Submitted:
22 April 2023
Posted:
24 April 2023
You are already at the latest version
Abstract
The population growth, economic development and urbanization of the city of Douala in Cameroon are facing great challenges, particularly environmental and economic problems. However, there is an evolution of the road transport sector that has led to an excessive increase in the consumption of fossil fuels and over the last decades to an increase in greenhouse gases in the road transport sector. From this observation, no real policy has yet been put in place with a view to improving the energy efficiency of the transport sector. This work aim at analyzing the driving force factors of energy consumption in road transport in the city of Douala. In this study, a decomposition analysis through the Logarithmic Mean Divisa Index (LMDI) method is used during the period 2010-2019 to quantify their respective contributions in energy consumption. We have broken down road transport energy consumption into four main factors as main determinants such as: vehicle energy intensity, vehicle intensity, Gross Domestic Product (GDP) per capita and population. The results show that vehicle energy intensity, vehicle intensity, GDP per capita and population effect all have a positive impact on energy consumption and therefore main responsible for the increase in fuel consumption energy contributing respectively to 13.06%, 31.30%, 12.85% and 42.76% of the total variation of energy consumption. It is therefore necessary to implement several energy saving strategies in order to achieve a rationalization of energy consumption for a reduction of road transport energy. Political decision-makers must take such a study into account to better integrate the notion of sustainable transport.
Keywords:
decomposition analysis
; driving factors
; energy consumption
; logarithmic -mean divisa Index method
; road transport
1. Introduction
The transport sector is one of the systems with high energy consumption. It plays a major and very important role in the economic activity of a country [1]. Improved resource accessibility, employment growth, market reach, and mobility behavior are influenced by the transport sector. However, the structure and volume of transport vary drastically due to the socio-economic development of the country. These variations are associated with increasing energy consumption and negative impacts on the environment such as greenhouse gas emissions and toxic air pollutants that affect the climate but also the health of populations.
In Cameroon, the transport sector represents a very important part of energy consumption, with petroleum products as the main sources. The release for consumption of petroleum products excluding LPG between 2010 and 2014, experienced a significant increase from 1,360,628 to 1,789,754, either an average annual growth of 5% per year [2]. According to information on energy consumption carried out by the Ministry of Water and Energy (MINEE), in 2010, the consumption of petroleum products represented 54% of the energy bill [3]. In the transport sector, the road mode is the most important major pole in the movement of people and goods, providing about 90% of domestic passenger transport demand and nearly 75% of freight transport demand [4] and monopolizes more than 85% of national transport. This mode is considered to be the main cause of fuel depletion.
In many reviews, it is mentioned that the use of fuels in the transport sector increases significantly with economic activity, population growth, rapid industrialization and even the urban spatial configuration that Cameroon faces. The phenomenon is observable through the major cities of the country, in particular that of Douala which plays a primordial role and also in the CEMAC zone (Economic and Monetary Community of Central African States) given its highest economic and demographic weight. However, with the industrial development of the major metropolises of Cameroon, added to this the phenomenon of the rural exodus of which they are victims, the city of Douala is placed in this case at the center of the major challenges of sustainable development. Eco-development and the reduction of greenhouse gas emissions are major challenges for the city. The transport sector, which consumes a lot of fuel and is responsible for harmful effects on the environment, requires great attention.
The choice of the road transport sector is due to its strong involvement in the economic and environmental dimension of sustainable development. Petroleum products such as gasoline and diesel are the main fuels consumed in the road transport sector. In order to better analyze our study, the determination of a set of determining factors constitutes one of the main steps to be highlighted in order to identify the various causes responsible for the growth of energy consumption in transport road. This will allow us to identify appropriate solutions with a view to improving energy efficiency and making transport sustainable.
Many factors can be presented for this purpose, such as the types of fuels used by the vehicles, the weight of the vehicles, the age of the vehicles, the speed of the vehicle, the distances travelled, the driving conditions and the modal mix. As part of our study, we highlight the economic, technological, demographic and urban factors. The objective of our study is to make a diagnosis of the impact of these factors on the energy consumption of road transport in the city of Douala during the period from 2010-2019. For our study, it is a question of analyzing the impacts emitted by the energy intensity of vehicles, the intensity of vehicles, the GDP per capita and the population of the city in Douala, the economic heart of Cameroon.
The determination of the impacts of the determining factors during the study period could allow the contribution of an energy saving policy in the transport sector. In our study, we use the decomposition analysis of the energy consumption of road transport of the city in Douala through the LMDI method to discuss the impacts of the various factors illustrated upstream of the road transport of the economic capital in Cameroon. Reducing polluting emissions from road transport is a major focus for the development of sustainable transport throughout the world. The notion of sustainable transport refers to a transport system that meets current needs without jeopardizing the ability of future generations to meet their transport needs [5]. According to [6,7], the issue related to this notion is not the only one, because there are some that respond to environmental, economic and social problems. In view of this observation, it will be necessary to put in place a real energy policy aimed at developing strategies with a view to improving energy efficiency and carrying out surveys of the main factors influencing variations in energy consumption energy to achieve sustainable transport.
The remaining part of this document is structured as follows: Section 2 provides a brief overview of the literature review of work on the main factors affecting the transport sector. Section 3 presents a brief description of the energy consumption of road transport of the city in Douala. Section 4 presents the data, the main factors influencing the energy consumption of road transport and the methodology of the decomposition technique through the LMDI method. Section 5 presents the empirical results and discusses them by proposing some policy options aimed at rationalizing the energy consumption of road transport. Section 6 concludes the document.
2. Literature review
Energy consumption in the transport sector and its gas emissions are frequently discussed in the literature. The rapid increase in motorization caused by a lack of transport policy planning creates threats to energy security, the state of the environment and leads to rapid traffic congestion. The relationship between economic activity, transport activity and energy in the transport sector is one of the important relationships that requires diagnosis to be analyzed efficiently for an understanding of energy use in the transport sector. Indeed, for an estimate of energy consumption in the transport sector, the evaluation using top-down and bottom-up approaches of factors such as economic, demographic, technological and urban factors is necessary.
Many studies concerning the identification of the determinants of energy demand in the transport sector have been carried out previously using the decomposition analysis method [8]. For sustainable transport planning, the need to study the determinants of energy consumption in the transport sector is highlighted in most studies. In order to study the energy consumption of transport, most works have used the decomposition method which is very popular and effective in the analysis of the factors influencing the energy consumption of transport [9]. Several decomposition techniques are currently used in the field of energy and environmental studies, among which we note the Index decomposition (Arithmetic Mean Divisa Index and Logarithmic Mean Divisa Index) which is the most used to identify the factors that influence changes in energy consumption and gas emissions of a system [8,9]. To this end, we note various works carried out for the analysis of the decomposition. Thus, the work of [10] used the decomposition method in order to identify the determinants of energy consumption and gas emissions. In the work of [11], they used the decomposition method to analyze the influences of transport activity, travel mode mix, energy intensity, CO2 intensity and energy mix on the increase in CO2 emissions in nine countries of the Organization for Economic Co-operation and Development (OECD).The results of their work showed that travel-related activities were the main cause of the growth in greenhouse gas emissions.
Shrestha et al (1996) used decomposition analysis to determine the effects of fuel mix, fuel quality, and thermal power generation efficiency on CO2 intensity in 12 selected Asian countries during the study period 1980-1990 [12]. Shipper et al (1997) used the decomposition method by decomposing energy intensity into three factors: transport activity (ton kilometer), transport structure (types of modals) and intensity (energy used per transport unit) [13]. Their results showed that the better energy efficiency cannot compensate for the increase in transport and the modal share of road transport. Steenhof et al (2006) used the energy intensity decomposition method to examine the determinants of greenhouse gas emissions caused by freight transportation in Canada [14]. In their work, they deduced that technical progress is an inadequate and inappropriate solution. Lu et al (2007) used the decomposition method approach to determine the impact of determining factors on the total carbon dioxide emission factor [15]. Their results showed that the rapid growth of the economy and of vehicles were the most important major factors in the increase in greenhouse gas emissions.
Zheng et al (2009) analyzed energy consumption by highlighting China's regional transportation factors from four aspects, namely natural geographical environment, transportation structure, economic development level, and network density traffic [16]. Sorrell et al (2010) used a formal decomposition analysis of road freight energy consumption in the United Kingdom. The results of their work established that the main major factor contributing to energy consumption was the value of manufactured goods relative to GDP [17]. Jian Jiang et al (2015) used the decomposition method to identify the factors influencing the evolution of transport energy consumption [18]. In this work, they showed that the impact of transport activity is the most important significant factor that contributes to a growth in energy consumption and energy intensity has a dominant major role in the decline of energy consumption energy consumption.
Ming et al (2011) used the LMDI decomposition method to analyze the effects of transport activity in China and to assess energy consumption over the period 1980-2006 [19]. They analyze the effect of a change in transport mode, energy intensity and activity and their results show that the effect of transport activity is the major factor contributing to the increase in energy consumption transport energy and energy intensity play a dominant role in reducing energy consumption. Marshall et al (2011) analyzes the causal relationship between residential location and vehicle miles traveled, energy consumption, and CO2 emissions in the Chicago metropolitan area during the period 2007-2008 [20].
Steckel et al (2011) used a decomposition analysis of China's CO2 emissions during the period 1971-2000 [21]. The results of their work showed that the impact of strong economic growth on emissions was partially offset by a steady decline in energy intensity. Qipeng et al (2013) used the LMDI method decomposition methodology to identify the main drivers of regional transport energy consumption in China [22]. Their results showed that the impacts of the effects of scale and technique weaken on the other hand, those of the effect of structure increase on the energy consumption. Zhang et al (2014) highlighted the decoupling index with the LMDI Decomposition Method to analyze the contribution of factors that influence energy-related CO2 emissions in China over the period 1996-2010 [23]. The results of their research showed that economic growth is presented as the main major driver of the increase in carbon emissions in recent decades, on the other hand, the reduction of energy intensity and the cleaning of the structure of the final energy consumption have had a significant impact in reducing carbon emissions.
Houda et al (2016) conducted a study on the decomposition analysis of energy consumption and determining factors in the transport sector in Tunisia over the period 1985-2012 [24]. They used the LMDI decomposition method by decomposing transport-related energy consumption into energy intensity, transport structure effect, transport intensity effect, economic output and population scale effect according to the mechanism of coaching. The results of their work indicated that the overall effect of economic production, transport intensity, population scale and transport structure on energy consumption is positive, while the overall effect of the energy intensity is negative.
The work carried out by Anita et al (2017) used the decomposition methodology by the LMDI method to analyze the determinants of road transport energy consumption in Nepal during the period 2003-2016 [25]. To this end, four main factors have been identified as the main drivers of transport energy: transport intensity, energy intensity, GDP per capita and population. The results of their studies showed that transport intensity and GDP per capita have a positive impact while energy intensity has a negative impact on transport energy consumption.
3. Energy consumption of road transport in the city of Douala
The transport activity of the city of Douala is mainly road transport and depends exclusively on petroleum products (gasoline and diesel). During this period, the fossil fuel consumption of road transport increased considerably from 66.108 Ktoe in 2010 to 180.336 Ktoe in 2019 with an annual growth rate of 11.48% as shown in Table 1. Figure 1 shows us the pace of the evolution of energy consumption from 2010-2019. Energy consumption in the road transport sector is strongly associated with several factors such as economic activity, population growth, the road vehicle fleet, the road network, motorization, fuel costs and market planning truck transport. The energy efficiency of road transport leads to reduced energy consumption, reduced greenhouse gas emissions, financial savings and energy security. The energy intensity of fuel consumption of the city in Douala generally increases with GDP during the study period. Figure 2 shows us the trend of fuel consumption energy intensity and GDP. There is a general increase during the study period in the energy intensity of fuel consumption, this can be explained by a critical situation in the rational management of energy consumption in road transport, thus reflecting a road sector energy-intensive.
4. Data and methodology
4.1. Source of data
In this work, we used a set of statistical data from many establishments from 2010-2019. These data come from the Ministry of Transport (MINTRANS), the Ministry of Water and Energy (MINEE), the Cameroon Oil Depot Company (SCDP) and the National Institute of Statistics (INS). In order to better analyze our work, we used data integrating the population, the road fuel consumption expressed in Ktoe, the Gross Domestic Product expressed in Euro.
4.2. Data
In this section, we present and discuss the potential factors that impact the energy consumption of road transport such as:
- -
- The energy intensity of vehicles
The energy efficiency of vehicles has a relationship with the fuel consumption of road transport. Figure 3(a) shows us an overall increase in vehicle energy intensity from 2010-2019. This can be reflected in the fact that the growth of road vehicles has led to a significant increase in the fuel consumption of road traffic as shown in Figure 3(b). However, looking at Figure 3(b), there is a slight decrease in the energy intensity of vehicles from 2013-2016. This can be explained by a number of taxes imposed on the road transport sector, the increase in fuel prices and some observed fuel shortages.
- -
- Vehicle intensity
Fuel consumption related to road transport depends on the use of road vehicles. Figure 3(b) shows us the evolution of the intensity of road vehicles in the city of Douala and we see that it is increasing from 2010-2019. This tells us that the demand for road vehicles per unit of GDP is growing. The increase in the intensity of vehicles reflects the fact that the economic growth of the city of Douala required a large number of road vehicles during the study period. Indeed, the high intensity of vehicles can be correlated to the growth of fuel consumption. Table 2 shows us a strong growth in the automobile flow of the city of Douala with an average annual growth rate of 9.5%. This strong growth in the car fleet can be explained by a strong increase in taxis and motorcycle taxis, the activity of which occupies a very significant place in the mobility of goods and people, added to this the purchase of private vehicles for services non-profit transportation.
- -
- Economic growth and motorization
The gross domestic product of the city of Douala experienced strong growth from 2010-2019 with an annual growth rate of 5.85%. Table 3 presents the evolution of GDP per capita and the motorization rate. Transport energy consumption is strongly linked to economic growth. From 2010-2019, the trend of energy consumption and that of GDP per capita has experienced a significant increase. This generally translates into a strong demand for urban mobility directly due to the growth of economic activity through the improvement of living standards. Economic growth is correlated with an increase in motorization. Figure 3(c) shows us the evolution of GDP per capita. This growth in GDP per capita and in the motorization rate can be explained by an increase in purchasing power.
- -
- Population growth and urbanization
The population of the city of Douala has increased during the study period. Table 4 presents the total population, the urban density during the study period. Demographic change is correlated with growing urbanization. Urban density has increased at an average annual growth rate of 4.5%. Figure 3(d) presents the evolution of the population of the city in Douala.
4.3. Methodology
In this study, the decomposition analysis through the LMDI method was used. The main objective of this method is to break down the variation in energy consumption linked to transport into several determining factors. It allowed us to identify the negative externalities of the transport activity. This method is widely used for sustainable transport studies and makes it possible to determine the impact of the various factors acting on variations in energy consumption and greenhouse gas emissions. Indeed, two methods are sometimes used to break down the variation in energy consumption: the Laspeyres and Divisa methods [26]. Other methods have also been developed such as the refined Laspeyres techniques [26], the Arithmetic Mean Divisia Index (AMDI) method and the Logarithmic Mean Divisia Index (LMDI) method [27,28].
As part of our study, we have highlighted data on population, economic growth per capita (, vehicle intensity ( and energy intensity of vehicles (in order to define the main determinants of energy consumption related to road transport (. In order to determine the contribution of the major factors influencing road transport energy consumption, we present a methodology for breaking down road transport energy into potential factors. Thus, the energy consumption of road transport for a year t ( peut se traduire par l’expression :
Where i and t respectively represent the type of fuel (diesel and gasoline) and the reference year.
Expression (1) can be written:
The relation (2) can also be translated by:
In this relationship,
- • VFI : represents the energy intensity of vehicles, defined as the energy demand per vehicle;
- • VI : It is the intensity of vehicles translating the demand for vehicles for a unit of GDP
- • GDP : it represents economic growth per capita and allows us to better understand the evolution of the motorization rate, and to assess the impact on the use of vehicles and energy consumption;
- • POP: represents the population of the city of Douala. It allows us to understand the impact of population growth on energy consumption.
Indeed, the evolution of these different factors reflects their direct and indirect impacts on the evolution of energy consumption. The evolution of energy consumption in the road transport sector during two periods can be allocated to the different indicators such as:
- The variation in the energy intensity of vehicles, with effect coefficient;
- The variation in the intensity of vehicles, with effect coefficient;
- Variation in economic activity, with effect coefficient;
- Population variation, with effect coefficientAfter having defined the different variations, the expression of the variation of the energy consumption of the road transport sector can be expressed by the relationship:
In general, the effects can be calculated according to the model of expression of :
5. Results and discussion
The methodological approach issued in the previous section highlights a set of major factors that influence the energy consumption of the road transport sector of the city of Douala. The data collected and processed have been circumscribed for the years ranging from 2010-2019.The activity of the road transport sector is linked to energy consumption. In this section, we present the contributions of driving factors of energy consumption. The results of our study are shown in Table 5. The variation in energy consumption is positive with a value of 114.087 Ktoe. Figure 4 shows us the trend of this variation. The impact of the effect of the coefficient of the energy intensity of vehicles and that of the intensity of vehicles on the total variation in energy consumption is positive and for a few years is negative. The impact of the economic production and population effect is positive.
5.1. Effect of vehicle energy intensity
Figure 5 shows us the evolution of the contribution of the effect of the coefficient of the energy intensity of vehicles and the variation in energy consumption. The effect of the coefficient of the energy intensity of vehicles represents 14.91 Ktoe or 13.06% of the total variation in energy consumption. This coefficient is positive except for the 2013-2016 period when it is negative. In particular, we see that the effect of the energy intensity of vehicles has the same appearance as the variation in energy consumption. It can therefore be deduced that the variation in energy consumption is strongly linked to the energy intensity of vehicles. The energy intensity of vehicles is one of the main contributors to the variation in energy consumption linked to road transport. The negative values obtained therefore allow us to deduce that a reduction in the energy intensity of vehicles will lead to a reduction in energy consumption and therefore an improvement in the energy efficiency of road transport.
5.2. Vehicle Intensity Effect
Figure 6 shows us the evolution of the contribution of the effect of the vehicle intensity coefficient. It represents 35.712 Ktoe or 31.30% of the total variation in energy consumption. This coefficient is positive and it is negative over two short periods 2010-2011 and 2012-2013. The positive values obtained from this coefficient of the intensity of vehicles during the study period inform us that it has considerably contributed to the increase in the energy consumption of road transport. This can be explained by a significant growth in the use of road vehicles, particularly that of passenger transport, including the most used taxis and motorcycle taxis in circulation in the city of Douala. As for the energy intensity of vehicles, the negative values obtained from the intensity coefficients of vehicles can explain the fact that a reduction in energy demand requires a good structuring of road transport in the city of Douala, in particular by ahead of mass transport.
5.3. Effect of economic growth.
Figure 7 shows us the evolution of the effect of the GDP per capita coefficient. This coefficient is positive throughout the study period and represents 14.669 ktoe or 12.85% of the total variation in energy consumption. When we observe this figure, we see during the period 2015-2018, that this coefficient has the same pace as the variation in energy consumption and can therefore be considered as a major factor in the variation in energy consumption road transport. However, between the period 2011-2014 there is an increase in the effect of the coefficient of GDP per capita which has led to a decrease in energy consumption. On the other hand, the opposite phenomenon occurred during the short period between 2014-2015 when the decrease in the effect of the GDP per capita coefficient led to an increase in energy consumption. We can therefore deduce that the effect of GDP per capita is a determining factor in energy consumption, this was highlighted in section 2 of our study cited above, in particular by an increase in the rate of motorization, the high demand for urban mobility and the improvement of living conditions.
5.4. Population effect
Figure 8 presents the evolution of the contribution of the population effect and the total variation of energy consumption. The results show us that the population plays a major role in increasing the energy consumption of the transport sector. It can be seen that the contribution of the population is significant representing 48.795 Ktoe or 42.76% of the total variation in energy consumption. This reflects the strong impact of population in energy consumption. This can be explained by the fact that urbanization generally increases with population growth [29]. To illustrate this explanation, the works of Newman et al (1988) present urbanization as a major element of growth in the construction of transport infrastructure, it is from there that the phenomenon of urban sprawl is emitted, therefore resulting in greater consumption of energy [30,31]. This means that the increase in population leads to a pressing demand for mobility and therefore more energy consumption.
In our study, we calculated the general contribution of each factor on the total variation of road transport energy consumption in the city of Douala between 2010-2019. At the end of the calculations carried out, it appears that the contribution of the effect of the coefficient of energy intensity of vehicles and that of the intensity of vehicles on the total variation of energy consumption is positive and for some periods it is negative. The effect of population and GDP per capita on the total change in energy consumption is positive. Thus, the impact of the population effect is the main factor with a contribution of 42.76% on the total variation in energy consumption, next, followed by the intensity of vehicles 31.30%, energy intensity vehicles 13.06% and finally that of economic production presenting 12.85%.
6. Conclusion
In this study, we examine the evolution of road transport energy consumption and the major determining factors during the period 2010-2019 in the city of Douala. For this, the LMDI decomposition method is used. This method makes it possible to determine the factors that influence variations in energy consumption in the transport sector. The results of our study show that vehicle energy intensity, vehicle intensity, GDP per capita and population scale have a positive impact on energy consumption. It can be deduced from this analysis that all the factors mentioned above are the main major causes of the increase in energy consumption during the study period. The main contributions of the determining factors in the variation of energy consumption show that the effect of the population is the first contributing factor and represents (42.76%) of the total variation of energy consumption. Then the second is the vehicle intensity with (31.30%), the third factor is the vehicle energy intensity with (13.06%) and the fourth factor is GDP per capita with a contribution of (12.85%).
Improving the energy intensity of vehicles and the intensity of vehicles can have a major impact that can lead to a decrease in energy consumption. As a result, the condition of vehicles in circulation and the structuring of road transport are driving pillars that must be optimized for a good rationalization of energy consumption. In order to control the evolution of the energy consumption of road transport, the energy efficiency of road transport must be improved. According to Zhang et al (2014), technological progress is a more effective way to increase the efficiency of energy consumption [32]. Moreover for Yan et al (2013), the technological development and applications of renewable energies can also contribute to energy efficiency [33]. For sustainable transport, several strategies can be issued, including: promoting mass transport to reduce the use of private vehicles, controlling vehicle emission standards. Political decision-makers must take into account such a study which will make it possible to better control the evolution of the energy consumption of road transport.
This study is of great importance because it allows us to have an overall reading of the control of energy consumption indicators in the road transport sector in particular. Beyond this work, we can also put forward a perspective study of the relationship between energy consumption, CO2 emissions and GDP from road traffic in Douala to determine the levels of variation. It will make it possible to improve in an effective way the gains of an environmental management policy, which constitutes one of the capital aspects for the development of sustainable cities.
Author Contributions
Fontaine Dubois Bissai: Writing-original draft (lead); writing-review and editing (lead); methodology (lead). Bienvenu Gael Fouda Mbanga: Writing-original draft (supporting); writing-review and editing (supporting); Methodology (supporting). Adiang Mezoue Cyrille: Writing-original draft (equal); writing-review and editing (equal). Methodology (supporting); Supervision (equal). Severing Nguiya: Writing-original draft (equal); writing-review and editing (equal); Supervision (lead). DATA AVAILABILITY: The datasets used and/or analyzed during the current study are available from the corresponding author on reasonable request.
Funding
No funding was obtained for this study.
Ethics approval
Not applicable.
Competing interests
The authors declare no competing interests.
References
- Sadeghi, M.; Hosseini, H.M. Integrated energy planning for transportation sector: A case study for Iran with techno-economic approach. Energy Policy 2008, 36, 850–886. [Google Scholar] [CrossRef]
- MINEE, Situation énergétique du Cameroun, Rapport 2009-2020.
- Bilan énergétiques SIE-Cameroun, 2011. 2011.
- Banque Africaine de Développement (BAD), ‘‘Note sur le secteur des transports au Cameroun’’, Département des Transports, du Développement Urbain et des TIC, 2015, 44p. 2015.
- Richardson, B.C. Sustainable transport: analysis frameworks. Journal of Transport Geography 2005, 13, 29–39. [Google Scholar] [CrossRef]
- Loo, B.P.Y. Editorial. International journal of sustainable transportation 2008, 2, 135–137. [Google Scholar] [CrossRef]
- Becky, P.Y. , Loo, N.; Linna, Li. Carbon dioxide emissions from passenger transport in China since 1949: Implications for developing sustainable transport. Energy Policy 2012, 50, 464–476. [Google Scholar]
- Ang, B.W.; Zhang, F.Q. A survey of index decomposition analysis in energy and environmental analysis. Energy 2000, 25, 1149–1176. [Google Scholar] [CrossRef]
- Ang, B.W. Decomposition analysis for policy making in energy: Which is the preferred method? Energy Policy 2004, 32, 1131–1139. [Google Scholar] [CrossRef]
- Kolb, A.; Wacker, M. Calculation of energy consumption and pollutant emissions on freight transport routes. The science of the Total Environment 1995, 169, 283–288. [Google Scholar] [CrossRef]
- Lynn, S.; Lee, S.; Nancy, K. CO2 emissions from passenger transport: A comparison of international trends from 1973 to 1992. Energy policy 1996, 24, 17–30. [Google Scholar]
- Shrestha, R.M.; Timilsina, G.R. Factors affecting CO 2 intensities of power sector in Asia: A Divisia decomposition analysis. Energy Economics 1996, 18, 283–293. [Google Scholar] [CrossRef]
- Shipper, L.; Scholl, L.; Price, L. Energy use and carbon emissions from in 10 industrialized countries: an analysis of trends from 1973 to 1992. Transportation Research Part D 1997, 2, 57–76. [Google Scholar] [CrossRef]
- Steenhof, P.; Woudsma, C.; Sparling, E. Greenhouse gas emissions and the surface transport of freight in Canada. Transportation Research Part D 2006, 11, 369–376. [Google Scholar] [CrossRef]
- Lu, I.J.; Lin, S.J.; Lewis, C. Decomposition and decoupling effects of carbon dioxide emission from highway transportation in Taiwan, Germany, Japan and South Korea. Energy Policy 2007, 35, 3226–3235. [Google Scholar] [CrossRef]
- Zheng, L.C.; Zhang, L. Study on affecting factors of transportation energy consumption in China. Logistics Technology 2009, 28, 1–5. [Google Scholar]
- Sorrell, S. Decoupling of road freight energy use from economic growth in the United Kingdom. Energy Policy 2010, 07, 1–14. [Google Scholar] [CrossRef]
- Jiang, J. A factor decomposition analysis of transportation energy consumption and related policy implications. IATSS research 2015, 38, 142–148. [Google Scholar] [CrossRef]
- Zhang, M.; Li, H.; Zhou, M.; Mu, H. Decomposition analysis of energy consumption in Chinese transportation sector. Applied Energy 2011, 88, 2279–2285. [Google Scholar] [CrossRef]
- Marshall, L.; Joseph, L.S.; Pablo, D.; Kimberly, A.G. The effect of residential location on vehicle miles of travel, energy consumption and greenhouse gas emission: Chicago case study. Transportation Research Part D 2011, 16, 1–9. [Google Scholar]
- Steckel, J.C.; Jakob, M.; Marschinski, R.; Luderer, G. From carbonization to decarbononizaton? Past trends and future scenarios for China’s CO2 emissions. Energy policy 2011, 39, 3443–3455. [Google Scholar] [CrossRef]
- Qipeng, S.; Jiao, J.I.; Cheng, X.U. Energy Consumption Driving Factors and Measuring Models of Regional Integrated Transport System. J Transport Syst Eng. and IT 2013, 13, 1–9. [Google Scholar]
- Zhang, Y.J.; Da, Y.B. The decomposition of energy-related carbon emission and its decoupling with economic growth in China. Renewable and Sustainable Energy Reviews 2014, 41, 1255–1266. [Google Scholar] [CrossRef]
- Achour, H.; Belloumi, M. Decomposing the influencing factors of energy consumption in Tunisian transportation sector using the LMDI method. Transport Policy 2016, 52, 64–71. [Google Scholar] [CrossRef]
- Prajapati, A.; Bajracharya, T.R.; Bhattrai, N. Driving factors of Energy consumption in Transport Sector. Proceedings of IOE Graduate Conference; Proceedings of IOE Graduate Conference, 2017; Volume: 5. ISSN: 2350-8914 (Online), 2350-8906 (Print). [Google Scholar]
- Lin, J.; Zhou, N.; Levine, M.; Fridley, D. Takingout 1 billion ton of CO2: the magic of China's 11th five-year plan. Energy Policy 2008, 36, 954–970. [Google Scholar] [CrossRef]
- Liu, L.C.; Fan, Y.; Wu, G.; Wei, Y.M. Using LMDI method to analyze the change of China's industrial CO2 emissions from final fuel use: an empirical analysis. Energy Policy 2007, 35, 5892–5900. [Google Scholar] [CrossRef]
- Hatzigeorgiou, E.; Polatidis, H.; Haralambopoulos, D. CO2 emissions in Greece for 1990–2002: a decomposition analysis and comparison of results using the arithmetic mean divisia index and logarithmic mean divisia index techniques. Energy 2008, 33, 492–499. [Google Scholar] [CrossRef]
- Zhang, C.G.; Lin, Y. Panel estimation for urbanization, energy consumption and CO2 emissions: a regional analysis in China. Energy Policy 2012, 49, 488–498. [Google Scholar] [CrossRef]
- Newman, P.; Kenworthy, J.R. The transport energy trade off: fuel-efficient traffic versus fuel-efficient cities. Transportation Research 1988, 22A, 163–174. [Google Scholar] [CrossRef]
- Park, S.H. Decomposition of industrial energy consumption: an alternative method. Energy Economics 1992, 14, 265–27. [Google Scholar] [CrossRef]
- Zhang, S.W.; Bauer Nico Luderer, G.; Kriegler, E. Role of technologies in energy related CO2 mitigation in China within a climate-protection world: a scenarios analysis using REMIND. Appl Energy 2014, 115, 445–455. [Google Scholar] [CrossRef]
- Yan, J.; Chou, S.K.; Desideri, U.; Tu, S.T.; Jin, H.G. Research, development and innovations for sustainable future energy systems. Appl Energy 2013, 112, 393–395. [Google Scholar] [CrossRef]
Figure 1.
Evolution of road transport energy consumption in the city of Douala.
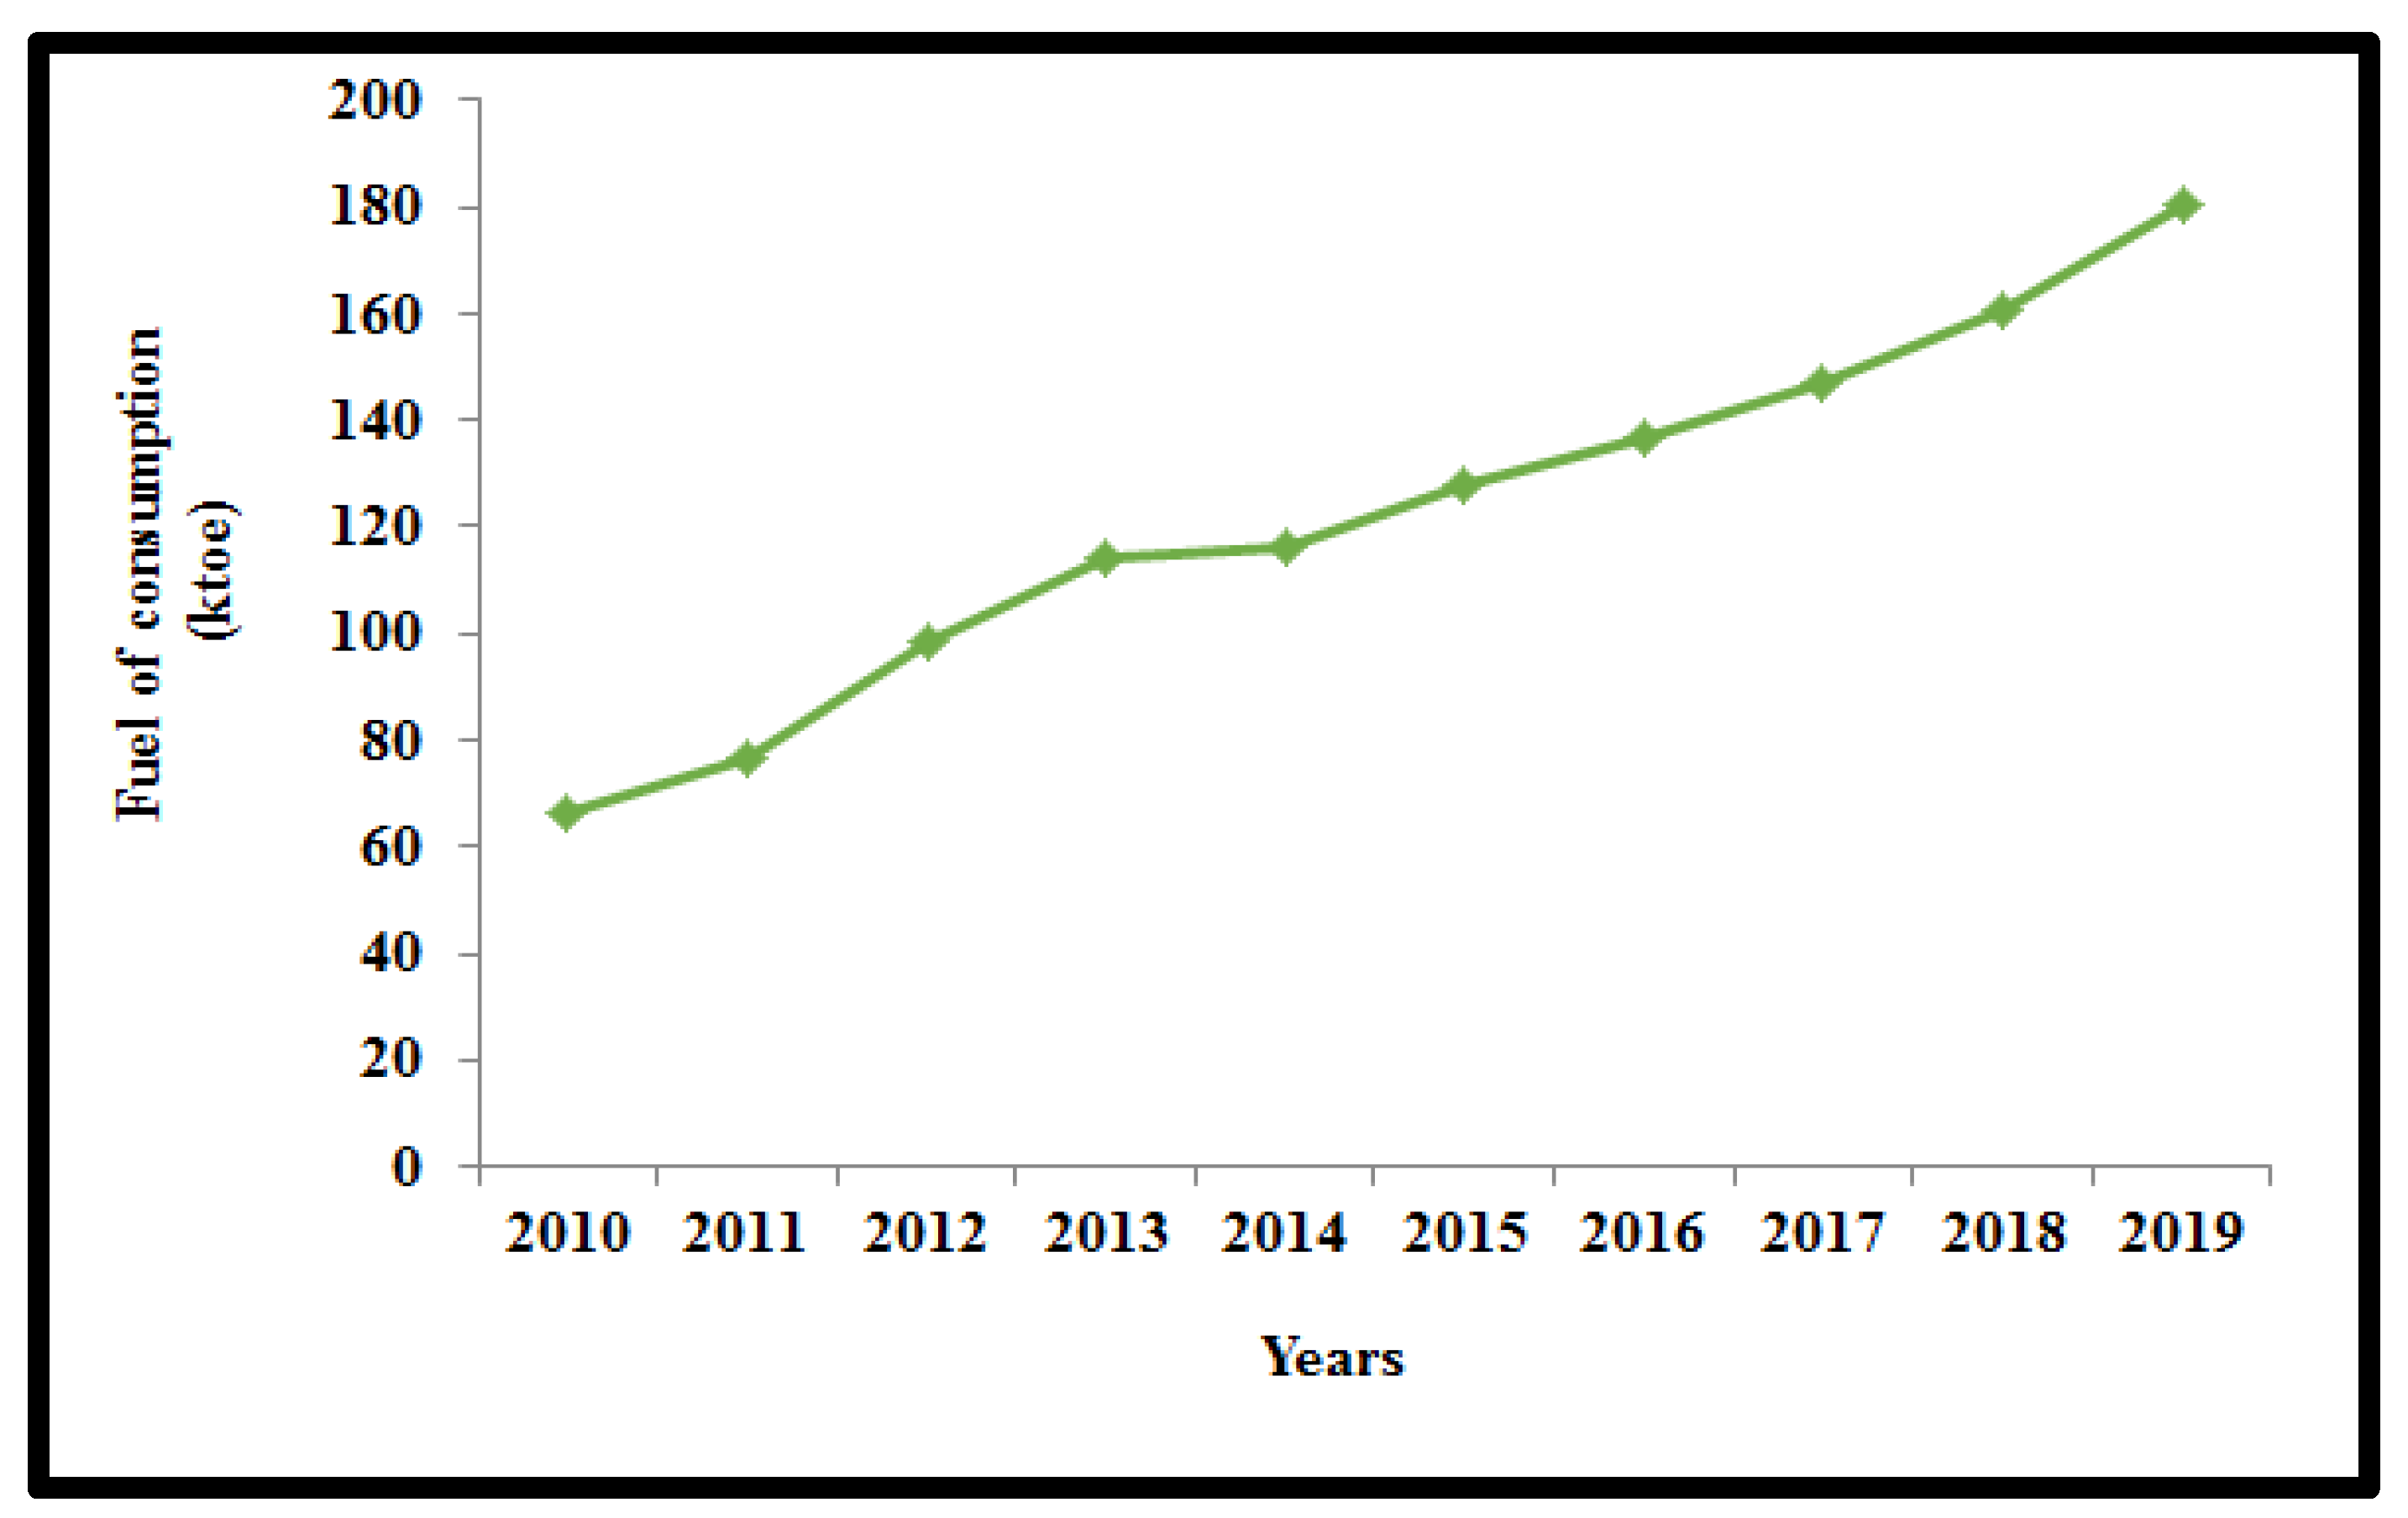
Figure 2.
Evolution of the GDP trend and the energy intensity of energy consumption.
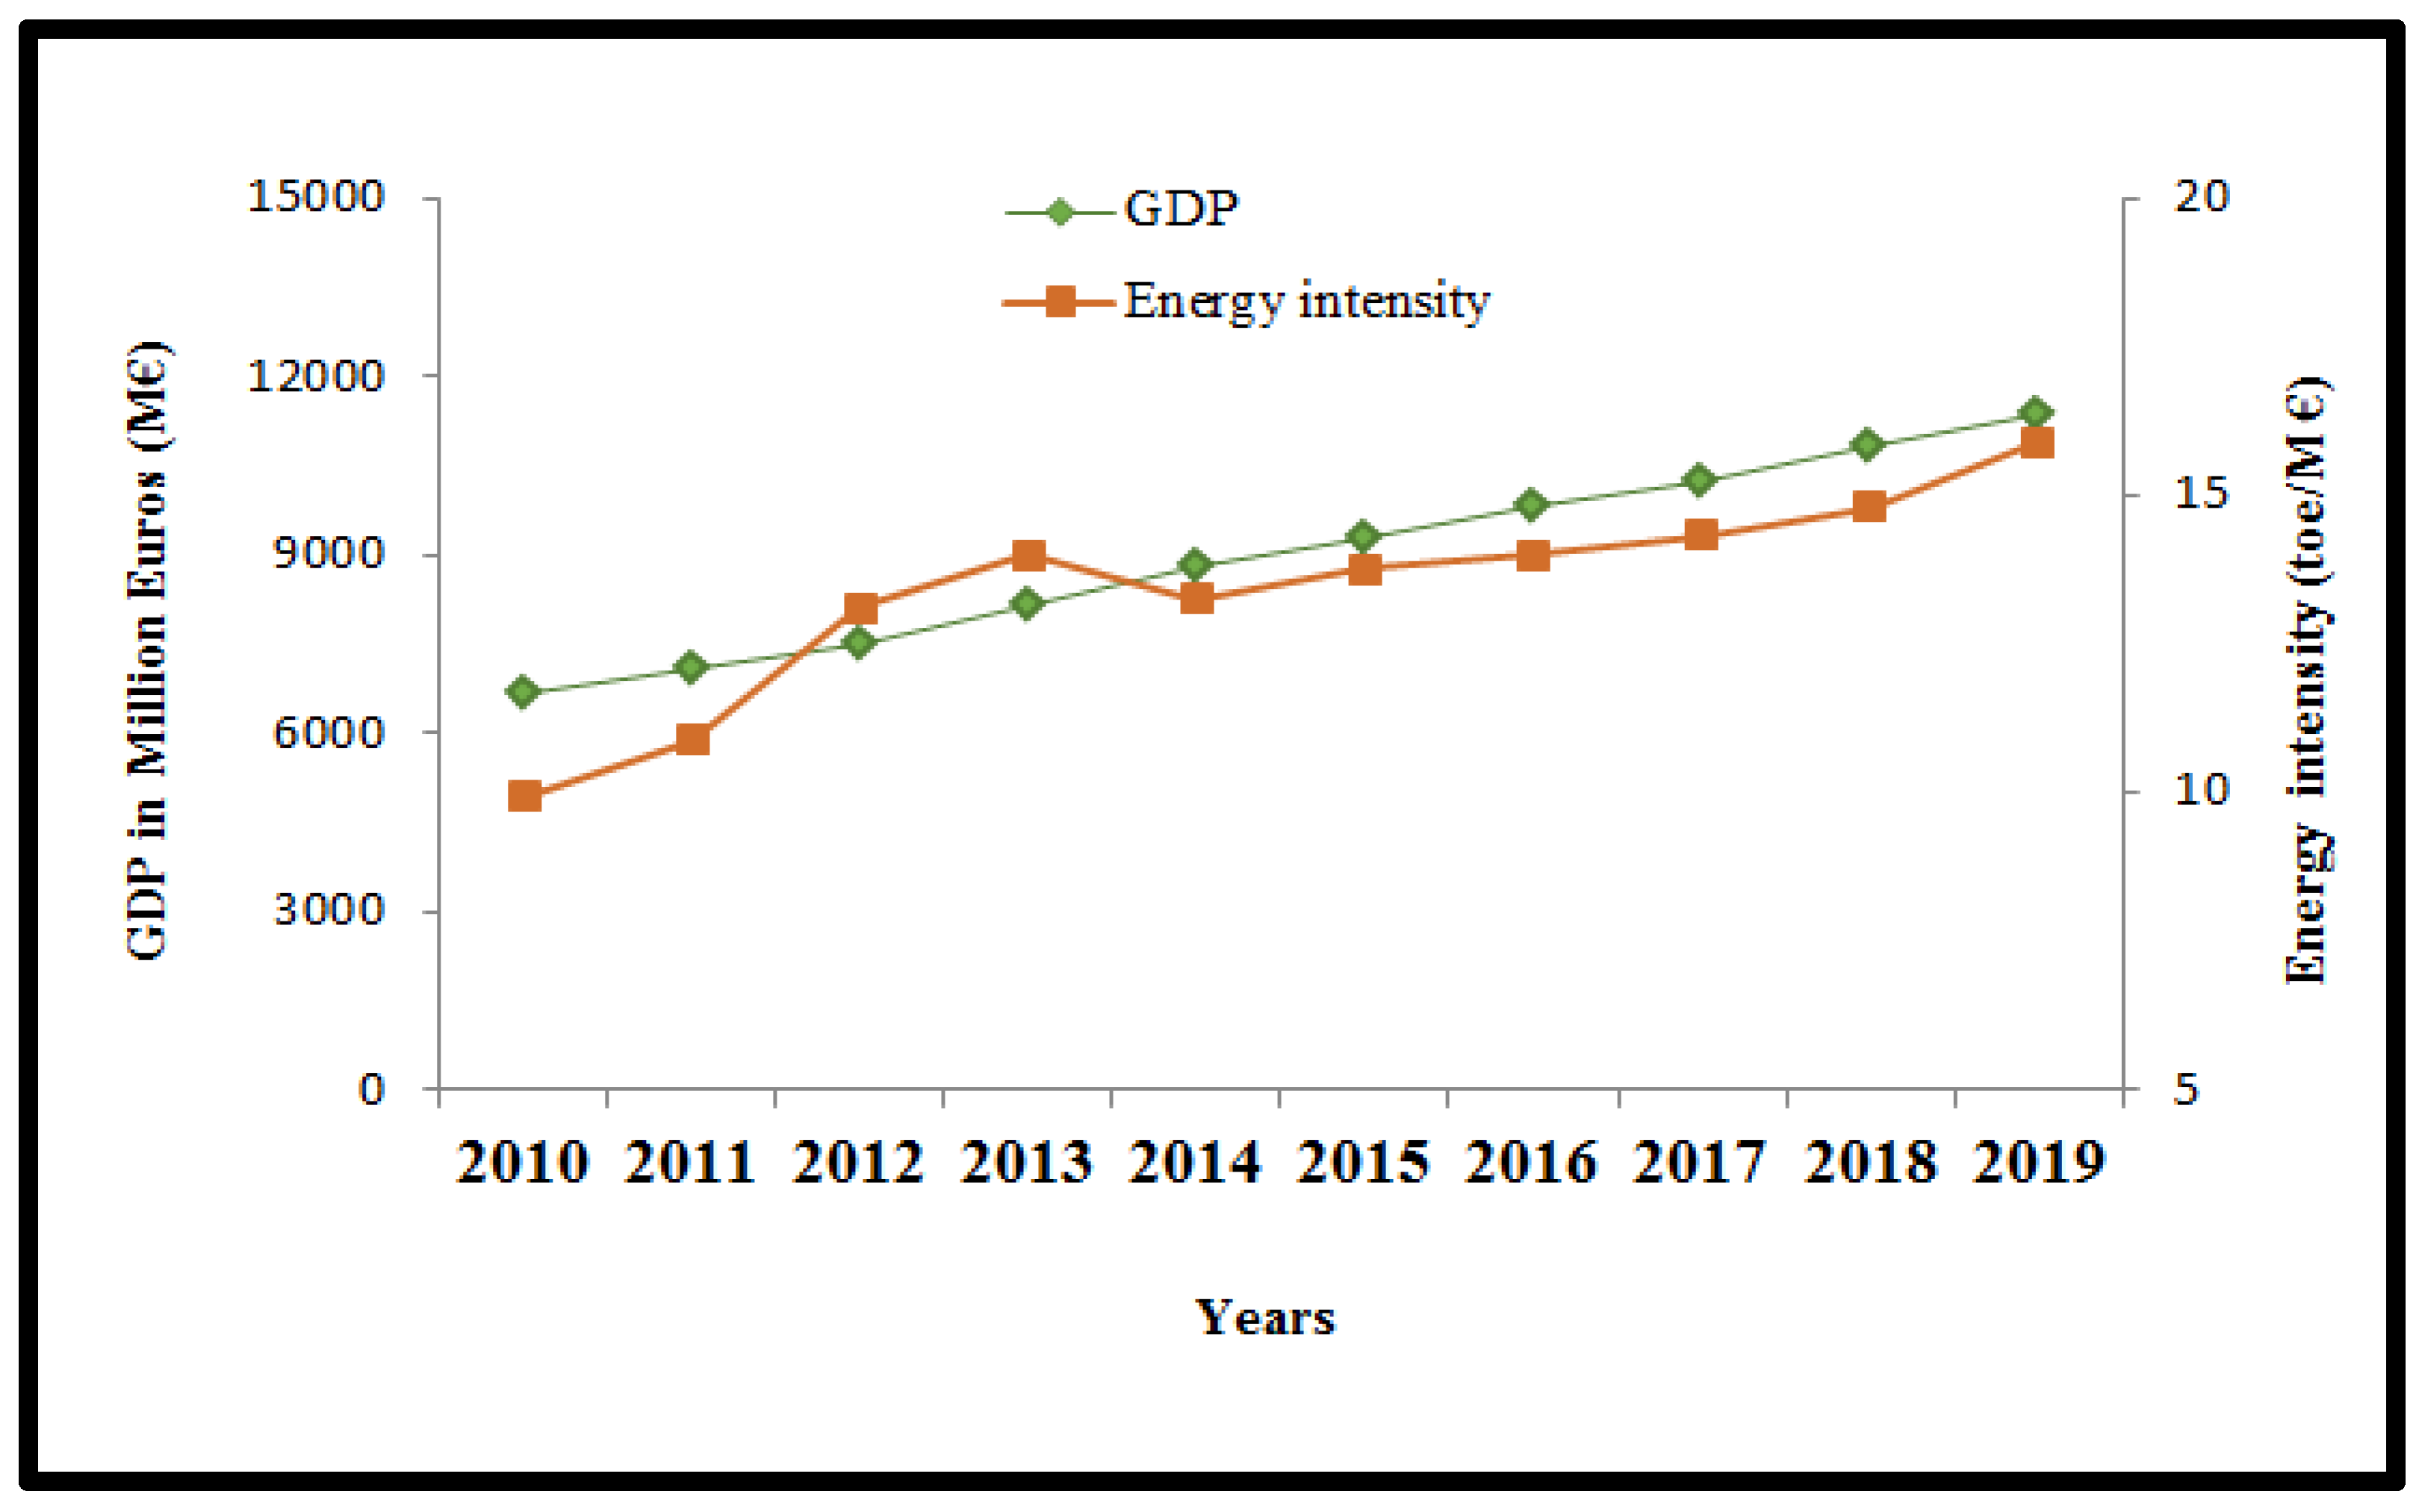
Figure 3.
Evolution of energy consumption trends related to road transport and driving factors.
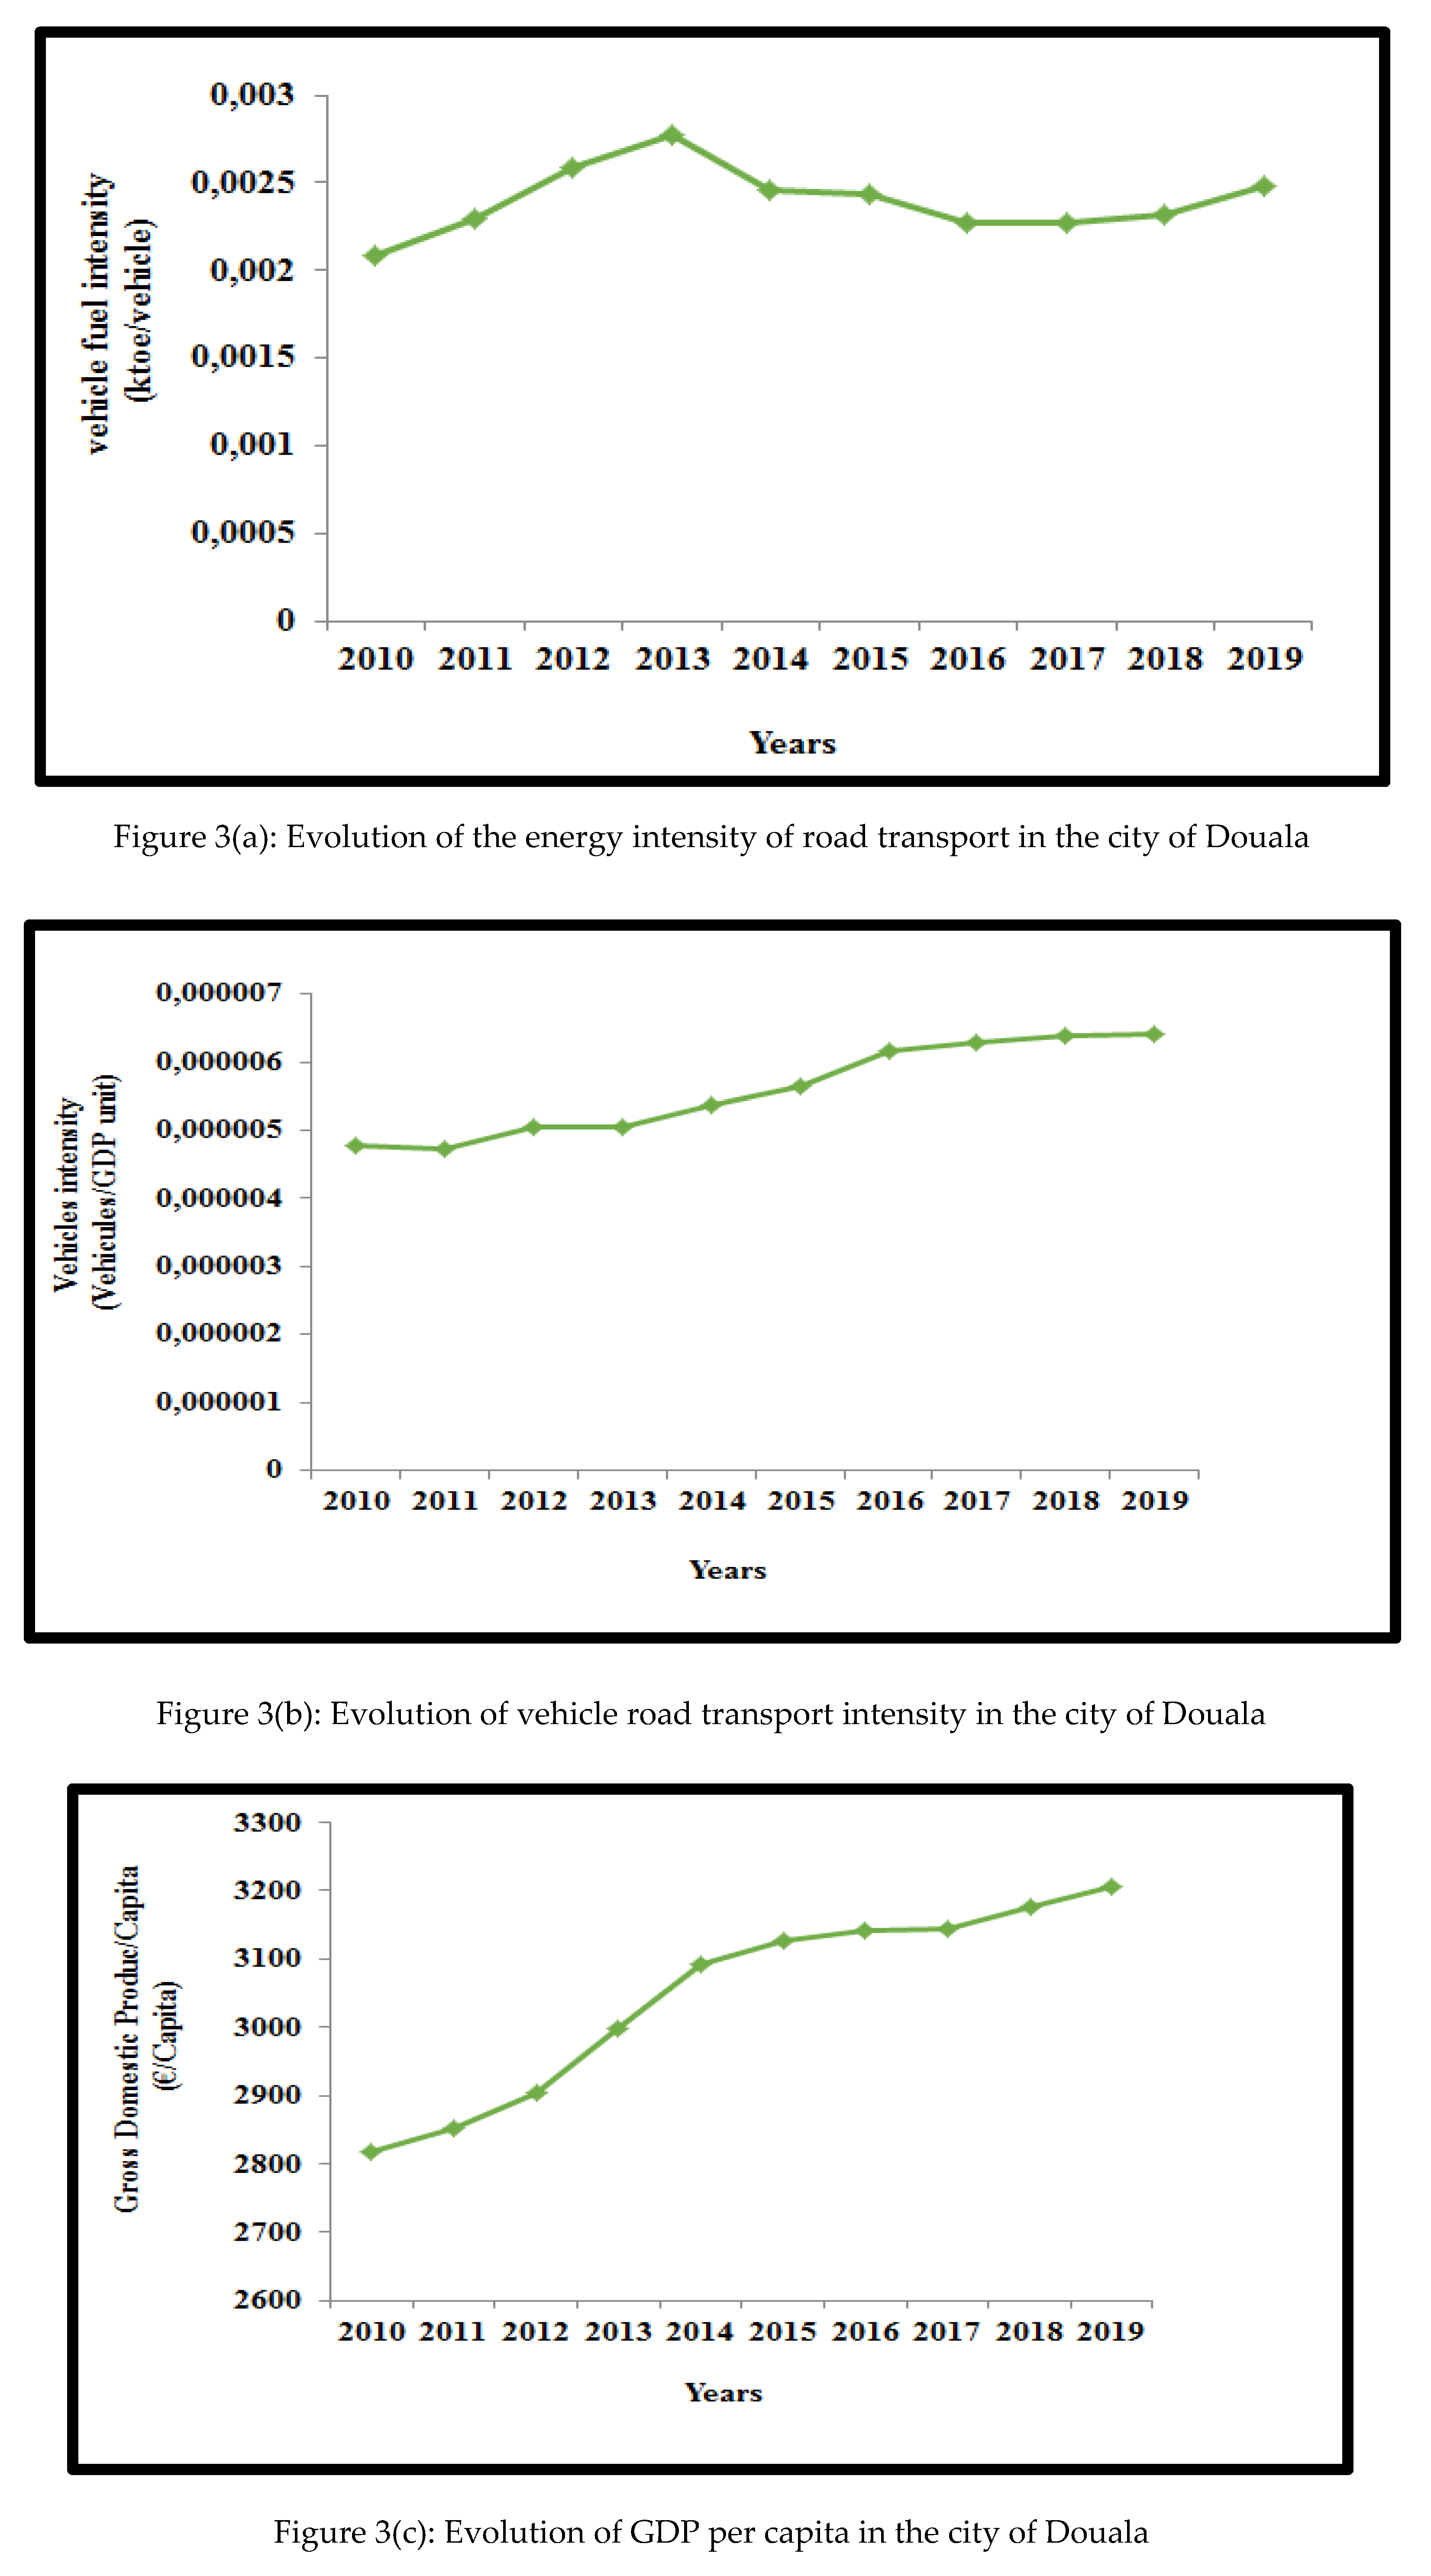
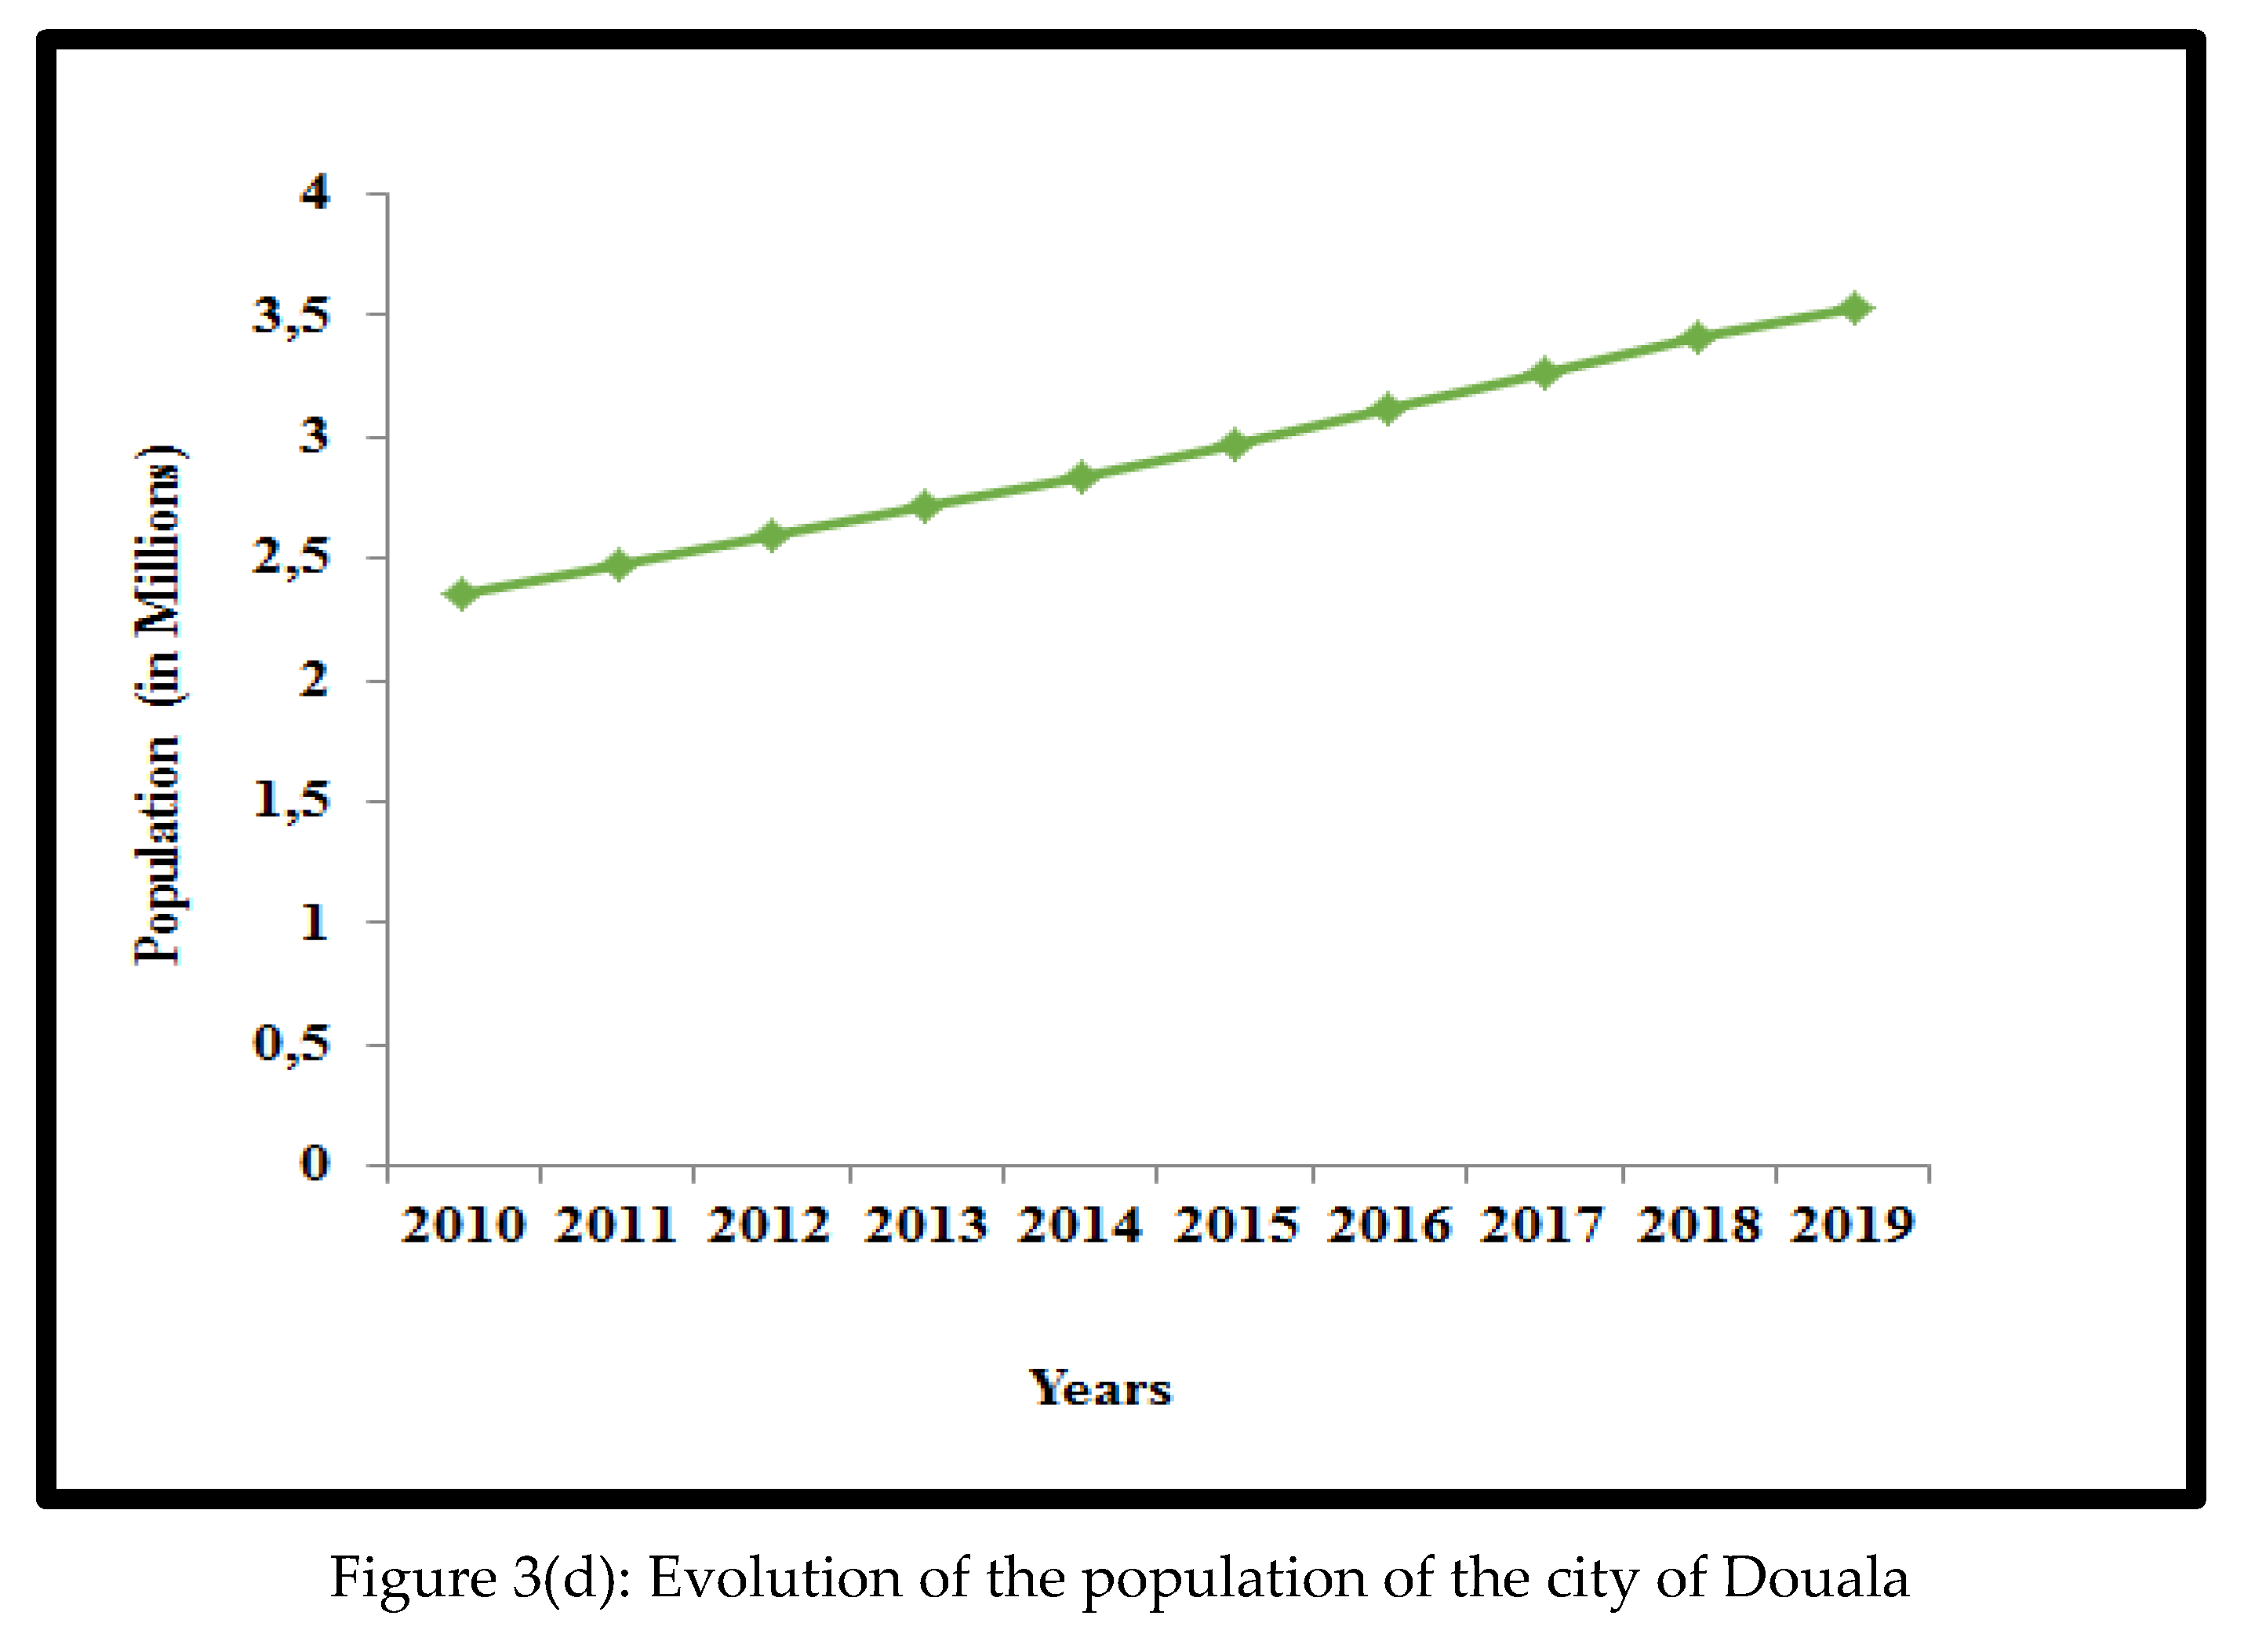
Figure 4.
Variation in energy consumption linked to road transport.

Figure 5.
Evolution of the effect of the energy intensity of vehicles and the variation in energy consumption.
Figure 5.
Evolution of the effect of the energy intensity of vehicles and the variation in energy consumption.
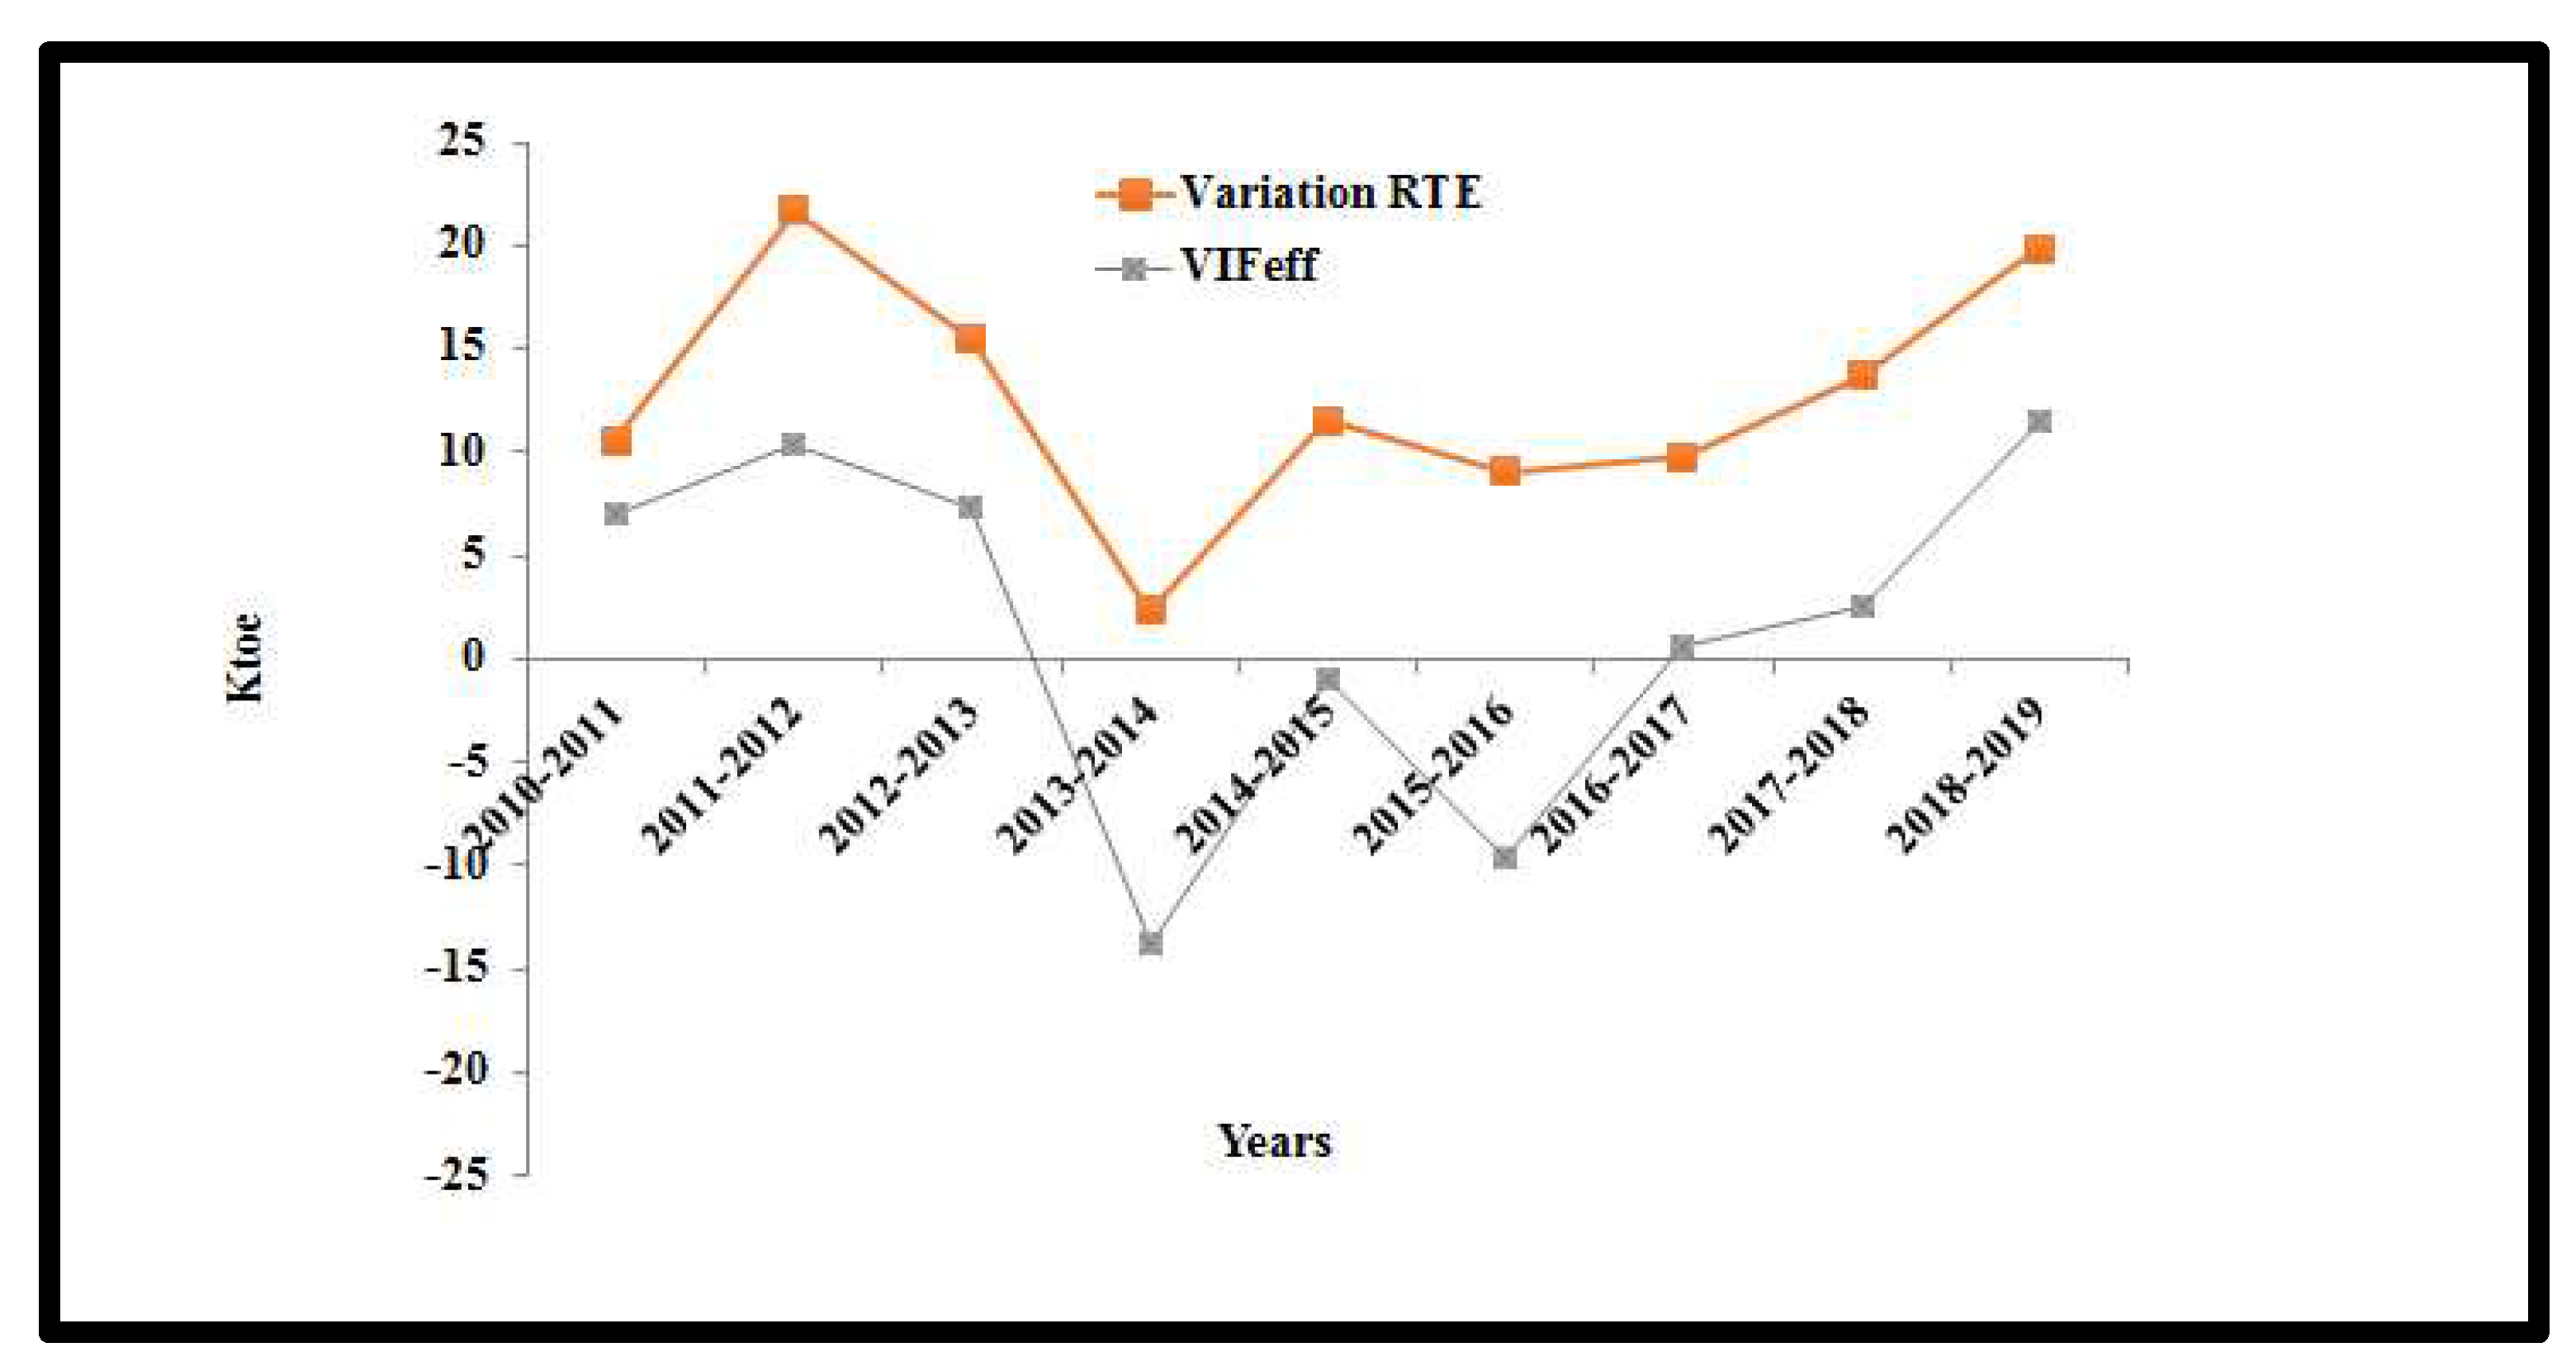
Figure 6.
Evolution of the effect of vehicle intensity and variation in energy consumption.
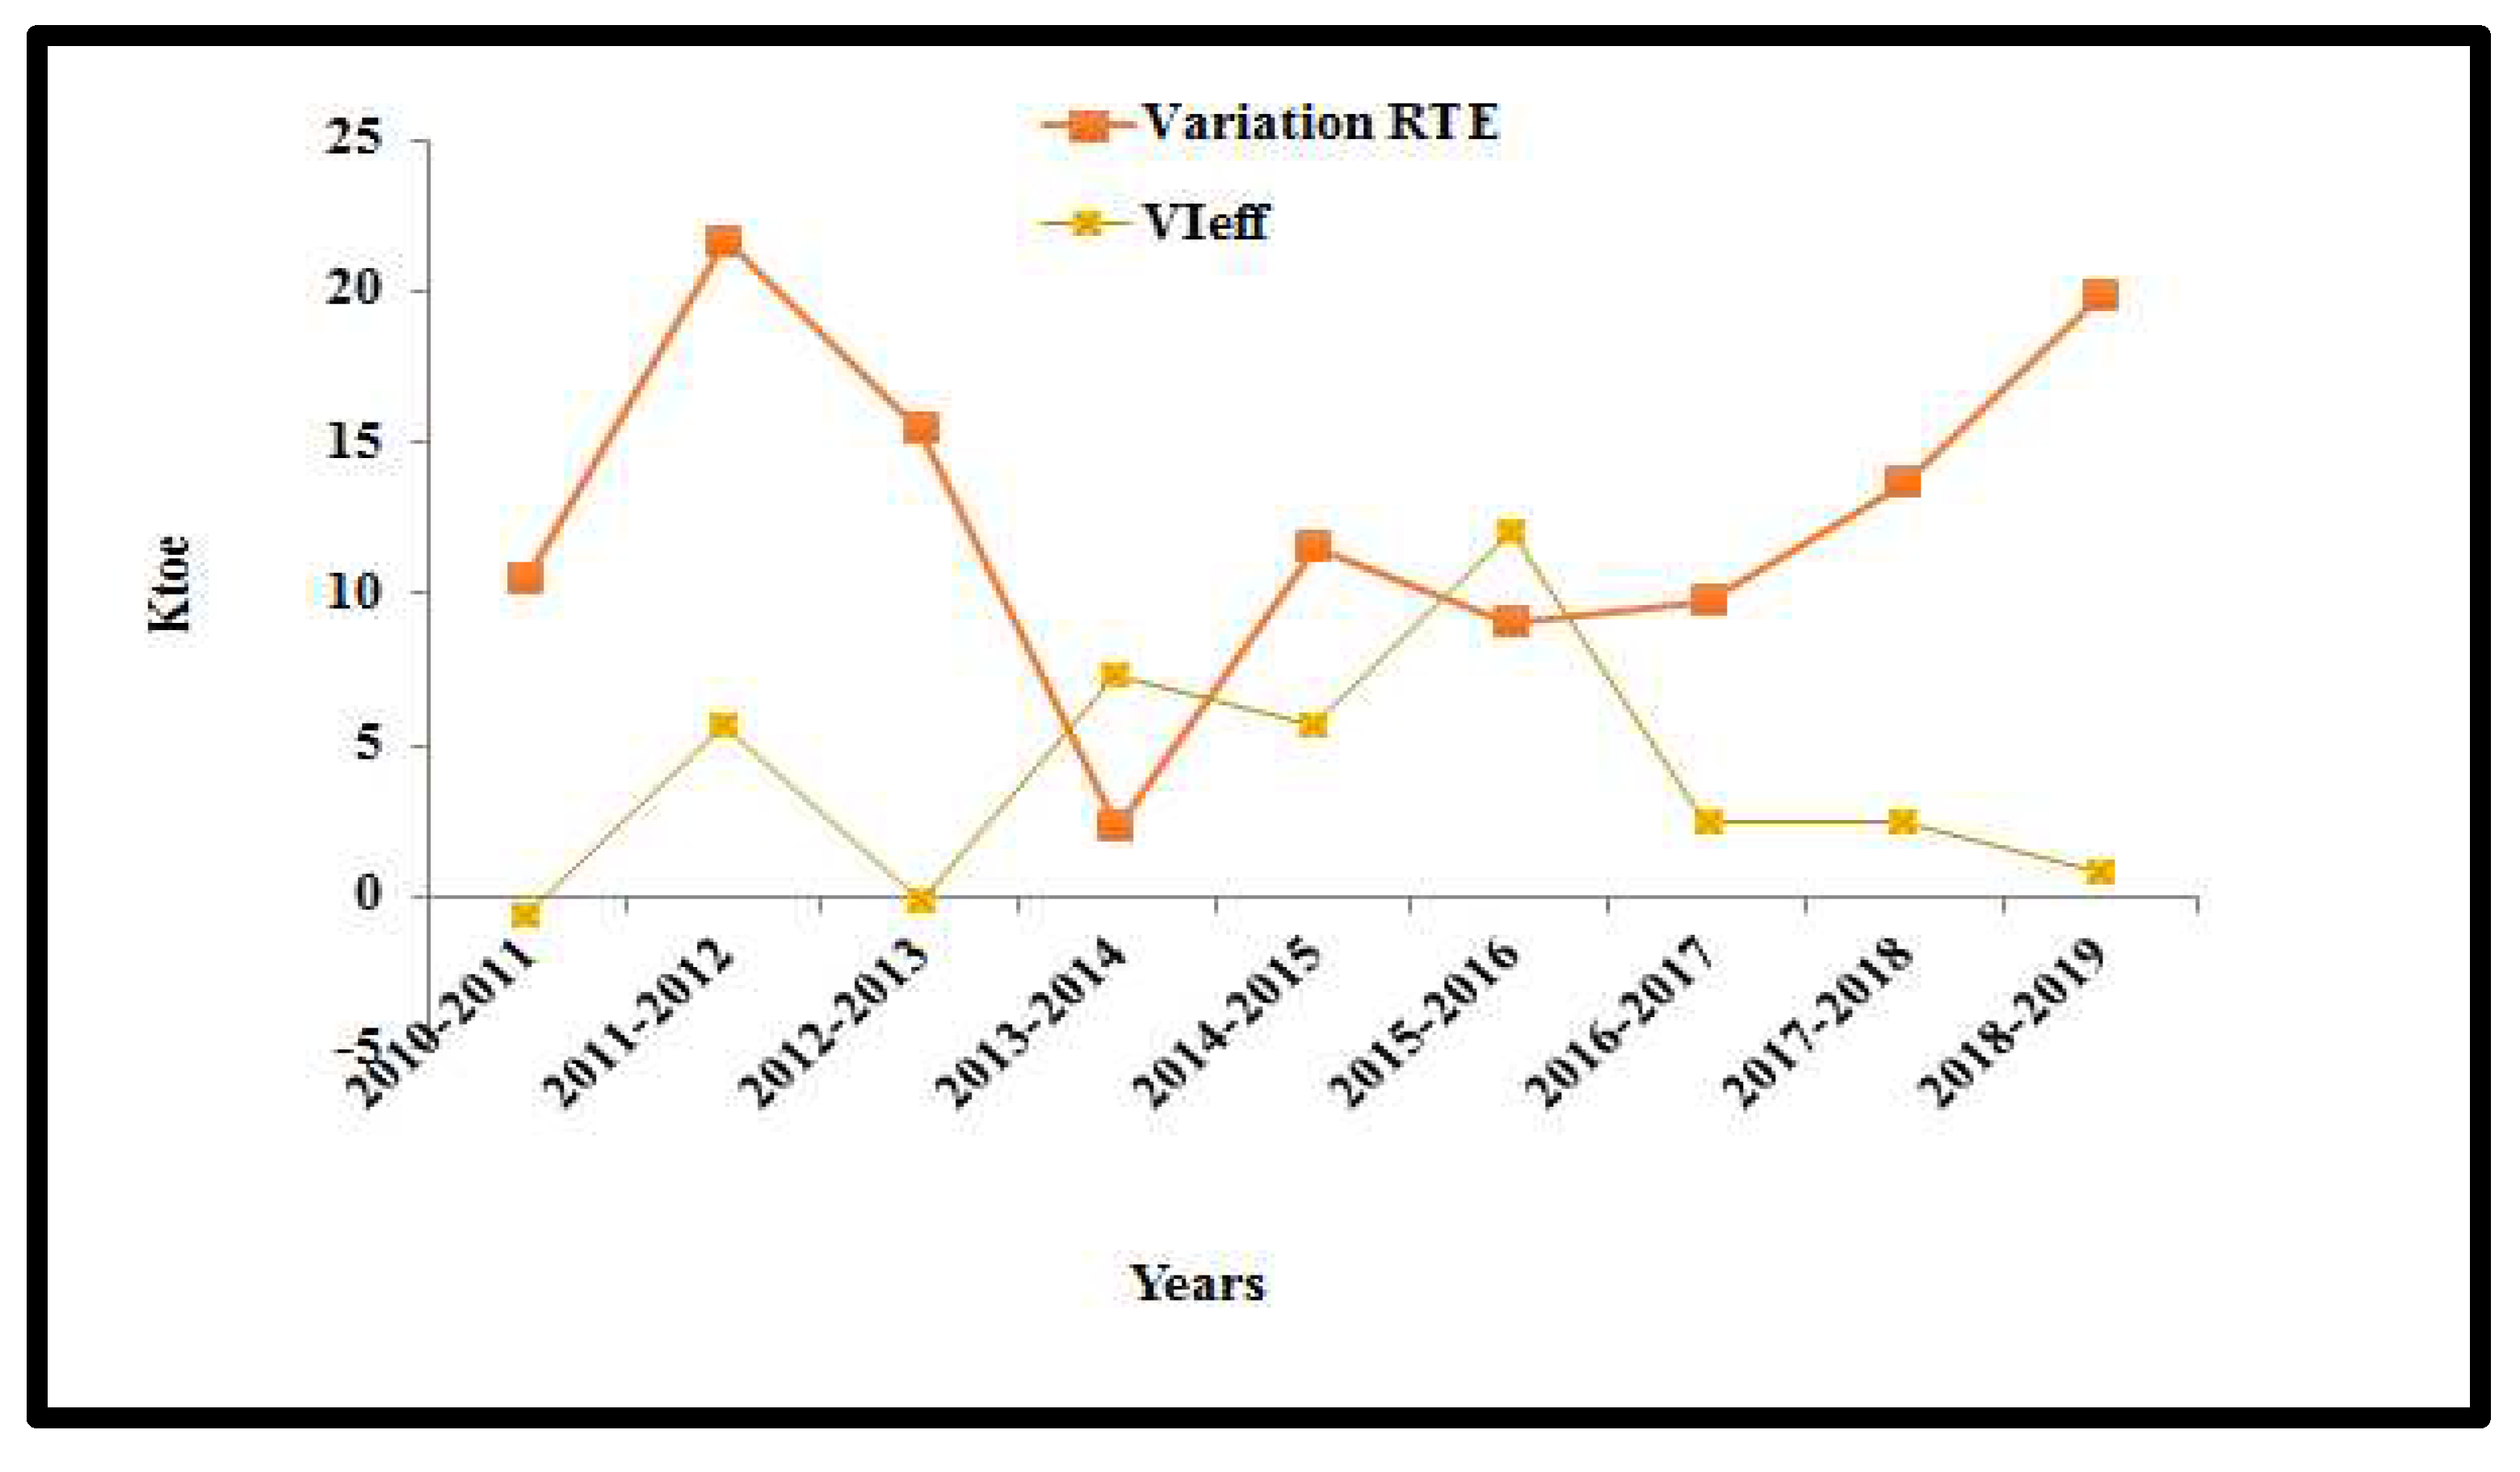
Figure 7.
Evolution of the effect of economic growth and variation in energy consumption.
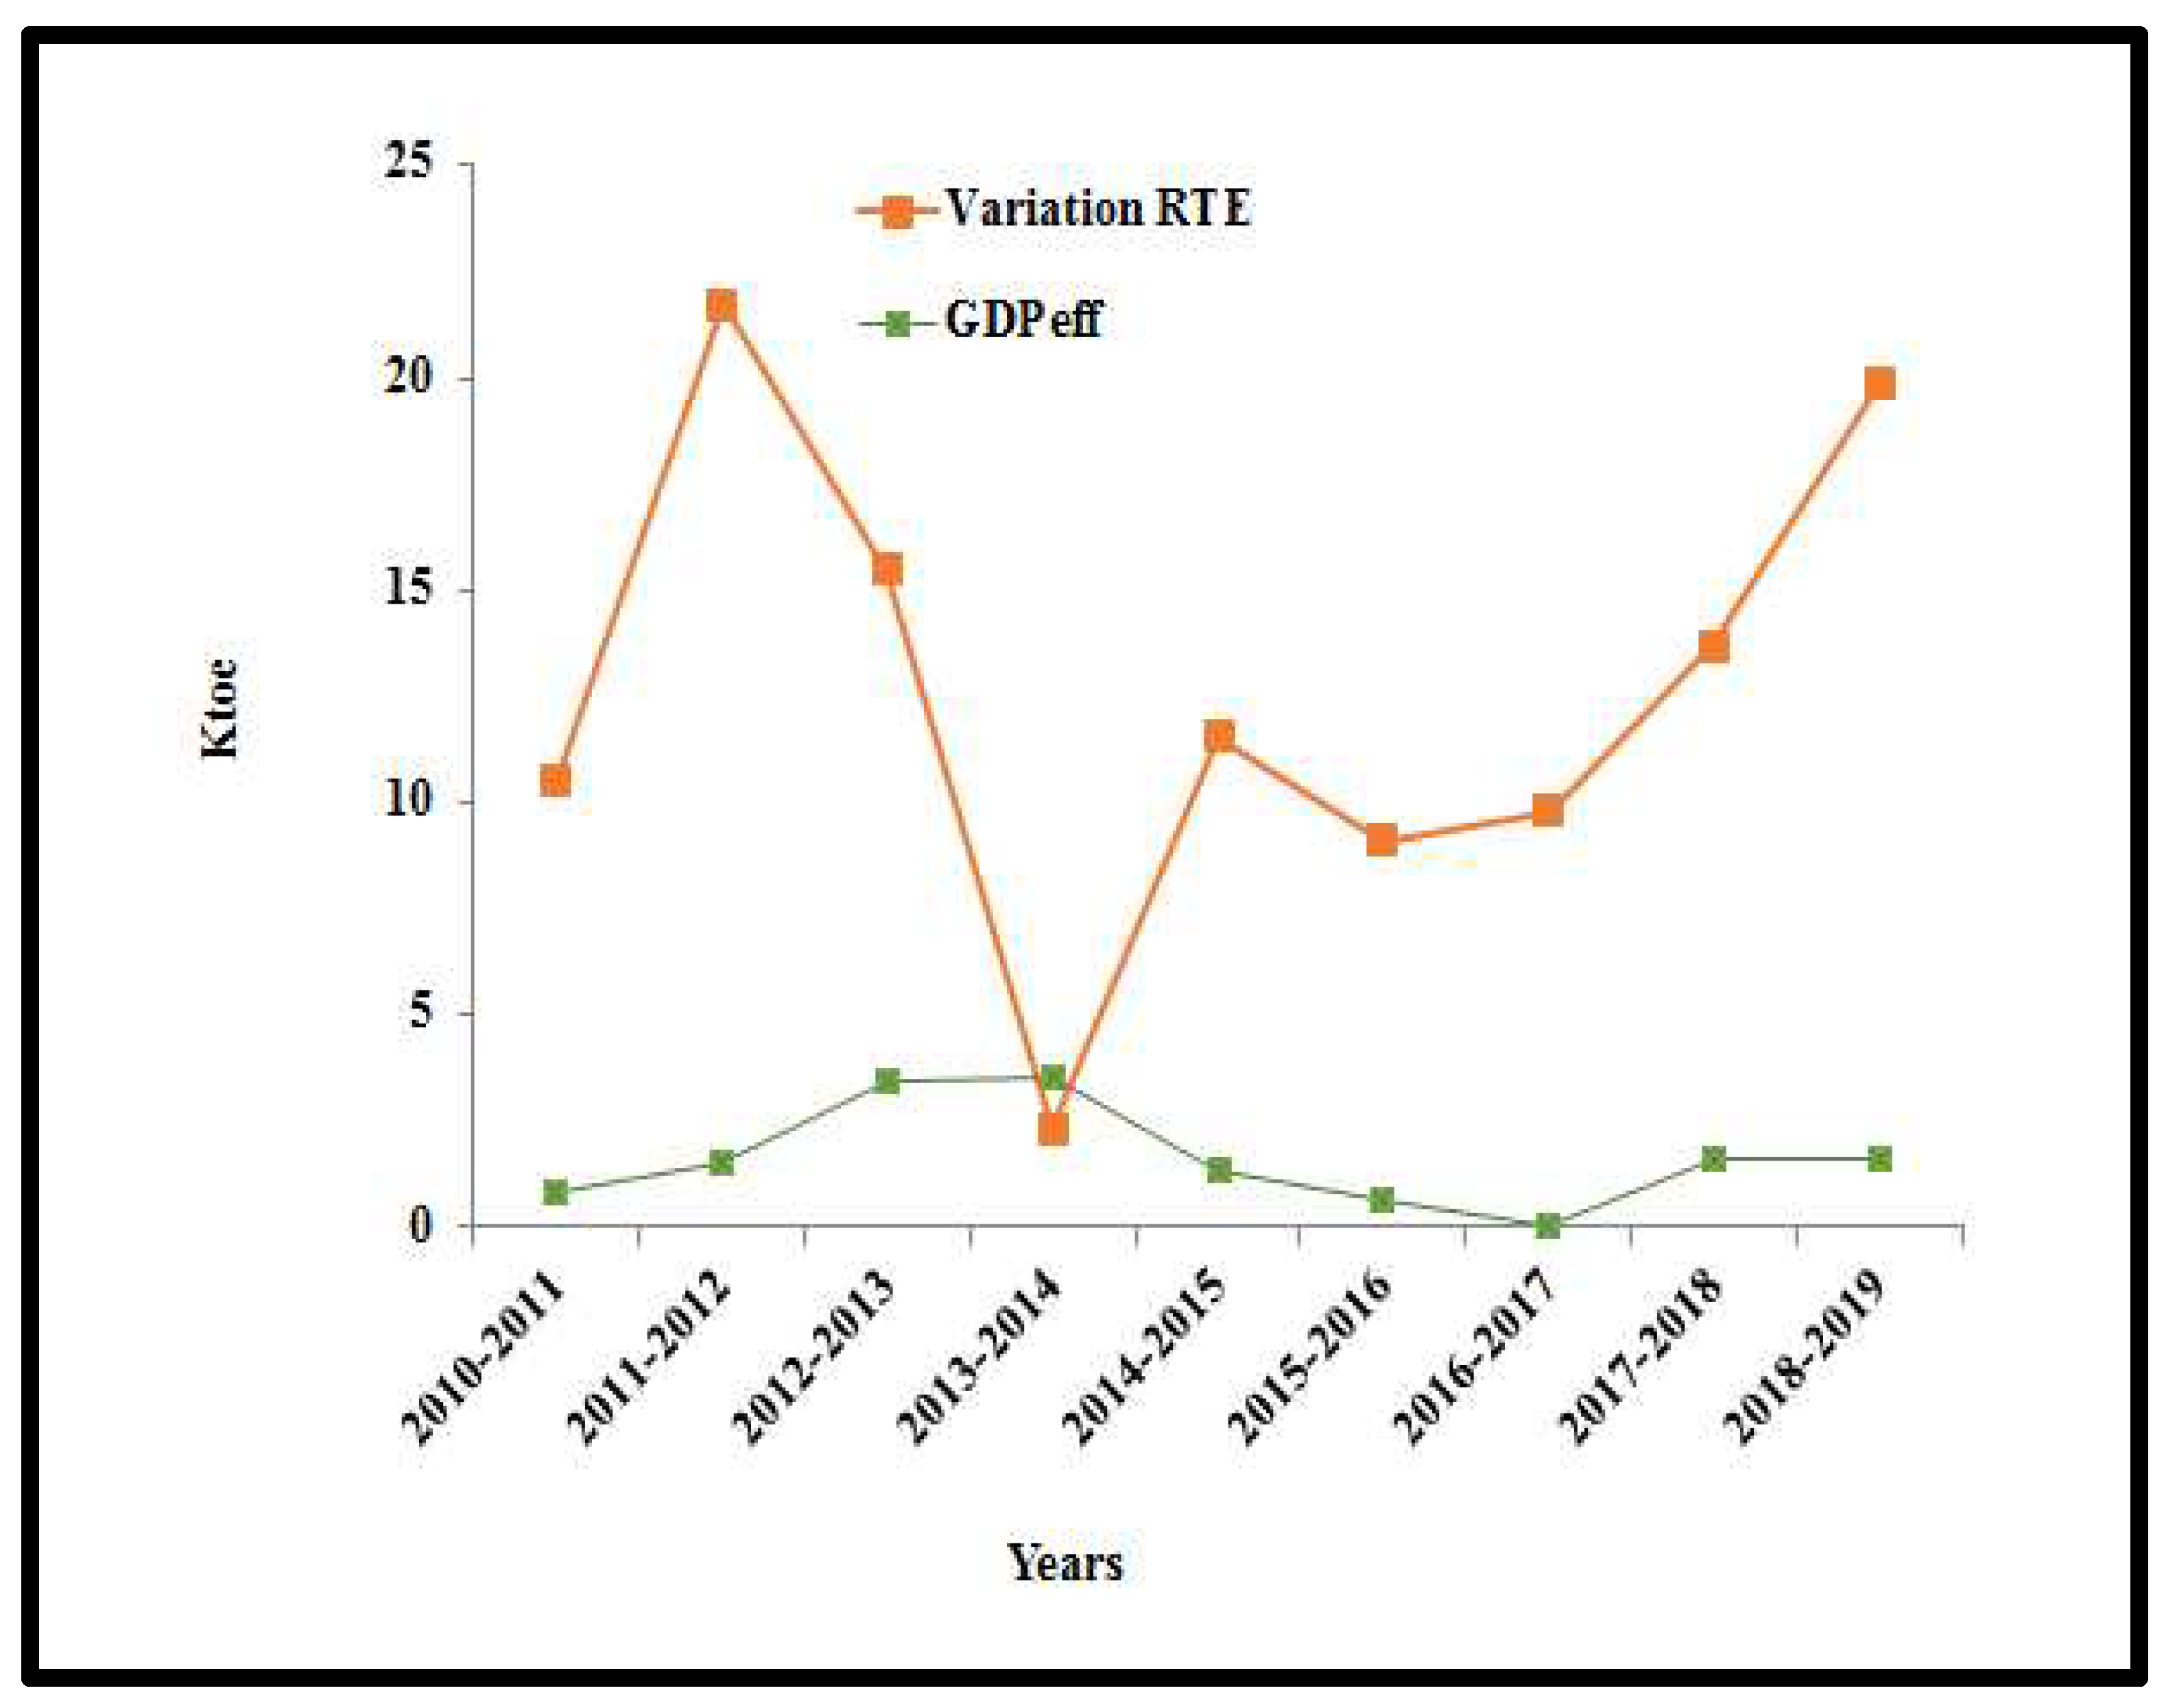
Figure 8.
Evolution of the population effect and the variation in energy consumption.
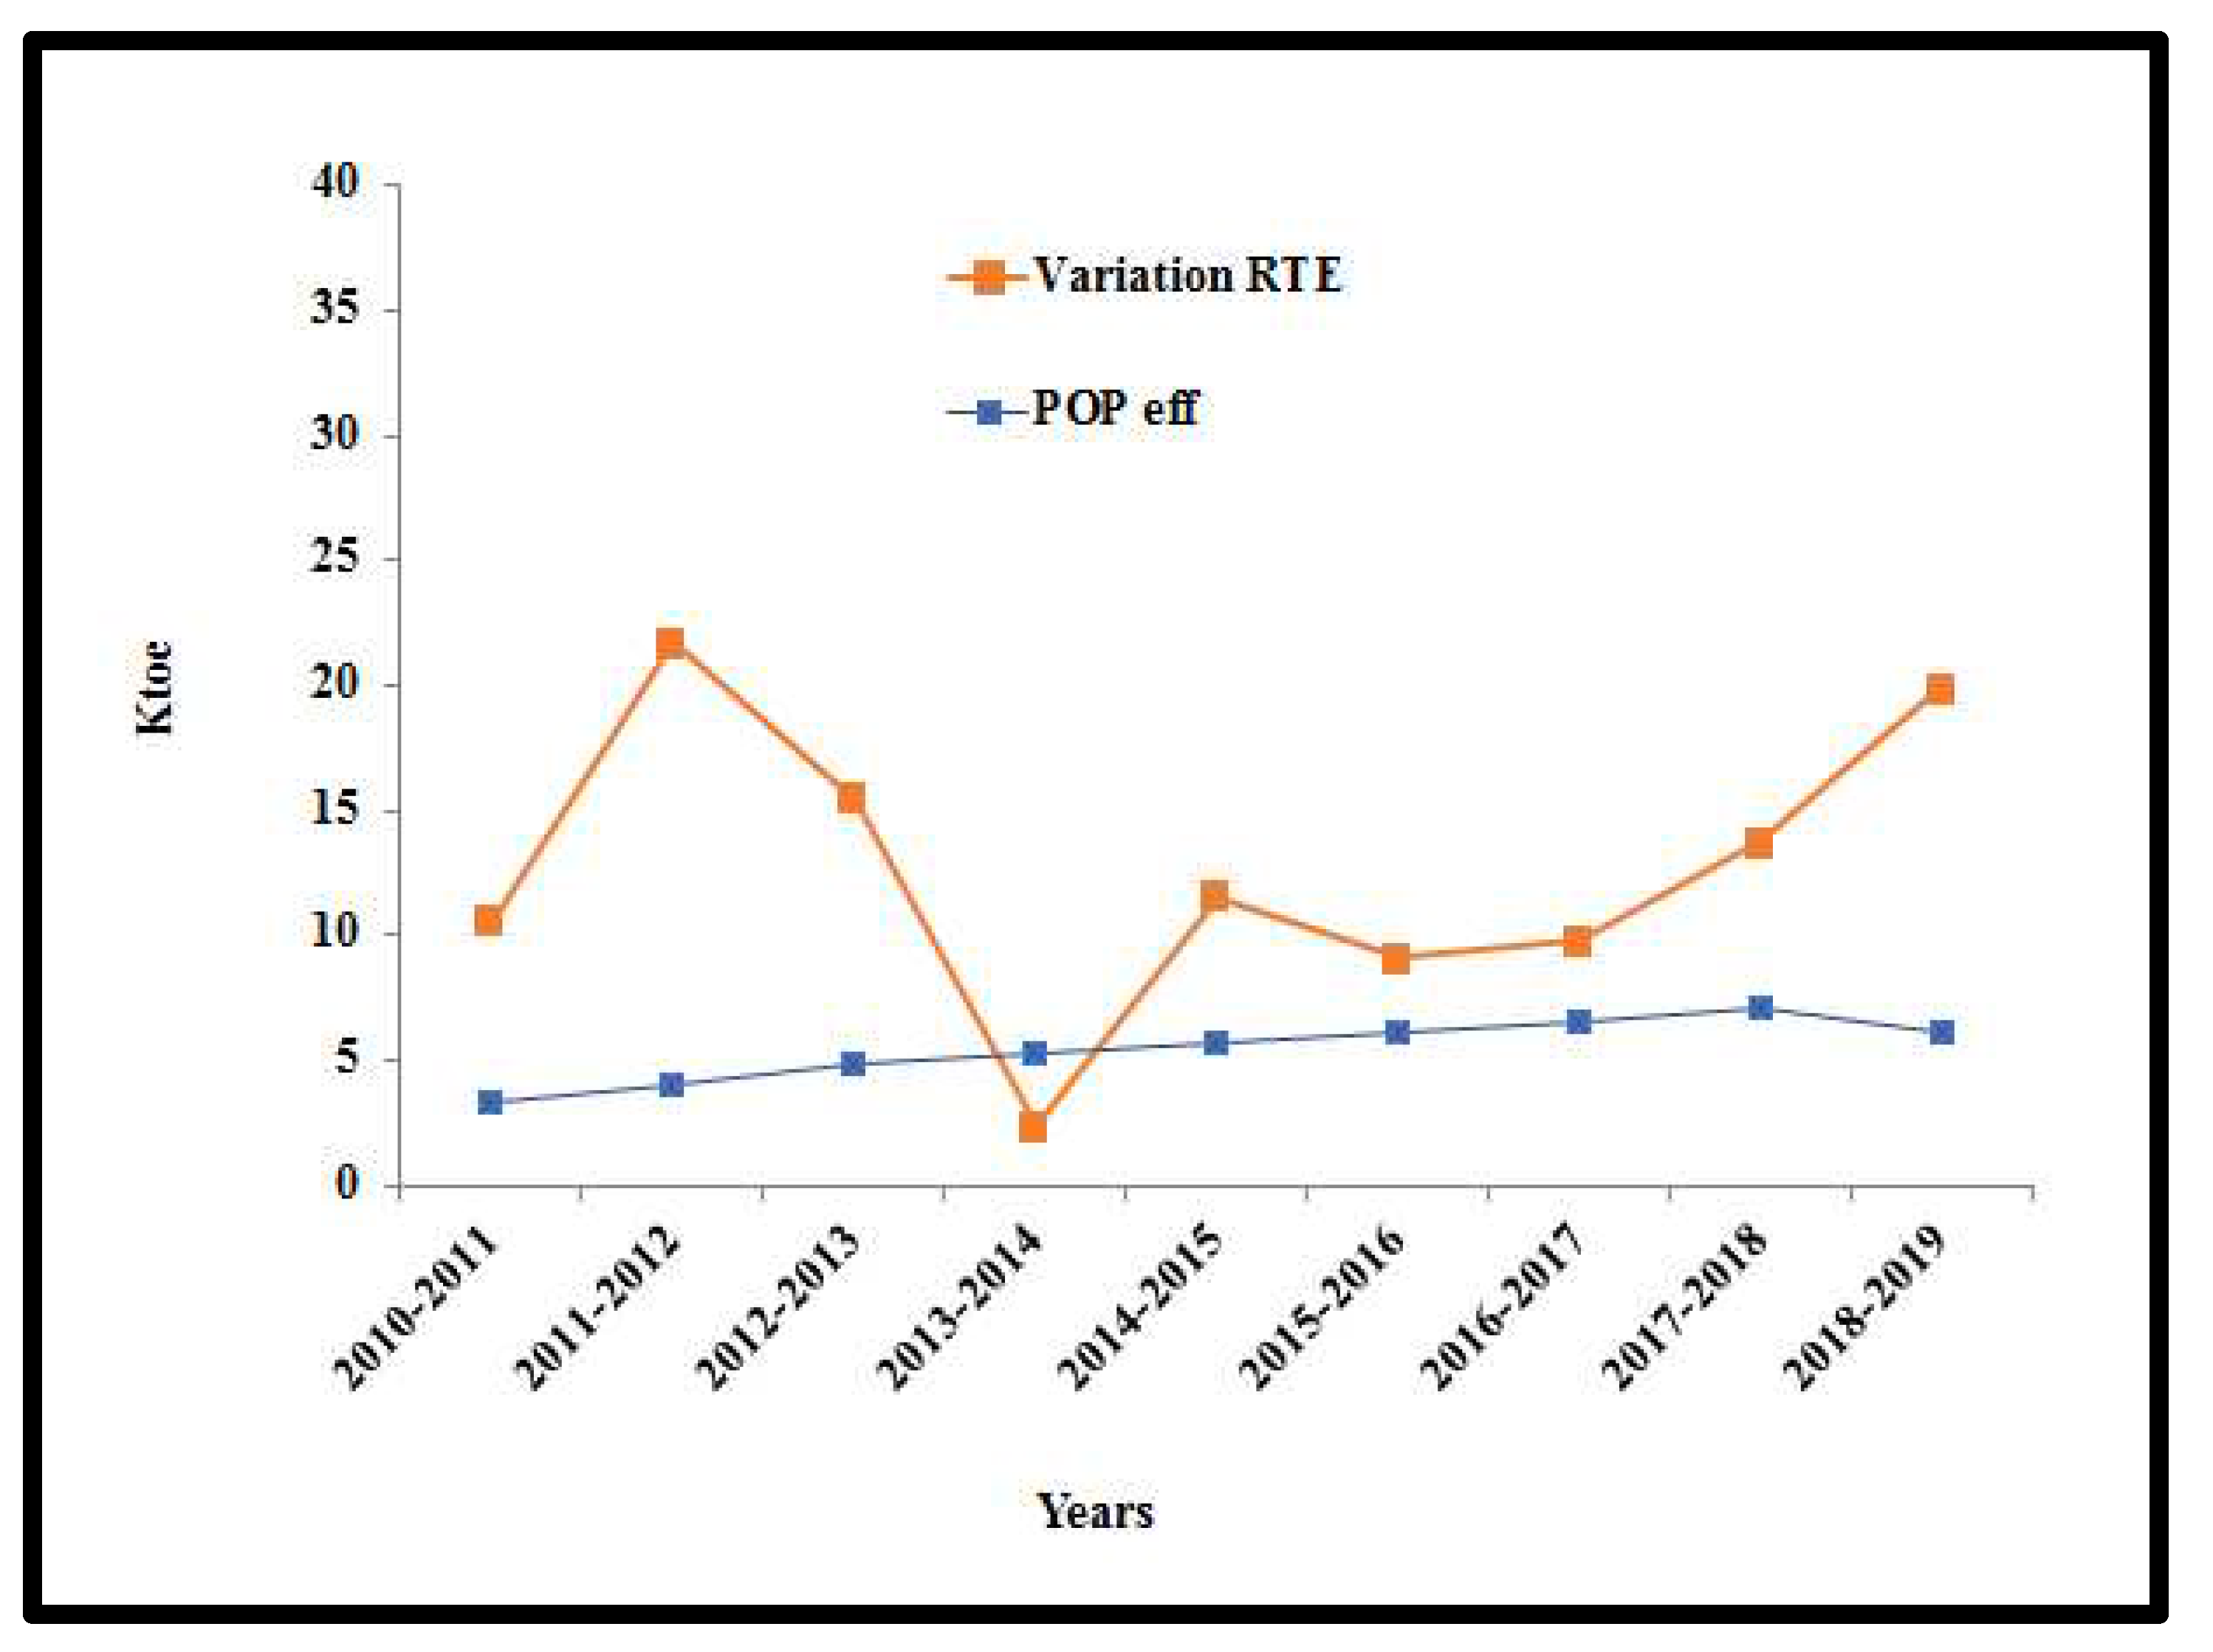

Table 1.
fuel consumption of road transport of the city in Douala.
| Fuel type | Years | Average annual growth rate (%) | ||
| 2010 | 2019 | |||
| Gasoline | Diesel | 66.108 | 180.336 | 11.48 |
| Total energy consumption (Ktoe) | ||||
Table 2.
Breakdown of the road vehicle fleet.
| 2010 | 2019 | Average annual growth rate (%) | |
| Cars | 9,702 | 18,892 | 8.41 |
| Motorbike | 20,800 | 52,000 | 10.87 |
| Bus | 500 | 810 | 4.23 |
| Lorry | 770 | 1075 | 4.49 |
| Total vehicles | 31,772 | 72,777 | 9.5 |
Table 3.
GDP per capita and motorization rate.
| 2010 | 2019 | Average annual growth rate(%) | |
| GDP per capita (€/Cap) | 2817.518 | 3207.149 | 5.85 |
| Motorization rate | 20.08 | 24.52 | 2.53 |
Table 4.
Population and urban density.
| 2010 | 2019 | Average annual growth rate(%) | |
| Population | 2, 361,000 | 3, 536,000 | 4.5 |
| Urban density (Cap /K) | 2557.963 | 3830.985 | 4.5 |
Table 5.
Decomposition results of Douala road transport related energy consumption.
| Year | |||||
| 2010-2011 | 10.543 | 7.067 | -0.644 | 0.848 | 3.272 |
| 2011-2012 | 21.722 | 10.415 | 5.728 | 1.554 | 4.025 |
| 2012-2013 | 15.485 | 7.31 | -0.147 | 3.446 | 4.877 |
| 2013-2014 | 2.346 | -13.816 | 7.325 | 3.572 | 5.265 |
| 2014-2015 | 11.557 | -1.045 | 5.644 | 1.336 | 5.622 |
| 2015-2016 | 9.087 | -9.612 | 12.015 | 0.641 | 6.087 |
| 2016-2017 | 9.797 | 0.623 | 2.526 | 0.064 | 6.539 |
| 2017-2018 | 13.696 | 2.537 | 2.494 | 1.628 | 7.036 |
| 2018-2019 | 19.854 | 11.431 | 0.771 | 1.58 | 6.072 |
| 2010-2019 | 114.087 | 14.91 | 35.712 | 14.669 | 48.795 |
Disclaimer/Publisher’s Note: The statements, opinions and data contained in all publications are solely those of the individual author(s) and contributor(s) and not of MDPI and/or the editor(s). MDPI and/or the editor(s) disclaim responsibility for any injury to people or property resulting from any ideas, methods, instructions or products referred to in the content. |
© 2023 by the authors. Licensee MDPI, Basel, Switzerland. This article is an open access article distributed under the terms and conditions of the Creative Commons Attribution (CC BY) license (http://creativecommons.org/licenses/by/4.0/).
Copyright: This open access article is published under a Creative Commons CC BY 4.0 license, which permit the free download, distribution, and reuse, provided that the author and preprint are cited in any reuse.


