1. Introduction
The low voltage (LV) distribution system contains several elements such as transformers, switches, circuit breakers, relays etc. These elements are essential for safe and uninterrupted supply for the users. It is also important to remember that cables are one of the most important and main parts of the network. The existing networks, which were built decades ago, face new challenges with increasing penetration of distributed generation (DG), electric vehicles, new appliances from the consumer side, and reverse power flow due to renewables [
1]. According to Eurostat, the EU’s share of renewable energy has doubled since 2004 [
2]. These new challenges may cause unbalanced and cyclic load distribution on the cable network. The accelerated aging tests used for lifetime estimation of insulating materials are usually executed at constant, elevated temperatures for relatively long periods; nevertheless, in real cable lines, the thermal cycling caused by cyclic loads causes additional stress initiating additional degradation mechanisms for the insulation, which is not simulated in a usual thermal aging test [
3]. Short-term overloads and short-circuit operations raise the temperature above the maximum operating limit [
4], damaging the cable insulation and shortening the lifespan [
5]. The thermal cycles also affect the dielectric parameter of cable insulation, and an increase of tan
was observed in a wider frequency range [
6].
The most commonly used insulating material for LV distribution cables is PVC [
7]. Besides the distribution network application, PVC is also used as an insulating material for nuclear power plant cables; however, installing PVC-insulated cables in the new reactor is not allowed [
8]. Nevertheless, due to the second license renewal of NPPs, condition monitoring of LV cables is paramount. High temperatures on plasticized PVC typically cause two main degradation processes. One of these is dehydrochlorination, while the second process is a mass loss of the plasticizer [
9]. However, the diffusional desorption of the plasticizers is the dominant process at lower temperatures [
10,
11]. Plasticizers are used to change a polymer’s glass transition temperature (Tg) [
12]. The glass transition temperature is the temperature at which an amorphous polymer changes from a hard/glassy state to a soft/leathery state. Plasticizer diffusion and evaporation have been identified as causes of insulation degradation during thermal ageing by several studies [
13,
14,
15,
16]. According to Nedjar et al., the early stages of ageing cause insulation degradation due to plasticizer loss. At a longer time, the degradation is attributed to stabilizer consumption followed by material colouration and hydrochloric acid emission. A change in the colour, shrinking, and mass loss is observed as degradation [
14]. Wie et al. described that plasticizers could leave the polymer through migration, evaporation, or extraction, which causes changes in mechanical properties by reducing flexibility, extensibility, and toughness [
15]. Konecna et al. investigated the temperature dependence of dielectric parameters under thermal aging by measuring tan
and capacitance. It is proven that these parameters are affected [
17]. Nedjar et al. have published that the evaporation of plasticizers has resulted in increases in tan
[
16]. Later, Csanyi et al. published several studies showing that the PVC cable insulation hardens when exposed to cyclic thermal stress and showed correlation between the dielectric parameters and the hardness of the material [
13,
18,
19].
In investigating cable aging, single-core simple cables are usually used to eliminate the effect of the complex structure of multicore cables and the interaction among the polymeric components [
20,
21,
22]. However, a typical LV cable contains layers such as conductors, core insulations, protective tape screens, a jacket etc. The degradation of these layers may be different due to the nonuniform temperature distribution in the cable and the inter-diffusion of plasticizer between the layers [
22,
23]. Honing et al. found that an increased number of insulation layers could add several degrees to the cable temperature [
24].
In this study the effect of the structure is investigated to reveal the behaviour due to repetitive ageing is the characteristic of the polymer itself or it is resulted from the structure as well. Hence, four cable samples, each 50 cm in length, were prepared for this purpose. One sample was kept intact, and the different layers were removed from other samples to investigate the impact of the cable structure on dielectric parameters during ageing. Then short-term artificial cyclic ageing was applied to simulate the short-term temperature changes due to the load variation. Previous studies have successfully adopted dielectric spectroscopy measurements on LV cables [
21,
25,
26,
27,
28]. Therefore dielectric parameters, tan
, capacitance, polarization and depolarization currents were measured after each ageing cycle. The hardness was also measured but can be executed on the belting layer only because the cable’s structure does not enable measuring it on core insulations.
The paper in
Section 2 introduces the applied methodology, while
Section 3 details the sample preparation and equipment used.
Section 4 describes the results and discusses them. Finally, in the last section, the main findings are summarised.
2. Methodology
For characterization of the change of the properties of the cable polymeric components the dielectric response and the hardness were measured.
2.1. Dielectric Response Measurements
Dielectric Response Measurement (DRM) is widely accepted and used as useful condition monitoring (CM) technique [
29]. These techniques measure the current flowing through the tested insulation. If the exciting voltage is DC, the current is measured and recorded in the time domain. While applying AC voltage, the magnitude and the phase of the current are measured. In the case of dielectric spectroscopy, these parameters are investigated in a wide frequency range, i.e., frequency domain measurement.
In general, tan
and capacitance are measured in the frequency domain, and polarization- depolarization currents are measured in the time domain [
30]. These measurements are capable of monitoring the degradation of LV cables [
25,
26].
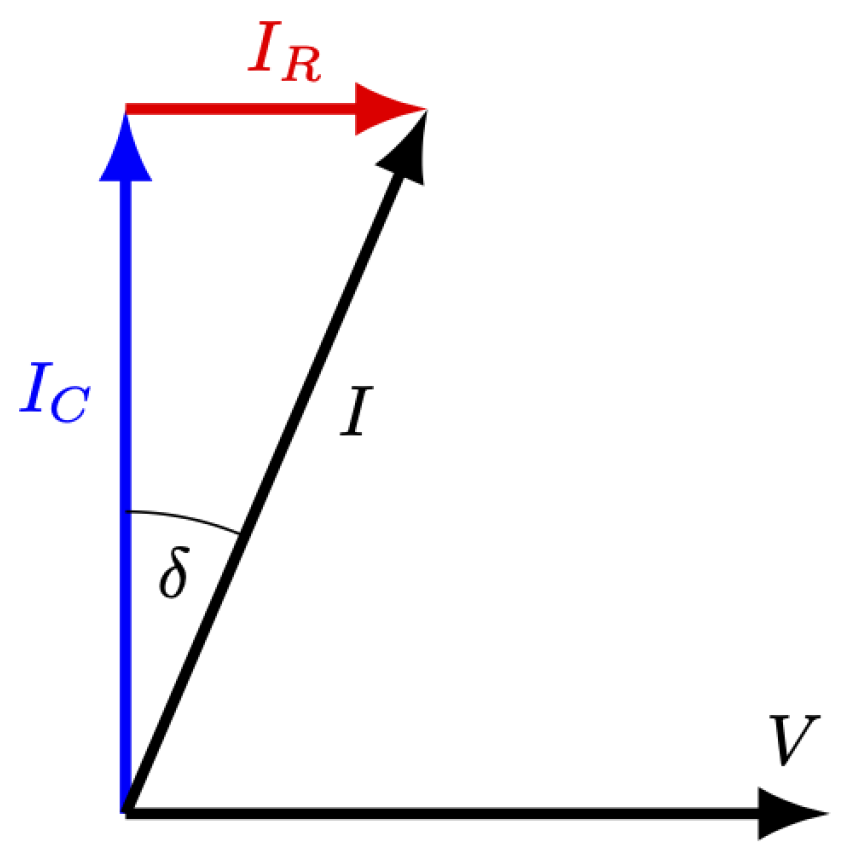
The tan
, or loss factor is a ratio of the resistive and capacitive current flowing through a dielectric excited with alternating voltage (
Figure 1):
The value of the tan
characterizes the dielectric loss of insulation and is widely used in condition monitoring of electrical equipment [
31].
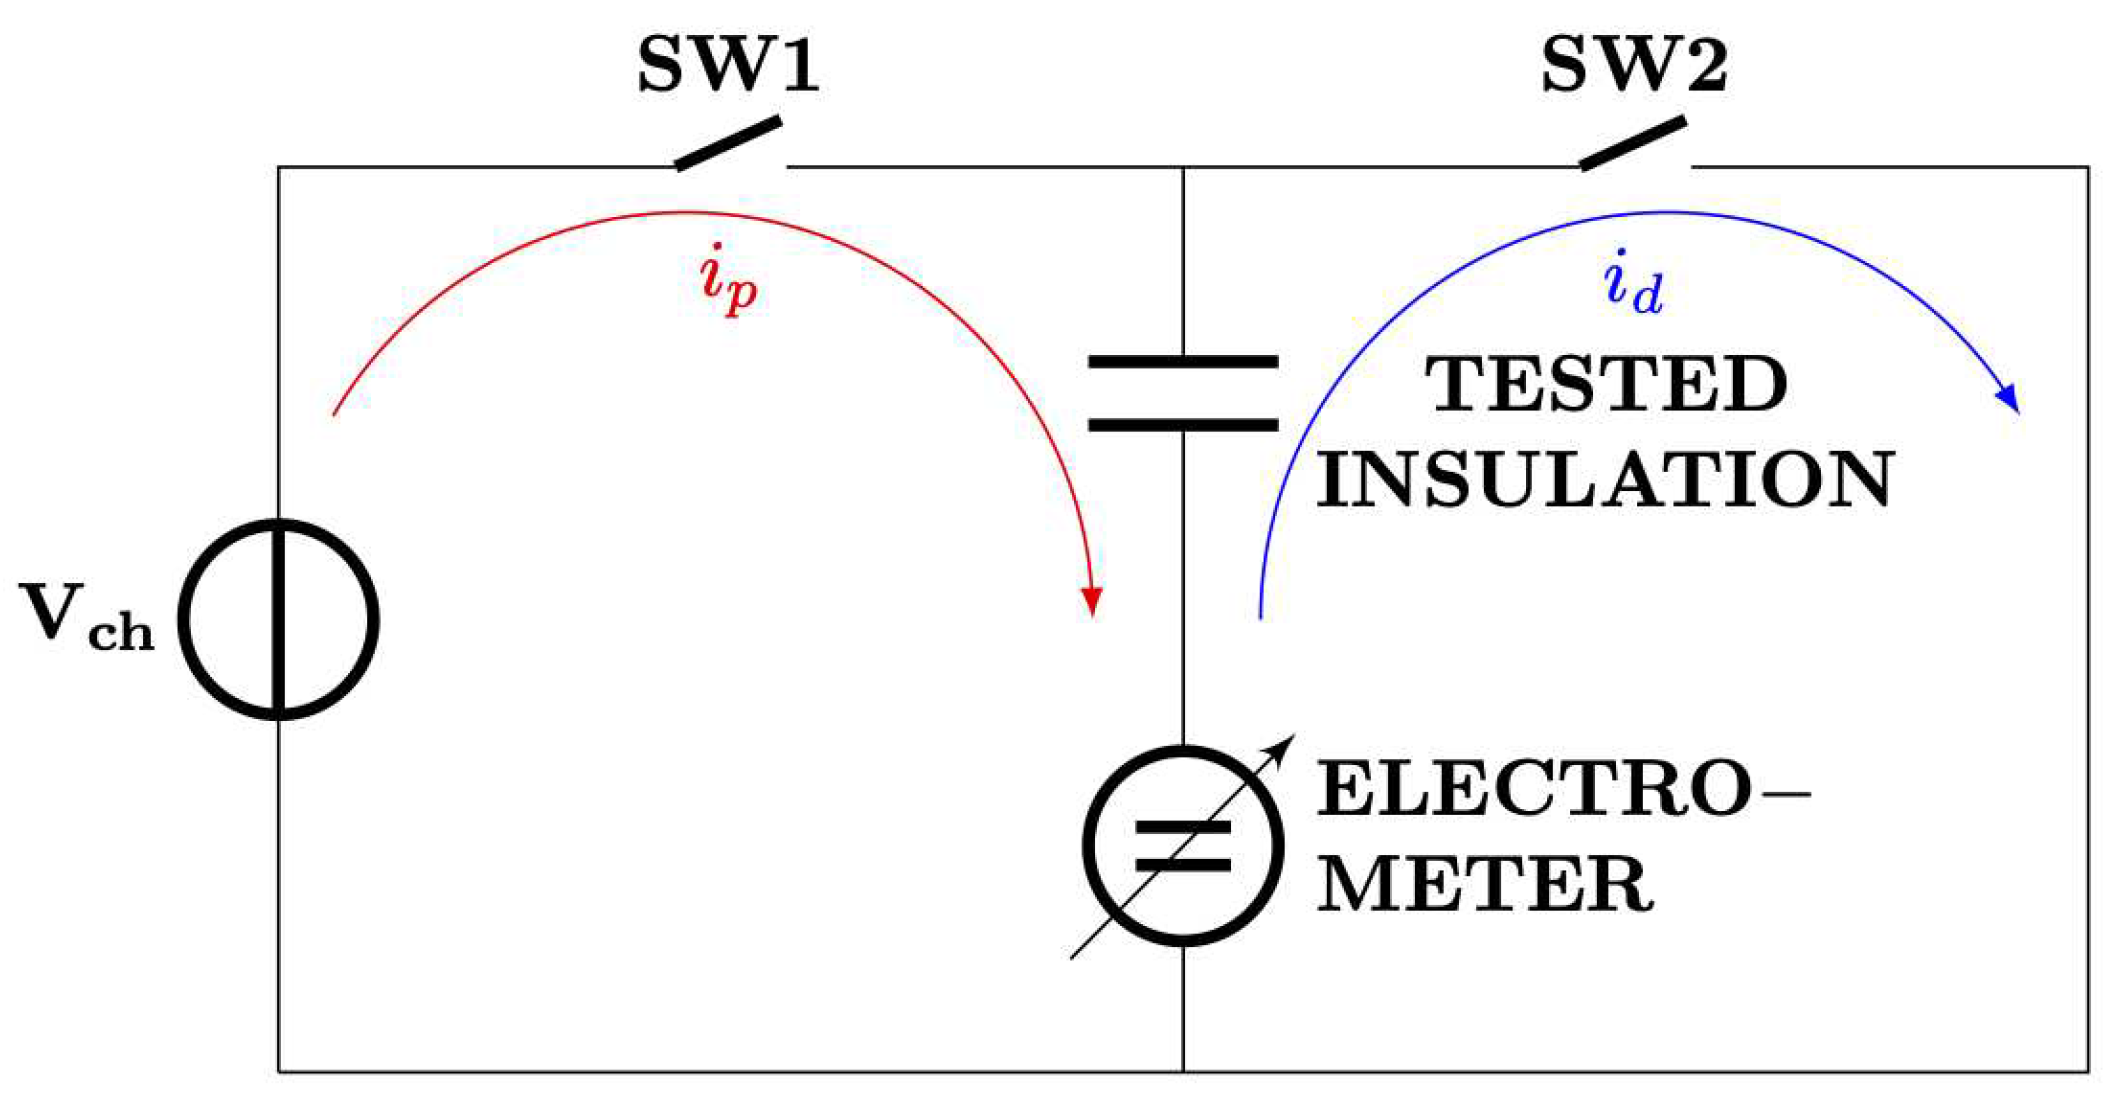
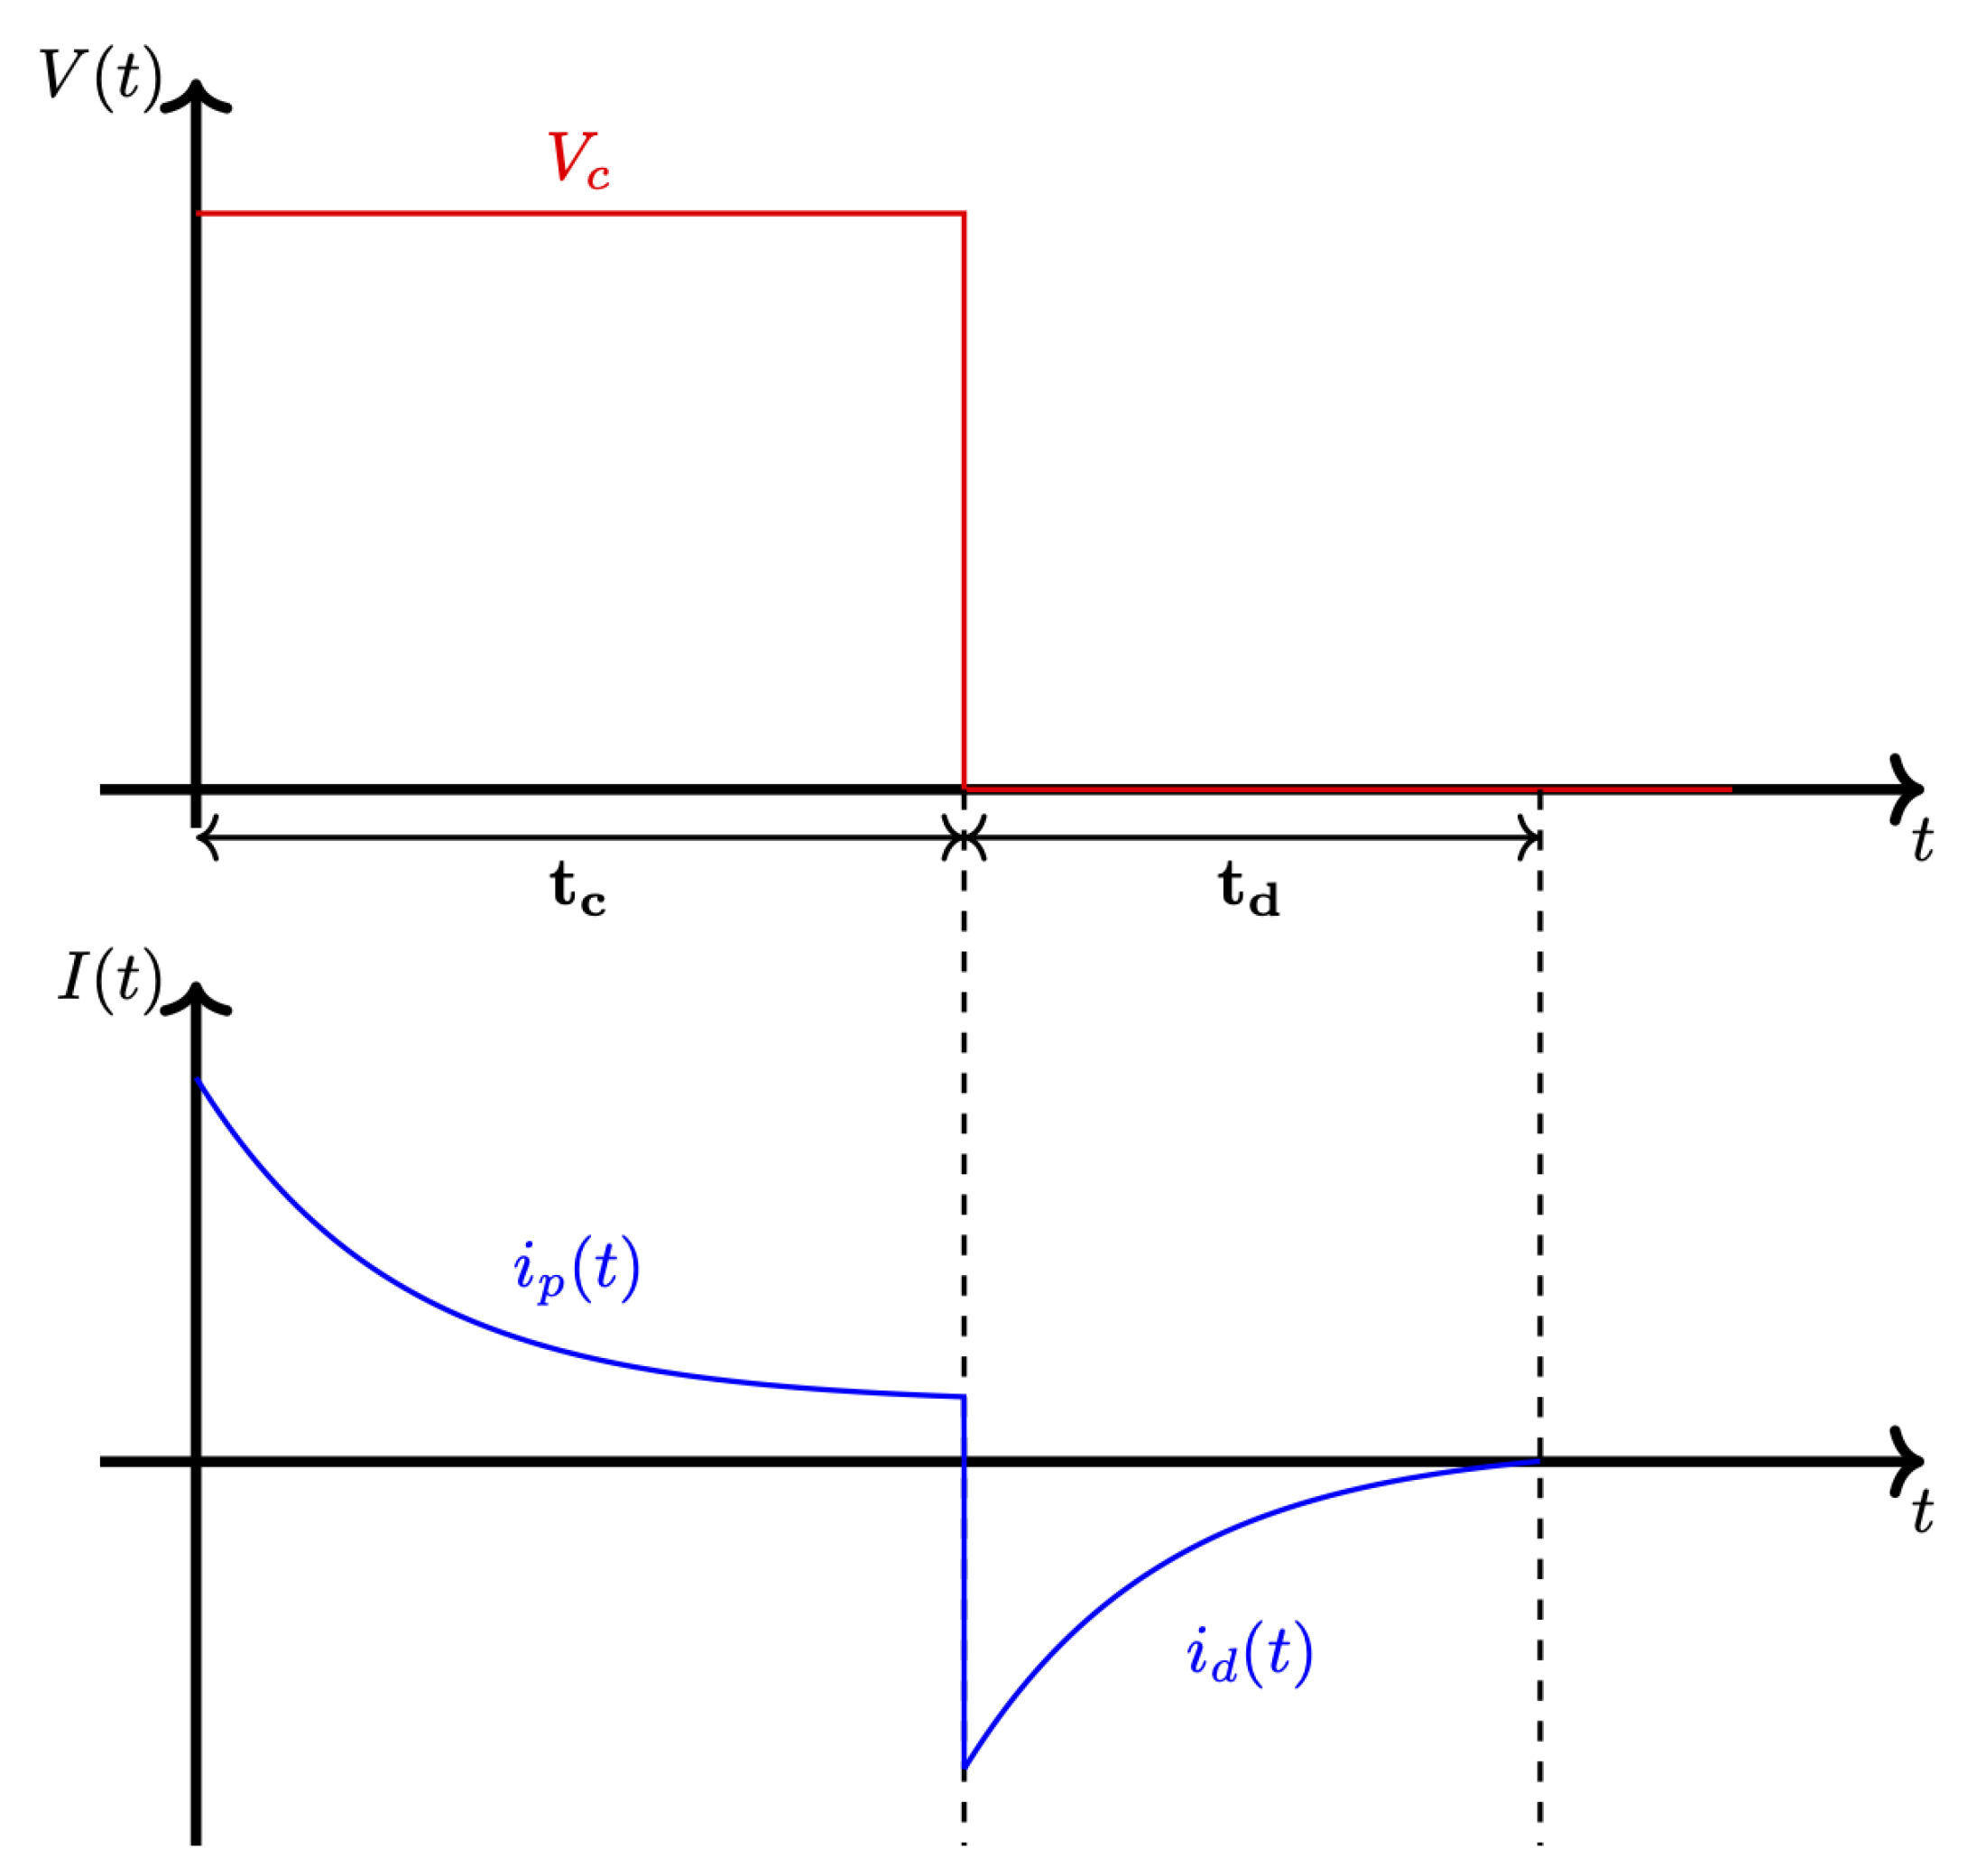
The PDC measurement is based on two processes, charging and discharging the dielectric. The cable sample is charged with a voltage source for a defined period of time. Once the charging period is over, the cable sample is discharged again for a pre-defined discharging time. The PDC is measured, from which the conduction current is calculated. The polarization current is strongly dependent on the insulation conductivity. The circuit diagram of PDC can be seen in
Figure 2, while the timing diagram is in
Figure 3.
The polarization current formula can be seen in Equation (
2) [
30]:
stands for geometric capacitance,
stands for conductivity and
stands for the dielectric response function. The depolarization current can be expressed as in Equation (
3).
Using Equation (
2) and Equation (
3),
can be derived as shown in Equation (
4):
The timing diagram of the experiment can be seen in
Figure 3.
2.2. Hardness Testing
The change of mechanical properties of the cable’s plastic components was measured by Shore D hardness. The hardness measures the penetration depth of the indenting foot in the material by applying a constant. The Shore D hardness is used to measure the hardness of plastics and is also applied for condition monitoring in cable diagnostics. In the case of the Shore D scale, if the indenting foot has no indention to the material, the hardness value is 100, while if the indention has a maximum (2.54 mm), the value is 0. The applied force is 4450.0 mN.
3. Experiment
3.1. Cable Sample
SZAMKAM
kV 16 mm
× 4 PVC insulated, manufactured by Prysmian MKM Kft, Hungary, cable samples were put under accelerated aging test. The cable samples were produced according to the requirements of IEC 60502-1 [
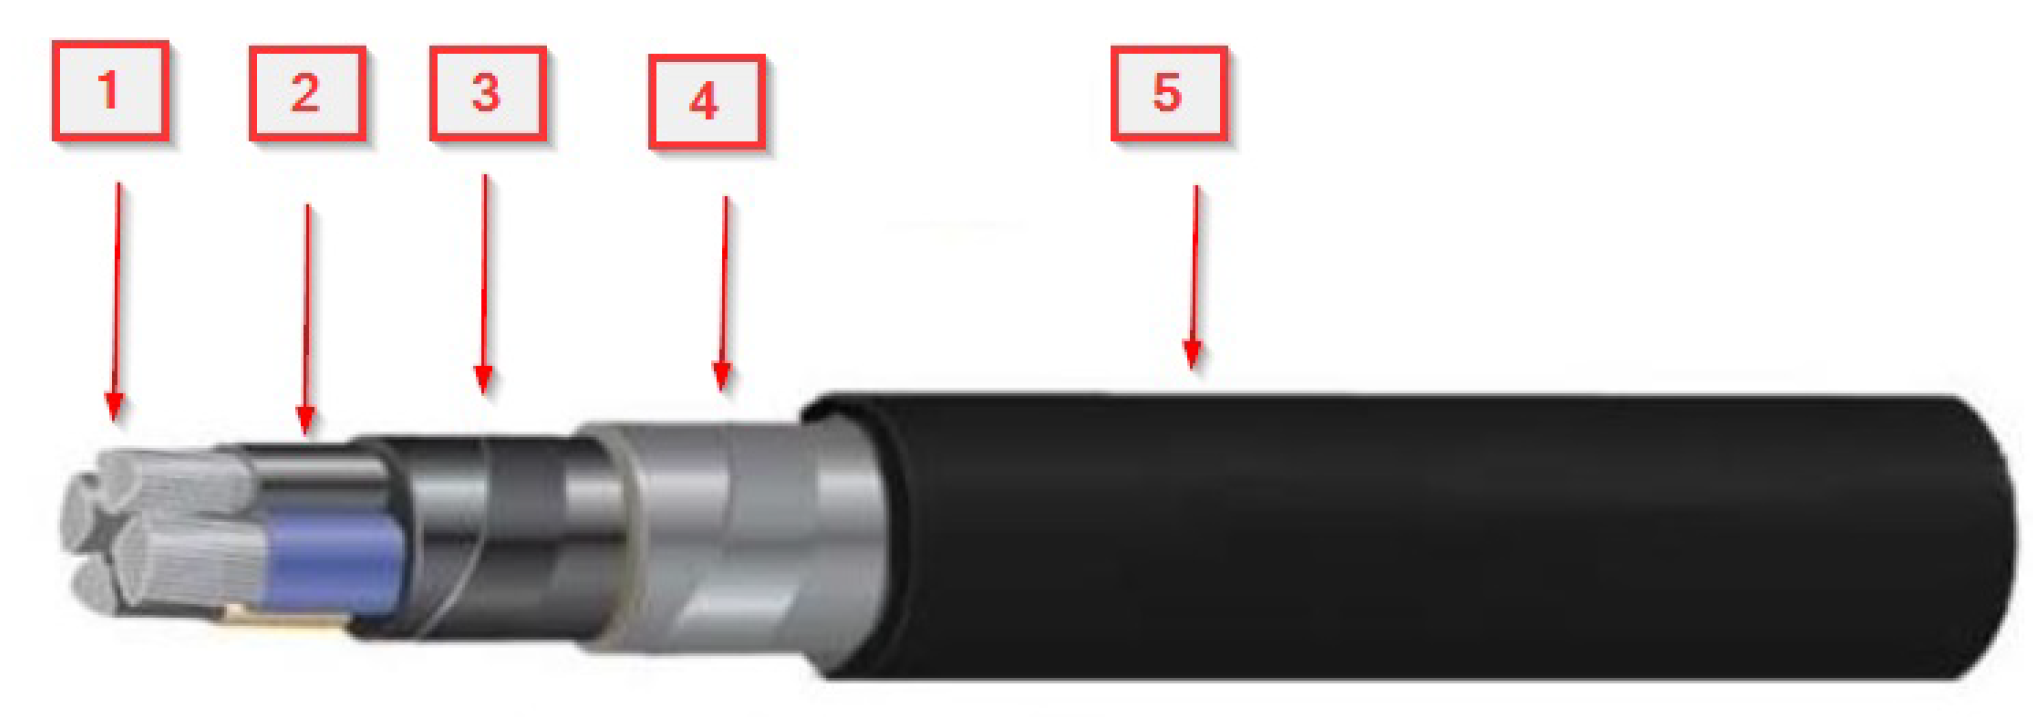
32]. The cable structure can be seen in
Figure 4. According to the technical data, the maximum conductor operating temperature of the cable is 70
C.
As previously mentioned, this research aims to look at the effect of cable construction on dielectric characteristics that are impacted by thermal aging. Therefore, the layers of the cable were removed. It is worth emphasizing that the dielectric parameters were measured before changing the structure and thermal aging to ensure sample homogeneity.
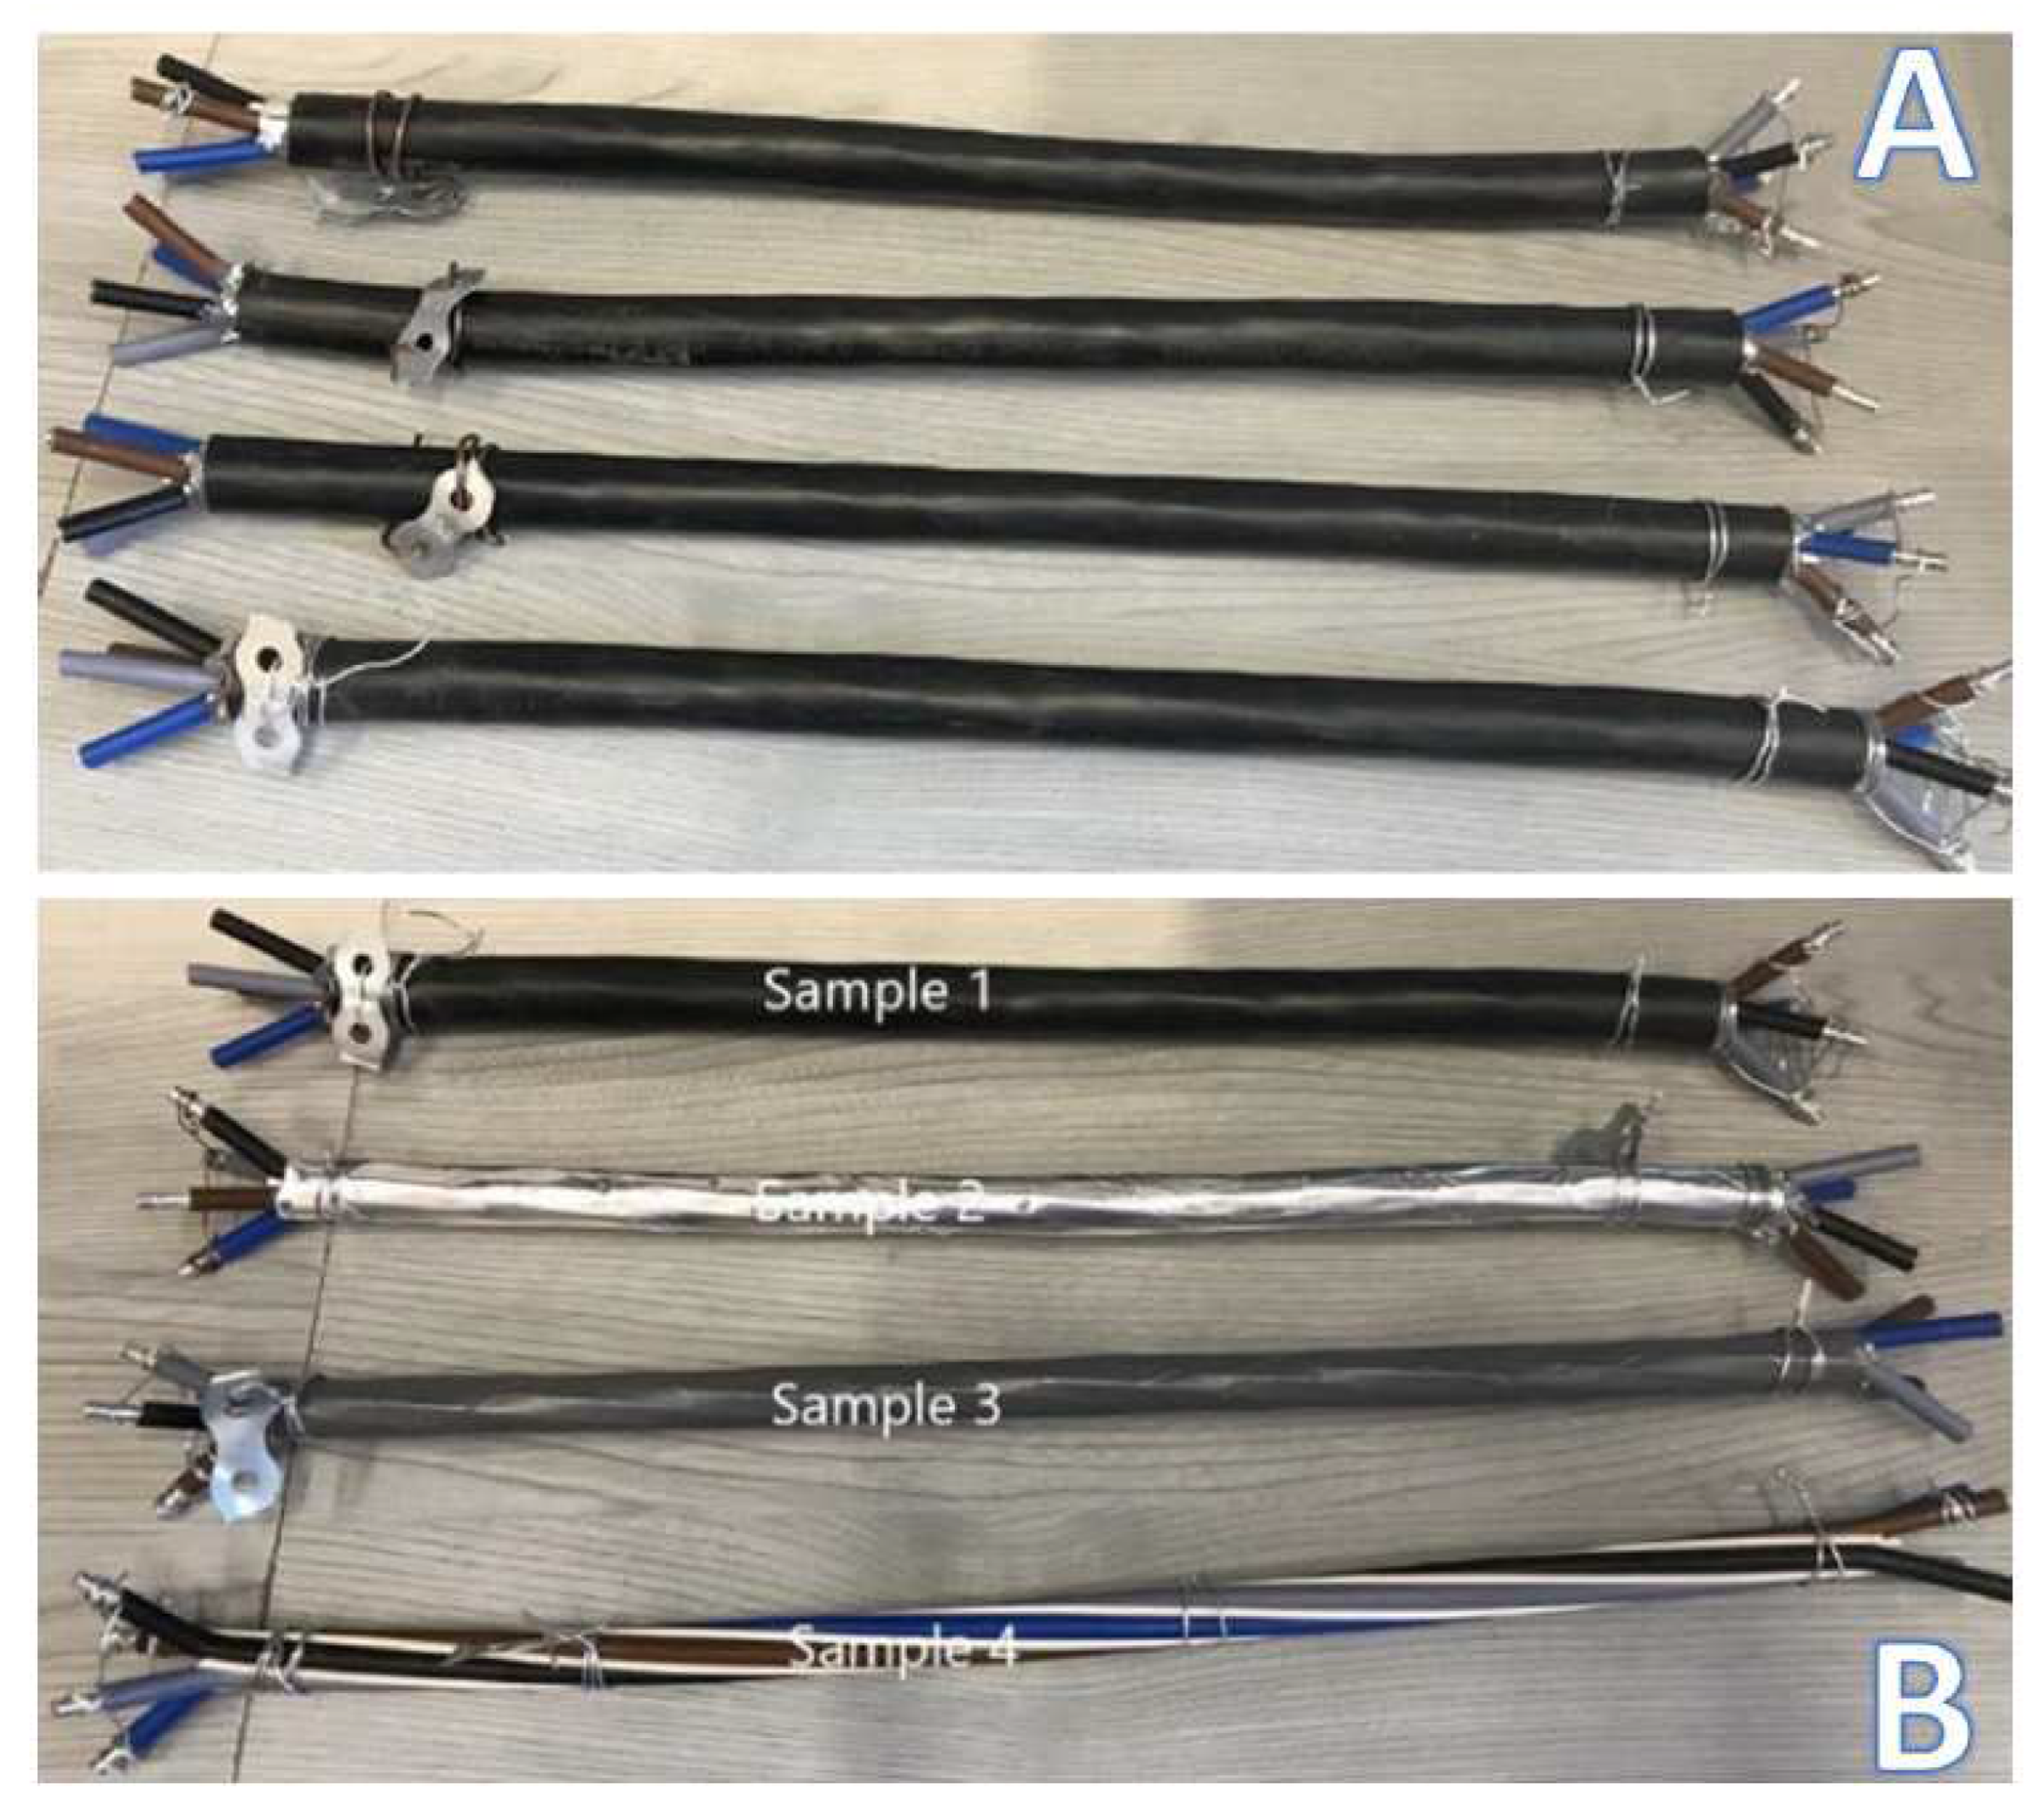
Figure 5 shows the samples before and after changing the structure.
Table 1 depicts the leftover layers for each sample after changing the structure. Sample 1 was kept intact. The outer PVC jacket was removed from Sample 2. By comparing the measurements on this sample with those on the intact sample, it is possible to test whether the layers under the jacket (aluminum tape screen and PVC tape) adequately insulate the core insulations from the air. In the case of Sample 3, besides the PVC jacket, the aluminum screening tape was also removed. Only the PVC belt isolates the core insulations from the atmosphere of the aging chamber, while in Sample 4, the core insulations are not covered by anything. Hence, if the atmosphere affects the aging of the core insulations, it has to be seen in the measurement results.
3.2. Thermal Ageing
The cables are subjected to various stresses during the operation. However, dominant stress may be responsible for the majority of degradation. A previous study has shown that thermal stress can dominate, resulting in insulation degradation [
33]. As mentioned in
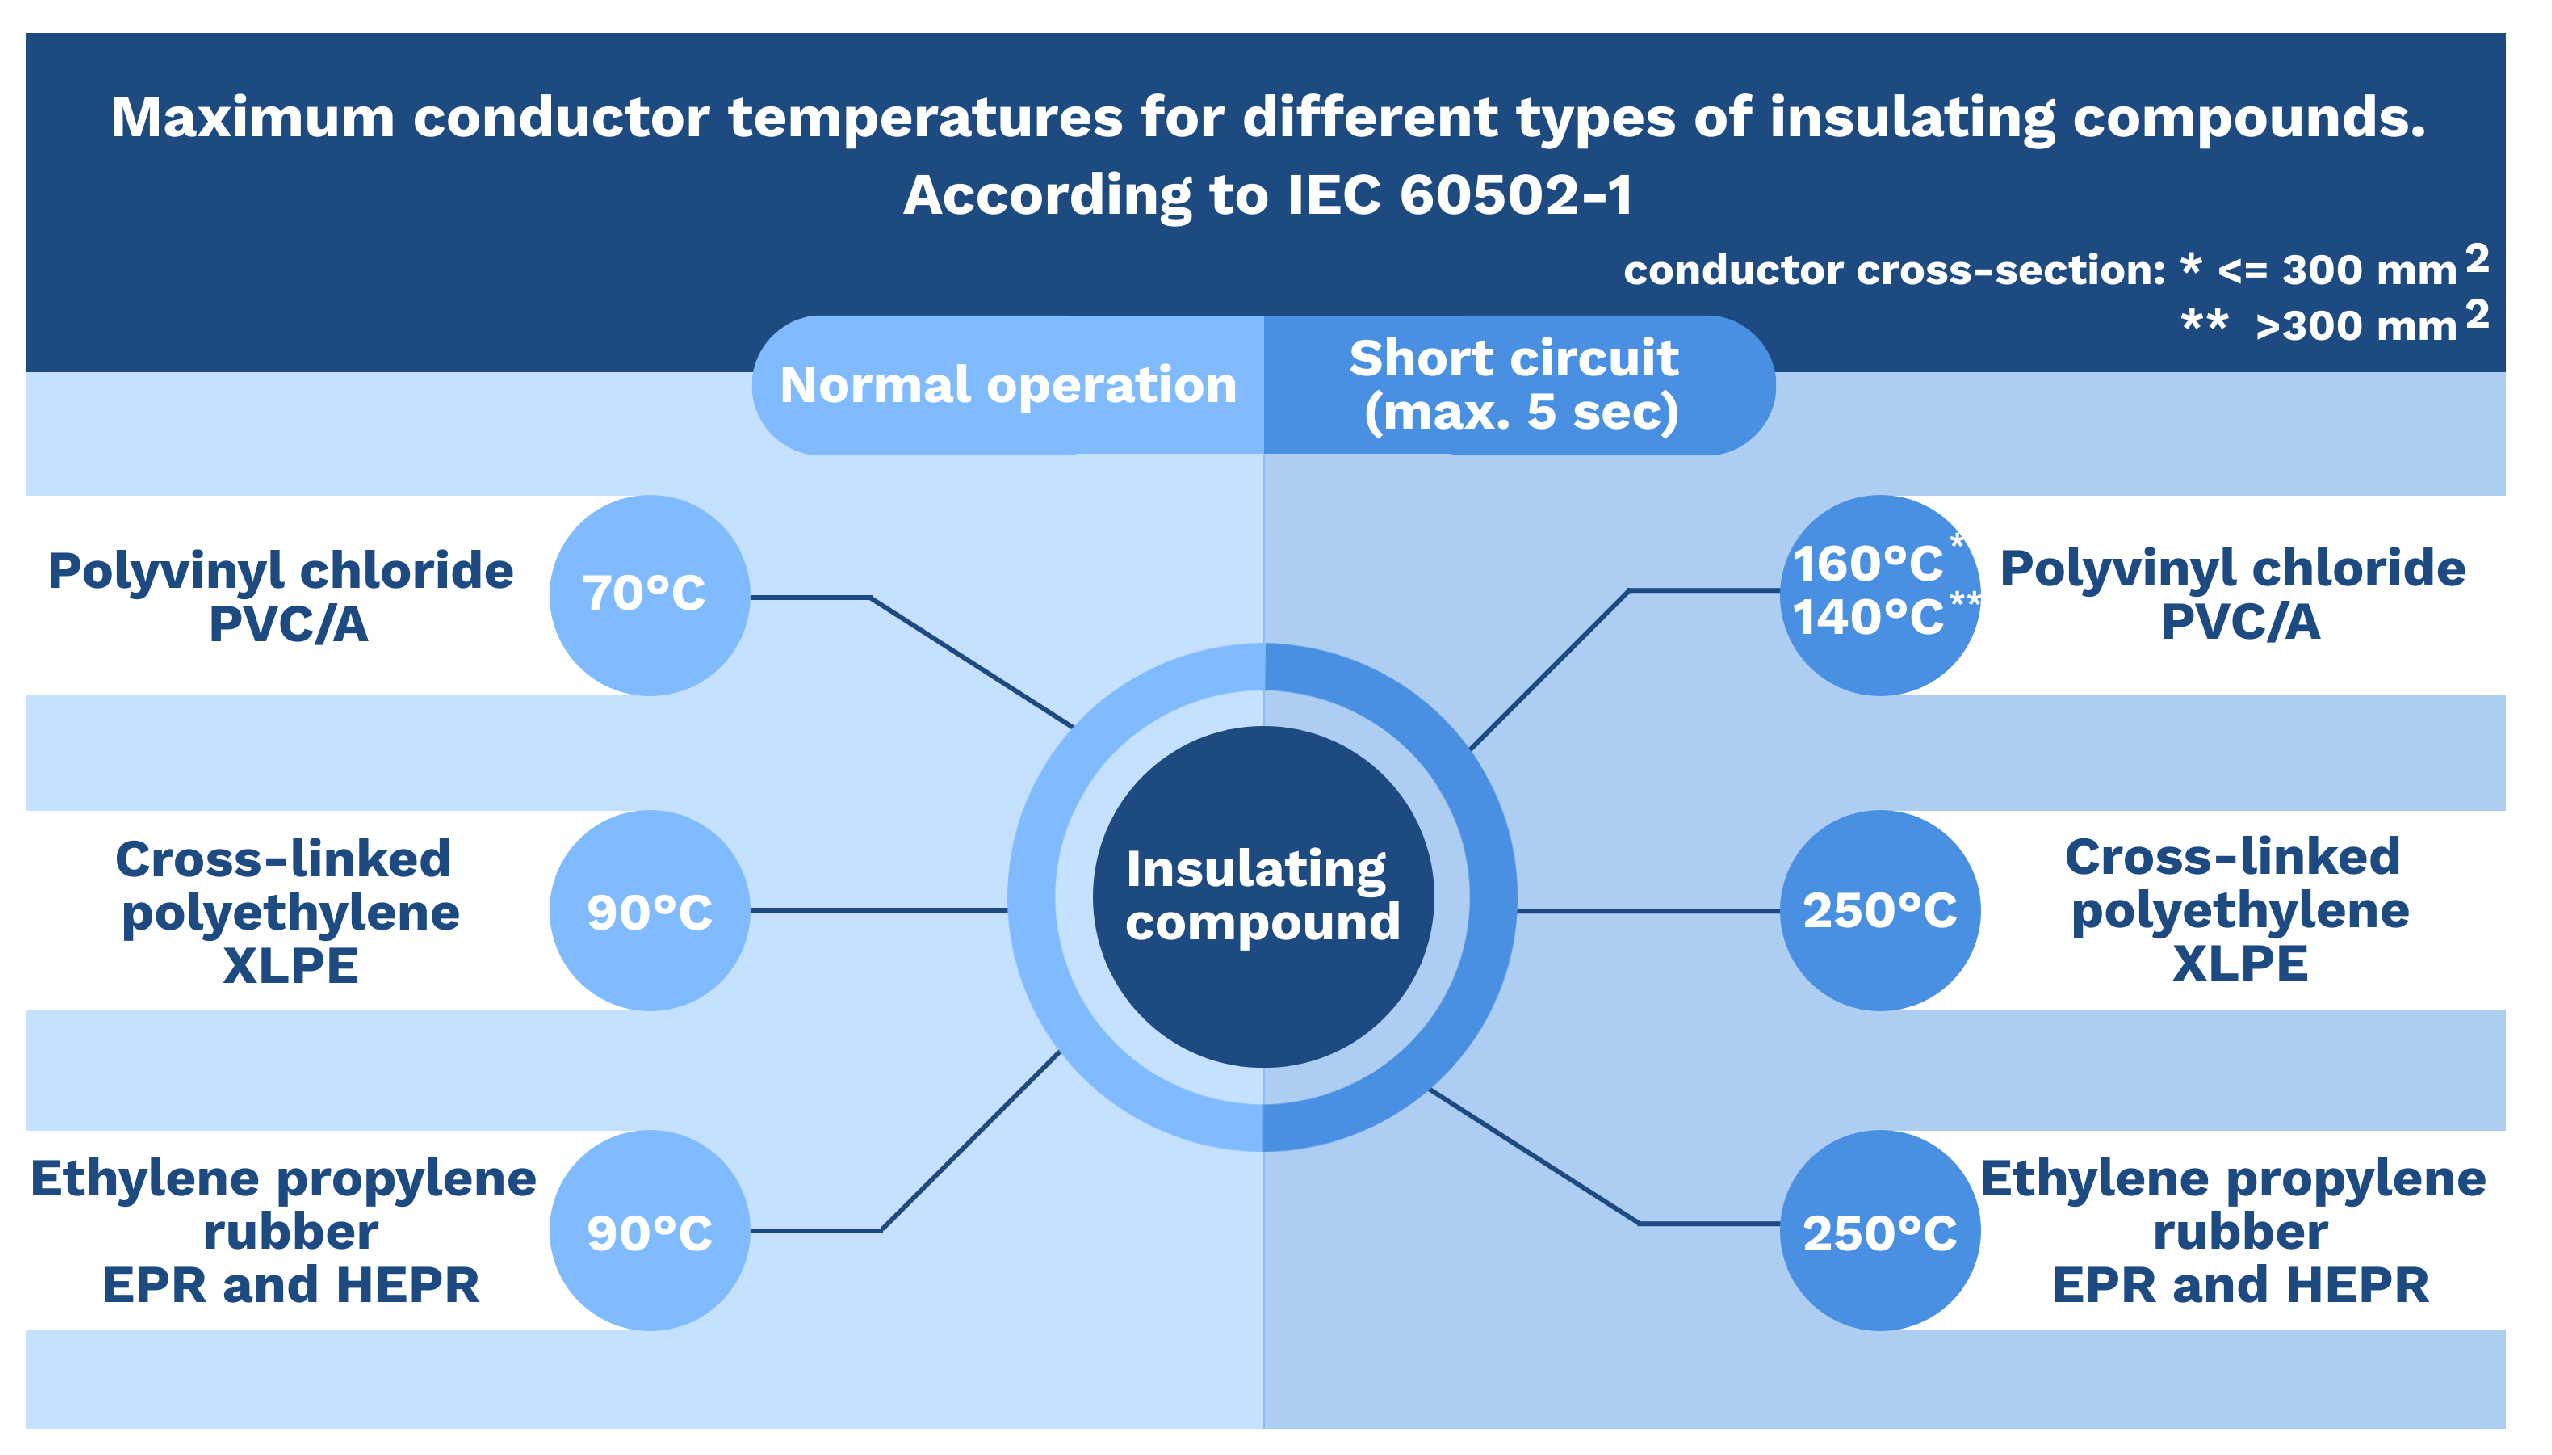
Section 1, the cable temperature may rise for a short-time due to overload, short circuit operation, daily periodic generations. Especially in the summer, the generation rate of photovoltaics is high at noon. Therefore, short-term cyclic thermal aging was used in this study. The cable samples were placed inside the temperature-controlled oven for three rounds (each of 6 hours). According to IEC 60502-1, thermal ageing shall be carried out at least 10
C more than the maximum conductor temperature, which is 70
C during normal operation, and 160
C during short-circuit operation [
32]. Respective information can be seen in
Figure 6.
The temperature for thermal aging was set to 110
C. This temperature was chosen for easier comparison with the previous studies, and it was intended to use a temperature higher than specified in the standard [
13,
18,
19,
25,
34,
35]. Eighteen hours of aging have been reached. It can be calculated by using the Arrhenius equation that this aging time would be equal to 330 hours of service time at 70
C.
3.3. Dielectric Response Measurement
The dielectric parameters in the time and frequency domains were measured by Dirana Dielectric Response Analyzer, manufactured by Omicron Electronics Gmbh, Klaus, Austria. This equipment combines frequency-domain spectroscopy (FDS) and polarization-depolarization current (PDC) techniques to measure the dielectric response. The FDS method is applied at higher frequencies above 0.1 Hz. Time-domain PDC data are captured to measure the dielectric response in the lower frequency band. The collected PDC data are then transformed to the frequency domain using Fourier transformation [
31,
36,
37,
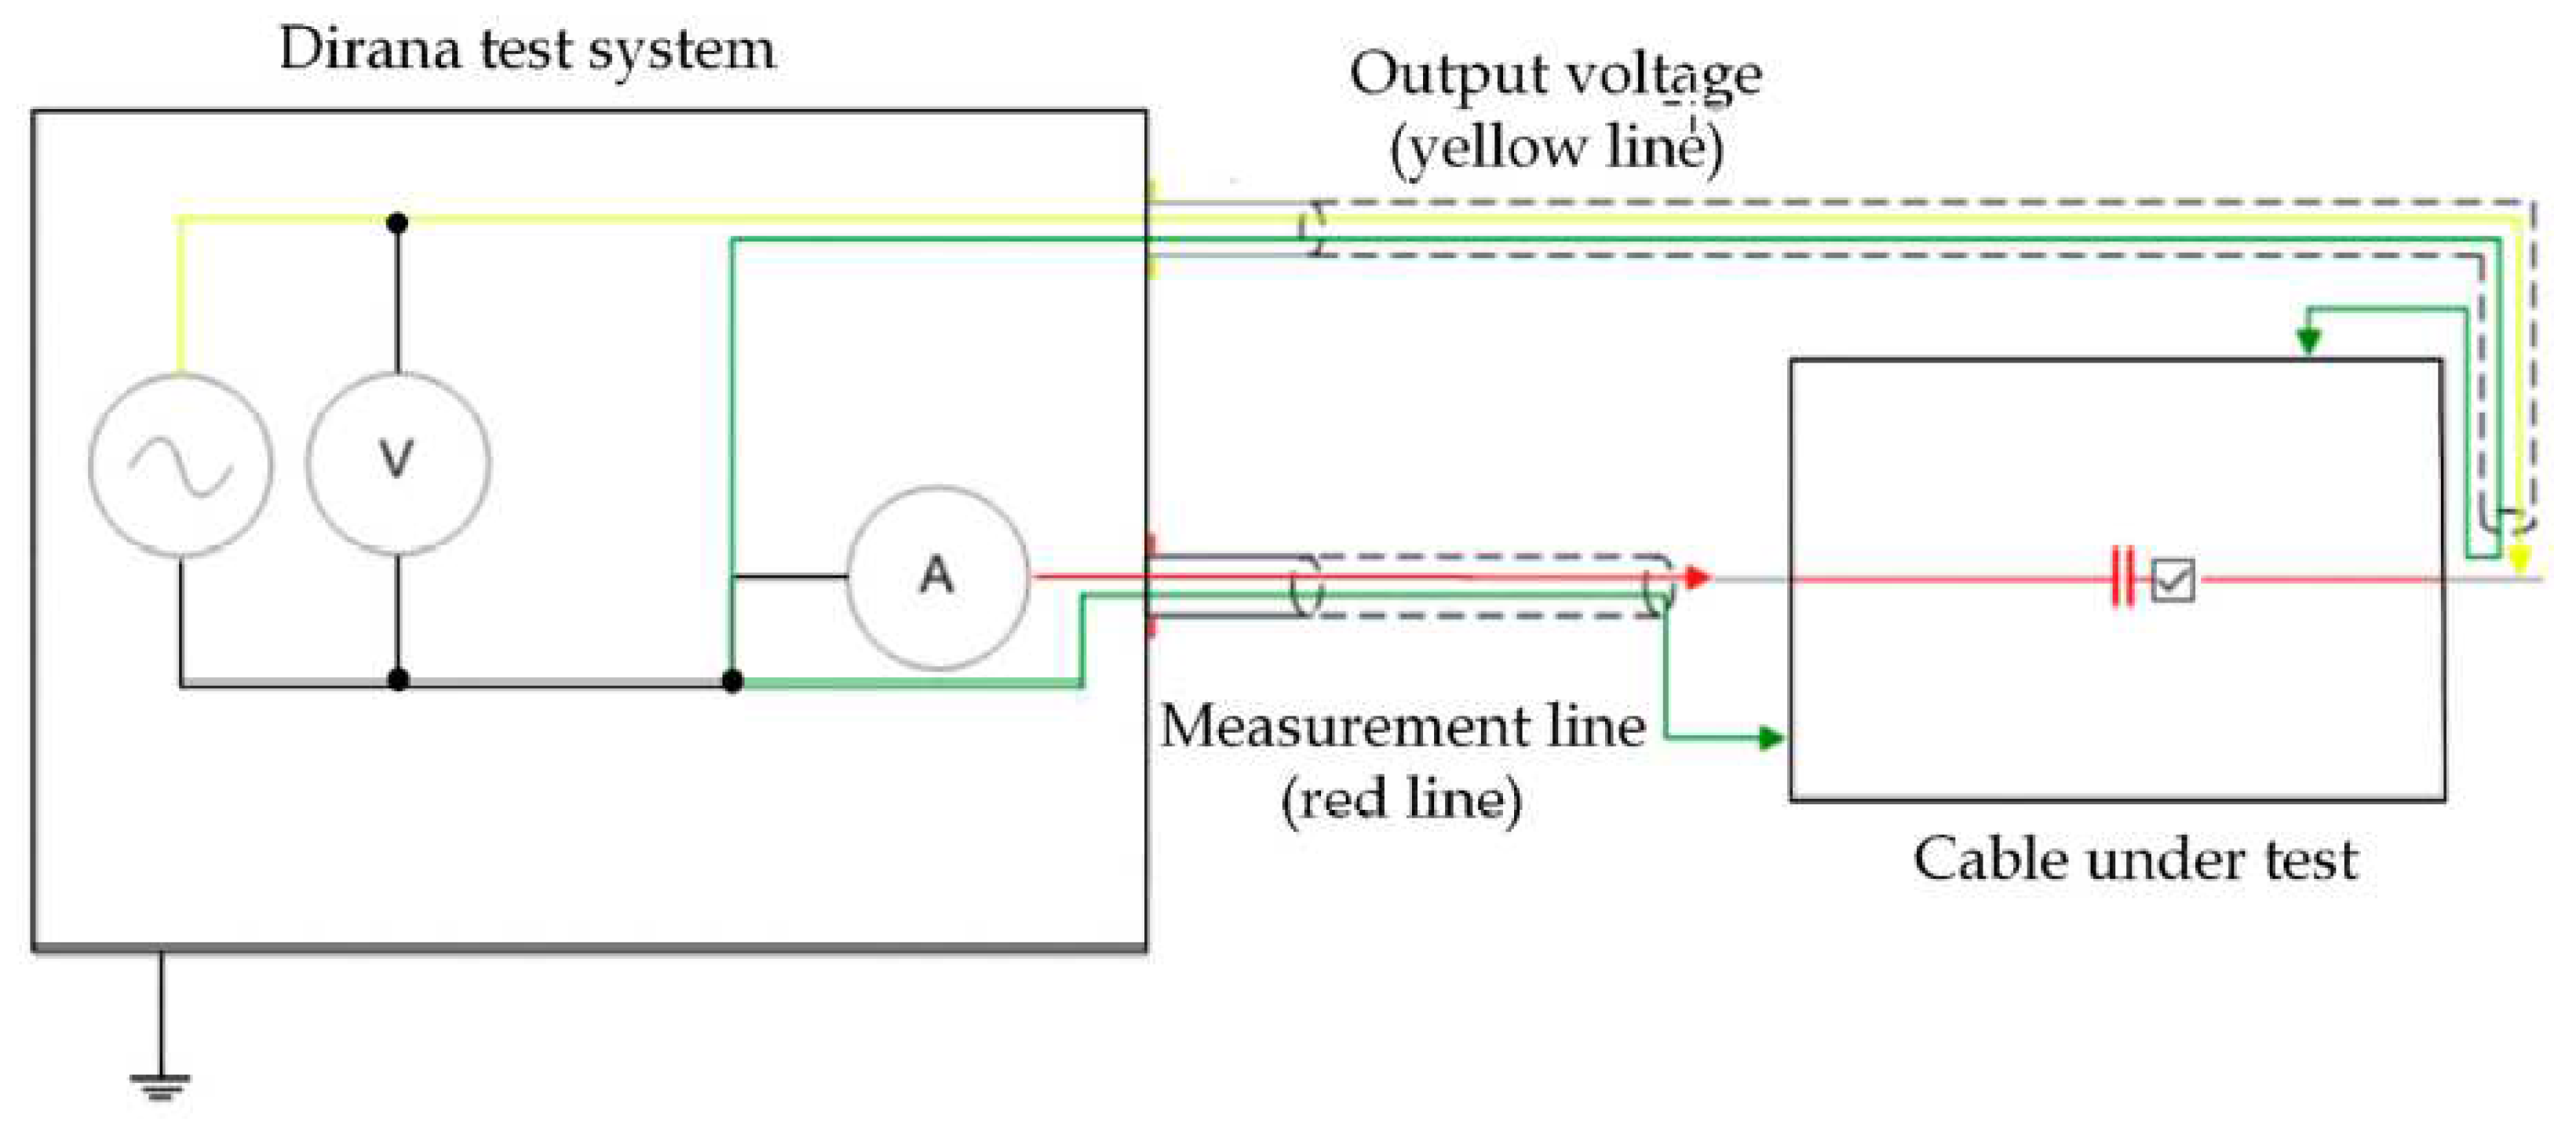
38]. The measurement setup can be seen in
Figure 7. General dielectric measurement configuration was chosen from the Dirana library. The frequency range has been given so that interfacial polarization is investigated [
39]. The cable samples were placed inside the Faraday cage to avoid external electromagnetic disturbances. The measurement setup is depicted in
Figure 8.
The measurement parameters were set as:
Configuration: General dielectric.
Test voltage: 100 V.
Frequency range: 300 Hz–5 kHz.
Charging time: 3333 s.
Discharging time: 1000 s.
3.4. Shore D Hardness Measurement
The hardness was measured on the cable’s belt layer only since the diameter of the cores was too small, and the thickness of the insulation was lower than the maximum penetration depth of the Shore D hardness technique. The ASTMD2240-05 [
40] standard prescribes a 6 mm minimal material thickness for Shore D hardness measurement. The PVC belt thickness is 0.2 mm, and a double layer is used for cable belting. Since the double-layer PVC belt thickness is only 0.4 mm, the PVC belt was folded three times resulting 3.2 mm thickness for the measurements. More folding of the samples was not possible because each folding halved the sample area, and on a smaller surface area, the test could not be repeated as many times to give a sufficiently small uncertainty in the measurement. In this manner, the Shore D hardness does not provide standardized results, but it can be applied to compare the hardness of the samples with reasonable accuracy. The applied equipment was a Bareiss HPE II Shore D durometer (Bareiss Prüfgerätebau GmbH, Oberdischingen, Germany). The hardness was measured 12 times on each sample in randomly selected points. The average and standard deviation of the results were calculated from 10 measurement values dropping the highest and the lowest values.
4. Results and Discussions
The dielectric parameters were measured after each round of aging. Tan and capacitance values were registered and presented in a log-log chart.
4.1. Effect on Tan and Capacitance
All measurement results are presented in
Appendix A. In this section, the results included in the detailed analysis are shown only.
4.1.1. Before Aging
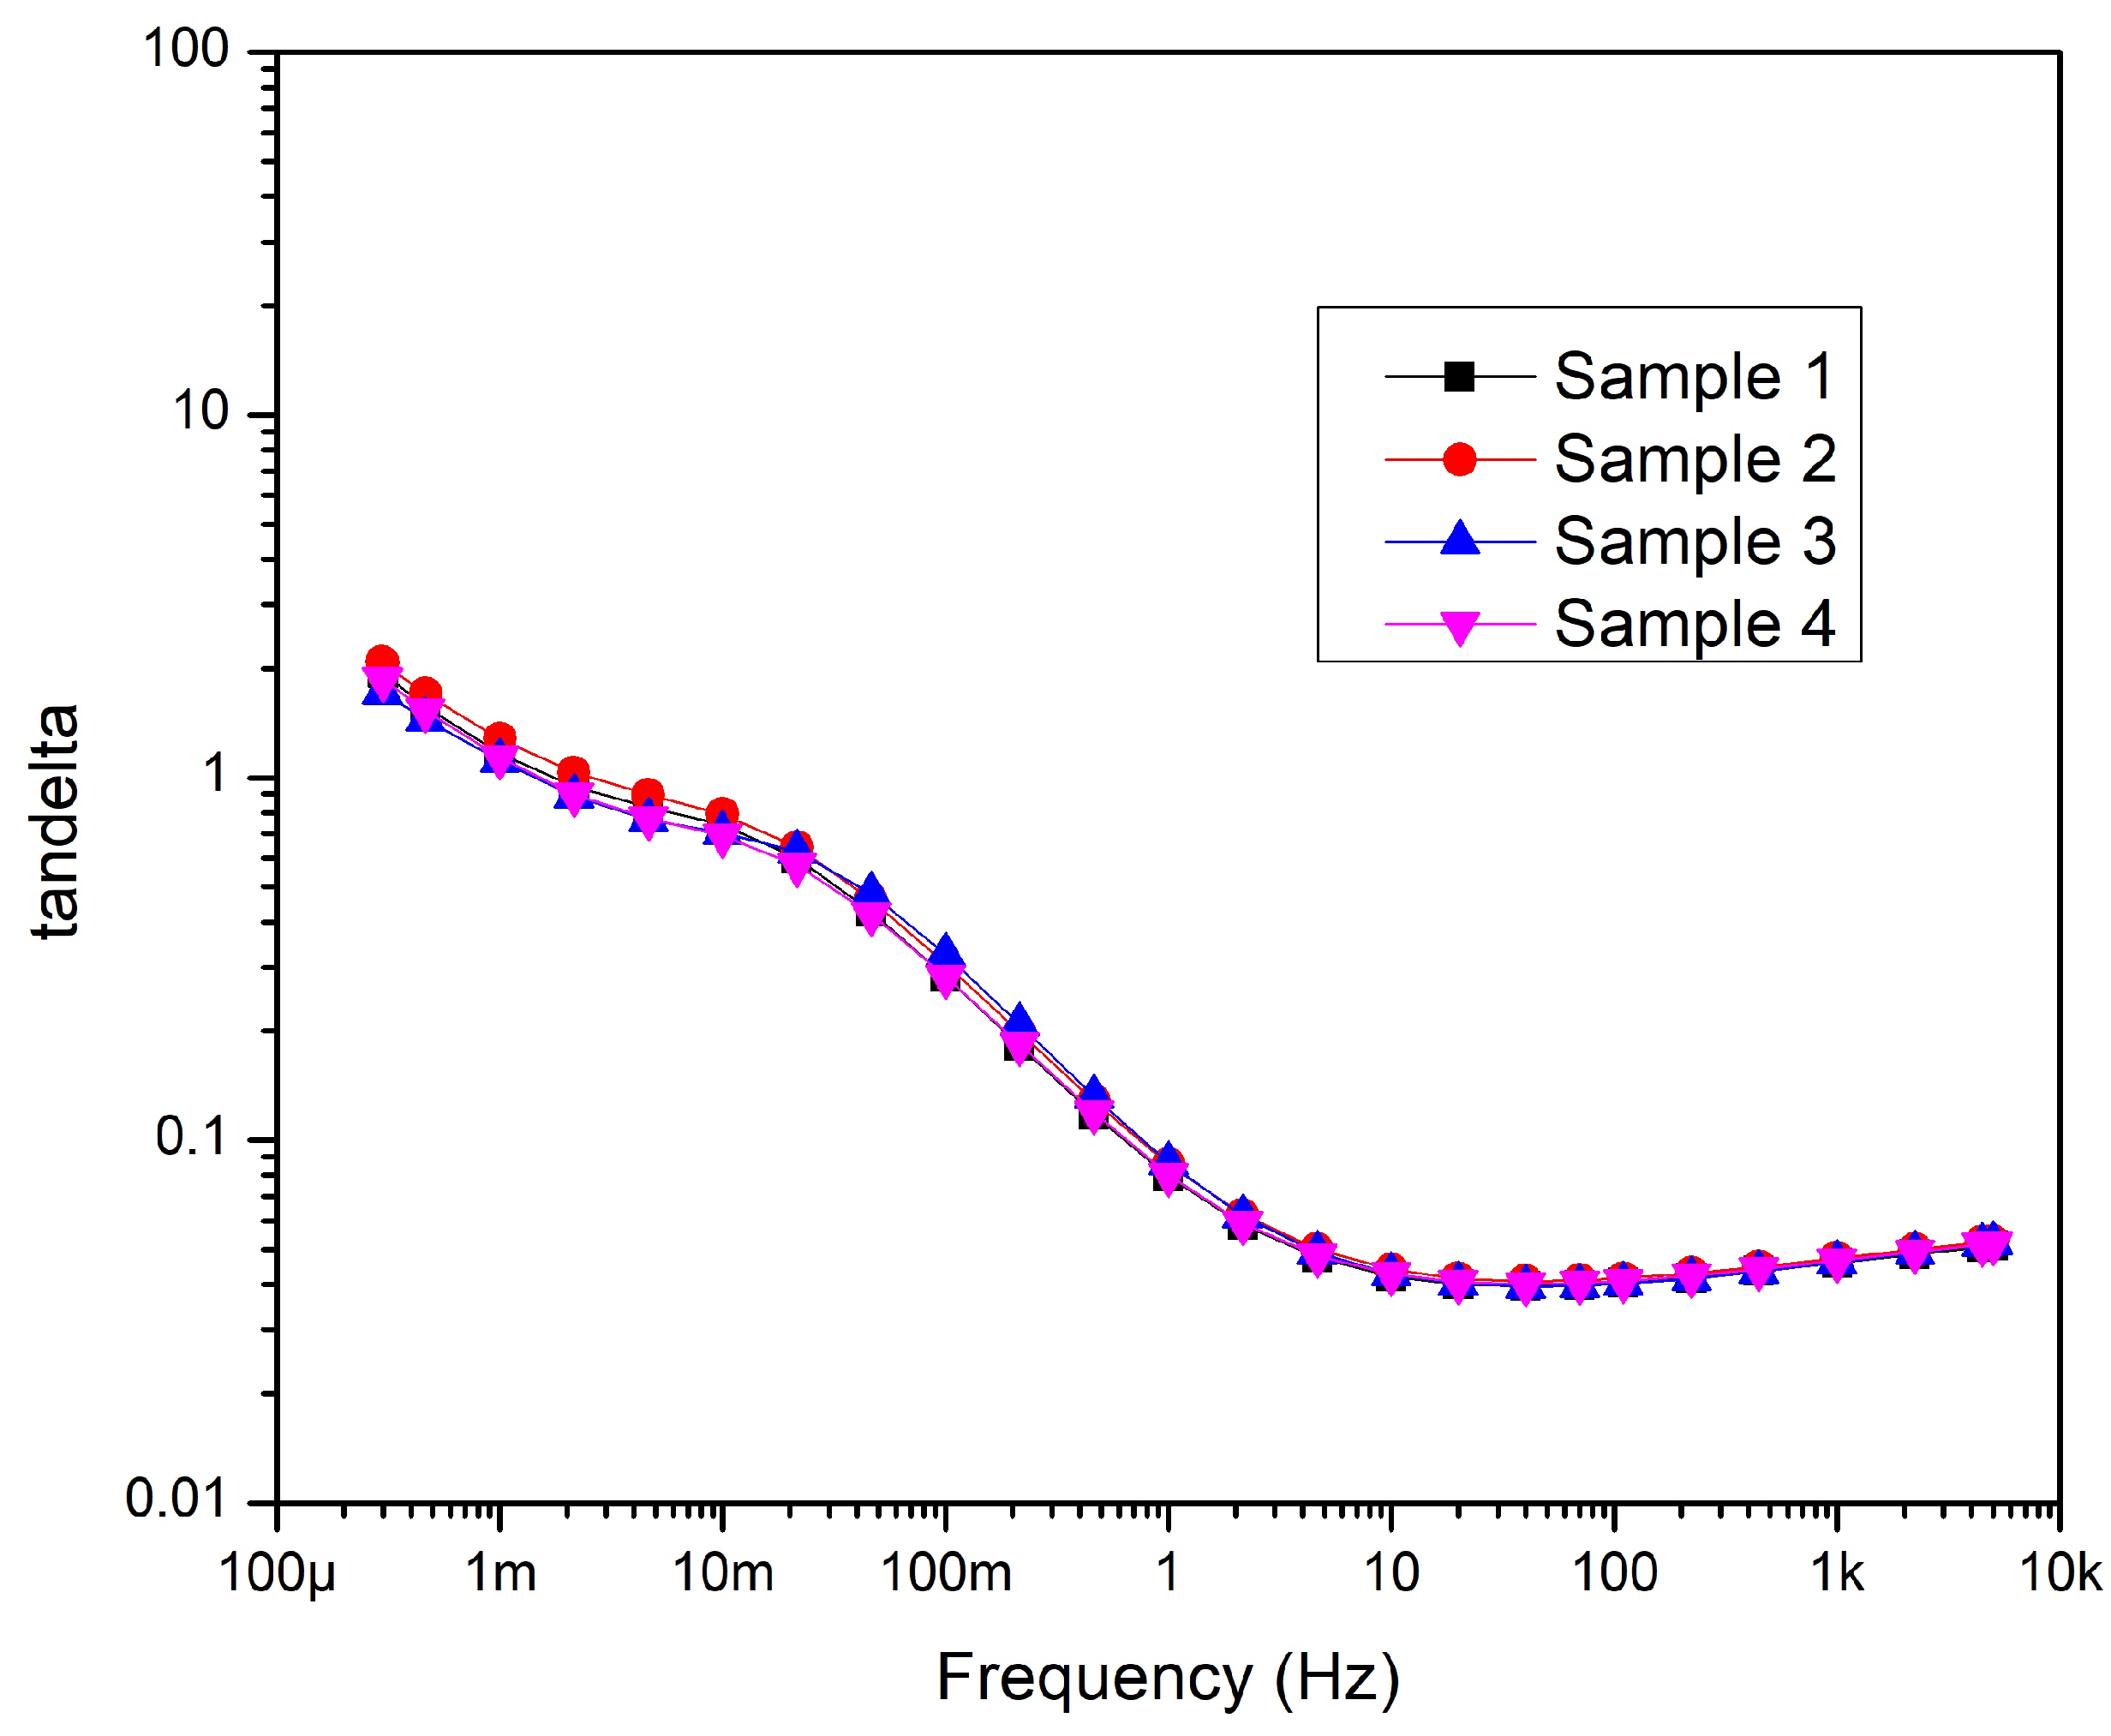
The homogeneity of cable samples was checked by measuring them while unaged and intact.
Figure 9. shows that there is no significant difference between the samples. Therefore, it can be considered that the samples are homogeneous. Hence the different aging behavior of the samples can be caused by only the various structures of the samples. The typical trend of the tan
with frequency is that it goes down until it reaches the minimum point, from where it goes up till 5 kHz.
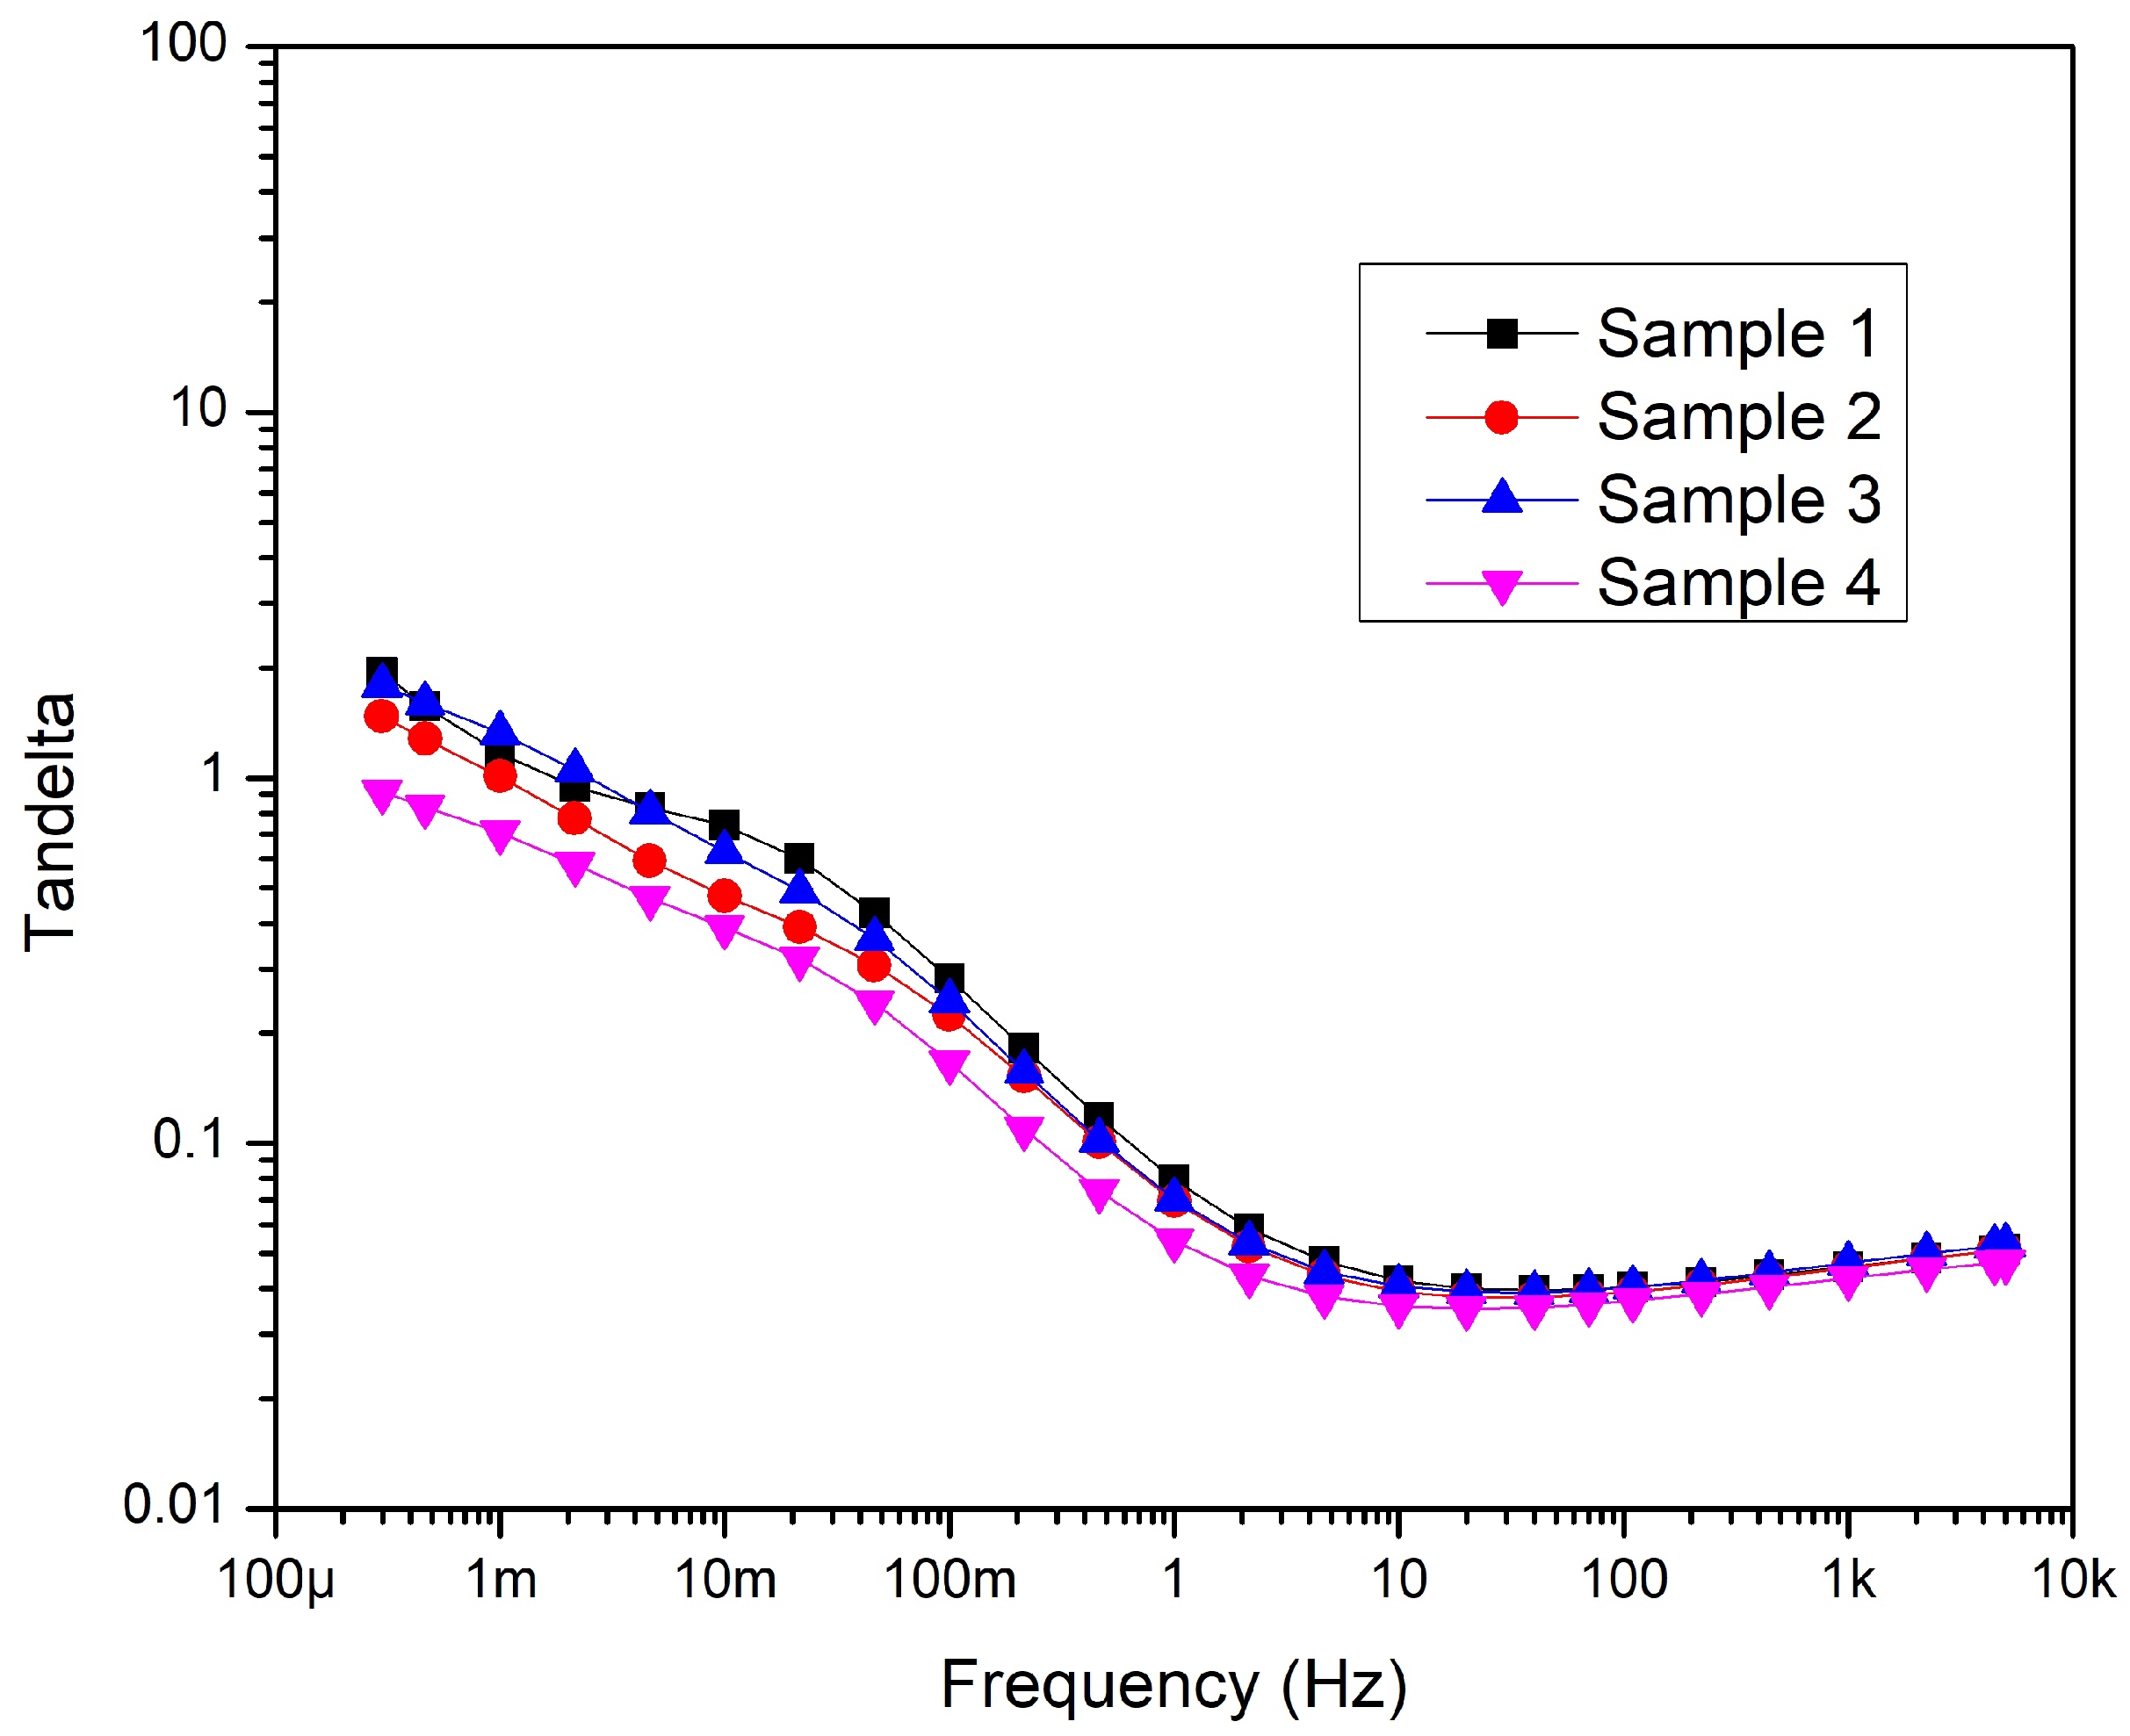
Table 1 shows that Sample 1 is the only sample kept intact during the measurement. But the structure of other Samples 2,3 and 4 were changed before the thermal aging. Tan
was measured after the structural change. The results are plotted in
Figure 10. As shown before, the curves follow a similar trend over the frequency range, but removing the layers affects tan
. The cross-comparison shows that tan
of Sample 4 decreased significantly compared to Sample 1, the intact cable, while Samples 2 and 3 did not show drastic change. It is probably due to the distribution of electric field changes inside the cable because removing the layers decreases the compressing force on the cable structure, causing a minimal change in the cable geometry. Otherwise, recent studies have revealed the compressing force can cause an increase in dissipation factor significantly at the low-frequency range [
41,
42].
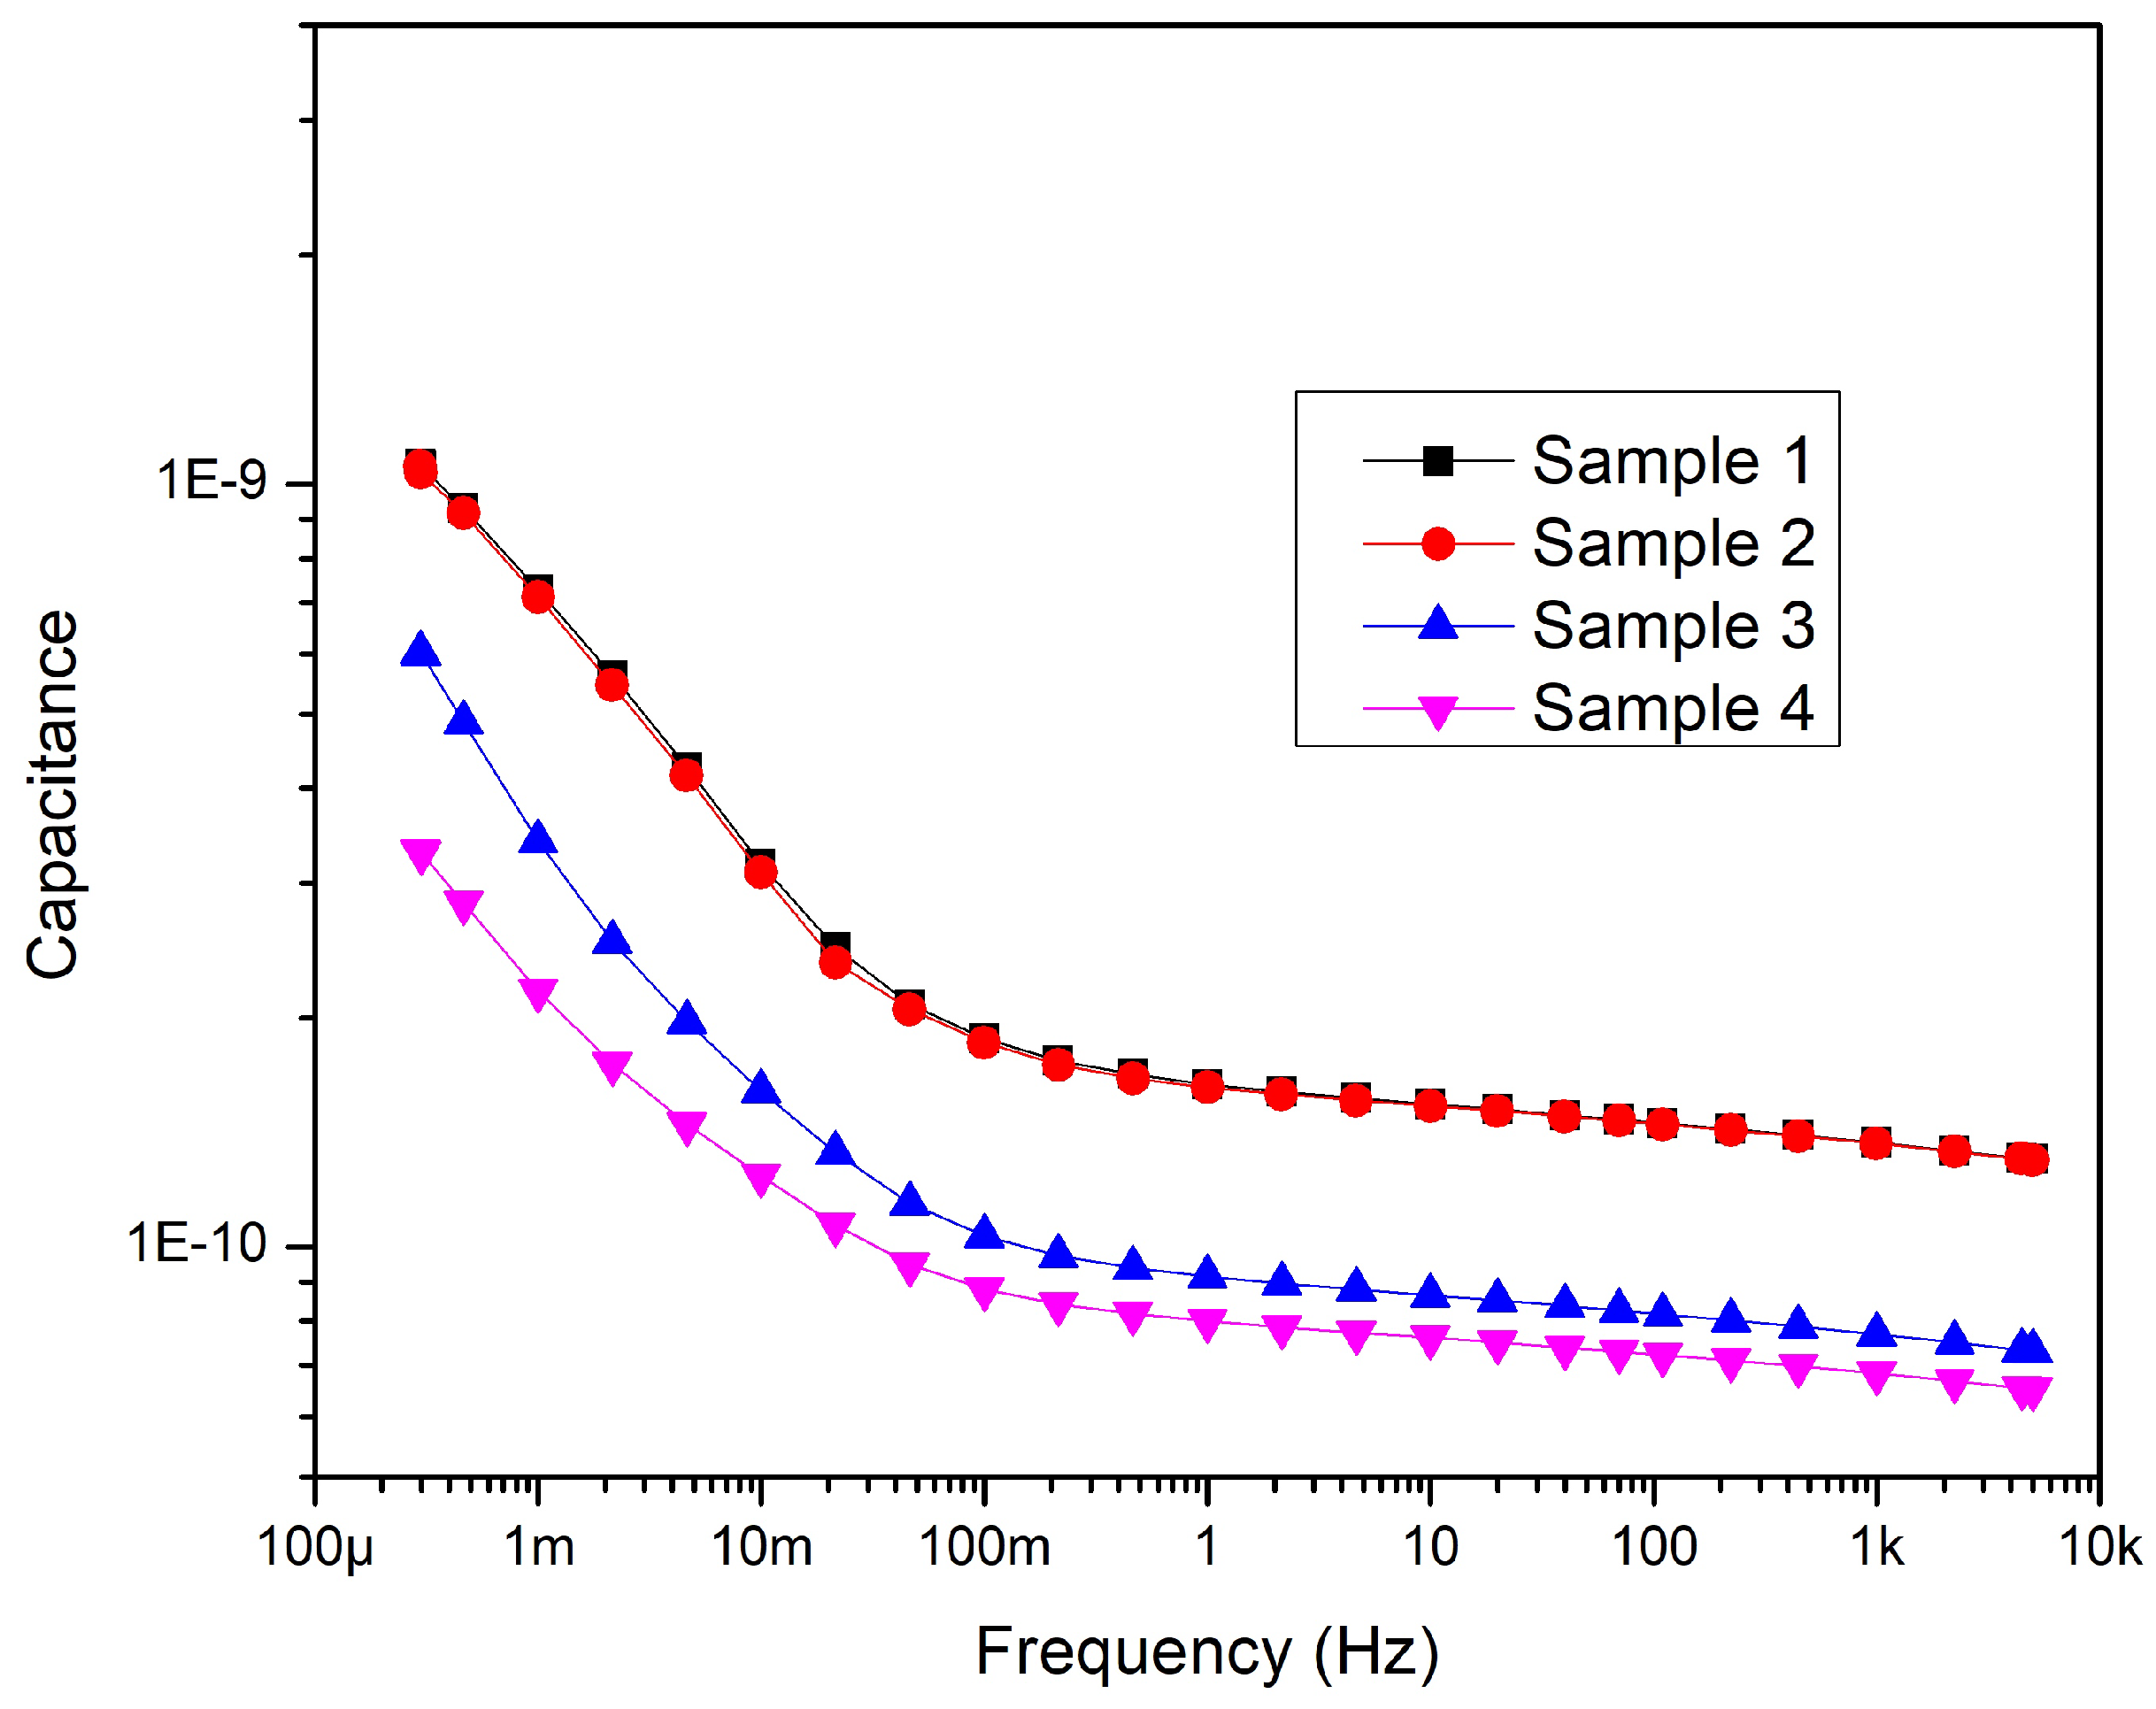
Figure 11 shows how the capacitance has changed by removing the layers. It is observed that removing the jacket did not show a considerable difference compared to the intact sample. However, the graph shows that the capacitance of Samples 3 and 4 has dropped. The reason is that removing the aluminum tape screen reduces the electrode surface, which results in decreased capacitance values. Interestingly, the capacitance change between Samples 3 and 4 is relatively big despite only the thin PVC belt being removed from the cores. Thus, this layer significantly affects the field strength distribution within the cable.
4.1.2. After Aging
The tan values measured after aging were compared with the results of the measurements before aging, and a cross-comparison was also executed between samples after aging.
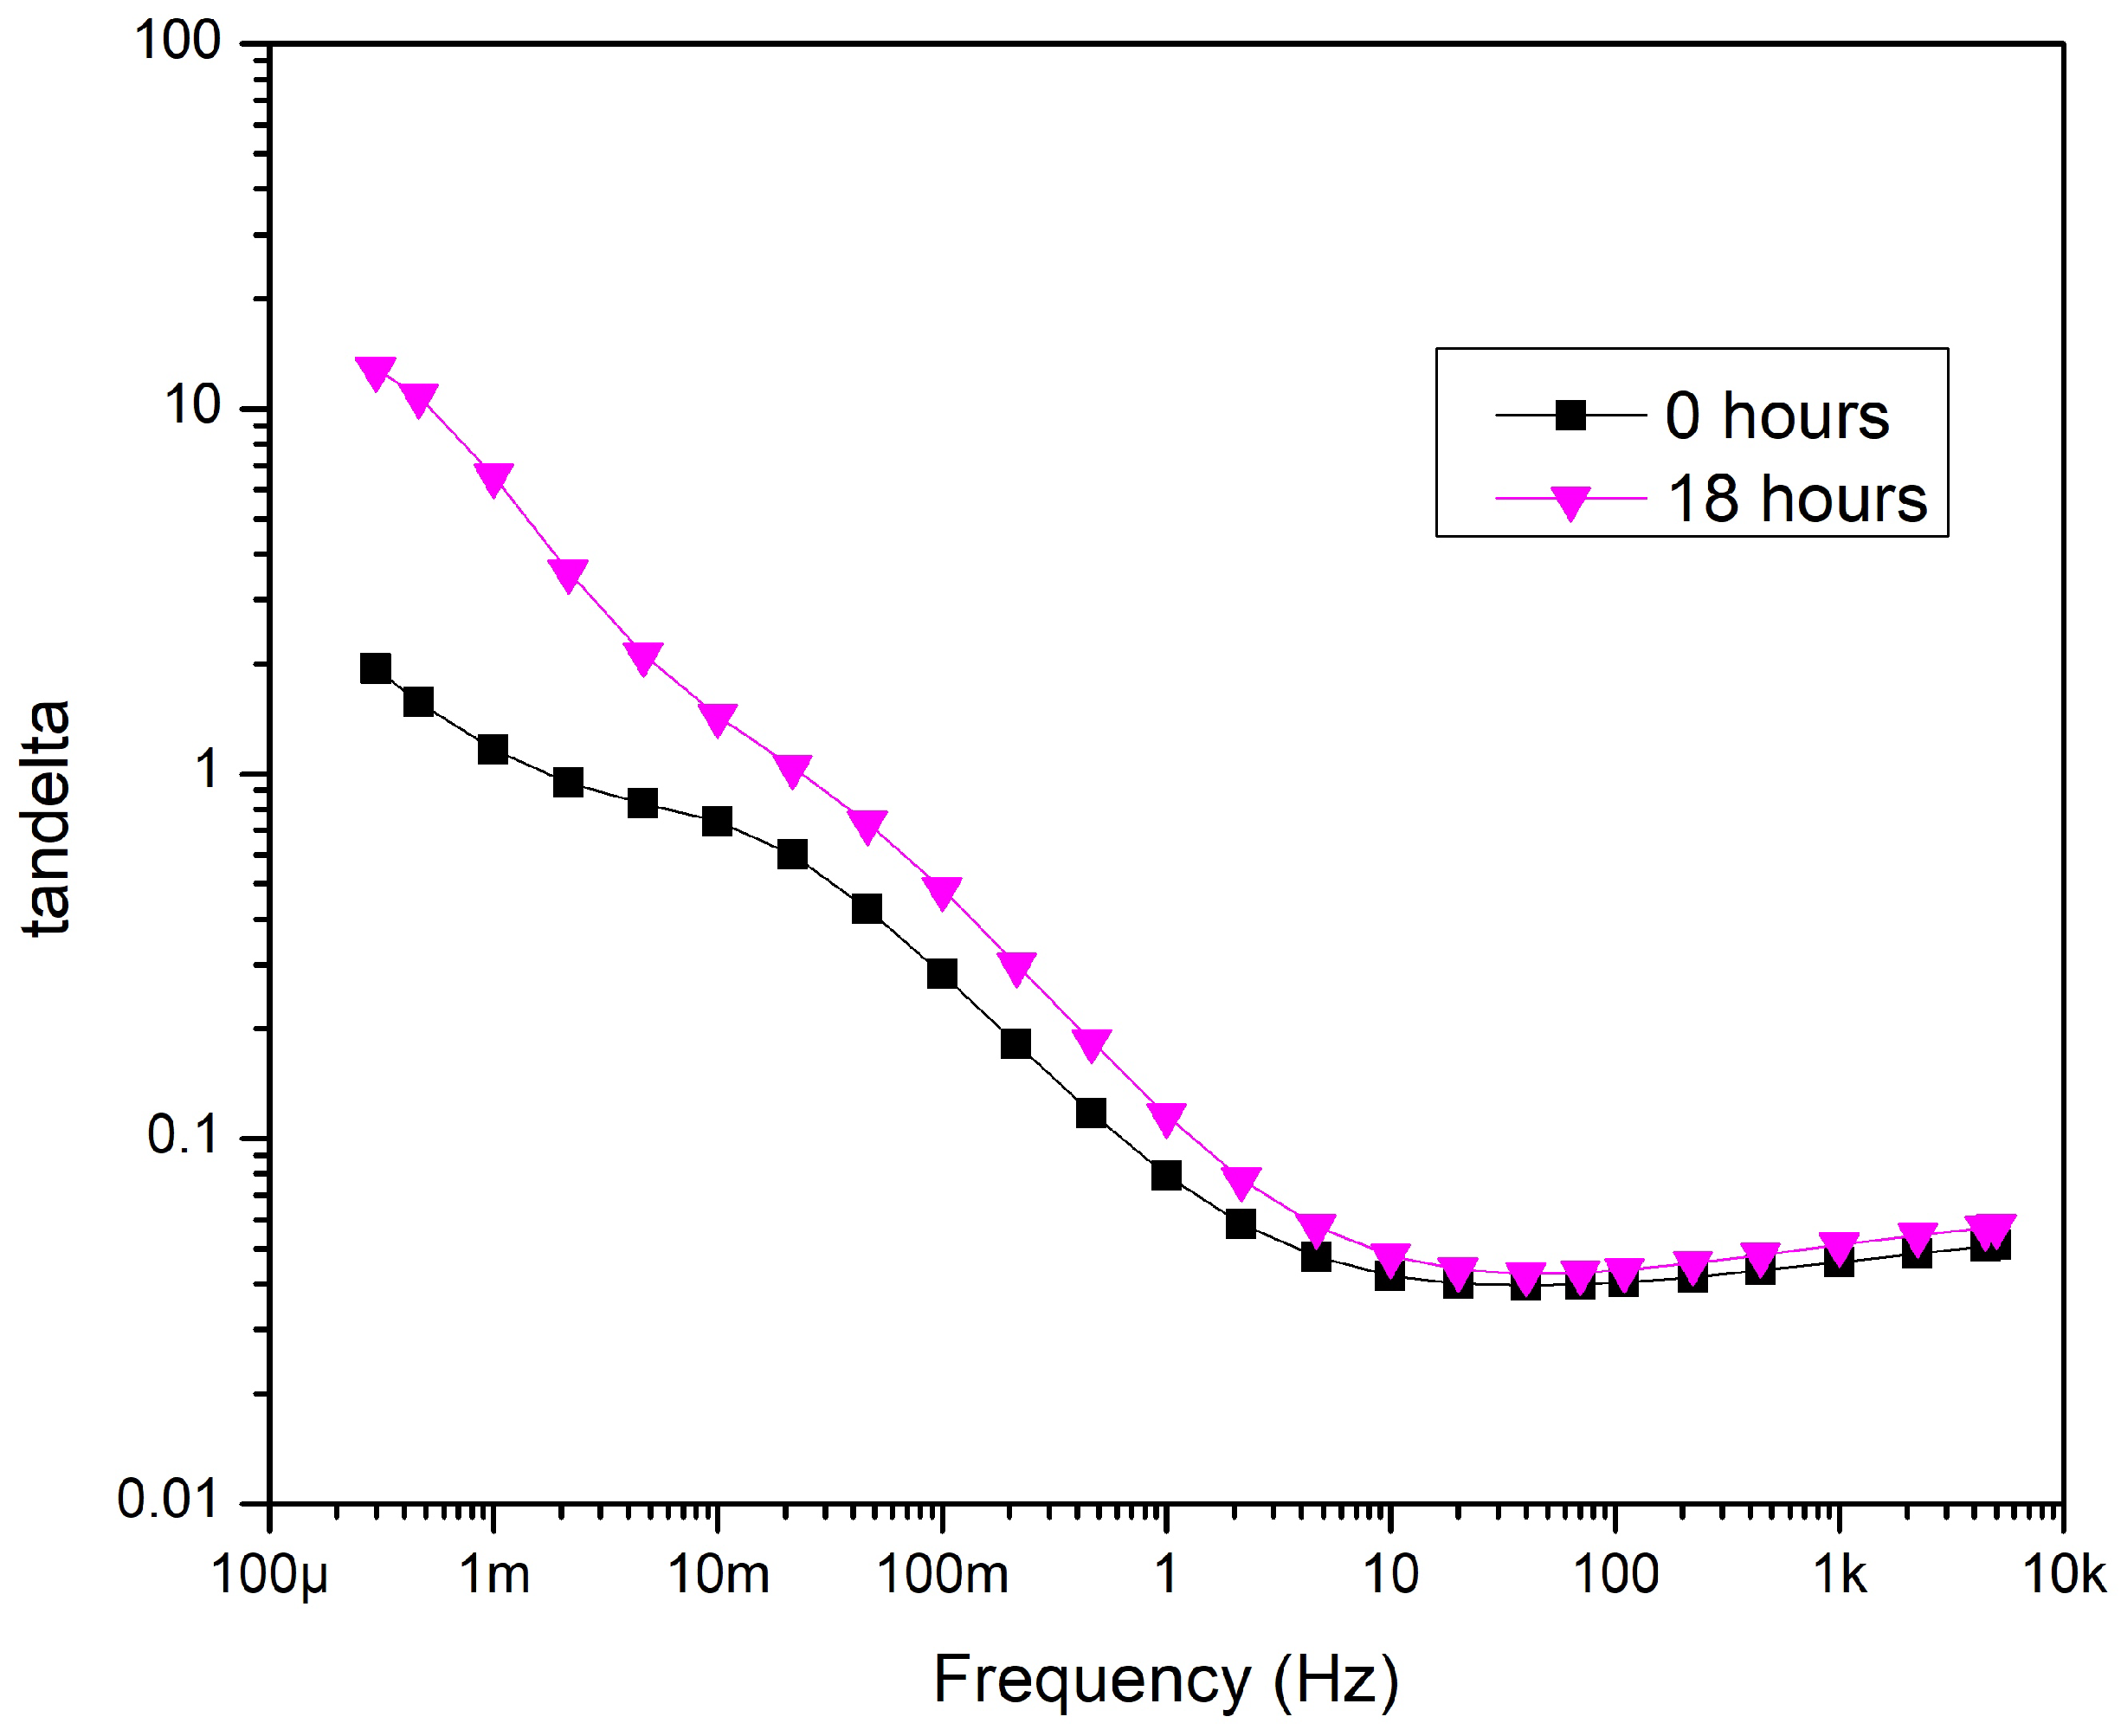
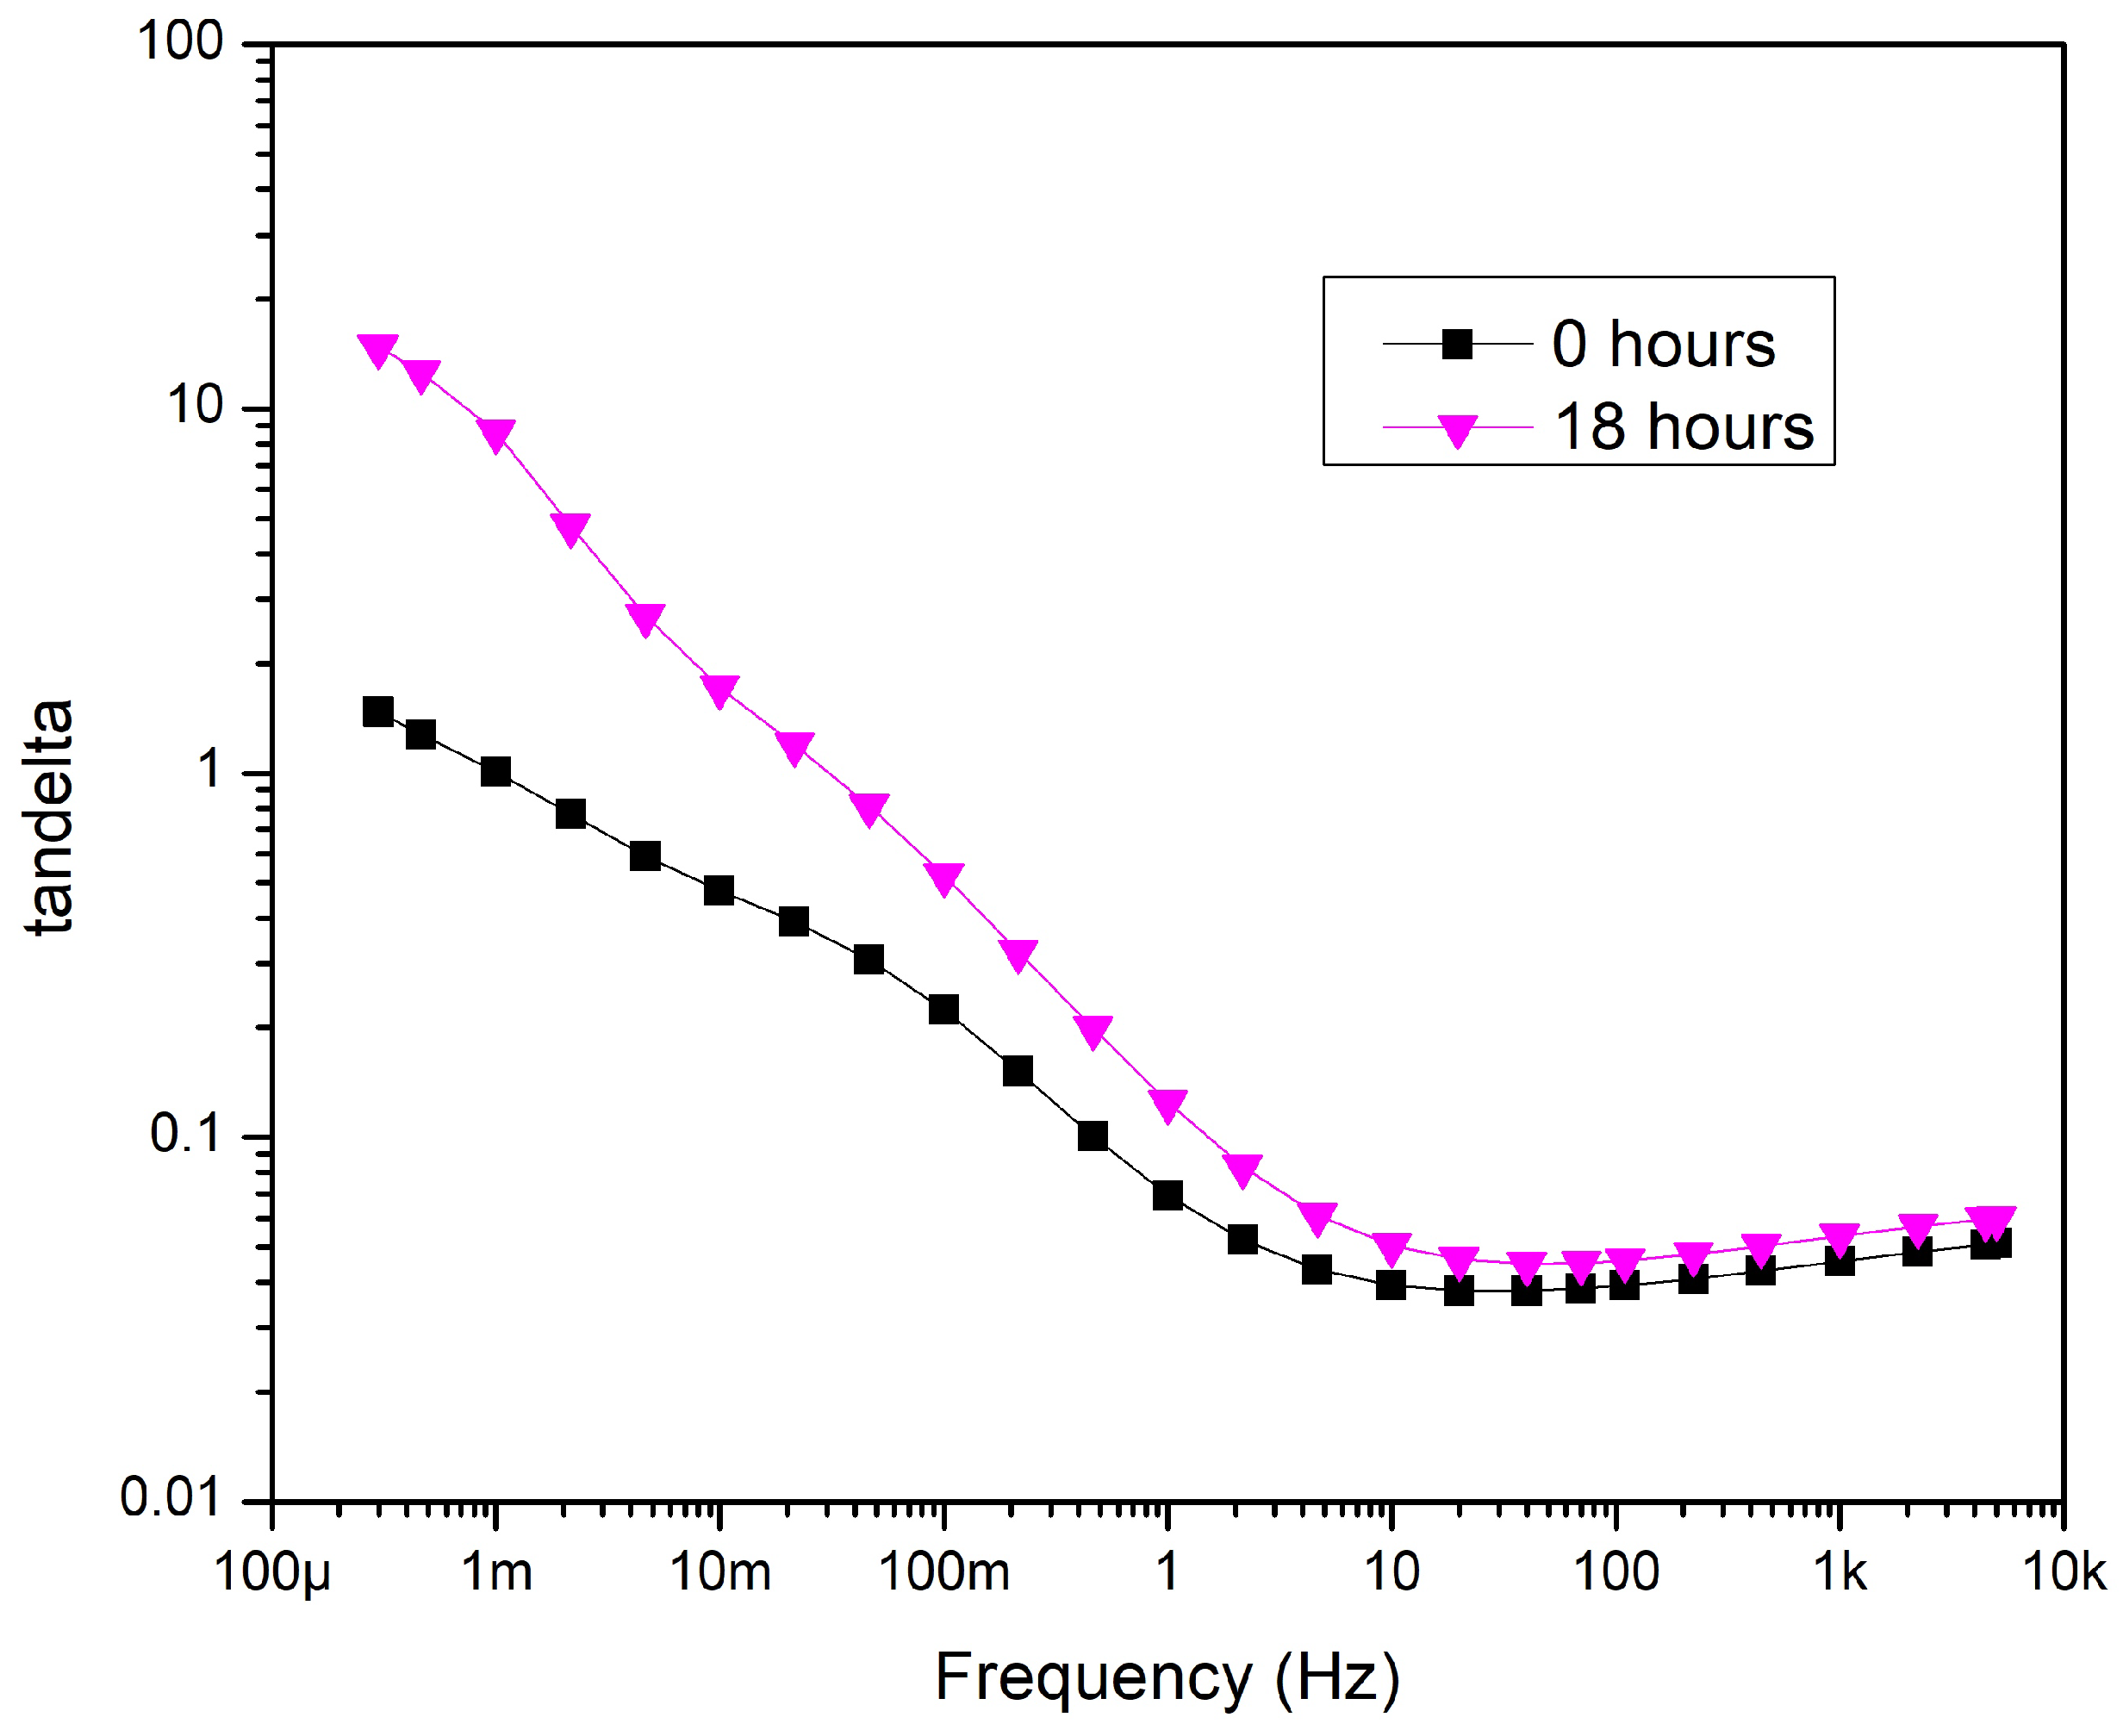
Sample 1. As mentioned above, Sample 1 is the intact cable. Therefore, it is expected to observe general aging behavior from Sample 1. In addition, Sample 1 can be used as a reference for the other three samples. The results of 18 hours of aging on tan
can be seen in
Figure 12. It can be seen that the tan
has increased, especially at low frequencies from 300
Hz to 10 Hz and the difference decreases with the increase in frequency. The increasing intensity of interfacial polarization can explain this behavior due to the higher conductivity after aging.
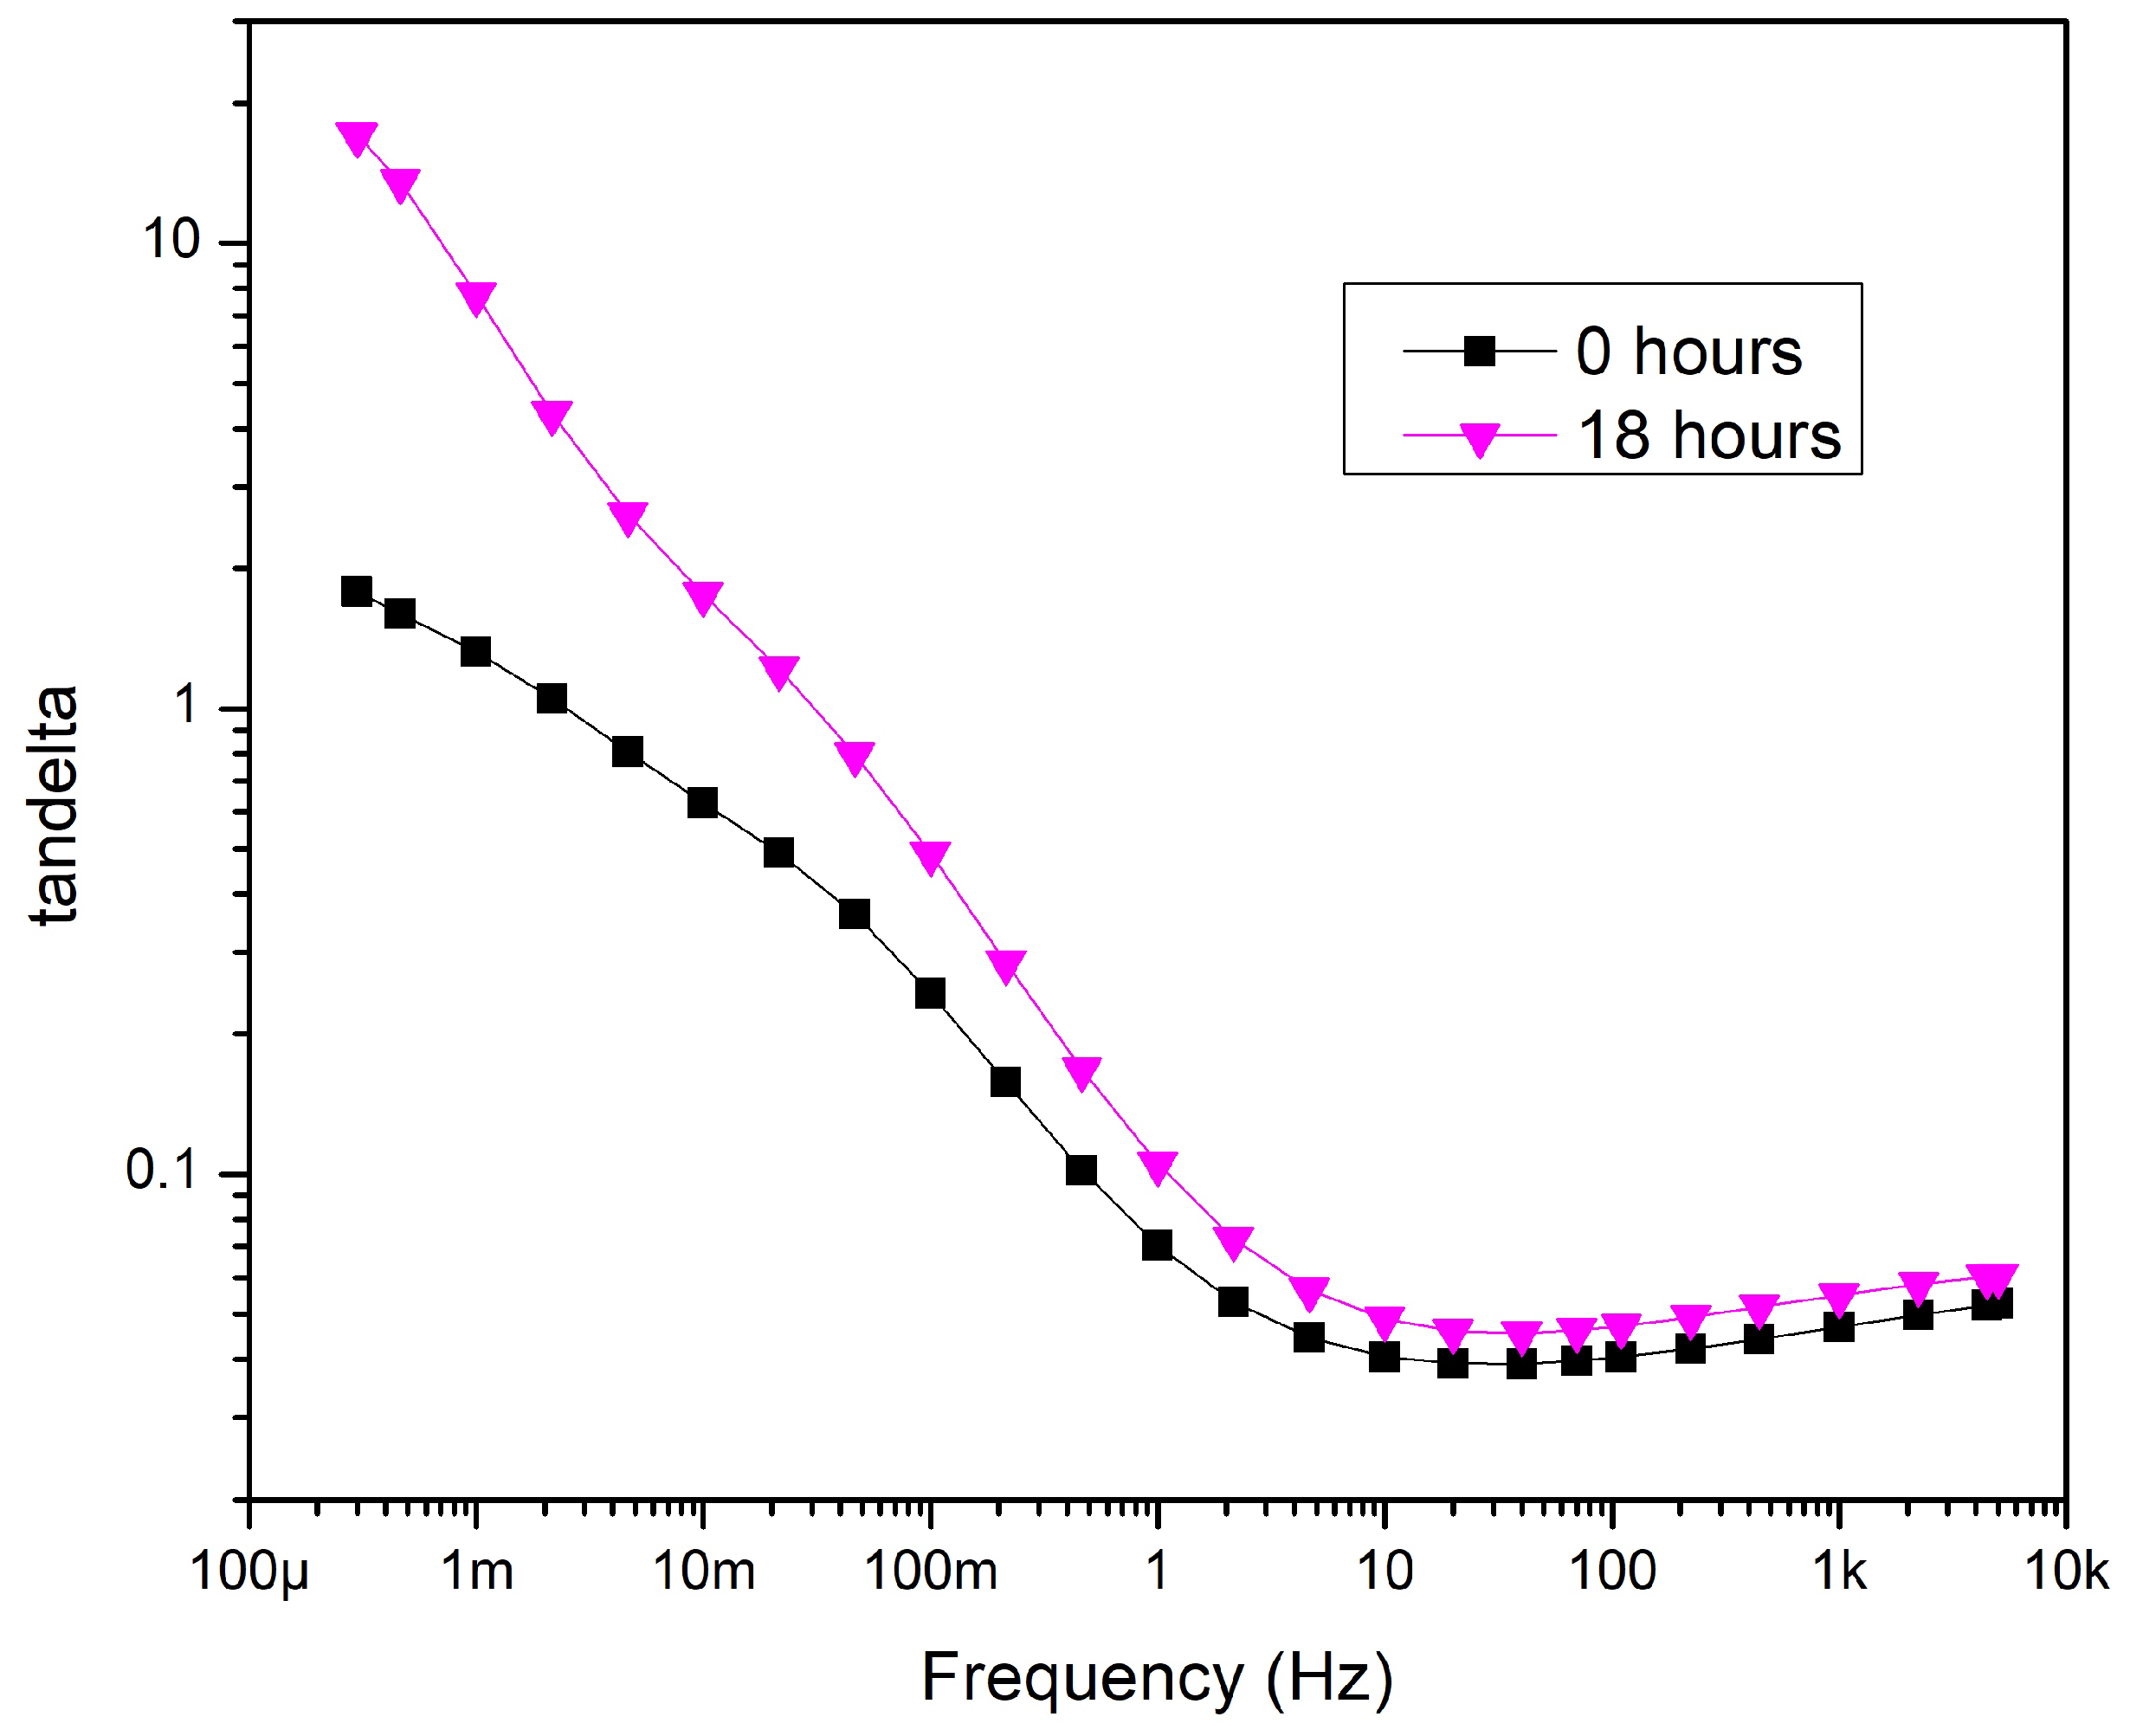
Sample 2. Comparing before and after aging (
Figure 13) points to a tendency similar to Sample 1. Tan
has increased after eighteen hours of thermal aging. It is also noted that the difference between the tan
values in the 10 mHz...100 mHz range is higher than that of Sample 1. This difference is due to the different values of the loss factor before aging (
Figure 10).
Sample 3. Sample 3 shows a similar result as sample 2. Tan
has increased at the end of eighteen hours of aging (
Figure 14). The results of the measurements suggest removing the aluminum tape screen does not significantly affect tan
.
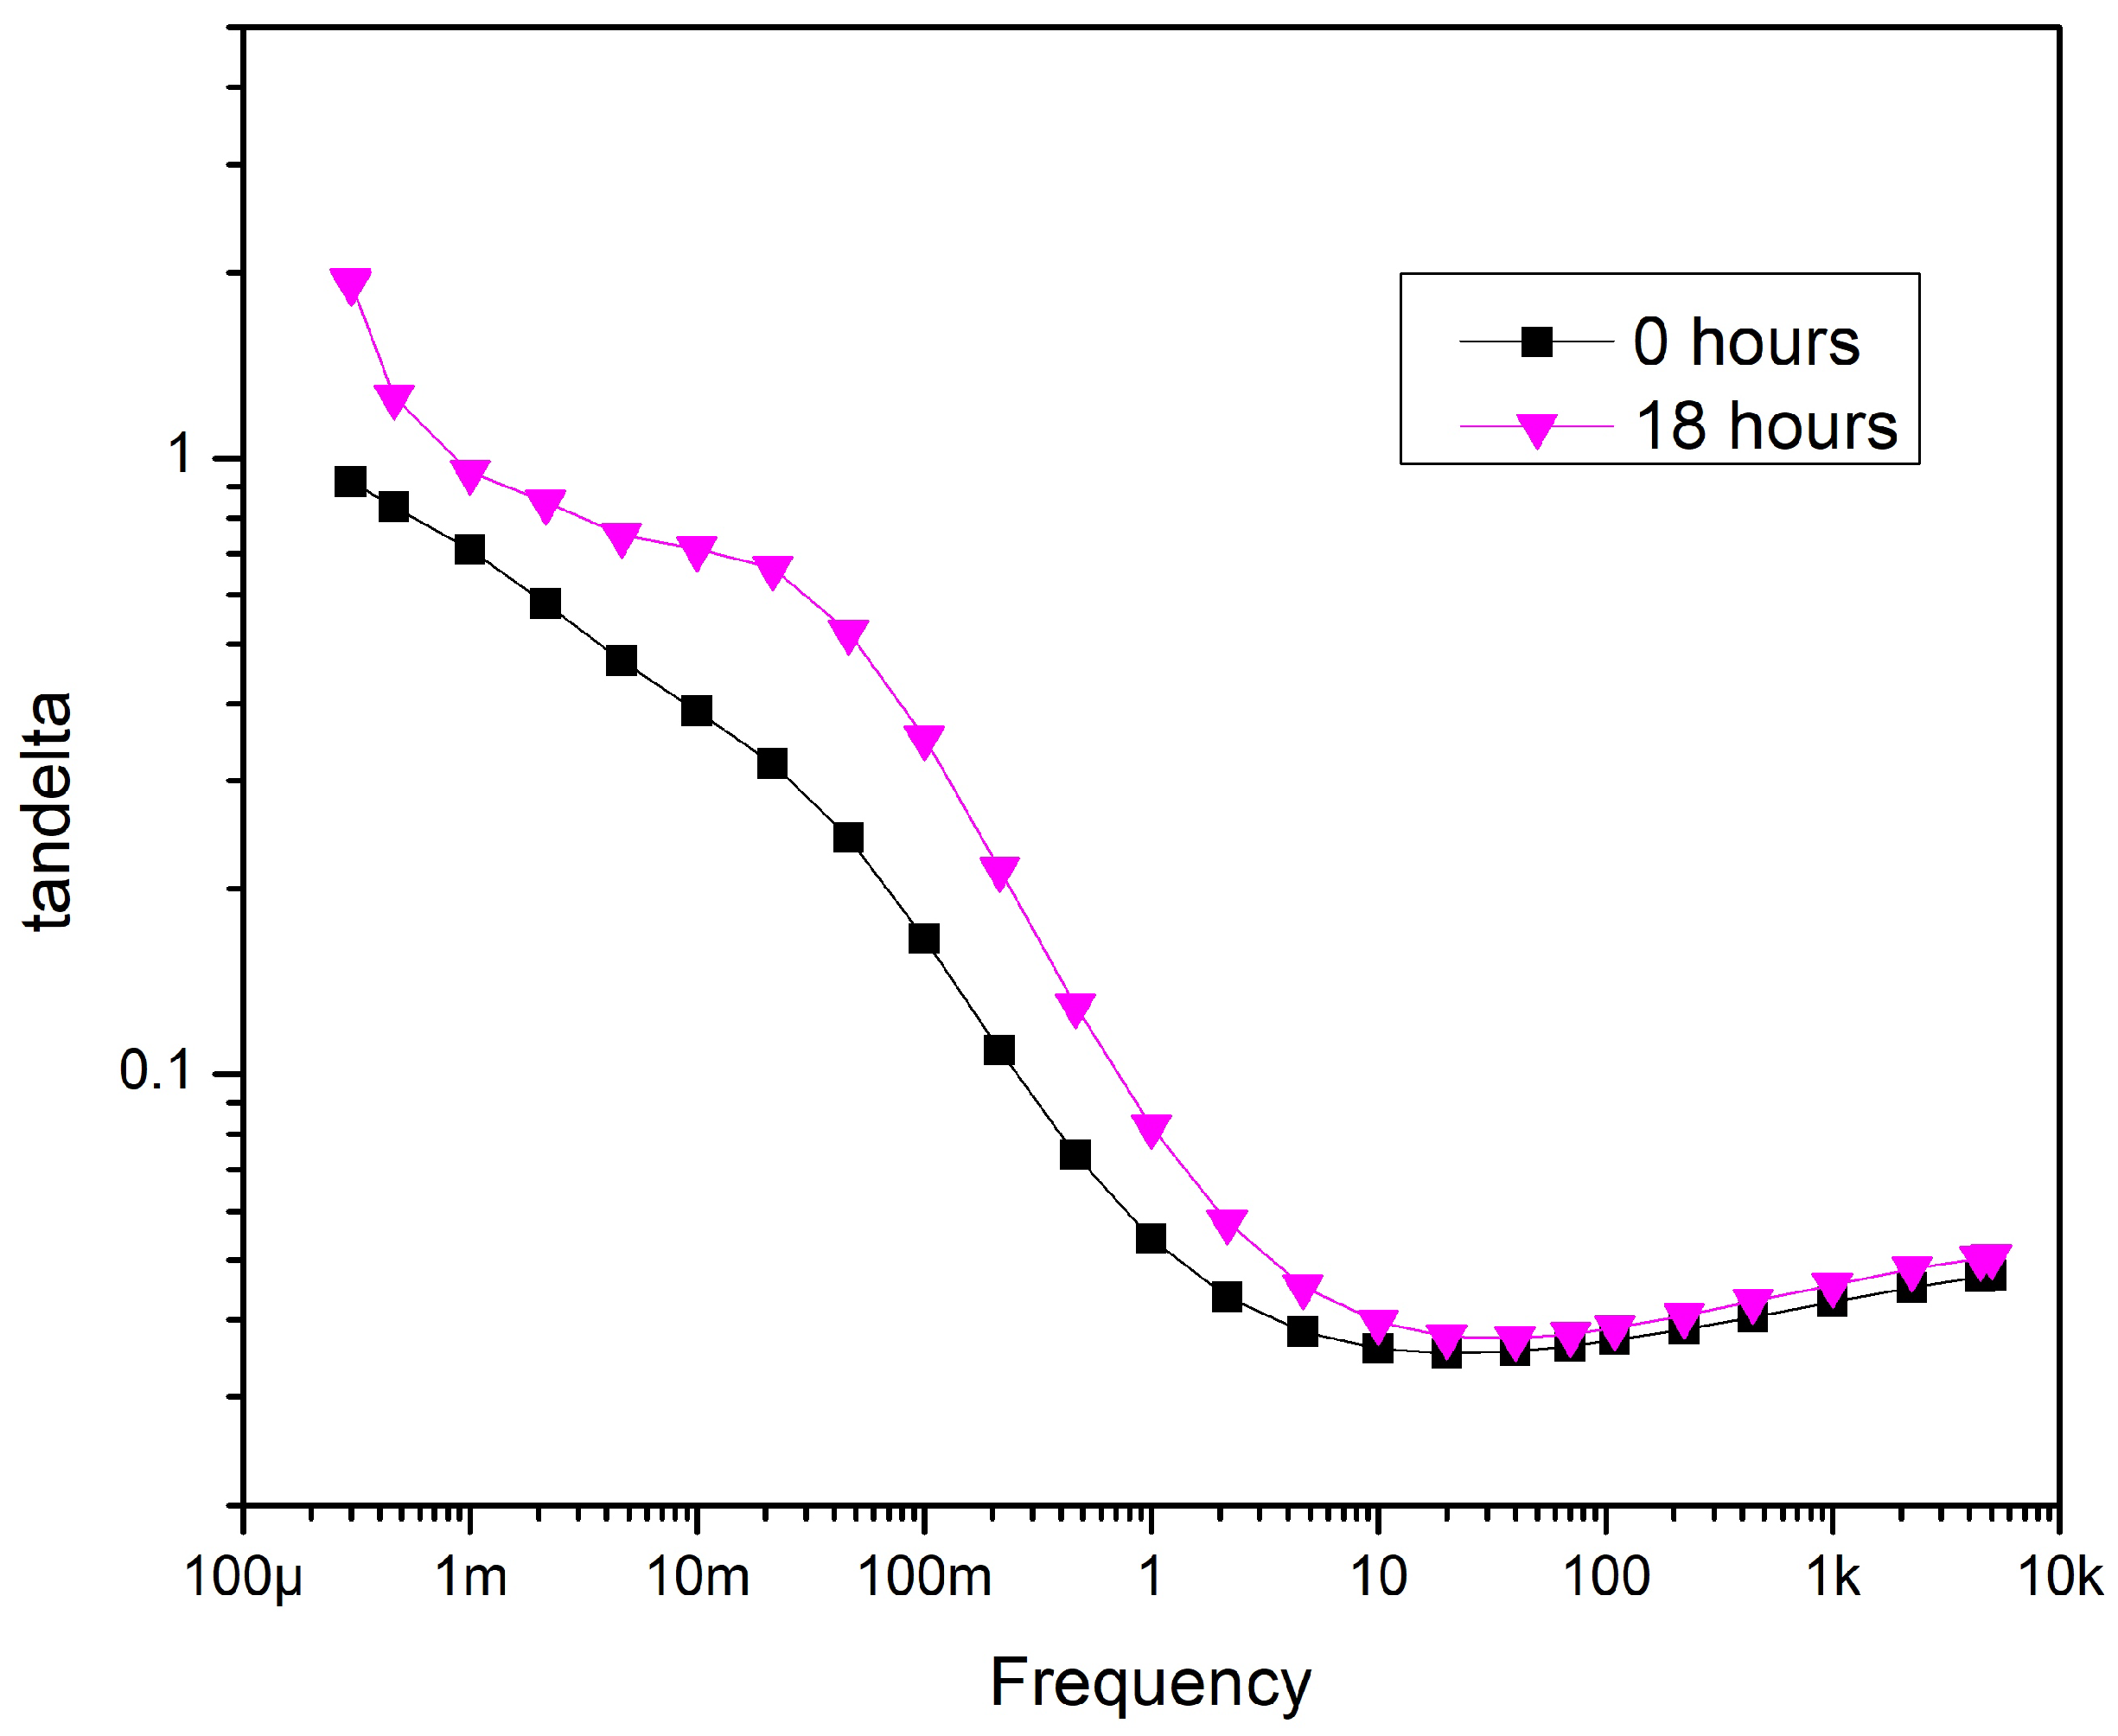
Sample 4. Sample 4 is the sample that has only the conductors and the core insulations. The result can be seen in
Figure 15. This sample’s tan
values also show an increasing trend compared to before aging, even the shape of the curve is also changed. Nevertheless, while the loss factor decreases steadily over the 300
Hz...1 Hz range in the previous cases, there are two knee points around 1 mHz and 100 mHz of the tan
curve of this sample. It can be stated that removing the PVC belt has the most significant effect on electrical parameters changing due to aging.
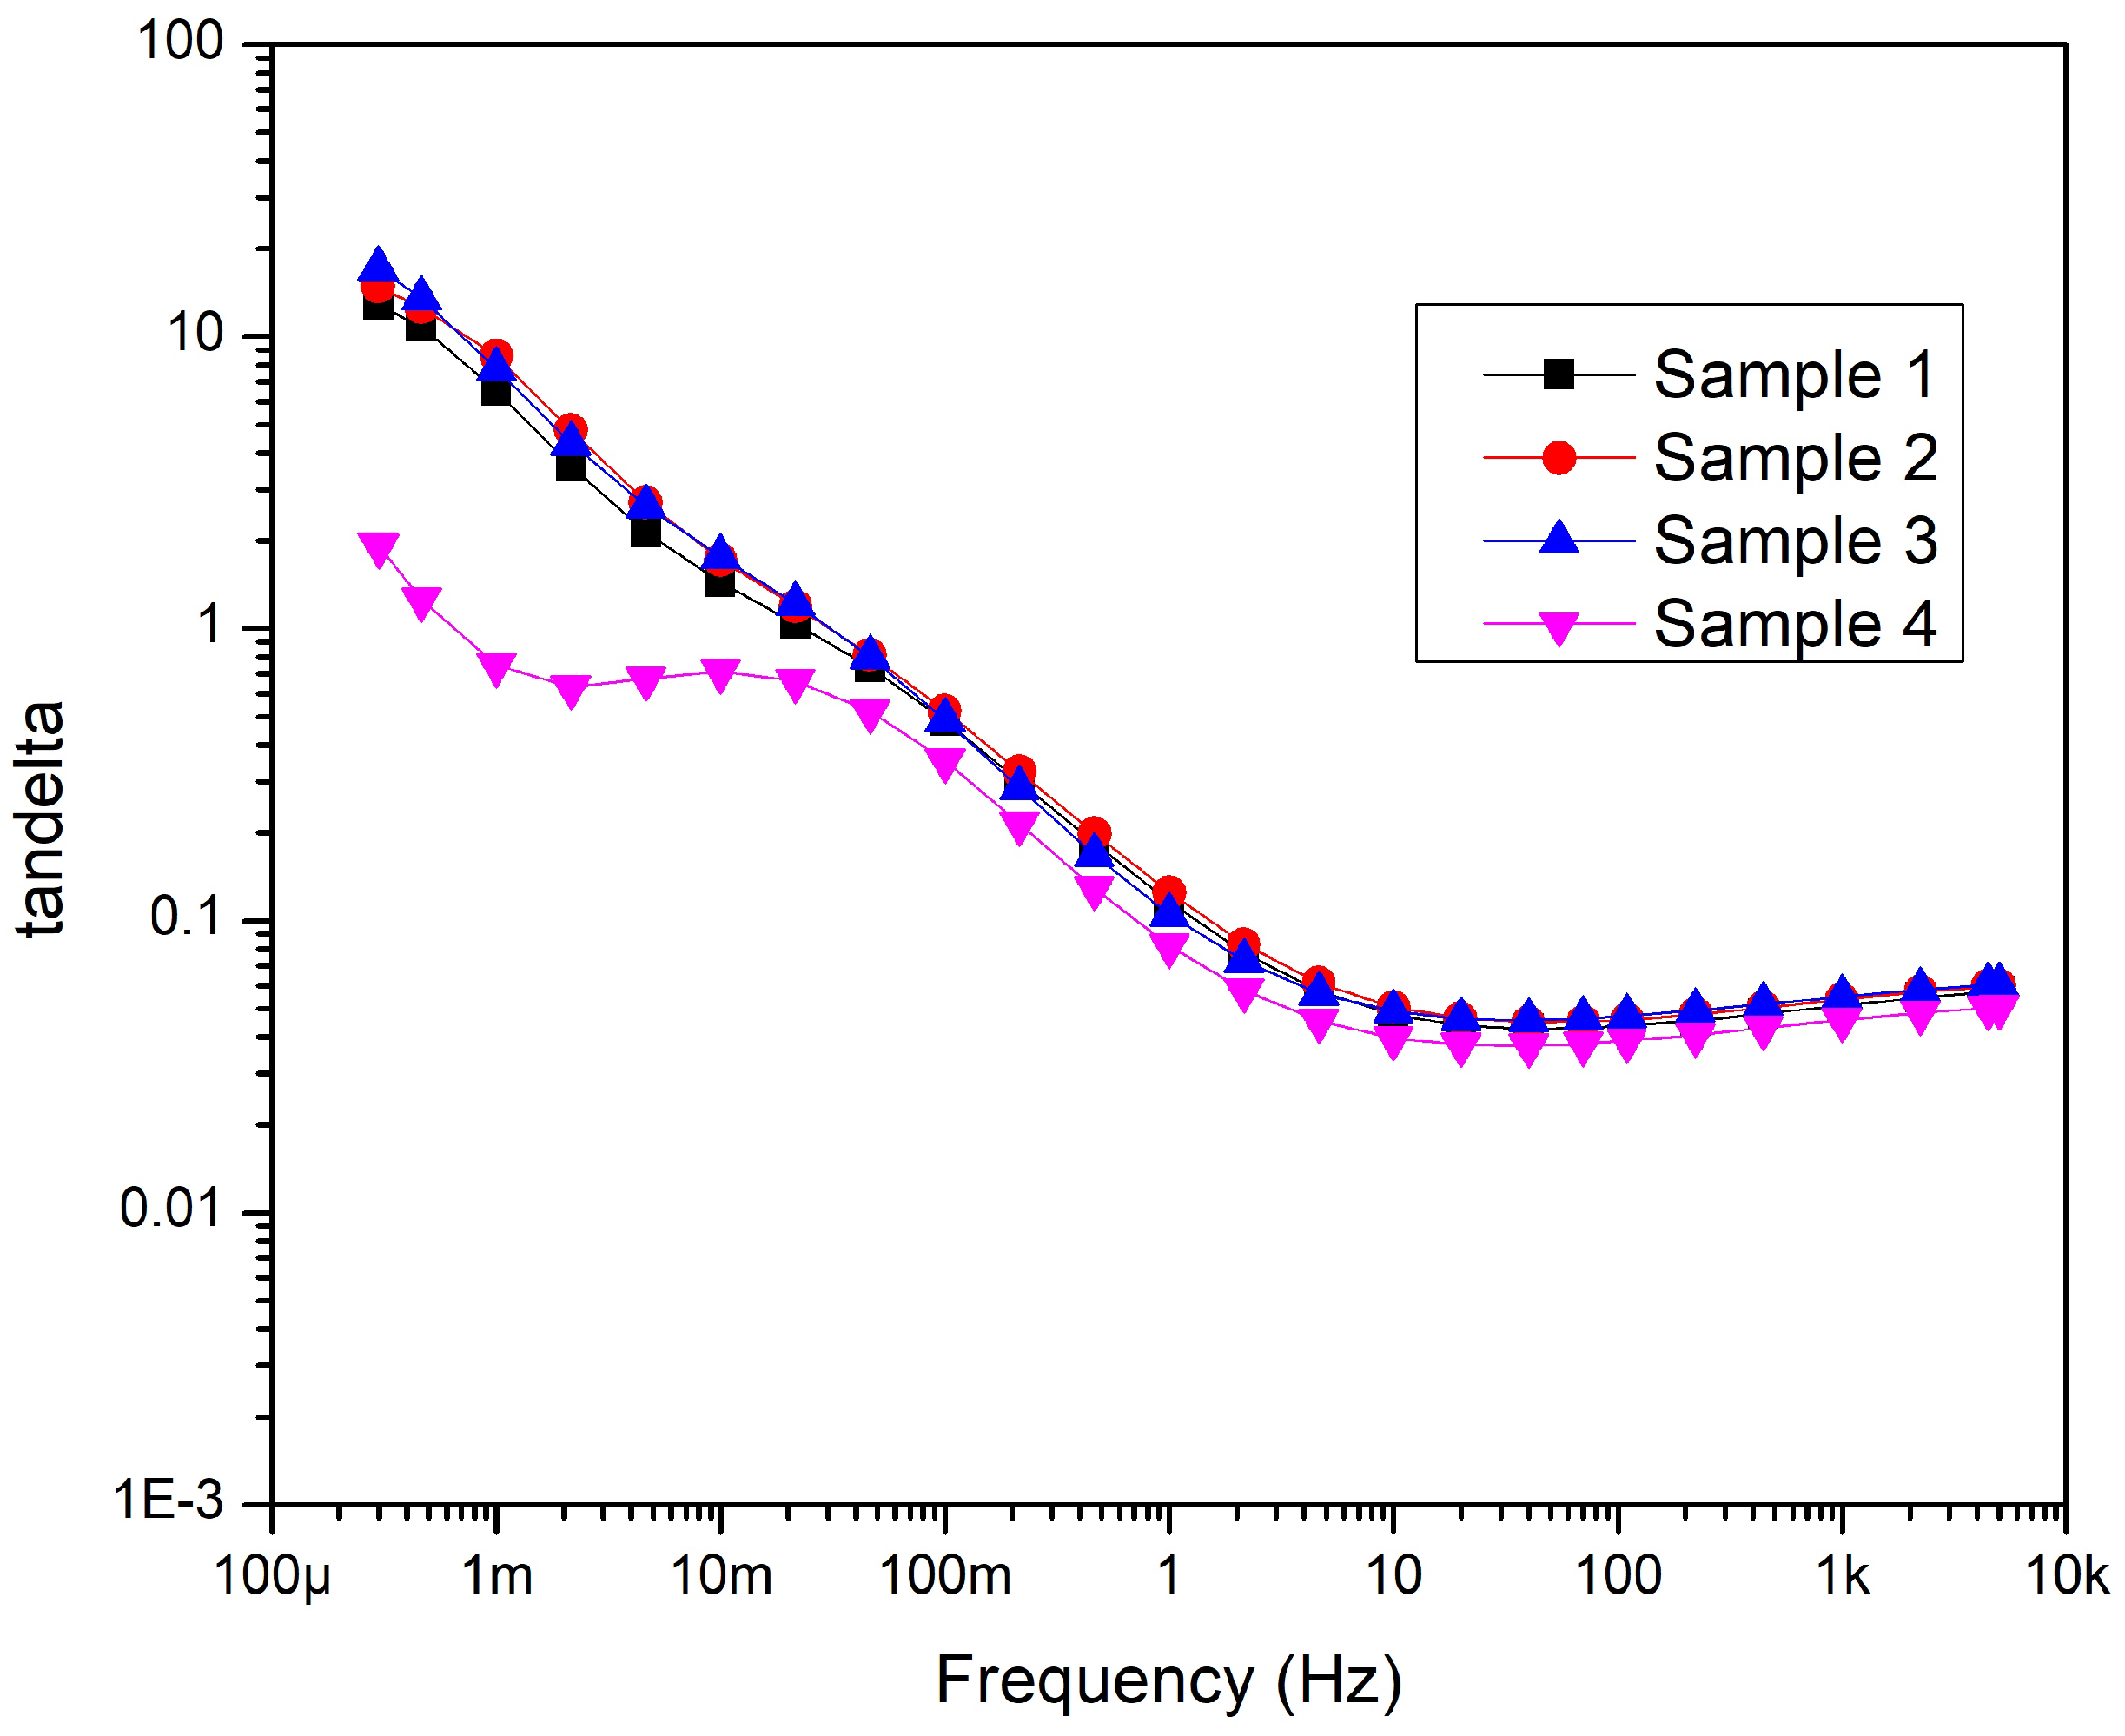
Cross comparison. As shown in the previous chapters, all four samples show a similar increasing trend when compared individually with their results. However, the cross-comparison gives interesting results. Tan
of Sample 4 is noticeably lower than the other samples (
Figure 16).
The reason for the difference is that in the case of Samples 1-3. the core insulations did not come into contact with air during thermal aging. Moreover, the result suggests that the PVC belt layer itself is enough to prevent the core insulations from coming into contact with the atmosphere of the aging chamber.
In a normal air atmosphere, there are three degradation mechanisms of plasticized PVC: dehydrochlorination, oxidation, and migration of plasticizer [
43].
In a normal air atmosphere, there are three degradation mechanisms of plasticized PVC: dehydrochlorination, oxidation, and migration of plasticizer. All of these processes affect the dielectric property of the material. The dehydrochlorination mainly results in double-bond formation in the chain molecule [
44]. The double bonds act as shallow electron traps or hopping places for electrons, increasing the conductivity of the material [
45,
46,
47]. The presence of oxygen affects the thermal degradation of PVC. Compared to an inert atmosphere, the dehydrochlorination rate is higher in normal air [
48]. At higher temperatures, chain scission and cross-linking reactions are also observed [
49]. Since the low-frequency tan
increased in all cases, an increase in conductivity can be assumed, indicating the thermal degradation of PVC core insulation. Because of the 110
C aging temperature, the dominant degradation process is plasticizer loss, controlled by the environmental conditions in this temperature range [
43]. Previous studies have shown that thermal aging affects the plasticizer component content inside the PVC, leading to tan
alteration [
13]. The tan
of dielectrics in the low-frequency range is mostly the result of the conductivity, and plasticized PVC conductivity is proportional to the plasticizer content. The different behavior of Sample 4 from the other samples can be explained by the fact that the core insulations of Sample 4 are in contact with air. Therefore the plasticizer can easily evaporate from them, unlike the other samples, which are covered with other structural elements of the cables, such as the PVC belt layer, the aluminum tape, and the jacket. The conductivity decrease due to the plasticizer loss can partly compensate for the conductivity increase caused by the dehydrochlorination. The Sample 3 insulations are covered only with the PVC belt layer. The Sample 3 aging behavior is similar to the Smaples 1 and 2 hence the PVC belt layer can prevent alone the plasticizer evaporation. However, this requires further investigation.
A local peak in a tan
curve is related to a dominant polarization process on a given frequency, resulting in a significant change in the capacitance–frequency curve [
31,
38]. Since the tan
of Sample 4 has a local peak between 10 and 100 mHz (
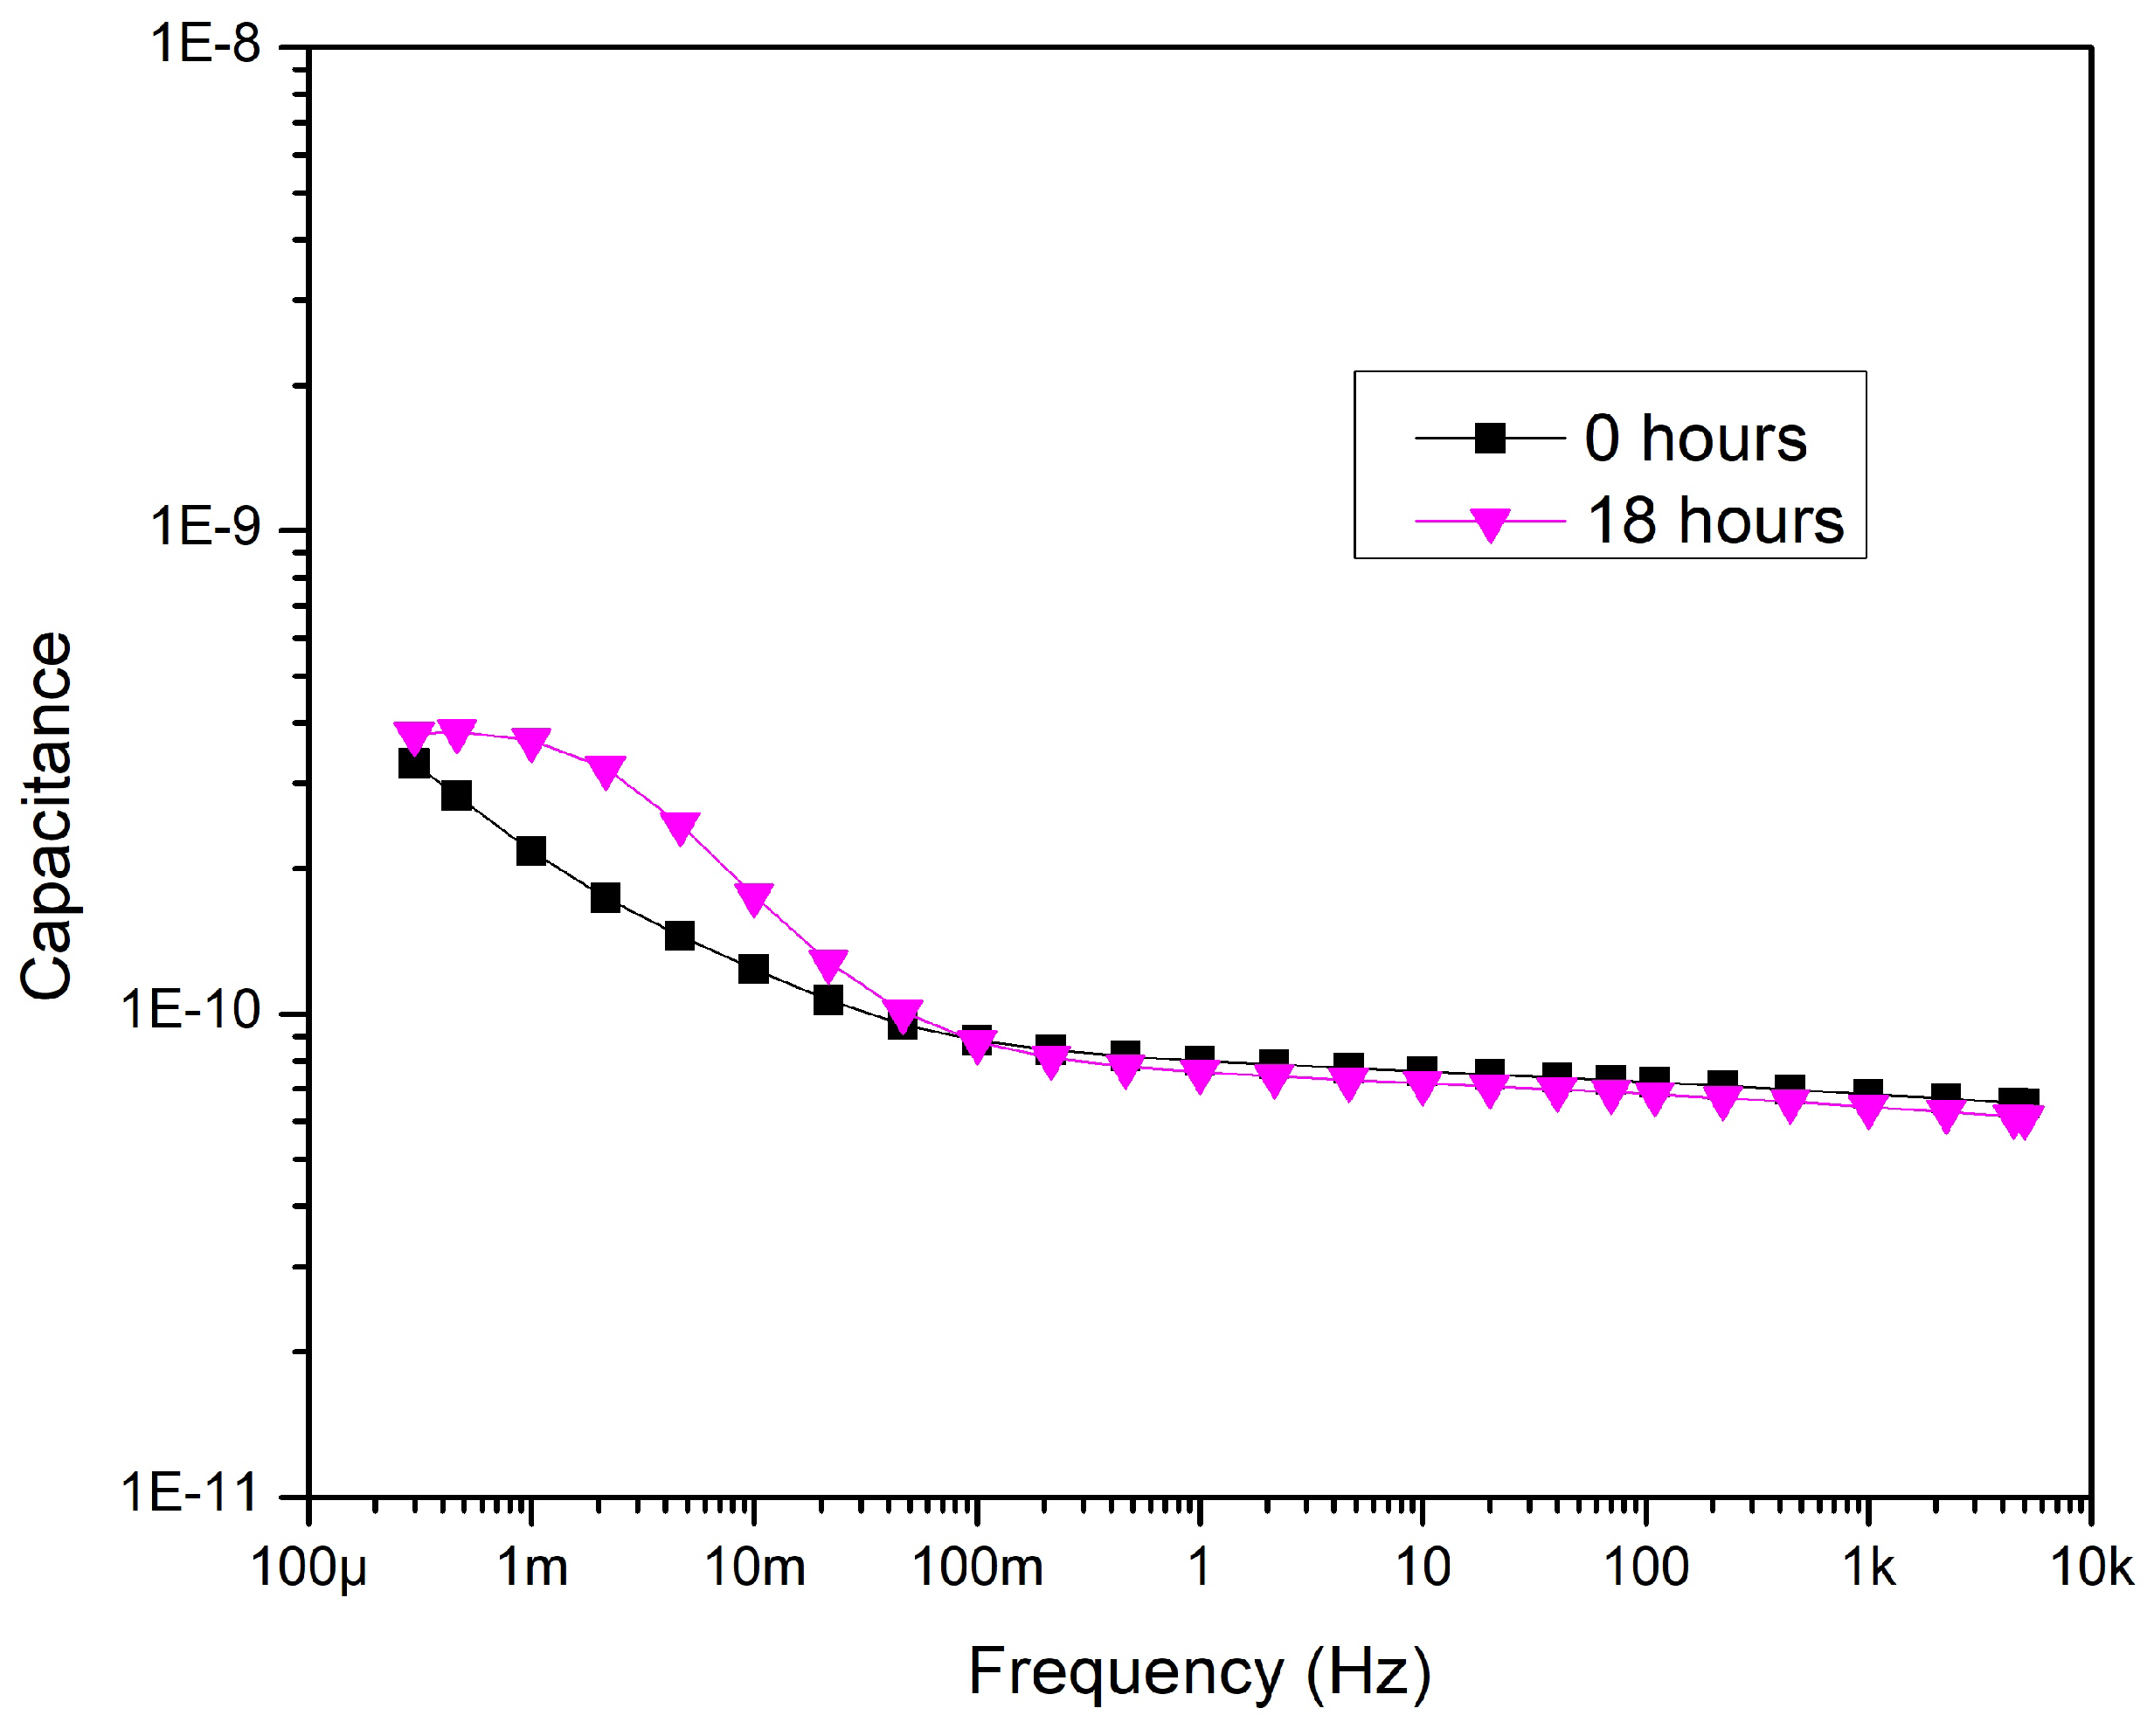
Figure 16), it is worth looking at its capacitance curve (
Figure 17). Between 1 mHz and 30 mHz the capacitance drops below 100 nF from 300 nF. The reason for this capacitance decrease could be due to the appearance of a dominant interfacial polarization in this frequency range [
26].
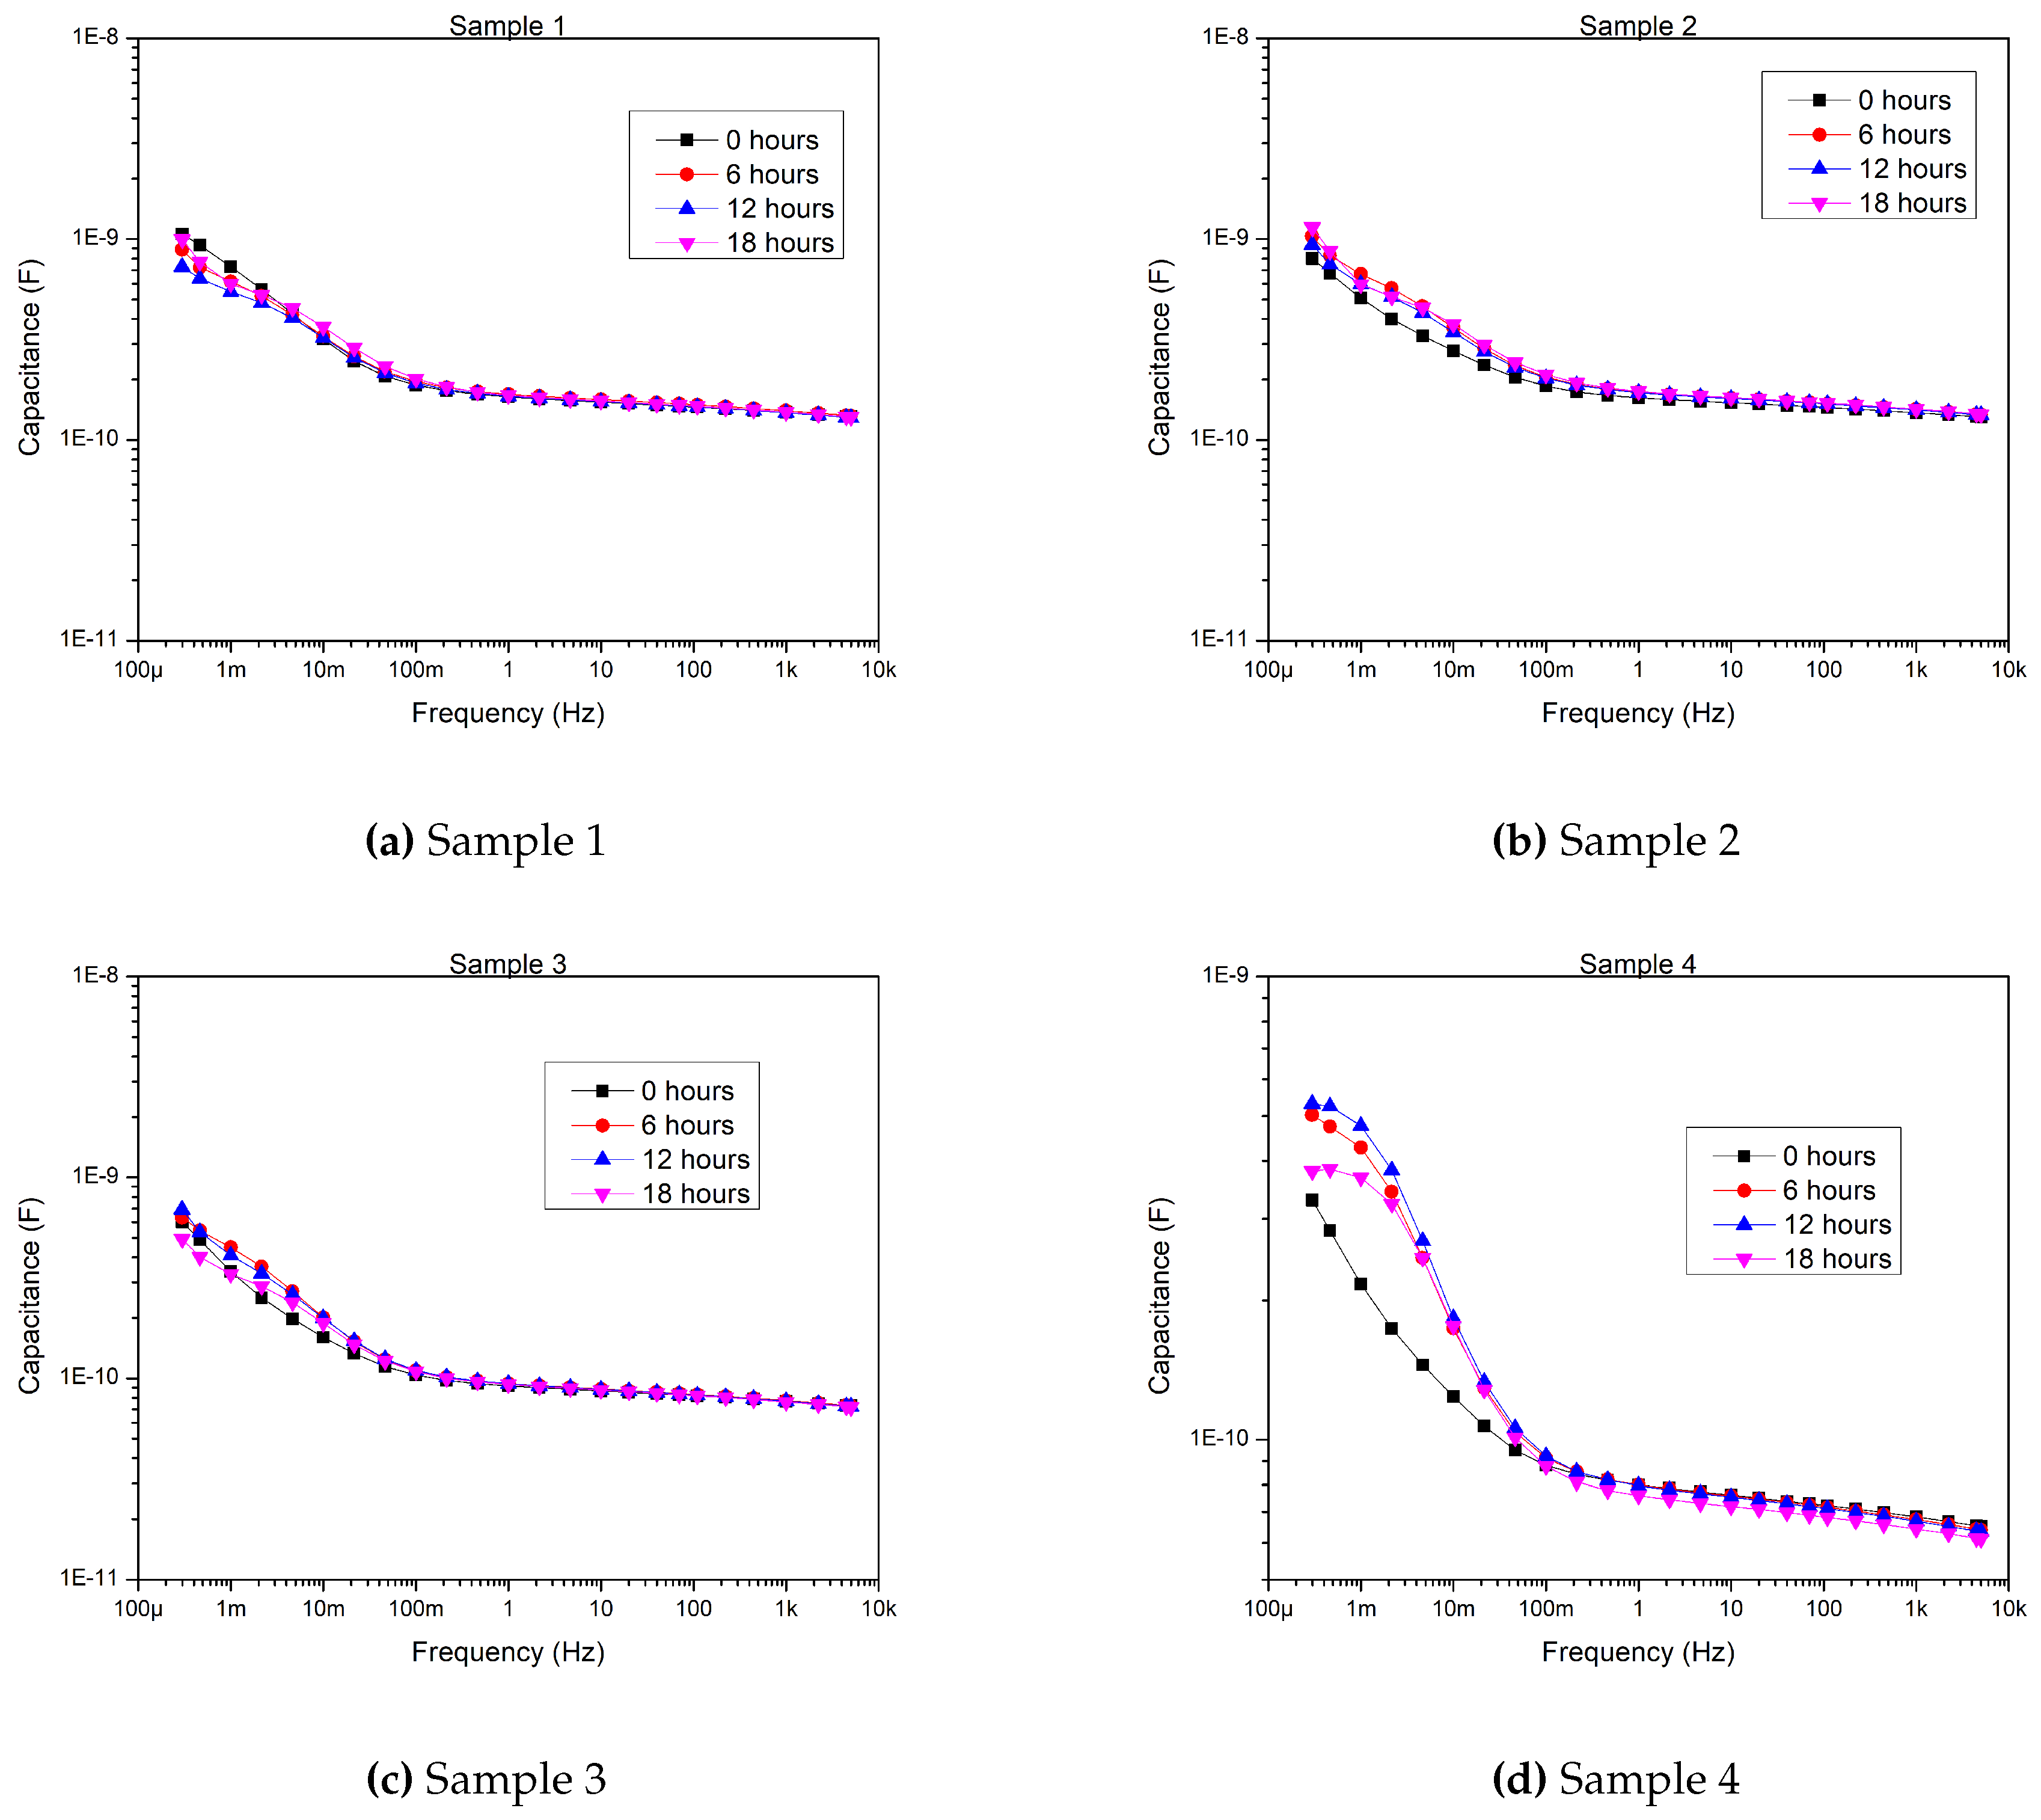
The other samples’ capacitances show a small increase below
Hz with aging (see
Appendix A) due to the increase in the conductivity of the material with aging.
4.2. Impact on Polarization, Depolarization, and Conduction Currents
As mentioned in
Section 3.3, the measuring equipment registered the PDC curves, hence the results of time-domain measurements were also involved in the aging investigation. All measurement results of PDC measurement are presented in
Appendix B.
From the results of PDC measurement using Equation (
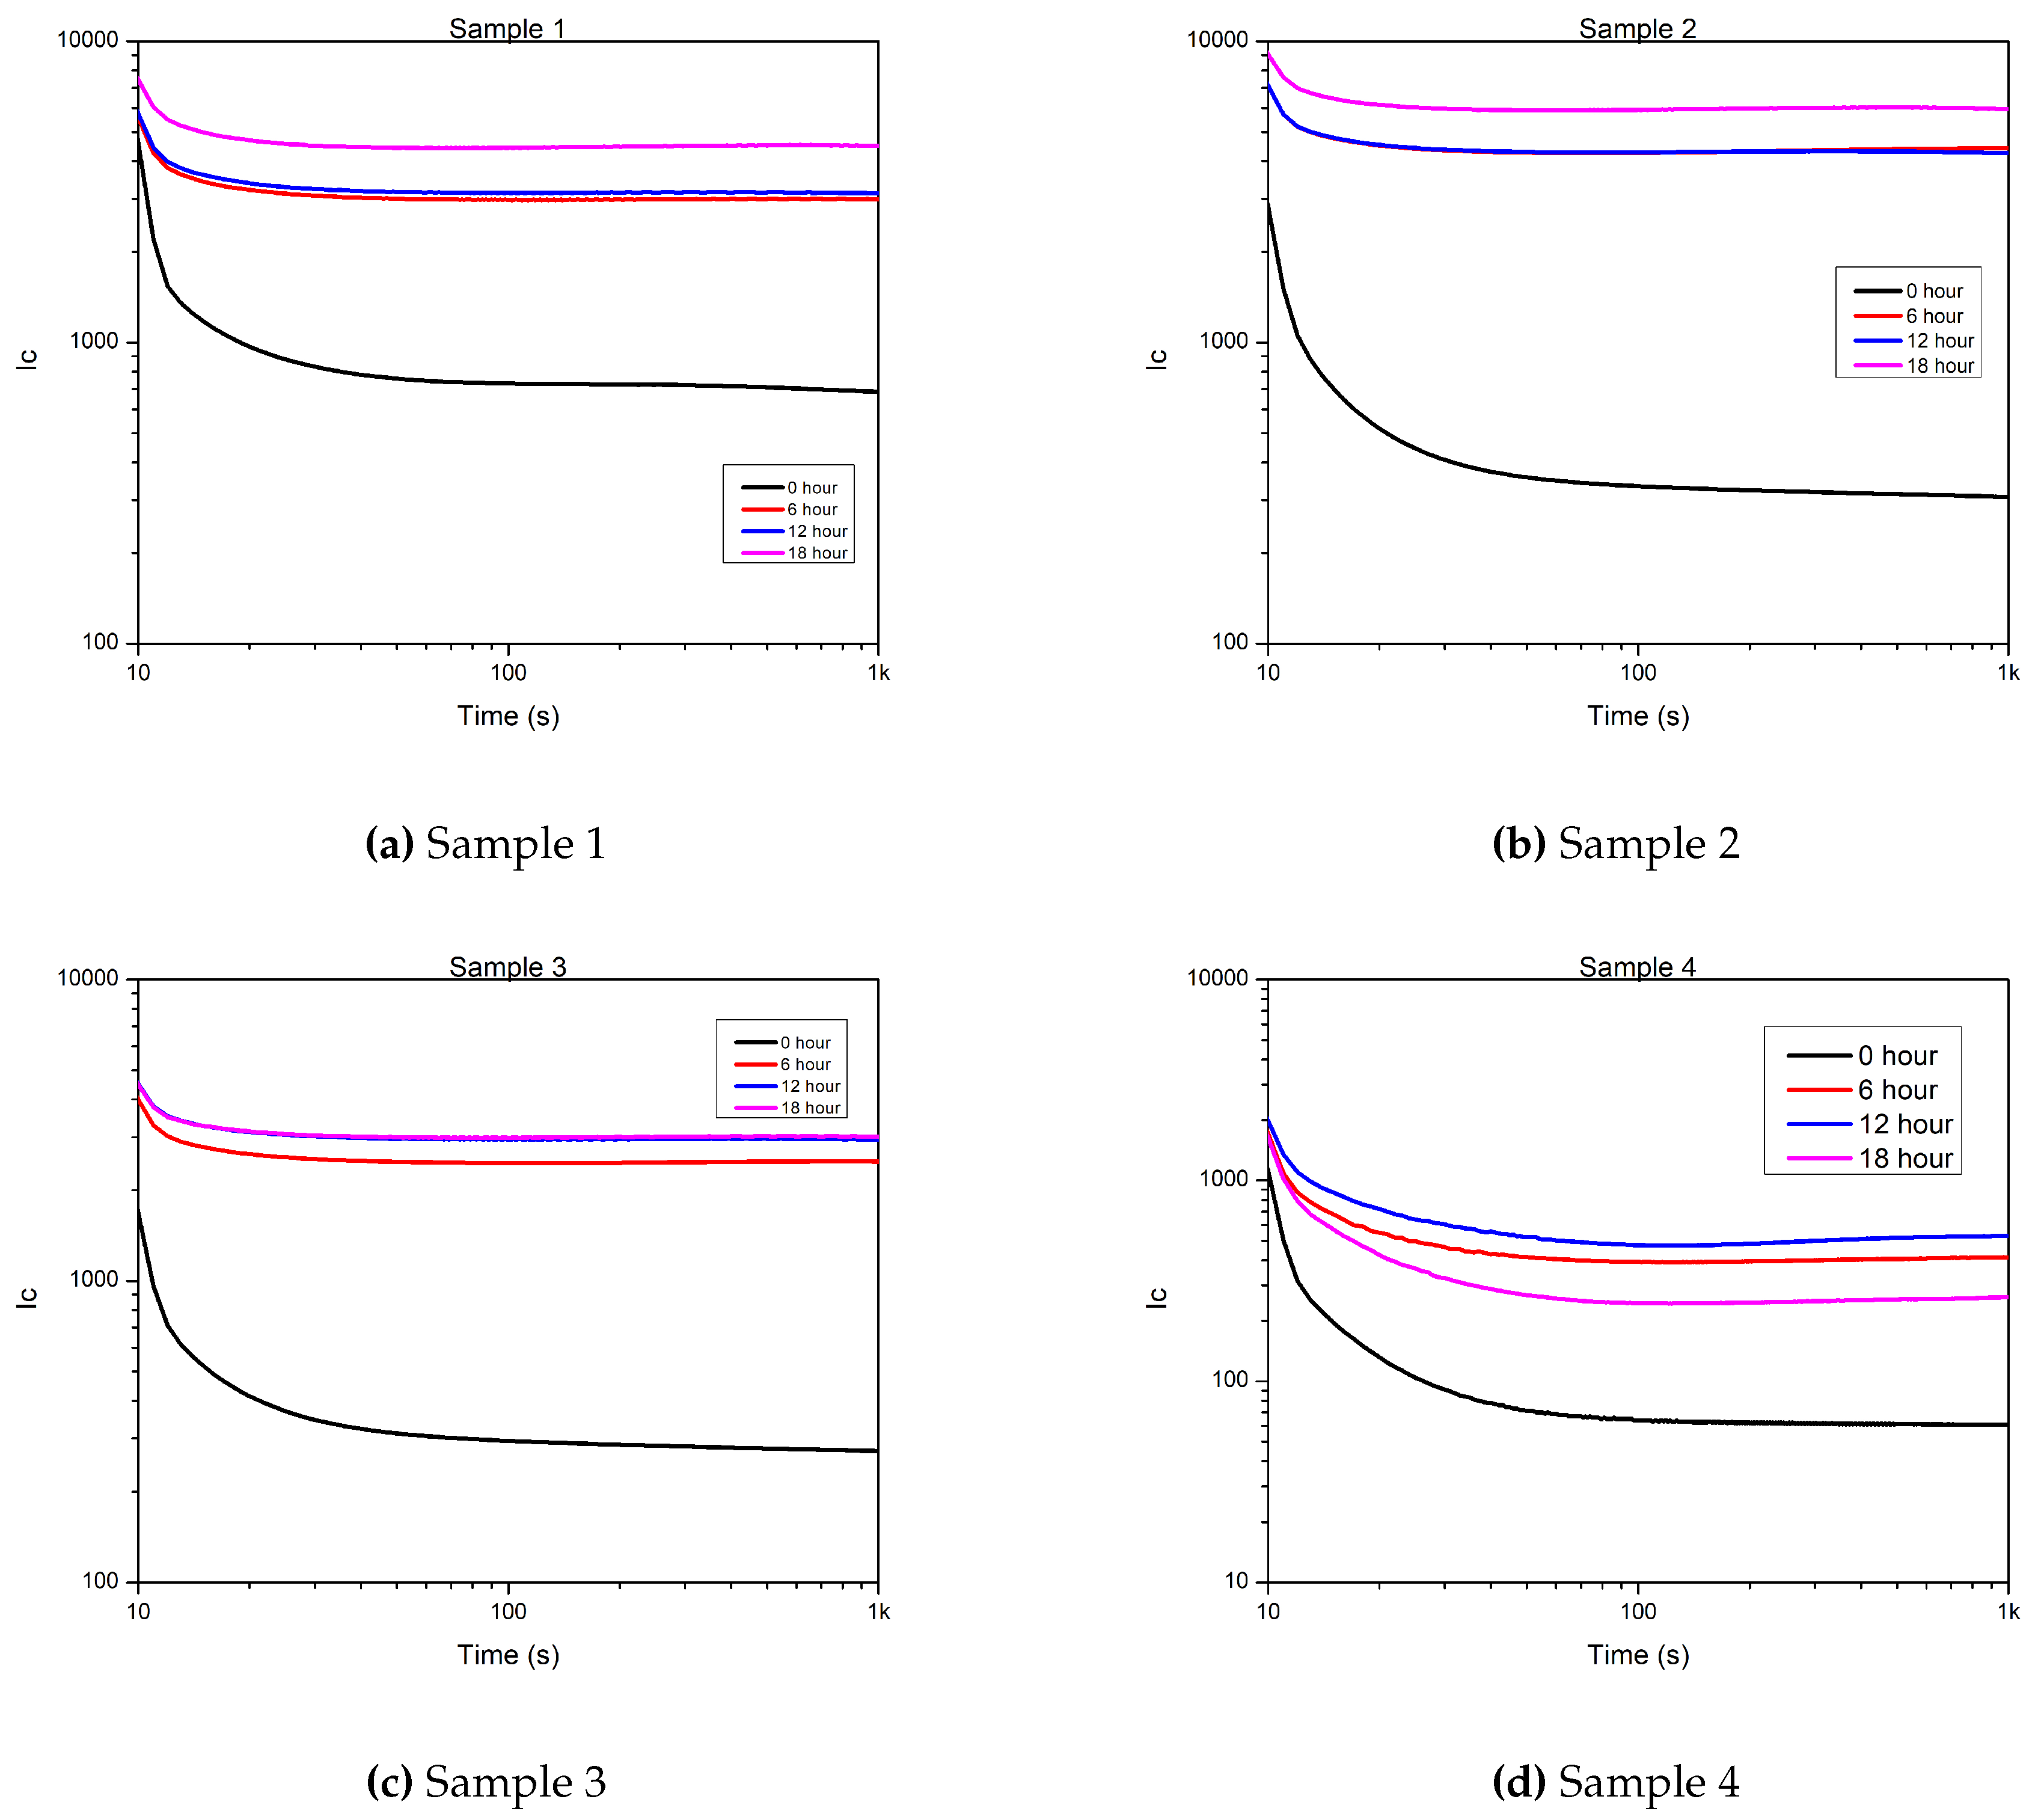
4), the change in the conductive current due to aging can also be compared. The calculated conductive currents for all samples after each aging cycles are in
Appendix C. Although Equation (
4) would allow the specific conductivity to be determined, given the complexity of the cable structure, it would be difficult to calculate accurately. Hence the conductive current change with aging was analyzed.
4.2.1. Before Aging
The polarization and depolarization currents were measured after changing the structure of the cable samples.
Figure 18 and
Figure 19 show polarization and depolarization currents before aging, respectively.
The conductive current has been calculated from the polarization and depolarization currents.
Figure 20 shows how the conductive current was affected after the cable structure changed.
It can be seen clearly that Sample 1, which is the intact one, has the highest conductive current. The conduction current decreases with removing components, i.e., jacket, aluminum tape, and PVC belt, of the cable. The current curves obtained are consistent with the previous findings that the difference between Samples 1 and 2 can be explained by the compression exerted by the jacket because the jacket removal decreases the contact area between the cable components, increasing the contact resistance among them [
50]. The increased contact resistance lesser the conductive current, but the effect on the capacitance is negligible because the electrode arrangement is the same for both samples (see
Figure 10). Surprisingly, a relatively small change can be observed between Samples 2 and 3. This small change in the conductive current means that without the compression force of the jacket, the smaller part of the conductive current flows between the aluminum tape and the cores. The determinant part of the current flows between the core conductors. By comparing the conductive currents of Sample 3 and 4, the difference shows the PVC belt layer’s significant role in field distribution as previously assumed in the
Section 4.1.1 based on the results of tan
and capacitance measurements of structurally changed samples before aging.
4.2.2. After Aging
The polarization and depolarization currents were measured after each aging cycle, and conduction currents were derived from them. Previous studies have shown that thermal aging affects the polarization level of the dielectric. The polarization current is increased by thermal aging. With the increase of the conductivity, the conductive current increases, too. To summarize, only the results of 18 hours of aging are presented here.
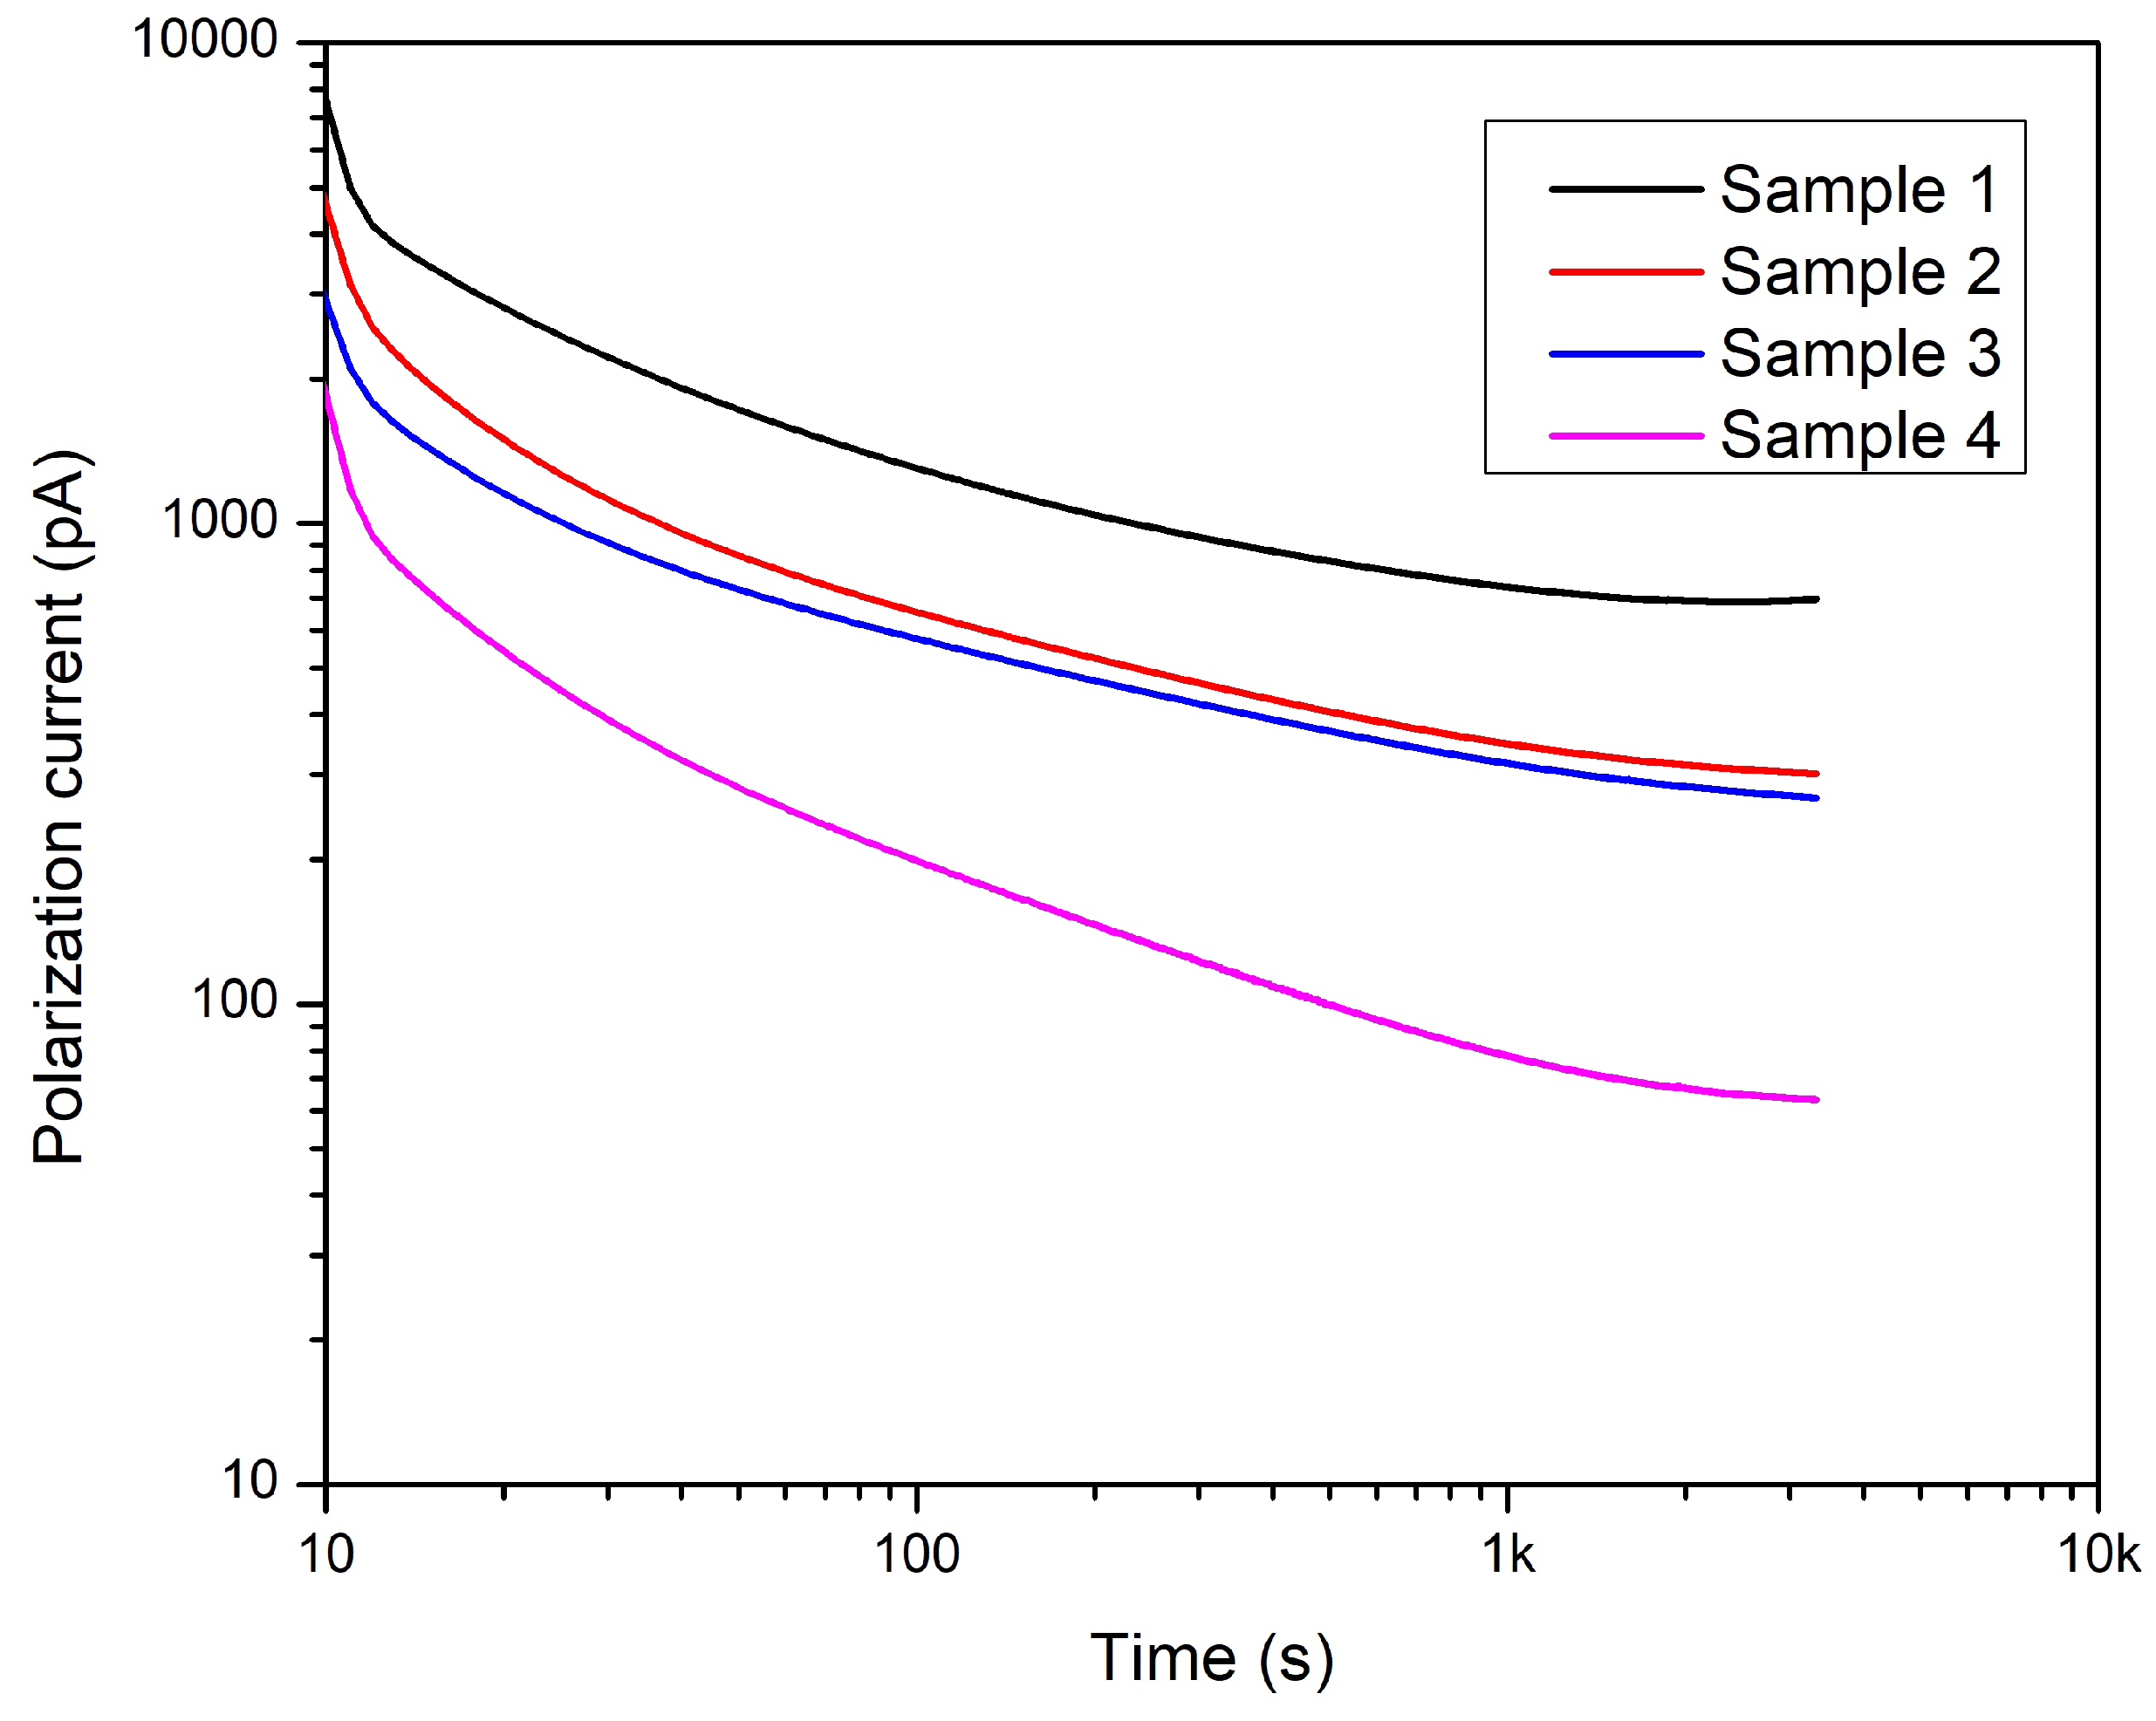
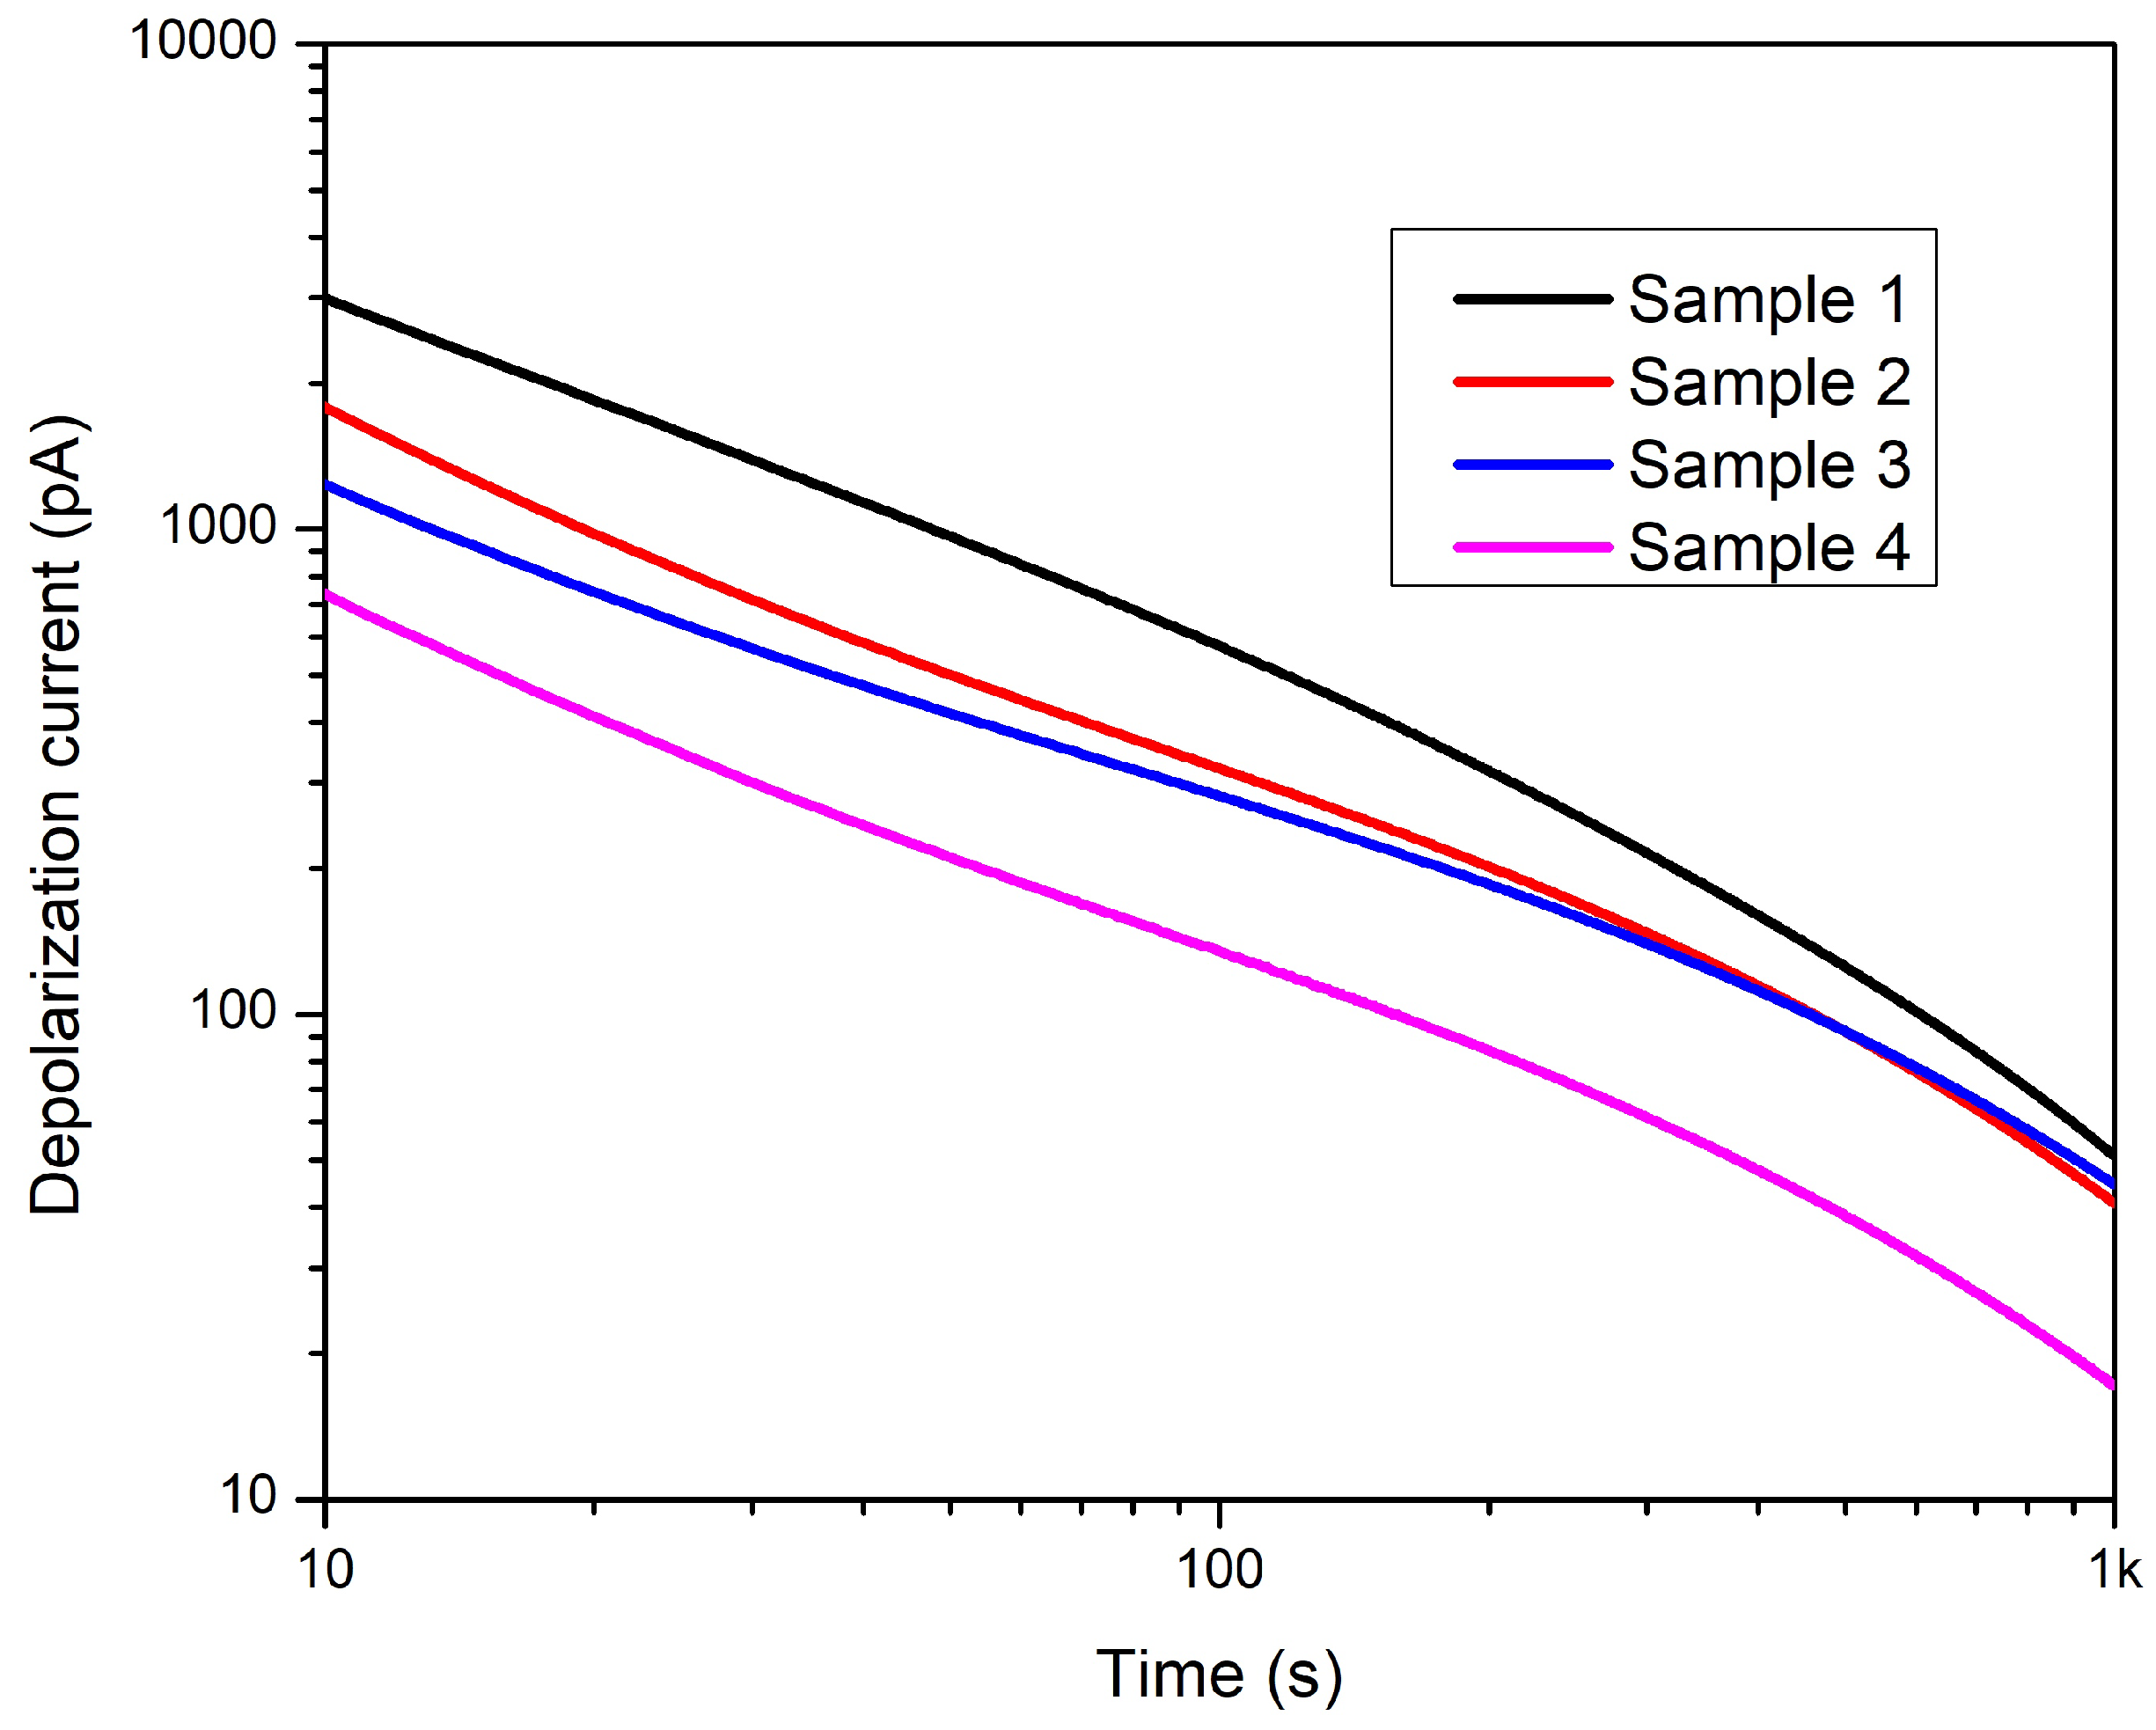
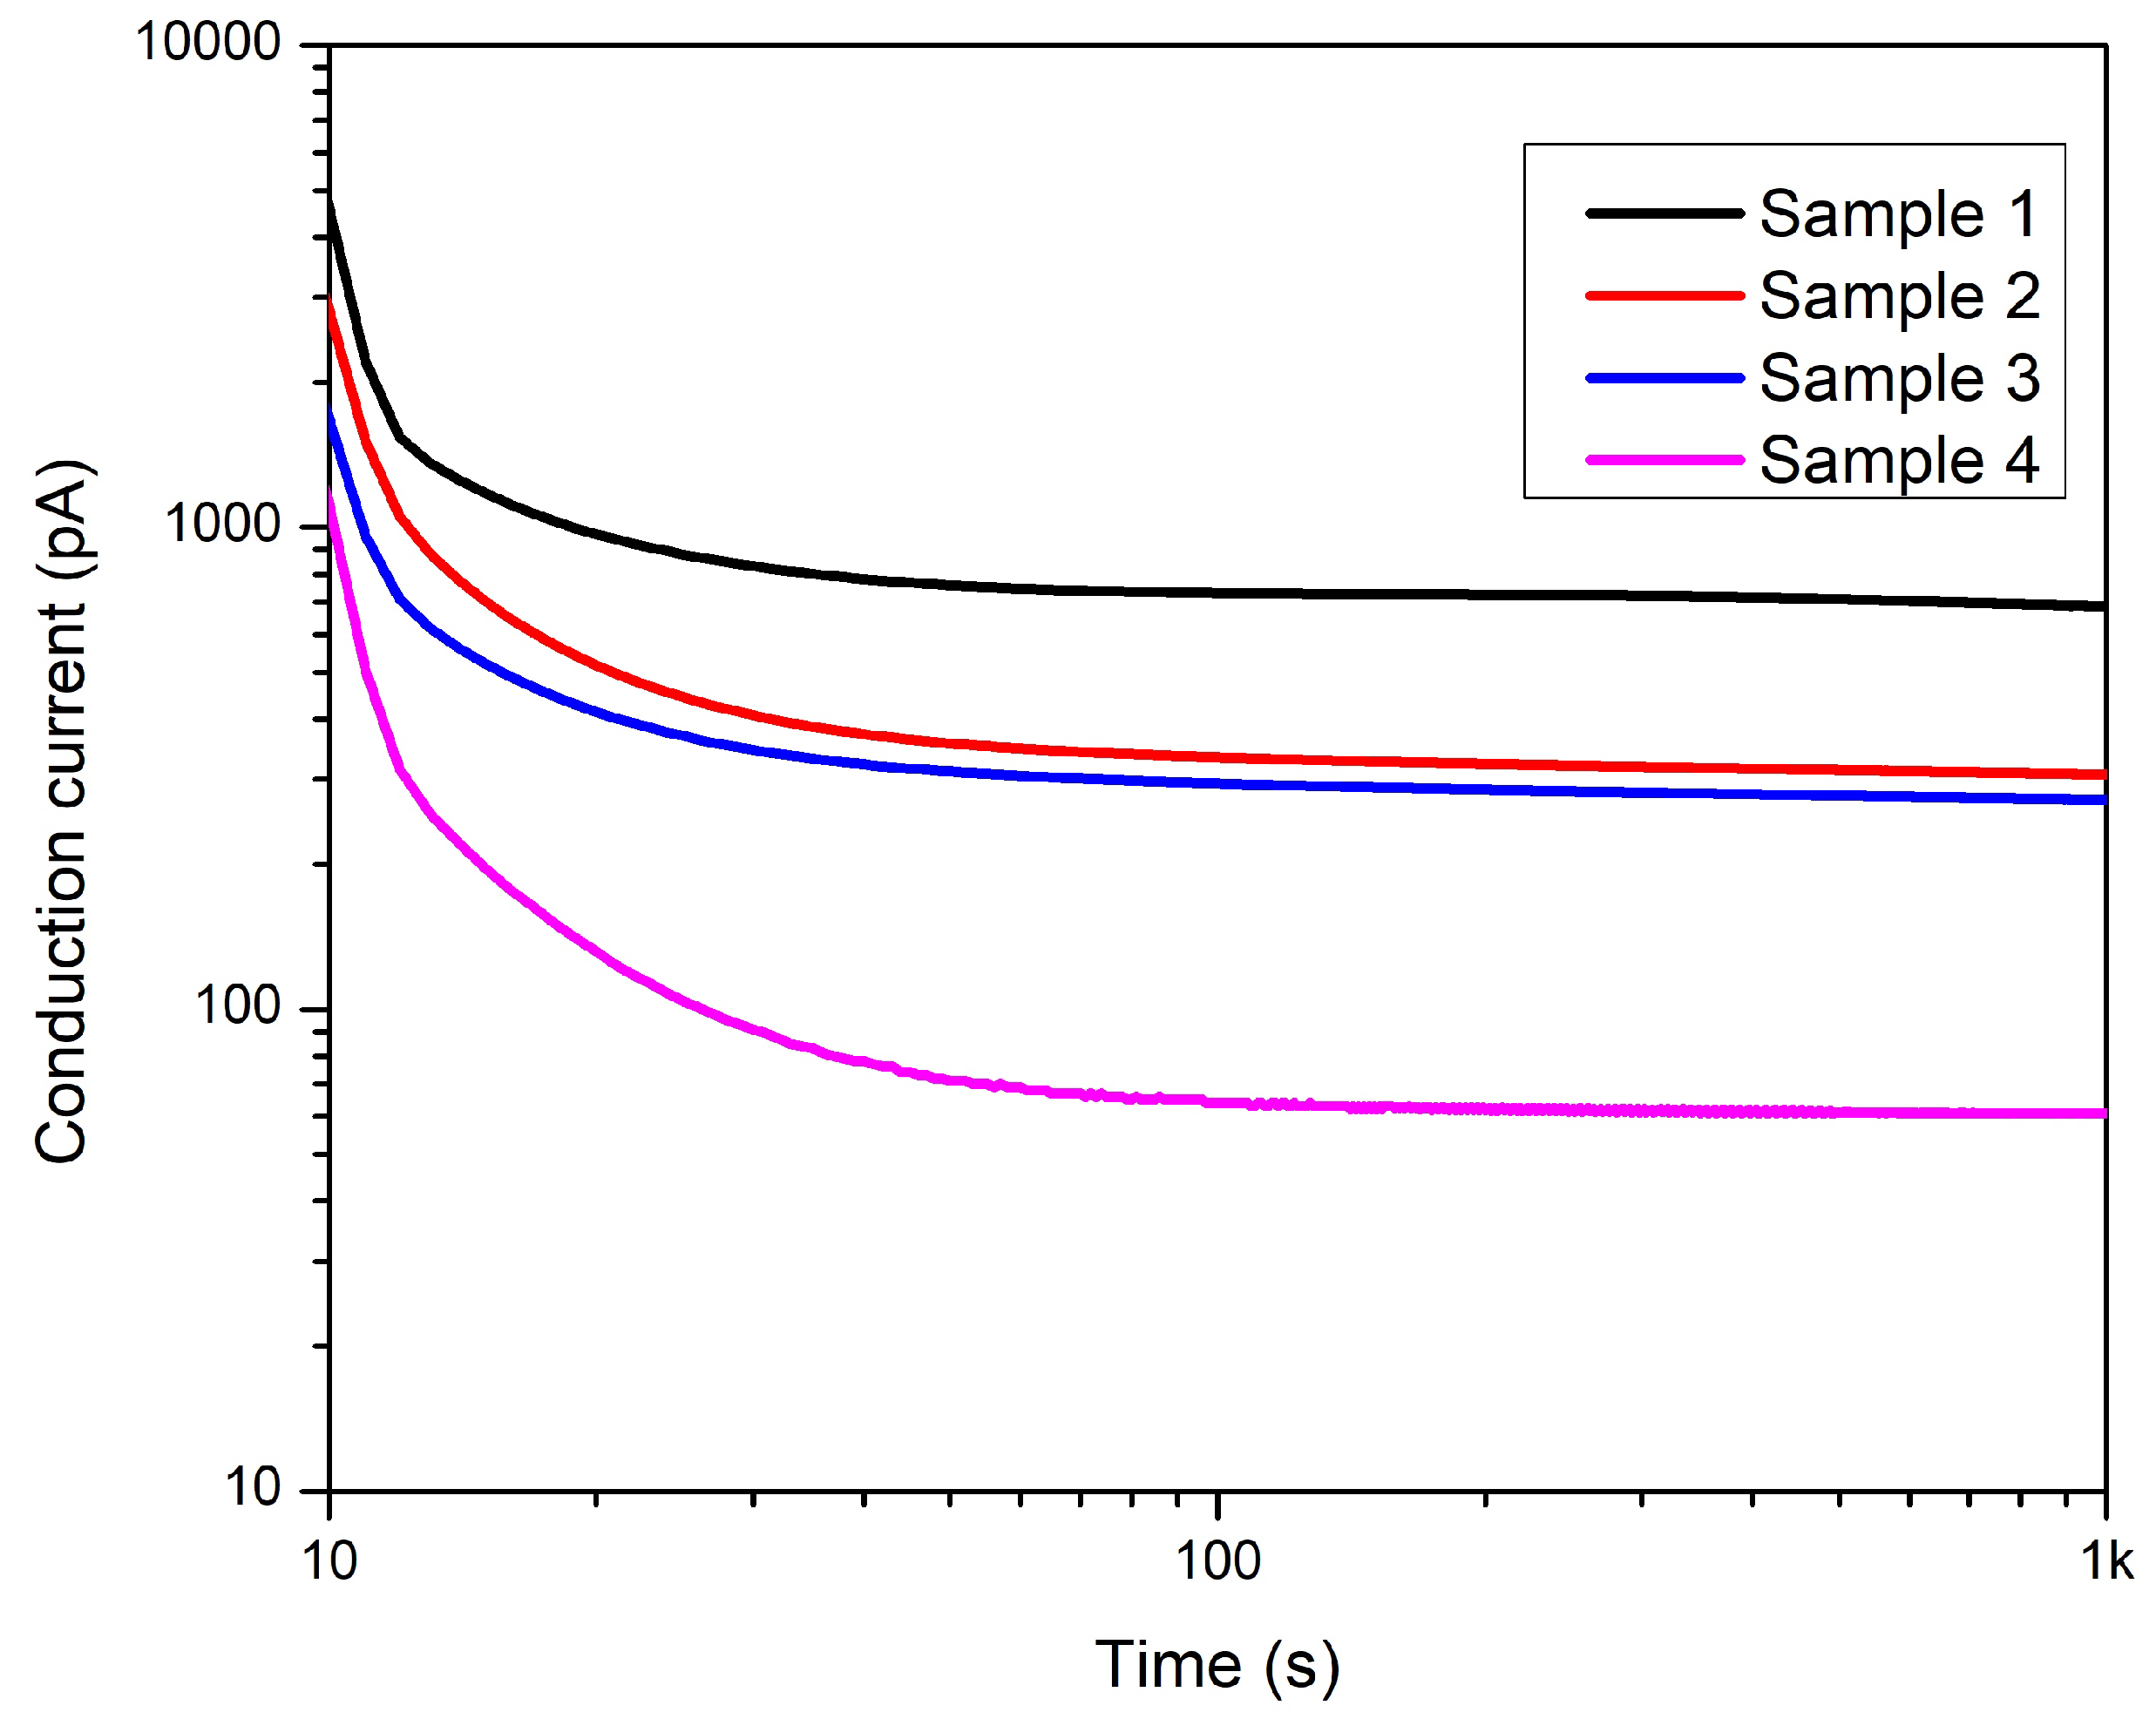
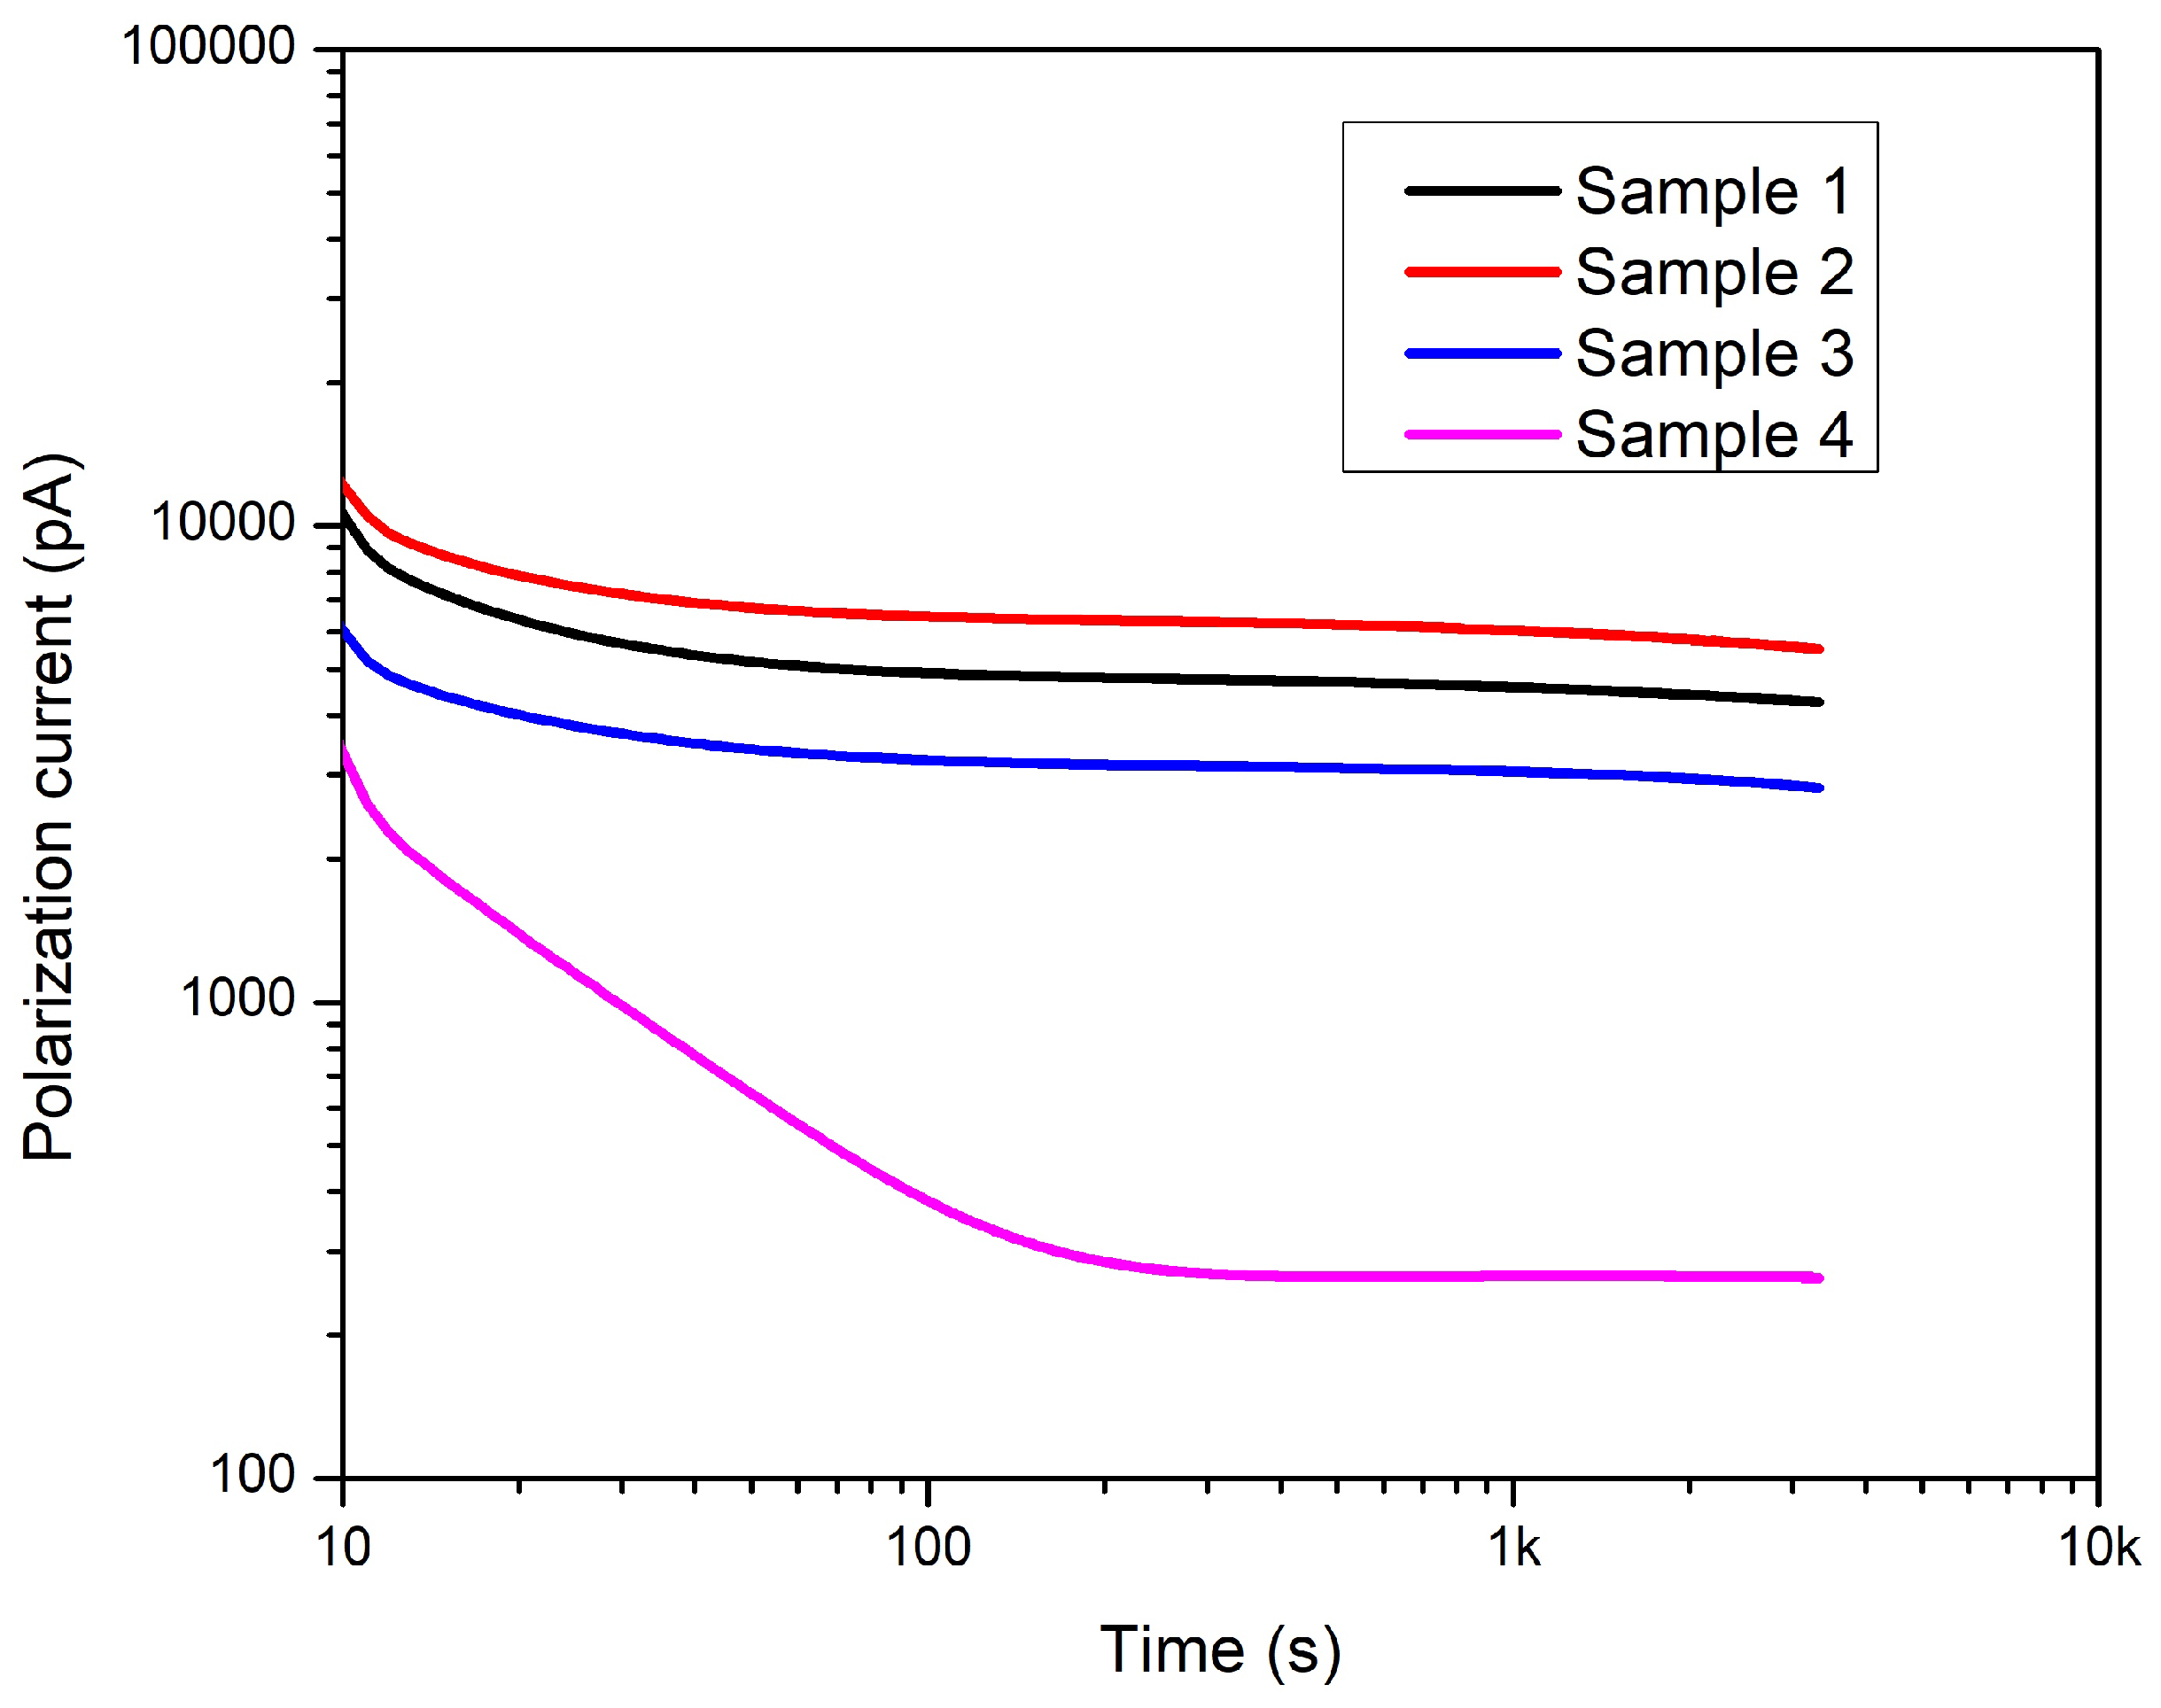
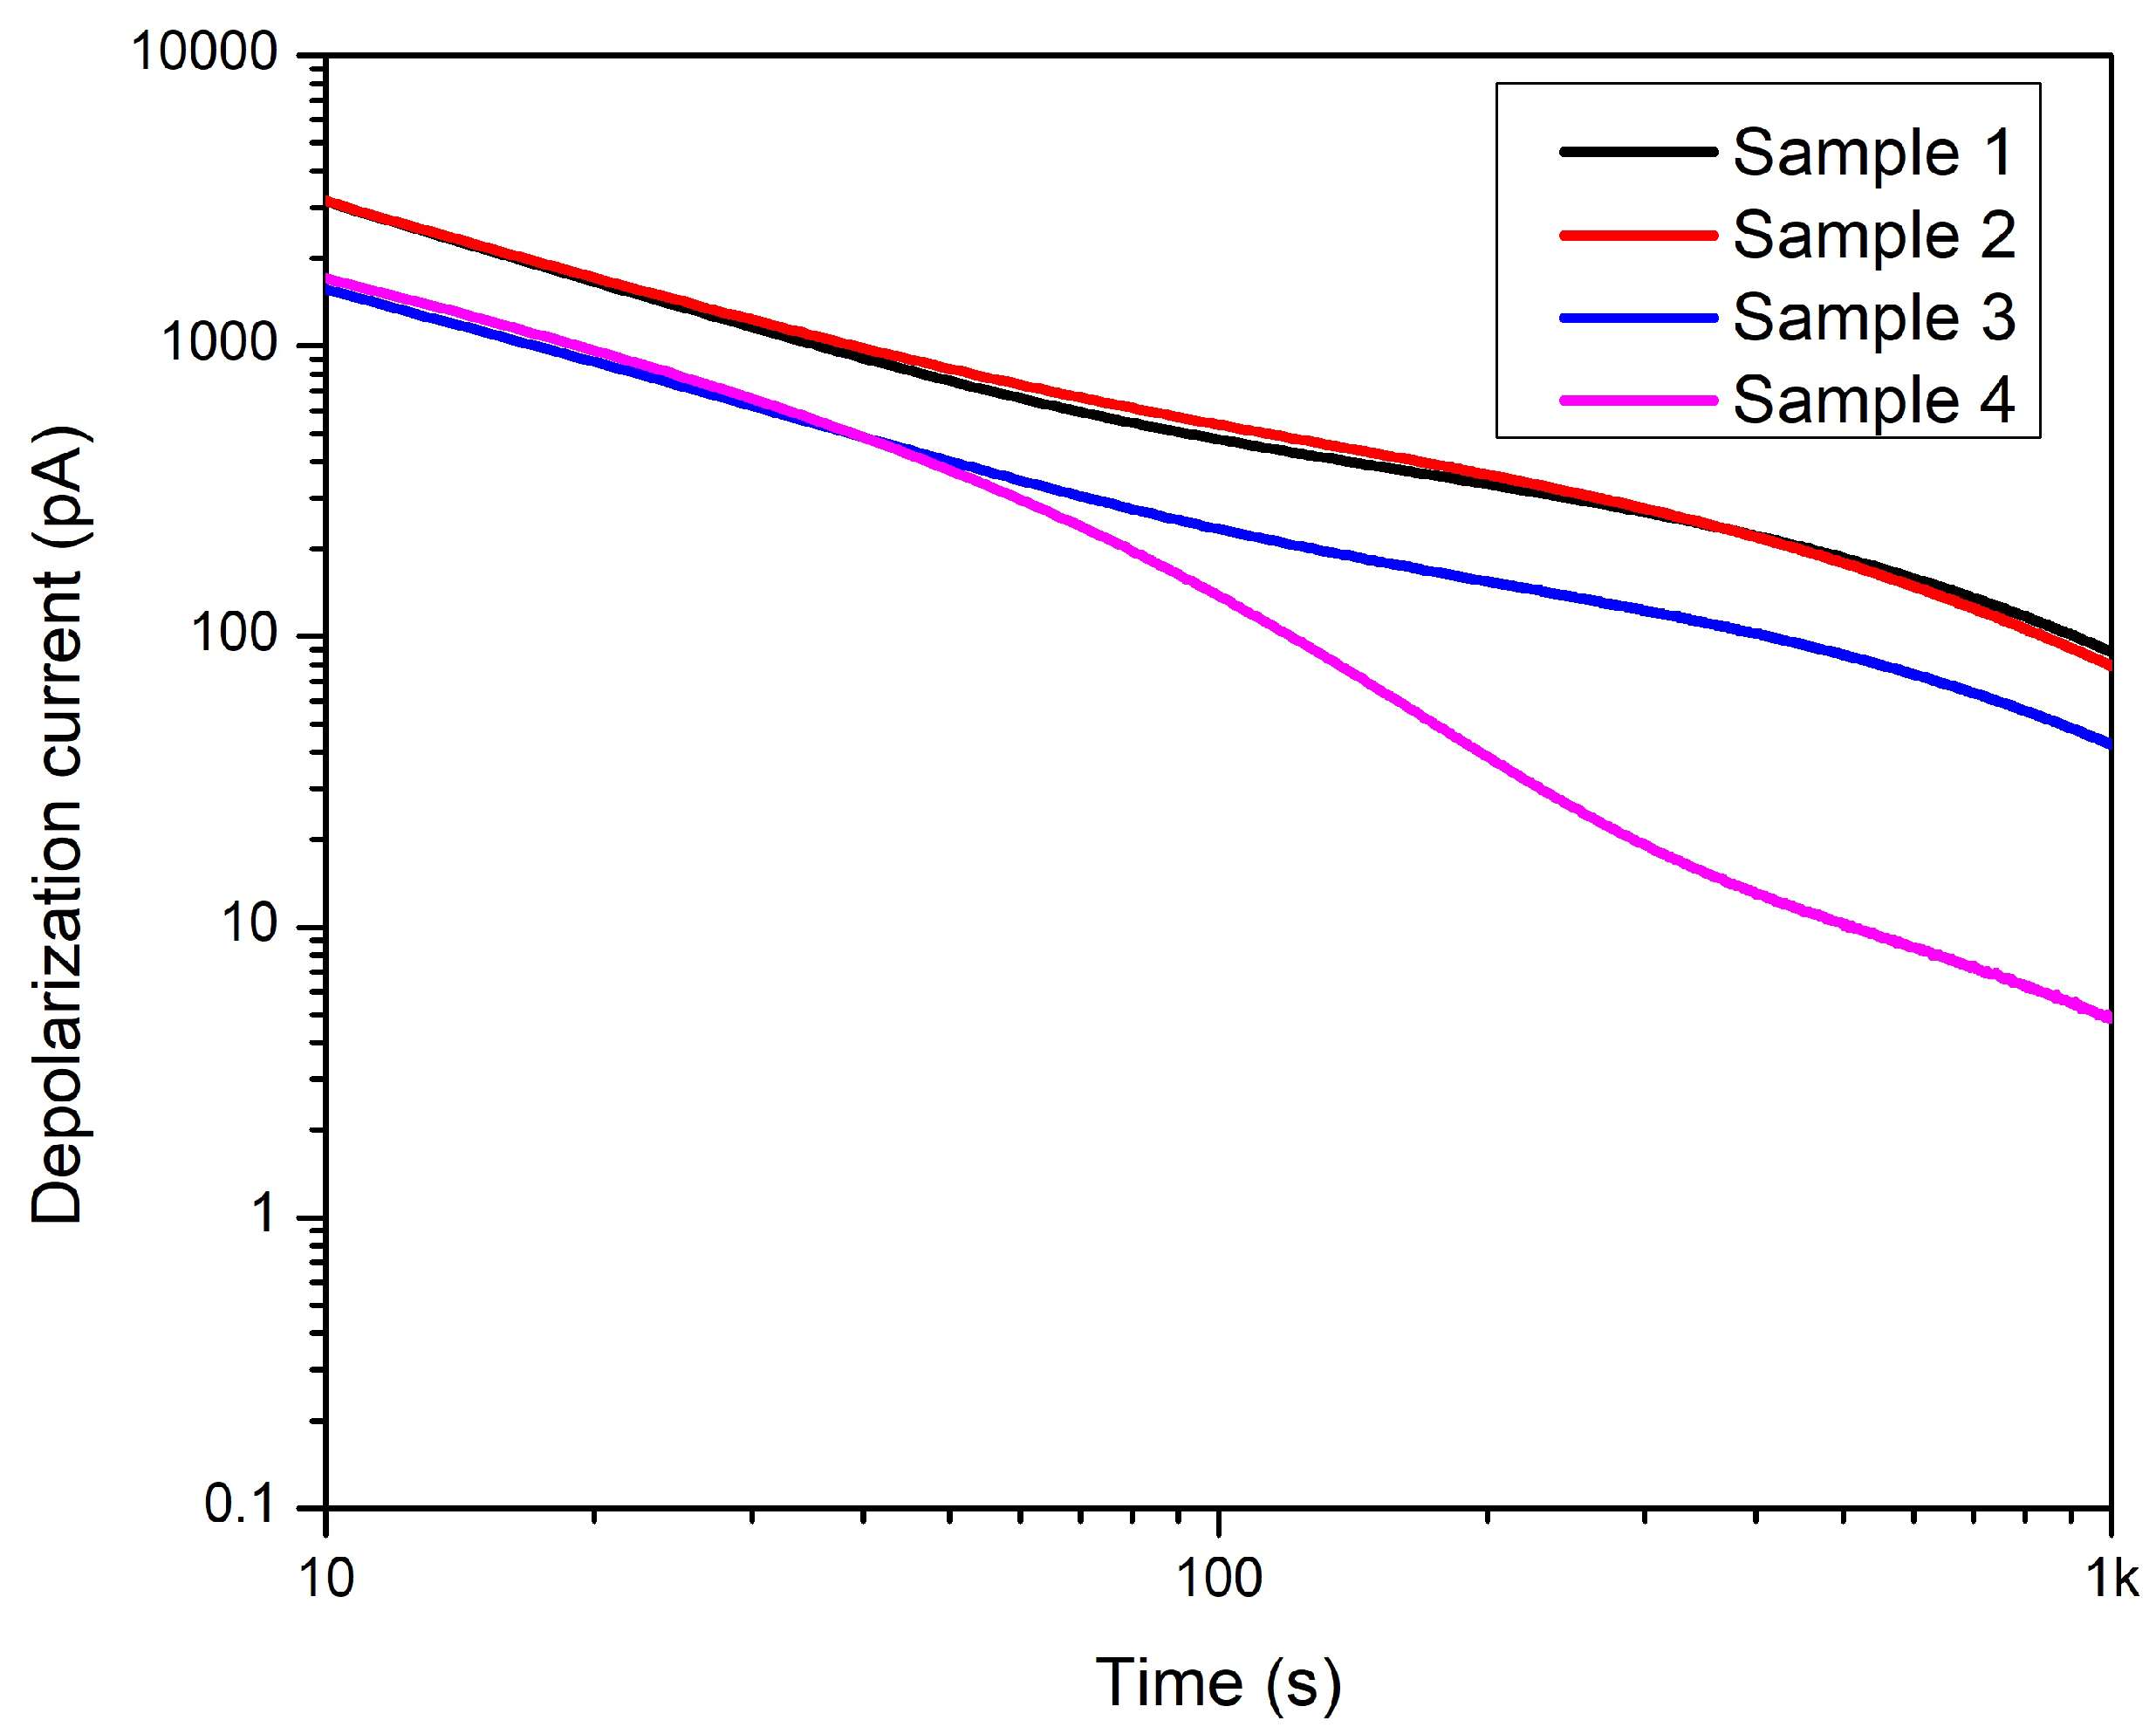
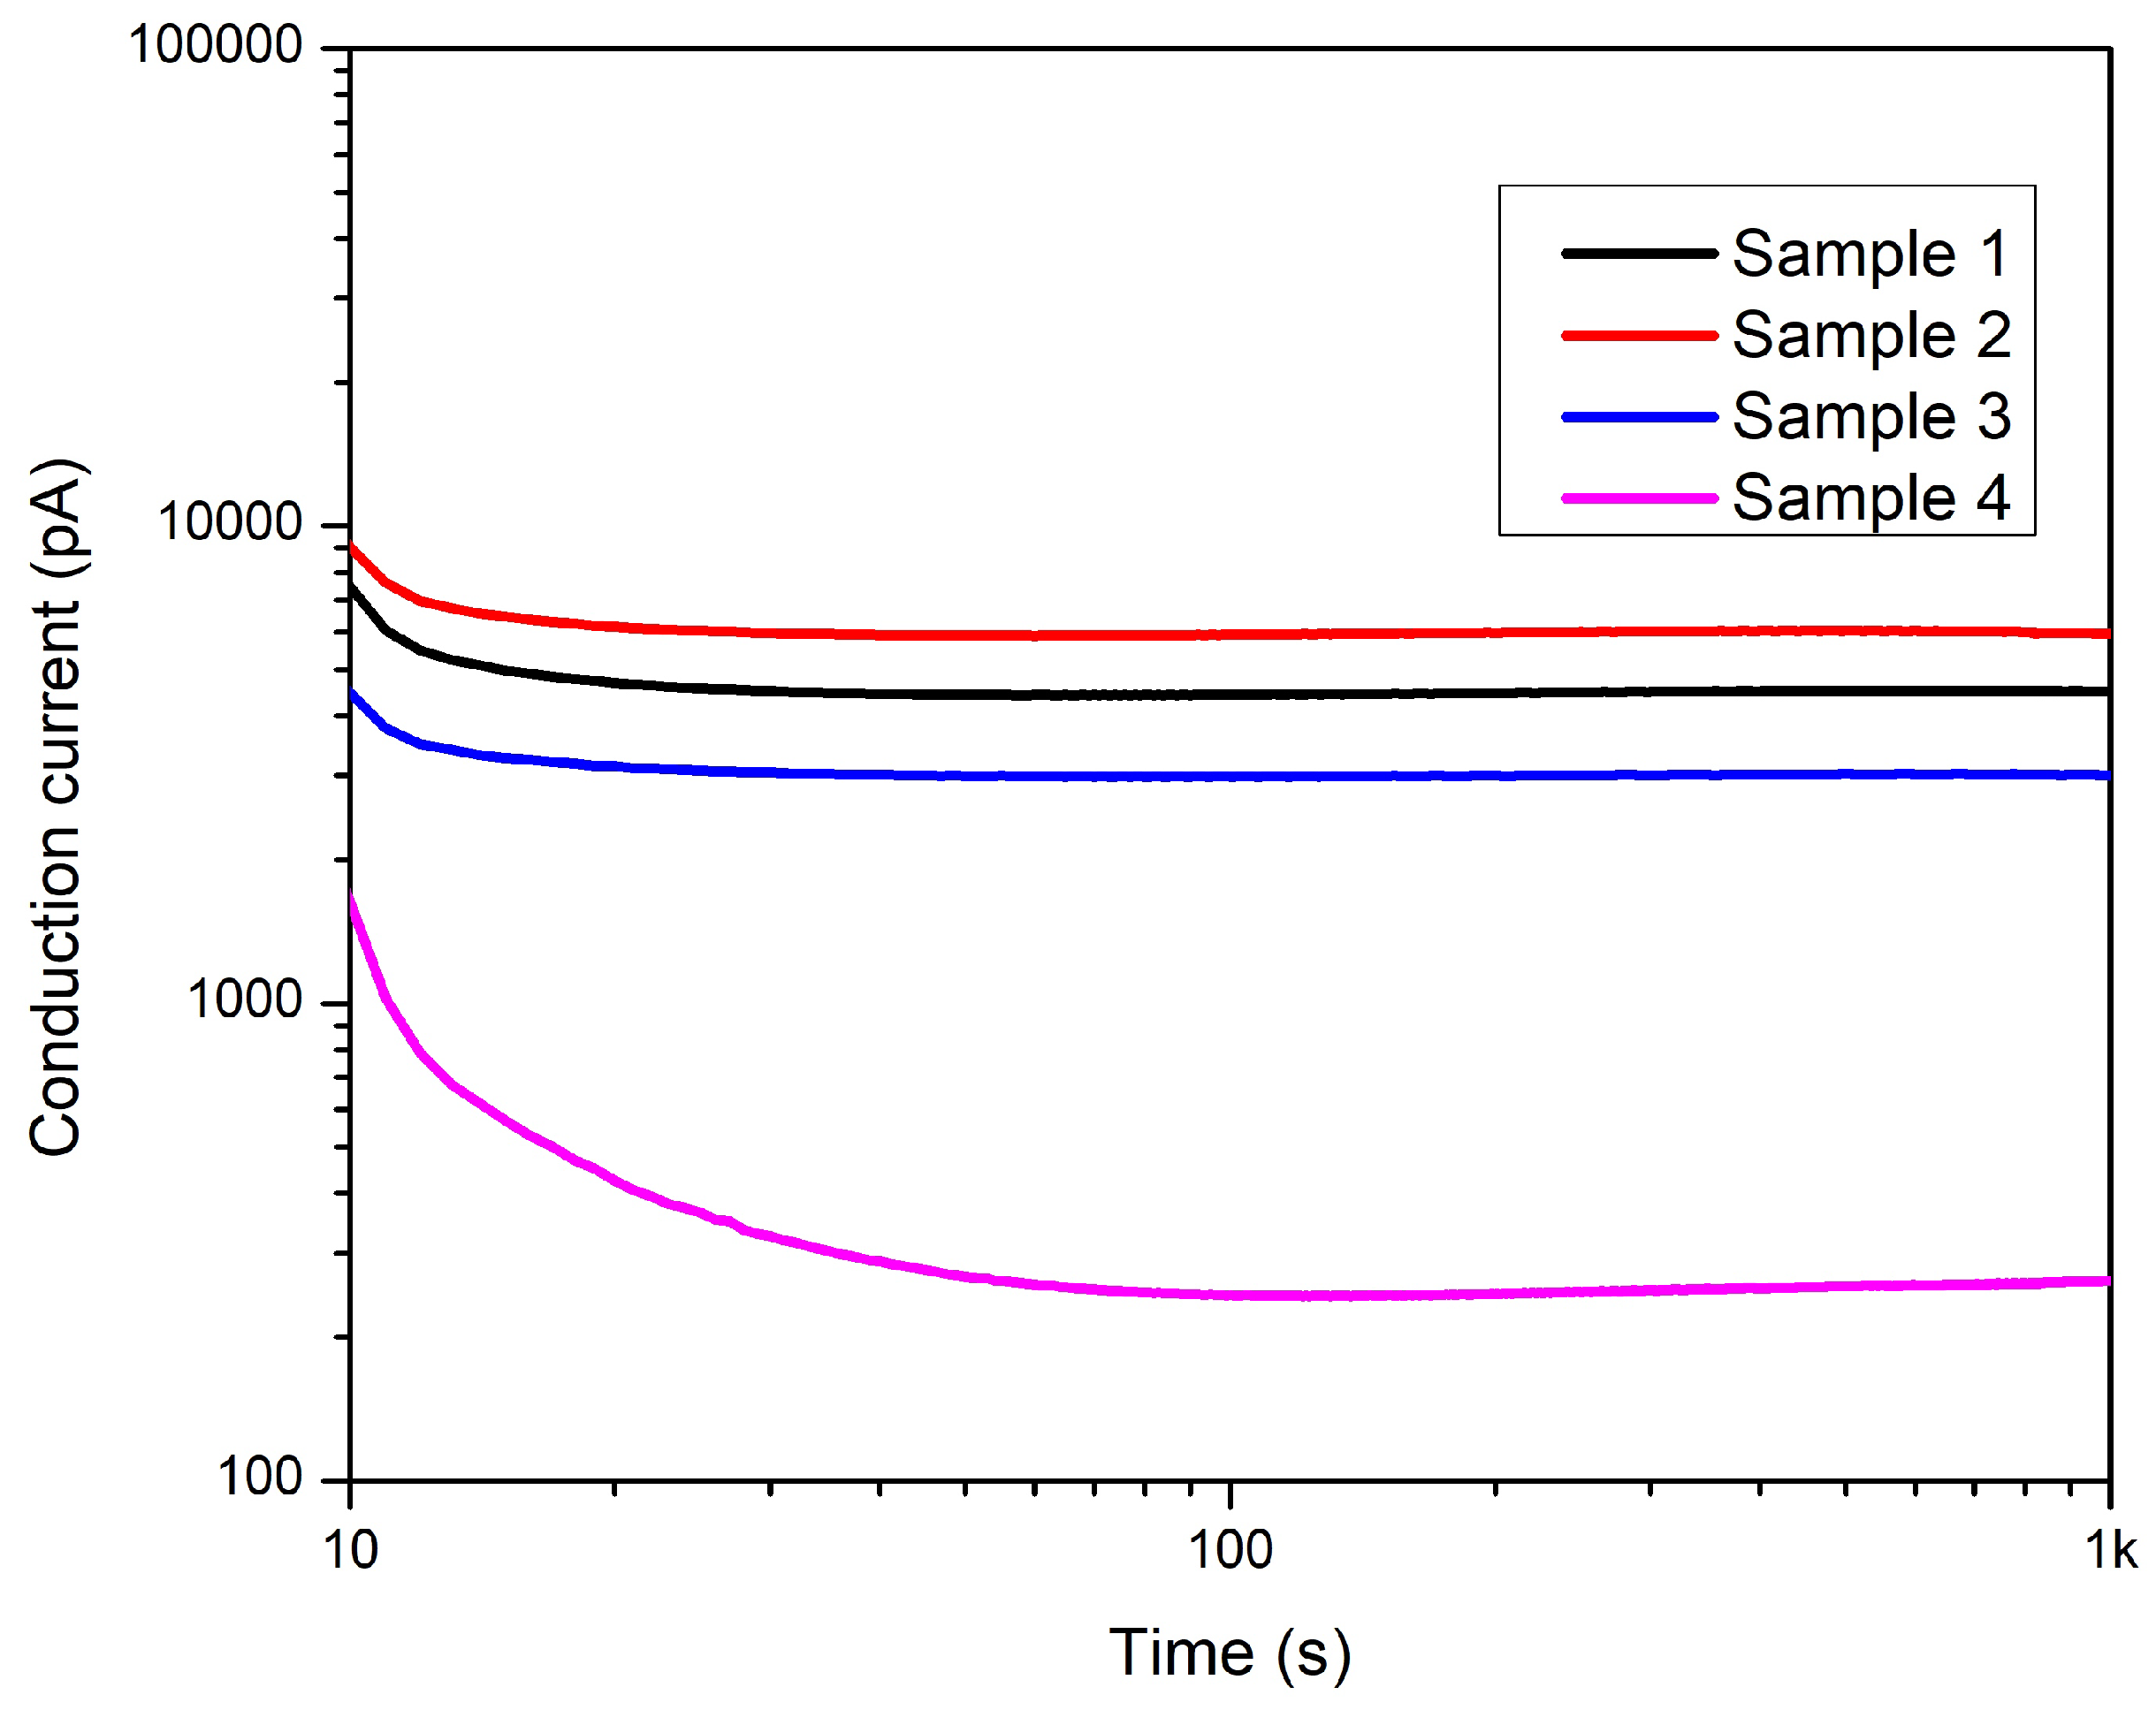
Figure 21,
Figure 22 and
Figure 23 depict the polarization, depolarization and conduction currents for all four samples. It is understood that removing the cable layers affects polarization, depolarization, and conduction currents. Therefore, the polarization process is affected by the structure change. The most significant difference can be seen in Sample 4 compared to the intact sample, namely, Sample 1. In the case of samples 1, 2, and 3, the conductors are covered with a PVC belt. However,
Table 1 indicates that sample 4 this PVC belt has been removed from Sample 4. Removing the PVC belting could cause easier movement of the plasticizer and evaporation from the core insulation. The lower concentration of the plasticizer molecules, the less conductivity. Therefore, the conduction current has reduced.
Since the specific conductivity cannot be calculated, each sample’s before and after aging conductive currents must be compared to assess the conductivity change due to aging. Therefore the rates of conductive currents at 1000 s after and before aging were calculated. The results and the before and after aging conductive currents values at 1000 s are in
Table 2.
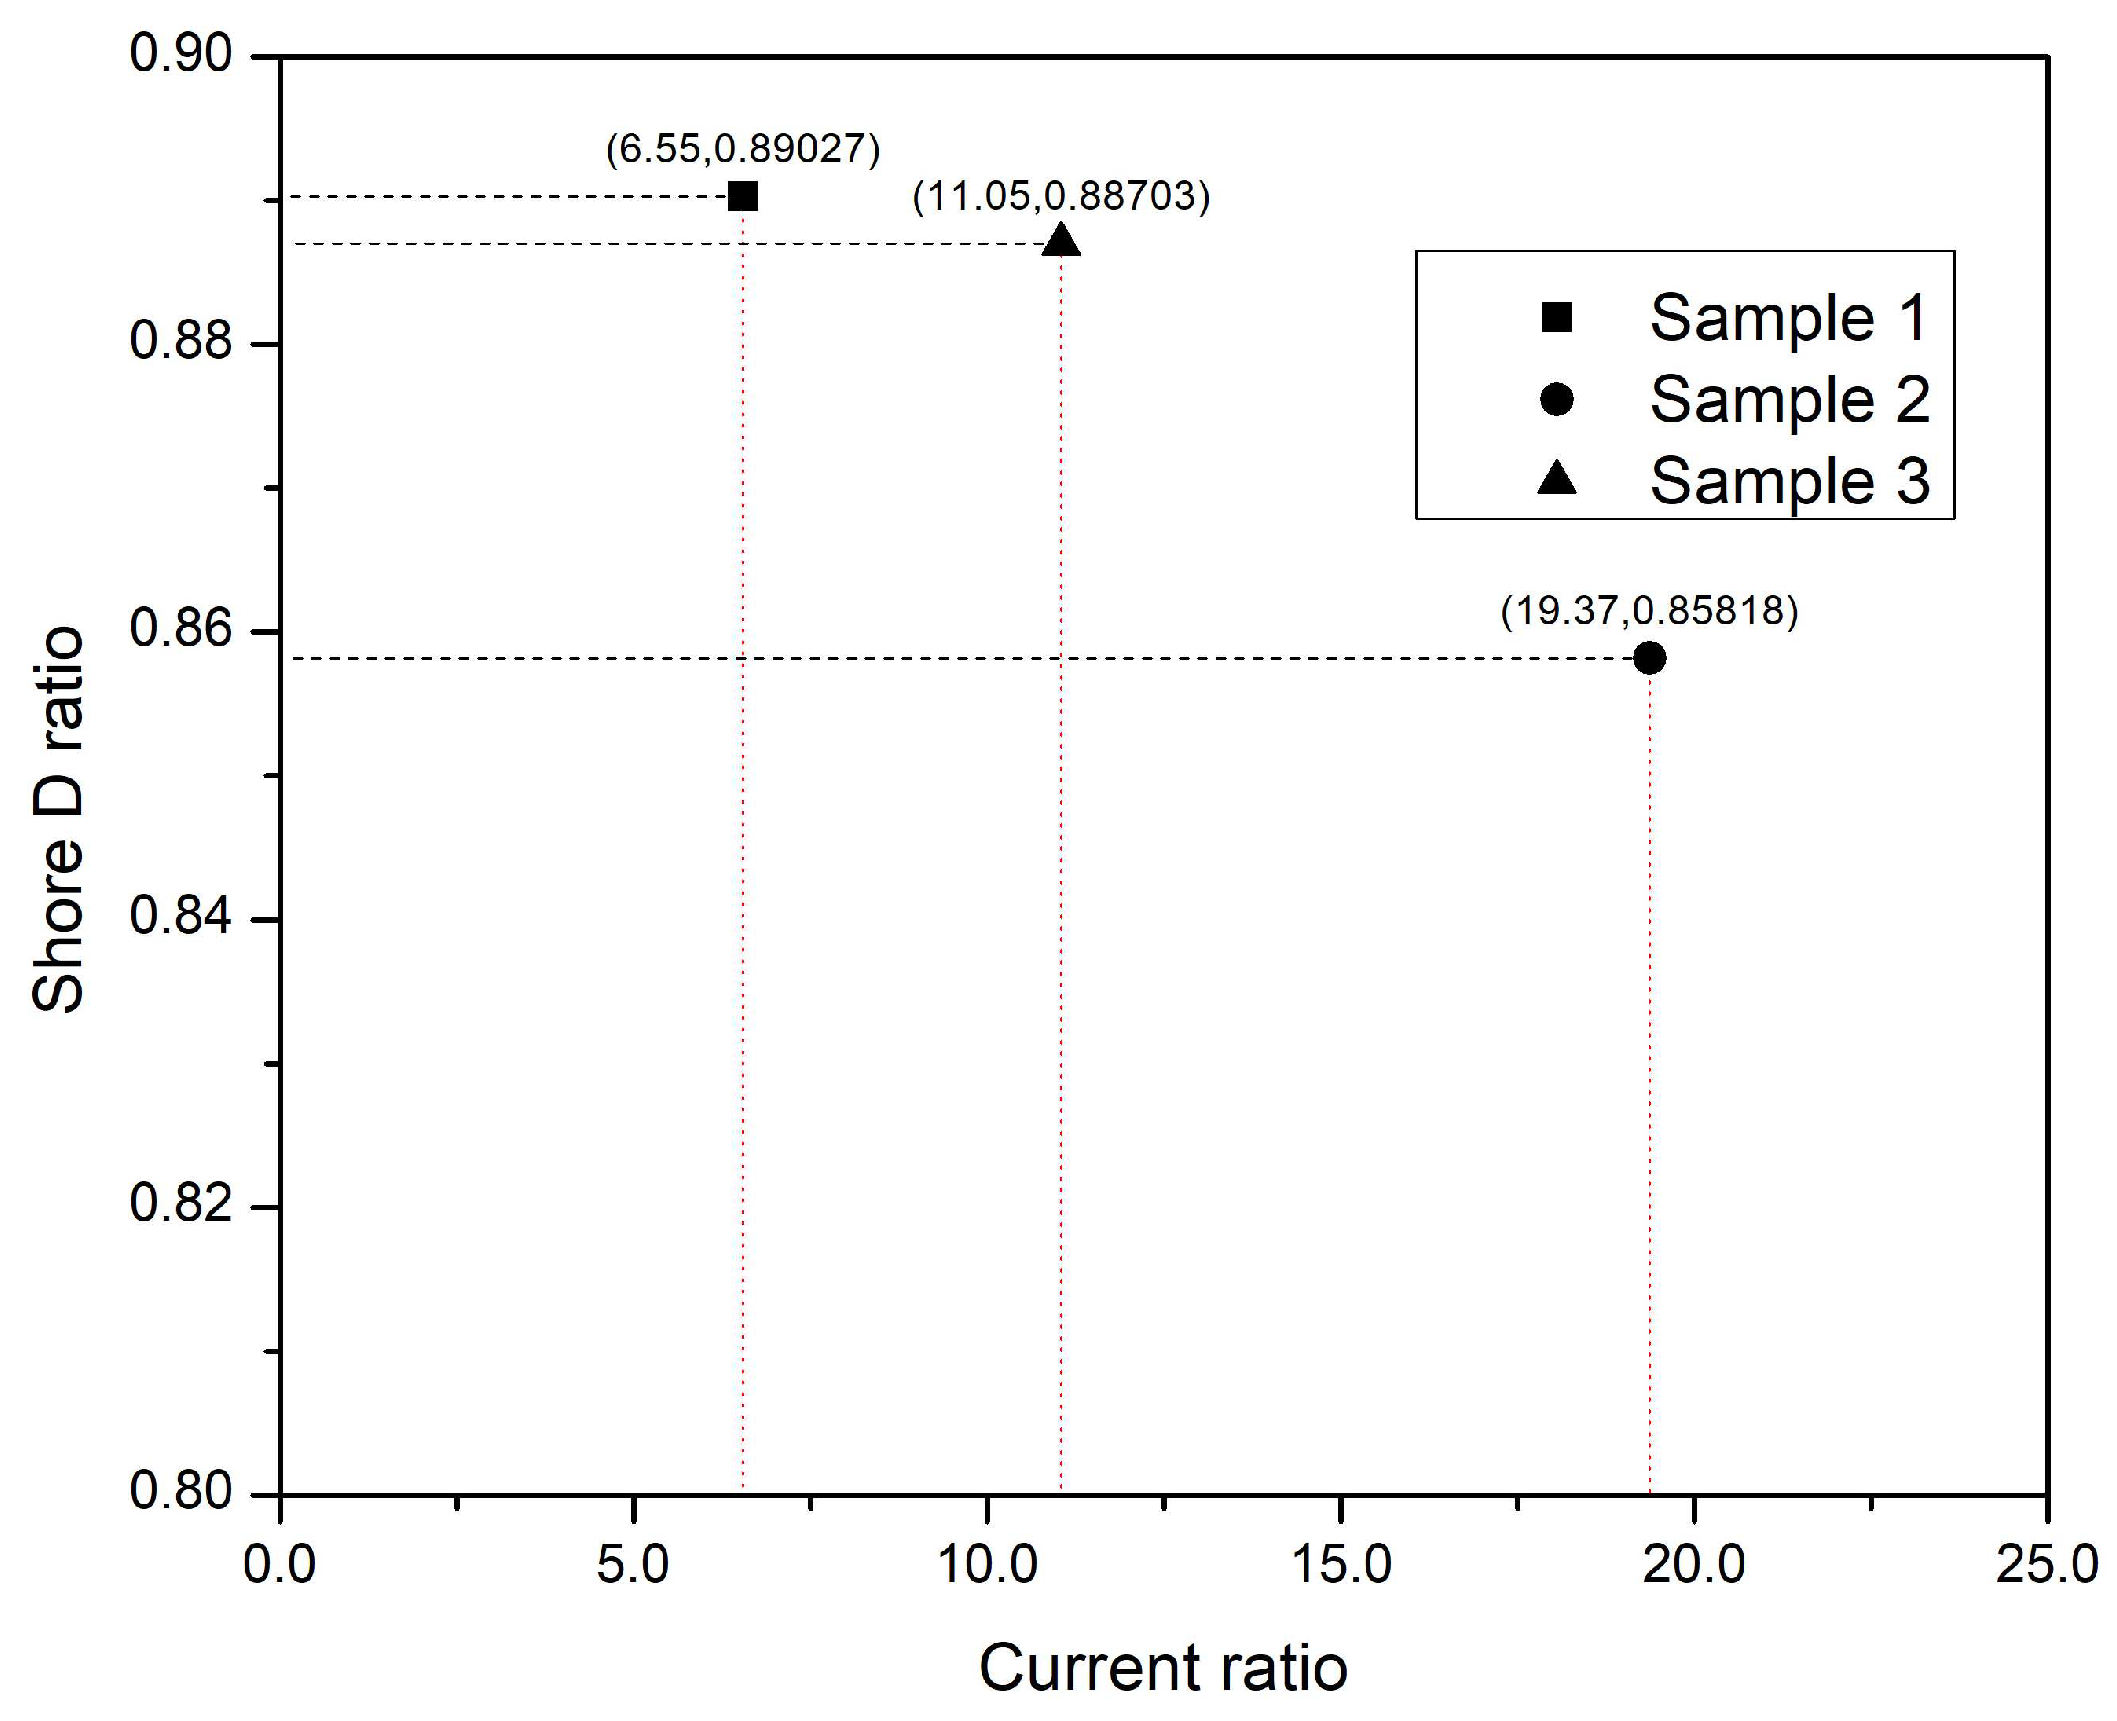
The results show that the highest increase (by 19.37 times) of conductive current can be observed in Sample 2, where the PVC jacket is removed, and both the aluminum tape and the PVC belting layers cover the cores. 11.05 times increment of conductive current was observed in Sample 3. In this sample, only the PVC belting layer covers the cores. In the intact sample, i.e., Sample 1, the conductive current increased by 6.55 times after aging, while in the case of Sample 4, with no covered conductors, the conduction current increased by 4.31 times.
4.3. Shore D Hardness
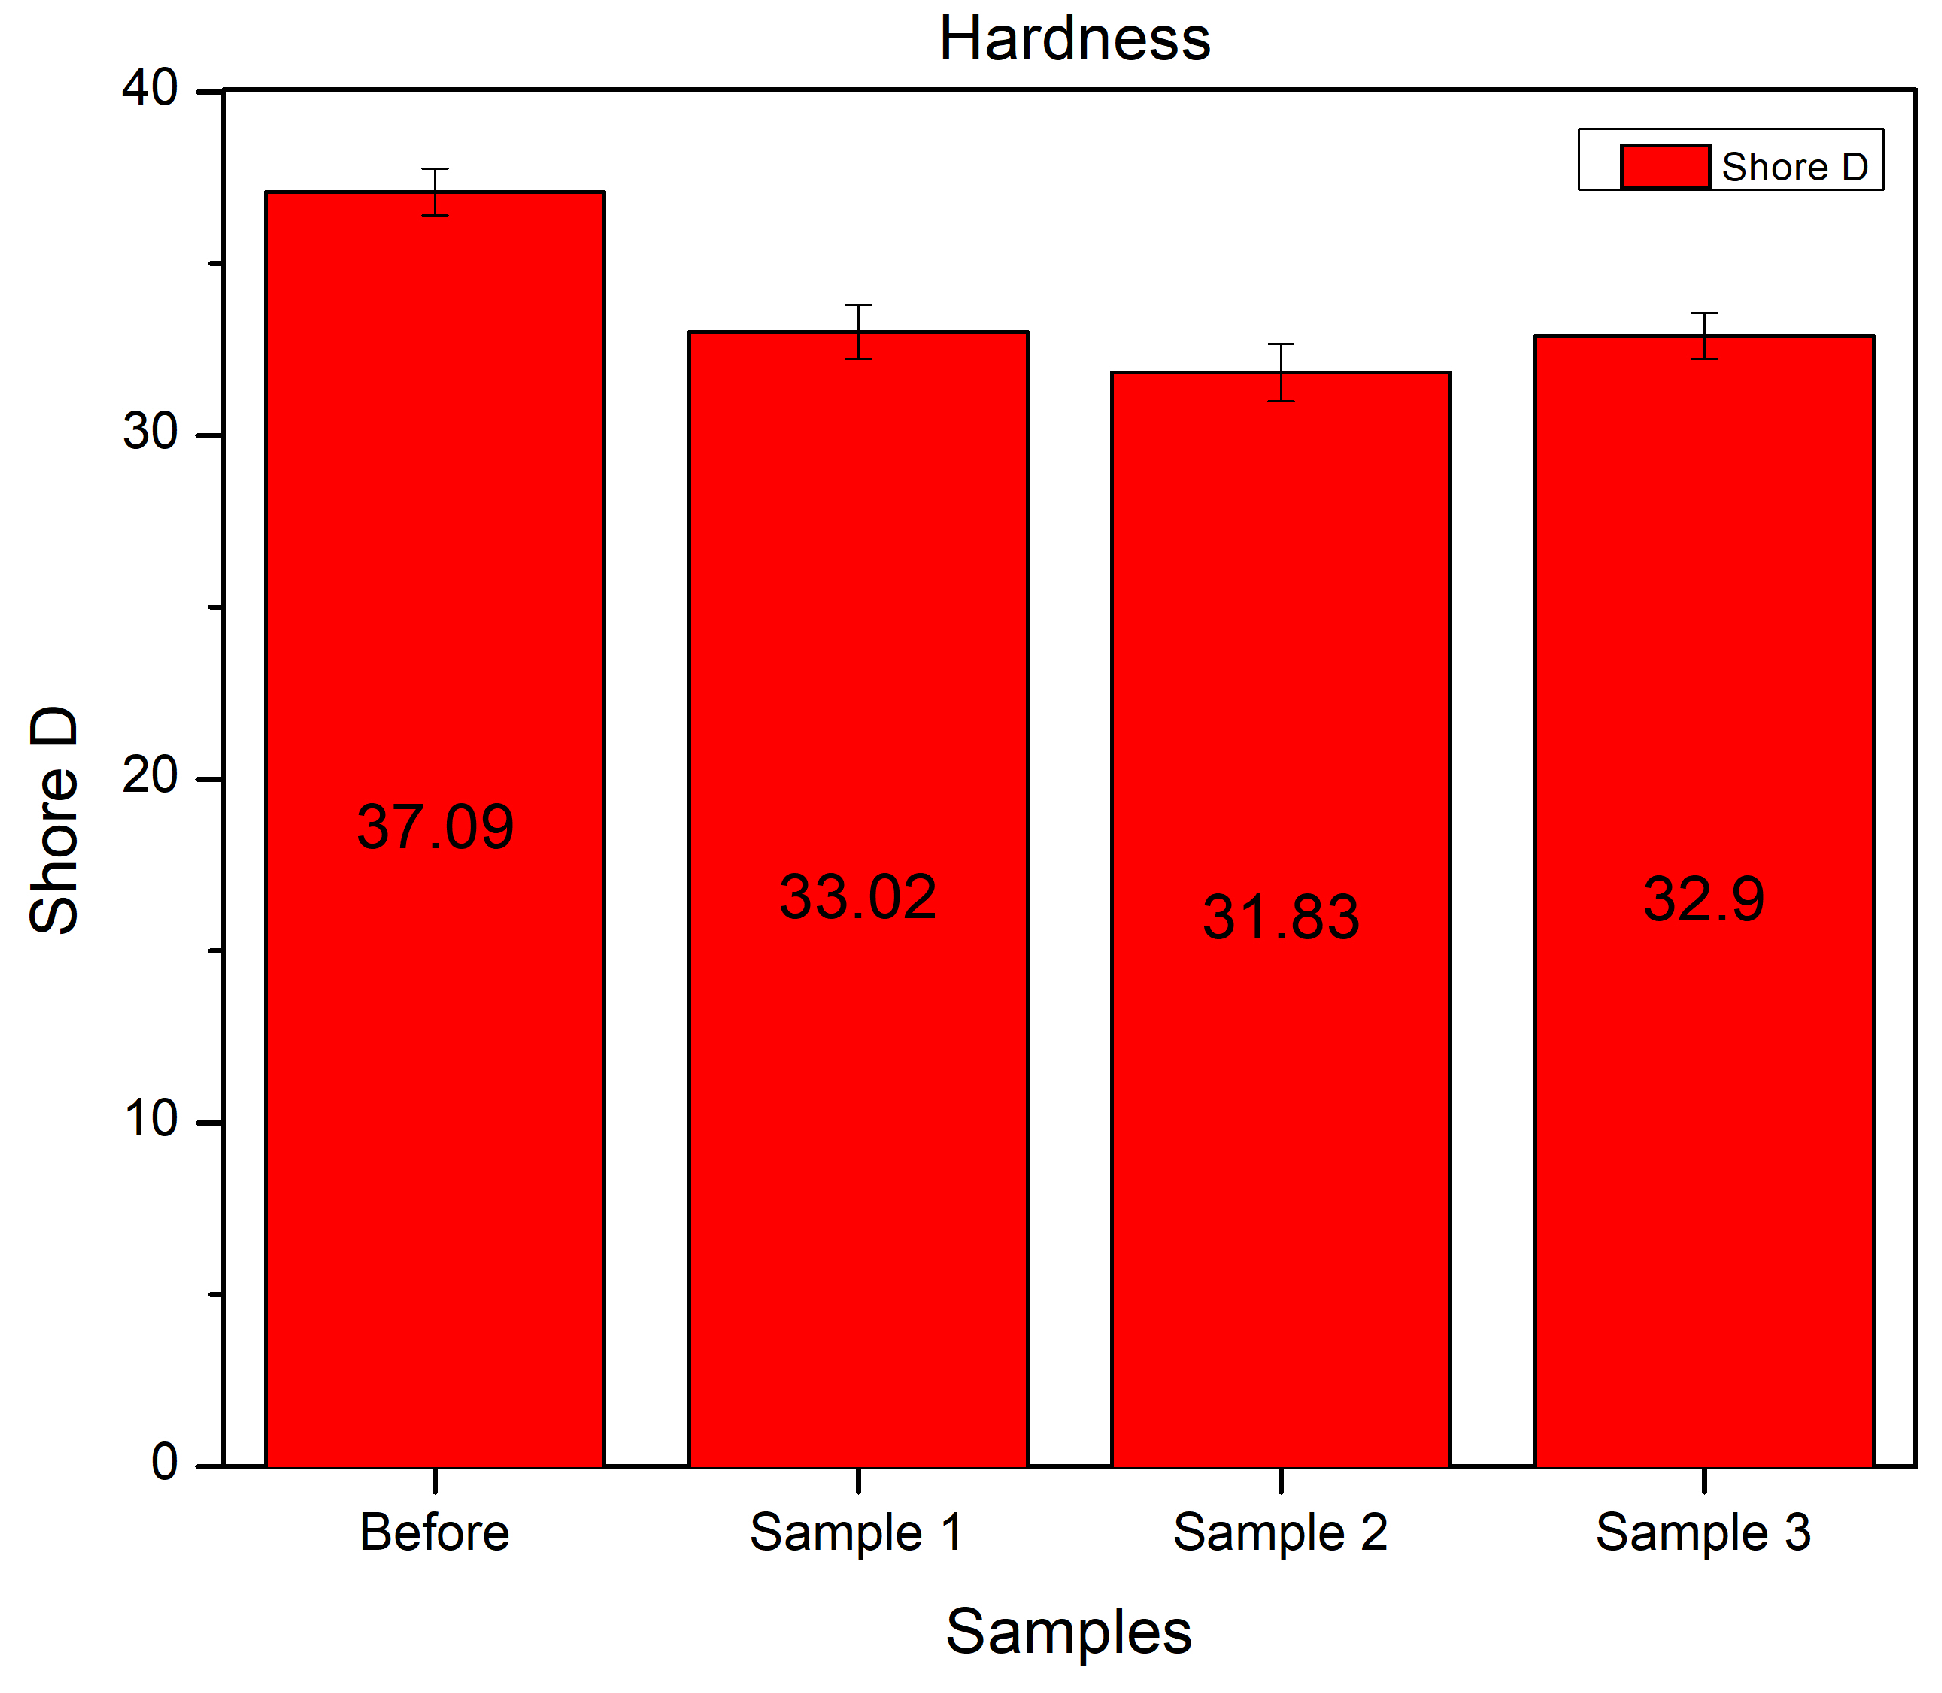
The results of the Shore D hardness measurements of PVC belting layers are depicted in
Figure 24. The sample before aging exhibits the highest hardness. In Sample 1, the hardness decreased after aging, and Sample 2 had the lowest Shore D hardness. Surprisingly, the hardness of Sample 3 is higher than that of Sample 2.
It is well known that long thermal aging increases the hardness of the PVC due to the evaporation of the plasticizer; however, earlier studies have shown softening of PVC cable insulation at the beginning of the aging before the hardness would have started to increase [
13]. In this experiment, the aging times were the same for all samples, but the belt layers of the different samples were exposed to the atmosphere of the aging chamber to different extents: In Sample 1, the belting layer was covered by the jacket and aluminum tape. Only the aluminum tape covered the belting layer in Sample 2, while Sample 3’s belting layer could freely come into contact with air. Since the presence of oxygen increases the degradation of the PVC, it probably caused the different hardnesses of the samples after aging [
48,
49]. However, the softening of the PVC at the beginning of the thermal aging can also be caused by the annealing effect [
51,
52]. At the beginning of the aging, the annealing and the plasticizer loss arise in parallel. At the same time, dehydrochlorination only takes effect in the later aging phase at such a low temperature used for aging in this experiment. Therefore the combination of the effects of annealing and the plasticizer loss determines the hardness of the PVC belting layer in the cable insulation system. Since the structure of the cable samples intensively affects the evaporation of the plasticizer, structural changes affect the hardness of the PVC belt layer through this process.
Nevertheless, the plasticizer can evaporate the easiest way from the belting layer of Sample 3. Based on the earliest studies at the beginning of aging, the effect of annealing on the hardness of the PVC overweights the impact of plasticizer loss. Later the effect of plasticizer loss becomes more dominant, so the material starts to harden.
Similarly to the conductive current, the ratio of before and after aging Shore D values can also be calculated, and the results are in
Table 3.
The Shore D hardnesses’ ratios show a similar change to the conductive current ratios. The greatest change of Shore D hardness can be observed in the case of Sample 2, while the lowest is in Sample 1. The change ratio of Sample 3 is between them.
The variables are plotted to a scatter-plot to observe the relationship between the before and after aging ratios of conductive current and Shore D hardness (
Figure 25).
The figure shows a clear relationship between the change of conductive current and Shore D hardness; however, the number of points is insufficient for correlation analysis. For this purpose, the experiments should be repeated with more aging rounds to reveal the link between the results of dielectric measurements and the mechanical properties of the belting layer. However, this kind of examination requires a large number of samples since the cable samples would have to be dismantled to test the hardness of the belting layers. Nevertheless, previous studies have shown clear evidence between the Shore D hardness and the dielectric properties of PVC cable insulation.
5. Conclusions
Short-term overloads and short-circuit operations raise the temperature above the maximum operating limit, damaging the cable insulation and shortening the lifespan. In case of these short-term temperature rises, the temperature distribution on the cable is not even. Therefore, the cable components are not degraded evenly and similarly. Short-term overloads and short-circuit operations raise the temperature above the maximum operating limit, damaging the cable insulation and shortening the lifespan. In case of these short-term temperature rises, the temperature distribution on the cable is not even. Therefore, the cable components are not degraded evenly and similarly. The effect of component degradation on the dielectric spectrum was investigated, for this purpose four samples were prepared. One was intact. Only the jacket was removed from the second one. Besides the jacket, the aluminum tape layer was removed from the third one. In addition, the PVC belting layer was removed from the fourth sample. Dielectric parameters were measured by FDS and PDC techniques, and the Shore D hardness was also tested on the PVC belting layer. Before aging, measurements reveal that the compression pressure of the PVC jacket on the inner cable structure significantly affects the low-frequency tan delta values. Because after removing the jacket, the tan delta decreased. This fact is also reflected in the PDC measurement results after calculating the conductive current. Due to the lower compression force, the decrease of the contact surfaces between the polymeric components can explain it. Another important finding of the comparison of dielectric parameters after structure change is that the capacitance measurements show that the PVC belting layer is the most dominant component in the dielectric behavior of this kind of cable. After removing this thin layer, the capacitance values were changed significantly. The after-aging measurements proved the dominant effect of the PVC belting layer. Moreover, this layer provides enough protection from the environmental air. Since after removing this layer, plasticizer evaporation can occur more easily. The results of the Shore D hardness measurement also proved this and the change of conductive current correlation with the Shore D hardness changing of the belting layer. The study results revealed that the PVC belting layer is an important component of PVC-insulated power cables if they are exposed to repetitive thermal aging caused by cyclic overloads.
Author Contributions
Conceptualization, S.B. and Z.A.T.; methodology, S.B.; formal analysis, S.B. and Z.A.T.; investigation, S.B.; resources, S.B.; writing—original draft preparation, S.B. and Z.A.T.; writing—review and editing, Z.A.T.; visualization, S.B. and Z.A.T.; supervision, Z.A.T.; funding acquisition, Z.A.T. All authors have read and agreed to the published version of the manuscript.
Funding
Project no. 123672 was implemented with support provided by the National Research, Development, and Innovation Fund of Hungary, financed under the KNN_16 funding scheme.
Institutional Review Board Statement
Not applicable.
Informed Consent Statement
Not applicable.
Data Availability Statement
The data presented in this study are available on request from the corresponding author.
Conflicts of Interest
The authors declare no conflict of interest.
Appendix A. Results of the FDS Measurement
Appendix A.1. Capacitance of Samples
Figure A1.
Capacitances of the samples after each aging round.
Figure A1.
Capacitances of the samples after each aging round.
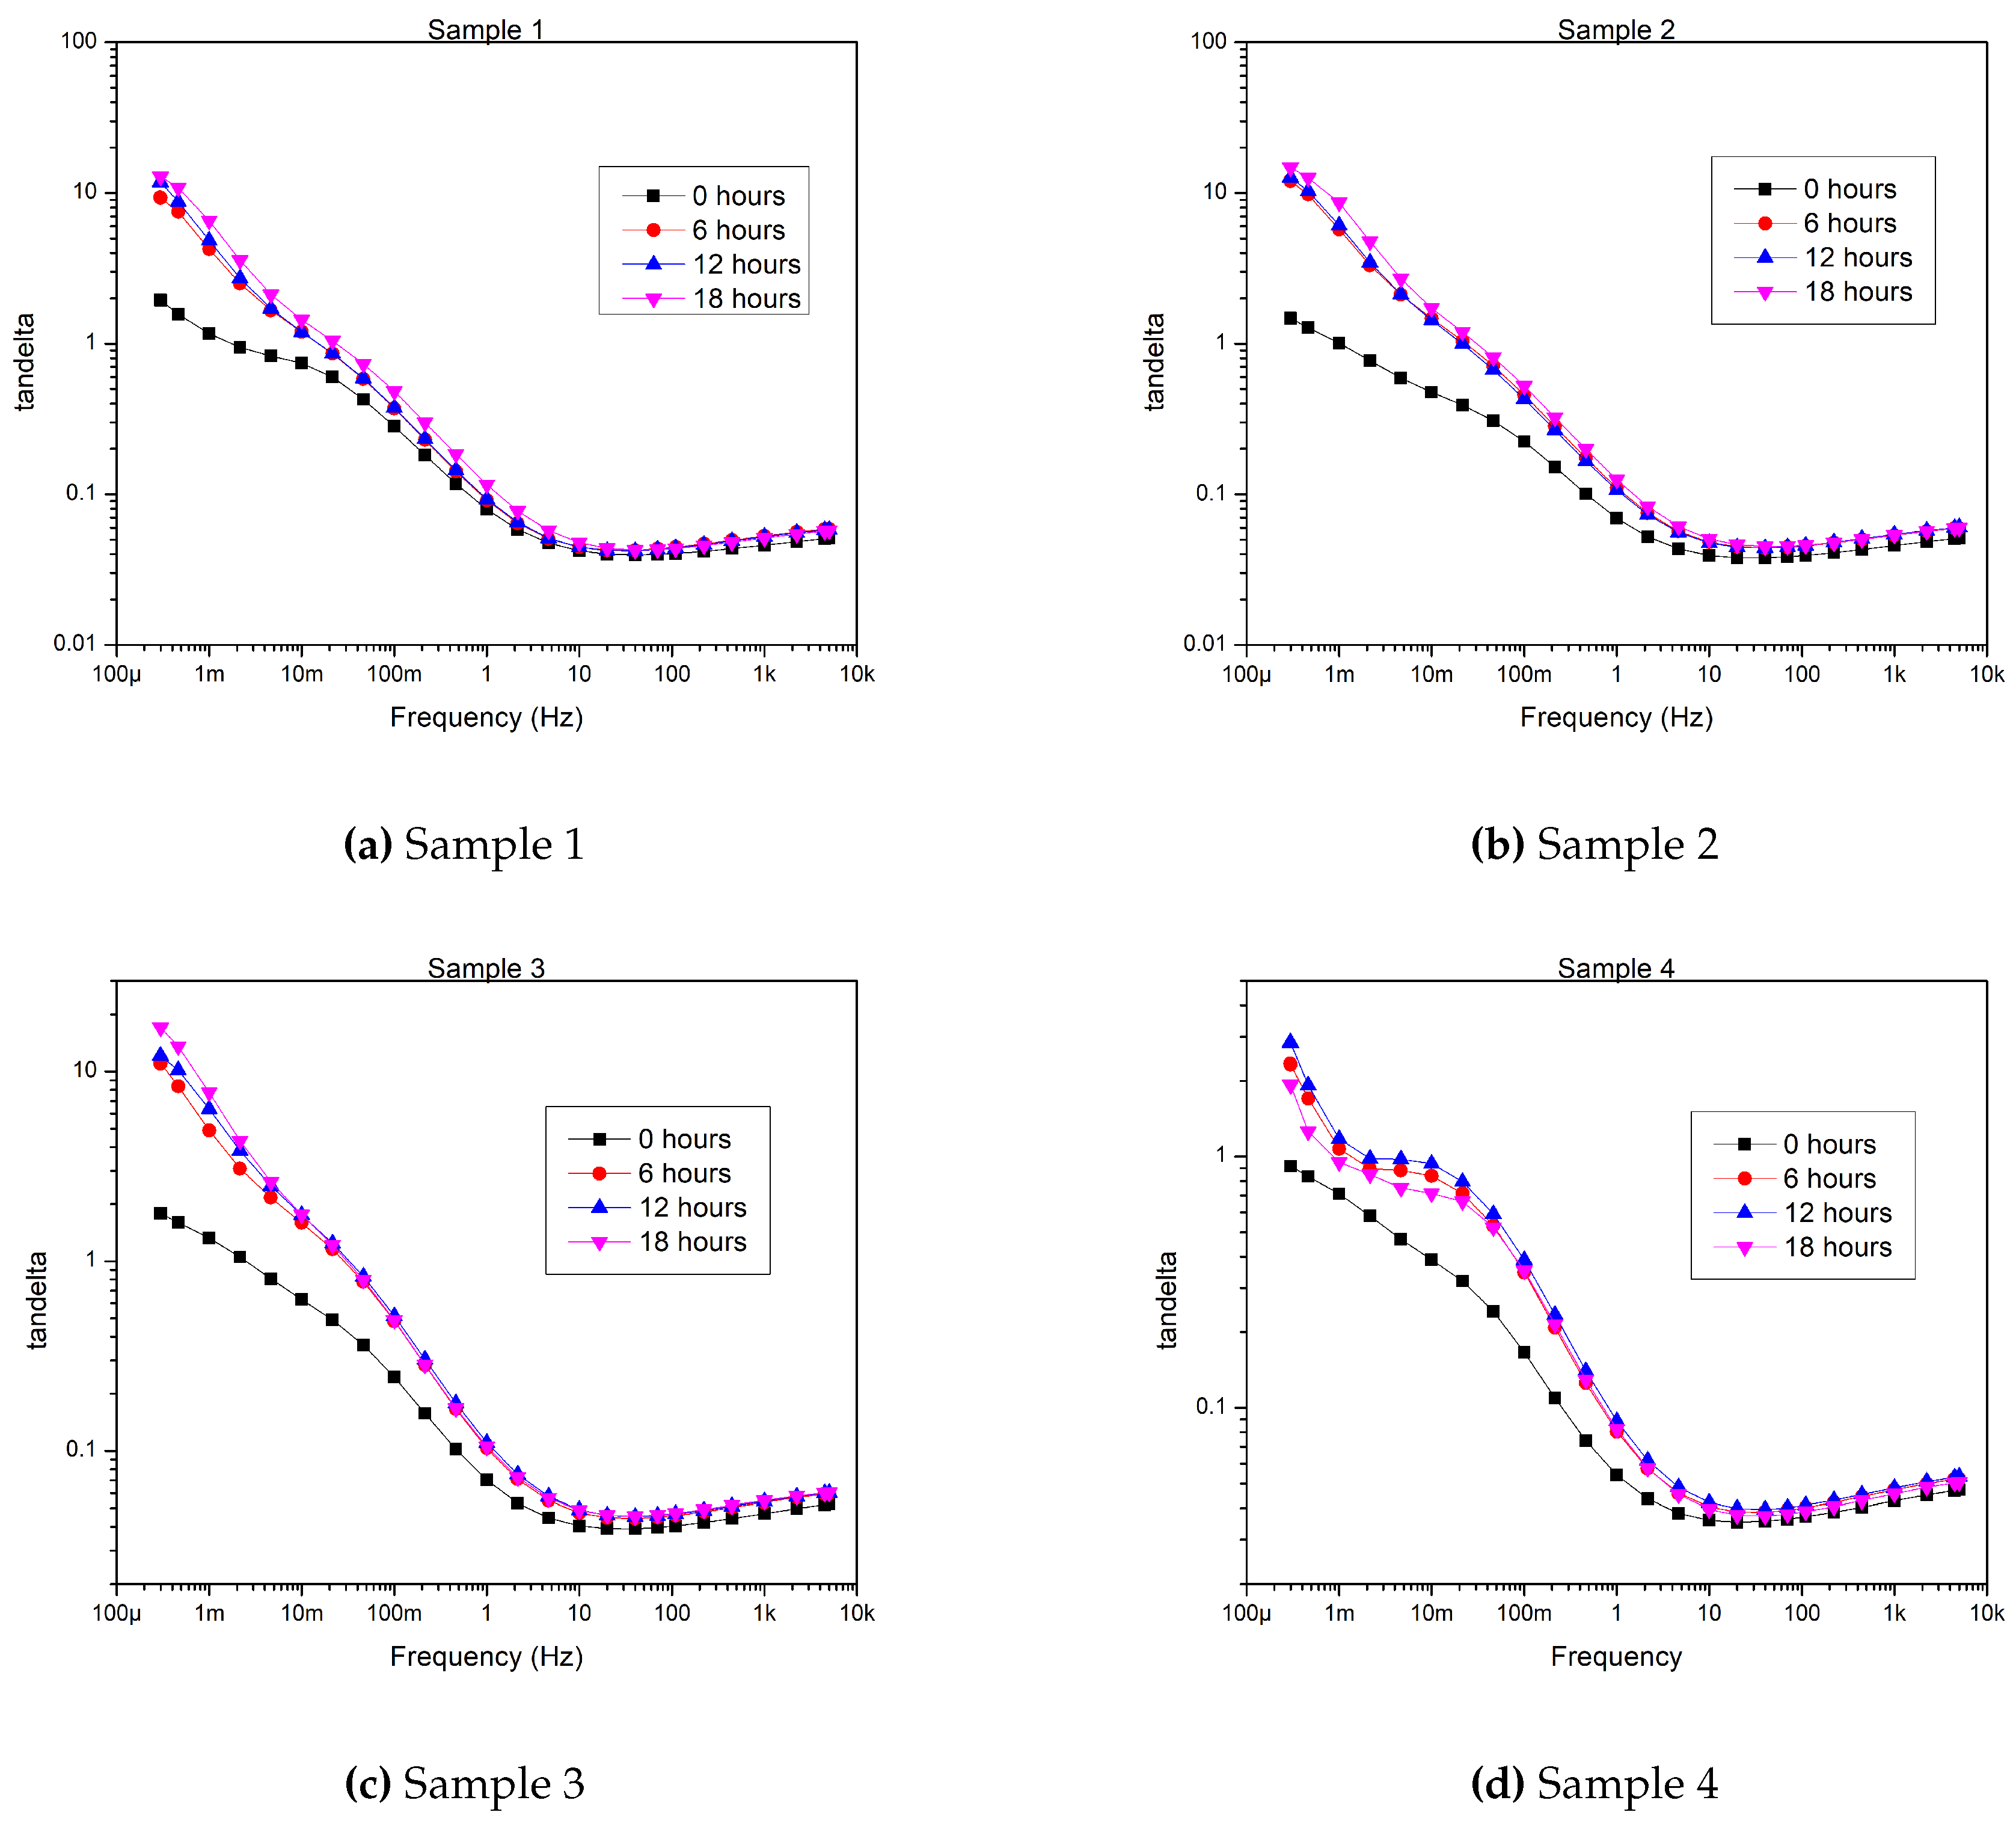
Appendix A.2. Tan δ of Samples
Figure A2.
Tan values of the samples after each aging round.
Figure A2.
Tan values of the samples after each aging round.
Appendix B. Results of the PDC Measurement
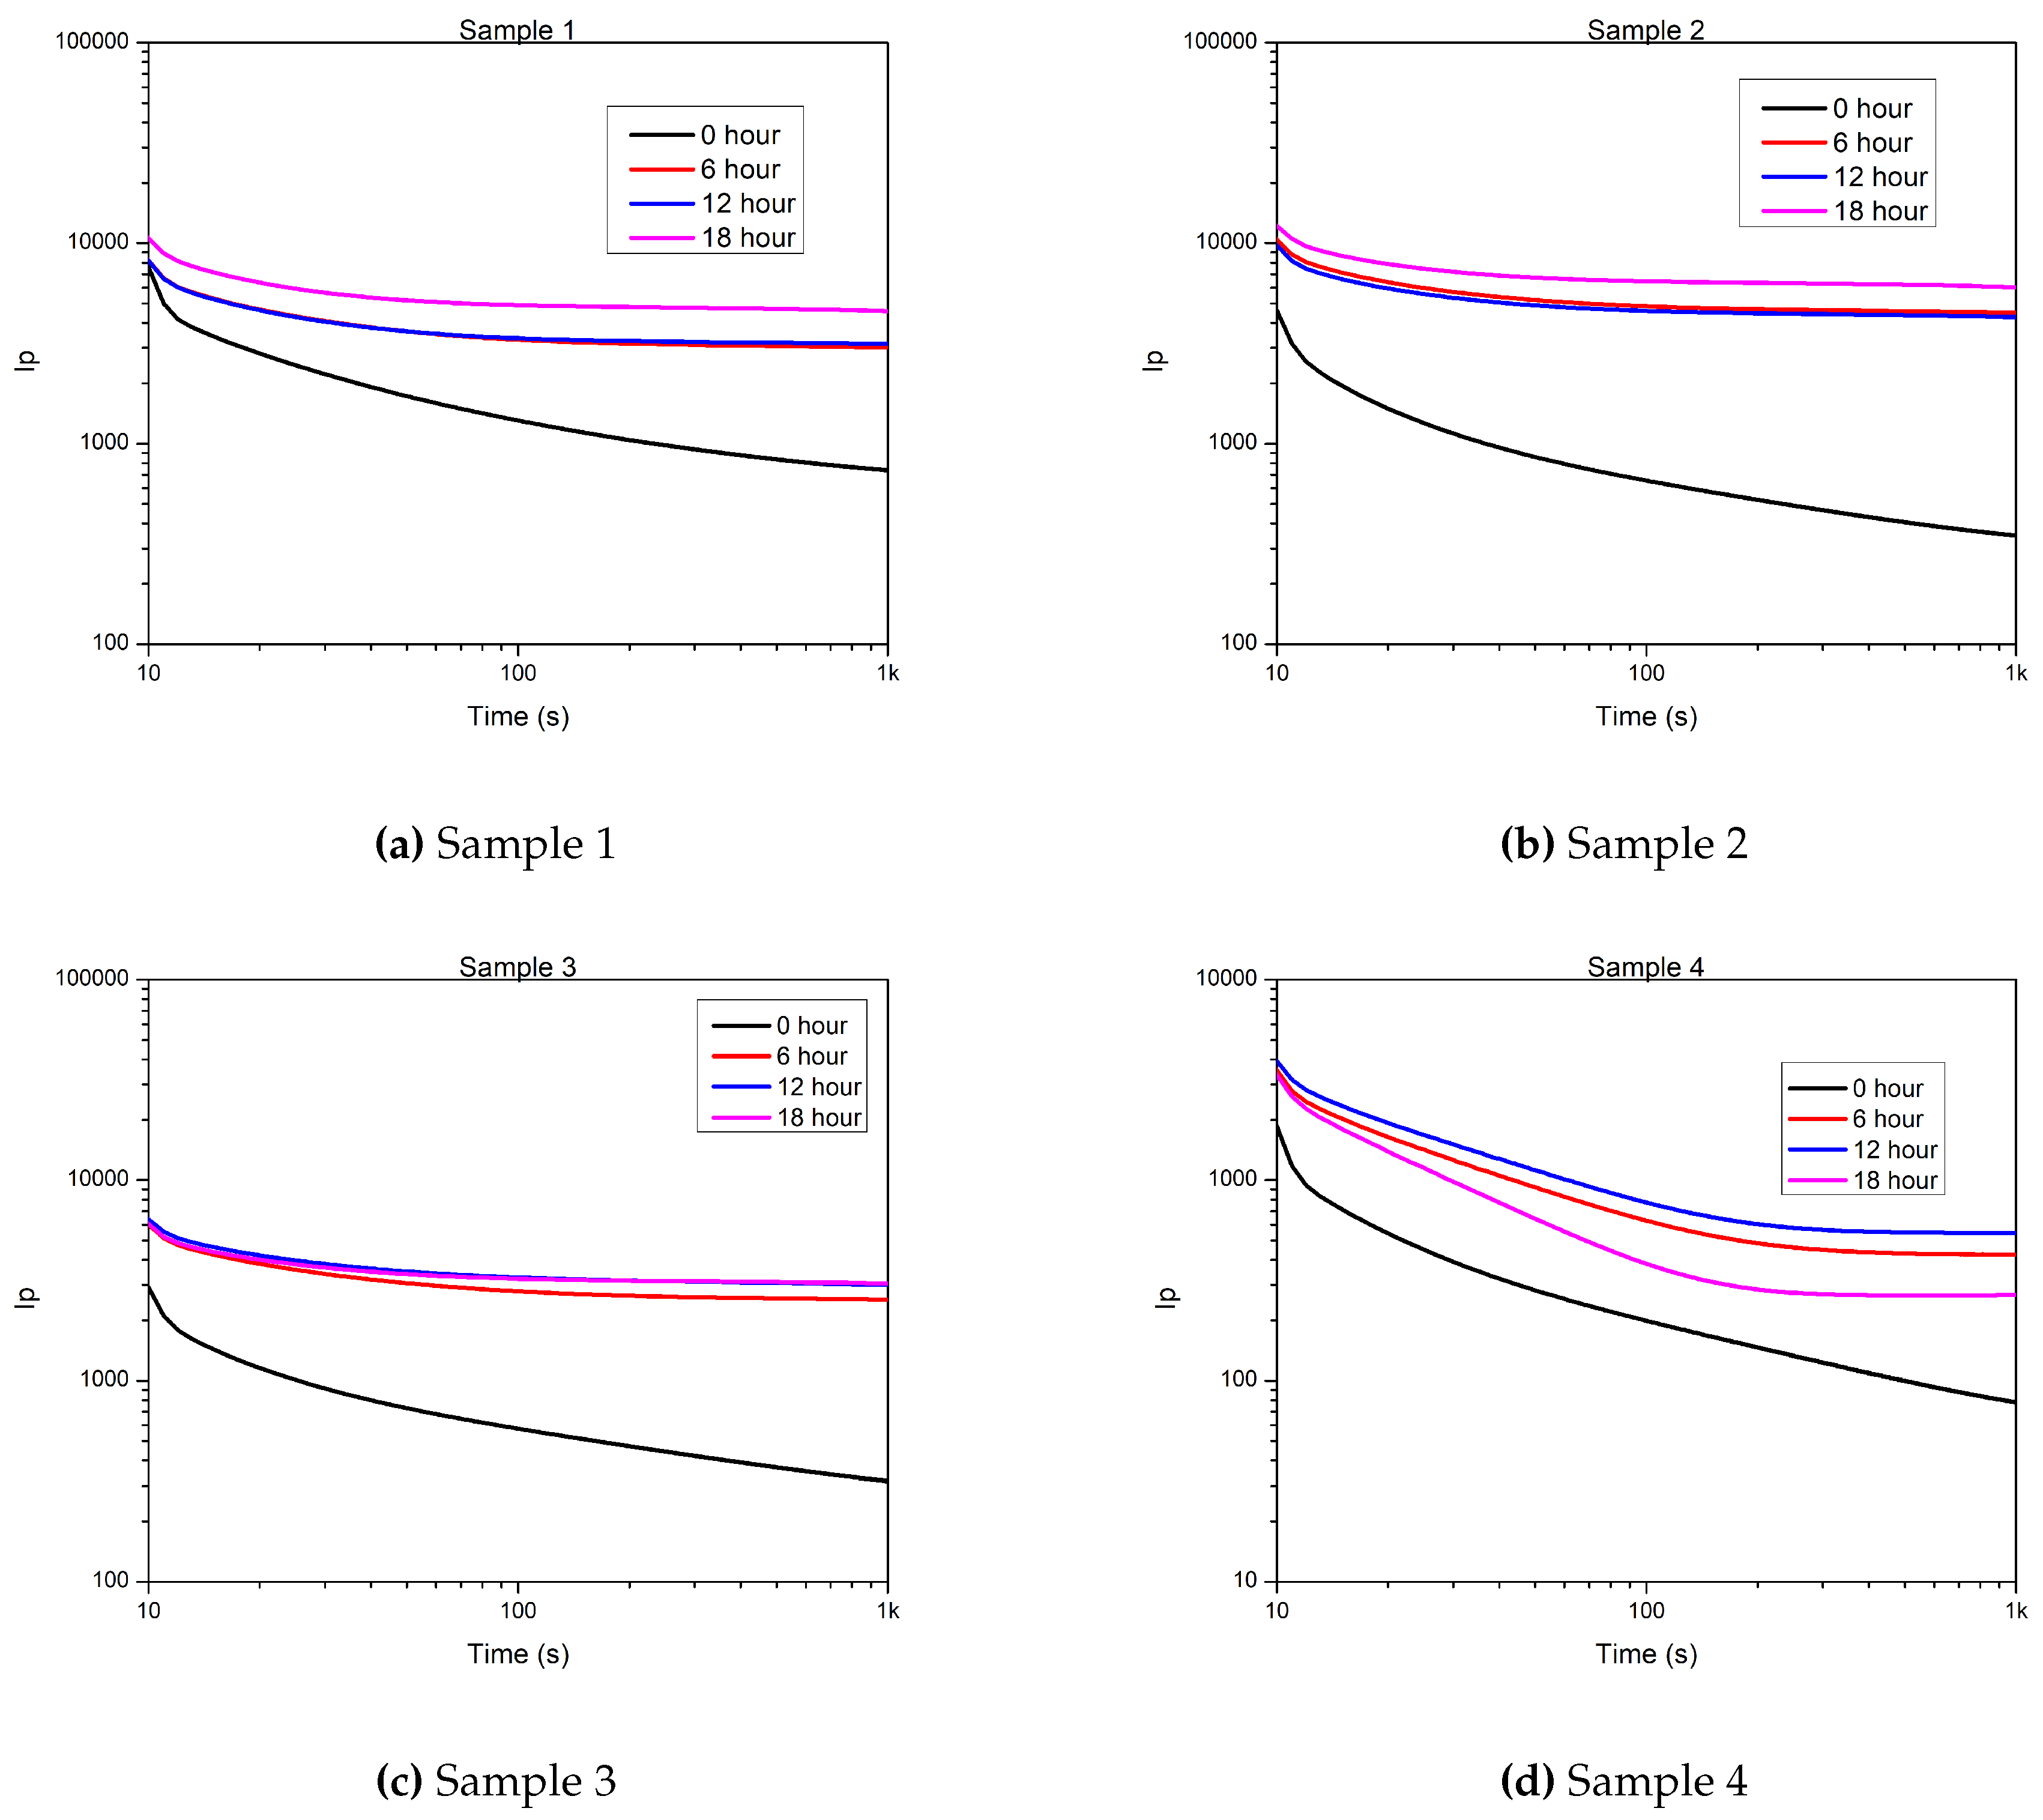
Appendix B.1. Polarization Current of Samples
Figure A3.
Polarization currents of the samples after each aging round [pA].
Figure A3.
Polarization currents of the samples after each aging round [pA].
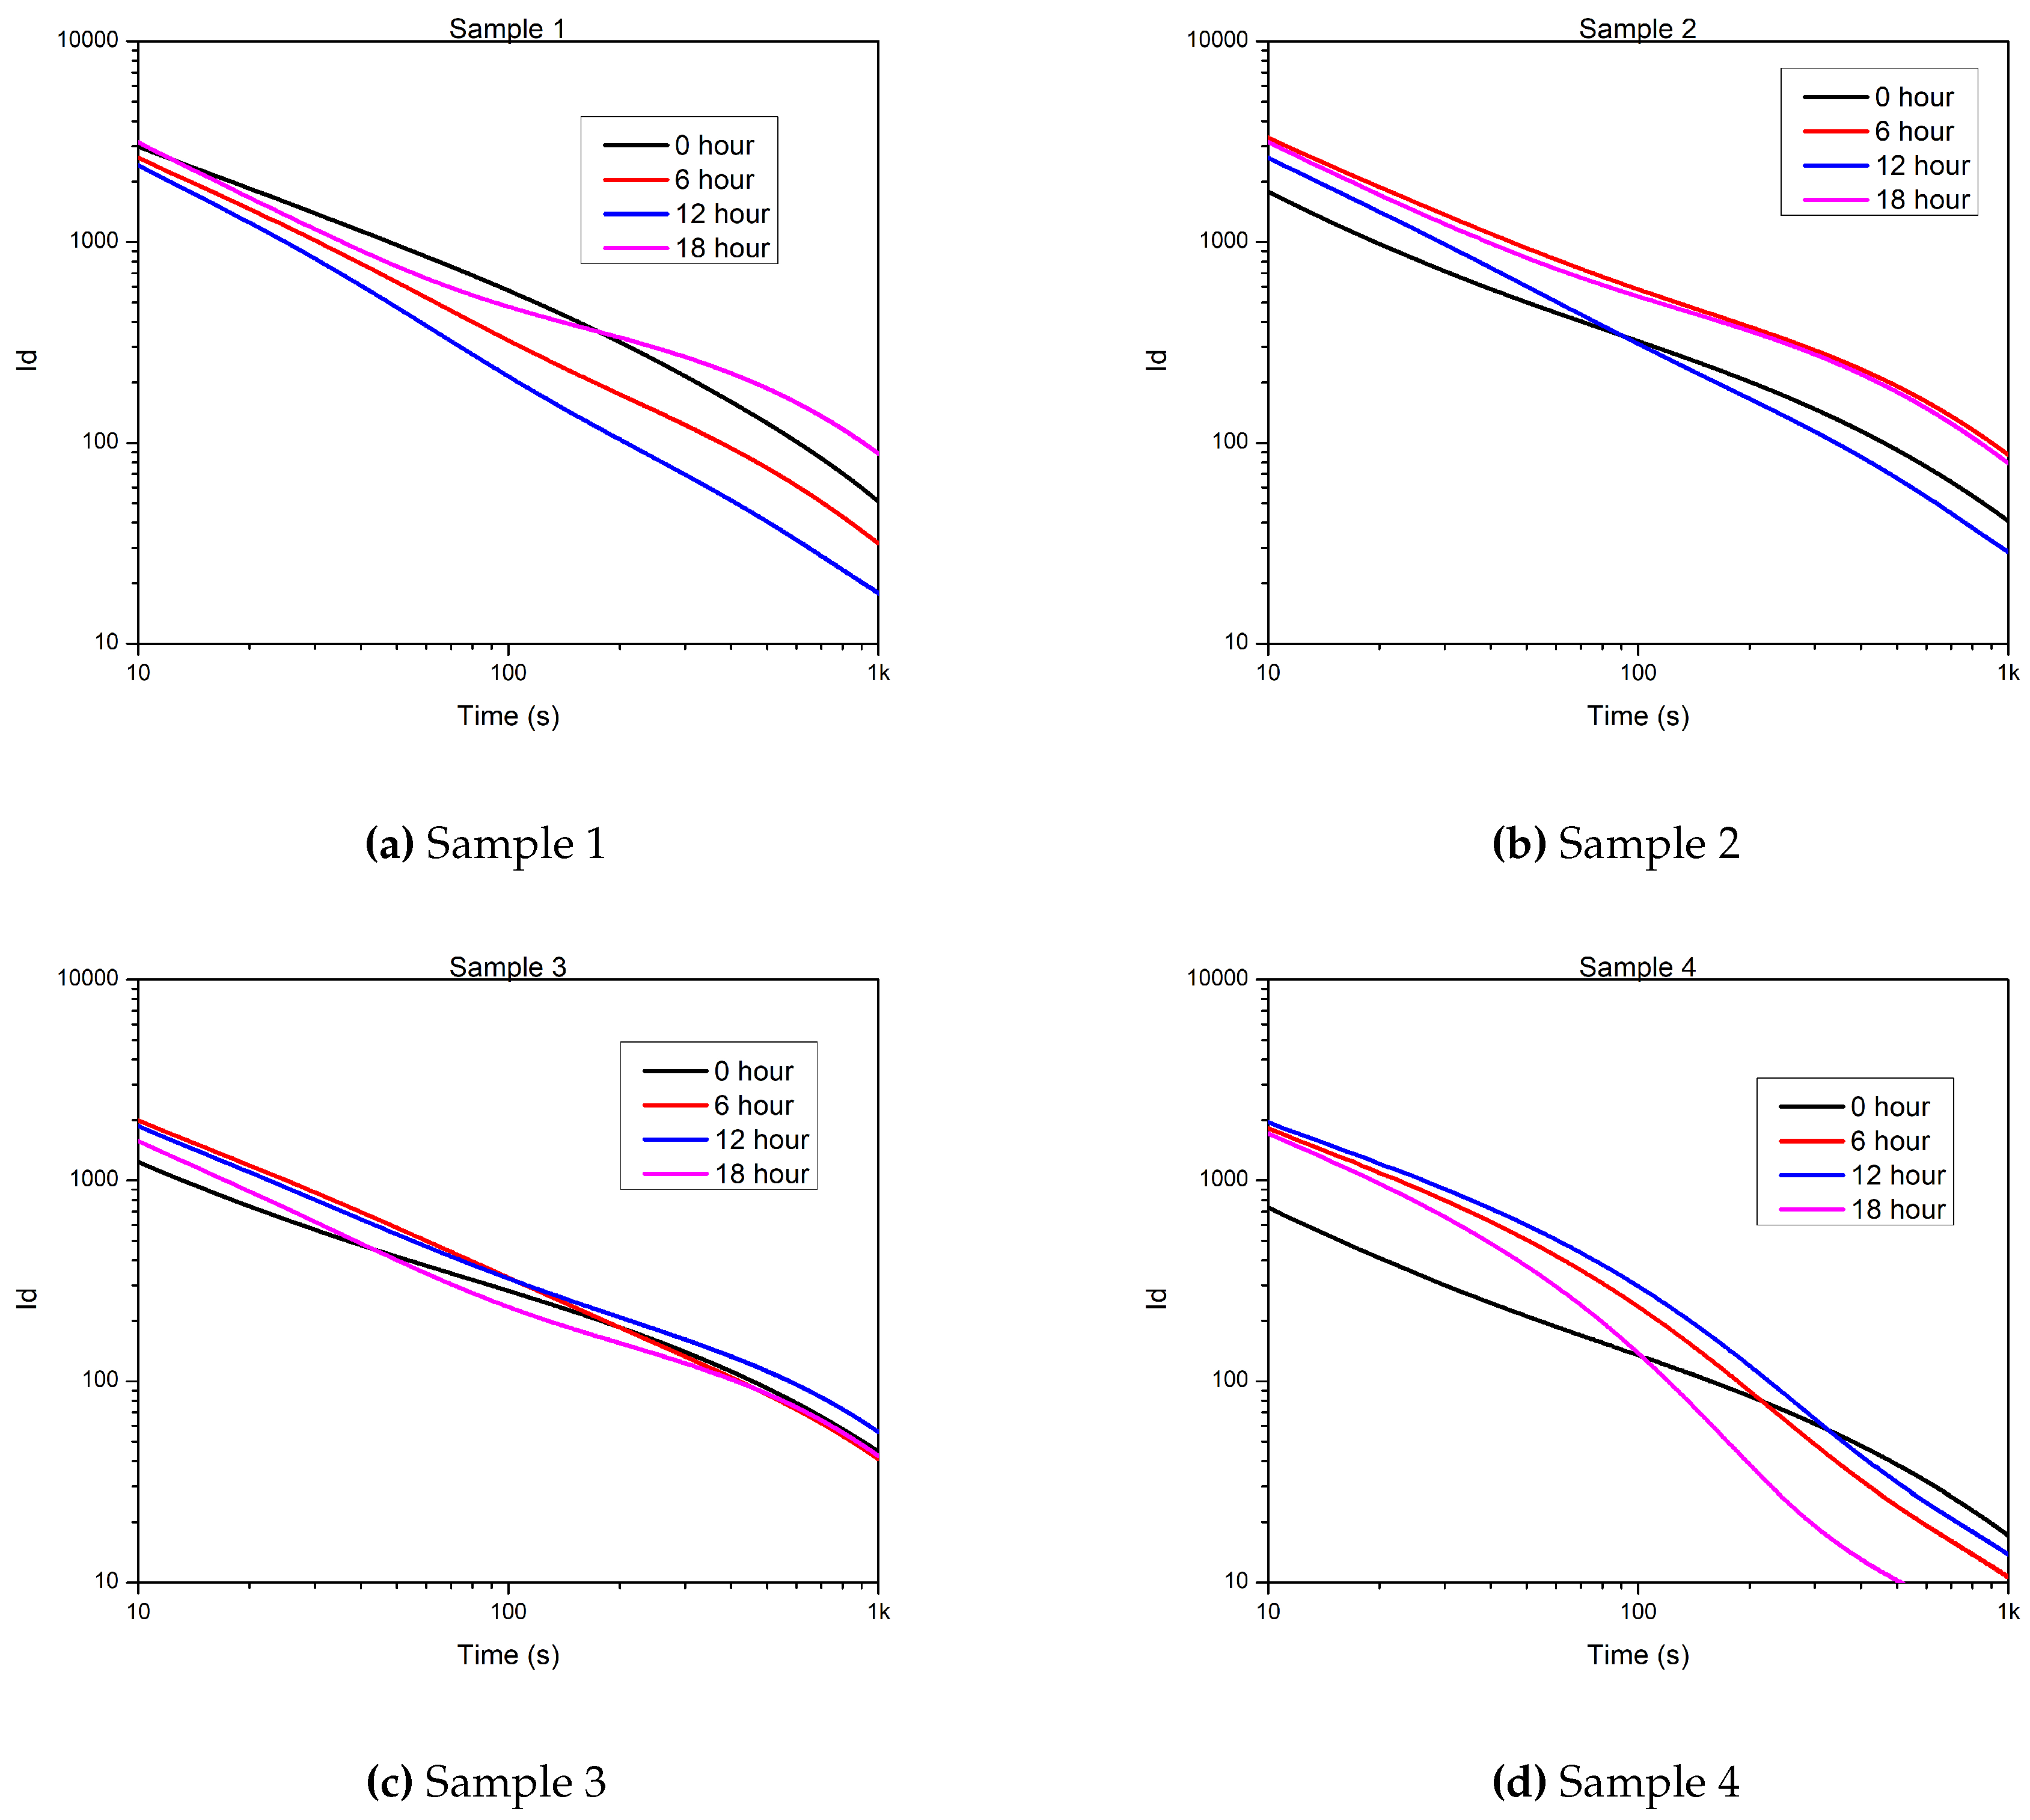
Appendix B.2. Depolarization Current of Samples
Figure A4.
Depolarization currents of the samples after each aging round [pA].
Figure A4.
Depolarization currents of the samples after each aging round [pA].
Appendix C. Calculated Conductive Current of Samples
Figure A5.
Calculated conductive currents of the samples after each aging round [pA].
Figure A5.
Calculated conductive currents of the samples after each aging round [pA].
References
- Kruizinga, B.; Wouters, P.; Steennis, E. Fault development on water ingress in damaged underground Low Voltage cables with plastic insulation. In Proceedings of the 2015 IEEE Electrical Insulation Conference (EIC); 2015; pp. 309–312. [Google Scholar] [CrossRef]
- Eurostat. Renewable Energy Statistics. Available online: https://ec.europa.eu/eurostat/statistics-explained/index.php?title=Renewable_energy_statistics#Share_of_renewable_energy_more_than_doubled_between_2004_and_2021 (accessed on 14 April 2023).
- Densley, J. Ageing mechanisms and diagnostics for power cables - an overview. IEEE Electr. Insul. Mag. 2001, 17, 14–22. [Google Scholar] [CrossRef]
- Phayomhom, A.; Kveeyarn, K. Heat cycles test set for power cable. In Proceedings of the 2013 10th International Conference on Electrical Engineering/Electronics, Computer, Telecommunications and Information Technology; 2013; pp. 1–6. [Google Scholar] [CrossRef]
- Mazzanti, G. The Effects of Seasonal Factors on Life and Reliability of High Voltage AC Cables Subjected to Load Cycles. IEEE Trans. Power Deliv. 2020, 35, 2080–2088. [Google Scholar] [CrossRef]
- Lingvay, I.; Stancu, C.; Budrugeac, P.; Cucos, A.; Lingvay, C. Studies concerning the fast ageing by thermal cycling of power cables. In Proceedings of the 2011 7th International Symposium on Advanced Topics in Electrical Engineering (ATEE); 2011; pp. 1–4. [Google Scholar]
- Muniz, P.R.; Teixeira, J.L.; Santos, N.Q.; Magioni, P.L.Q.; Cani, S.P.N.; Fardin, J.F. Prospects of life estimation of low voltage electrical cables insulated by PVC by emissivity measurement. IEEE Trans. Dielectr. Electr. Insul. 2017, 24, 3951–3958. [Google Scholar] [CrossRef]
- Bowler, N.; Liu, S. Aging mechanisms and monitoring of cable polymers. Int. J. Progn. Health Manag. 2015, 6. [Google Scholar] [CrossRef]
- Jakubowicz, I.; Yarahmadi, N.; Gevert, T. Effects of accelerated and natural ageing on plasticized polyvinyl chloride (PVC). Polym. Degrad. Stab. 1999, 66, 415–421. [Google Scholar] [CrossRef]
- Wilson, A.S. Plasticisers: Selection, Applications and Implications; iSmithers Rapra Publishing: 1996; Volume 88.
- Gumargalieva, K.; Ivanov, V.; Zaikov, G.; Moiseev, J.V.; Pokholok, T. Problems of ageing and stabilization of poly (vinyl chloride). Polym. Degrad. Stab. 1996, 52, 73–79. [Google Scholar] [CrossRef]
- Cheremisinoff, N.P. P. Condensed Encyclopedia of Polymer Engineering Terms; Cheremisinoff, N.P., Ed.; Butterworth-Heinemann: Boston, 2001; pp. 200–255. [Google Scholar] [CrossRef]
- Csányi, G.M.; Bal, S.; Tamus, Z.A. Dielectric Measurement Based Deducted Quantities to Track Repetitive, Short-Term Thermal Aging of Polyvinyl Chloride (PVC) Cable Insulation. Polymers 2020, 12. [Google Scholar] [CrossRef] [PubMed]
- Nedjar, M.; Beroual, A.; Bournane, M. Thermal aging of polyvinyl chloride. In Proceedings of the CEIDP ’05. 2005 Annual Report Conference on Electrical Insulation and Dielectric Phenomena; 2005; pp. 261–264. [Google Scholar] [CrossRef]
- Wei, X.F.; Linde, E.; Hedenqvist, M.S. Plasticiser loss from plastic or rubber products through diffusion and evaporation. Npj Mater. Degrad. 2019, 3, 18. [Google Scholar] [CrossRef]
- Nedjar, M.; Béroual, A.; Boubakeur, A. Influence of thermal aging on the electrical properties of poly (vinyl chloride). J. Appl. Polym. Sci. 2006, 102, 4728–4733. [Google Scholar] [CrossRef]
- Konečná, Z. Temperature dependence of electrical parameters of coaxial cables. In Proceedings of the 2016 Conference on Diagnostics in Electrical Engineering (Diagnostika); 2016; pp. 1–4. [Google Scholar] [CrossRef]
- Csányi, G.M.; Tamus, Z.Á.; Varga, Á. Impact of distributed generation on the thermal ageing of low voltage distribution cables. In Proceedings of the Doctoral Conference on Computing, Electrical and Industrial Systems; Springer, 2017; pp. 251–258. [Google Scholar]
- Csányi, G.M.; Tamus, Z.Á.; Kordás, P. Effect of Enhancing Distribution Grid Resilience on Low Voltage Cable Ageing. In Proceedings of the Doctoral Conference on Computing, Electrical and Industrial Systems; Springer, 2018; pp. 300–307. [Google Scholar]
- Suraci, S.V.; Fabiani, D.; Xu, A.; Roland, S.; Colin, X. Ageing Assessment of XLPE LV Cables for Nuclear Applications Through Physico-Chemical and Electrical Measurements. IEEE Access 2020, 8, 27086–27096. [Google Scholar] [CrossRef]
- Afia, R.S.A.; Mustafa, E.; Tamus, Z.A. Aging Mechanisms and Non-Destructive Aging Indicators of XLPE/CSPE Unshielded LV Nuclear Power Cables Subjected to Simultaneous Radiation-Mechanical Aging. Polymers 2021, 13. [Google Scholar] [CrossRef] [PubMed]
- Quennehen, P.; Royaud, I.; Seytre, G.; Gain, O.; Rain, P.; Espilit, T.; François, S. Determination of the aging mechanism of single core cables with PVC insulation. Polym. Degrad. Stab. 2015, 119, 96–104. [Google Scholar] [CrossRef]
-
Dielectric and Physicochemical Behavior of Aged PVC Insulated Cables; 2012. [CrossRef]
- Höning, N.; De Jong, E.; Bloemhof, G.; Poutre, H.L. Thermal behaviour of low voltage cables in smart grid — Related environments. In Proceedings of the IEEE PES Innovative Smart Grid Technologies, Europe; 2014; pp. 1–6. [Google Scholar] [CrossRef]
- Bal, S.; Tamus, Z.A. Investigation of Effects of Thermal Ageing on Dielectric Properties of Low Voltage Cable Samples by using Dielectric Response Analyzer. In Proceedings of the 2022 International Conference on Diagnostics in Electrical Engineering (Diagnostika); 2022; pp. 1–6. [Google Scholar] [CrossRef]
- Afia, R.S.; Mustafa, E.; Ádám Tamus, Z. Dielectric Spectroscopy of Low Voltage Nuclear Power Cables Under Simultaneous Thermal and Mechanical Stresses. Energy Rep. 2020, 6, 662–667, 2020 The 7th International Conference on Power and Energy Systems Engineering. [Google Scholar] [CrossRef]
- Afia, R.S.; Mustafa, E.; Ádám Tamus, Z. Condition Monitoring of Photovoltaic Cables Based Cross-Linked Polyolefin Insulation Under Combined Accelerated Aging Stresses: Electrical and Mechanical Assessment. Energy Rep. 2022, 8, 1038–1049, 2021 The 8th International Conference on Power and Energy Systems Engineering. [Google Scholar] [CrossRef]
- Afia, R.S.A.; Mustafa, E.; Tamus, Z.A. Condition Assessment of XLPO Insulated Photovoltaic Cables Based on Polarisation/Depolarisation Current. In Proceedings of the 2020 International Conference on Diagnostics in Electrical Engineering (Diagnostika); 2020; pp. 1–4. [Google Scholar] [CrossRef]
- Zaengl, W. Dielectric spectroscopy in time and frequency domain for HV power equipment. I. Theoretical considerations. Ieee Electr. Insul. Mag. 2003, 19, 5–19. [Google Scholar] [CrossRef]
- Morsalin, S.; Phung, T.B.; Danikas, M.; Mawad, D. Diagnostic challenges in dielectric loss assessment and interpretation: A review. IET Sci. Meas. Technol. 2019, 13, 767–782. Available online: http://xxx.lanl.gov/abs/https://ietresearch.onlinelibrary.wiley.com/doi/pdf/10.1049/iet-smt.2018.5597. [CrossRef]
- Fofana, I.; Hadjadj, Y. Electrical-Based Diagnostic Techniques for Assessing Insulation Condition in Aged Transformers. Energies 2016, 9. [Google Scholar] [CrossRef]
-
IEC 60502-1; Power Cables with Extruded Insulation and Their accessories for rated voltages from 1 kV (Um=1,2 kV) up to 30 kV (Um=36 kV) - Part 1: Cables for rated voltages of 1 kV (Um=1,2 kV) and 3 kV (Um=3,6 kV). International Electrotechnical Commission: 2004.
- Mustafa, E.; Afia, R.S.; Tamus, Z.Á. Dielectric loss and extended voltage response measurements for low-voltage power cables used in nuclear power plant: Potential methods for aging detection due to thermal stress. Electr. Eng. 2021, 103, 899–908. [Google Scholar] [CrossRef]
- Bal, S.; Tamus, Z.A. Investigation of Effects of Short-term Thermal Stress on PVC Insulated Low Voltage Distribution Cables. Period. Polytech. Electr. Eng. Comput. Sci. 2021, 65, 167–173. [Google Scholar] [CrossRef]
- Tamus, Z.A. Practical consideration of mechanical measurements in cable diagnostics. In Proceedings of the 2011 Electrical Insulation Conference (EIC); 2011; pp. 359–363. [Google Scholar] [CrossRef]
- Fothergill, J.C.; Dodd, S.J.; Dissado, L.A.; Liu, T.; Nilsson, U.H. The measurement of very low conductivity and dielectric loss in XLPE cables: A possible method to detect degradation due to thermal aging. IEEE Trans. Dielectr. Electr. Insul. 2011, 18, 1544–1553. [Google Scholar] [CrossRef]
- Koch, M.; Raetzke, S.; Krueger, M. Moisture diagnostics of power transformers by a fast and reliable dielectric response method. In Proceedings of the 2010 IEEE International Symposium on Electrical Insulation; 2010; pp. 1–5. [Google Scholar] [CrossRef]
- Afia, R.S.A.; Mustafa, E.; Tamus, Z.Á. Comparison of Mechanical and Low-Frequency Dielectric Properties of Thermally and Thermo-Mechanically Aged Low Voltage CSPE/XLPE Nuclear Power Plant Cables. Electronics 2021, 10. [Google Scholar] [CrossRef]
- Mustafa, E.; Afia, R.S.A.; Tamus, Z.A. Investigation of Electrical and Mechanical Properties of Low Voltage Power Cables under Thermal Stress. In Proceedings of the 2020 International Conference on Diagnostics in Electrical Engineering (Diagnostika); 2020; pp. 1–4. [Google Scholar] [CrossRef]
- American Society for Testing and Materials. ASTM D2240-05 Standard Test Method for Rubber Property—Durometer Hardness, 2000.
- Raza, M.H.; Butt, S.U.; Khattak, A.; Alahmadi, A.A. Investigation of Ramped Compression Effect on the Dielectric Properties of Silicone Rubber Composites for the Coating of High-Voltage Insulation. Materials 2022, 15. [Google Scholar] [CrossRef] [PubMed]
- Iqbal, M.B.; Khattak, A.; Ali, A.; Raza, M.H.; Ullah, N.; Alahmadi, A.A.; Khan, A. Influence of Ramped Compression on the Dielectric Behavior of the High-Voltage Epoxy Composites. Polymers 2021, 13. [Google Scholar] [CrossRef] [PubMed]
- Linde, E.; Gedde, U. Plasticizer migration from PVC cable insulation – The challenges of extrapolation methods. Polym. Degrad. Stab. 2014, 101, 24–31. [Google Scholar] [CrossRef]
- Starnes, W.H. Structural and mechanistic aspects of the thermal degradation of poly(vinyl chloride). Prog. Polym. Sci. 2002, 27, 2133–2170. [Google Scholar] [CrossRef]
- Zhu, M.X.; Li, J.C.; Song, H.G.; Chen, J.M.; Zhang, H.Y. Determination of trap energy in polyethylene with different aging status by molecular dynamics and density function theory. IEEE Trans. Dielectr. Electr. Insul. 2019, 26, 1823–1830. [Google Scholar] [CrossRef]
- Huzayyin, A.; Boggs, S.; Ramprasad, R. Density functional analysis of chemical impurities in dielectric polyethylene. IEEE Trans. Dielectr. Electr. Insul. 2010, 17, 926–930. [Google Scholar] [CrossRef]
- Kryshtob, V.I.; Rasmagin, S.I.; Vlasova, T.V. On Improving the Running Ability of Cables with Polymer Insulation. Russ. Electr. Eng. 2018, 89, 385–387. [Google Scholar] [CrossRef]
- Beneš, M.; Milanov, N.; Matuschek, G.; Kettrup, A.; Plaček, V.; Balek, V. Thermal degradation of PVC cable insulation studied by simultaneous TG-FTIR and TG-EGA methods. J. Therm. Anal. Calorim. 2004, 78, 621–630. [Google Scholar] [CrossRef]
- Wypych, G. 4—PRINCIPLES OF THERMAL DEGRADATION. In PVC Degradation and Stabilization (Third Edition), 3rd ed.; Wypych, G., Ed.; ChemTec Publishing: Boston, 2015; pp. 79–165. [Google Scholar] [CrossRef]
- Bazilchuk, M.; Sumigawa, T.; Kitamura, T.; Zhang, Z.; Kristiansen, H.; He, J. Contact area measurement of micron-sized metal-coated polymer particles under compression. Int. J. Mech. Sci. 2020, 165, 105214. [Google Scholar] [CrossRef]
- Ito, M.; Nagai, K. Analysis of degradation mechanism of plasticized PVC under artificial aging conditions. Polym. Degrad. Stab. 2007, 92, 260–270. [Google Scholar] [CrossRef]
- Audouin, L.; Dalle, B.; Metzger, G.; Verdu, J. Thermal aging of plasticized PVC. II. Effect of plasticizer loss on electrical and mechanical properties. J. Appl. Polym. Sci. 1992, 45, 2097–2103. [Google Scholar] [CrossRef]
Figure 1.
Currents and voltage of the tan measurement.
Figure 1.
Currents and voltage of the tan measurement.
Figure 2.
Circuit diagram of PDC
Figure 2.
Circuit diagram of PDC
Figure 3.
Timing diagram of PDC.
Figure 3.
Timing diagram of PDC.
Figure 4.
SZAMKAM cable structure.
Figure 4.
SZAMKAM cable structure.
Figure 5.
Before and after the structure changed.
Figure 5.
Before and after the structure changed.
Figure 6.
Maximum conductor temperature according to IEC 60502-1.
Figure 6.
Maximum conductor temperature according to IEC 60502-1.
Figure 7.
Measurement configuration from Dirana library.
Figure 7.
Measurement configuration from Dirana library.
Figure 8.
Measurement setup.
Figure 8.
Measurement setup.
Figure 9.
The results of tan measurements on intact samples—before aging.
Figure 9.
The results of tan measurements on intact samples—before aging.
Figure 10.
The effect of structure changing on tan —before aging.
Figure 10.
The effect of structure changing on tan —before aging.
Figure 11.
The effect of structure changing on capacitance [F]—before aging.
Figure 11.
The effect of structure changing on capacitance [F]—before aging.
Figure 12.
The change of tan with aging—Sample 1.
Figure 12.
The change of tan with aging—Sample 1.
Figure 13.
After ageing—Sample 2.
Figure 13.
After ageing—Sample 2.
Figure 14.
After ageing—Sample 3.
Figure 14.
After ageing—Sample 3.
Figure 15.
After ageing—Sample 4.
Figure 15.
After ageing—Sample 4.
Figure 16.
Cross comparison between the samples—after ageing.
Figure 16.
Cross comparison between the samples—after ageing.
Figure 17.
Capacitance of Sample 4—After aging.
Figure 17.
Capacitance of Sample 4—After aging.
Figure 18.
Polarization current.
Figure 18.
Polarization current.
Figure 19.
Depolarization current.
Figure 19.
Depolarization current.
Figure 20.
Conduction current.
Figure 20.
Conduction current.
Figure 21.
Polarization current of all samples—After ageing.
Figure 21.
Polarization current of all samples—After ageing.
Figure 22.
Depolarization current of all samples—After ageing.
Figure 22.
Depolarization current of all samples—After ageing.
Figure 23.
Conduction current of all samples—After ageing.
Figure 23.
Conduction current of all samples—After ageing.
Figure 24.
Results of Shore D hardness measurements of belting layers.
Figure 24.
Results of Shore D hardness measurements of belting layers.
Figure 25.
Comparison of Shore D hardness and conduction current after and before aging ratios.
Figure 25.
Comparison of Shore D hardness and conduction current after and before aging ratios.
Table 1.
Remaining cable layers per sample.
Table 1.
Remaining cable layers per sample.
| Cable layer/Sample |
Sample 1 |
Sample 2 |
Sample 3 |
Sample 4 |
| Conductor |
✓ |
✓ |
✓ |
|
| PVC Core Insulation |
✓ |
✓ |
✓ |
✓ |
| PVC Tape |
✓ |
✓ |
✓ |
X |
| Aluminium Tape Screen |
✓ |
✓ |
X |
X |
Table 2.
Conduction current in pA at 1000 s of samples before and after aging.
Table 2.
Conduction current in pA at 1000 s of samples before and after aging.
| |
Sample 1 |
Sample 2 |
Sample 3 |
Sample 4 |
| Before |
686.3961 |
307.2256 |
272.1701 |
60.8 |
| After |
4501.6 |
5950.7 |
3007.5 |
262.12 |
| Ratio (After/Before) |
6.55 |
19.37 |
11.05 |
4.31 |
Table 3.
Ratio of Shore D hardness of PVC belting layer of samples before and after aging.
Table 3.
Ratio of Shore D hardness of PVC belting layer of samples before and after aging.
| |
Sample 1 |
Sample 2 |
Sample 3 |
| Before |
|
37.09 for all samples |
|
| After |
33.02 |
31.83 |
32.90 |
| Ratio (After/Before) |
0.890 |
0.858 |
0.887 |
|
Disclaimer/Publisher’s Note: The statements, opinions and data contained in all publications are solely those of the individual author(s) and contributor(s) and not of MDPI and/or the editor(s). MDPI and/or the editor(s) disclaim responsibility for any injury to people or property resulting from any ideas, methods, instructions or products referred to in the content. |
© 2023 by the authors. Licensee MDPI, Basel, Switzerland. This article is an open access article distributed under the terms and conditions of the Creative Commons Attribution (CC BY) license (http://creativecommons.org/licenses/by/4.0/).
