1. Introduction
Global food demand is expected to increase by 70%-100% by 2050 [
1], and sustainable development of agriculture will be crucial to meet the increasing and diverse demand with available natural resources to overcome the challenges of hunger, nutritional insecurity, unemployment and socio-political instability [
2]. The earlier agricultural intensification during the green revolution has been appraised for its tremendous productivity boost but condemned for serious social and environmental externalities [
3]. ’Sustainable intensification’ (SI) of agriculture emerged as a logical response to the sustainability crises in agriculture and developed into a loaded and debated concept across research groups [
4]. Despite the similarity of SI’s unique perceived benefit i.e., ’increased productivity without altering ecological balance’ with closely related paradigms of regenerative agriculture such as ’ecological intensification,’ sustainable intensification is pitched as a broader-spectrum concept encompassing productivity, economic, social, and ecological intensification [
5,
6,
7]. Although the connotation of ’sustainable intensification of agriculture’ is often considered ambiguous [
2], or even ’oxymoron’ [
8], this has been practised widely to avoid the harmful impact of conventional high-input intensive agriculture and the ever-widening problem of food and nutritional insecurity [
9]. Many of these endeavours take the form of modification and transformations in existing cropping systems in smallholder agriculture [
10,
11]. The economic viability of these cropping systems under risky scenarios needs to be understood to strike a balance between profitability and externality in sustainable cropping systems, which is a prerequisite for upscaling cropping system intensification initiatives.
Like many agriculture-dependent countries India negotiates the dual pressure of feeding a 1.27 billion population [
12] and sustaining the livelihoods of 53% of agrarian population [
13,
14]. The adoption of SI in its existing crop management practices will bring about a curb-cut effect on the country’s multi-sector development. Apart from reducing the pressure on limited agricultural lands, SI is capable of transitioning desirable effects on soil health, labour economy, socioeconomics, energy use, and climate resilience [
15]. However, in the present study, we have examined the economic sustainability of different cropping system intensification in selected areas of Indian Sundarbans.
Crop production along with animal husbandry and forestry contributes significantly to the livelihoods of rural households in this coastal area [
16]. But agriculture has increasingly become nonremunerative due to climatic, edaphic, topographic, and drainage-related problems. Additionally, a steady workforce moves out from the farm sector every year, exacerbating the situation. However, such propositions do not necessarily imply agriculture’s point of no returns in this area. In fact, farm-based enterprises still form the main livelihood option for the rural people in Sundarbans [
17,
18] and asks for an efficient utilization of scarce resources to extract more output from existing production systems. Rainy (
kharif) rice is central to the cropping systems in coastal West Bengal, grown in an estimated area of 3.33 lakh ha with a production of8.15lakh tonnes in south 24 Parganas district [
19]. Almost all cropping systems revolve round this crop and these rice-based systems have been extensively studied for their economic and ecological performances and optimum resource use efficiencies [
20]. Although there are substantial cultivating short duration pulse crops, vegetables, oilseeds, potato, grain maize crops in the winter (
rabi) and summer season in coastal zone, post-rice fallow system is the predominant cropping scenario (more than 80% crop fields remain fallow during post-monsoon period) due to drainage obstruction associated waterlogging, lack of suitable irrigation water in dry seasons and problem of soil salinity [
21].
Farmers of the coastal area often experience climate change related obstacles such as flood, uncertain rainfall, sea level rise, and frequent cyclones, complicating the performances of farming activities. Every year, the deltaic Sundarbans experiences multi-hazard weather abnormalities, and nearly 65% households of the region is considered economically deprived due to such extreme climatic events every year [
22]. Very recently, cyclones like
Fani (during April-May 2019),
Bulbul (during November 2019),
Amphan (during May 2020),
Yaas (during May 2021) and
Sitrang (October 2022) have repeatedly caused mayhem for millions of villagers in this region and perturbed their livelihood options. Attempts from different quarters of the society have tried to relocate the distressed people and restored their destabilized economy. Such recursive climatic perturbations after extreme events trigger hydro-meteorological abnormalities in the local socio-ecological systems and asks for reorientation and transformation in the crop choice and management options. Although there are available climate-resilient technologies to improve output from existing cropping systems, nominal profitability or farmers’ noncompatible socio-economic conditions often impede adoption of apparently beneficial crop management techniques [
23]. This necessitates an estimation of present cropping systems’ feasibility and an
ex-ante assessment of their sustainability to identify pragmatic operations/modifications in the cropping systems to develop resilience against projected long-term climate change and associated market vulnerabilities. Recent studies have compared techno-economic performances of different cropping systems in coastal Sundarbans [
20]. However, simulation studies are necessary to underpin the existing profitability assessments and associated trade-off for the coastal region to assess the ’best,’ ’normal’ and ’worse’ performance of cropping systems under economic risk associated with future climate change scenarios. Biophysical models have been instrumental in estimating sensitivity of generic cropping system practices to climate change [
24,
25]. Such models have previously been used for different farming system options in the Bangladesh part of coastal Sundarbans to estimate projected crop yield [
26] and economics [
27] under varied climatic and soil salinity situations, and economic performances of the farming systems under varied sowing dates and fertilizer applications [
28]. In Indian part of Sundarbans, Bidhan Chandra Krishi Viswavidyalaya (BCKV) and Ramakrishna Mission Vivekananda Educational & Research Institute (RKMVERI) with Australian Centre for International Agricultural Research (ACIAR) conducted several research programmes since 2016 at two villages of the coastal area (Rangabelia and Jatirampur villages under Gosaba Block) of South 24 Parganas district, West Bengal, India for agricultural, social and economic development of the coastal region to implement sustainable intensification through site-specific scientific interventions. In the present study, using a questionnaire survey with the farmers of the case-study villages, we attempt to estimate the productivity and economic indicators of different rice-based cropping systems and assess the risk associated with long-term climate change and related market variability. We hypothesize that among different rice-based systems, the system productivity, profitability and associated economic risk will vary. Rejection of null hypothesis may possibly lead us to find out the best cropping system having highest system productivity, net return and least risk under climate-change related abnormalities.
2. Materials and Methods
2.1. Study Location and Cropping Systems
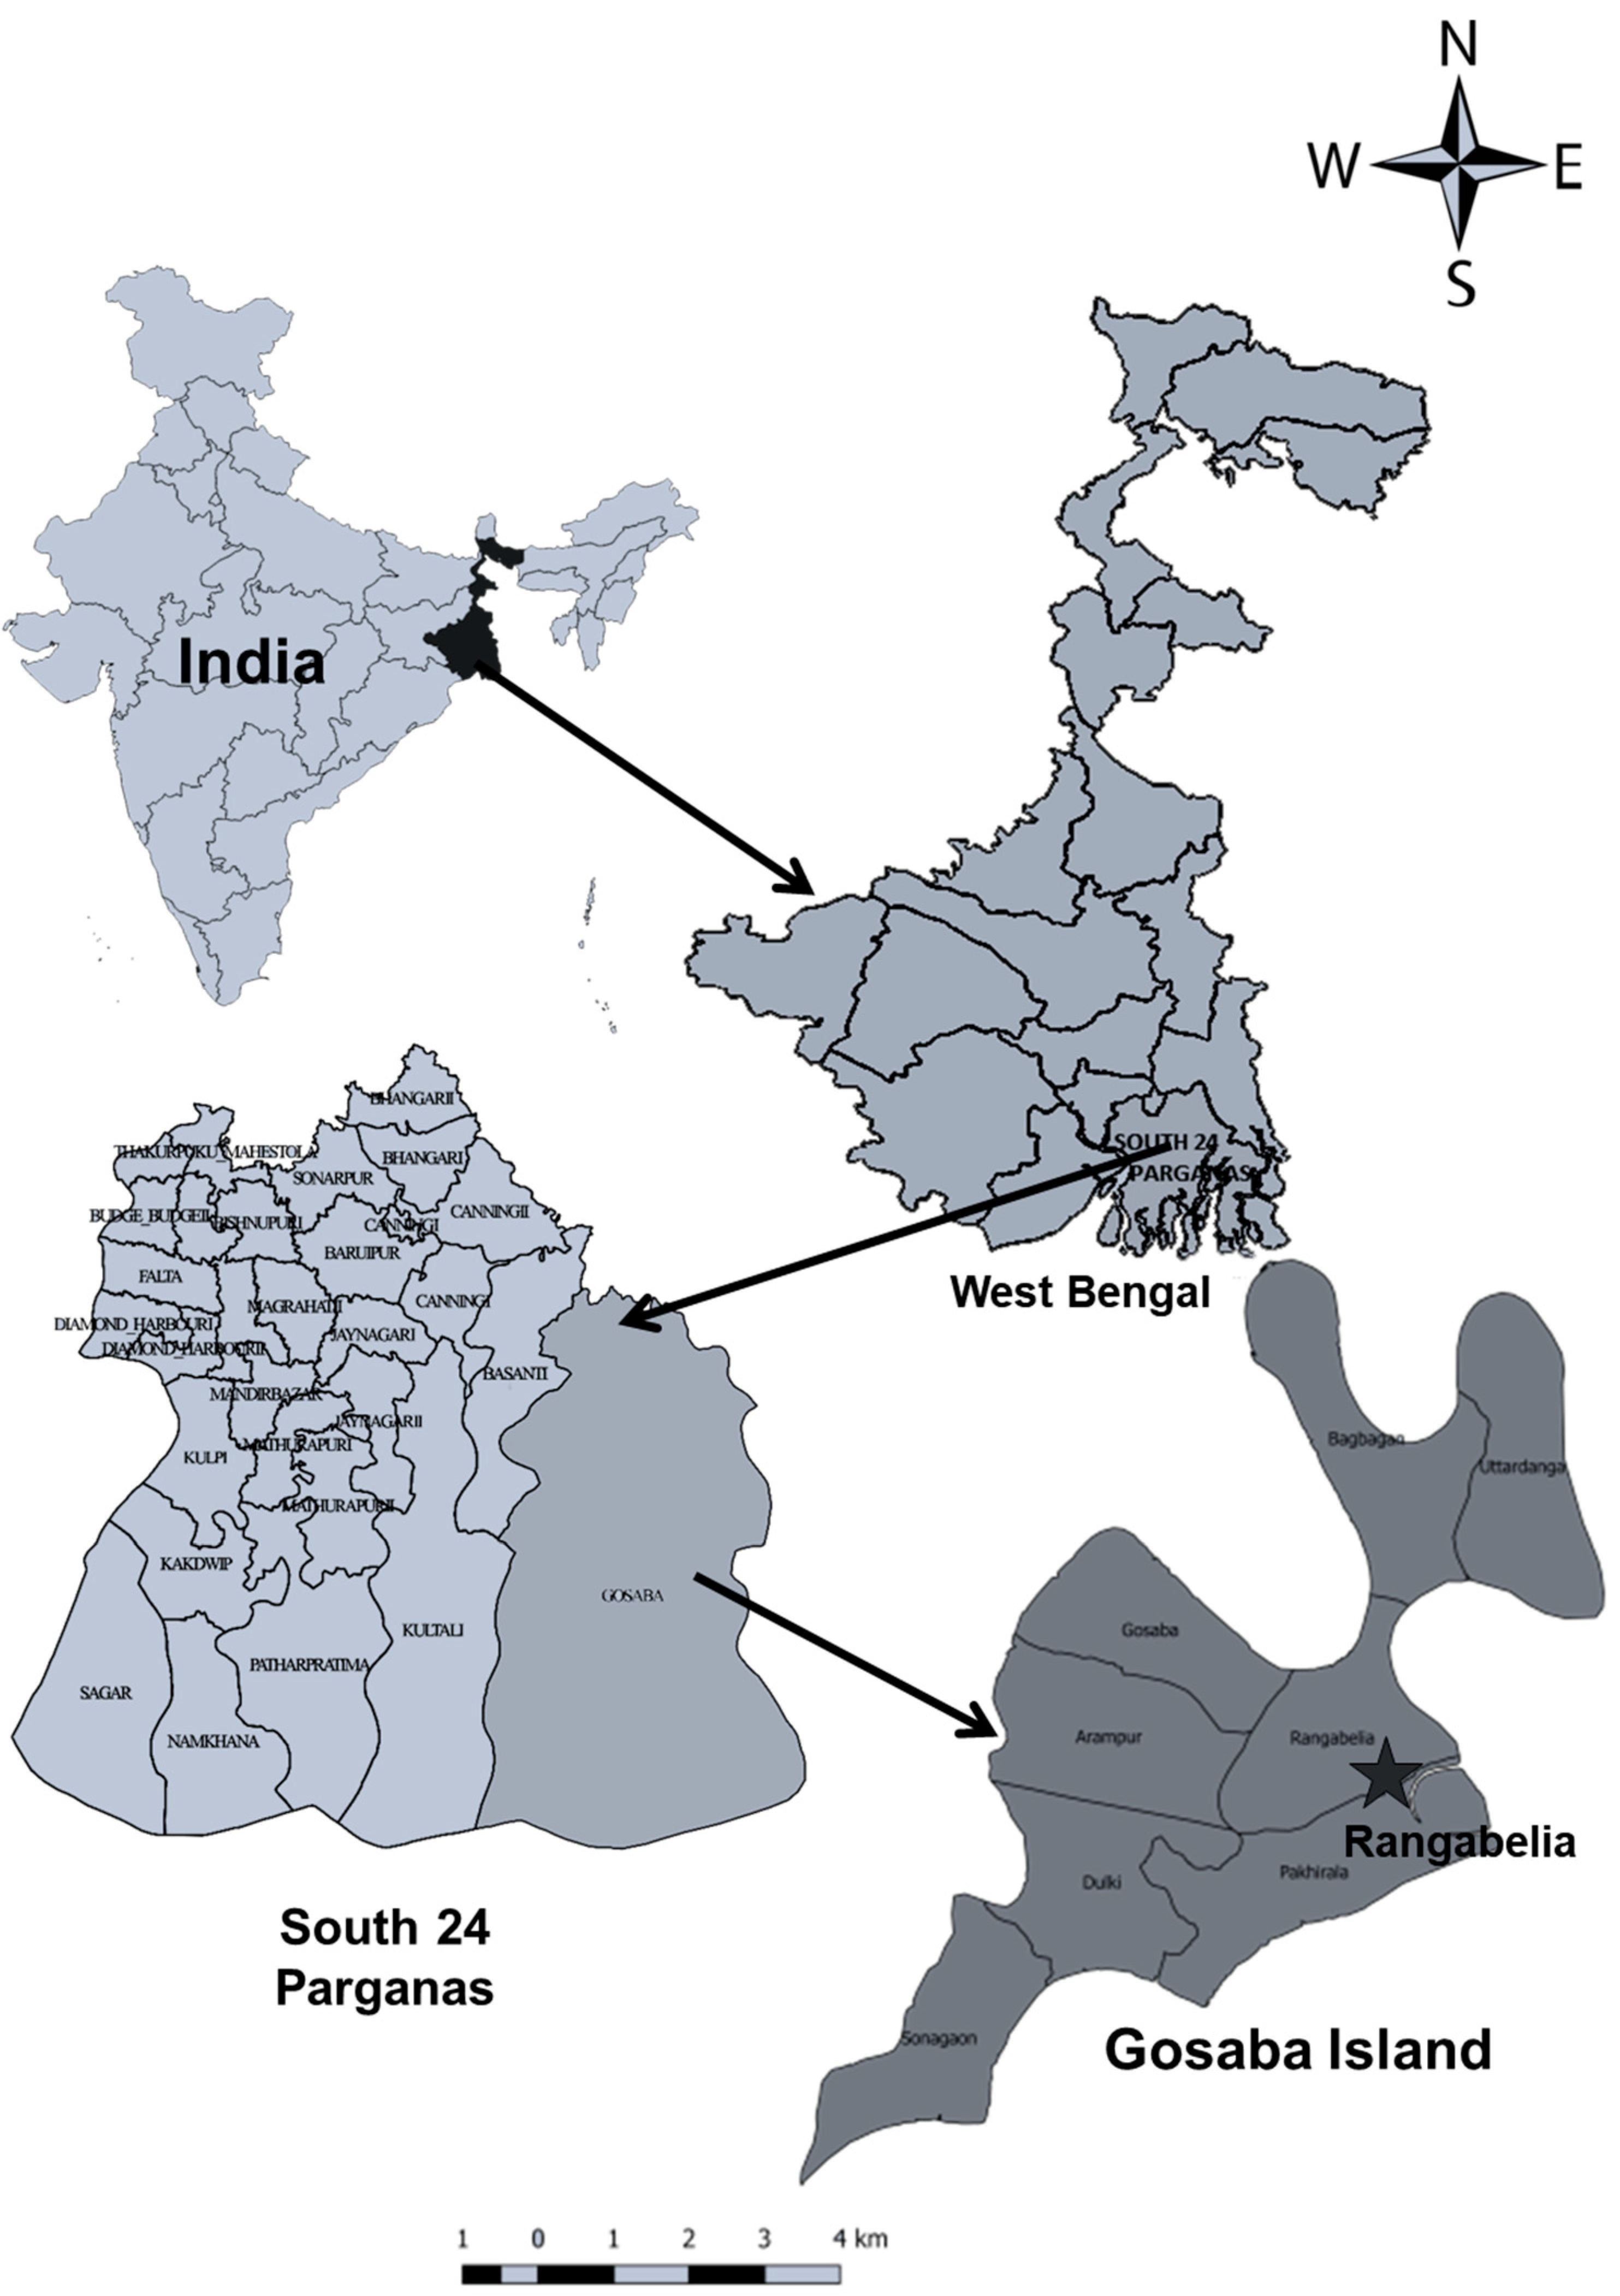
We selected the study villages purposively from Gosaba Block of south 24 Parganas district, West Bengal (
Figure 1). Majority of the respondents, in general, practised more than one crop in a year. Most of them grew two; others grew three crops in a single growing season [(
kharif (rainy) –
rabi(winter) – pre-
kharif (summer)] on a small proportion of their land. We identified eleven major cropping systems in the study areas, of which eight systems were in practice for at least last ten years – rice-tomato, rice-lathyrus, rice-potato, rice-fallow, rice-rice, rice-lentil, rice-onion and rice-chilli. However, three potential systems were suggested by state Govt officials and scientists after conducting trials for consecutive three years in that location, viz. rice-fallow-green gram, rice-maize and rice-potato-green gram (
Table 1).
2.2. Identification of Socio-Demographic and Physiographic Variables and Their Description
The variables were identified in an exploratory manner in consultation with the respondents and local project stakeholders. The questionnaire was used to record the –age, primary and secondary occupation, education, caste, total members in family, type of family, total land area, type of land, availability of irrigation water, soil fertility status and perception about woman’s participation in both household and agricultural activities. Details about the variables are summarized in
Supplementary Table S1.
2.3. Primary Data Collection
The research team selected the blocks, gram panchayats and villages purposively in consultation with the Tagore Society for Rural Development (TSRD), West Bengal, India a civil society organization, working in the study locations (
http://www.tsrd.org), and Bidhan Chandra Krishi Viswavidyalaya (BCKV), a State Agricultural University (SAU) at Nadia, West Bengal (
http://www.bckv.edu.in) as per the mandate of the project on ’Cropping systems intensification in the salt affected coastal zones of Bangladesh and West Bengal, India (CSI4CZ)’ of Australian Centre for International Agricultural Research (ACIAR) (details available at URL:
https://aciar.gov.au/project/lwr-2014-073). Initially, the team selected the key informant purposively for each village, and then the rest of the respondents, after surveying the first household, were selected by simple random sampling (SRS) method from a manually prepared list of farmers in the study areas. Total numbers of respondents in two villages were 50. The field enumerator collected data from March-May, 2019 with the help of a pretested semi-structured interview schedule. Exploratory Focus Group Discussions (FGDs) were organized to comprehend (for the interviewee) the study objectives, and also to have an idea (for the interviewers) about comparative profitability of different cropping systems. Additionally, we conducted ten in-depth interviews (out of the 50 respondents) with the farmers about their experiences of disaster-induced devastation, their strategies (or inability) of survival and post-calamity market vulnerabilities.
2.4. Rice equivalent Yield and System Yield
Rice equivalent yield (REY) of cropping systems were estimated from dry season (both during winter and summer seasons) crop yields, as reported by farmers, as per the formula given below [
29]:
where, REY is Rice equivalent yield of the system (t/ha), Y
d is yield of a dry season crop (t/ha), P
d is selling price of that dry season crop (Indian rupees or INR/t), and P
r is the selling price of rice crop (INR/t).
Then the REY (t/ha) was added to rainy season rice yield (t/ha) to estimate system yield of any of the cropping systems (t/ha).
2.5. Costs and Returns for Farm Enterprises
Economic indicators like total paid-out cost (TPC), total imputed cost (TIC), total cost (TC), gross return (GR), net return (NR) and benefit:cost ratio (B:C ratio) for different systems were calculated as per information provided by the farmers. For both the ’paid-out’ and ’unpaid/imputed’ cost of cultivation, costs incurred for individual crop management operations (from land preparation to harvesting, and then post-harvesting operations) were considered, and then summed up for any cropping system. Formula for estimation of different economic indicators were used as per Kabir, et al. [
27] with slight modifications:
The gross and net returns and B:C ratios of different crops in a system were then summed up to get system returns and B:C ratio. Prevailing market price (for the year 2018-19) in INR for inputs and outputs for crops in different cropping systems were used for different estimations.
2.6. Risk Analysis
Cumulative density functions (CDFs) for net returns of individual crops and also for different cropping systems were determined using the program @RISK Student Version 7.5 along with Microsoft Excel. Monte Carlo simulation was used to generate probability distributions of system yield and net returns. The lower limit was the farmers’ perceived worst case, and the upper limit was best-case scenario [
30] under varied weather conditions and market situations, excluding weather extremes that caused complete loss in crop fields. To increase stability of the distribution, 10,000 iterations were used to simulate the CDFs. Risk analysis was accomplished by comparing the CDFs of different cropping systems. Simple stochastic dominance concepts were used to draw logical conclusions. If individual crop/cropping system 1 is preferred more by farmers (the decision makers) to individual crop / cropping system 2 (foursome / any amount of net return, the former will have first-degree stochastic dominance (FSD) over the later, regardless of utility function (in our case consumption preferences for economic products). The concept of second-degree stochastic dominance (SSD) assumes that, for a given expected net income, farmers prefer individual crop / cropping system 1 to individual crop / cropping system 2 in terms of less variability (less risk associated) to more variability (more risk associated), regardless of utility function. With these concepts, we ranked the studied cropping systems. To predict the impact of change in components crop’s yield and selling price in a cropping system (independent variable) on system net return (dependent variable), we performed deterministic sensitivity analysis using Tornado chart.
2.7. Statistical Analysis
Data on background information of the respondents were analysed using software SPSS v21.0 (Version 21.0, IBM SPSS Statistics for Windows, IBM Corporation, Armonk, NY, USA). The Excel software (ver. 2007, Microsoft Inc, WA, USA) was used to draw graphs and figures.
3. Results
3.1. Socio-Demographic and Physiographic Features
More than half of the respondents (54%) interviewed were in the age group of 40-60 years and a majority of them did not complete their secondary education (82%) (
Table 2). Agriculture was their primary occupation (88%) and a sizable proportion of them (72%) supplemented farm income with non-agricultural secondary occupations such as rickshaw-van pulling, running wholesale shop, working as casual wage labour etc. (68%). About 88% of the respondents belonged to general caste, rest were scheduled castes. A portion of the families were nuclear, consisted of less than 5 members (48%), while the others were extended, constituted of 5-7 members (48%). A large proportion of respondents (64%) had owned land and rest of them (36%) cultivated in leased-in land. A majority of the farmers (64%) farmed on less than an acre of land and another 28% cultivated on 1-2.5 acres land (28%). A little more than half of the farms (56%) could irrigate a part of their land with surface water, while the others had constrained or no access to irrigation source (44%). Only a negligible proportion of farmers (12%) got their soil tested and a large portion of farmers perceived their soil to be fertile (38%) or unfertile (30%). Women’s participation was very high both in farming (86%) and household activities (92%).
3.2. Climatic Trends
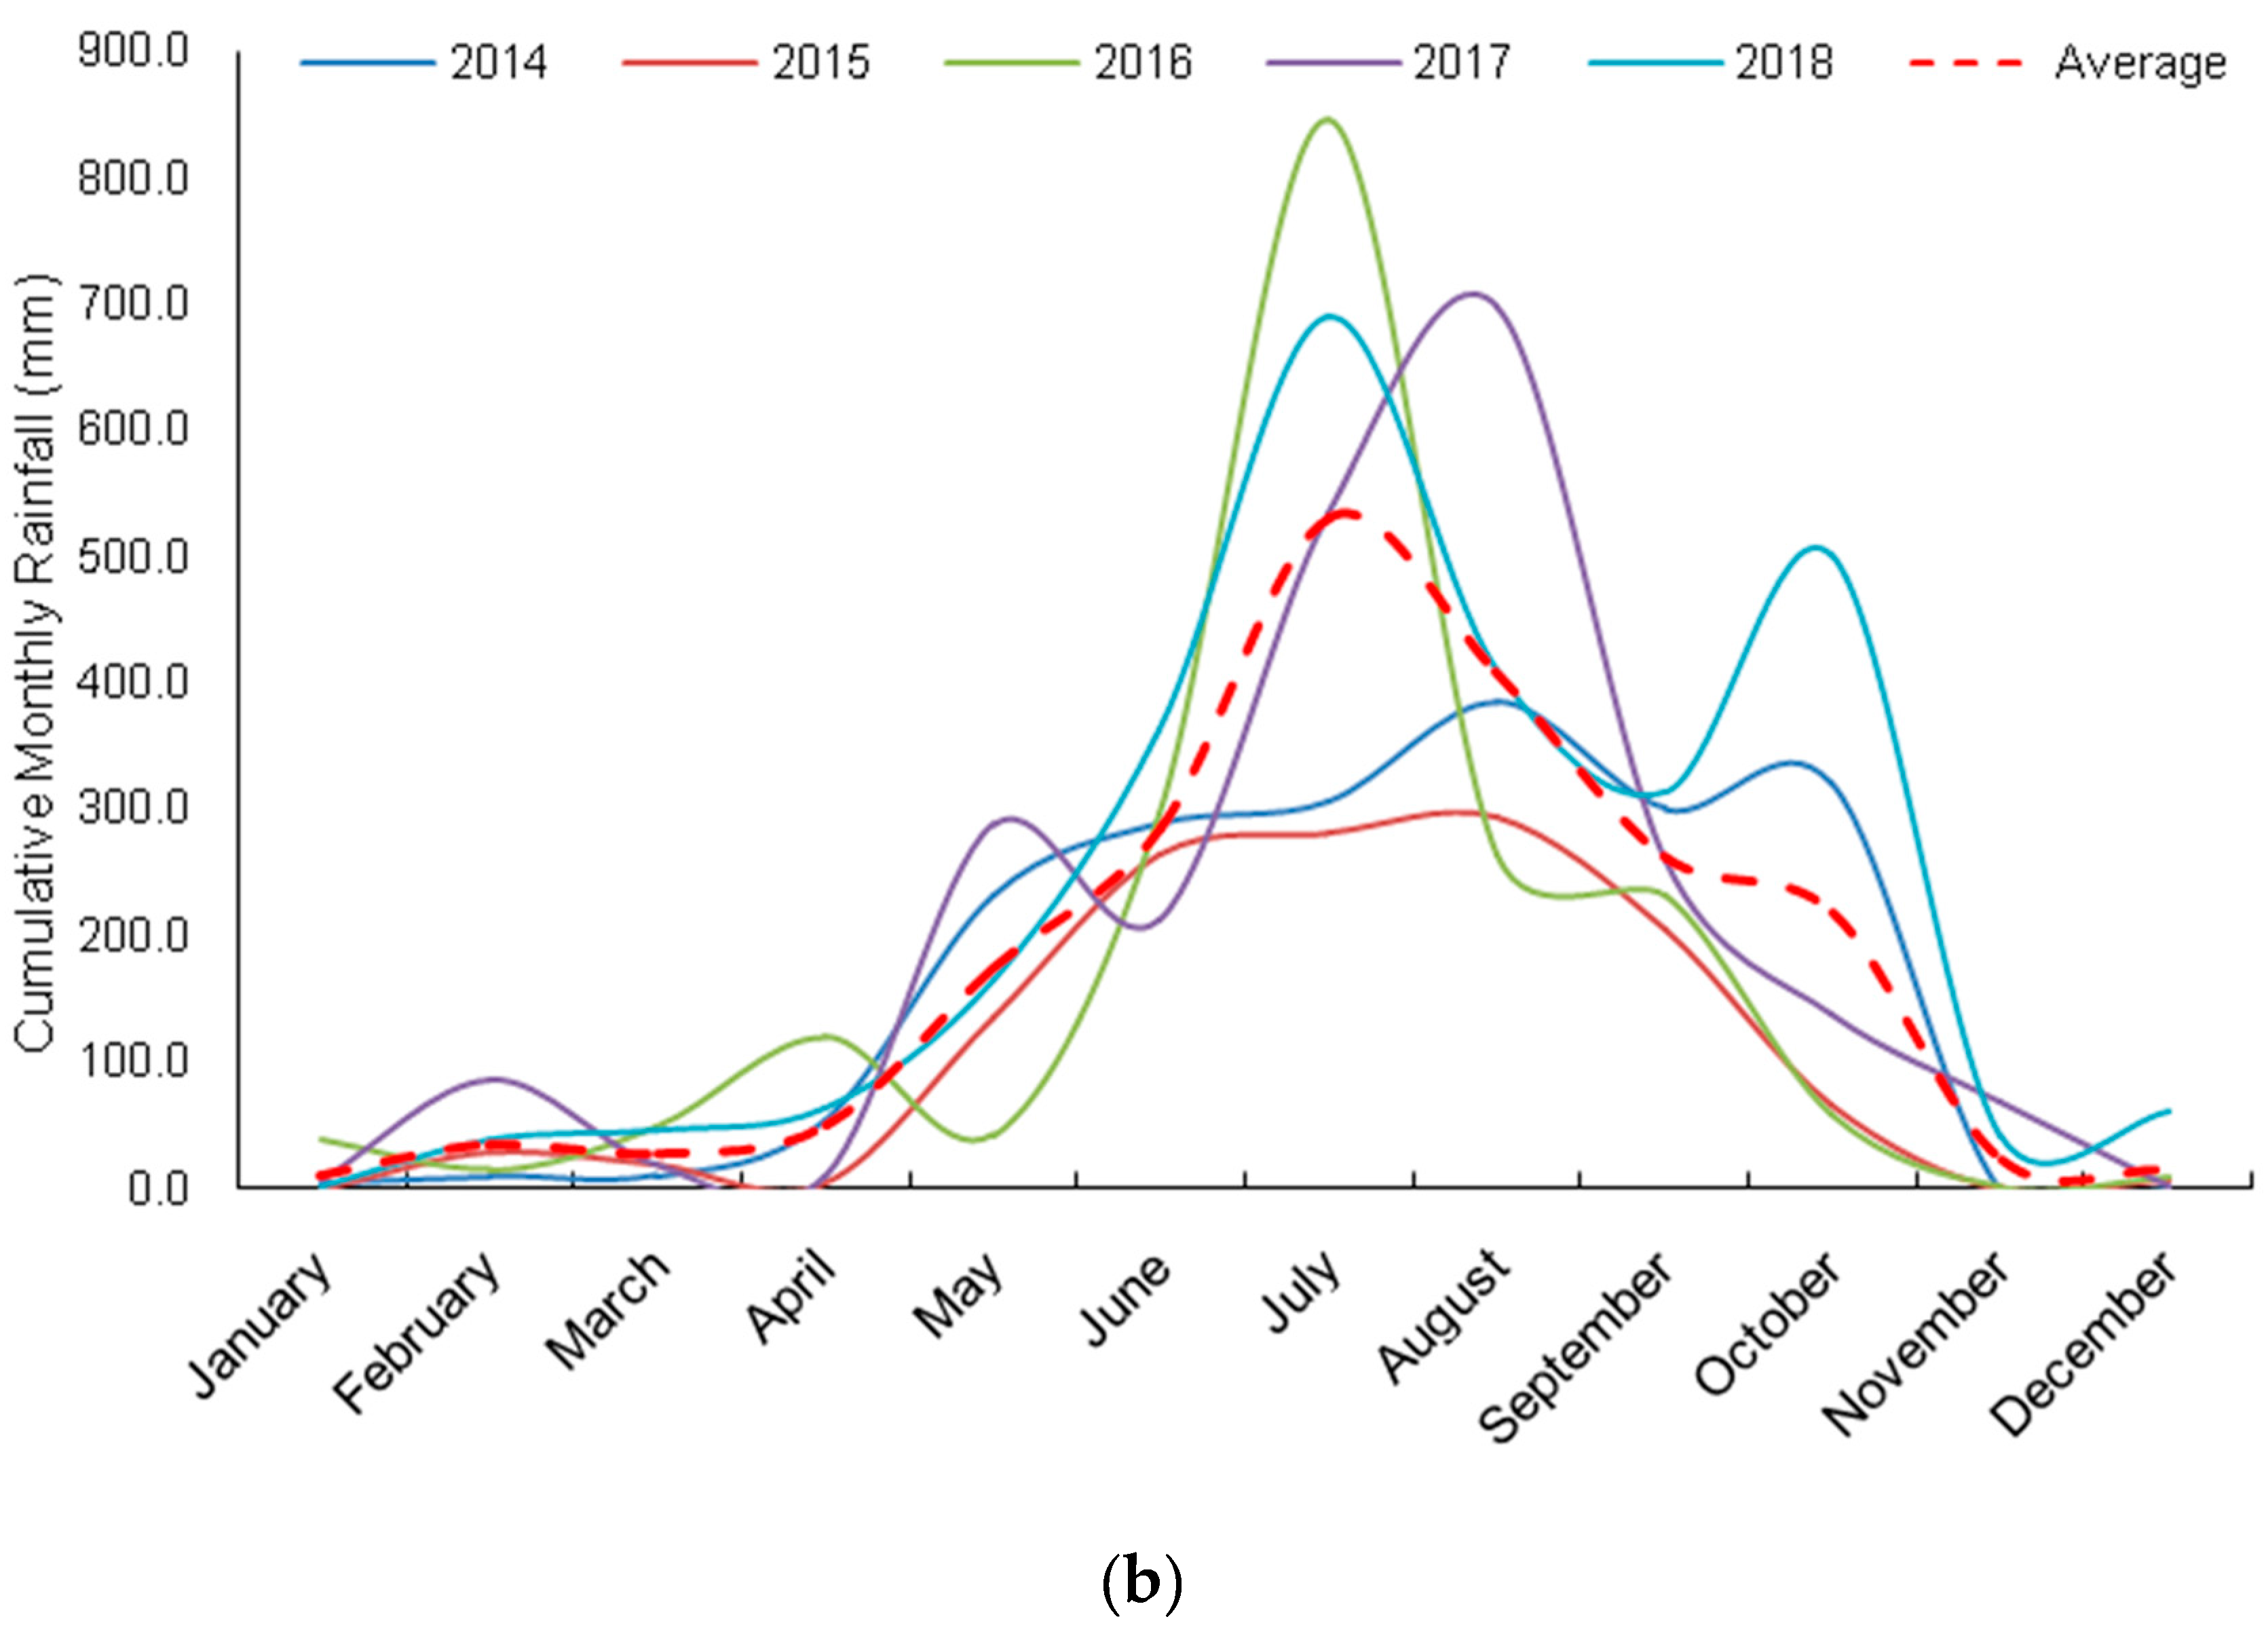
Figure 2 clearly depicts the weather conditions during 2014-18. Although the maximum and minimum temperature did not show much variability over the years (
Figure 2a), there was variability in cumulative rainfall during past years (
Figure 2b). The increment in the atmospheric temperature started in the end of February and continued up to the end of May. A sudden temperature drop was observed at the end of February during these five years.
3.3. Farmers’ Perceptions of Climate and Market Changes
Table 3 represents the seasonal variability in yield and price of rice and non-rice crops in Rangabelia and Jatirampur villages. We classified the performance of the crops and market prices as ’best,’ ’typical’ and ’worst’ seasonal conditions. The seasonal yield variation in both wet (40.74%) and dry (41.54%) season rice, lathyrus (35.71%), green gram (42.86%), and maize (34.25%) were notable. On the other hand, seasonal variability of price was markedly high for perishable crops such as tomato (53.33%), onion (44.44%), chillies (35.0%), and potato (33.33%). Price variation in lentil (42.86%) and maize (33.33%) were also high. The studied villages witnessed frequent disasters caused by salt intrusion, flood situations and natural calamities like cyclonic storms. These uncontrollable events cause huge losses to agricultural crops and household properties every year, and farmers repeatedly rebuild, adapt, transform or abandon their farming practices to sustain livelihoods. We qualitatively analysed the transcripts of the farmers’ narratives recorded during the 10 in-depth interviews and cite a few of them to demonstrate the climatic vulnerabilities for appreciating the risk analysis later in this article:
#Farmer 1: ’First, there was a flood in 2006 in my area, then Aila in 2009, and now Fani in 2019... Field crops are damaged every time because of salt intrusion in crop fields... It takes time to restore normal soil conditions... For the last few years, I have been growing lathyrus, but I do not know whether we will be able to grow it in the coming rabi (winter) season (in 2019) or not, as there will be a salinity problem.’
#Farmer 2: Due to these devastating effects of nature, sustainable livelihood is affected, and despite adoption of new technologies and varieties farmers could hardly have any savings because of these recurrent cyclone or flood.
#Farmer 3: ’I use farm profit to meet family expenditure, but there are no extra savings because every year we have to face cyclone and flood... We face damages to our property like homes, ponds and crop fields. And every time it takes some time to recover from the situation. Not only that, but the uncertain weather conditions like early monsoon also sometimes destroy the summer (pre-kharif) crops.’
#Farmer 9: this year, due to the early monsoon, I incurred huge loss, and could manage only 188.75 kg/ha yield of green gram. The price of green gram varied from INR35 to 45/kg in general. However, in some years it may rise up to INR65/kg. But we seldom get an opportunity to exploit the price rise.”
#Farmer 10: ’Chilli was once a very remunerative crop in our area. But frequent virus attack (chilli leaf curl virus) has reduced the area of chilli cultivation. The price also varies... if demand rises in market and if it is your lucky day, you will be able to sale it at INR120 per kg, but in normal situation it is generally sold at INR55 to 65.’
3.4. Productivity of Rice-Based Cropping Systems
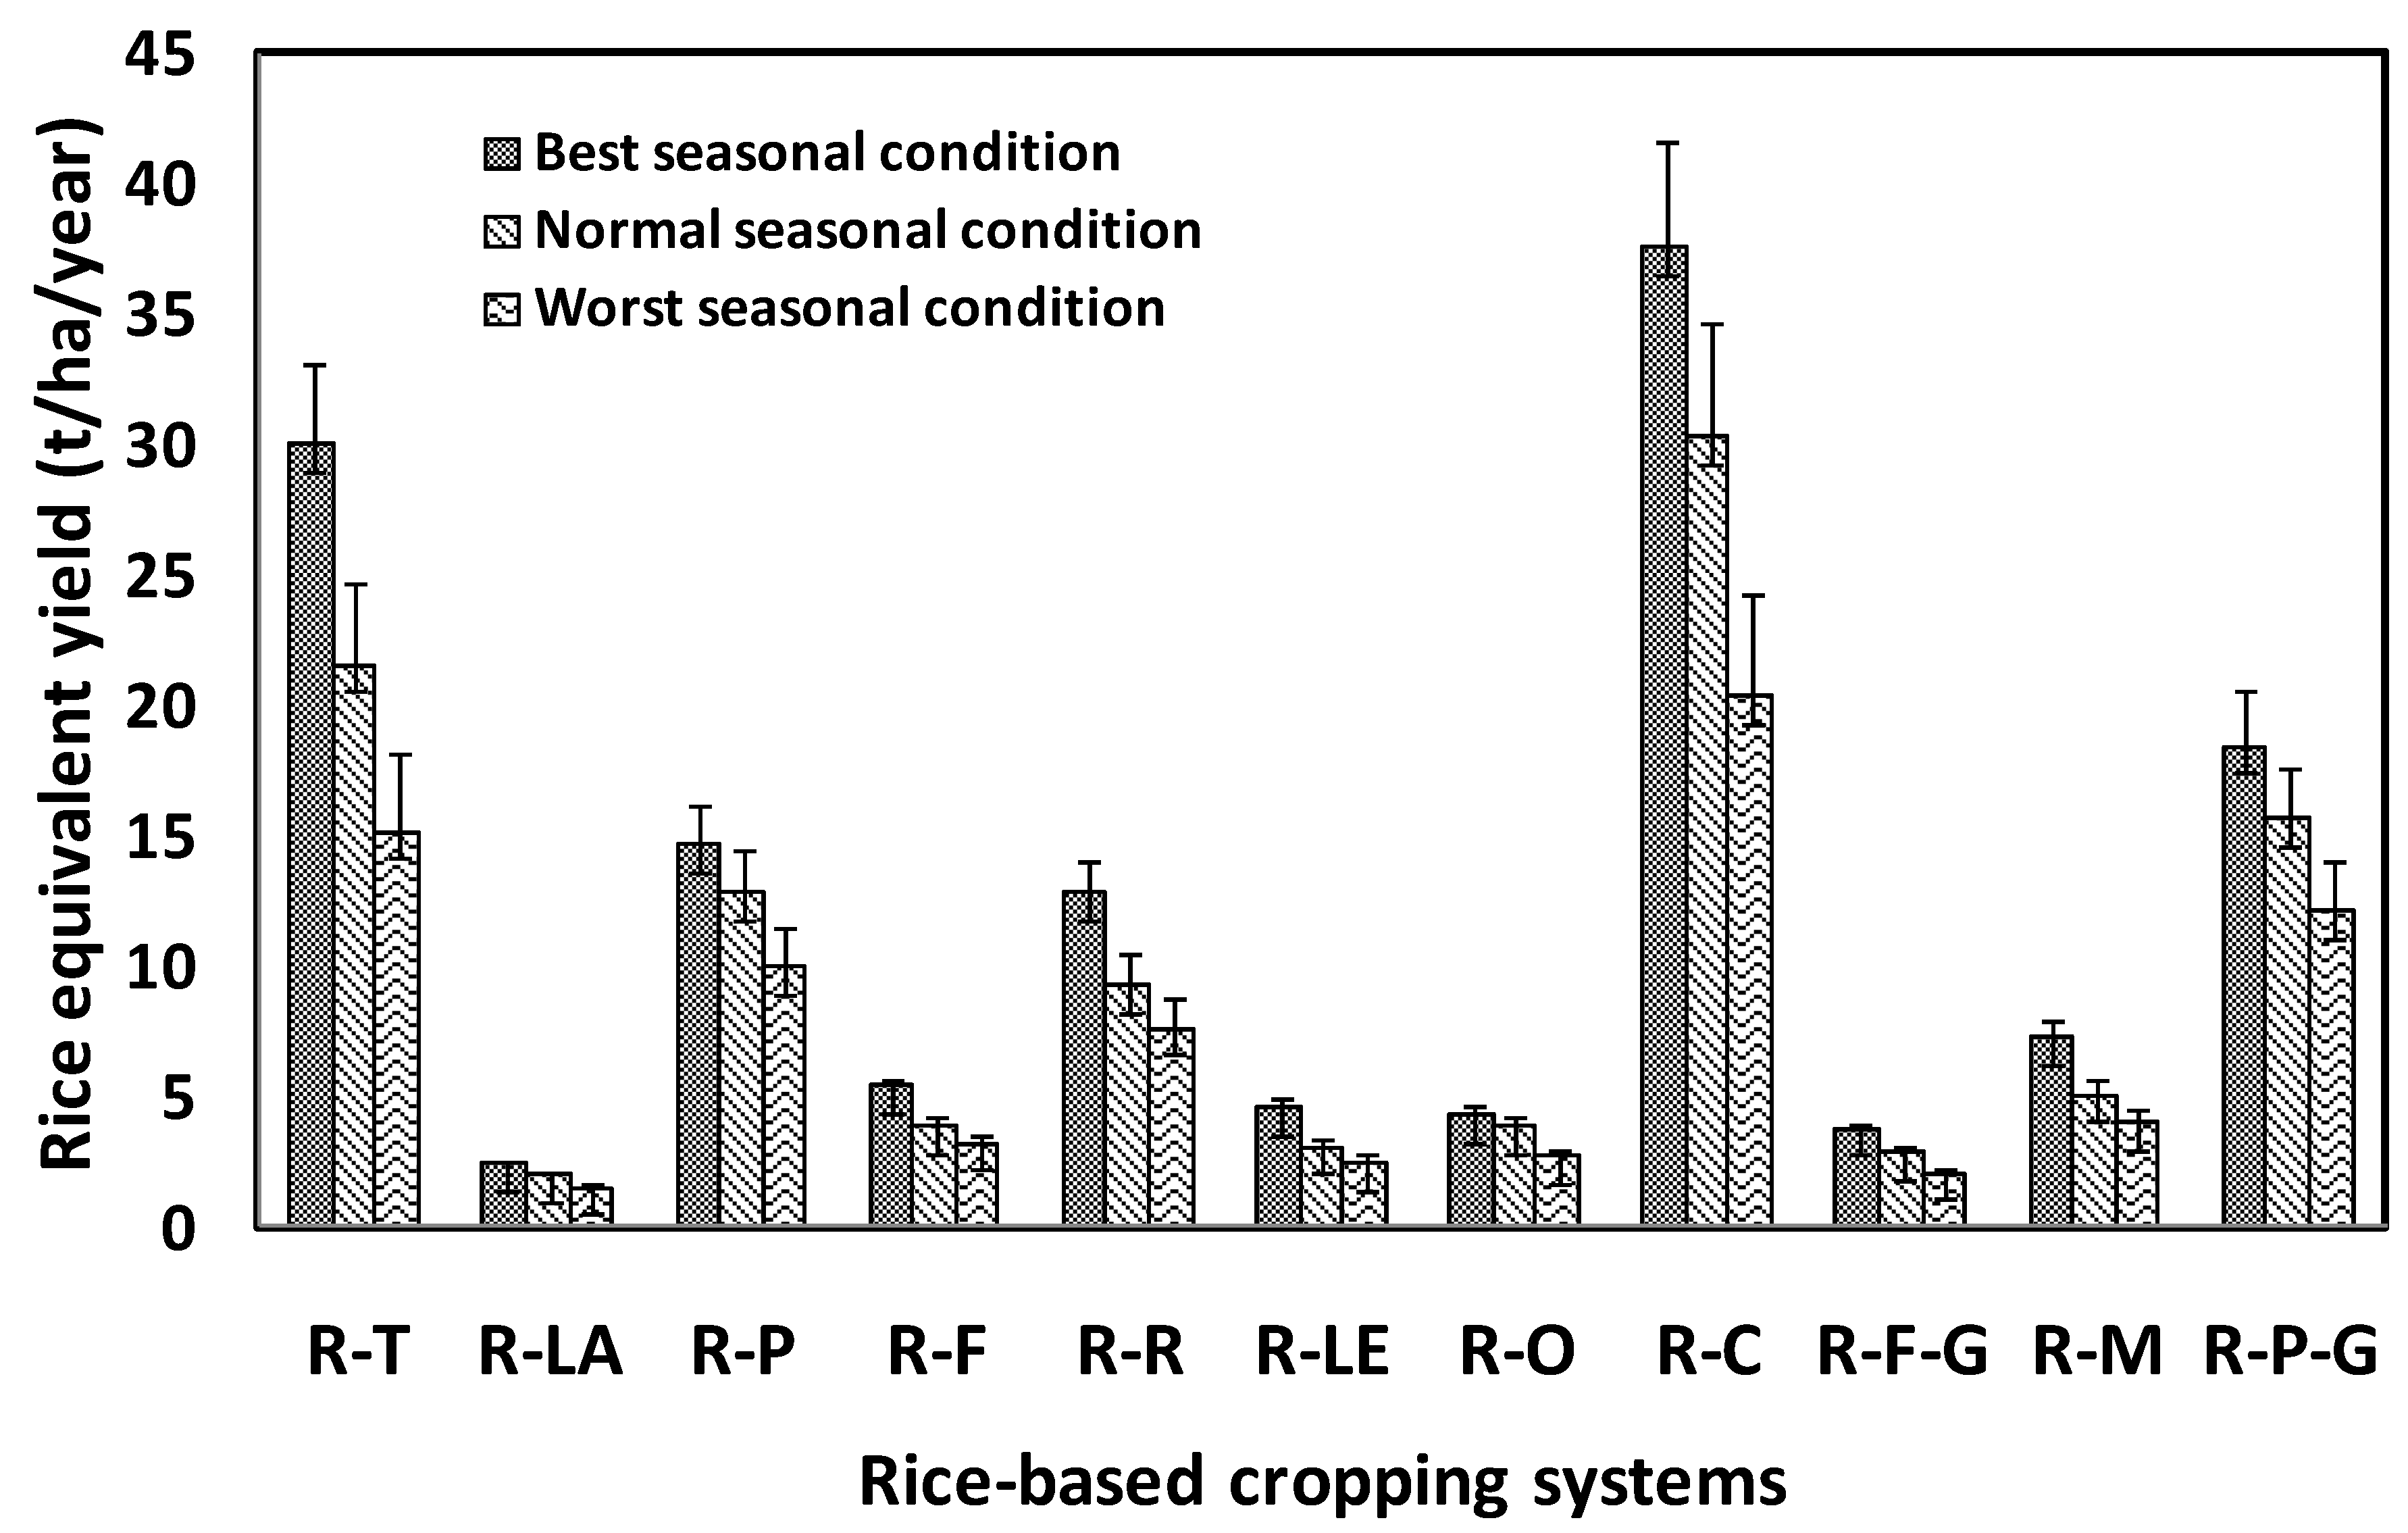
The rice-equivalent yield (REY) was estimated for all three situations – best, normal, and worst (
Figure 3), for different existing and potential cropping systems can be envisaged from (details in
Table 1). We observed that irrespective of the best, normal and worst weather situations, rice-lathyrus, followed by rice-onion and rice-lentil recorded the lowest rice-equivalent yields among different existing cropping systems. However, highest rice-equivalent yields were recorded for rice-chilli, followed by rice-tomato and rice-potato-green gram systems (
Figure 3).
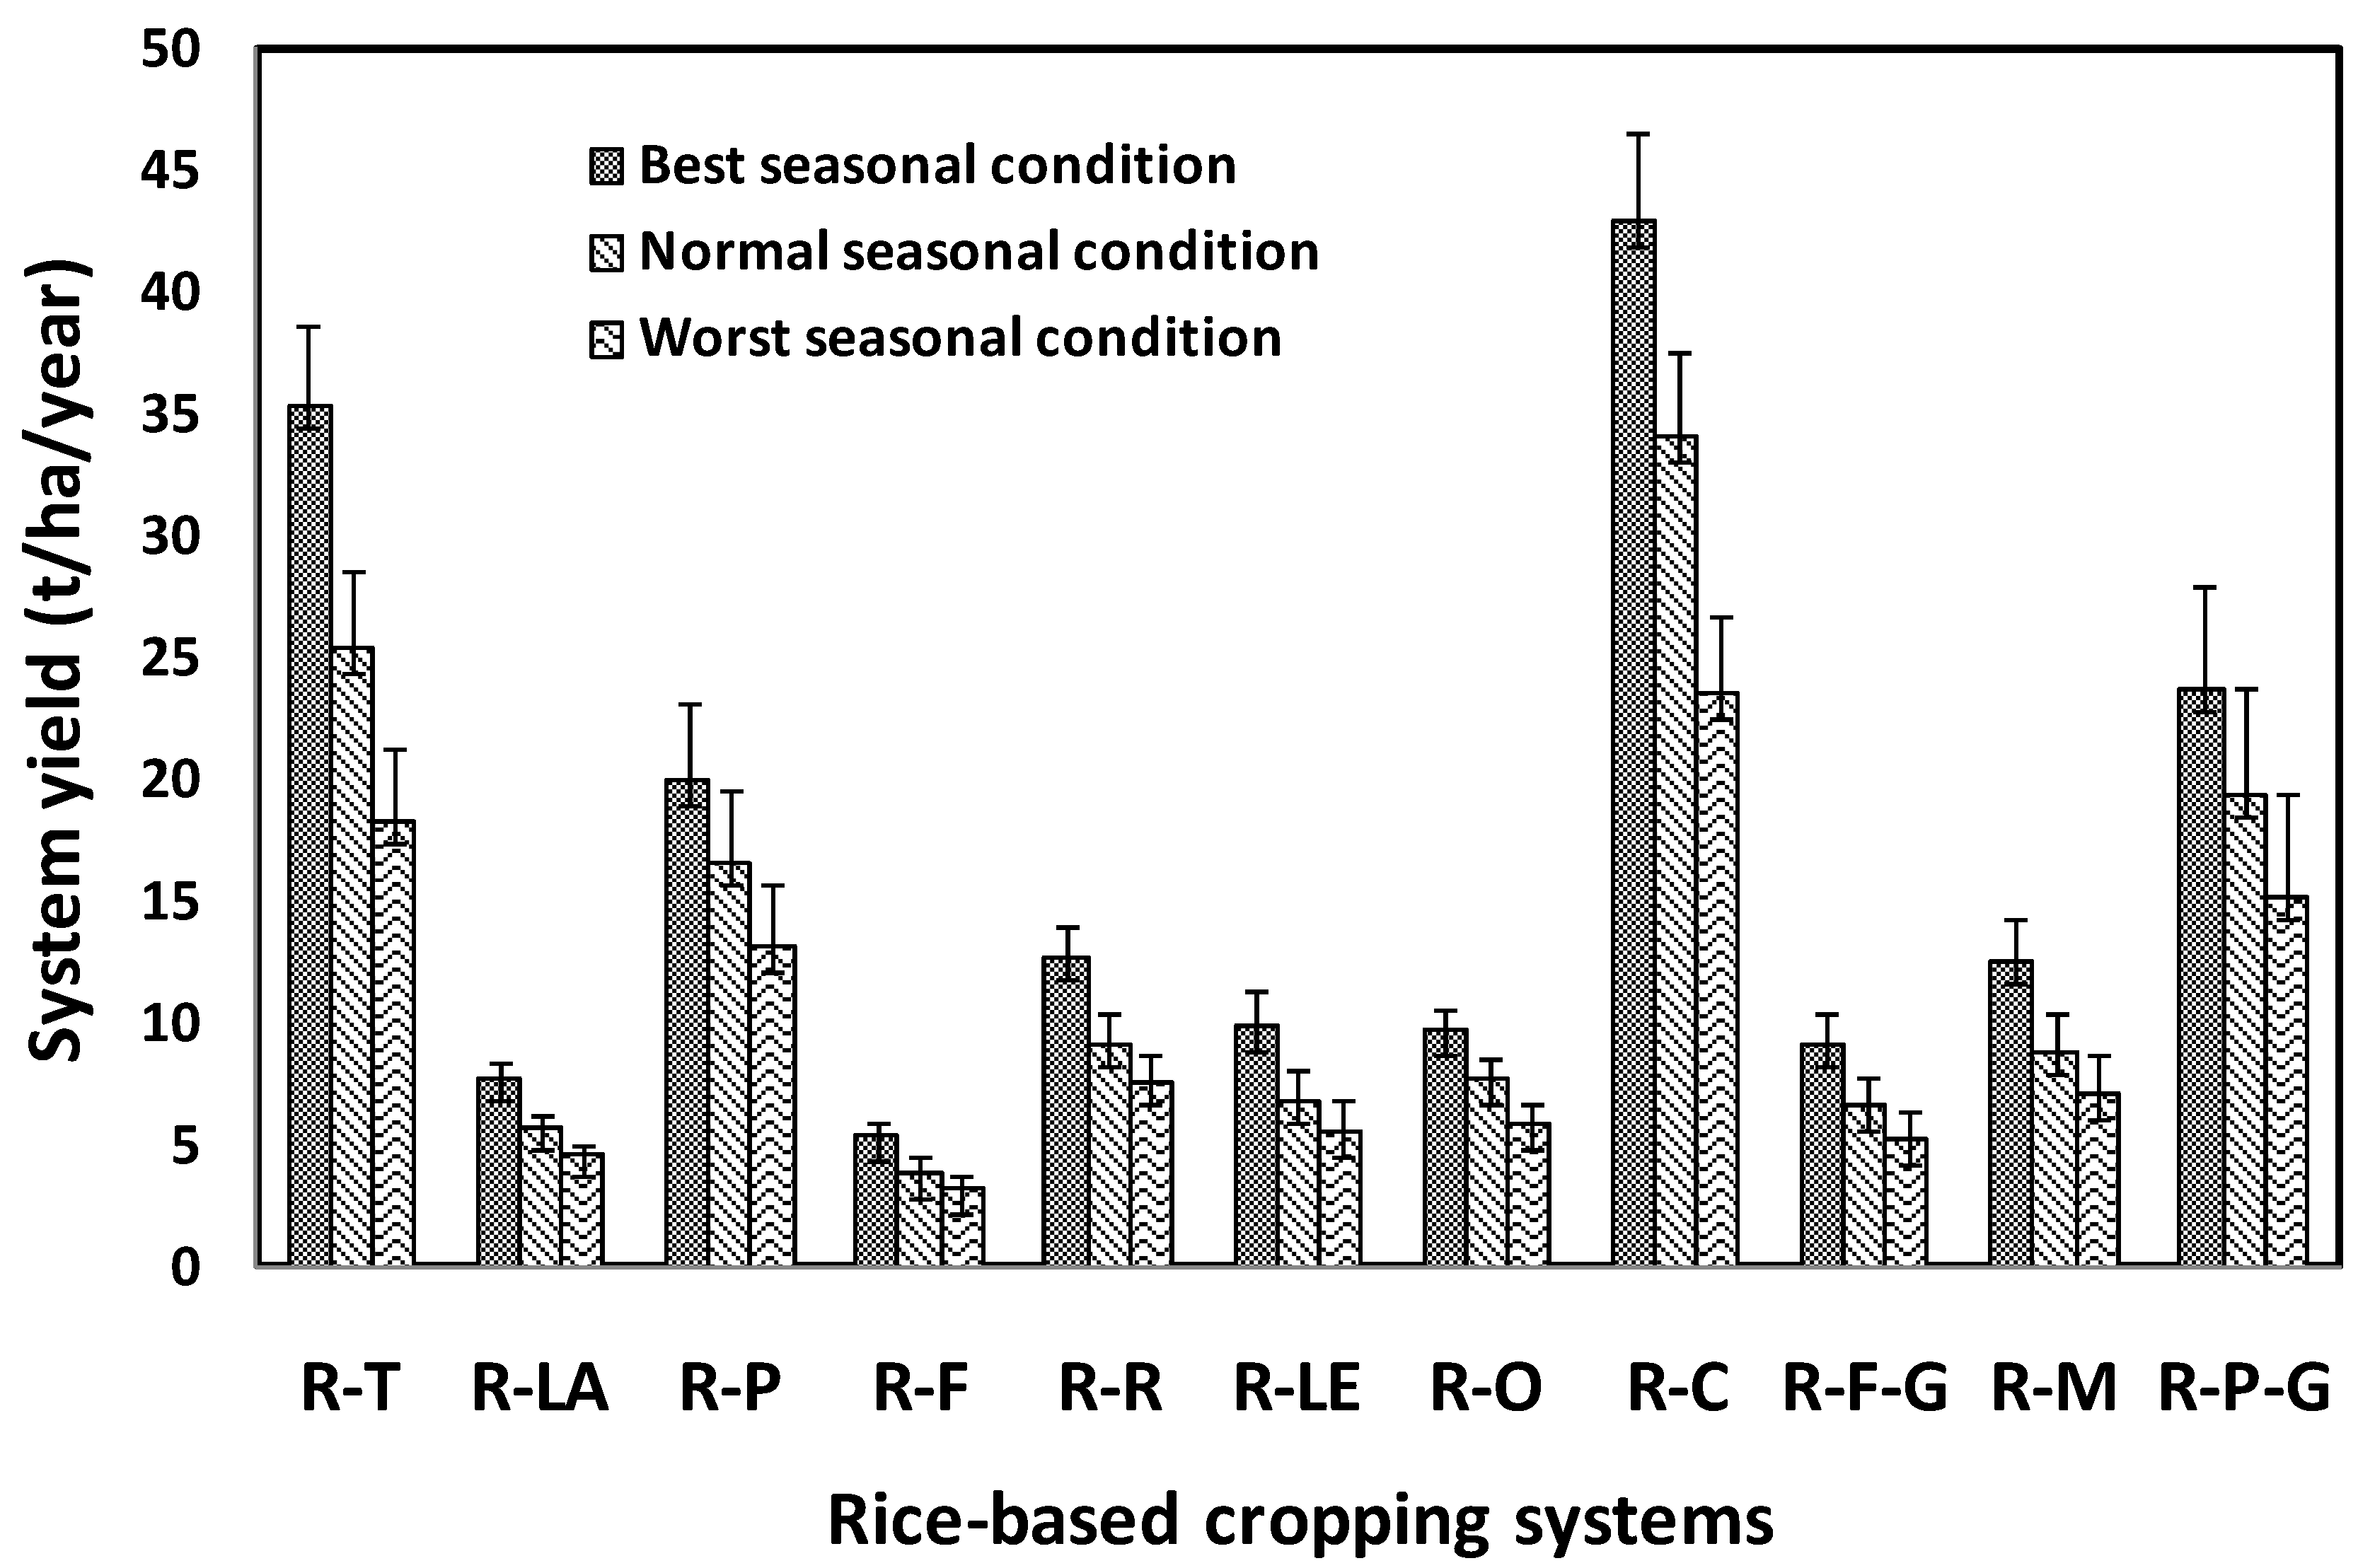
The system yield of different rice-based systems showed almost similar trend as was observed in case of REY (
Figure 4). Highest system yield among different existing systems was estimated for rice-chilli, followed by rice-tomato and rice-potato. On the other hand, lowest system yield was observed for rice-fallow system. Among the potential systems, highest system yield was estimated for rice-potato-green gram system and lowest was observed for rice-fallow-green gram system.
3.5. Profitability of Rice-Based Cropping Systems
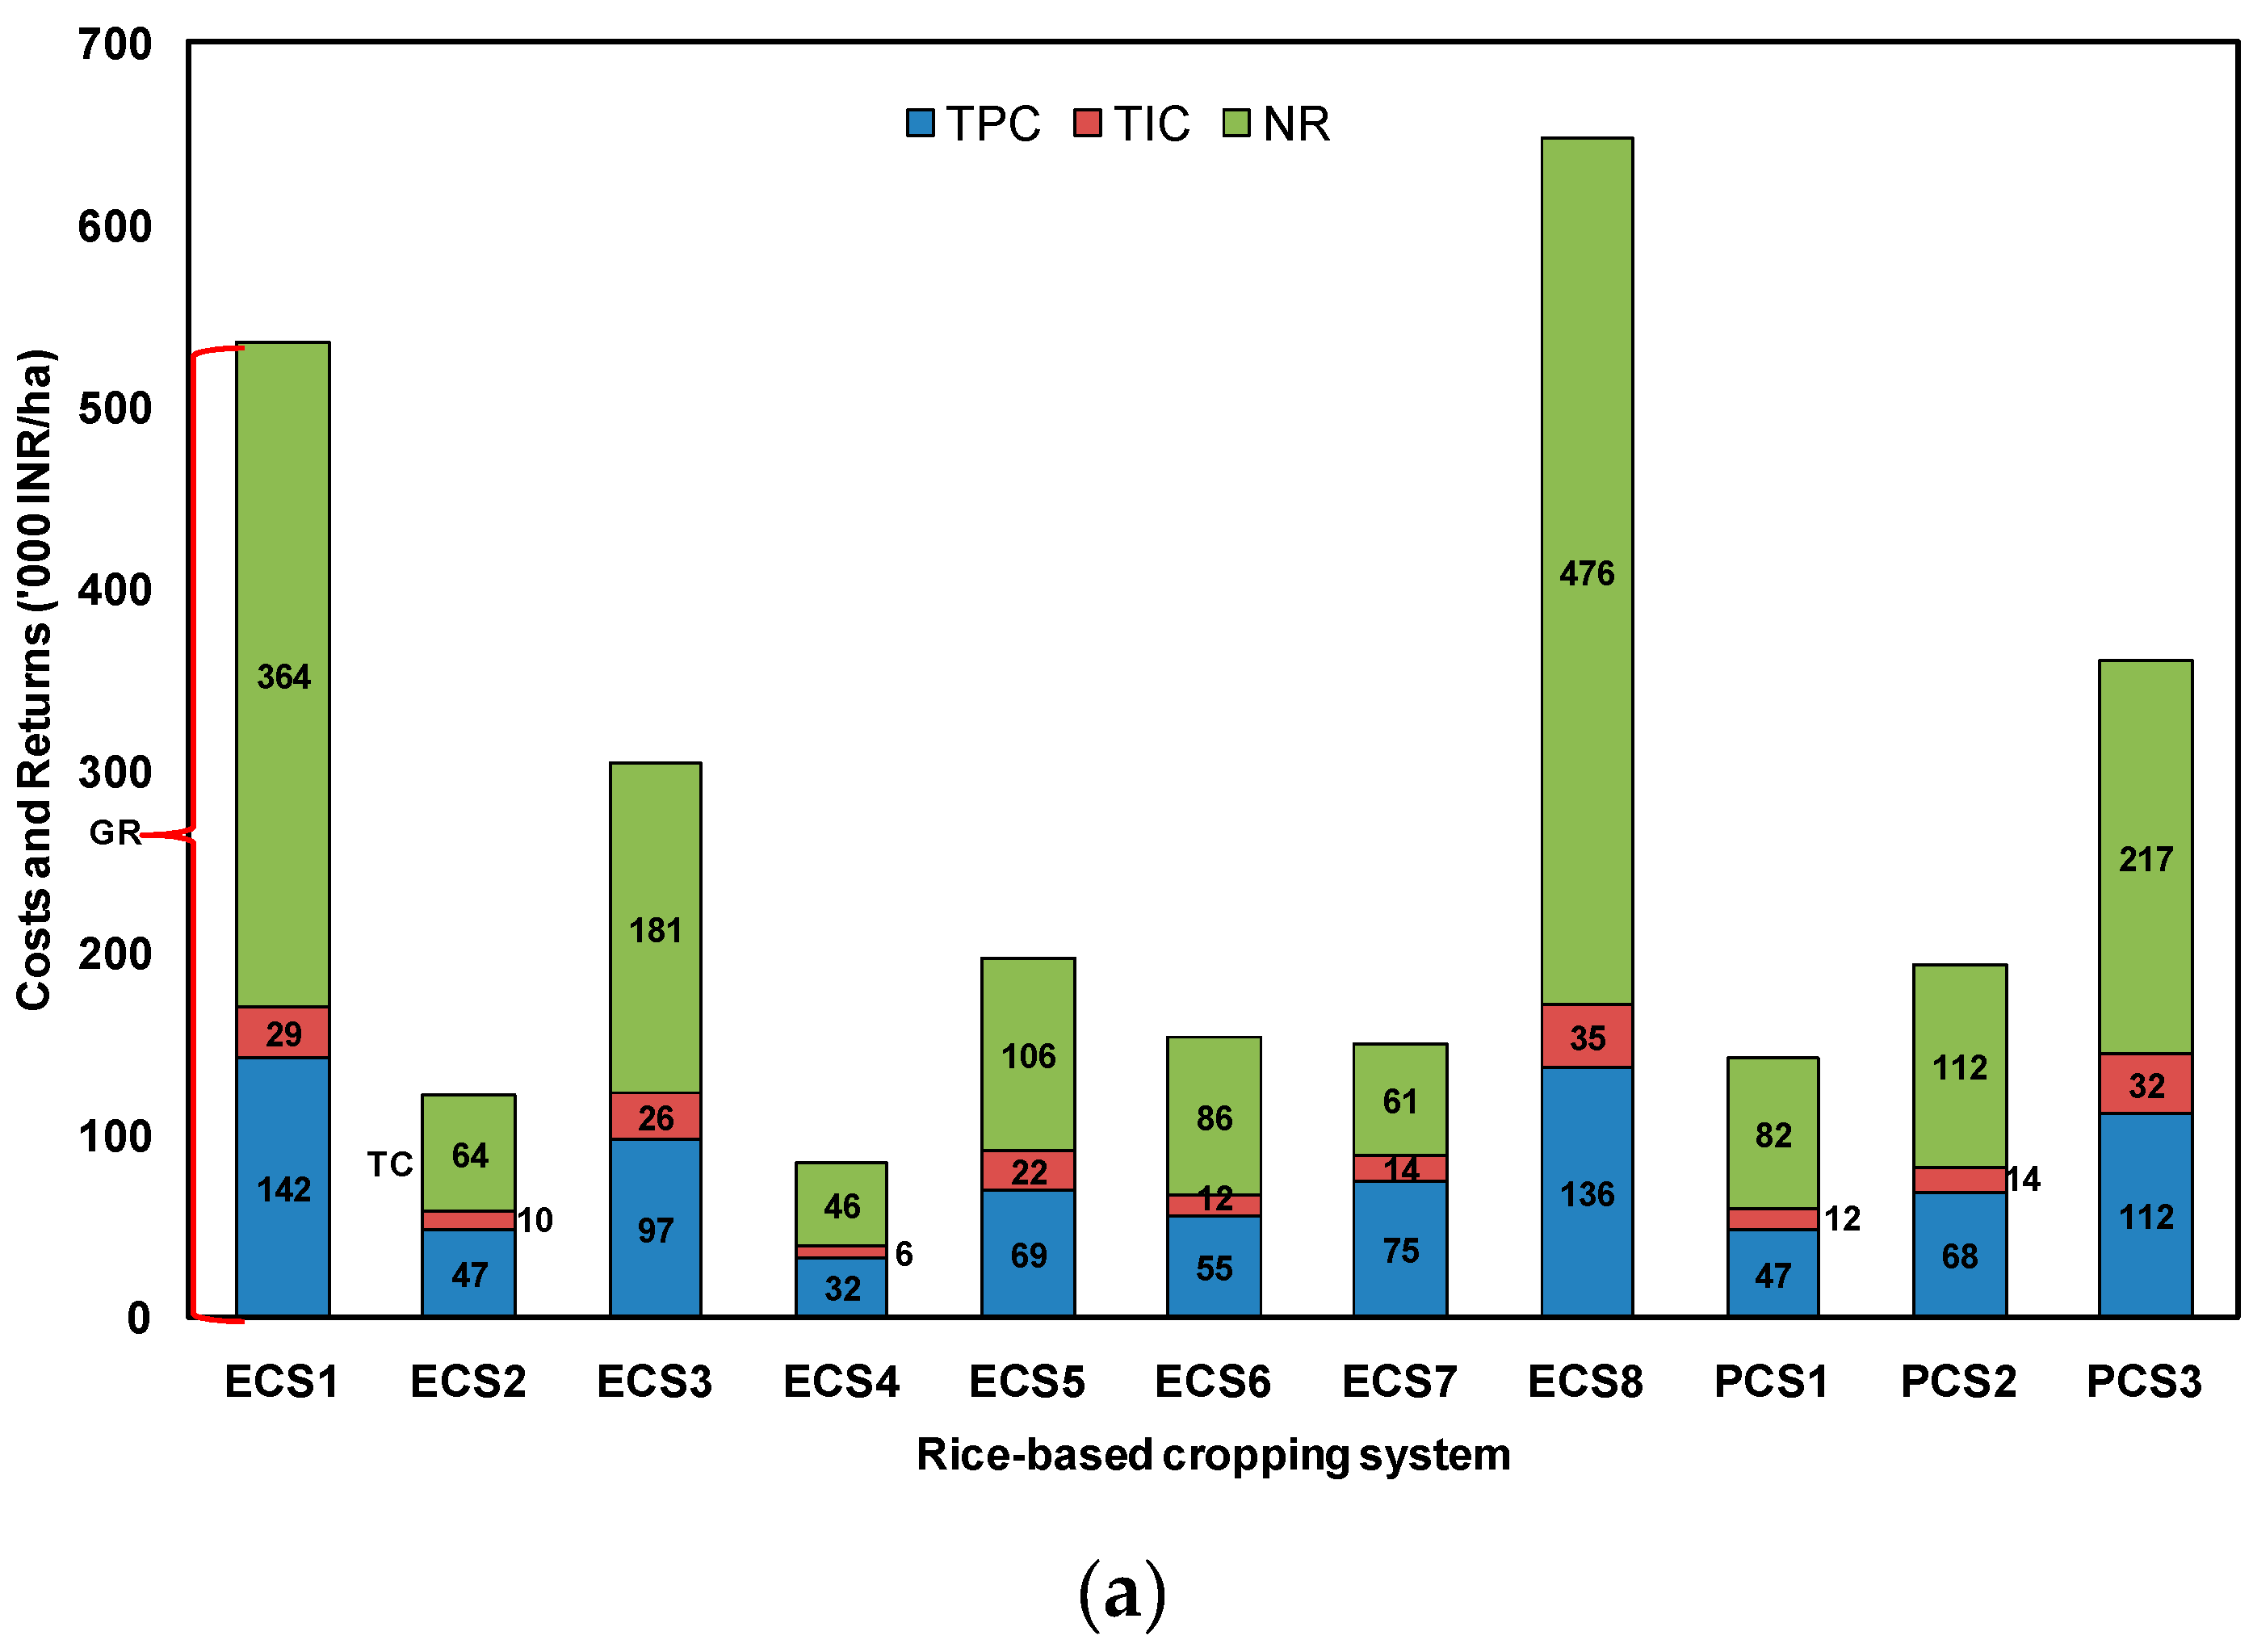
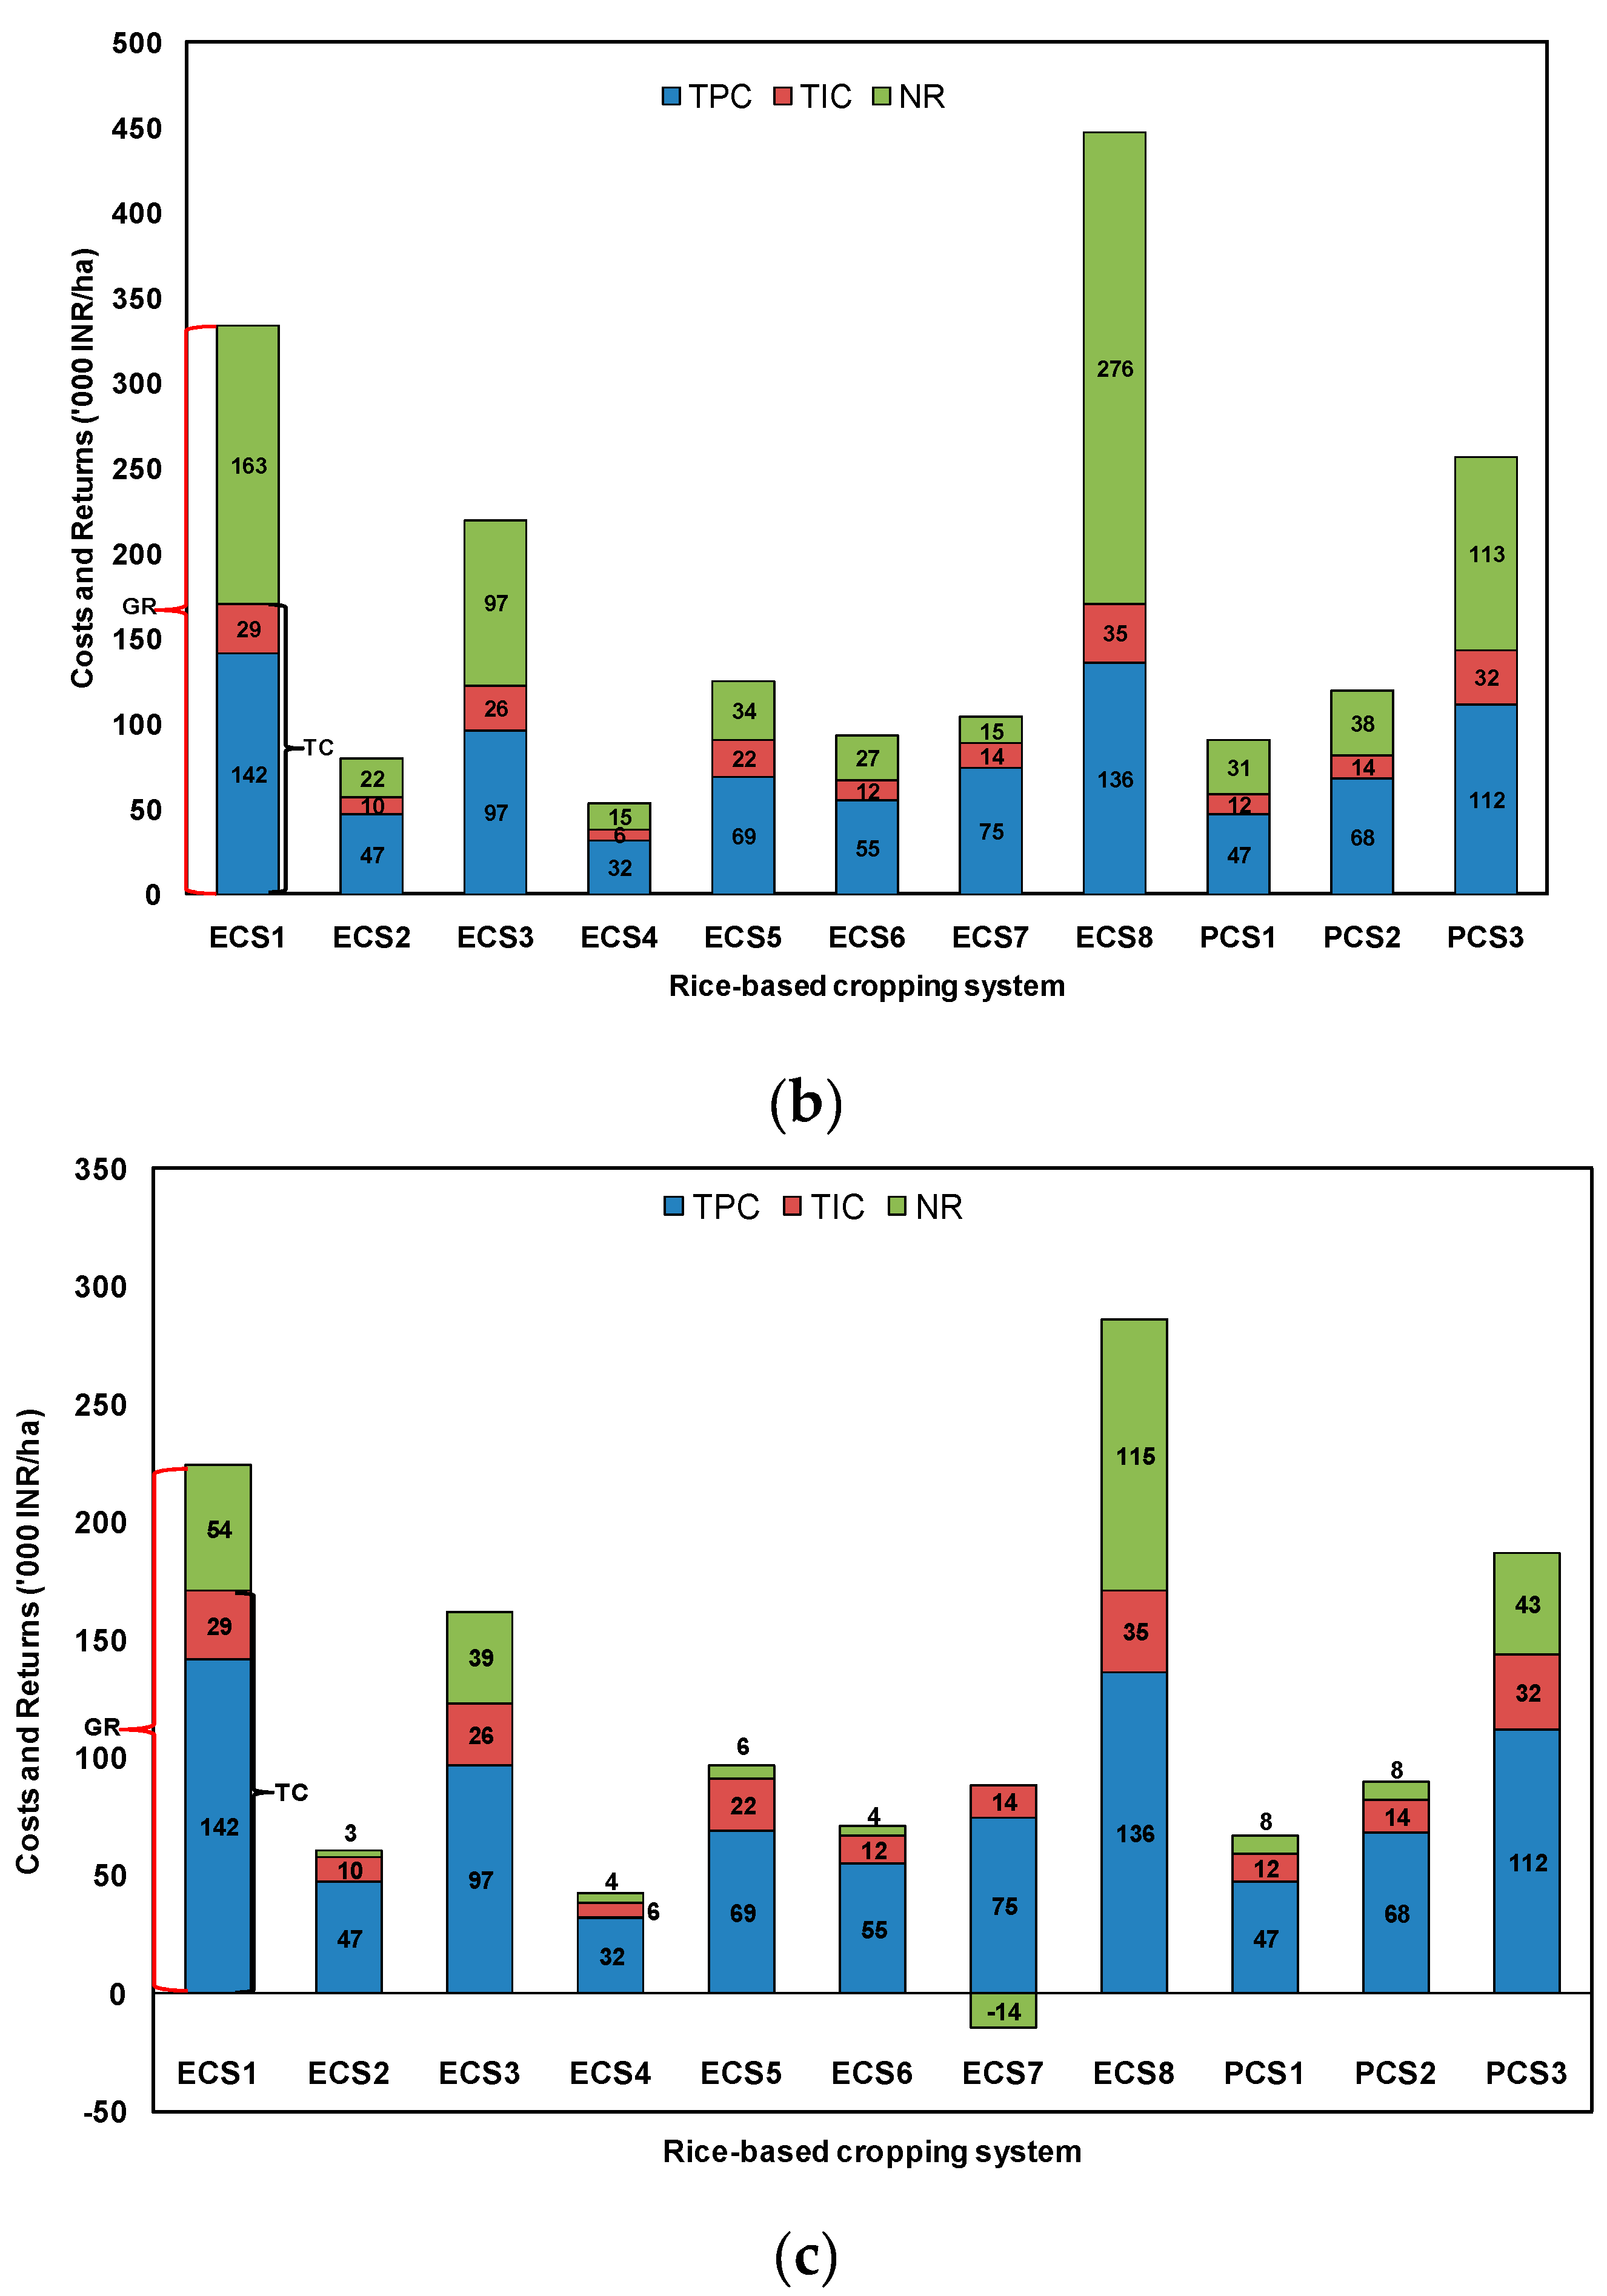
Figure 5 presents the relative economic performance of existing and potential rice-based cropping systems in Rangabelia and Jatirampur villages. Per hectare total paid out cost (TPC), total imputed cost (TIC) and total cost (TC) of the systems did not vary with climate and market variability. It was estimated that TPC of rice-tomato was higher followed by rice-chilli, rice-potato-greengram and rice-potato. However, irrespective of seasonal conditions (best, normal and worst), rice-chilli gave higher net return followed by rice-tomato and rice-potato-greengram (
Figure 5). Rice-fallow system recorded the lowest value for both the parameters. Under worst seasonal conditions, rice-onion system gave negative net return (
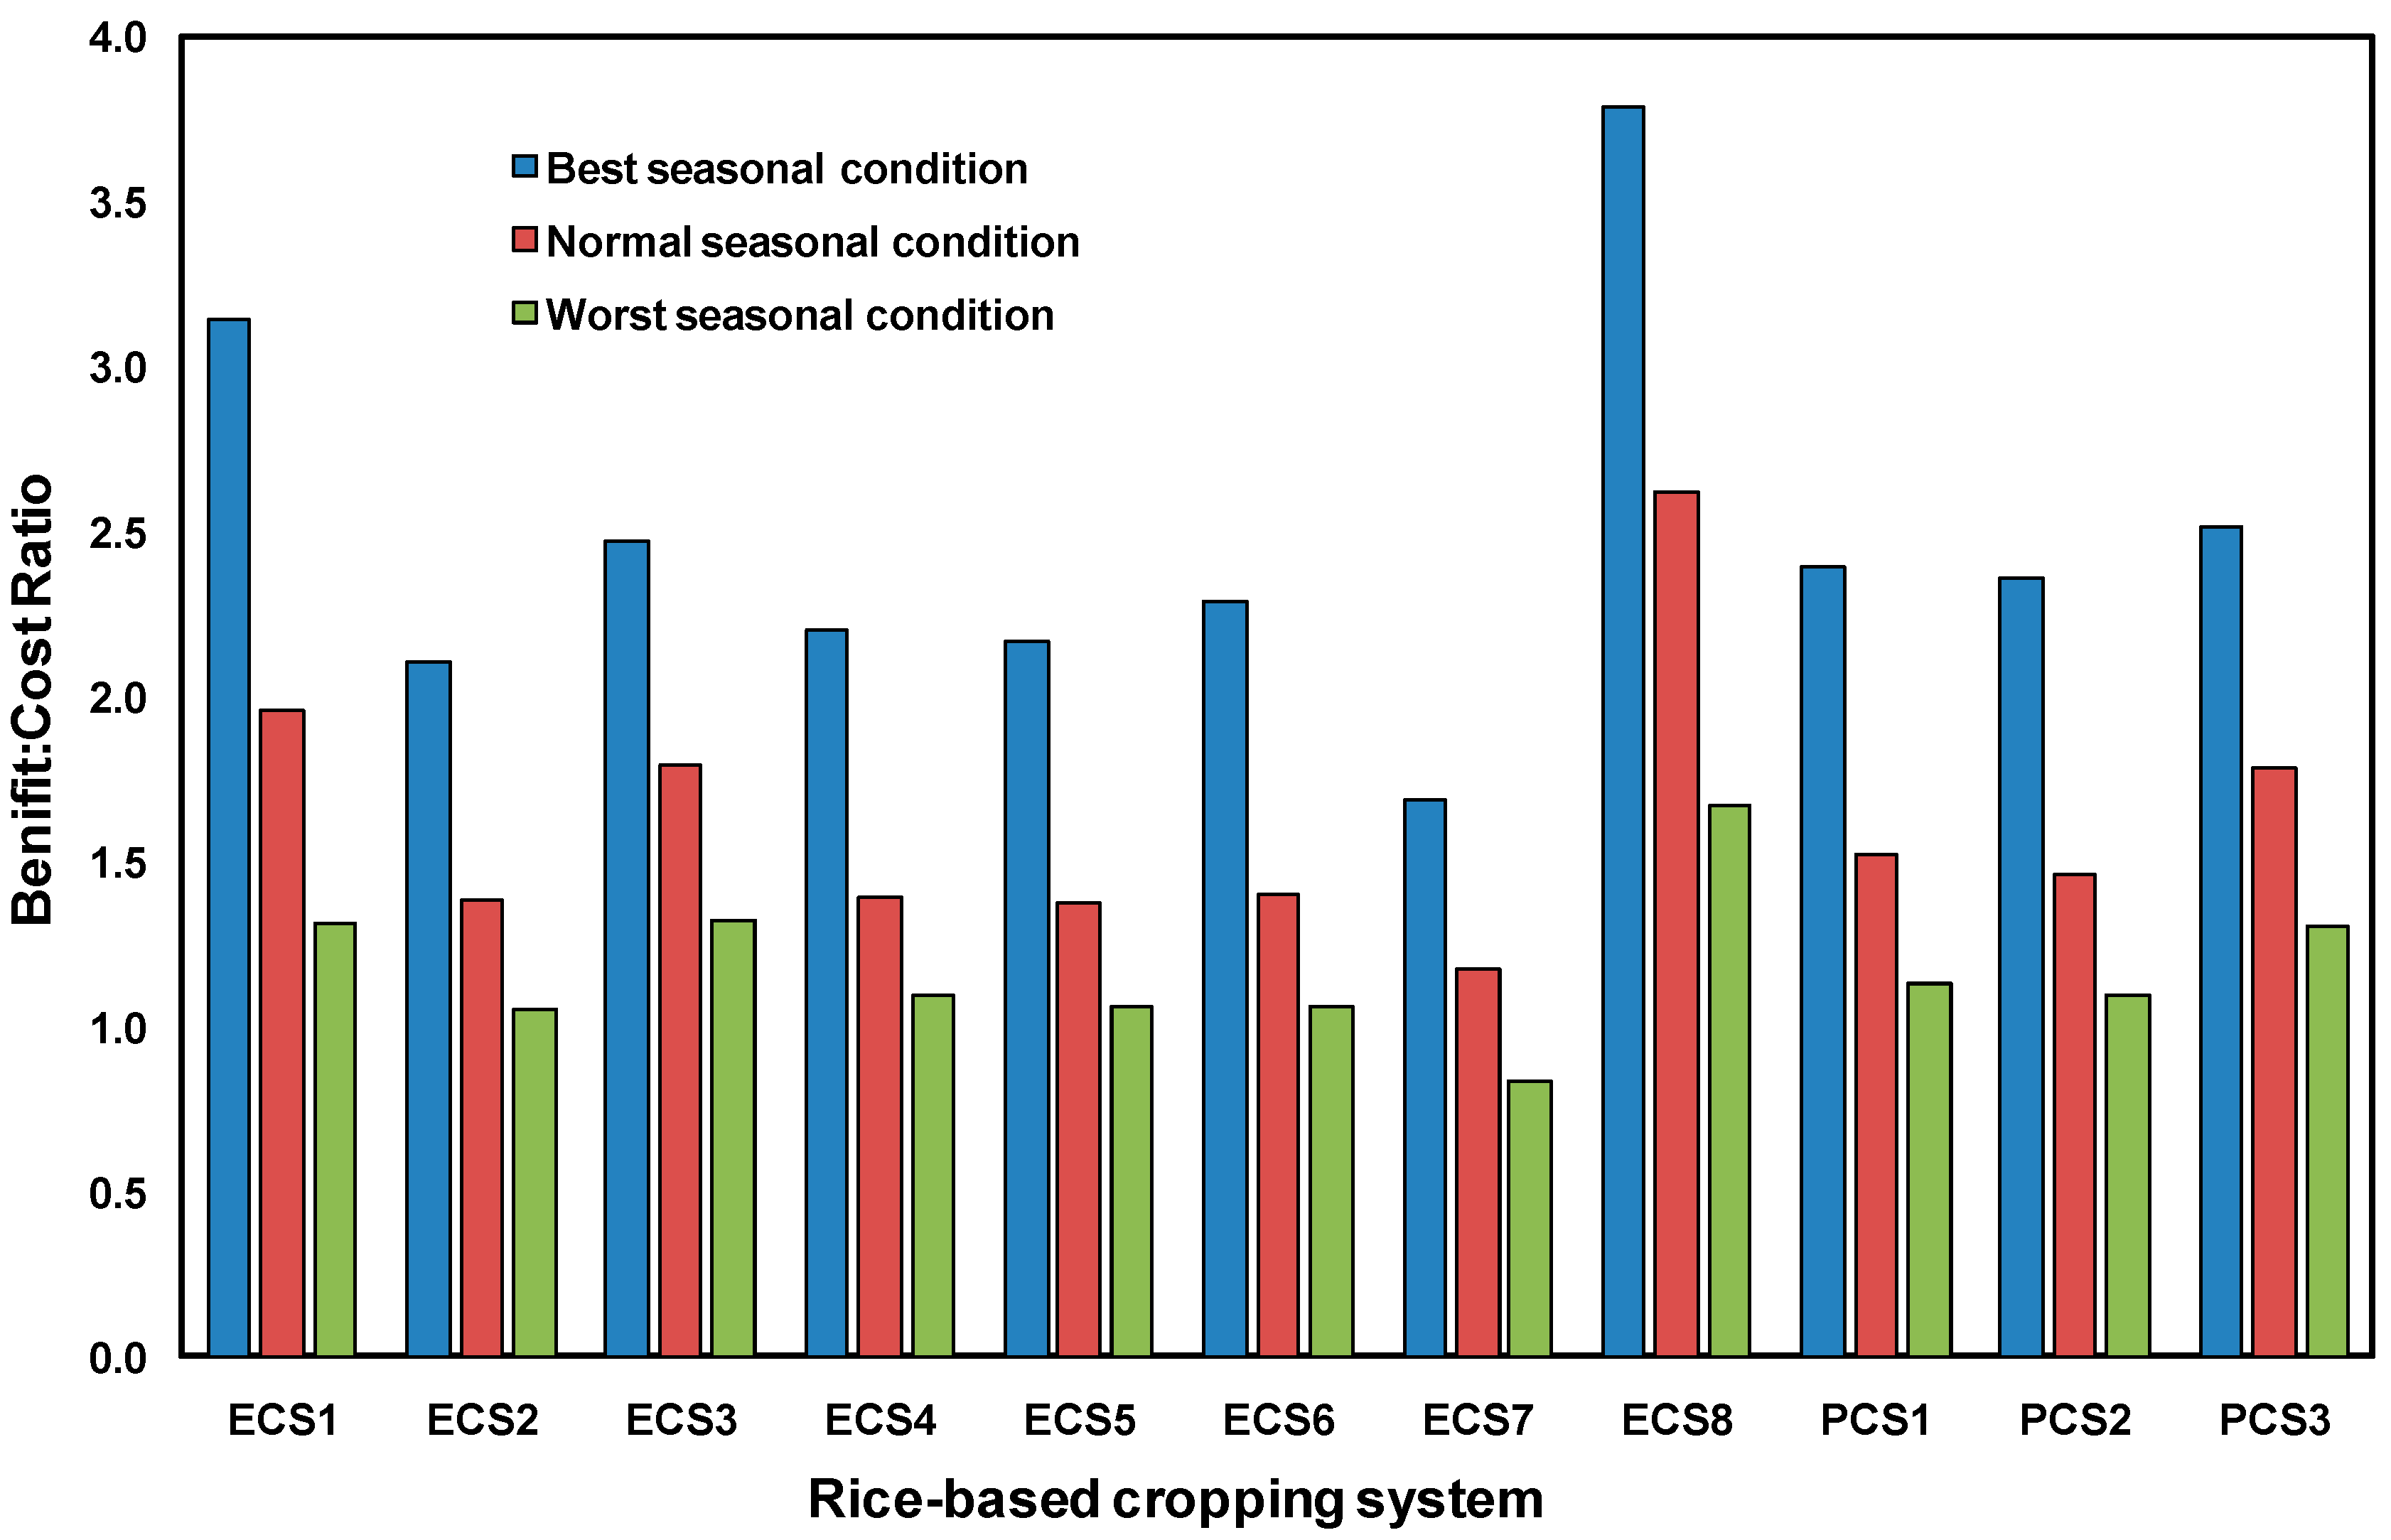
Figure 5c). It can be noted that except for rice-onion system, combinations of rainy season rice followed by non-rice crop (in post-monsoon dry season) in the cropping systems were economically more efficient compared to rainy season rice followed by summer rice. Among the potential systems, it was observed that three-crop systems (rice-potato-green gram i.e., PCS3) gave higher net return compared to two-crop systems (rice-fallow-green gram, PCS1 and rice-maize, PCS2). The benefit:cost ratio of different rice-based systems is shown in
Figure 6. Under both best, normal and worst situations, highest B:C ratio was observed for rice-chilli, rice-tomato, rice-potato-green gram and rice-potato systems. However, lowest B:C ratio was observed in case of rice-onion system.
3.6. Stochastic Dominance Analysis
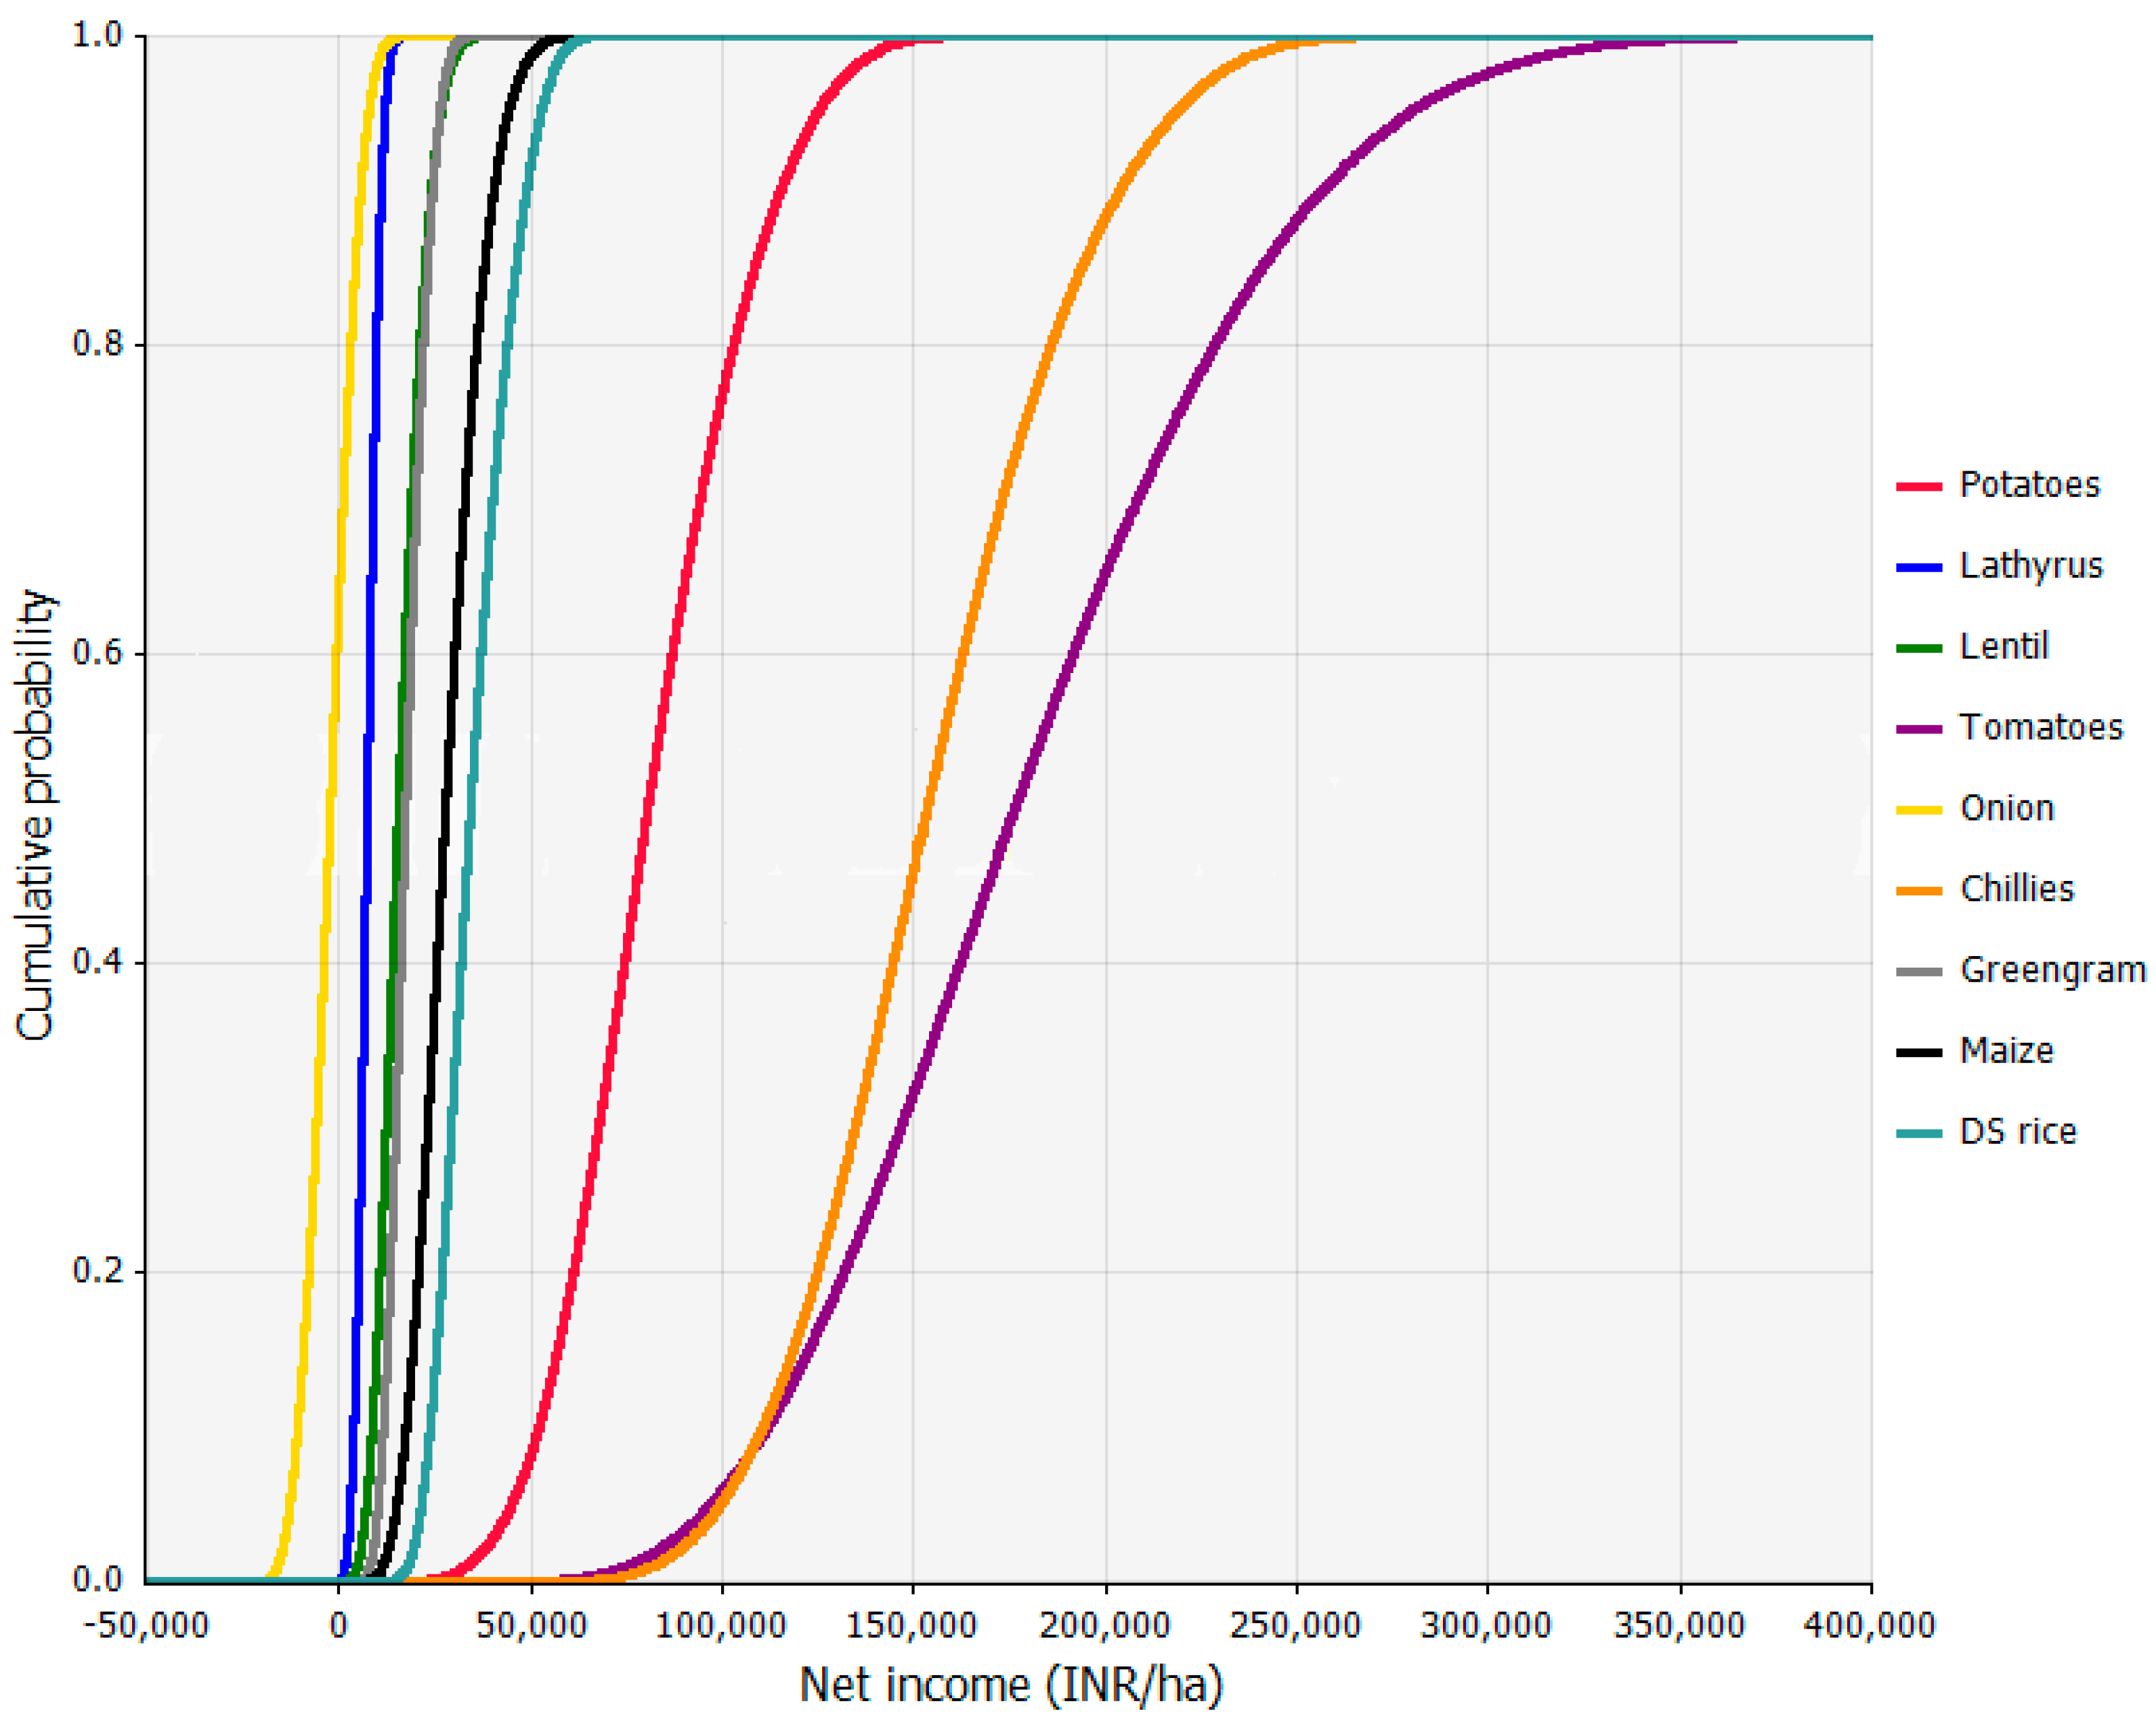
The stochastic dominance analysis was carried out to assess risk and returns trade-off in the existing and potential cropping systems. We performed the CDFs for all rice and non-rice crops, all existing systems and also for existing + potential systems separately. CDFs of rice and non-rice crops in
Figure 7 clearly depicts that CDFs for tomatoes lies on the right side followed by chilli and potato, respectively, and those for dry-season rice, maize, green gram, lentil and lathyrus, respectively in the middle position (from right to middle), and CDF for onion is in the left position. From
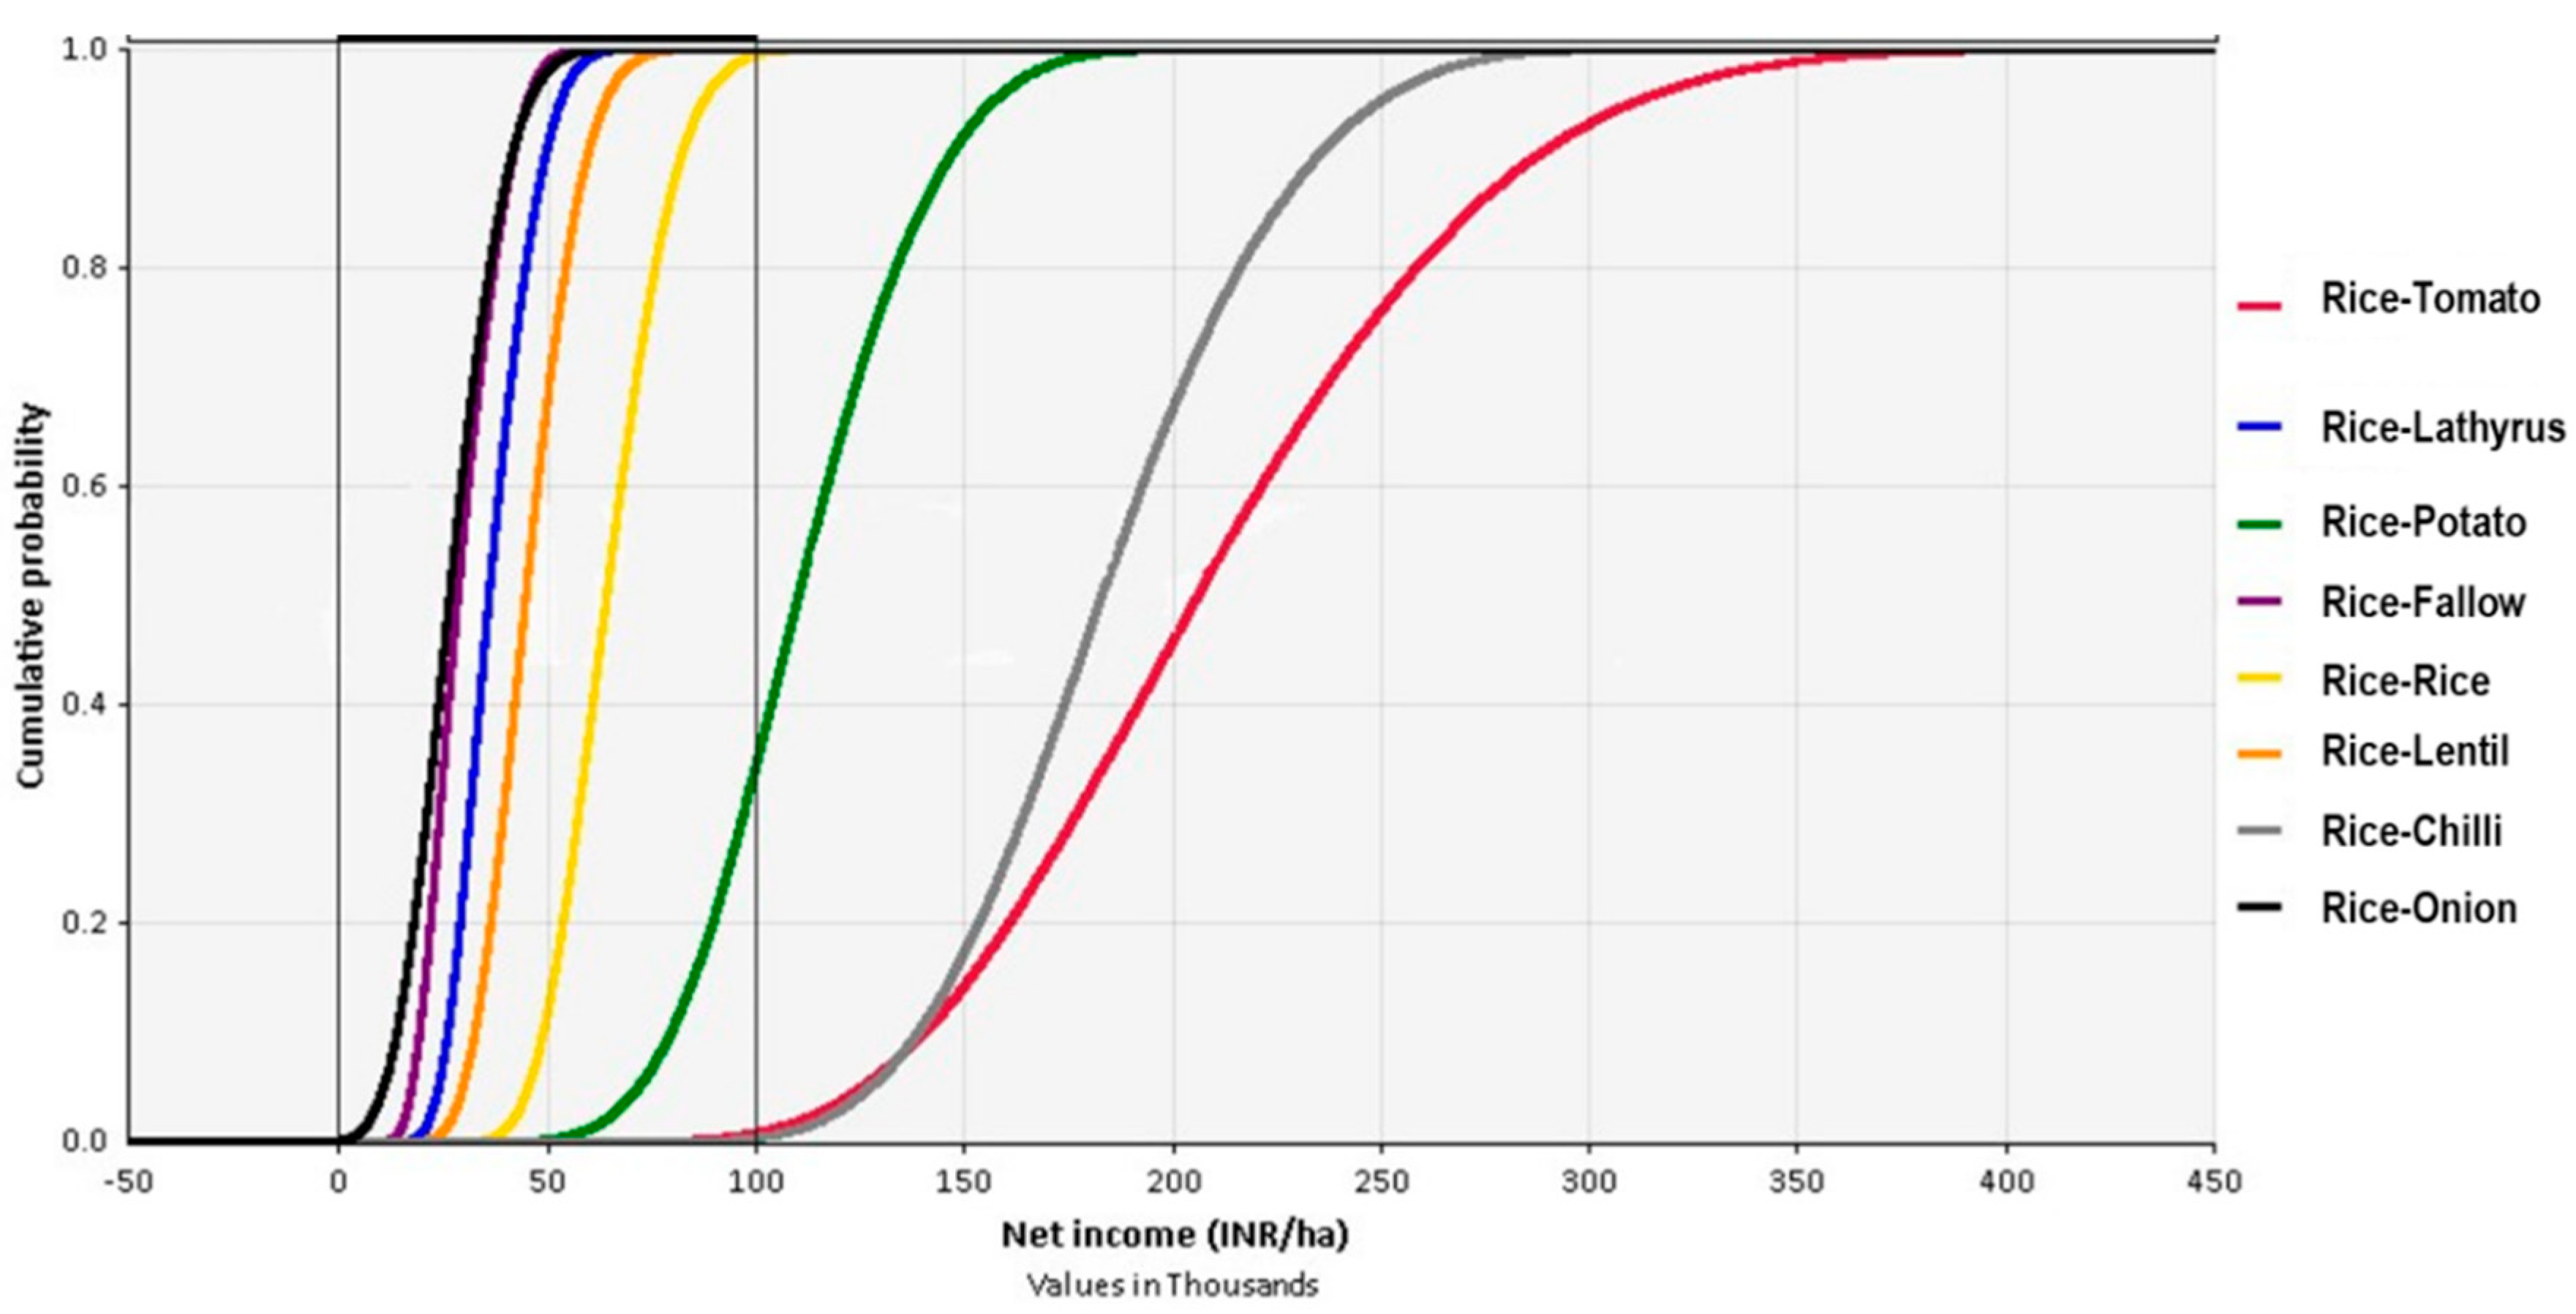
Figure 8, comprising CDFs for existing rice-based cropping systems, it was observed that CDF for rice-tomato reclines in right side, followed by rice-chilli and rice-potato, whereas rice-onion followed by rice-fallow systems are in the left side. In
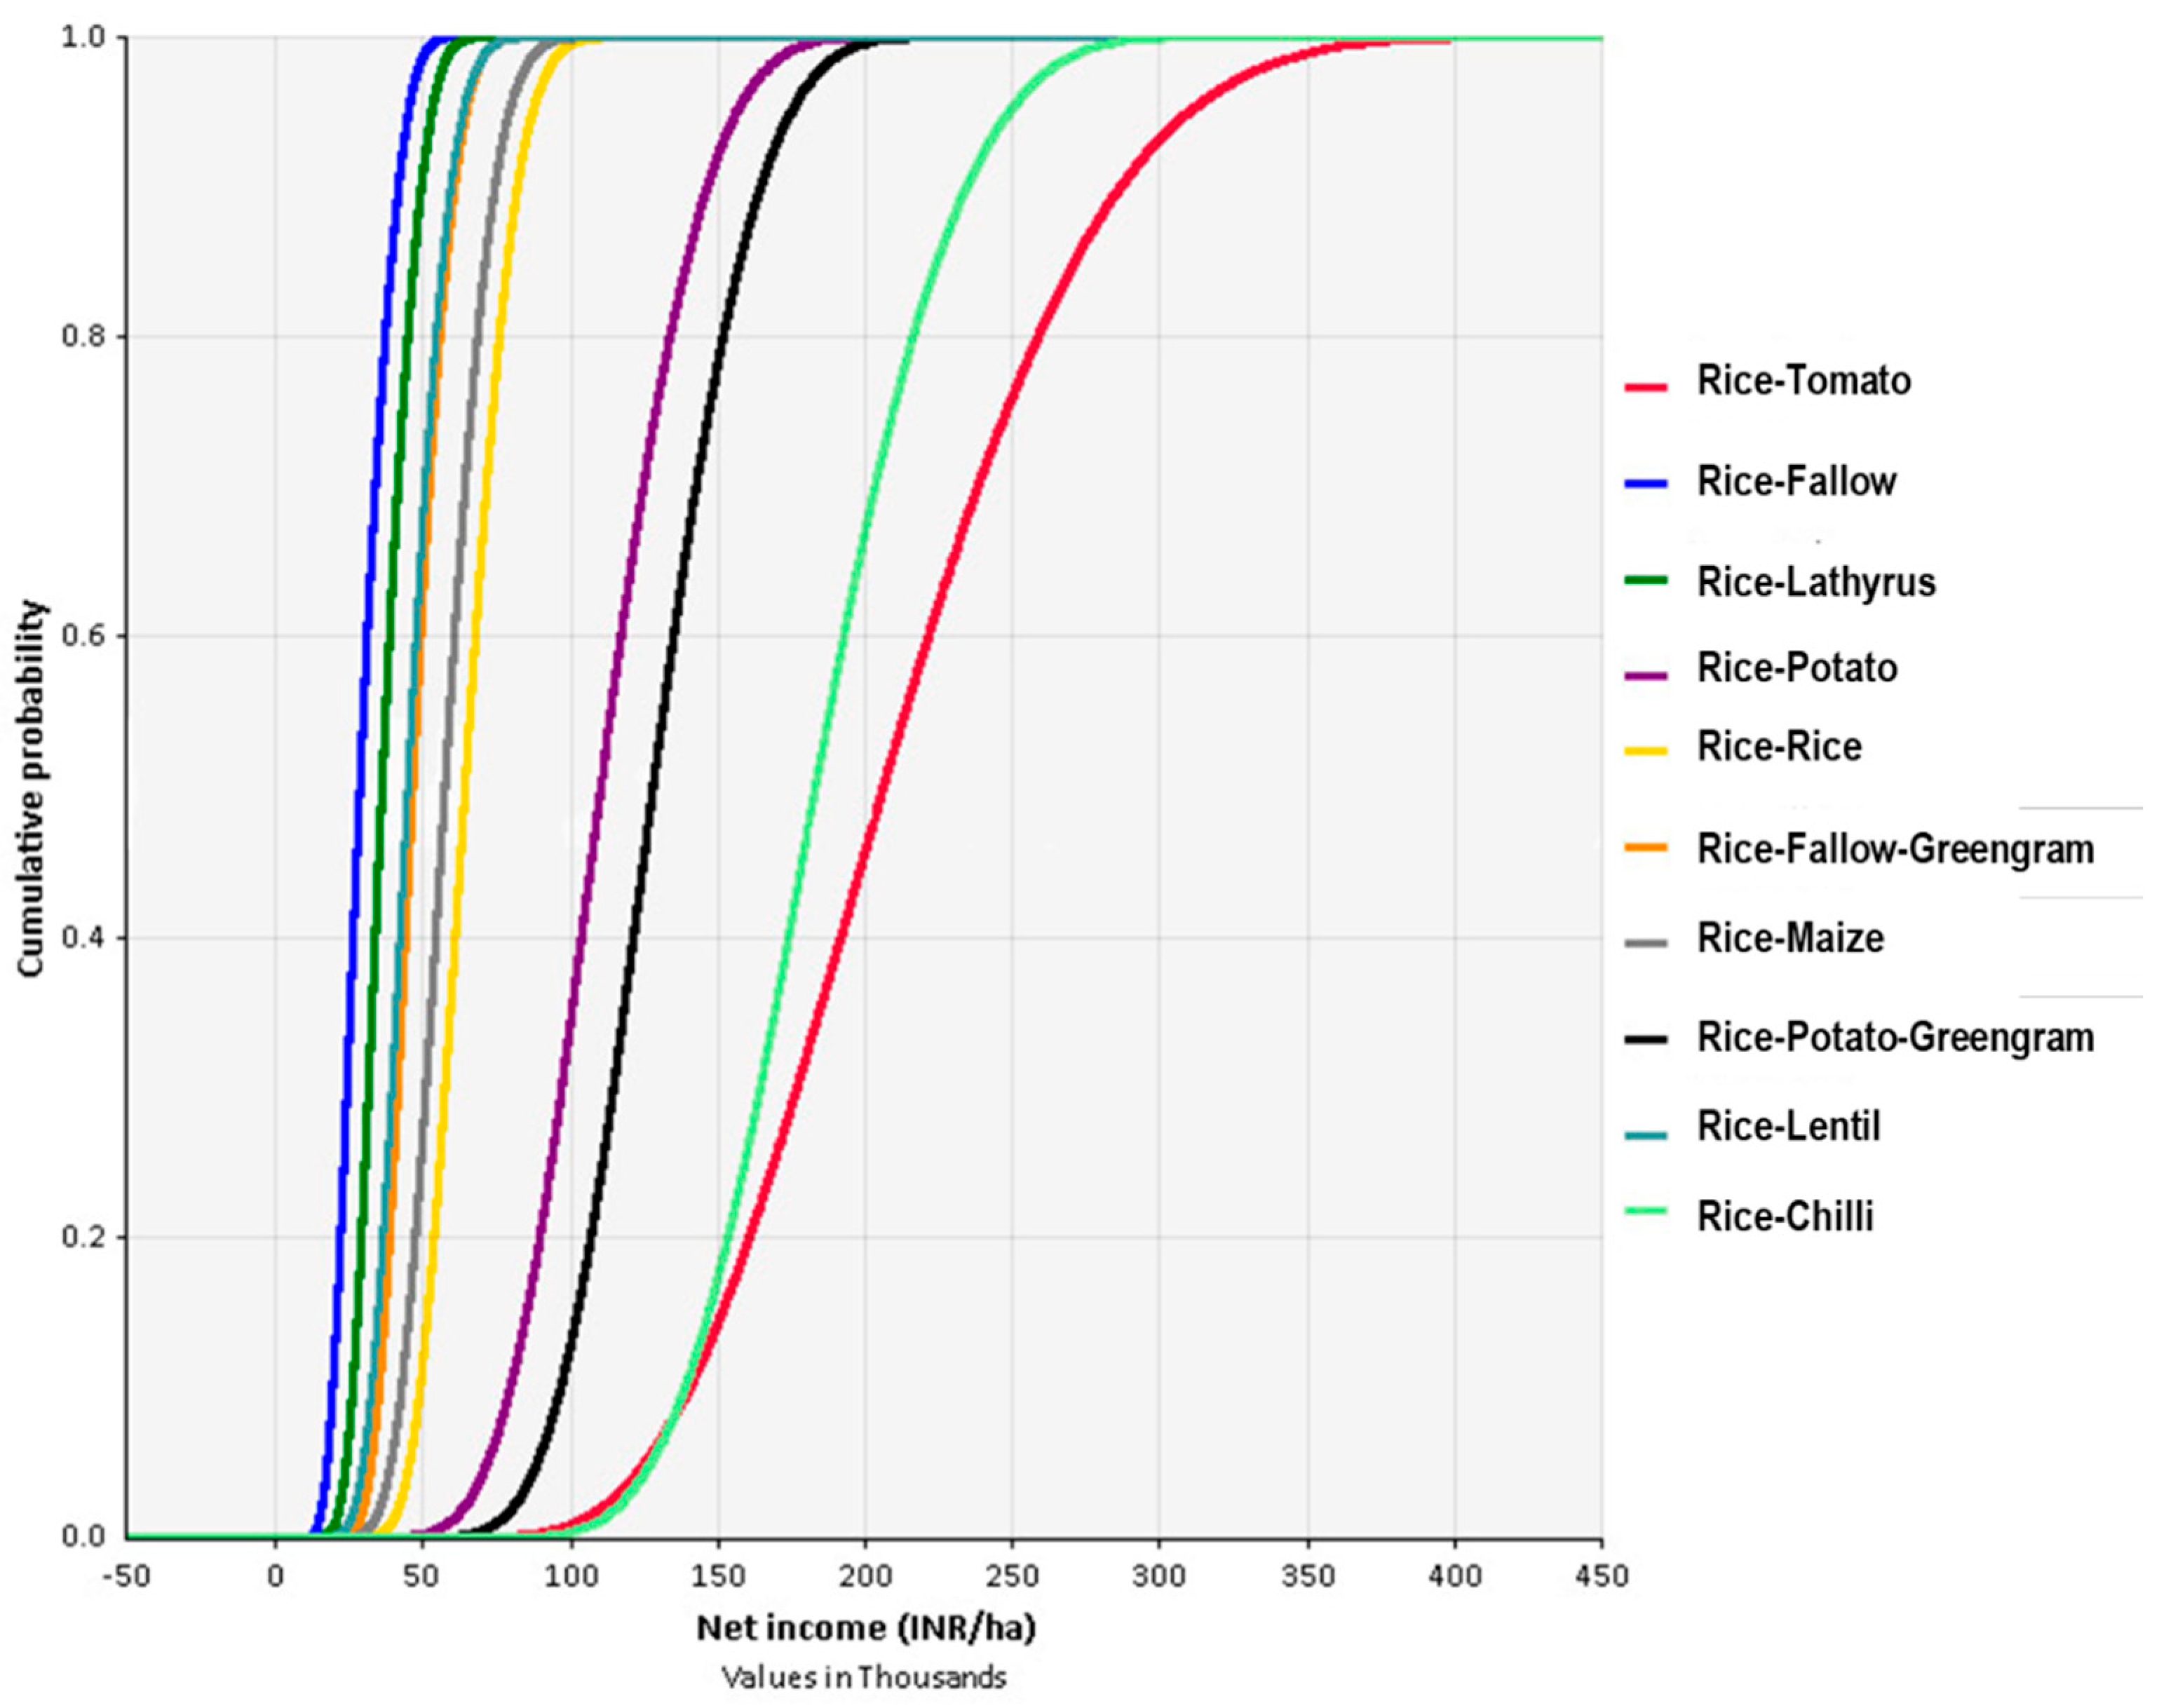
Figure 9, CDFs for both major existing and potential rice-based cropping systems are shown, where CDF for rice-tomato reclines in the right side, followed by rice-chilli and rice-potato-green gram and rice-fallow in the left side. Stochastic rankings of the cropping systems have been enlisted in
Table 4, showing that the rice-chilli ranked first, followed by rice-tomato and rice-potato-green gram systems. Lowest rank was for rice-onion system.
3.7. Sensitivity Analysis
Table 5 and
Supplementary Figures S1–S11 shows that how seasonal variability in yield and price impacts the net return of the cropping systems. The seasonal variability of tomatoes price followed by tomato yield, rice yield and rice price contributed most to the variability in net return from rice-tomato cropping system. Similarly, the seasonal variability of potato price contributed most to the variability in net return of rice-potatoes cropping system followed by potato yield, rice yield and rice price. The seasonal variability of price of chillies demonstrated the highest impact on variability in net return of rice-chilli cropping system followed by chilli yield, rice yield and rice price. On the other hand, seasonal variability in yield of rainfed rainy season rice yield contributed most to the variability in net income, followed by yield of dry season rice yield, price of wet season rice and then dry season rice. For rice-onion system, rice yield followed by onion price, rice price and onion yield were found sensitive to variability in system net return. The results indicate that uncertainty in price of non-rice crops is more responsible for seasonal fluctuation of return. On the contrary, climate induced variability in grain yield of rice impacts more in the fluctuation of net return of the cropping systems.
4. Discussion
The rationale of the SI concept hinges on multiple objectives – a) increasing productivity by introducing new crop varieties, crop diversification, and application of integrated crop, nutrient and pest management practices, b) increasing profitability by good market linkages, less risky ventures, higher profitability, catching appropriate seasons for crop harvest, good transport systems, c) ensuring social benefits by allowing gainful participation of woman farmers, higher and quicker adoption and diffusion of technologies, and d) improving ecosystem services by adopting climate-smart regenerative agriculture which will have low energy use, low greenhouse gas emission and less ecological footprint of the cropping systems [
6,
31]. SI in agricultural practices ideally starts with identifying the most suitable cropping systems for a region. By strategically incorporating two or three crops in a system, cropping system intensification can offset the negative outcomes of a mono-cropping system on soil, Environment, and economics [
32]. The transition from ’cropping system intensification’ to ’sustainable intensification of cropping system’ needs further assessment of the systems in terms of multiple dimensions and yardsticks sensitive to climate change and market variability [
1]. In the present study, our approach was to estimate the economic sustainability in the forms of costs incurred and returns received for any cropping system and to examine the vulnerability of such systems economic outcomes to climatic scenarios and choppy market situations.
Among the existing and potential cropping systems identified in our study, rice-lathyrus, followed by rice-fallow-green gram and rice-onion systems recorded comparatively lowest rice-equivalent yields irrespective of best, normal and worst situations (
Figure 3). However, the system yield was lowest for rice-fallow, followed by rice-lathyrus and rice-fallow-green gram systems. The rice-fallow system i.e., mono-crop rainy season rice production system has been a serious concern in the past decades. Almost 22.3 million ha area in South Asia comes under rice-fallows, of which India accounts for more than 80% area [
33] and the West Bengal state shares about 1.72 million ha rice-fallow [
13,
14]. Rice-fallow system is widely reported to be intensified to improve system performance [
29,
34,
35] in eastern parts of the country. Although pulse crop cultivation in post-rainy rice is a common intensification strategy in South Asia, especially in eastern India, the production of pulse crops is suboptimal because of its cultivation in marginal lands with poor input management practices. Apart from judicious fertilizer management, water is the most important input for pulse crops which is often ignored by the farmers. In the present study area, pulse crops are sometimes grown without irrigation in the standing crop field (e.g., using the residual moisture of paddy fields). However, the application of irrigation at critical stages can enhance pulse productivity. Moisture stress at critical stages often causes low crop yield even under irrigated conditions [
36]. The highest rice-equivalent yield and system yield, considering both existing and potential systems, were recorded for rice-chilli, followed by rice-tomato and rice-potato-greengram systems. Increase in cropping intensity and improvement in crop diversification in coastal Bengal from 1998 to 1999 to 2014-15, suggests the significance of fruits, vegetables and pulse crop strategically embedded in improved interventions like land shaping and integrated farming systems, especially after the devastating
Aila cyclone [
23]. Singh, et al. [
35] explored the role of vegetable crops in intensifying rice-fallow areas with improved agro-techniques like drip irrigation and mulching. On the other hand, Samant [
37], Yadav, et al. [
34], and Ray, et al. [
29] have estimated a higher net return
vis-a-vis low risk in the rice-vegetable systems. In our study, rice-tomato system recorded the highest total paid-out cost followed by rice-chilli, rice-potato-green gram and rice-potato systems under best, normal and worst situations. However, irrespective of seasonal conditions, rice-chilli offered higher net return and B:C ratio than rice-tomato and rice-potato-green gram systems.
However, our study contradicts previous findings of Banerjee, et al. [
17] and Ray, et al. [
29] who observed higher energy and cost involvement in potato cultivation. The reason may be that unlike other parts of West Bengal where potato is sown after heavy tillage to pulverize the post-paddy soil, coastal area is mostly dominated by zero tillage potato cultivated areas. The zero-tillage potato has been largely acclaimed for its decent productivity, higher return from unit land area and higher postharvest storability of potatoes. Our research advocates the rice-potato-green gram system where apart from higher productivity and economics, inclusion of green gram crops in the summer season may significantly reduce the application of nitrogenous fertilizer and fossil fuel in the system. Other pulse crops such as lentil and lathyrus are less preferred by the farmers due to their lesser ability of withstanding biotic stress situations (e.g., mid-season and terminal salinity, rainfall, etc.). Although rice-fallow system alone recorded the lowest value of net return under best seasonal condition, rice-onion system accompanied with rice-fallow system witnessed lowest net return in normal situation. Under worst situation, rice-onion system could not even provide positive return and demonstrated the worst performance. Farmers in the coastal belt grow onion in smaller areas for subsistence purpose with minimum input investment, often without tillage. They mostly use straw mulching and organic manure and apply very lesser number of irrigations. Although the rice-onion system yield in different seasonal conditions were almost in parity with other low yielding systems (like rice-pulses, rice-fallow, rice-rice), the lack of confidence among the farmers on achievable yield and price of zero-tilled onion might have resulted in a negative net return of the system under worst seasonal conditions. The crop chilli has been documented to be an important remunerative crop in coastal West Bengal before
Aila cyclone [
38]. Red chilli cultivation was prevalent in more than 60% of the farming areas and was highly preferred by the farmers as they used to dry and store chillies for selling them during lean months to earn profit [
39]. However, after salt intrusion in the post-
Aila period [
40] coupled with chilli leaf curl virus outbreak [
41] affected the chilli growing areas and discouraged the chilli cultivation in coastal Bengal.
The variability of climatic conditions along with market accessibility can largely dictate yield and economics of farming systems in any particular region [
27]. Considering the ’economic sustainability’ of cropping practices necessitates that cropping systems achieve multifunctional benefits with an explicit emphasis on production economics and introducing marketing facilities [
2,
42]. Discrepancies in crop yield and selling price under varied climate and market situations should be well accounted and risk assessment must be performed to select the economically viable cropping systems. To abide by these aspects of sustainability, we performed a stochastic dominance analysis, following Kabir et al. [
26], to record the trade-off between such variability in yield and price components of cropping systems.
In our study, The CDF of tomato showed first degree stochastic dominance over other rice and non-rice crops. The CDF of chili shows second degree stochastic dominance over other rice and non-rice crops. Further, potatoes show first degree stochastic dominance over other crops except tomatoes and chilli. The CDFs also show that only onion has chances (64%) to render negative net return. On the other hand, rest of the crops have shown 100% probability to give positive net returns. Also, tomatoes and chilli showed more than80% probability to give net income above the upper benchmark.
The results of risk analysis indicate that tomatoes are economically more viable (higher return and less risky) followed by chillies and potatoes compared to other rice and non-rice crops. Among different cropping systems studied, rice-tomato system showed first degree stochastic dominance over other systems and rice-chilli system showed second degree stochastic dominance over rest of the rice and non-rice-based cropping systems. Noticeably, only rice-onion system had a small chance (< 1%) to get negative net return, where the rest of the cropping systems were highly likely to get positive net return. Further, the rice-tomato, rice-chilli and rice-potato systems are highly likely to give positive net return over the upper benchmark (INR100 thousand/ha).
Finally, after assessment of productivity, profitability and risk of different rice-based systems, rice-vegetable systems, especially rice-tomato and rice-chilli systems among the existing systems and rice-potato-greengram system among the potential systems can be recommended in the coastal saline zone of West Bengal as these systems can largely offset the climate and market related uncertainty and can be tailored for socio-economic improvement and ecological stability of the study sites.
5. Conclusions
The coastal saline zone of West Bengal frequently faces climate change induced hazards in the island areas. Despite numerous contingency plans documented in policy papers these are most effective in the post-hazard scenario and have limited use during the devastation period. These policies make people “tolerate and resist” but cannot “avoid” the crises. As crop management is an integral part of rural livelihoods in these areas, agrarian community along with technologists, extension workers, farmers and local administrations play crucial role after the natural calamities recede. There have always been changes in cropping sequences in a year depending on these climatic vagaries and associated market instability. Many crops, in this way, have been rejected by the farming communities, which otherwise would have been a decent performer in a cropping system. Our study is positioned in a context, which have experienced several super cyclones in past ten years, and attempts to account for the existing (in practice) and potential (suggested from different field trials conducted by research Institutes and extension groups) cropping systems in terms of their system yield, profits under risk averse situation. Although it is very difficult to arrive at a conclusive idea about ideal cropping systems from a time-bound study since extraneous complex issues go beyond statistical conclusions, the outcome of the present study uses stochastic methods and explains how quantitative system yield and economics can be jeopardized under climate and market related risks.
Among the existing systems, we found rice-vegetables (mainly tomato and chilli) systems to be more productive and profitable than other rice-based systems. However, the study also analysed maize, zero-tillage potato, greengram as emerging and potential crops for rice-fallow intensification in post-rice dry seasons. The results suggested that seasonal variability in net returns from the systems was more sensitive to prices of non-rice crops and grain yield variation in rice crop. Observation of different systems’ CDFs definitely give an idea about the suitable systems under climate and market fluctuations. The rice-tomato system was first degree stochastically dominant and the rice-chilli system had second degree stochastic dominance over other systems, which necessarily meant that the likelihood of getting lower return was smaller for rice-tomato system but under uncertain adverse situation, decision makers could opt for rice-chilli system. Since such assumptions are not very restrictive, the farmers are likely to find available alternatives. We suggest, both rice-tomato and rice-chilli systems among the existing systems and rice-potato-greengram among potential systems as profitable, productive and good performing systems under uncertain situations for the coastal saline zone of West Bengal or similar agroclimatic conditions.
Supplementary Materials
The following supporting information can be downloaded at the website of this paper posted on
Preprints.org, Table S1. Description of the variables for Socio-demographic and physiographic features; Figure S1: Input Ranked by effect on Output Mean of Rice-Tomato cropping system; Figure S2: Input Ranked by effect on Output Mean of Rice-Lathyrus cropping system; Figure S3: Input Ranked by effect on Output Mean of Rice-Potato cropping system; Figure S4: Input Ranked by effect on Output Mean of Rice-Fallow cropping system; Figure S5: Input Ranked by effect on Output Mean of Rice-Rice cropping system; Figure S6. Input Ranked by effect on Output Mean of Rice-Lentil cropping system; Figure S7: Input Ranked by effect on Output Mean of Rice-Onion cropping system; Figure S8: Input Ranked by effect on Output Mean of Rice-Chilli cropping system; Figure S9: Input Ranked by effect on Output Mean of Rice-Fallow-Greengram cropping system; Figure S10: Input Ranked by effect on Output Mean of Rice-Maize cropping system; Figure S11: Input Ranked by effect on Output Mean of Rice-Potato-Greengram cropping system.
Author Contributions
Conceptualization, K.R., J.K., S.S.; resources, K.B., M.K.N., R.G. and M.M.; data curation, K.R., S.M., J.K., S.S. and R.G.; writing—original draft preparation, K.R., S.M., S.S., K.R., A.G., S.M., S.G. and R.G.; writing—review and editing, R.G., M.K.N., K.B. and M.M.; visualization, R.G., M.K.N., K.B. and M.M.; supervision, M.M. All authors have read and agreed to the published version of the manuscript.
Funding
This research was funded by Australian Centre for International Agricultural Research (ACIAR) sponsored research project viz., “Cropping system intensification in the salt-affected coastal zones of Bangladesh and West Bengal, India (LWR/2014/073).
Institutional Review Board Statement
The study was conducted following Human Research Ethics Procedure of CSIRO (approval number 065/15).
Informed Consent Statement
Informed consent was obtained from all subjects involved in the study.
Data Availability Statement
The data presented in this study are available on request.
Acknowledgments
Authors are thankful to the farmers from Rangabelia and Jatirampur villages of Gosaba Block, south 24 Parganas and staffs from Tagore Society for Rural Development (TSRD), Rangabelia, Gosaba for their heartily supports during the study.
Conflicts of Interest
The authors declare no conflict of interest. The funders had no role in the design of the study; in the collection, analyses, or interpretation of data; in the writing of the manuscript; or in the decision to publish the results.
References
- Schut M, van Asten P, Okafor C, Hicintuka C, Mapatano S, Nabahungu NL et al. Sustainable intensification of agricultural systems in the Central African; 2016.
- Xie H, Huang Y, Chen Q, Zhang Y, Wu Q. Prospects for agricultural sustainable intensification: a review of research. Land. 2019;8(11):157. [CrossRef]
- Wezel A, Soboksa G, McClelland S, Delespesse F, Boissau A. The blurred boundaries of ecological, sustainable, and agroecological intensification: a review. Agron Sustain Dev. 2015;35(4):1283-95. [CrossRef]
- Cassman KG, Grassini P. A global perspective on sustainable intensification research. Nat Sustain. 2020;3(4):262-8. [CrossRef]
- Tittonell P, Giller KE. When yield gaps are poverty traps: the paradigm of ecological intensification in African smallholder agriculture. Field Crops Res. 2013;143:76-90. [CrossRef]
- Smith A, Snapp S, Chikowo R, Thorne P, Bekunda M, Glover J. Measuring sustainable intensification in smallholder agroecosystems: a review. Glob Food Sec. 2017;12:127-38. [CrossRef]
- Cortner O, Garrett RD, Valentim JF, Ferreira J, Niles MT, Reis J et al. Perceptions of integrated crop-livestock systems for sustainable intensification in the Brazilian Amazon. Land Use Policy. 2019;82:841-53. [CrossRef]
- Mahon N, Crute I, Simmons E, Islam MM. Sustainable intensification -’oxymoron’ or ’third-way’? A systematic review. Ecol Indic. 2017;74:73-97. [CrossRef]
- Umesha S, Manukumar HMG, Chandrasekhar B. Chapter 3. Sustainable agriculture and food security. In: Singh RK, Mondal S, editors. Biotechnology for sustainable agriculture: emerging approaches and strategies. Woodland Publishing; 2018. p. 67-92.
- Tripathi SC, Venkatesh K, Meena RP, Chander S, Singh GP. Sustainable intensification of maize and wheat cropping system through pulse intercropping. Sci Rep. 2021;11(1):18805. [CrossRef]
- Lamichhane JR, Alletto L, Cong WF, Dayoub E, Maury P, Plaza-Bonilla D et al. Relay cropping for sustainable intensification of agriculture across temperate regions: crop management challenges and future research priorities. Field Crops Res. 2023;291:108795. [CrossRef]
- FAO. World food and agriculture – statistical [yearbook]. Vol. 2021. Rome; 2021. [CrossRef]
- Kumar HMV, Chauhan NB, Patel DD, Patel JB. Predictive factors to avoid farming as a livelihood. Economic Structures. 2019;8(1):10. [CrossRef]
- Kumar R, Mishra JS, Upadhyay PK, Hans H. Rice fallows in the eastern India: problems and prospects. Indian J Agri Sci. 2019;89(4):567-77. [CrossRef]
- Zsögön A, Peres LEP, Xiao Y, Yan J, Fernie AR. Enhancing crop diversity for food security in the face of climate uncertainty. Plant J. 2022;109(2):402-14. [CrossRef]
- Mainuddin M, Karim F, Gaydon DS, Kirby JM. Impact of climate change and management strategies on water and salt balance of the polders and islands in the Ganges Delta. Sci Rep. 2021;11(1):7041. [CrossRef]
- Banerjee H, Sarkar S, Ray K. Energetics, GHG emissions and economics in nitrogen management practices under potato cultivation: a farm level study. Energy Ecol Environ. 2017;2(4):250-8. [CrossRef]
- Ghosh S, Mistri B. Drainage induced waterlogging problem and its impact on farming system: a study in Gosaba Island, Sundarban, India. Spat Inf Res. 2020a;28(6):709-21. [CrossRef]
- Directorate of Agriculture, Govt. of WB. Area, yield and production of major field crops. Evaluation wing, directorate of agriculture, Govt. of WB; 2021.
- Ray K, Sen P, Goswami R, Sarkar S, Brahmachari K, Ghosh A et al. Profitability, energetics and GHGs emission estimation from rice-based cropping systems in the coastal saline zone of West Bengal, India. PLOS ONE. 2020;15(5):e0233303. [CrossRef]
- Ghosh S, Mistri B. Coastal agriculture and its challenges: A case study in Gosaba Island, Sundarban, India. Space Cult, (India). 2020b;8(2):140-54. [CrossRef]
- Mandal S, Sarangi SK, Mainuddin M, Mahanta KK, Mandal UK, Burman D et al. Cropping system intensification for smallholder farmers in coastal zone of West Bengal, India: A socio-economic evaluation. Front Sustain Food Syst. 2022;6:1001367. [CrossRef]
- Mandal S. Risks and profitability challenges of agriculture in Sundarbans India. In: The Sundarbans: A disaster-prone eco-region, coastal research (Sen, H.S. Ed.). Springer Nature Switzerland pp; 2019. p. 353-71. [CrossRef]
- Hassan A, Wahid S, Shrestha ML, Rashid MA, Ahmed T, Mazumder A et al. Climate change and water availability in the Ganges-Brahmaputra-Meghna Basin: impact on local crop production and policy directives. In: Vaidya R, Sharma E, editors. Research insights on climate and water in the Hindu Kush Himalayas. Kathmandu, Nepal: International Centre for Integrated Mountain Development (ICIMOD); 2014. p. 97-108.
- Lázár AN, Clarke D, Adams H, Akanda AR, Szabo S, Nicholls RJ et al. Agricultural livelihoods in coastal Bangladesh under climate and environmental change-a model framework. Environ Sci Process Impacts. 2015;17(6):1018-31. [CrossRef]
- Kabir MJ, Cramb R, Gaydon DS, Roth CH. Bio-economic evaluation of cropping systems for saline coastal Bangladesh: III Benefits of adaptation in current and future environments. Agric Syst. 2018a;161:28-41. [CrossRef]
- Kabir J, Cramb R, Gaydon DS, Roth CH. Bio-economic evaluation of cropping systems for saline coastal Bangladesh: II. Economic viability in historical and future environments. Agric Syst. 2017;155:103-15. [CrossRef]
- Kabir MJ, Gaydon DS, Cramb R, Roth CH. Bio-economic evaluation of cropping systems for saline coastal Bangladesh: I. Biophysical simulation in historical and future environments. Agric Syst. 2018b;162:107-22. [CrossRef]
- Ray K, Hasan SS, Goswami R. Techno-economic and environmental assessment of different rice-based cropping systems in an inceptisol of West Bengal, India. J Cleaner Prod. 2018;205:350-63. [CrossRef]
- Kabir MJ, Cramb R, Alauddin M, Gaydon DS. Farmers’ perceptions and management of risk in rice-based farming systems of south-west coastal Bangladesh. Land Use Policy. 2019;86:177-88. [CrossRef]
- Tittonell P. Ecological intensification of agriculture – sustainable by nature. Curr Opin Environ Sustain. 2014;8:53-61. [CrossRef]
- Bogužas V, Skinulienė L, Butkevičienė LM, Steponavičienė V, Petrauskas E, Maršalkienė N. The effect of monoculture, crop rotation combinations, and continuous bare fallow on soil CO2 emissions, earthworms, and productivity of winter rye after a 50-year period. Plants (Basel). 2022;11(3):431. [CrossRef]
- Kumar R, Mishra JS, Rao KK, Mondal S, Hazra KK, Choudhary JS et al. Crop rotation and tillage management options for sustainable intensification of rice-fallow agro-ecosystem in eastern India. Sci Rep. 2020;10(1):11146. [CrossRef]
- Yadav GS, Lal R, Meena RS, Datta M, Babu S, Das A et al. Energy budgeting for designing sustainable and environmentally clean/safer cropping systems for rainfed rice fallow lands in India. J Cleaner Prod. 2017;158:29-37. [CrossRef]
- Singh AK, Das B, Mali SS, Bhavana P, Shinde R, Bhatt BP. Intensification of rice-fallow cropping systems in the Eastern Plateau region of India: diversifying cropping systems and climate risk mitigation. Clim Dev. 2020;12(9):791-800. [CrossRef]
- Ray LIP, Swetha K, Singh AK, Singh NJ. Water productivity of major pulses – a review. Agric Water Manag. 2023;281:108249. [CrossRef]
- Samant TK. System productivity, profitability, sustainability and soil health as influenced by rice-based cropping systems under mid central table land zone of Odisha. Int J Agric Sci. 2015;7(11):746-9.
- Samanta B. Changing scenario of red chilli cultivation after Cyclone Aila in Haripur. Int J Res Anal Rev. 2018;5(3):920-5.
- Lahiri K. Role of participatory management for livelihood resurgence in Sundarban region with special reference to Sagar Island and canning blocks; 2011. Sodhganga [cited Apr 12, 2023]. Available from: http://shodhganga.inflibnet.ac.in/handle/10603/155888.
- Debnath A. Condition of agricultural productivity of Gosaba C.D. Block, South24 Parganas, West Bengal, India after severe Cyclone Aila. Int J Sci Res Publ. 2013;3(7):1-4.
- Patel LC, Mondal CK. Management of causal agents of chilli leaf curl complex through bio-friendly approaches. The J Plant Prot Sci. 2013;5(2):20-5.
- Kassie M, Teklewold H, Jaleta M, Marenya P, Erenstein O. Understanding the adoption of a portfolio of sustainable intensification practices in eastern and southern Africa. Land Use Policy. 2015;42:400-11. [CrossRef]
Figure 2.
Monthly average temperature (a), and cumulative monthly rainfall (b) of the study region during 2014-2018.
Figure 2.
Monthly average temperature (a), and cumulative monthly rainfall (b) of the study region during 2014-2018.
Figure 3.
Rice equivalent yield of dry and summer season crops in Rangabelia and Jatirampur villages [Note: R-T: Rice-Tomato; R-LA: Rice-Lathyrus, R-P: Rice-Potato, R-F: Rice-Fallow, R-R: Rice-Rice, R-LE: Rice-Lentil, R-O: Rice-Onion, R-C: Rice-Chilli, R-F-G: Rice-Fallow-Greengram, R-M: Rice-Maize, R-P-G: Rice-Potato-Greengram].
Figure 4.
Total system productivity of existing and some potential rice-based cropping systems in Rangabelia and Jatirampur villages. [Note: R-T: Rice-Tomato; R-LA: Rice-Lathyrus, R-P: Rice-Potato, R-F: Rice-Fallow, R-R: Rice-Rice, R-LE: Rice-Lentil, R-O: Rice-Onion, R-C: Rice-Chilli, R-F-G: Rice-Fallow-Greengram, R-M: Rice-Maize, R-P-G: Rice-Potato-Greengram].
Figure 5.
Profitability of existing and potential rice-based cropping systems under best (a), normal (b), and worst (c) seasonal conditions in Rangabelia and Jatirampur villages. Note: TPC, Total paid out cost; TIC, Total imputed cost, GR, gross return, and NR, net return; ECS1: rice-tomato, ECS2: rice-lathyrus, ECS3: rice-potato, ECS4: rice-fallow, ECS5: rice-rice, ECS6: rice-lentil, ECS7: rice-onion, ECS8: rice-chilli, PCS1: rice-fallow-greengram, PCS2: rice-maize, PCS3: rice-potato-green gram].
Figure 6.
Benefit: cost ratio of different rice-based systems of the study area under best, normal and worst situations [ECS1: rice-tomato, ECS2: rice-lathyrus, ECS3: rice-potato-fallow, ECS4: rice-fallow, ECS5: rice-rice, ECS6: rice-lentil, ECS7: rice-onion, ECS8: rice-chilli, PCS1: rice-fallow-greengram, PCS2: rice-maize, PCS3: rice-potato-greengram].
Figure 7.
Cumulative probability distribution (CDF) of rice and non-rice crops of the study area based on current prices and last five years’ yields (Note: DS, dry season).
Figure 7.
Cumulative probability distribution (CDF) of rice and non-rice crops of the study area based on current prices and last five years’ yields (Note: DS, dry season).
Figure 8.
Cumulative probability distribution (CDF) of existing major rice-based cropping systems in Rangabelia and Jatirampur villages. (Notes: CDFs were developed based on farmers’ perceived seasonal variability in yield and price of the rice and non-rice crops over the last five years).
Figure 8.
Cumulative probability distribution (CDF) of existing major rice-based cropping systems in Rangabelia and Jatirampur villages. (Notes: CDFs were developed based on farmers’ perceived seasonal variability in yield and price of the rice and non-rice crops over the last five years).
Figure 9.
Cumulative probability distribution (CDF) of eight existing major and three potential rice-based cropping systems in Rangabelia and Jatirampur villages. Notes: CDFs were developed based on farmers’ perceived seasonal variability in yield and price of the rice and non-rice crops over the last five years.
Table 1.
Existing and potential cropping systems in Rangabelia and Jatirampur villages.
Table 1.
Existing and potential cropping systems in Rangabelia and Jatirampur villages.
| Cropping System |
Wet Season |
Dry Season |
Early Wet Season |
| Existing |
Rice |
Tomato |
Fallow |
| Rice |
Lathyrus |
Fallow |
| Rice |
Potato |
Fallow |
| Rice |
Fallow |
Fallow |
| Rice |
Rice |
Fallow |
| Rice |
Lentil |
Fallow |
| Rice |
Onion |
Fallow |
| Rice |
Chilli |
Fallow |
| Potential |
Rice |
Fallow |
Greengram |
| Rice |
Maize |
Fallow |
| Rice |
Potato |
Greengram |
Table 2.
Socio-demographic and perceived physiographic featuresin Rangabelia and Jatirampur villages.
Table 2.
Socio-demographic and perceived physiographic featuresin Rangabelia and Jatirampur villages.
| Variables |
Frequency (%) |
| Age (Years) |
| <40 |
10 (20) |
| 40-60 |
27 (54) |
| >60 |
13 (26) |
| Primary occupation |
| Agriculture |
44 (88) |
| Non-agriculture |
6 (12) |
| Secondary occupation |
| Agriculture |
2 (4) |
| Non-agriculture |
34 (68) |
| Nil |
14 (28) |
| Education (class) |
| <10 |
41 (82) |
| 10-11 |
8 (16) |
| ≥12 |
1 (2) |
| Caste |
| General |
44 (88) |
| Schedule Caste |
6 (12) |
| Total family member (number) |
| <5 |
24 (48) |
| 5-7 |
24 (48) |
| >7 |
2 (4) |
| Family type |
| Nuclear |
38 (76) |
| Extended |
12 (24) |
| Tenurial statusof land |
| Own land |
32 (64) |
| Leased-in land |
18 (36) |
| Total operational land (acre)* |
| <1 |
32 (64) |
| 1-2.5 |
14 (28) |
| >2.5 |
4 (8) |
| Irrigation availability |
| Unirrigated |
22 (44) |
| Irrigated |
28 (56) |
| Soil testing done or not |
| Not done |
44 (88) |
| Done |
6 (12) |
| Fertility status of soil |
| Fertile |
16(32) |
| Medium fertile |
19 (38) |
| Unfertile |
15 (30) |
| Perception about the participation of women in agricultural activities |
| Active participation |
43 (86) |
| No participation |
7 (14) |
| Perception about participation of women in household activities |
| Active participation |
46 (92) |
| No participation |
4 (8) |
Table 3.
Seasonal variability of yield (t/ha) and market price (INR/kg) of rice and non-rice crops during the last five years in Rangabelia and Jatirampur villages.
Table 3.
Seasonal variability of yield (t/ha) and market price (INR/kg) of rice and non-rice crops during the last five years in Rangabelia and Jatirampur villages.
| Crop |
Grain Yield (t/ha) |
Selling Price (INR/kg) |
| Best Seasonal Condition |
Normal Seasonal Condition |
Worst Seasonal Condition |
% Variation (1-3) |
High Price |
Normal Price |
Low Price |
% Variation (5-7) |
| (1) |
(2) |
(3) |
(4) |
(5) |
(6) |
(7) |
(8) |
| Wet season rice |
5.4 |
3.8 |
3.2 |
40.74 |
15 |
13 |
12 |
20.00 |
| Dry season rice |
6.5 |
4.5 |
3.8 |
41.54 |
17 |
15.5 |
14 |
17.65 |
| Potato |
18.3 |
16.6 |
15.0 |
18.03 |
12 |
10 |
8 |
33.33 |
| Lathyrus |
1.4 |
1.2 |
0.9 |
35.71 |
26 |
22 |
20.5 |
21.15 |
| Lentil |
1.0 |
0.8 |
0.7 |
30.00 |
70 |
50 |
40 |
42.86 |
| Tomato |
15.0 |
14.0 |
13.0 |
13.33 |
30 |
20 |
14 |
53.33 |
| Onion |
3.6 |
3.4 |
3.2 |
11.11 |
18 |
15 |
10 |
44.44 |
| Chilli |
5.6 |
5.3 |
3.8 |
32.14 |
100 |
75 |
65 |
35.00 |
| Greengram |
1.4 |
1.1 |
0.8 |
42.86 |
40 |
35 |
30 |
25.00 |
| Maize |
7.3 |
5.5 |
4.8 |
34.25 |
15 |
12 |
10 |
33.33 |
Table 4.
Stochastic dominance ranking of different systems under varied climatic scenarios and market fluctuations.
Table 4.
Stochastic dominance ranking of different systems under varied climatic scenarios and market fluctuations.
| Sl. No. |
Cropping Systems |
Ranks |
| Existing |
Rice-tomato |
2 |
| Rice-lathyrus |
=5 |
| Rice-potato |
4 |
| Rice-fallow |
=5 |
| Rice-rice |
=5 |
| Rice-lentil |
=5 |
| Rice-onion |
6 |
| Rice-chilli |
1 |
| Potential |
Rice-fallow-greengram |
=5 |
| Rice-maize |
=5 |
| Rice-potato-greengram |
3 |
Table 5.
Impact of yield and price variability on system net return (INR/ha) of rice-based cropping systems.
Table 5.
Impact of yield and price variability on system net return (INR/ha) of rice-based cropping systems.
| Systems |
Input |
Net Return (INR/ha) |
| Rice-tomato |
Rice price |
9,820 |
| |
Rice yield |
26,694 |
| |
Tomato price |
1,64,858 |
| |
Tomato yield |
91,303 |
| Rice-lathyrus |
Rice price |
10,627 |
| |
Rice yield |
26,221 |
| |
Lathyrus price |
4,274 |
| |
Lathyrus yield |
7,865 |
| Rice-potato |
Rice price |
10,671 |
| |
Rice yield |
26,556 |
| |
Potato price |
65,956 |
| |
Potato yield |
47,215 |
| Rice-fallow |
Rice price |
10,689 |
| |
Rice yield |
26,297 |
| Rice-rice |
Rainy season rice price |
10,612 |
| |
Rainy season rice yield |
26,190 |
| |
Summer season rice price |
12,023 |
| |
Summer season rice yield |
29,673 |
| Rice-lentil |
Rice price |
10,758 |
| |
Rice yield |
26,381 |
| |
Lentil price |
17,634 |
| |
Lentil yield |
9,411 |
| Rice-onion |
Rice price |
10,641 |
| |
Rice yield |
26,383 |
| |
Onion price |
18,707 |
| |
Onion yield |
10,095 |
| Rice-chilli |
Rice price |
10,346 |
| |
Rice yield |
25,860 |
| |
Chilli price |
89,345 |
| |
Chilli yield |
78,872 |
| Rice-fallow-green gram |
Rice price |
10,717 |
| |
Rice yield |
26,263 |
| |
Greengram price |
7,795 |
| |
Greengram yield |
14,663 |
| Rice-maize |
Rice price |
10,617 |
| |
Rice yield |
26,148 |
| |
Maize price |
20,291 |
| |
Maize yield |
21,913 |
| Rice-potato-green gram |
Rice price |
10,698 |
| |
Rice yield |
26,522 |
| |
Potato price |
65,911 |
| |
Potato yield |
47,139 |
| |
Greengram price |
7,550 |
| |
Greengram yield |
14,286 |
|
Disclaimer/Publisher’s Note: The statements, opinions and data contained in all publications are solely those of the individual author(s) and contributor(s) and not of MDPI and/or the editor(s). MDPI and/or the editor(s) disclaim responsibility for any injury to people or property resulting from any ideas, methods, instructions or products referred to in the content. |
© 2023 by the authors. Licensee MDPI, Basel, Switzerland. This article is an open access article distributed under the terms and conditions of the Creative Commons Attribution (CC BY) license (http://creativecommons.org/licenses/by/4.0/).
