
You are currently viewing a beta version of our website. If you spot anything unusual, kindly let us know.
Preprint
Article
Aqueous Binary Mixtures of Stearic Acid and Its Hydroxylated Counterpart 12-Hydroxystearic Acid: Cascade of Morphological Transitions at Room Temperature
Altmetrics
Downloads
145
Views
44
Comments
0
A peer-reviewed article of this preprint also exists.


Abstract
We describe the behavior of mixtures of stearic acid (SA) and its hydroxylated counterpart 12-hydroxystearic acid (12-HSA) in aqueous mixtures at room temperature, as function of the 12-HSA/(fatty acid) mole ratio R. The morphologies of the self-assembled aggregates are obtained by a multi-structural approach that combines confocal and cryo-TEM microscopies with Small-Angle Neutron Scattering (SANS) and Wide-Angle X-Rays Scattering (WAXS) measurements, coupled with rheology measurements. Fatty acids are solubilized by an excess of ethanolamine counterions, so that their heads are negatively charged. The behavior is driven by the competition between mixing entropy and enthalpic effects. A clear trend towards partitioning between the two types of fatty acids is observed, presumably driven by the favorable formation of a H-bond network between hydroxyl OH function on the 12th carbon.
For all R, the self-assembled structures are locally lamellar, with bilayers composed of crystallized and strongly interdigitated fatty acids. At high R, multi-lamellar tubes are formed, similarly as for pure aqueous solutions of 12-HSA. The doping by a low amount of SA molecules only slightly modify the dimensions of the tubes (radius and length), and slightly decreases the bilayers rigidity. The solutions have a gel-like behavior originating from entanglements between tubes and show a yield stress. At intermediate R, a partial local partitioning occurs between the two types of fatty acids. The tubes coexist in solution with helical ribbons. The two structures possibly merge to form very long snaky objects with straight and curved parts. The rigidity of the bilayers and the rheological behavior of the solutions are very similar to those of the high R case. At low R, local partitioning also occurs, and the architecture of the self-assemblies associates the two morphologies of the pure fatty acids systems, respectively 2-D planar bilayers for SA and the tubes describe above for the 12-HSA molecules: they are facetted objects with planar domains enriched in SA molecules, capped with curved domains enriched in 12-HSA molecules. The rigidity of the bilayers is strongly increased, as well their storage modulus, compared to systems with larger R. The solutions remain however viscous fluids in this regime of low R.
Keywords:
Subject: Chemistry and Materials Science - Physical Chemistry
1. Introduction
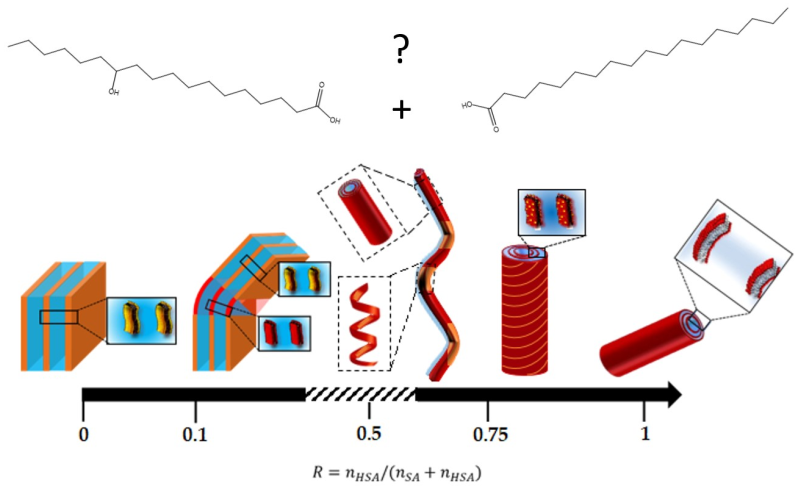
The climatic situation of the planet and the depletion of fossil resources leads to an increase in the need for the use of environmentally friendly molecules. In such a context, fatty acids, i.e. carboxylic acids with an aliphatic chain, are an alternative to oily-based surfactants as green surfactants since they are mostly extracted from plants. They are indeed probably the oldest surfactants used by humans, as their use as soaps is reported since ancient times and have been increasingly used by the industry. [1] The dispersion in aqueous solution of the fatty acids with long chains (C14 to C22) remains however a challenge since they have a high Krafft temperature with conventional metallic alkali counterions. [2] This has driven a huge effort lately to achieve such a dispersion, owing to both : (i) the large availability from biomass of the C14 tetradecanoic acid, C16 hexadecanoic acid C18 and octadecanoic acid, better known from their respective common names myristic acid, palmitic acid and stearic acid (SA, see scheme Figure 1B), and (ii) to the various morphologies they may form once dispersed in water that provide them a huge potential for their use as basic blocks for the design of stimuli-responsive systems such as foams or emulsions. [1,3]
Besides the possibility of a chemical modification from the quite reactive carboxylate group, the main strategy that enables the dispersion in water rely on the addition of a species that is prone to interact with the carboxylate head according to its ionization state, either by hydrogen-bonding when the head is in its COOH form or by electrostatics and ion-pairing interactions when the head is in its COO- form. There are then 2 main routes that were reported, depending on whether this added species is a surfactant itself or not:
The first route is the use of a cationic surfactant, that contains usually an amino head, that allow the formation catanionic self-assemblies, i.e. mixture of cationic and anionic surfactants, upon mixing with fatty acids. Their dispersion originates from the combination of both electrostatic interactions between the fatty acid and the oppositely charged cationic surfactant and hydrogen bonding that give rise to the formation of catanionic surfactant pairs with amphiphilic properties, as explained in the review from Fameau and Zemb. [3] By playing on parameters such as the type of polar group or the ratio between surfactants, it is possible to design aggregate structures with a very broad morphology (mixed micelles, lamellar phases, vesicles, bicontinuous structure), [4,5,6] the most spectacular being obtained with the myristic/cetyltrimethylammonium hydroxide system for which flat nanodiscs of finite size [7] , regular hollow icosahedra [8] or very robust vesicles that resist dialysis [9] s have been reported.
The second route is ion pairing with e g an alkyl-amine that decreases the Krafft temperature, as for instance obtained by simple neutralization of the unsaturated fatty acids from C14 to C22 by tetrabutylammonium hydroxide leading to small micelles. [10] Such a strategy has been successfully tested for a large range of amino counterion/fatty acid systems. [11,12,13,14,15,16,17,18,19,20,21,22] It is worth mentioning that solubilization at low temperature can also be achieved by chaotropic counterions such as K+ or Cs+. [4,10,12,15] The morphologies of the self-assembled aggregates mainly depend on three parameters: (i) the size and hydrophobicity of the counterion; (ii) the state of crystallinity of the alkyl chains and therefore the temperature; and (iii) the degree of ionization of the carboxylated head that depends on pH. [23] Indeed, the self-assemblies that are formed when fatty acids are in their disordered liquid crystal state are more flexible than when they are on their Lβ ordered crystalline phase, which increases their curvature. The melting transition between the two states may thus induce a morphological transition. Interactions between neighboring heads are strongly dependent on their ionization state because there is competition between H-bonding that promote their approach, which is prompted to occur when they are on their protonated COOH form, and electrostatic repulsions when they are on their COO- form, which moves them apart. The overall resulting subtle interplay of interactions tunes the packing parameters of the fatty acids and therefore their morphology. The counterion/fatty acid ratio is then a key parameter since it fixes the pH. Lamellar self-assemblies are obtained when pH is close to the pKa of fatty acids, with a large polymorphism (facetted objects, planar lamellar phases, unilamellar or mutilamellar vesicles [14,15,18,19]) and spherical micelles at pH > pKa. [14,15,18,19,20] However, it has been reported that the use of a chaotropic ion (Cs+ or K+) makes it possible to extend the lamellar domain towards large pH thanks to a strong screening of the COO- heads. [15] Also, a fine tuning of the interactions makes it possible to obtain the packing parameter allowing the formation of vermiform micelles. [16]
The introduction of a hydroxyl function OH onto the alkyl chains provides a huge potential to fatty acids compared to their unsatured non-modified counterpart because it brings 3 functionalities to the molecules: chirality, a second hydrophilic center and the possibility of making H bonds between the secondary OH groups. At the air/water interface, hydroxylated fatty acids, that are sometimes called “bihydrophilic”, show indeed a specific behavior if the OH group is located sufficiently far from the head group (typically from the 7th carbon of the alkyl chain or further). [24,25] At intermediate surface pressure, in-between the condensed liquid phase and the gas phase, they adopt a specific conformation where they lay onto the interface with their two hydrophilic centers in contact with water, which gives rises to a very large plateau in the surface pressure versus surface area isotherm. [24,25,26] At large surface pressure, the molecules are not elongated straightly but rather might present a kink at their second OH group. Moreover, in the condensed phase, the formation of a hydrogen bond network [27] makes the monolayer very elastic since their surface viscosity can reach values that are 3 orders of magnitude larger than that of the gas phase. [26]
Among these hydroxylated fatty acids, 12-hydroxy stearic acid (12-HSA, see scheme Figure 1A) is widely used because it is easily obtained from the hydrogenation of the double bond of rinoleic acid, that makes up 90 % of castor oil extracted from castor beans. [2] Owing to its possibility of making H bonds in an apolar medium, it is in particular very widely used as an organogelator, either in its pure form or in a chemically modified one. [2,28,29,30,31,32,33,34,35] In aqueous solution, the chirality of 12-HSA molecules enables them to make remarkable self-assemblies in presence of alkoxyamines counterions or their derivatives: twisted ribbons [36] or multi-lamellar tubes. [37] These multi-lamellar tubes have a length of about 10 µm, a diameter of 0.6 µm and their core is composed of a few (~3-6) stacked bilayers separated by water and can be obtained from a large set of counterions. [38,39] Their formation likely comes from the rolling of helical ribbons. If there exists a large literature on the formation of single wall tubes based on organic species such as peptides, [40] such architecture of multi-lamellar tubes is by contrast sparsely described and have been obtained recently with complexes of ionic surfactants and cyclodextrins. [41,42,43,44,45]
A unique specificity of the multilamellar tubes of 12-HSA is their ability to swell and deswell over a wide range of temperature resulting in a tunable diameter. [46] At high temperature, they melt into small micelles above a threshold melting temperature [38] that depends on the counterion/12-HSA ratio: [39] in excess of counterions the transition is mostly driven by the melting of the chains whereas at lower content in counterions, for which H-bonding occurs between non-dissociated heads, it comes from both the chain-melting process and the surface-melting process. The formation of the tubes is a robust process as they can be obtained for a large set of physico-chemical conditions (concentrations, molar ratio, pH, ionic strength, addition of ethanol or doping by fatty acids). [11] Entanglements between tubes provide to their aqueous suspensions a hydrogel behavior [2] since their viscosity is larger by 3 to 5 orders of magnitude, depending on swelling, than that of the regime of small micelles at high temperature. [39,47] This opens the way to the design of thermo-responsive systems. For instance, such a large change of viscosity, associated to the strong elasticity of the 12HSA monolayers, has enabled the design of ultra-stable and responsive aqueous foams, [36] with a tunable temperature of destabilization. [49] The loading of tubes by molecules of biomedical interest for drug delivery applications has been demonstrated. [50]
We propose here a new strategy to design self-assemblies of long chains fatty acids in aqueous solutions with various and potentially thermo-responsive behavior. It is based on the formation of binary mixture of a given unsaturated fatty long chains and its hydroxylated counterpart. In this case, the behavior will be driven by specific interactions between both surfactants at the level of the alkyl chains, such as possible formation of hydrogen bonds, and not by the modifications of interactions between the polar heads, as for instance in the case of catanionic systems. To this aim, we choose to work on the stearic acid/12-hydroxystearic acid pair as both fatty acids have been solubilized in past work in the same conditions with ethanolamine counterion, with which they form very different self-assemblies at low temperature: multi-lamellar tubes for 12-HSA [38] and planar lamella and vesicles for the SA/ethanolamine system. [14] Moreover, both systems melt into micelles at high, but different, temperatures. [14,39] We also build on the seminal work of Fameau et al [11] that showed that 12-HSA molecules still form tubes at room temperature upon the introduction of a small amount of SA but turn into ribbons at larger SA content, a behavior that was hypothesized as coming from a local partitioning between the two kinds of fatty acids. The structure of the binary self-assemblies was however poorly described as it was only obtained by phase-contrast microscopy. We will in particular probe the regime of SA doped by a few 12-HSA molecules, never studied in solution to the best of our knowledge. Synergistic effects may be anticipated since the 2D phase diagram of monolayers of mixtures SA/12-HSA has an eutectic point. [51]
We focus on the behavior of the system at room temperature, probing exhaustively its structural and rheological properties over the full range of R (12-HSA/SA mole ratio). The multi-structural approach combines confocal microscopy, SANS, WAXS and CryoTEM measurements and is coupled with rheology measurements.
2. Results
2.1. Macroscopic Aspect
In order to make the mixtures, we chose to use a large excess of ethanolamine counterions so that all fatty acid heads would be ionized. This prompt us to work at r = 0.2, where , for which the tubes/micelles transition for pure HSA solution is ~ 40 °C. [3,39] The overall concentration of fatty acids was fixed at 2 wt% of surfactants in water, as in references [3,11,38,39] on pure solutions of 12-HSA, so mixtures can be compared to these latter. The stock-solutions of HSA and SA were prepared at 70 °C following a protocol previously developed for pure HSA solutions (see materials and methods section). Both HSA and SA solutions were clear at such a large temperature, suggesting the formation of micelles, in agreement with previous articles on SA [14] and HSA; [38,39] they were mixed at 70 °C, a temperature at which the resulting mixtures remained homogeneous and clear. The whole range of ratio R, where R=nHSA/nSA+nHSA, was probed, the R=0 sample being the pure SA and the R=1 sample the pure HSA. For all samples, the pH of the mixtures were constant (pH=10.85 ± 0.15, see Table 1), a value much larger than the pKa of the carboxylate groups (pKa of pure 12-hydroxy stearic acid is 4.75, and around 8 in presence of alkanolamines in excess [2] ).
When cooling down the mixtures to ambient temperature, all samples turn turbid, revealing the formation of objects that are sufficiently large to scatter visible light (Figure 2). At R=0.9 and R=1, the turbidity of samples is more intense, suggesting the formation of larger objects than for other ratios. All samples look homogeneous by naked eye with the exception of R=0.4 and R=0.5 that show some heterogeneities at macroscopic scale with respect to turbidity (see inset of Figure 2 for R=0.4). All the samples have a large apparent viscosity.
2.2. Confocal Microscopy
Confocal microscopy of samples has been performed on the whole range of ratio R using a hydrophobic dye, Nile Red. The Nile Red concentration is negligible with respect to the fatty acid concentration (see Materials and Methods), so that we assume that the morphology of the self-assembled structures is not modified by its introduction. Figure 3 shows some representative images of samples for all R probed with a ×100 objective. On the images, the black domains are enriched in Nile red, and correspond thus to the hydrophobic regions of the self-assembled structures made of the alkyl chains of the fatty acids, whereas white domains do not contain the fluorophores.
Figure 3I shows the image obtained for R=1 (pure HSA) that reveals the presence of disordered thin and rigid rods with a length of around 20 μm. These rods corresponds to the multi-lamellar tubes resulting from the self-assembly of HSA molecules. [39] The organization of these tubes appears disordered, without formation of any nematic order. When R decreases from 1 down to 0.75 upon the introduction of a small amount of SA (Figure 3H,G), the self-assembled structures conserve their rodlike shape. It however appears that the overall length of the rods decreases progressively, with a distribution of lengths that becomes more polydisperse, when R decreases. We did not make a statistical study of this variation of tube length in this regimes of large R because images are transversal cross-sections of a 3D sample.
At R = 0.75, it also appears that a very small amount of curved objects coexist with the long tubes. This trend is confirmed when decreasing R in the regime of intermediate R (R=0.6, R=0.5). Indeed, for R=0.6 (Figure 3F), the rigid thin polydisperse rods now coexist with an important amount of objects with a large curvature. For R=0.5, at stoichiometry, fatty acids self-assemble into bended long tubes that can reach much longer length that the 20 μm obtained at R = 1 and extend up to 60 μm (Figure S1E). These bended tubes appear to be made of two types of domains, with some rigid parts bound to each other by some curved parts. In this regime of intermediate R, the structure of fatty acid self-assemblies evolves thus continuously from bended tubes to rigid ones with R. In their seminal study where they introduced an important amount of SA in aqueous solutions of 12-HSA, Fameau et al. [11] observed by phase contrast microscopy the formation of twisted ribbons that are the precursors of multilamellar tubes. Confocal microscopy does not allow to discriminate between multi-lamellar tubes and ribbons, however we hypothesize that the rigid parts do correspond to the tubes and the bended ones to ribbons.
At low R, where SA is in excess, the structure is completely different and images are less simple to interprete (see Figure 3D, Figure 3C and Figure 3B that correspond respectively to R=0.4, R=0.3 and R=0.2). There are no longer thin black lines in which all Nile red hydrophobic molecules concentrate, as it was for larger R, but 2D domains of variable levels of grey. Most of these domains have straight sides, suggesting the formation of facetted objects, connected to each other by either edges or by curved parts. Some other domains display a more spherical shape. These domains are all made of multi-lamellar bilayers, as demonstrated by SANS as we will show later. They have thus different distributions of thicknesses and orientations, which give rise to this variation of grey level from one domain to another. The fact that the majority of their sides are either straight or circular suggest that they are made of planar lamellar phases connected by spherical lamellar phases, that are possibly pieces of multilamellar tubes. The images also suggest that these domains are strongly entangled. Indeed, when following the temporal evolution of the system during the experiment, it appeared that these domains do not move individually but collectively (data not shown). This collective motion of domains is consistent with the fact that they are either connected to each other and/or strongly entangled.
Finally, for R=0 (pure SA), there are only small fluctuations of the color of the images, with a typical size of fluctuations of the order of a few microns, although SANS experiments shown later will unambiguously demonstrate that this sample contains planar lamellae. Since all lamellar phase domains contain the same amount of fluorophores in average, the only variations of grey level within the images come from orientation of the 2D lamellar domains. The image is thus consistent with a structural organization of planar lamellar phase domains with random orientations that occupy all space, in agreement with literature. [15]
2.3. Cryogenic Transmission Electron Microscopy (Cryo-TEM)
Pictures of samples were obtained by Cryogenic Transmission Electron Microscopy for pure HSA (R = 1), pure SA (R = 0), intermediate content of both kinds of molecules (R = 0.4) and low content of SA (R = 0.1). Samples were left at room temperature (around 20°C) for 24 hours to equilibrate before the freezing step. The final thickness of the frozen cut sample is around 1 micrometer, which is much lower than the length of the tubes of the order of 20 μm observed by confocal microscopy. This forces them to lay onto the grid surface.
For R=1, long straight rectangular objects are visible with a width of ~ 500 nm and a length that is at least 8 μm, as they exceed such a size that corresponds to the image section at the lowest magnification probed, in agreement with the length of 20 μm determined by confocal microscopy (Figure 4A–C). In all of these rectangles, there is a continuous gradient within the grey scale from the outer of the edges of the rectangle that are lighter to the inner of the rectangle that is darker, evidencing a continuous variation of their thickness from outward to inward. Even if the images are 2D, this demonstrates that these rectangular shapes do correspond to cylindrical tubes. There are some parallel dark lines within the tubes parallel to their edges, which originates from the presence of lamellas. Although SANS experiments demonstrate that the inter-lamellar distance is constant (see later), such a distance between lamella does not appear strictly constant on images, but this is an effect of projection from the 3D self-assemblies to the 2D images. Moreover, the dark center of the rectangles tubes does not show any lamella. This is also consistent with the formation of multi-lamellar tubes, as such a dark center corresponds to the top of adsorbed cylinder where lamella are parallel to the surface. Thus the exact estimate of the number of lamella is not possible from these cryo-TEM images, yet they reveal that there are at least 5 or 6 lamella per tube. Since the tubes lay onto the surface, there are no images of the section of the tubes, but they would resemble to onions. Similar pictures have been obtained by cryo-TEM on multi-lamellar tubes of SDS@2β-CD. [42] In summary, these cryo-TEM images are fully consistent with the structure proposed in literature for HSA self-assemblies as long rigid multi-lamellar tubes. They also evidence that the radius of these tubes are rather monodisperse, since their width is fairly constant from one tube to another. But the more interesting feature concerns their ends, which are open and not capped, as it is unambiguously visible in some pictures (Figure 4B). This was not established yet in literature.
For pure SA (R=0), while turbidity and SANS (see later) unambiguously demonstrate that large lamellar self-assembled aggregates do exist in solution, they are not visible at first sight on the grid. There are areas domains, with various size, that are more or less dark separated by straight edges that must correspond to steps between domains of different thicknesses (Figure 4L,M). Such areas come from the coverage of the surface by surfactants molecules, as proven by the presence of cracks, that are depleted in molecules since their light grey level corresponds to the pure grid, as shown in Figure 4N. It is likely that planar lamellar phases with a variable number of lamellae, but probably low, are deposited on the surface and lay parallel to it. The images are thus a top view of such lamella and the steps correspond to a change of lamellas number from one domain to another. The darker the area, the larger the number of lamella. Similar pictures have been also obtained by cryo-TEM on Lα lamellar phase on fatty acids in excess of alkali. [15]
For R = 0.4, there are also long rigid multi-lamellar tubes with open ends, as for the R= 1 case with the same order of magnitude of radius (Figure 4D–F) and a length that still exceeds 10 microns (Figure 4G). However, compared to such R = 1 case, the number of lamella seems to be slightly reduced in average, and varies more largely from one tube to another. It also appears that parts of the tubes are slightly curved. This is in line with what was observed by confocal microscopy at R = 0.5 with long 1D objects with rigid and soft domains. This suggests that part of the objects evidenced by cryo-TEM are twisted ribbons and not multilamellar tubes, although the cryo-TEM images do not allow to arbitrate between both structures as they give the same image due to projection. The curved parts would come from the lowest rigidity of the ribbons.
For R = 0.1, there are no longer multi-lamellar tubes but the images still reveal the existence of lamellar structures with different morphologies and various number of lamella. The most striking feature concern the curvature of these lamellar, as they appear either straight, that may account for planar lamella or pieces of large tubes, or spherical, suggesting truncated onion vesicles (Figure 4H,J). Such straight and spherical lamella eventually merge to form a single multi-lamellar objects (Figure 4I). Regarding the number of lamella, it is ranging from a single lamella up to a few ones with the same order of magnitude as the tubes at R = 1. Also, part of images show the dark areas and steps, revealing the presence of planar lamellas sitting onto the surface, as for the R = 0 case (Figure 4K). The samples are thus composed of different kinds of self-assemblies that partially fuse with different curvatures. It is thus likely that these different kinds of self-assembled aggregates do not all contain the same amount of SA and HSA molecules, i.e. there exists a partitioning between the two surfactants at the local scale.
2.4. Structure at Local Scale by SANS
The structure of self-assembled surfactants was determined by SANS in the whole range of R (Figure 5A). SANS probes a range of distances from ca. 10 Å to 1 µm in solution, with no artifact from deposition on a 2D surface, and no addition of an extra probe; it does require to work in heavy water D2O to create a contrast with the hydrogen-rich molecules and to decrease the large incoherent scattering of [1] H, that acts as a constant background for SANS. Data are presented as intensity versus q, the magnitude of the wavevector, expressed in reciprocal length scale. In a first approximation, intensity-features at a given q-value can be associated to characteristic dimensions d based on the Bragg relation d~2π/q.
The SANS scattering spectra of the pure SA sample (R = 0) display all the characteristic features of a 2-D lamellar phase : (i) a q- [2] scattering decay in the low q region, typical from the scattering of a 2-D object and that accounts for the planar shape of lamella, (ii) a strong correlation peak at q0 = 0.0109 Å- [1] followed by its harmonics at n·q0 (n=2, 3, 4…) that accounts for the Bragg peak associated with the interlamellar distance dinter whose order of magnitude is ~ 575 Å (2π/q0) and (iii) a so-called form factor oscillation at around 0.25 Å- [1] originating from the cross-section of the lamellae and enabling to determine its thickness at ~25 Å (2π/0.25). Such scattering spectra unambiguously demonstrate that the sample is made of lamellar phase in agreement with previous results from [14] that deduce the formation of a lamellar phase by birefringence measurements, even if they are not visible on the cryo-TEM pictures.
The pure HSA system (R = 1) also displays the characteristics features of lamellar phases at intermediate and large q, (i.e. a correlation peak followed by its harmonics, oscillation at large q). It however immediately appear that interlamellar thickness is strongly reduced compared to the pure SA case and interactions between lamella are different from the pure SA case since q0_R=1 is strongly shifted towards low q with respect to q0_R=0 at ~ 0.025 Å- [1] (dinter = 240 Å). The correlation peak is narrower, its harmonic being visible up to 6th order, indicating a more regular periodicity, i.e. bilayers fluctuate less in the R = 1 case and/or comprise more stacked bilayers in tube wall than those forming the SA lamellar phase. The thickness of the lamella is similar to that of the pure SA case since the form factor oscillation is also at 0.25 Å- [1] . The main difference to the SA case appears in the low q region where the overall scattering decays overall like q- [3] and no longer as q- [2] , and shows a well-defined marked oscillation at 1.2 10- [3] Å- [1] , that comes from the form factor of tube diameter. The highlighting of such an oscillation was made possible by the extended low q range of the D11 diffractometer and was not yet reported on the scattering curves of the same system in literature as they were all limited to a reduced q-range. The overall q- [3] decay has however already been obtained on the scattering of hollow tubes and multi-lamellar tubes on other systems. [42,43,45,52] Assuming that tubes are rigid, such q- [3] can be explained by a decoupling approximation from a tube in its length (∝ 1/q) by its 2-D discotic section (∝ 1/q [2] ). In the case of an imogolite hollow tube, Paineau et al [52] , proposed to fit the scattering form factor by , where Δρ is the difference in scattering density between the tubes and the solvent, Rext and Rint being respectively the external and internal diameters of the hollow tubes, and F the Fourier transform of the projection or a full cylinder of radius R along its axis , with J1 the first-order cylindrical Bessel function. The extension to orientationally averaged multilamellar tubes was proposed in reference [45] for the fitting of scattering of multilamellar tubes made of SDS@2Β-CD complexes. It is here difficult to fit by such a model because the number of lamella is unknown. We have then fitted the low q part of the scattering spectra with a model of hollow tube with a single bilayer of fatty acids which allows to fit the minima and to recover the q- [3] decay (Figure 5a). The tube radius Rtube was estimated at 200 nm. Such model however overestimates the intensity in the very low q part of the spectra with respect to the experimental data. This is due to the high scattering intensity in this very low q region at ~ 10 [6] - 10 [7] cm- [1] resulting in multiple scattering events that lower in practice the experimental measured pattern from its true value.
For the other R probed, the SANS scattering evidence the formation of lamellar phases in every case, yet several regimes can be clear-cut evidenced.
In the regime of low content of SA molecules for which rigid tubes were observed in confocal microscopy (1 > R ≥ 0.75), the scattering spectra are very similar to those of the pure HSA system at R = 1. The oscillation arising from the form factor of the tube radius and an overall q- [3] scattering decay at low q, the correlation peak of the interlamellar phase and its harmonics are around at the same positions and their amplitudes and width have the same order of magnitude. The mixture of molecules self-associate thus into multi-lamellar tubes that have a very similar structure as for the pure HSA system, revealing that these tubes can accommodate a significant amount in SA molecules. These SA molecules insert themselves within the HSA self-assemblies without disturbing the structure of the tubes. The tube radius increases slightly with respect to the R = 1 case at 210 nm for R=0.9 and 250 nm for R=0.75.
At intermediate R, for R = 0.6 and R = 0.5, all of the scattering features of multilamellar tubes are recovered, except for the low q oscillation of the tube form factor that is no longer present, the scattering decaying like q- [3] over the whole probed low q-range. It this thus likely that the distribution of the outer diameters of the tubes become very broad, which leads to the disappearance of the oscillation. This likely comes from the fact that the self-assemblies are made of both multi-lamellar tubes and twisted ribbons, the respective rigid and soft domains of the tubes observed by confocal and cryo-TEM microscopies, in agreement with reference [11]. Even if the interlamellar distance is well defined, it is also possible that both rigid and curved domains do not contain the same amount of lamella, as it depends on the degree of rolling of the lamella into the ribbons.
At R = 0.4, the behavior is different. Although the scattering features are similar to those of the intermediate R case, the correlation peak and harmonics are strongly attenuated and shifted towards larger q, which evidences that interactions between lamella within tubes are largely different for such R. It has however to be kept in mind that samples partially phase separate at the macroscopic scale for such R and that the two phases are present in the measurement cuvette, since it has been filled from an homogenous solution at 70°C that has been cooled down. Given that the neutron beam illuminates both phases (with a beam cross-section near 1 cm- [2] ), it is thus difficult to go deeper in the SANS analysis for such a sample.
For R ≤ 0.25, at large content in SA molecules, the scattering curves markedly differ from the other cases. First, the correlation peak and its harmonics are much narrower than in the other cases, evidencing either stronger repulsions between lamella leading to a more regular periodicity, or a larger number of lamella per stack. Second, the scattering decays like q- [4] in the low q regime and no longer like q- [3] , even if cryo-TEM images show that there are still tubes in sample. This is the regime where confocal microscopy shows facetted objects and cryo-TEM straight rigid lamella and spherically curved lamella joint to each other. Neutrons interact thus with surfaces of very different orientations within the typical scale of the coherence length of neutrons (a few micrometers), which enables to recover the q- [4] Porod law. We postulate that in this regime where SA molecules are in excess, there is a partitioning between the two types of surfactants within the self-assemblies with 2-D lamellar phases of SA that are capped by partial pieces of vesicles (unilamellar or multilamellar) made of HSA molecules.
These first qualitative descriptions pointed out that there is a large evolution of the broadening of correlation peaks as a function of R. This may come either because bilayers fluctuate with different amplitudes or because the amount of stacked bilayers in the tube walls/lamellar phase changes. In order to get a refined quantitative description, all scattering curves in the intermediate and large q-region were fitted by a model proposed by Nallet et al [53] that considers a form factor of the lamella and a structure factor between lamella; both the number of stacked bilayers Nlam and the Caillé parameter (η) were adjusted accounting for the thermal fluctuations of the bilayers. Such a model allows us to determine the structural parameters of lamella (thickness, d-spacing dinter, rigidity from the Caillé parameter). η is essentially determined from the region of the spectrum where the Bragg peaks arise at intermediate q and the thickness of the lamella from the oscillation at large q, which enables us to decouple these parameters rather confidently in the fitting process. It is however difficult to decouple unambiguously Nlam from the Caillé parameter since both parameters play on the Bragg peaks amplitudes. We have thus varied both parameters when minimizing χ [2] during the fitting procedure, with a range of Nlam varying from 3 to 8. This maximal tested Nlam was chosen from geometrical constrains, given that Nlam times the interlamellar spacing dinter cannot exceed the tube radius. Values of Nlam corresponding to the best fits are recalled in the Table S1. For samples at large R, Nlam has a value of 3 or 4, in agreement with cryo-TEM images and previous data reported in literature of 4 stacked bilayers for pure HSA system [37] , and reached a maximal value of 7 at low R.
This model is able to fit satisfactorily all the data for which multi-lamellar objects were formed at 20 °C for all R (see Figure 5A). The low q part of the curves was not fitted as it displays different behavior from one sample to another (q- [2] versus q- [3] versus q- [4] ), that comes from either planar objects, tubes or ribbons, and facetted objects. These different behaviors at low q are highlighted in Figure S1 in Supplementary Materials that show the experimental data with a I(q)qα versus q representation, with α = 2, α = 3 and α = 4 respectively ). In case of tubes that have a monodisperse radius, the radius was obtained from the fit of the low q part by a model of hollow tube, as explained before. The quantitative values obtained for such fits for dinter, η, and the bilayer thickness as a function of R are shown in Table 1 in supplementary materials.
The bilayer thickness has an almost constant value of ~ 24 Å in all cases – the slight differences from one sample to another being within fit precision – which is slightly larger than the chain length of the fatty acids (21 Å), [38] which is similar whether there are HSA or SA molecules. Such a low value of the bilayer thickness evidences that fatty acid chains are thus strongly interdigitated.
dinter is much larger for pure SA (dinter = 575 Å at R = 0) than for pure HSA (dinter = 240 Å at R = 1) and varies almost continuously with R between these two values with two clear-cut regimes: (i) at large R (> 0.5), in the regime where multilamellar tubes are formed, this interlamellar distance varies only very slightly from one R to another, (ii) while at lower R, it decreases continuously with R with a linear decrease in the regime of low R where partitioning between two types of fatty acids occurs (0.1 ≤ R ≤ 0.25). In this last regime of low R, one may hypothesize that this experimentally obtained dinter is just an effective interlamellar spacing resulting from the linear combination of pure planar lamellar spacing of large dinter and pieces of multilamellar tubes of low dinter. Such coexistence of zones of very different dinter is however very unlikely because it would have led to the broadening of the peak, and the reverse is observed, up to the appearance of two separate correlation peaks. Moreover, the objects depicted in cryo-TEM and confocal microscopy appear continuous. Finally, dinter is much smaller than for the other samples at R = 0.4, but there are uncertainties on the measurement for such a sample, as noted here before.
The evolution of η is shown on Figure 5B. The bilayers are as much rigid as the Caillé parameter is low. For such a parameter, we refrain ourselves to discuss too deeply some slight differences from one sample to another as since Nlam and η are coupled parameters during fitting, which gives an intrinsic uncertainty of the quantitative fitted values of η. To assess if such quantitative values were strongly influenced by Nlam, we have also fitted all scattering curves of Figure with a fixed number of Nlam that was equal to 4. It appears that the values of η obtained in this latter case are always very close to those obtained when Nlam is a floating parameter during fitting (see Table S1 in Supplementary Materials). The large variations of η evidenced in Figure 5B are thus representative of variations in the rigidity of layers. It appears that the partial doping of HSA multilamellar tubes by SA induces a progressive decrease of rigidity of the bilayer since η progressively increases from 0.11 at R = 1 to η = 0.18 at R = 0.75 when introducing progressively a small amount of HSA molecules. It keeps then such constant value of ~ 0.18 at intermediate R, which is also the rigidity obtained for pure SA lamellar phases at R = 0. Surprisingly, in the regime of low R (0.1 ≤ R ≤ 0.25), the bilayers are much more rigid since the value of the Caillé parameter is around 5 times smaller, with an almost constant value of 0.03.
2.5. Wide Angle X-ray Scattering
WAXS measurements were performed to determine if the fatty acids chains within the bilayers are fluid or in a gelled state for the whole range of HSA/SA mixtures (Figure 6), as well as for a reference sample of pure 12-HSA molecules at r = 0.5. Indeed, the value of the bilayer thickness of 24 Å we obtained by SANS is exactly similar to that obtained in references [3,39] in the case of pure 12-HSA at the r = 0.2 we consider here , i.e. in excess of counterions. Such state does not correspond to the Lβ gel one, for which the bilayer has a much larger value of around 42 Å, exactly twice the fatty acids length, as obtained when ethanolamine and 12-HSA are at equimolarity for r = 0.5. [38] Besides, when counterions are in excess, it has also been shown by coupled DSC and structural measurements that the multi-lamellar tubes/micelles transition matches the fluid/gel transition of the chains in case of 12-HSA. [3,39] Thus, we hypothesize that fatty chains are in a crystalline gel state in pure 12-HSA system at every r, but with very different crystalline structures whether ethanolamine and 12-HSA are at equimolarity or with an excess of ethanolamine, with a strong interdigitation of the fatty acids chains within the gelled bilayer in this later case. All spectra show some Bragg diffraction peaks at large q, demonstrating that the fatty acids are in a crystalline gel state in all cases; the main correlation peak of the lamellar phase and its harmonics, already evidenced by SANS, are also visible at low q. For the pure suspensions of 12-HSA molecules, the crystalline structure of the bilayer at r = 0.2 (R = 0) is strikingly different from the likely Lβ gel phase reference at r = 0.5, confirming our hypothesis that the 12-HSA/ethanolamine ratio tunes the crystalline structure. The r = 0.2 solution shows indeed an intense peak at 1.495 Å- [1] and a less marked one at 1.58 Å- [1] within the q-window we probed, while the r = 0.5 shows an intense peak at 1.391 Å- [1] and two others of lower intensity at 1.572 Å- [1] and 1.597 Å- [1] . The pure SA system (R = 0) has another crystalline structure with a single rather broad Bragg peak at 1.53 Å- [1] .
The mixtures show four distinct behaviors. In large excess of 12-HSA molecules (R ≥ 0.75), the suspension displays the same Bragg peaks as for the R = 1 case. Hence the introduction of a small content of doping SA molecules does not prevent the system to crystallize within the structure of the pure 12- HSA solution that is recovered. The amplitude of the peaks however decreases upon an increase of SA content, suggesting that the size of the crystalline domains reduces. Symmetrically, with a large excess of SA molecules (R = 0.05), the influence of the introduction as a small amount of 12-HSA doping molecules is minute since the structure is similar as that of pure HSA. In excess of SA fatty acids (0.1 ≤ R ≤ 0.5), the main crystalline structure is the one of the pure SA sample: the Bragg peak of SA remains and those of the 12-HSA crystalline structure at r = 0.2 are lacking. The intensity of such SA Bragg peak decreases upon an increase of R, showing the progressive decrease of the size of the crystalline phase in lamellar domains of SA molecules. At the same time, a peak of low intensity appears at ~ 1.39 Å- [1] whose amplitude increases concomitantly with the decrease of the SA main broad peak upon increasing R. At R = 0.5, both peaks have almost the same intensity. The origin of this new Bragg peak likely comes from the formation of crystals domains that contain the HSA molecules and coexist with domains of pure SA molecules. Such a local phase separation between small domains that would have variable HSA/SA ratios is consistent with the confocal microscopy and cryo-TEM experiments. The structure of the new crystalline phase that contain the HSA molecules is difficult to assess, but it likely contains some SA molecules embedded in HSA ones since some of the Bragg peaks obtained for pure solutions of 12-HSA are lacking on the diffractogram, whether for r = 0.2 or r = 0.5. Finally, at R = 0.6, the spectra can be viewed as a linear combination of the spectra of both pure systems of 12-HSA at r = 0.2 and SA, because it shows nicely all the Bragg peaks associated to their respective crystalline structures, while the Bragg peak of low intensity arising at lower R at 1.39 Å- [1] is not any longer present. Moreover, the intensities of the main peaks of both structures are similar. This suggests the coexistence of similarly sized local domains of either pure 12-HSA or pure SA.
In summary, the crystalline structure of the gelled bilayers shifts continuously from the pure SA one to the pure HSA one upon the progressive introduction of HSA molecules, with a partial demixion between two types of molecule at intermediate R.
2.6. Rheology
Rheology was used to correlate the variety of structures observed as a function of R with their mechanical properties. Shear-stress-amplitude sweep measurements were carried out at a frequency of 1 Hz for each ratio R from 0 to 1. All results are reported on Figure S2. Those measurements allow for the determination of the storage G’ and loss G’’ modulus of the samples which respectively represent the solid/elastic and viscous component of the samples mechanical response. Hereafter we focus on the properties in the viscoelastic linear domain (Figure S2a,b).
Figure 7A displays the evolution of the elastic modulus G0’and viscous modulus G0’’ determined for the linear domain as a function of R. The loss factor tan δ is shown as an inset for the sake of clarity. Three domains of R with distinctive behaviors can be distinguished, and correlates well with the main structures of self-assemblies of the mixtures.
Figure 1.
(A) Plateau value of the Storage G0’ and Loss G0’’ modulus measured at 1 Hz for the different samples ratio from pure SA (R=0) to pure HSA (R=1) at 20 °C (Loss Factor in inset) (B) Shear stress as a function of the strain amplitude at a constant frequency of 1 Hz for selected samples (R=0.4; 0.6 and 1). Asymptotic curves (dashed lines) depict the elastic regime followed by the solution yielding. The associated yield stress is shown in the inset for R ranging from 0.4 to 1).
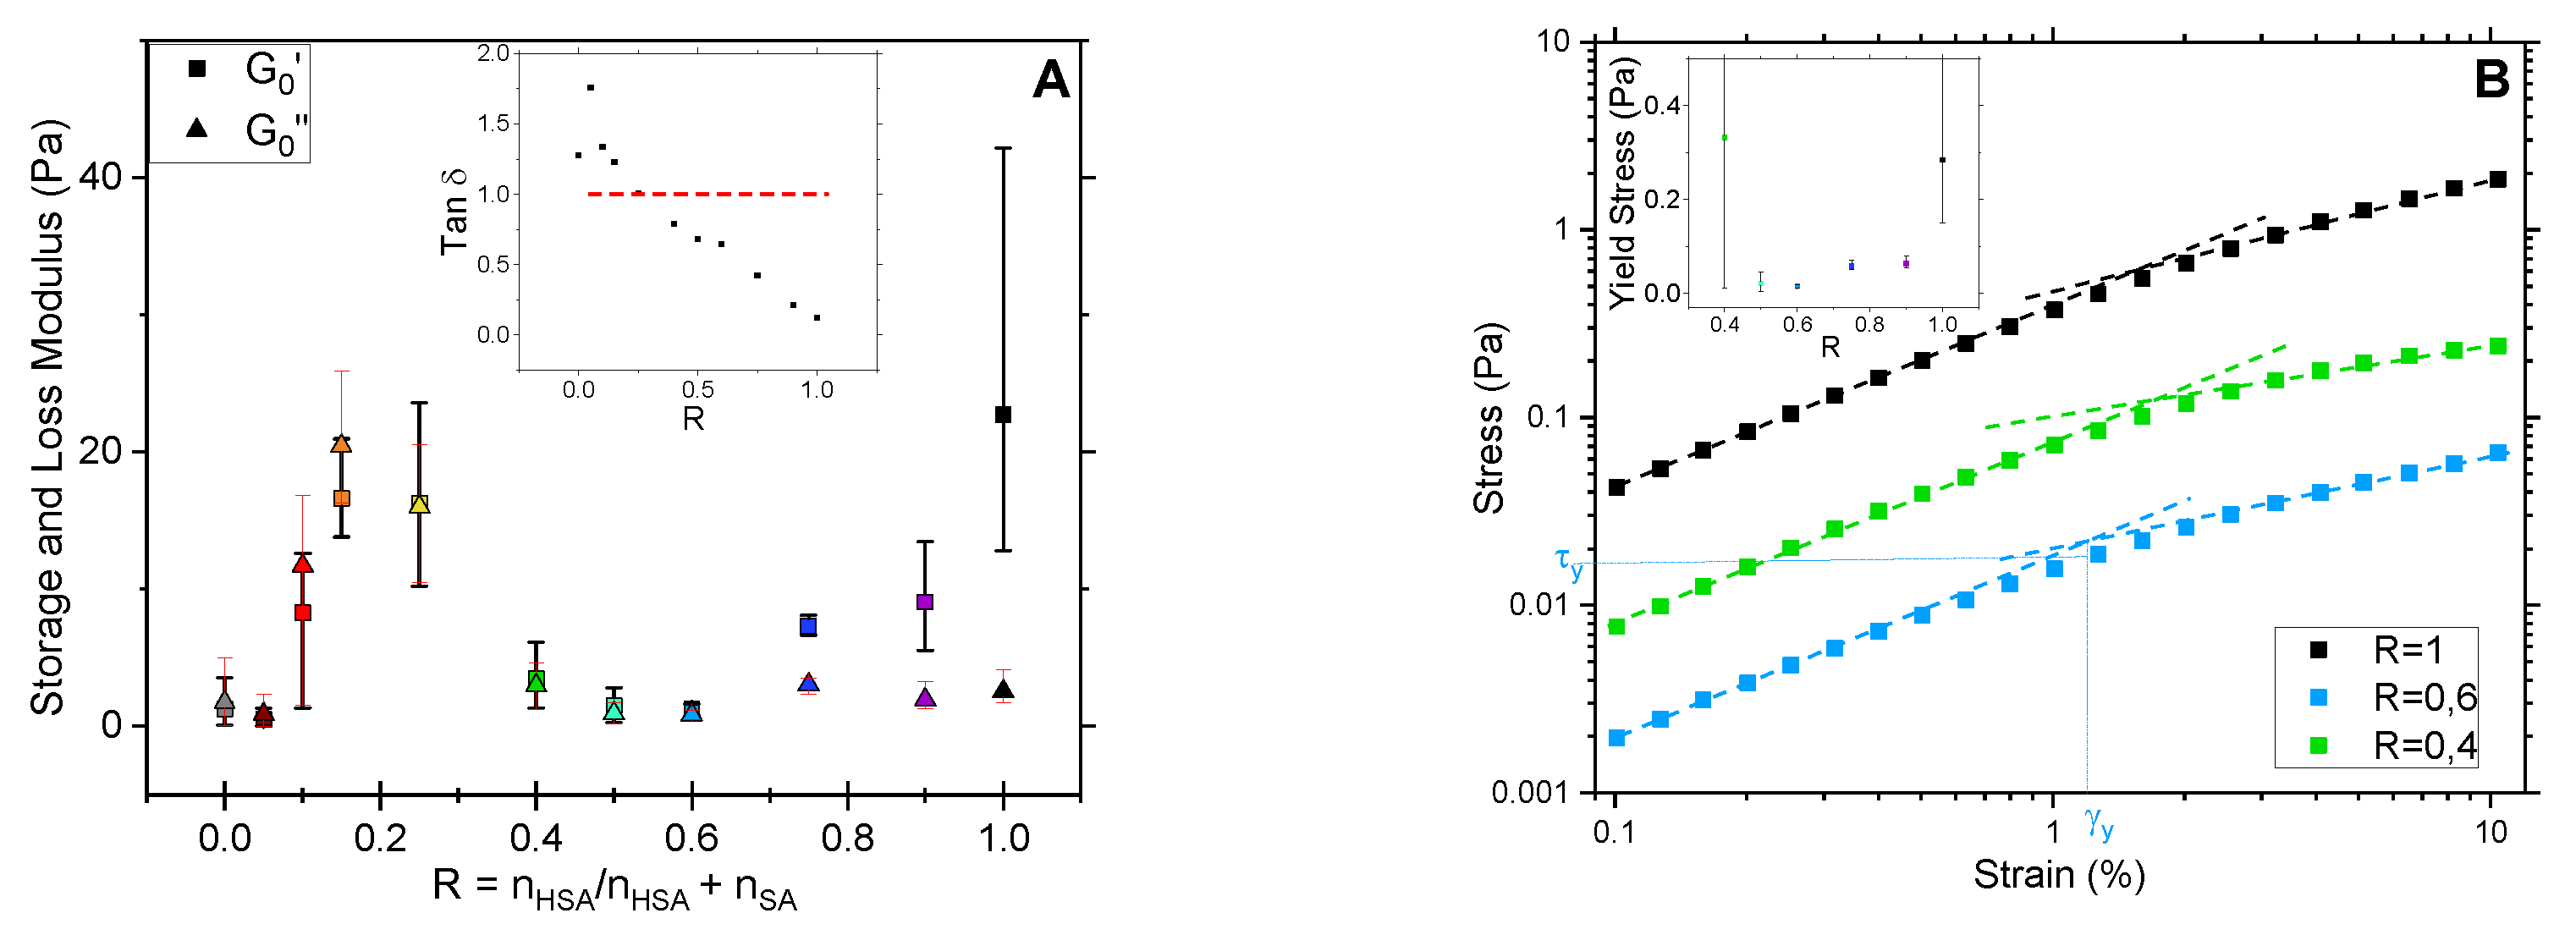
Figure 2.
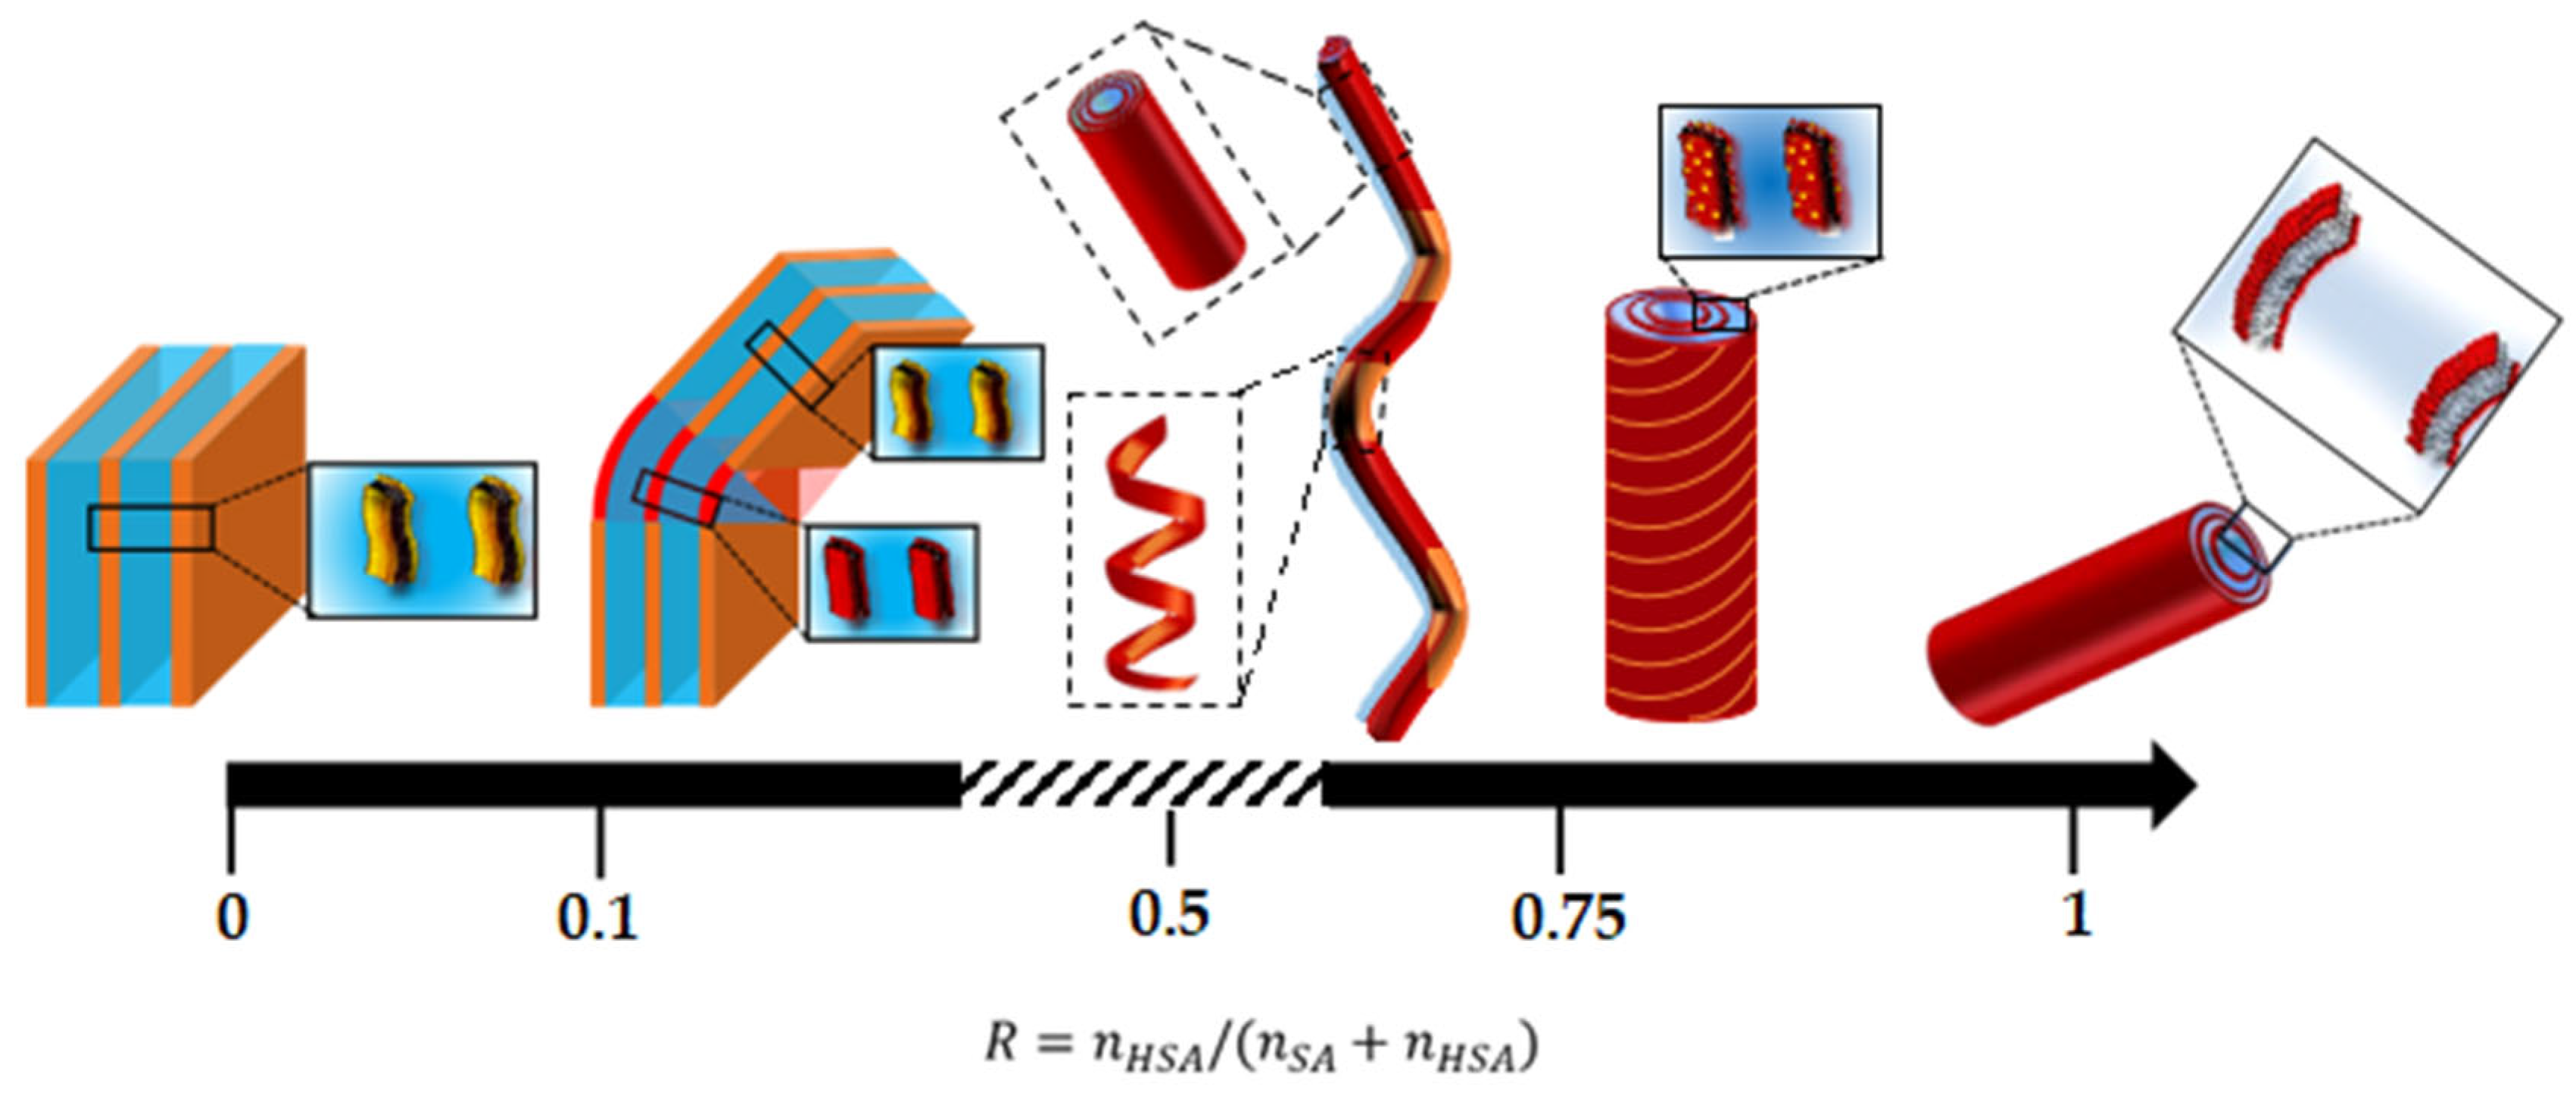
Schemes of the structures of the self-assembled aggregates as function of R from pure SA (R=0) to pure HSA (R=1) at 20°C. The SA molecules are shown in orange and the 12-HSA molecules in red. The scale is not kept constant from one structure to another. The dashed part of diagram correspond to the range of R where several structures coexist in solution.
Figure 2.
Schemes of the structures of the self-assembled aggregates as function of R from pure SA (R=0) to pure HSA (R=1) at 20°C. The SA molecules are shown in orange and the 12-HSA molecules in red. The scale is not kept constant from one structure to another. The dashed part of diagram correspond to the range of R where several structures coexist in solution.
For R=1, the elastic modulus G’0 of the pure HSA sample is significantly higher than the loss modulus and the loss factor tan δ = G’’/G’ is low (<<1). Furthermore, two asymptotic behaviors can be identified for the stress τ as function of strain γ. At low γ, τ varies linearly with γ, and then as γα , with α<1, once a critical stress τy is reached. τy is determined from the crossing point of the two asymptotic curves, as exemplified on Figure 7B for R=0.6. Those results indicate that, at 1 Hz, a pure 12-HSA sample at 2 wt% is an elastic gel at low stress and start to flow at large strain as we can observe in Figure S2a. Similar behavior was reported for the same system when multi-lamellar tubes, but with another ethanolamine/HSA ratio of r = 0.5, in reference [47] .
For R ≥ 0.75, the introduction of a few amount SA molecules in tubes causes a decrease of G’0 compared to the R = 1 samples while G’’0 stays unchanged. The loss factor increases thus accordingly but stays strictly inferior to 1 which indicates a gel-like behavior. As for R = 1, the samples display the features of yield stress gels, with a linear variation of τ(γ) at low γ, but the yield stress τy decreases. This evolution is consistent with the shortening of the multilamellar tubes when decreasing R evidenced with confocal microscopy. Given that the amount of fatty acids in solution is kept constant, the decrease of the length of multilamellar tubes decreases in turn the number of tubes entanglements and thereby G’0.
From 0.6 ≥ R ≥ 0.4, G’0 and G’’0 are almost constant, with G’0 slightly larger than G’’0. The samples are then also in a gel state in this regime of R, which is confirmed by the loss factor value that remains below 1. Similarly as for the regime at large R, samples display the features of yield stress gels, with a linear variation of τ(γ) at low γ. A decrease of R leads to both an increase of tan δ, i.e. a less solid-like behavior, and an increase of τy. This specific behavior arises from the fact that part of the rigid tubes turn into more flexible ribbons that bind the tubes to form longer objects, as observed in confocal microscopy. The self-assembled objects are then more flexible than at larger R but their overall length creates more entanglements.
Finally, in the regime of low content of SA (from 0.25 ≥ R ≥ 0), the behavior is completely different. Samples are no longer gels but viscous fluid since G’’ is larger than G’, the loss factor consequently rising above 1 (inset on Figure 7a). They have however G’0 values that are much larger than in the regime at larger R where tubes are formed, with values that can reach 20 times those obtained for R≥0.4 for some ratios (R= 0.15, R= 0.2 and R= 0.25), the maximum being at R = 0.25. This may come from the increased rigidity of the bilayers in this regime evidenced by SANS. In this regime, planar bilayers are formed, whether they are pure 2-D lamella at R = 0 or facetted objects where planar part are bound by curved parts at other R. These objects can entangle and organize themselves at mesoscopic scale in large domains that can move collectively (as observed by confocal microscopy) and slide one on the top of the other. Such a slippage would then explain the viscous fluid behavior of the solution.
For all samples, oscillatory measurements were completed with a frequency sweep between 0.05 and 5 Hz, with a constant strain of 0.1 %. They all display a shear thinning behavior (see Supplementary Materials). This is consistent with the yield stress fluid aspect in the case of gels. For the fluid viscous samples made of planar lamella, this may come from an induced transition into Multi Lamellar Vesicles under shear. The monitoring of the moduli did not enable us to determinate any relaxation time in the explored frequency range.
In summary, the mechanical properties of the samples display two main behaviors: at low content in SA, the samples are viscous fluids, with large G’0, and turn into gels at higher R of lower G’0, with a transition located between R = 0.25 and R = 0.4.
3. Discussion: Formation of the Different Aggregates Morphologies
The combination of the structural experiments carried out at 20 °C at all relevant scales of the system enable us to build the state diagram of the system as function of R at this temperature. The main structures are schematized in Figure 8. Please note that for the sake of simplicity we have chosen to show only one type of structure per R (tube, helical ribbon, facetted object, planar lamella) but several structures coexist in solution in the transition zones from one regime of structures to another. These transitions zones are likely rather broad with a progressive evolution from one morphology to another within such transitions zones. Overall, all structures are based on 2-D lamella stacked bilayers and display a very broad polymorphism depending on the ratio between the two type of fatty acids. At low R, when doping the SA molecules by a few amount of 12-HSA molecules, the planar multi-lamellar self-assemblies that are formed in pure SA solutions turn into complex multi-lamellar facetted structures with planar domains bounded by spherical curves domains. At large R, when doping the 12-HSA molecules by a few amount of SA molecules, the multi-lamellar long tubes that are formed in pure 12-HSA systems are preserved but their tube-length decreases upon addition of SA. At intermediate R, tubes and helical ribbons coexist and eventually fuse in spectacular long 1-D multilamellar objects made of tubes bonded by the helical ribbons. WAXS experiments revealed that two types of bilayers with different crystalline are present at low and intermediate R, which suggest a partial demixion between the two types of fatty acids for these ratios. There would then be a local distribution of variable 12-HSA ratios within the different part of the structures. At low R, the 12-HSA molecules would locate preferentially within the curved parts of the self-assemblies structures. At intermediate R, the SA would locate preferentially within the helical parts. These different morphologies of the self-assemblies (from 1-D multilamellar tubes to large domains of fatty acid lamellas) are associated with different clear-cut regimes of bilayers rigidities and drive the macroscopic rheological properties.
A first hypothesis to explain the occurrence of the various morphological transitions would be a variation of the ionization state of the carboxylated heads with R that would change the packing parameter. The pH is however almost constant for all samples at 10.85 ± 0.15 (see Table 1): All carboxyl heads are under their COO- form and negatively charged and probably associated with ethanolamine counter-ion since the pH remains almost constant for one sample to another 10.85 ± 0.15. The fact that 2-D self-assemblies are formed in every case originates then from the fact that all bilayers are in a crystalline gelled state and not in a fluid state, as demonstrated by WAXS, otherwise spherical micelles would have been formed, as usually obtained when long chain fatty acids are fluid and negatively charged. Also, the fact that all heads are negatively charged implies that electrostatic repulsions are similar on the whole range of R, whether they occur at the molecular level between heads or at the colloidal level between charged bilayers. Such electrostatic forces cannot thus be invoked to explain the strong variations of both the interlamellar layer dinter and the rigidity of the bilayer that occur when varying R (Figure 5B,C).
Another possibility to explain the partial local demixion between the two different fatty acids would come from a possible mismatch between the respective thicknesses of bilayers 12-HSA or SA when interacting with ethanolamine ions at r = 0.2, in spite of their alkyl chains having the same length (21 Å). The fatty acids indeed crystallize in bilayers with different in-plane structures (Figure 6). The thickness of the lamella is however the only structural parameter that remains constant for all R at ~ 24 Å (Figure 5D) which reveals a very strong interdigitation of the crystallized fatty acids within the bilayer. For the pure 12-HSA system, such an interdigitation comes from a mechanism related to the way the fatty acids interacts with the ethanolamine counterions because it occurs only in large excess of ethanolamine r = 0.2 but not at equimolarity at r = 0.5. For this latter ratio, when heads are not fully charged, there exists hydrogen bonds between them which leads to a more tight packing than at lower r when bilayers are non-interdigitated. The fatty acids crystallize in this non interdigitated bilayer then almost in the same way as monolayers of 12-HSA at the air/water interface. The Bragg peaks we obtain at r = 0.5 (respectively 1.391 Å- [1] , 1.572 Å- [1] and 1.597 Å- [1] ) indeed do almost correspond to those measured by GIXD on monolayers, [24,25] whose position vary slightly with the surface pressure and therefore with the tilt angle between the monolayer and the interface. The interdigitation process induces a full reorganization of the molecules since the interdigitated and non-interdigitated crystalline structures are completely different, although it remains impossible at this stage to determine if ethanolamine ions insert or not in the bilayer. Given that the crystalline bilayers of all samples at r = 0.2 are interdigitated roughly with the same thickness whatever R, it is likely that ethanolamine counterions interact in the same way with the fatty acids, whether they are SA or 12-HSA molecules. The interaction must takes then place between the heads of the fatty acids and ethanolamine.
The formation of the different morphologies with R, and their associated transitions, are then fully driven by the specific mechanisms induced by the presence of the OH hydroxyl function on the 12th carbon of the 12-HAS and the possibility of formation of hydrogen bonds with neighboring OH groups whenever possible. It is enthalpically favorable for the 12-HSA molecules to form homogeneous domains in which they have the same curvature and can interact one to each other through H-bonding of OH groups in position 12. The behavior of the mixtures is then driven by the competition between the mixing entropy, that favors a homogeneous distribution of two types of fatty acids within the bilayers, and enthalpic effects that would lead to the segregation of pure domains of SA molecules or 12-HSA molecules. Thus, depending on R, a local demixion can occur within a given type of self-assembled object, as for catanionic systems. [4,18,54] This likely arises in the low regime of R within the facetted objects. The demixion can even lead to the formation of different types of self-assembled structures that coexist in solution, as in the transition zone from facetted objects to tubes/ribbons around R = 0.4. Samples in which two very different types of self-assembled structures do coexist may undergo a gravity-induced phase separation due to difference of densities, which is partially arrested by the high viscosity of the samples. This may then create large macroscopic heterogeneities observed at R = 0.4 (see the inset of Figure 2) and that makes analysis of SANS data difficult for this regime.
The simplest case is the regime of low doping of 12-HSA multilamellar tubes by SA molecules (R ≥ 0.75). The doping molecules only create defects within the bilayer but do not modify the main arrangement of the self-assemblies: the crystalline structure of the bilayer of pure 12-HSA system is preserved, and the tubes’ external radius and interlamellar distances are of the same orders. Their introduction induces a progressive decrease of rigidity of the bilayer since η progressively slightly increases with R. This induces also a progressive concurrent increase of the tube radius and reduction of the length of the tubes. It is likely that part of the SA molecules mainly localizes at the edges of the 12-HSA bilayers that roll to form the tubes, which releases constraints and therefore decreases the bilayers rigidity. The progressive capping of the bilayers at the tubes ends mays also decrease their length.
At low R, in the regime of low doping of SA-self assemblies by a small amount of SA molecules (0.05 ≤ R ≤ 0.25), the multi-lamellar facetted structures with planar domains bounded by spherical curves domains suggest a local partitioning of the two fatty acids, which is confirmed by the presence of two type of crystalline structures by WAXS. The SA molecules would localize mainly in the planar domains, that have the curvature they adopt in pure solution, and 12-HSA would localize in the curved domains that make the edges of the facetted objects. Enthalpic effects would then predominate in this regime and lead to the formation of these domains enriched in 12-HSA molecules where they can form a rigid H-bond network and impose their curvature. Such domains would act then as rigid rafts within the bilayers, and therefore end up limiting membrane fluctuations. This may explain the high membrane rigidity evidenced in this regime, compared to all others R. In this regime, the interlamellar distance dinter decreases largely and linearly from R = 0 to R = 0.25. This may be explained by the specific topology of the self-assembled structures. Since dinter is much larger for the pure SA lamellar phase than for tubes (575 Å versus 240 Å), the junction of the planar lamellas of SA by bilayers of smaller interlamellar distance force them to approach themselves to fit the mismatch. The system adopts then an intermediate dinter that accounts for the respective contents of planar and curved parts domains, which explains why dinter decreases linearly with R. The increased rigidity of the membranes may also come from the fact that planar membranes of SA molecules are forced to come closer together.
When R tends to equimolarity at intermediate R, WAXS showed that demixion between the fatty acids occurs, as for the low R case. The main geometrical structures of the self-assemblies remain however close to those observed at large R in case of multilammellar tubes doped by HSA tubes. They are long tubular objects with very close rigidities and intermellar distances as for R = 0.75, while the crystalline structure stays close to that of pure SA. The large doping of the 12-HSA tubes by SA leads to the formation of helical ribbons, as already observed by Fameau et al in reference [11] that come from their partial unrolling when domains of SA of planar curvature insert within the tubes. The demixion between acids also lead to the formation of several types of tubular objects with various local contents in HSA/SA ratios, from rigid to helical ribbons, that eventually merge to form very long objects of various rigidities along the tubes. Also, close to the transition towards the low R regime art R = 0.4, it is likely that such tubular objects coexist with the facetted objects evidenced at low R.
4. Materials and Methods
4.1. Materials and Sample Preparation
12-Hydroxystearic acid (HSA) was purchased from Xilong Chemical Co., Ltd., Shantou, Stearic acid (SA) was purchased from Sigma-Aldrich and ethanolamine from Aldrich Chemistry (≥99.5%). H2O was provided by a Millipore system and D2O purchased from Eurisotop.
Aqueous stock-solutions of HSA and SA at a concentration of 100 g/L were prepared as follows. HSA (respectively SA) and ethanolamine were first weighted accurately in a sample tube into which ultrapure water was further added to reach the targeted molar concentration of fatty acid. The mass of ethanolamine was adjusted to set the molar ratio surfactant/counter ion r at 0.2, calculated by r = nfatty_acid/( nfatty_acid + nethanolamine). Then, the solutions were stirred and heated to 70 °C in an oven for 2 hours, a temperature at which solutions are non-viscous, and vortexed to ensure homogenization. They all look clear and homogeneous at 70 °C.
The mixture samples were then prepared at a fixed concentration of fatty acid molecules of 20 g/L by mixing stock-solutions and ultrapure water in appropriate dilutions to reach the targeted ratio of the two fatty acids R defined by:
where nHSA and nSA are the moles of the fatty acids. The mixtures were then heated back in an oven at 70 °C for two hours and vortexed for some seconds for homogenization. This concentration was chosen in order to compare the results with literature, where a large corpus of knowledge exists for the pure 12-HSA system. [11,38,39] In the case of SANS experiments, all samples were prepared in D2O at the same volume fraction.
We probed the following R values in the paper: 1 (pure sample of HSA fatty acids as reference), 0.9, 0.75, 0.6, 0.5, 0.4, 0.25, 0.1, 0.05 and 0 (reference sample of SA fatty acids).
In the following we systematically heated the samples at 70 °C for homogenization before any kind of measurement.
Table 1 shows the pH of each sample, it was measured with a Jenway 3510 pH Meter, at room temperature.

Table 1.
pH values for each ratio (R), measured at room temperature.
| R | pH |
|---|---|
| R=0 | [10.91;10.92] |
| R=0.05 | 10.94 |
| R=0.1 | [10.96;11.02] |
| R=0.15 | 10.75 |
| R=0.25 | 10.93 |
| R=0.4 | [10.75;10.79] |
| R=0.5 | [10.83;10.84] |
| R=0.6 | [10.86;10.88] |
| R=0.75 | [10.76;10.78] |
| R=0.9 | 10.85 |
| R=1 | [11.01;11.02] |
4.2. Confocal Microscopy
A Zeiss LSM 700 confocal system mounted on a Zeiss microscope with an AxioCam MRm and a ×100 oil-immersion objective was used to examine the samples with Nile Red (Aldrich Chemistry) in the proportion of 1 molecule of Nile Red per 2.10 [4] molecules of fatty acid. Each sample has been mixed with Nile red dye at 70°C and then measured at ambient temperature. The dye was excited by a laser at 514 nm.
4.3. Cryogenic Transmission Electron Microscopy (Cryo-TEM)
The cryo-transmission electron microscopy (Cryo-TEM) were performed at Institut de Minéralogie, de Physique des Matériaux et de Cosmochimie (IMPMC), Sorbonne Université. Samples were left in vials for two days at least to equilibrate at room temperature before being pipetted from vials. For each sample, a drop of the solution was deposited on “quantifoil”® carbon membrane grid (Quantifoil Micro Tools GmbH, Germany). The excess of liquid on the grid was absorbed with a filter paper and the grid was quench-frozen quickly in liquid ethane to form a thin vitreous ice film. Once placed in a Gatan 626 cryo-holder cooled with liquid nitrogen, the sample was transferred in the microscope and observed at low temperature (-180 °C). Cryo-TEM images were recorded on ultrascan 2k × 2k pixels CCD camera (Gatan, Pleasanton, California, USA), using a LaB6 JEOL JEM2100 (JEOL, Tokyo, Japan) cryo microscope operating at 200 kV with a JEOL low dose system (Minimum Dose System, MDS) to protect the thin ice film from any irradiation before imaging and reduce the irradiation during the image capture.
4.4. Small Angle Neutron Scattering (SANS)
Small angle neutron scattering experiments were performed at Institut Laue-Langevin (Grenoble, France) on the diffractometer D11 (DOI: http://dx.doi.org/10.5291/ILL-DATA.9-11-2041). We used four configurations (6 Å at 1.7 m, 6 Å 5.5 m, 6 Å at 20.5 m, and 13 Å at 38 m) to reach a very broad q-range spanning from 5.9 10- [4] Å- [1] to 0.53 Å- [1] . The samples were prepared in D2O in order to optimize neutron contrast with hydrogenated molecules and to reduce as much as possible incoherent scattering. We checked beforehand that the use of deuterated water instead of hydrogenated water does not modify the macroscopic aspect of samples. Samples were held in flat quartz cells (Hellma) with a 2 mm optical path.
All samples were measured at 20 °C. The temperature was set by a circulating bath that thermalizes the sample holder into which samples were placed. Transmissions, scattering of empty cell, [10] B4C ceramics (neutron absorber to value ambient background of experiment), scattering of hydrogenated water and differential scattering cross section of water were measured independently. Subtraction of parasitic contributions and normalization by water to take into account detectors heterogeneities were applied to raw data by the GRASP software (version Grasp Lockdown V.9.22e) to obtain corrected data in absolute units (cm- [1] ). [55] Contributions from solvent and incoherent scattering were then subtracted.
Fitting software used was SasView 5.0.4 (http://www.sasview.org/.). Fitting models are detailed in the supplementary information.
4.5. Wide Angle X-ray Scattering (WAXS)
WAXS measurements were carried out on a Xeuss 2.0 instrument from Xenocs, which uses a microfocused Cu Kα source with a wavelength of 1.54 Å and a PILATUS3 detector (Dectris, Switzerland). The experiments were performed at a sample-to-detector distance of 350 mm with a collimated beam size of 0.8 × 0.8 mm to achieve a q-range of 0.038 Å− [1] – 1.78 Å− [1] . The solutions were poured inside 1.5 mm glass capillaries that were placed onto a home-made sample holder thermalized with a circulating water flow coupled with a Huber bath, allowing to control the samples temperature to 20°C. The measurements were performed for 35 minutes per sample to achieve a good statistics. The respective scattering from empty beam, empty capillary and dark field were measured independently and subtracted from the sample scattering, taking account their relative transmission, and normalized with incident beam intensity to obtain scattering in absolute units (cm- [1] ). A reference water sample measurement was measured independently. The contribution from water to the samples scattering was then subtracted properly thanks to such reference water sample.
4.6. Rheology
Rheological measurements were carried out on an Anton Paar MCR 302 rheometer equipped with a cone-plate geometry (50mm diameter, 2° angle). The temperature during the experiment was set to 20°C and controlled through the lower plate with a Peltier device. The setup was covered with a hood to prevent the sample from drying.
Each solution was heated in an oven at 60°C for at least 45 minutes, then manipulated hot. In those conditions all solutions were homogeneous and fluid. . Once the gap set, the measurements were started after a resting time of 10 minutes for recovery and temperature homogenization.
Two types of oscillatory measurements were successively performed for each sample: an amplitude sweep measurement at a fixed frequency of 1Hz and a strain varying from 0.1 to 10% and a frequency sweep measurement at a fixed strain of 0.1% (which corresponds to the linear plateau) from 0.05 Hz to 5 Hz. The whole sequence took less than 40 minutes to be completed and no drying was observed at the end of the experiments. This protocol was repeated 3 times with renewed samples in order to estimate error bars.
5. Conclusion
We have demonstrated the proof-of-concept of the simple strategy we propose to tune the properties of aqueous solutions of long fatty chains based on a simple mixture of a saturated fatty acid and its hydroxylated counterpart, with the only variation of the ratio R between the two types of fatty keeping all other physicochemical parameters such as the ionization state or concentration constant. The specific effects induced by the variable amounts of hydroxyl functions along the fatty chains that are prone to make hydrogen bonds made indeed possible to create a wide range of nanostructures, from flat lamellar phases to entangled facetted objects, multilamellar rigid tubes up to very long tubular objects with rigid and more flexible parts. The rheological properties of the solutions correlate very well with the different morphologies, and show also a broad range of behavior, from viscous fluids to gels with a yield stress. Also, in the regime of large R, we demonstrated that the dimensions of the multilamellar tubes (radius and length) of 12-HSA fatty acids widely described in literature can be finely tuned by a partial doping by SA molecules, which tunes in turn their rheological properties by playing on the density of entanglements.
The behavior of the aqueous mixtures of SA/12HSA fatty acids on a large range temperature will be probed in a forthcoming paper in order to probe the potential of the self-assemblies as building blocks for the design of thermo-responsive systems.
Supplementary Materials
The following supporting information can be downloaded at the website of this paper posted on Preprints.org, Table S1: Values of the lamellas’ parameters by fitting the SANS data; Figure S1: SANS data in (q)qα versus q representation, with α = 2, α = 3 and α = 4; Figure S2a: Storage and Loss Modulus as a function of the strain, at 1Hz; Figure S2b: Storage and Loss Modulus as a function of the frequency, at 0.1% strain; Complex viscosity as a function of the frequency.
Funding
This research received no external funding.
Acknowledgments
The authors warmly thank Dr Anne-Laure Fameau for fruitful discussions. This work benefited from the use of the SasView application, originally developed under NSF award DMR-0520547. SasView contains code developed with funding from the European Union’s Horizon 2020 research and innovation programme under the SINE2020 project, grant agreement No 654000.
Conflicts of Interest
The authors declare no conflict of interest.
References
- Fameau, A.; Marangoni, A. G. Back to the Future: Fatty Acids, the Green Genie to Design Smart Soft Materials. J. Am. Oil Chem. Soc. 2022, 99 (7), 543–558. [Google Scholar] [CrossRef]
- Fameau, A.-L.; Rogers, M. A. The Curious Case of 12-Hydroxystearic Acid — the Dr. Jekyll & Mr. Hyde of Molecular Gelators. Curr. Opin. Colloid Interface Sci. 2020, 45, 68–82. [Google Scholar] [CrossRef]
- Fameau, A.-L.; Zemb, T. Self-Assembly of Fatty Acids in the Presence of Amines and Cationic Components. Adv. Colloid Interface Sci. 2014, 207, 43–64. [Google Scholar] [CrossRef] [PubMed]
- Michina, Y.; Carrière, D.; Charpentier, T.; Brito, R.; Marques, E. F.; Douliez, J.-P.; Zemb, T. Absence of Lateral Phase Segregation in Fatty Acid-Based Catanionic Mixtures. J. Phys. Chem. B 2010, 114 (5), 1932–1938. [Google Scholar] [CrossRef]
- Vautrin, C.; Zemb, T.; Schneider, M.; Tanaka, M. Balance of PH and Ionic Strength Influences on Chain Melting Transition in Catanionic Vesicles. J. Phys. Chem. B 2004, 108 (23), 7986–7991. [Google Scholar] [CrossRef]
- Dubois, M.; Lizunov, V.; Meister, A.; Gulik-Krzywicki, T.; Verbavatz, J. M.; Perez, E.; Zimmerberg, J.; Zemb, T. Shape Control through Molecular Segregation in Giant Surfactant Aggregates. Proc. Natl. Acad. Sci. 2004, 101 (42), 15082–15087. [Google Scholar] [CrossRef]
- Zemb, Th.; Dubois, M.; Demé, B.; Gulik-Krzywicki, Th. Self-Assembly of Flat Nanodiscs in Salt-Free Catanionic Surfactant Solutions. Science 1999, 283 (5403), 816–819. [Google Scholar] [CrossRef] [PubMed]
- Dubois, M.; Demé, B.; Gulik-Krzywicki, T.; Dedieu, J.-C.; Vautrin, C.; Désert, S.; Perez, E.; Zemb, T. Self-Assembly of Regular Hollow Icosahedra in Salt-Free Catanionic Solutions. Nature 2001, 411 (6838), 672–675. [Google Scholar] [CrossRef] [PubMed]
- Michina, Y.; Carrière, D.; Mariet, C.; Moskura, M.; Berthault, P.; Belloni, L.; Zemb, T. Ripening of Catanionic Aggregates upon Dialysis. Langmuir 2009, 25 (2),, 698–706. [Google Scholar] [CrossRef] [PubMed]
- Zana, R. Partial Phase Behavior and Micellar Properties of Tetrabutylammonium Salts of Fatty Acids: Unusual Solubility in Water and Formation of Unexpectedly Small Micelles. Langmuir 2004, 20 (14), 5666–5668. [Google Scholar] [CrossRef] [PubMed]
- Fameau, A.-L.; Houinsou-Houssou, B.; Novales, B.; Navailles, L.; Nallet, F.; Douliez, J.-P. 12-Hydroxystearic Acid Lipid Tubes under Various Experimental Conditions. J. Colloid Interface Sci. 2010, 341, 38–47. [Google Scholar] [CrossRef]
- Douliez, J.-P.; Navailles, L.; Nallet, F. Self-Assembly of Fatty Acid−Alkylboladiamine Salts. Langmuir 2006, 22, 622–627. [Google Scholar] [CrossRef]
- Novales, B.; Navailles, L.; Axelos, M.; Nallet, F.; Douliez, J.-P. Self-Assembly of Fatty Acids and Hydroxyl Derivative Salts. Langmuir 2008, 24 (1), 62–68. [Google Scholar] [CrossRef] [PubMed]
- Xu, W.; Gu, H.; Zhu, X.; Zhong, Y.; Jiang, L.; Xu, M.; Song, A.; Hao, J. CO 2 -Controllable Foaming and Emulsification Properties of the Stearic Acid Soap Systems. Langmuir 2015, 31 (21), 5758–5766. [Google Scholar] [CrossRef] [PubMed]
- Xu, W.; Zhang, H.; Zhong, Y.; Jiang, L.; Xu, M.; Zhu, X.; Hao, J. Bilayers at High PH in the Fatty Acid Soap Systems and the Applications for the Formation of Foams and Emulsions. J. Phys. Chem. B 2015, 119 (33), 10760–10767. [Google Scholar] [CrossRef] [PubMed]
- Xu, W.; Liu, H.; Song, A.; Hao, J. Bilayers and Wormlike Micelles at High PH in Fatty Acid Soap Systems. J. Colloid Interface Sci. 2016, 465, 304–310. [Google Scholar] [CrossRef] [PubMed]
- Fameau, A.-L.; Arnould, A.; Lehmann, M.; von Klitzing, R. Photoresponsive Self-Assemblies Based on Fatty Acids. Chem. Commun. 2015, 51 (14), 2907–2910. [Google Scholar] [CrossRef] [PubMed]
- Arnould, A.; Perez, A. A.; Gaillard, C.; Douliez, J.-P.; Cousin, F.; Santiago, L. G.; Zemb, T.; Anton, M.; Fameau, A.-L. Self-Assembly of Myristic Acid in the Presence of Choline Hydroxide: Effect of Molar Ratio and Temperature. J. Colloid Interface Sci. 2015, 445, 285–293. [Google Scholar] [CrossRef]
- Arnould, A.; Cousin, F.; Chabas, L.; Fameau, A.-L. Impact of the Molar Ratio and the Nature of the Counter-Ion on the Self-Assembly of Myristic Acid. J. Colloid Interface Sci. 2018, 510, 133–141. [Google Scholar] [CrossRef]
- Klein, R.; Kellermeier, M.; Drechsler, M.; Touraud, D.; Kunz, W. Solubilisation of Stearic Acid by the Organic Base Choline Hydroxide. Colloids Surf. Physicochem. Eng. Asp. 2009, 338 (1–3), 129–134. [CrossRef]
- Cistola, D. P.; Atkinson, D.; Hamilton, J. A.; Small, D. M. Phase Behavior and Bilayer Properties of Fatty Acids: Hydrated 1:1 Acid-Soaps. Biochemistry 1986, 25 (10), 2804–2812. [Google Scholar] [CrossRef]
- Klein, R.; Touraud, D.; Kunz, W. Choline Carboxylate Surfactants: Biocompatible and Highly Soluble in Water. Green Chem. 2008, 10 (4), 433. [CrossRef]
- Zana, R.; Schmidt, J.; Talmon, Y. Tetrabutylammonium Alkyl Carboxylate Surfactants in Aqueous Solution: Self-Association Behavior, Solution Nanostructure, and Comparison with Tetrabutylammonium Alkyl Sulfate Surfactants. Langmuir 2005, 21 (25), 11628–11636. [Google Scholar] [CrossRef]
- Cristofolini, L.; Fontana, M. P.; Boga, C.; Konovalov, O. Microscopic Structure of Crystalline Langmuir Monolayers of Hydroxystearic Acids by X-Ray Reflectivity and GID: OH Group Position and Dimensionality Effect. Langmuir 2005, 21 (24), 11213–11219. [Google Scholar] [CrossRef]
- Vollhardt, D.; Siegel, S.; Cadenhead, D. A. Characteristic Features of Hydroxystearic Acid Monolayers at the Air/Water Interface. J. Phys. Chem. B 2004, 108 (45),, 17448–17456. [Google Scholar] [CrossRef]
- Yim, K. S.; Rahaii, B.; Fuller, G. G. Surface Rheological Transitions in Langmuir Monolayers of Bi-Competitive Fatty Acids. Langmuir 2002, 18 (17), 6597–6601. [Google Scholar] [CrossRef]
- Overs, M.; Hoffmann, F.; Schäfer, H. J.; Hühnerfuss, H. Infrared Reflection−Absorption Spectroscopy of Racemic and Enantioenriched Methyl 17,18-Dihydroxyoctadecanoate at the Air−Water Interface. Langmuir 2000, 16 (17), 6995–6998. [Google Scholar] [CrossRef]
- Yang, H.-K.; Zhang, C.; He, X.-N.; Wang, P.-Y. Effects of Alkyl Chain Lengths on 12-Hydroxystearic Acid Derivatives Based Supramolecular Organogels. Colloids Surf. Physicochem. Eng. Asp. 2021, 616, 126319. [Google Scholar] [CrossRef]
- Terech, P.; Pasquier, D.; Bordas, V.; Rossat, C. Rheological Properties and Structural Correlations in Molecular Organogels. Langmuir 2000, 16 (10), 4485–4494. [Google Scholar] [CrossRef]
- Burkhardt, M.; Noirez, L.; Gradzielski, M. Organogels Based on 12-Hydroxy Stearic Acid as a Leitmotif: Dependence of Gelation Properties on Chemical Modifications. J. Colloid Interface Sci. 2016, 466, 369–376. [Google Scholar] [CrossRef] [PubMed]
- Gordon, R.; Stober, S. T.; Abrams, C. F. Effects of Optical Purity and Finite System Size on Self-Assembly of 12-Hydroxystearic Acid in Hexane: Molecular Dynamics Simulations. J. Phys. Chem. B 2017, 121 (39), 9223–9233. [Google Scholar] [CrossRef]
- Mallia, V. A.; Weiss, R. G. Self-Assembled Fibrillar Networks and Molecular Gels Employing 12-Hydroxystearic Acid and Its Isomers and Derivatives: FIBRILLAR NETWORKS AND GELS WITH 12-HYDROXYSTEARIC ACID DERIVATIVES. J. Phys. Org. Chem. 2014, 27 (4), 310–315. [Google Scholar] [CrossRef]
- Takeno, H.; Yanagita, M.; Motegi, Y.; Kondo, S. Relationship between Helical Aggregates and Polymorphs in a 12-Hydroxystearic Acid Gel: Their Thermal Stability and Formation Kinetics. Colloid Polym. Sci. 2015, 293 (1), 199–207. [Google Scholar] [CrossRef]
- Liu, C.; Corradini, M.; Rogers, M. A. Self-Assembly of 12-Hydroxystearic Acid Molecular Gels in Mixed Solvent Systems Rationalized Using Hansen Solubility Parameters. Colloid Polym. Sci. 2015, 293 (3), 975–983. [Google Scholar] [CrossRef]
- Tachibana, T.; Kambara, H. Studies of Helical Aggregates of Molecules. I. Enantiomorphism in the Helical Aggregates of Optically Active 12-Hydroxystearic Acid and Its Lithium Salt. Bull. Chem. Soc. Jpn. 1969, 42 (12), 3422–3424. [Google Scholar] [CrossRef]
- Nakagawa, M.; Kawai, T. Tuning Gel–Sol Transition Behavior of a Hydrogel Based on 12-Hydroxystearic Acid and a Long-Chain Amidoamine Derivative. Bull. Chem. Soc. Jpn. 2019, 92 (2), 435–440. [Google Scholar] [CrossRef]
- Douliez, J.-P.; Gaillard, C.; Navailles, L.; Nallet, F. Novel Lipid System Forming Hollow Microtubes at High Yields and Concentration. Langmuir 2006, 22 (7),, 2942–2945. [Google Scholar] [CrossRef]
- Fameau, A.-L.; Cousin, F.; Navailles, L.; Nallet, F.; Boué, F.; Douliez, J.-P. Multiscale Structural Characterizations of Fatty Acid Multilayered Tubes with a Temperature-Tunable Diameter. J. Phys. Chem. B 2011, 115 (29), 9033–9039. [Google Scholar] [CrossRef]
- Fameau, A.-L.; Cousin, F.; Saint-Jalmes, A. Morphological Transition in Fatty Acid Self-Assemblies: A Process Driven by the Interplay between the Chain-Melting and Surface-Melting Process of the Hydrogen Bonds. Langmuir 2017, 33 (45), 12943–12951. [Google Scholar] [CrossRef]
- Valéry, C.; Artzner, F.; Paternostre, M. Peptide Nanotubes: Molecular Organisations, Self‐Assembly Mechanisms and Applications. Soft Matter 2011, 7 (20), 9583. [CrossRef]
- Jiang, L.; Peng, Y.; Yan, Y.; Deng, M.; Wang, Y.; Huang, J. “Annular Ring” Microtubes Formed by SDS@2β‐ CD Complexes in Aqueous Solution. Soft Matter 2010, 6 (8), 1731. [CrossRef]
- Yang, S.; Yan, Y.; Huang, J.; Petukhov, A. V.; Kroon-Batenburg, L. M. J.; Drechsler, M.; Zhou, C.; Tu, M.; Granick, S.; Jiang, L. Giant Capsids from Lattice Self‐Assembly of Cyclodextrin Complexes. Nat. Commun. 2017, 8 (1), 15856. [CrossRef] [PubMed]
- Landman, J.; Ouhajji, S.; Prévost, S.; Narayanan, T.; Groenewold, J.; Philipse, A. P.; Kegel, W. K.; Petukhov, A. V. Inward Growth by Nucleation: Multiscale Self‐Assembly of Ordered Membranes. Sci. Adv. 2018, 4 (6), eaat1817. [CrossRef]
- dos Santos Silva Araújo, L.; Watson, L.; Traore, D. A. K.; Lazzara, G.; Chiappisi, L. Hierarchical Assembly of PH-Responsive Surfactant–Cyclodextrin Complexes. Soft Matter 2022, 18 (35), 6529–6537. [Google Scholar] [CrossRef] [PubMed]
- Ouhajji, S.; Landman, J.; Prévost, S.; Jiang, L.; Philipse, A. P.; Petukhov, A. V. In Situ Observation of Self-Assembly of Sugars and Surfactants from Nanometres to Microns. Soft Matter 2017, 13 (13), 2421–2425. [Google Scholar] [CrossRef] [PubMed]
- Douliez, J.-P.; Pontoire, B.; Gaillard, C. Lipid Tubes with a Temperature-Tunable Diameter. ChemPhysChem 2006, 7 (10), 2071–2073. [Google Scholar] [CrossRef]
- Fameau, A.-L.; Saint-Jalmes, A. Yielding and Flow of Solutions of Thermoresponsive Surfactant Tubes: Tuning Macroscopic Rheology by Supramolecular Assemblies. Soft Matter 2014, 10 (20), 3622. [CrossRef]
- Fameau, A.-L.; Saint-Jalmes, A.; Cousin, F.; Houinsou Houssou, B.; Novales, B.; Navailles, L.; Nallet, F.; Gaillard, C.; Boué, F.; Douliez, J.-P. Smart Foams: Switching Reversibly between Ultrastable and Unstable Foams. Angew. Chem. Int. Ed. 2011, 50 (36), 8264–8269. [Google Scholar] [CrossRef]
- Fameau, A.-L.; Cousin, F.; Derrien, R.; Saint-Jalmes, A. Design of Responsive Foams with an Adjustable Temperature Threshold of Destabilization. Soft Matter 2018, 14 (14), 2578–2581. [Google Scholar] [CrossRef]
- Salerno, C.; Chiappetta, D. A.; Arechavala, A.; Gorzalczany, S.; Scioscia, S. L.; Bregni, C. Lipid-Based Microtubes for Topical Delivery of Amphotericin B. Colloids Surf. B Biointerfaces 2013, 107, 160–166. [Google Scholar] [CrossRef]
- Matuo, H.; Mitsui, T.; Motomura, K.; Matuura, R. Eutectic Transformation in Mixed Monolayers of Long Normal Chain Fatty Acids with 12-Hydroxyoctadecanoic Acid. Chem. Phys. Lipids 1981, 29 (1), 55–67. [Google Scholar] [CrossRef]
- Paineau, E.; Krapf, M.-E. M.; Amara, M.-S.; Matskova, N. V.; Dozov, I.; Rouzière, S.; Thill, A.; Launois, P.; Davidson, P. A Liquid‐Crystalline Hexagonal Columnar Phase in Highly‐Dilute Suspensions of Imogolite Nanotubes. Nat. Commun. 2016, 7 (1), 10271. [CrossRef] [PubMed]
- Nallet, F.; Laversanne, R.; Roux, D. Modelling X-Ray or Neutron Scattering Spectra of Lyotropic Lamellar Phases : Interplay between Form and Structure Factors. J. Phys. II 1993, 3 (4),, 487–502. [Google Scholar] [CrossRef]
- Dubois, M.; Gulik-Krzywicki, T.; Demé, B.; Zemb, T. Rigid Organic Nanodisks of Controlled Size: A Catanionic Formulation. Comptes Rendus Académie Sci. - Ser. IIC - Chem. 1998, 1 (9),, 567–575. [Google Scholar] [CrossRef]
- Cousin, F. Small Angle Neutron Scattering. EPJ Web Conf. 2015, 104, 01004. [Google Scholar] [CrossRef]
Figure 1.
Representation of (A) stearic acid molecule and (B) 12-hydroxy stearic acid molecules.
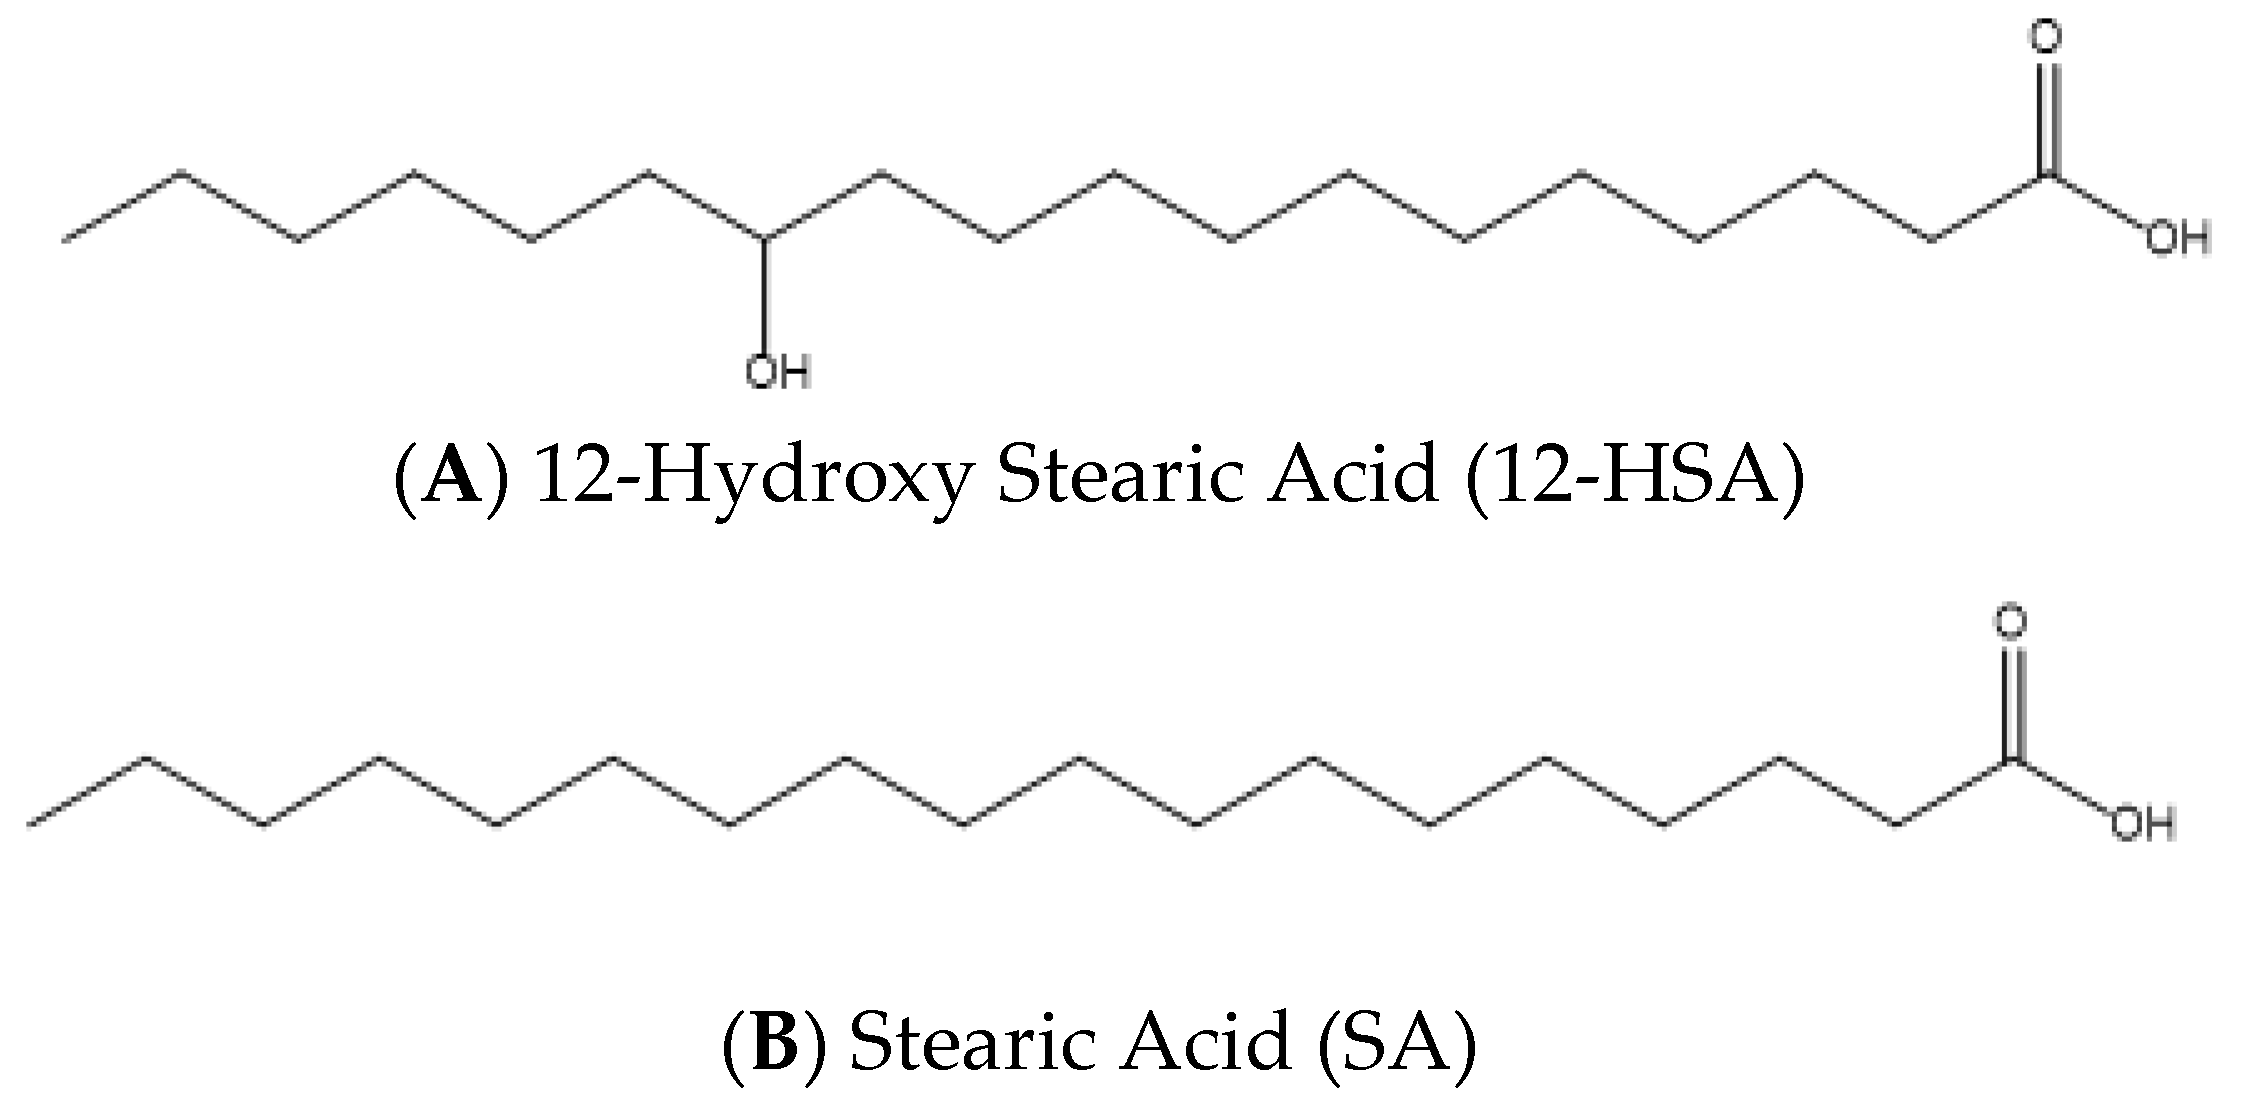
Figure 2.
Photographs of the samples at all ratios R probed in the paper. The inset at R=0.4 is a zoom showing its heterogeneous macroscopic aspect.
Figure 2.
Photographs of the samples at all ratios R probed in the paper. The inset at R=0.4 is a zoom showing its heterogeneous macroscopic aspect.
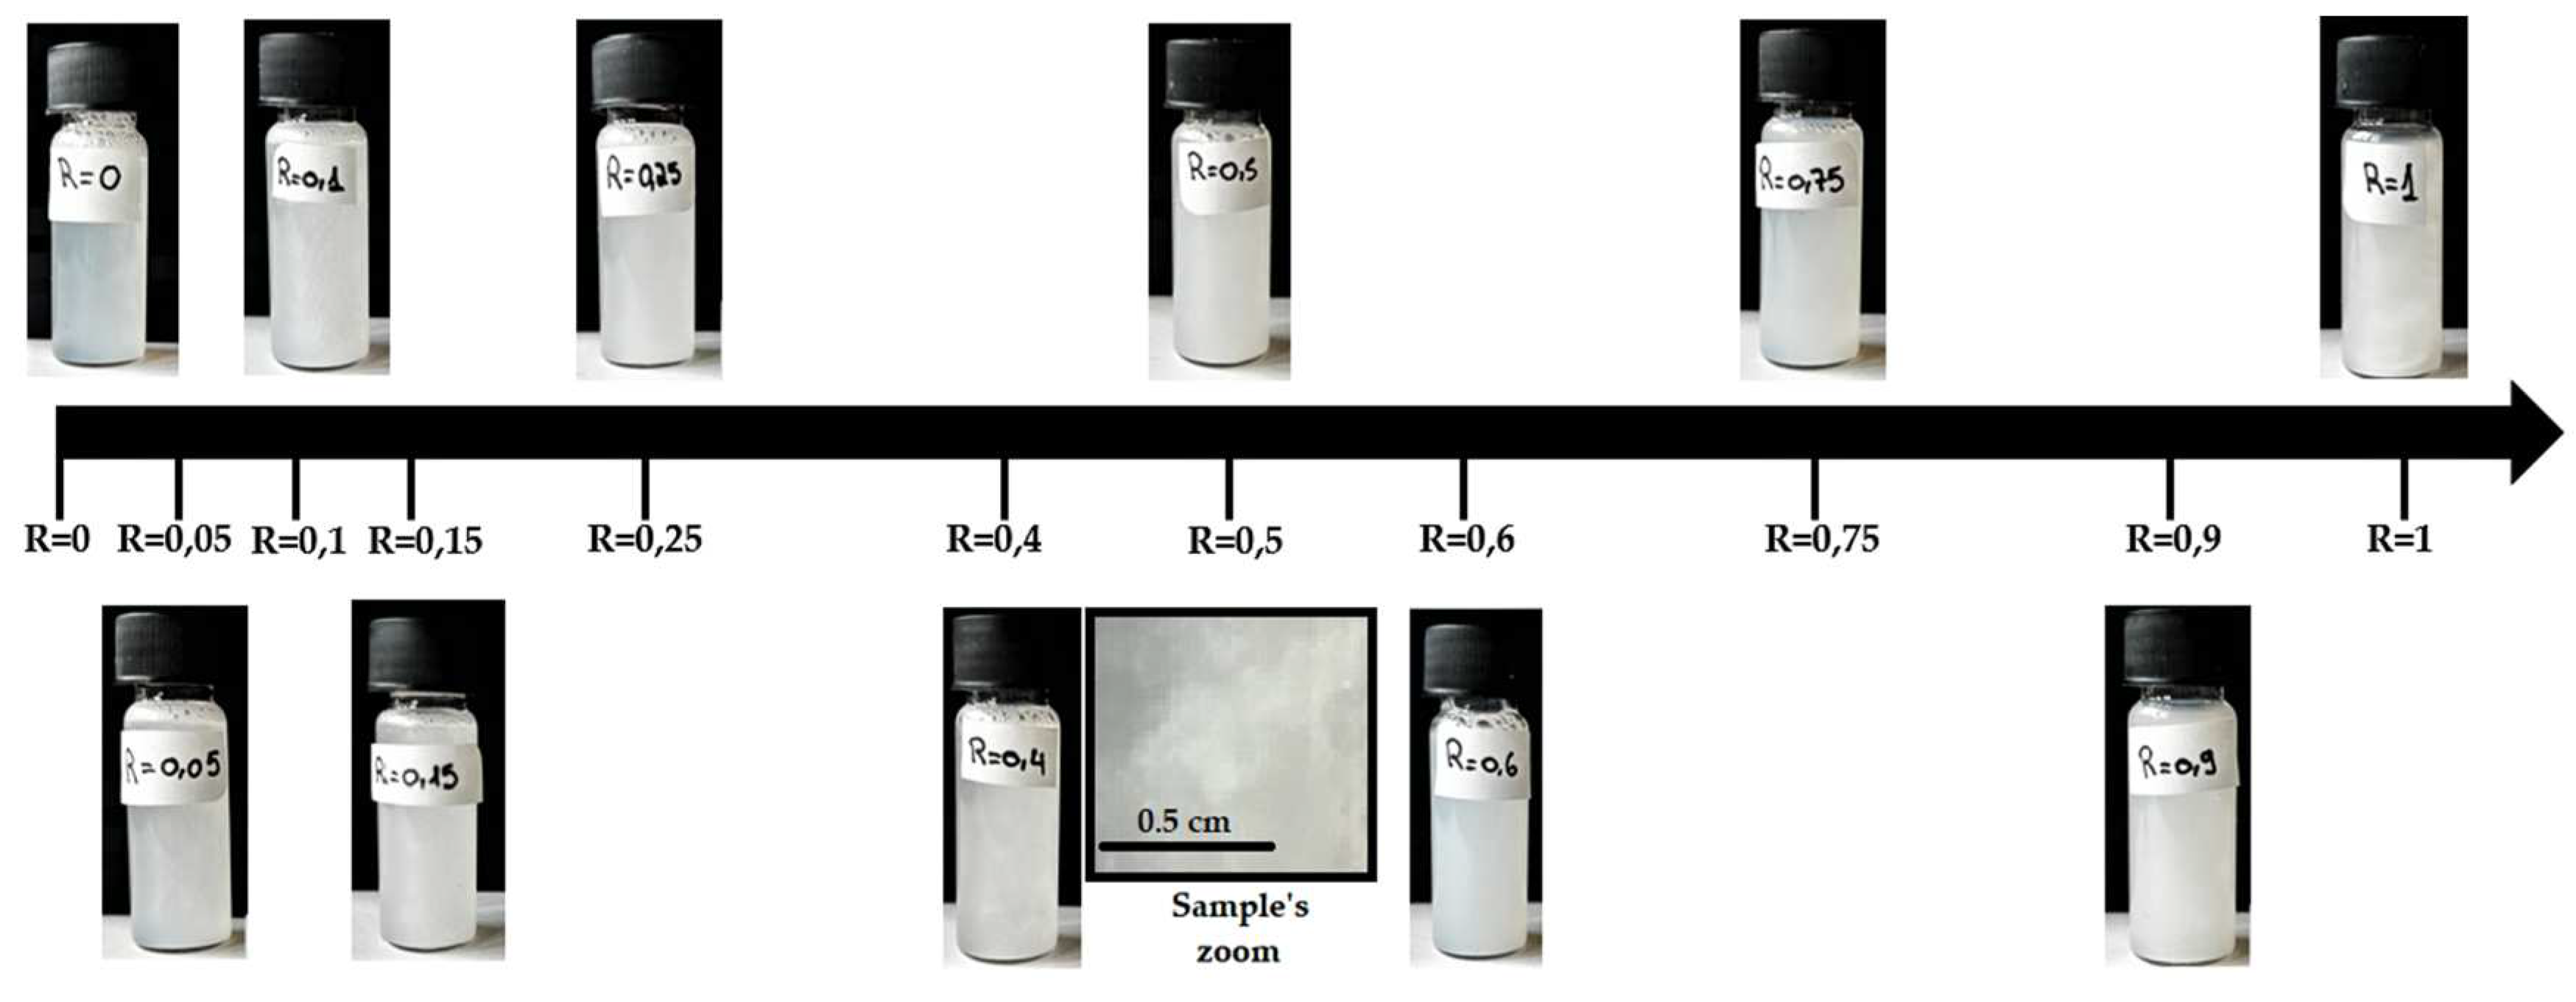
Figure 3.
Confocal microscope images with an ×100 objective obtained for different HSA/SA samples at 2 wt% in presence of Nile red with different ratio from pure SA (R=0) on figure (A) to pure HSA (R=1) on figure (I). Figures (B), (C), (D), (E), (F), (G), (H), correspond respectively to sample with a ratio R equal to 0.2, 0.3, 0.4, 0.5, 0.6, 0.75 and 0.9.
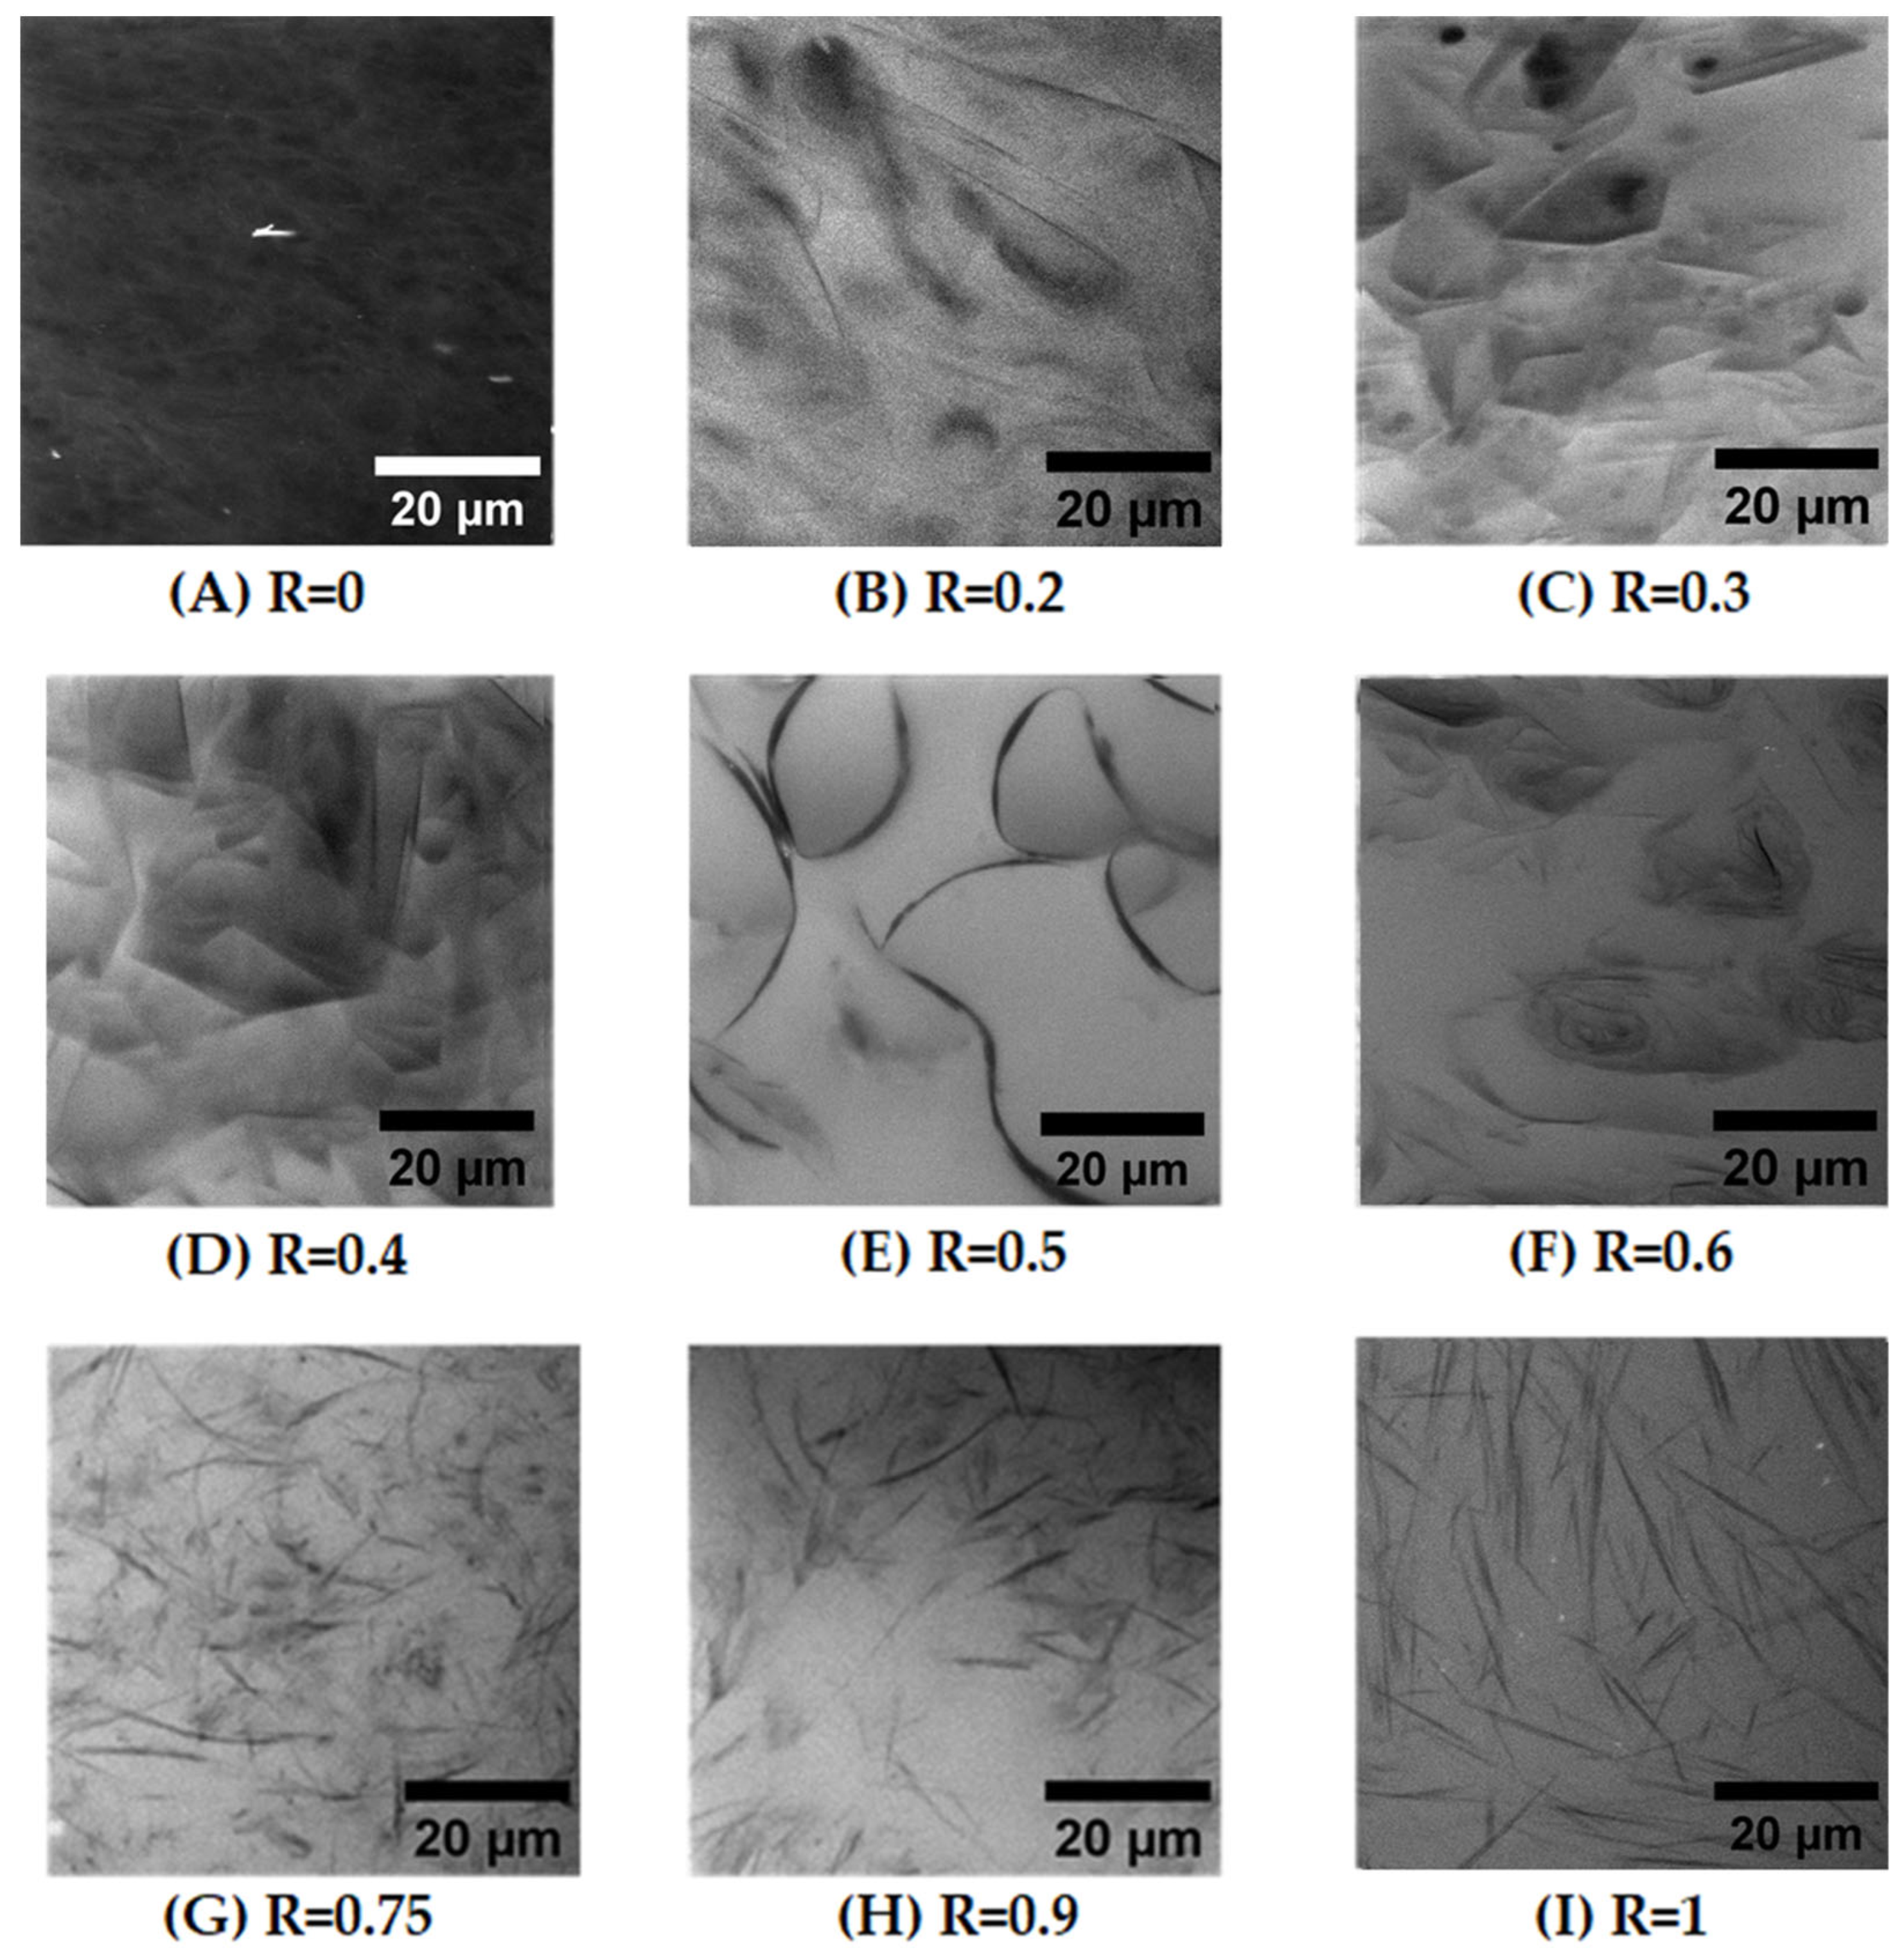
Figure 4.
Cryo-TEM images obtained for different samples ratios from pure HSA (R=1) to pure SA (R=0), and intermediate surfactant concentrations R=0.4 and R=0.1.
Figure 4.
Cryo-TEM images obtained for different samples ratios from pure HSA (R=1) to pure SA (R=0), and intermediate surfactant concentrations R=0.4 and R=0.1.
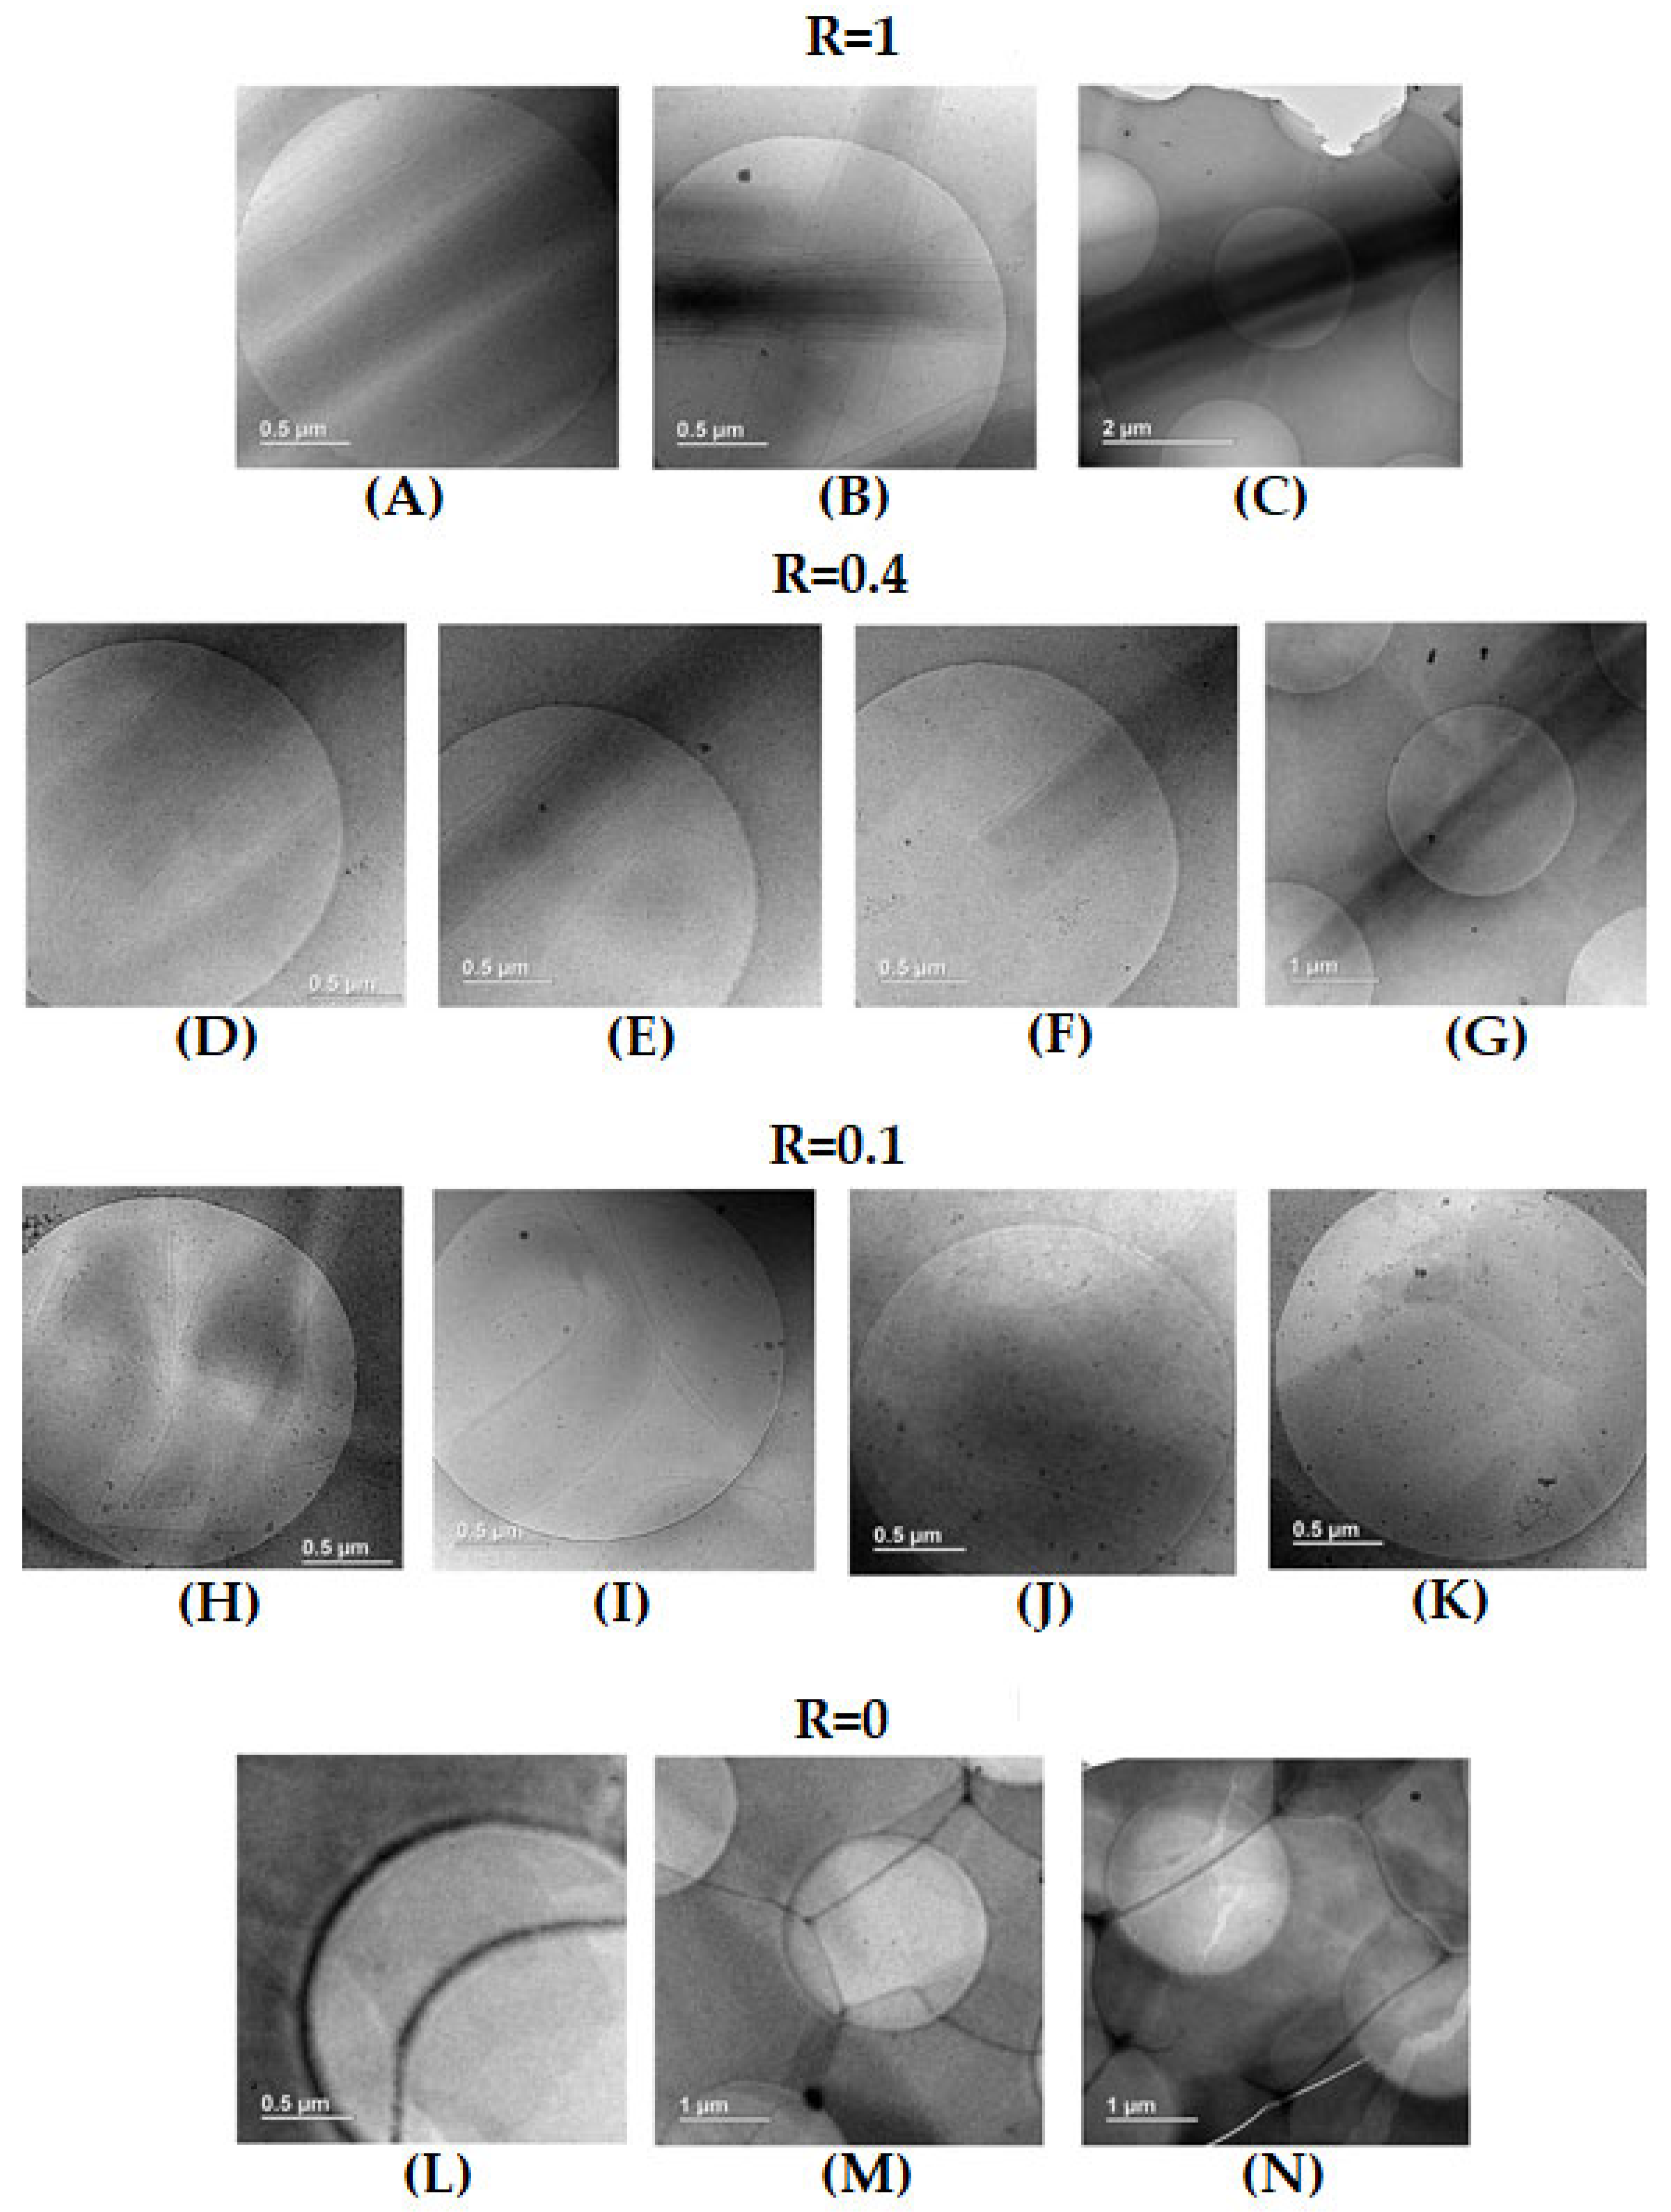
Figure 5.
Right: (A) SANS intensity profiles at 20°C for the different samples in D2O for all HSA/SA ratios, from pure SA (R=0) to pure HSA (R=1). The spectra are successively shifted by a factor 10 in intensity for clarity (data for R=0 in absolute scale). The green lines correspond to the characteristic decays in the low q region. The black and red continuous lines correspond to the best fit of the data (see description of the model in supplementary information). The dotted part of the fitted model for R = 1, R = 0.9 and R = 0.75 correspond to the q-range where there is multiple scattering. The sample at R = 0.4 is not fitted as it is macroscopically heterogeneous (see main text). Left (B), (C) and (D) : Respectively the Caillé parameters, interlamellar distances and lamella thicknesses as a function of R, obtained by SANS data fitting.
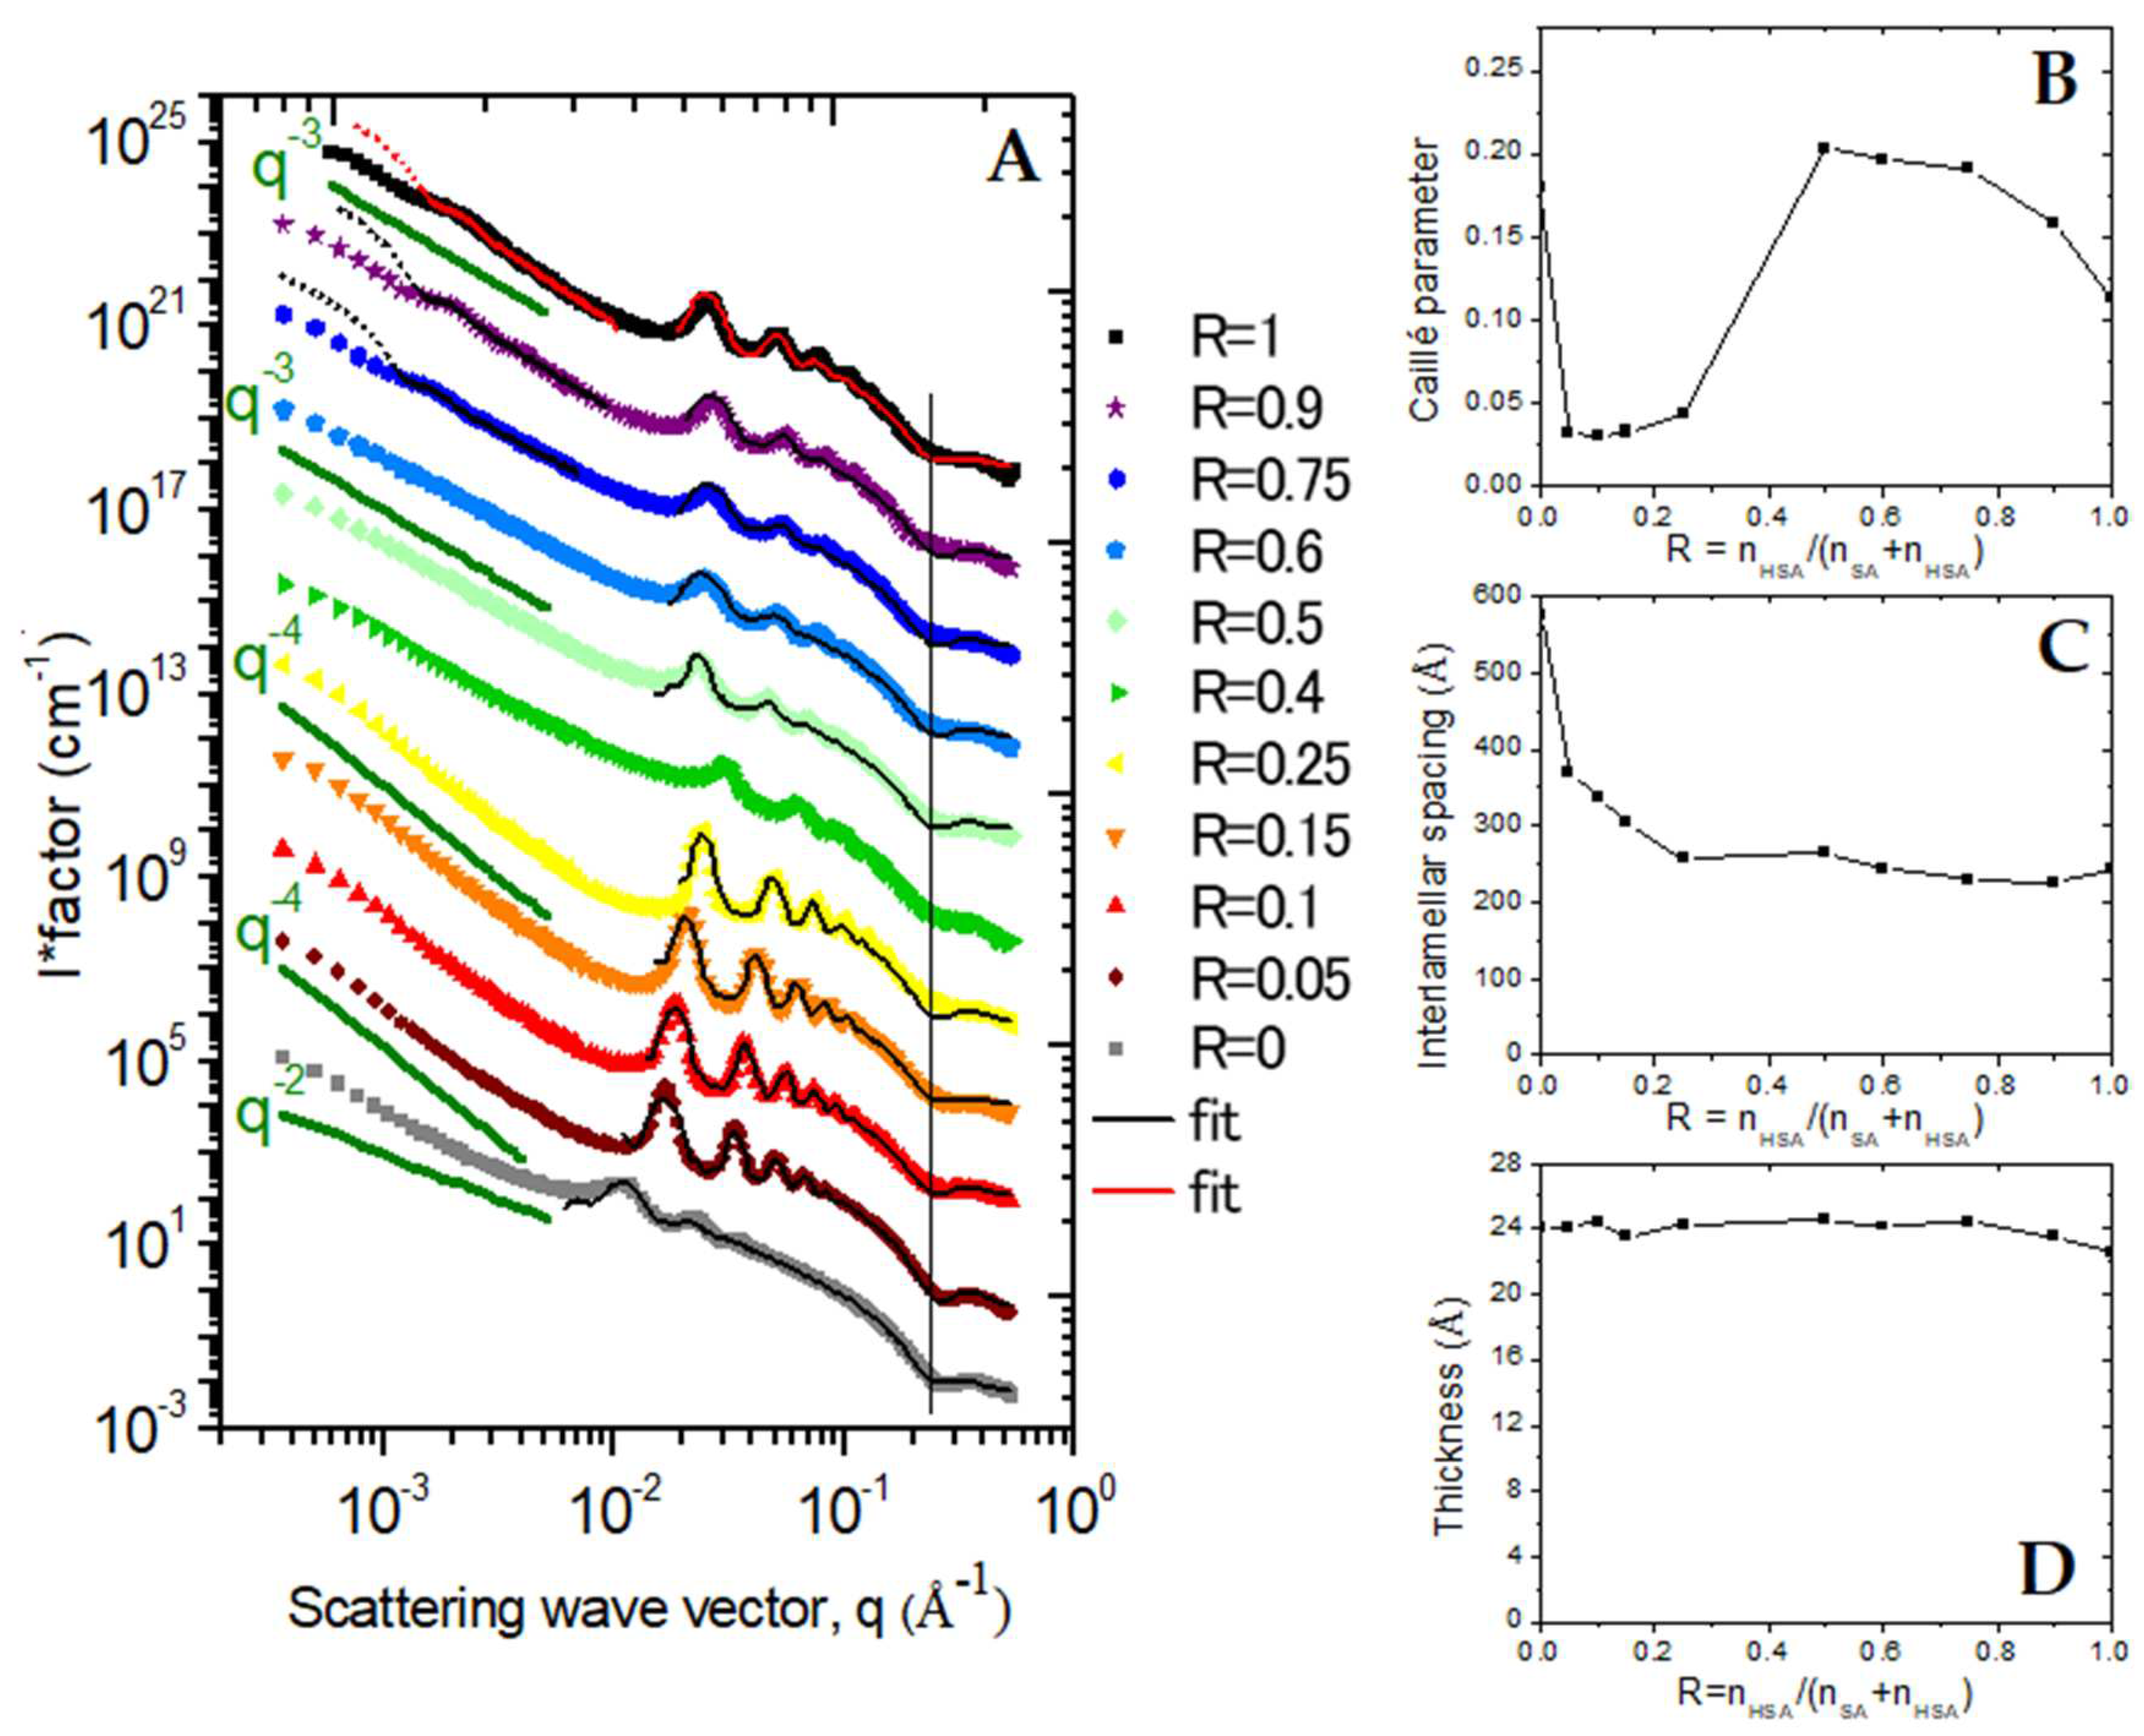
Figure 6.
WAXS diffractograms for the different HSA/SA samples ratio, from pure SA (R=0) to pure HSA (R=1), as well as of a pure 12-HSA sample at a fatty acid/ethanolamine ratio of r = 0.5 for comparison. The spectra were shifted in intensity one from each other by 0.0025 cm- [1] for clarity.
Figure 6.
WAXS diffractograms for the different HSA/SA samples ratio, from pure SA (R=0) to pure HSA (R=1), as well as of a pure 12-HSA sample at a fatty acid/ethanolamine ratio of r = 0.5 for comparison. The spectra were shifted in intensity one from each other by 0.0025 cm- [1] for clarity.
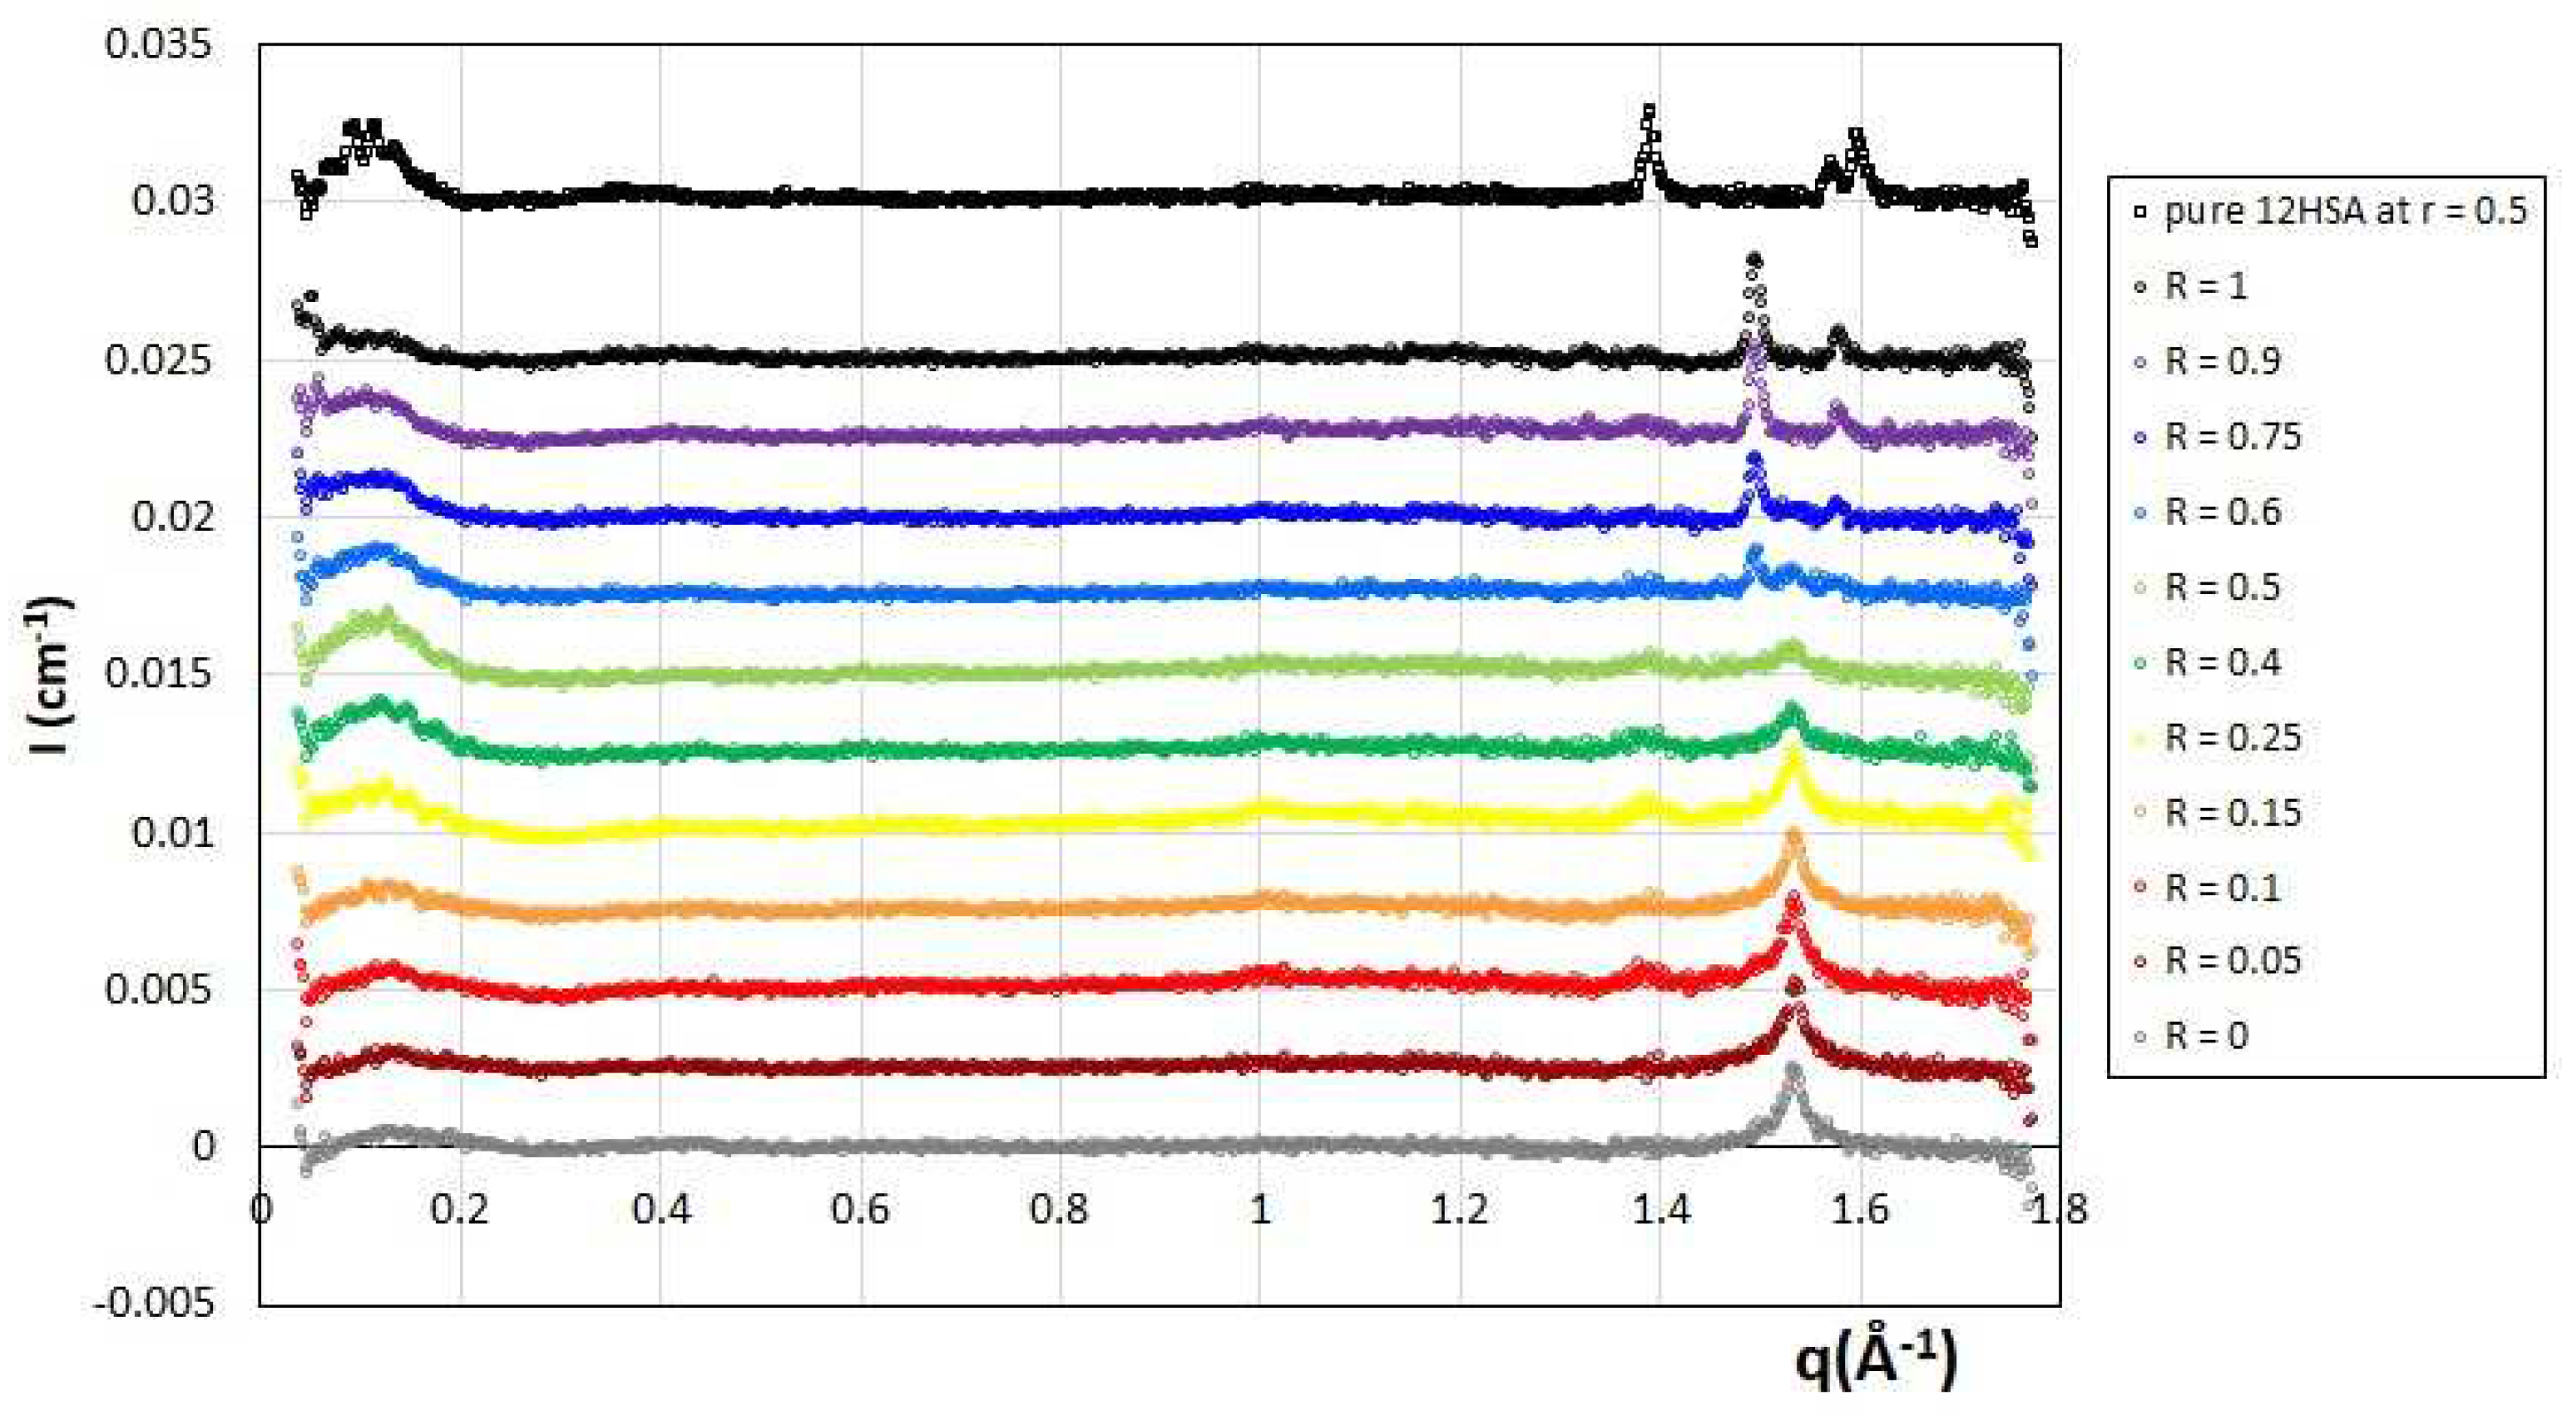
Disclaimer/Publisher’s Note: The statements, opinions and data contained in all publications are solely those of the individual author(s) and contributor(s) and not of MDPI and/or the editor(s). MDPI and/or the editor(s) disclaim responsibility for any injury to people or property resulting from any ideas, methods, instructions or products referred to in the content. |
© 2023 by the authors. Licensee MDPI, Basel, Switzerland. This article is an open access article distributed under the terms and conditions of the Creative Commons Attribution (CC BY) license (http://creativecommons.org/licenses/by/4.0/).
Copyright: This open access article is published under a Creative Commons CC BY 4.0 license, which permit the free download, distribution, and reuse, provided that the author and preprint are cited in any reuse.
supplementary.docx (526.23KB )
Submitted:
24 April 2023
Posted:
25 April 2023
You are already at the latest version
Alerts
A peer-reviewed article of this preprint also exists.
supplementary.docx (526.23KB )
Submitted:
24 April 2023
Posted:
25 April 2023
You are already at the latest version
Alerts
Abstract
We describe the behavior of mixtures of stearic acid (SA) and its hydroxylated counterpart 12-hydroxystearic acid (12-HSA) in aqueous mixtures at room temperature, as function of the 12-HSA/(fatty acid) mole ratio R. The morphologies of the self-assembled aggregates are obtained by a multi-structural approach that combines confocal and cryo-TEM microscopies with Small-Angle Neutron Scattering (SANS) and Wide-Angle X-Rays Scattering (WAXS) measurements, coupled with rheology measurements. Fatty acids are solubilized by an excess of ethanolamine counterions, so that their heads are negatively charged. The behavior is driven by the competition between mixing entropy and enthalpic effects. A clear trend towards partitioning between the two types of fatty acids is observed, presumably driven by the favorable formation of a H-bond network between hydroxyl OH function on the 12th carbon.
For all R, the self-assembled structures are locally lamellar, with bilayers composed of crystallized and strongly interdigitated fatty acids. At high R, multi-lamellar tubes are formed, similarly as for pure aqueous solutions of 12-HSA. The doping by a low amount of SA molecules only slightly modify the dimensions of the tubes (radius and length), and slightly decreases the bilayers rigidity. The solutions have a gel-like behavior originating from entanglements between tubes and show a yield stress. At intermediate R, a partial local partitioning occurs between the two types of fatty acids. The tubes coexist in solution with helical ribbons. The two structures possibly merge to form very long snaky objects with straight and curved parts. The rigidity of the bilayers and the rheological behavior of the solutions are very similar to those of the high R case. At low R, local partitioning also occurs, and the architecture of the self-assemblies associates the two morphologies of the pure fatty acids systems, respectively 2-D planar bilayers for SA and the tubes describe above for the 12-HSA molecules: they are facetted objects with planar domains enriched in SA molecules, capped with curved domains enriched in 12-HSA molecules. The rigidity of the bilayers is strongly increased, as well their storage modulus, compared to systems with larger R. The solutions remain however viscous fluids in this regime of low R.
Keywords:
Subject: Chemistry and Materials Science - Physical Chemistry
1. Introduction
The climatic situation of the planet and the depletion of fossil resources leads to an increase in the need for the use of environmentally friendly molecules. In such a context, fatty acids, i.e. carboxylic acids with an aliphatic chain, are an alternative to oily-based surfactants as green surfactants since they are mostly extracted from plants. They are indeed probably the oldest surfactants used by humans, as their use as soaps is reported since ancient times and have been increasingly used by the industry. [1] The dispersion in aqueous solution of the fatty acids with long chains (C14 to C22) remains however a challenge since they have a high Krafft temperature with conventional metallic alkali counterions. [2] This has driven a huge effort lately to achieve such a dispersion, owing to both : (i) the large availability from biomass of the C14 tetradecanoic acid, C16 hexadecanoic acid C18 and octadecanoic acid, better known from their respective common names myristic acid, palmitic acid and stearic acid (SA, see scheme Figure 1B), and (ii) to the various morphologies they may form once dispersed in water that provide them a huge potential for their use as basic blocks for the design of stimuli-responsive systems such as foams or emulsions. [1,3]
Besides the possibility of a chemical modification from the quite reactive carboxylate group, the main strategy that enables the dispersion in water rely on the addition of a species that is prone to interact with the carboxylate head according to its ionization state, either by hydrogen-bonding when the head is in its COOH form or by electrostatics and ion-pairing interactions when the head is in its COO- form. There are then 2 main routes that were reported, depending on whether this added species is a surfactant itself or not:
The first route is the use of a cationic surfactant, that contains usually an amino head, that allow the formation catanionic self-assemblies, i.e. mixture of cationic and anionic surfactants, upon mixing with fatty acids. Their dispersion originates from the combination of both electrostatic interactions between the fatty acid and the oppositely charged cationic surfactant and hydrogen bonding that give rise to the formation of catanionic surfactant pairs with amphiphilic properties, as explained in the review from Fameau and Zemb. [3] By playing on parameters such as the type of polar group or the ratio between surfactants, it is possible to design aggregate structures with a very broad morphology (mixed micelles, lamellar phases, vesicles, bicontinuous structure), [4,5,6] the most spectacular being obtained with the myristic/cetyltrimethylammonium hydroxide system for which flat nanodiscs of finite size [7] , regular hollow icosahedra [8] or very robust vesicles that resist dialysis [9] s have been reported.
The second route is ion pairing with e g an alkyl-amine that decreases the Krafft temperature, as for instance obtained by simple neutralization of the unsaturated fatty acids from C14 to C22 by tetrabutylammonium hydroxide leading to small micelles. [10] Such a strategy has been successfully tested for a large range of amino counterion/fatty acid systems. [11,12,13,14,15,16,17,18,19,20,21,22] It is worth mentioning that solubilization at low temperature can also be achieved by chaotropic counterions such as K+ or Cs+. [4,10,12,15] The morphologies of the self-assembled aggregates mainly depend on three parameters: (i) the size and hydrophobicity of the counterion; (ii) the state of crystallinity of the alkyl chains and therefore the temperature; and (iii) the degree of ionization of the carboxylated head that depends on pH. [23] Indeed, the self-assemblies that are formed when fatty acids are in their disordered liquid crystal state are more flexible than when they are on their Lβ ordered crystalline phase, which increases their curvature. The melting transition between the two states may thus induce a morphological transition. Interactions between neighboring heads are strongly dependent on their ionization state because there is competition between H-bonding that promote their approach, which is prompted to occur when they are on their protonated COOH form, and electrostatic repulsions when they are on their COO- form, which moves them apart. The overall resulting subtle interplay of interactions tunes the packing parameters of the fatty acids and therefore their morphology. The counterion/fatty acid ratio is then a key parameter since it fixes the pH. Lamellar self-assemblies are obtained when pH is close to the pKa of fatty acids, with a large polymorphism (facetted objects, planar lamellar phases, unilamellar or mutilamellar vesicles [14,15,18,19]) and spherical micelles at pH > pKa. [14,15,18,19,20] However, it has been reported that the use of a chaotropic ion (Cs+ or K+) makes it possible to extend the lamellar domain towards large pH thanks to a strong screening of the COO- heads. [15] Also, a fine tuning of the interactions makes it possible to obtain the packing parameter allowing the formation of vermiform micelles. [16]
The introduction of a hydroxyl function OH onto the alkyl chains provides a huge potential to fatty acids compared to their unsatured non-modified counterpart because it brings 3 functionalities to the molecules: chirality, a second hydrophilic center and the possibility of making H bonds between the secondary OH groups. At the air/water interface, hydroxylated fatty acids, that are sometimes called “bihydrophilic”, show indeed a specific behavior if the OH group is located sufficiently far from the head group (typically from the 7th carbon of the alkyl chain or further). [24,25] At intermediate surface pressure, in-between the condensed liquid phase and the gas phase, they adopt a specific conformation where they lay onto the interface with their two hydrophilic centers in contact with water, which gives rises to a very large plateau in the surface pressure versus surface area isotherm. [24,25,26] At large surface pressure, the molecules are not elongated straightly but rather might present a kink at their second OH group. Moreover, in the condensed phase, the formation of a hydrogen bond network [27] makes the monolayer very elastic since their surface viscosity can reach values that are 3 orders of magnitude larger than that of the gas phase. [26]
Among these hydroxylated fatty acids, 12-hydroxy stearic acid (12-HSA, see scheme Figure 1A) is widely used because it is easily obtained from the hydrogenation of the double bond of rinoleic acid, that makes up 90 % of castor oil extracted from castor beans. [2] Owing to its possibility of making H bonds in an apolar medium, it is in particular very widely used as an organogelator, either in its pure form or in a chemically modified one. [2,28,29,30,31,32,33,34,35] In aqueous solution, the chirality of 12-HSA molecules enables them to make remarkable self-assemblies in presence of alkoxyamines counterions or their derivatives: twisted ribbons [36] or multi-lamellar tubes. [37] These multi-lamellar tubes have a length of about 10 µm, a diameter of 0.6 µm and their core is composed of a few (~3-6) stacked bilayers separated by water and can be obtained from a large set of counterions. [38,39] Their formation likely comes from the rolling of helical ribbons. If there exists a large literature on the formation of single wall tubes based on organic species such as peptides, [40] such architecture of multi-lamellar tubes is by contrast sparsely described and have been obtained recently with complexes of ionic surfactants and cyclodextrins. [41,42,43,44,45]
A unique specificity of the multilamellar tubes of 12-HSA is their ability to swell and deswell over a wide range of temperature resulting in a tunable diameter. [46] At high temperature, they melt into small micelles above a threshold melting temperature [38] that depends on the counterion/12-HSA ratio: [39] in excess of counterions the transition is mostly driven by the melting of the chains whereas at lower content in counterions, for which H-bonding occurs between non-dissociated heads, it comes from both the chain-melting process and the surface-melting process. The formation of the tubes is a robust process as they can be obtained for a large set of physico-chemical conditions (concentrations, molar ratio, pH, ionic strength, addition of ethanol or doping by fatty acids). [11] Entanglements between tubes provide to their aqueous suspensions a hydrogel behavior [2] since their viscosity is larger by 3 to 5 orders of magnitude, depending on swelling, than that of the regime of small micelles at high temperature. [39,47] This opens the way to the design of thermo-responsive systems. For instance, such a large change of viscosity, associated to the strong elasticity of the 12HSA monolayers, has enabled the design of ultra-stable and responsive aqueous foams, [36] with a tunable temperature of destabilization. [49] The loading of tubes by molecules of biomedical interest for drug delivery applications has been demonstrated. [50]
We propose here a new strategy to design self-assemblies of long chains fatty acids in aqueous solutions with various and potentially thermo-responsive behavior. It is based on the formation of binary mixture of a given unsaturated fatty long chains and its hydroxylated counterpart. In this case, the behavior will be driven by specific interactions between both surfactants at the level of the alkyl chains, such as possible formation of hydrogen bonds, and not by the modifications of interactions between the polar heads, as for instance in the case of catanionic systems. To this aim, we choose to work on the stearic acid/12-hydroxystearic acid pair as both fatty acids have been solubilized in past work in the same conditions with ethanolamine counterion, with which they form very different self-assemblies at low temperature: multi-lamellar tubes for 12-HSA [38] and planar lamella and vesicles for the SA/ethanolamine system. [14] Moreover, both systems melt into micelles at high, but different, temperatures. [14,39] We also build on the seminal work of Fameau et al [11] that showed that 12-HSA molecules still form tubes at room temperature upon the introduction of a small amount of SA but turn into ribbons at larger SA content, a behavior that was hypothesized as coming from a local partitioning between the two kinds of fatty acids. The structure of the binary self-assemblies was however poorly described as it was only obtained by phase-contrast microscopy. We will in particular probe the regime of SA doped by a few 12-HSA molecules, never studied in solution to the best of our knowledge. Synergistic effects may be anticipated since the 2D phase diagram of monolayers of mixtures SA/12-HSA has an eutectic point. [51]
We focus on the behavior of the system at room temperature, probing exhaustively its structural and rheological properties over the full range of R (12-HSA/SA mole ratio). The multi-structural approach combines confocal microscopy, SANS, WAXS and CryoTEM measurements and is coupled with rheology measurements.
2. Results
2.1. Macroscopic Aspect
In order to make the mixtures, we chose to use a large excess of ethanolamine counterions so that all fatty acid heads would be ionized. This prompt us to work at r = 0.2, where , for which the tubes/micelles transition for pure HSA solution is ~ 40 °C. [3,39] The overall concentration of fatty acids was fixed at 2 wt% of surfactants in water, as in references [3,11,38,39] on pure solutions of 12-HSA, so mixtures can be compared to these latter. The stock-solutions of HSA and SA were prepared at 70 °C following a protocol previously developed for pure HSA solutions (see materials and methods section). Both HSA and SA solutions were clear at such a large temperature, suggesting the formation of micelles, in agreement with previous articles on SA [14] and HSA; [38,39] they were mixed at 70 °C, a temperature at which the resulting mixtures remained homogeneous and clear. The whole range of ratio R, where R=nHSA/nSA+nHSA, was probed, the R=0 sample being the pure SA and the R=1 sample the pure HSA. For all samples, the pH of the mixtures were constant (pH=10.85 ± 0.15, see Table 1), a value much larger than the pKa of the carboxylate groups (pKa of pure 12-hydroxy stearic acid is 4.75, and around 8 in presence of alkanolamines in excess [2] ).
When cooling down the mixtures to ambient temperature, all samples turn turbid, revealing the formation of objects that are sufficiently large to scatter visible light (Figure 2). At R=0.9 and R=1, the turbidity of samples is more intense, suggesting the formation of larger objects than for other ratios. All samples look homogeneous by naked eye with the exception of R=0.4 and R=0.5 that show some heterogeneities at macroscopic scale with respect to turbidity (see inset of Figure 2 for R=0.4). All the samples have a large apparent viscosity.
2.2. Confocal Microscopy
Confocal microscopy of samples has been performed on the whole range of ratio R using a hydrophobic dye, Nile Red. The Nile Red concentration is negligible with respect to the fatty acid concentration (see Materials and Methods), so that we assume that the morphology of the self-assembled structures is not modified by its introduction. Figure 3 shows some representative images of samples for all R probed with a ×100 objective. On the images, the black domains are enriched in Nile red, and correspond thus to the hydrophobic regions of the self-assembled structures made of the alkyl chains of the fatty acids, whereas white domains do not contain the fluorophores.
Figure 3I shows the image obtained for R=1 (pure HSA) that reveals the presence of disordered thin and rigid rods with a length of around 20 μm. These rods corresponds to the multi-lamellar tubes resulting from the self-assembly of HSA molecules. [39] The organization of these tubes appears disordered, without formation of any nematic order. When R decreases from 1 down to 0.75 upon the introduction of a small amount of SA (Figure 3H,G), the self-assembled structures conserve their rodlike shape. It however appears that the overall length of the rods decreases progressively, with a distribution of lengths that becomes more polydisperse, when R decreases. We did not make a statistical study of this variation of tube length in this regimes of large R because images are transversal cross-sections of a 3D sample.
At R = 0.75, it also appears that a very small amount of curved objects coexist with the long tubes. This trend is confirmed when decreasing R in the regime of intermediate R (R=0.6, R=0.5). Indeed, for R=0.6 (Figure 3F), the rigid thin polydisperse rods now coexist with an important amount of objects with a large curvature. For R=0.5, at stoichiometry, fatty acids self-assemble into bended long tubes that can reach much longer length that the 20 μm obtained at R = 1 and extend up to 60 μm (Figure S1E). These bended tubes appear to be made of two types of domains, with some rigid parts bound to each other by some curved parts. In this regime of intermediate R, the structure of fatty acid self-assemblies evolves thus continuously from bended tubes to rigid ones with R. In their seminal study where they introduced an important amount of SA in aqueous solutions of 12-HSA, Fameau et al. [11] observed by phase contrast microscopy the formation of twisted ribbons that are the precursors of multilamellar tubes. Confocal microscopy does not allow to discriminate between multi-lamellar tubes and ribbons, however we hypothesize that the rigid parts do correspond to the tubes and the bended ones to ribbons.
At low R, where SA is in excess, the structure is completely different and images are less simple to interprete (see Figure 3D, Figure 3C and Figure 3B that correspond respectively to R=0.4, R=0.3 and R=0.2). There are no longer thin black lines in which all Nile red hydrophobic molecules concentrate, as it was for larger R, but 2D domains of variable levels of grey. Most of these domains have straight sides, suggesting the formation of facetted objects, connected to each other by either edges or by curved parts. Some other domains display a more spherical shape. These domains are all made of multi-lamellar bilayers, as demonstrated by SANS as we will show later. They have thus different distributions of thicknesses and orientations, which give rise to this variation of grey level from one domain to another. The fact that the majority of their sides are either straight or circular suggest that they are made of planar lamellar phases connected by spherical lamellar phases, that are possibly pieces of multilamellar tubes. The images also suggest that these domains are strongly entangled. Indeed, when following the temporal evolution of the system during the experiment, it appeared that these domains do not move individually but collectively (data not shown). This collective motion of domains is consistent with the fact that they are either connected to each other and/or strongly entangled.
Finally, for R=0 (pure SA), there are only small fluctuations of the color of the images, with a typical size of fluctuations of the order of a few microns, although SANS experiments shown later will unambiguously demonstrate that this sample contains planar lamellae. Since all lamellar phase domains contain the same amount of fluorophores in average, the only variations of grey level within the images come from orientation of the 2D lamellar domains. The image is thus consistent with a structural organization of planar lamellar phase domains with random orientations that occupy all space, in agreement with literature. [15]
2.3. Cryogenic Transmission Electron Microscopy (Cryo-TEM)
Pictures of samples were obtained by Cryogenic Transmission Electron Microscopy for pure HSA (R = 1), pure SA (R = 0), intermediate content of both kinds of molecules (R = 0.4) and low content of SA (R = 0.1). Samples were left at room temperature (around 20°C) for 24 hours to equilibrate before the freezing step. The final thickness of the frozen cut sample is around 1 micrometer, which is much lower than the length of the tubes of the order of 20 μm observed by confocal microscopy. This forces them to lay onto the grid surface.
For R=1, long straight rectangular objects are visible with a width of ~ 500 nm and a length that is at least 8 μm, as they exceed such a size that corresponds to the image section at the lowest magnification probed, in agreement with the length of 20 μm determined by confocal microscopy (Figure 4A–C). In all of these rectangles, there is a continuous gradient within the grey scale from the outer of the edges of the rectangle that are lighter to the inner of the rectangle that is darker, evidencing a continuous variation of their thickness from outward to inward. Even if the images are 2D, this demonstrates that these rectangular shapes do correspond to cylindrical tubes. There are some parallel dark lines within the tubes parallel to their edges, which originates from the presence of lamellas. Although SANS experiments demonstrate that the inter-lamellar distance is constant (see later), such a distance between lamella does not appear strictly constant on images, but this is an effect of projection from the 3D self-assemblies to the 2D images. Moreover, the dark center of the rectangles tubes does not show any lamella. This is also consistent with the formation of multi-lamellar tubes, as such a dark center corresponds to the top of adsorbed cylinder where lamella are parallel to the surface. Thus the exact estimate of the number of lamella is not possible from these cryo-TEM images, yet they reveal that there are at least 5 or 6 lamella per tube. Since the tubes lay onto the surface, there are no images of the section of the tubes, but they would resemble to onions. Similar pictures have been obtained by cryo-TEM on multi-lamellar tubes of SDS@2β-CD. [42] In summary, these cryo-TEM images are fully consistent with the structure proposed in literature for HSA self-assemblies as long rigid multi-lamellar tubes. They also evidence that the radius of these tubes are rather monodisperse, since their width is fairly constant from one tube to another. But the more interesting feature concerns their ends, which are open and not capped, as it is unambiguously visible in some pictures (Figure 4B). This was not established yet in literature.
For pure SA (R=0), while turbidity and SANS (see later) unambiguously demonstrate that large lamellar self-assembled aggregates do exist in solution, they are not visible at first sight on the grid. There are areas domains, with various size, that are more or less dark separated by straight edges that must correspond to steps between domains of different thicknesses (Figure 4L,M). Such areas come from the coverage of the surface by surfactants molecules, as proven by the presence of cracks, that are depleted in molecules since their light grey level corresponds to the pure grid, as shown in Figure 4N. It is likely that planar lamellar phases with a variable number of lamellae, but probably low, are deposited on the surface and lay parallel to it. The images are thus a top view of such lamella and the steps correspond to a change of lamellas number from one domain to another. The darker the area, the larger the number of lamella. Similar pictures have been also obtained by cryo-TEM on Lα lamellar phase on fatty acids in excess of alkali. [15]
For R = 0.4, there are also long rigid multi-lamellar tubes with open ends, as for the R= 1 case with the same order of magnitude of radius (Figure 4D–F) and a length that still exceeds 10 microns (Figure 4G). However, compared to such R = 1 case, the number of lamella seems to be slightly reduced in average, and varies more largely from one tube to another. It also appears that parts of the tubes are slightly curved. This is in line with what was observed by confocal microscopy at R = 0.5 with long 1D objects with rigid and soft domains. This suggests that part of the objects evidenced by cryo-TEM are twisted ribbons and not multilamellar tubes, although the cryo-TEM images do not allow to arbitrate between both structures as they give the same image due to projection. The curved parts would come from the lowest rigidity of the ribbons.
For R = 0.1, there are no longer multi-lamellar tubes but the images still reveal the existence of lamellar structures with different morphologies and various number of lamella. The most striking feature concern the curvature of these lamellar, as they appear either straight, that may account for planar lamella or pieces of large tubes, or spherical, suggesting truncated onion vesicles (Figure 4H,J). Such straight and spherical lamella eventually merge to form a single multi-lamellar objects (Figure 4I). Regarding the number of lamella, it is ranging from a single lamella up to a few ones with the same order of magnitude as the tubes at R = 1. Also, part of images show the dark areas and steps, revealing the presence of planar lamellas sitting onto the surface, as for the R = 0 case (Figure 4K). The samples are thus composed of different kinds of self-assemblies that partially fuse with different curvatures. It is thus likely that these different kinds of self-assembled aggregates do not all contain the same amount of SA and HSA molecules, i.e. there exists a partitioning between the two surfactants at the local scale.
2.4. Structure at Local Scale by SANS
The structure of self-assembled surfactants was determined by SANS in the whole range of R (Figure 5A). SANS probes a range of distances from ca. 10 Å to 1 µm in solution, with no artifact from deposition on a 2D surface, and no addition of an extra probe; it does require to work in heavy water D2O to create a contrast with the hydrogen-rich molecules and to decrease the large incoherent scattering of [1] H, that acts as a constant background for SANS. Data are presented as intensity versus q, the magnitude of the wavevector, expressed in reciprocal length scale. In a first approximation, intensity-features at a given q-value can be associated to characteristic dimensions d based on the Bragg relation d~2π/q.
The SANS scattering spectra of the pure SA sample (R = 0) display all the characteristic features of a 2-D lamellar phase : (i) a q- [2] scattering decay in the low q region, typical from the scattering of a 2-D object and that accounts for the planar shape of lamella, (ii) a strong correlation peak at q0 = 0.0109 Å- [1] followed by its harmonics at n·q0 (n=2, 3, 4…) that accounts for the Bragg peak associated with the interlamellar distance dinter whose order of magnitude is ~ 575 Å (2π/q0) and (iii) a so-called form factor oscillation at around 0.25 Å- [1] originating from the cross-section of the lamellae and enabling to determine its thickness at ~25 Å (2π/0.25). Such scattering spectra unambiguously demonstrate that the sample is made of lamellar phase in agreement with previous results from [14] that deduce the formation of a lamellar phase by birefringence measurements, even if they are not visible on the cryo-TEM pictures.
The pure HSA system (R = 1) also displays the characteristics features of lamellar phases at intermediate and large q, (i.e. a correlation peak followed by its harmonics, oscillation at large q). It however immediately appear that interlamellar thickness is strongly reduced compared to the pure SA case and interactions between lamella are different from the pure SA case since q0_R=1 is strongly shifted towards low q with respect to q0_R=0 at ~ 0.025 Å- [1] (dinter = 240 Å). The correlation peak is narrower, its harmonic being visible up to 6th order, indicating a more regular periodicity, i.e. bilayers fluctuate less in the R = 1 case and/or comprise more stacked bilayers in tube wall than those forming the SA lamellar phase. The thickness of the lamella is similar to that of the pure SA case since the form factor oscillation is also at 0.25 Å- [1] . The main difference to the SA case appears in the low q region where the overall scattering decays overall like q- [3] and no longer as q- [2] , and shows a well-defined marked oscillation at 1.2 10- [3] Å- [1] , that comes from the form factor of tube diameter. The highlighting of such an oscillation was made possible by the extended low q range of the D11 diffractometer and was not yet reported on the scattering curves of the same system in literature as they were all limited to a reduced q-range. The overall q- [3] decay has however already been obtained on the scattering of hollow tubes and multi-lamellar tubes on other systems. [42,43,45,52] Assuming that tubes are rigid, such q- [3] can be explained by a decoupling approximation from a tube in its length (∝ 1/q) by its 2-D discotic section (∝ 1/q [2] ). In the case of an imogolite hollow tube, Paineau et al [52] , proposed to fit the scattering form factor by , where Δρ is the difference in scattering density between the tubes and the solvent, Rext and Rint being respectively the external and internal diameters of the hollow tubes, and F the Fourier transform of the projection or a full cylinder of radius R along its axis , with J1 the first-order cylindrical Bessel function. The extension to orientationally averaged multilamellar tubes was proposed in reference [45] for the fitting of scattering of multilamellar tubes made of SDS@2Β-CD complexes. It is here difficult to fit by such a model because the number of lamella is unknown. We have then fitted the low q part of the scattering spectra with a model of hollow tube with a single bilayer of fatty acids which allows to fit the minima and to recover the q- [3] decay (Figure 5a). The tube radius Rtube was estimated at 200 nm. Such model however overestimates the intensity in the very low q part of the spectra with respect to the experimental data. This is due to the high scattering intensity in this very low q region at ~ 10 [6] - 10 [7] cm- [1] resulting in multiple scattering events that lower in practice the experimental measured pattern from its true value.
For the other R probed, the SANS scattering evidence the formation of lamellar phases in every case, yet several regimes can be clear-cut evidenced.
In the regime of low content of SA molecules for which rigid tubes were observed in confocal microscopy (1 > R ≥ 0.75), the scattering spectra are very similar to those of the pure HSA system at R = 1. The oscillation arising from the form factor of the tube radius and an overall q- [3] scattering decay at low q, the correlation peak of the interlamellar phase and its harmonics are around at the same positions and their amplitudes and width have the same order of magnitude. The mixture of molecules self-associate thus into multi-lamellar tubes that have a very similar structure as for the pure HSA system, revealing that these tubes can accommodate a significant amount in SA molecules. These SA molecules insert themselves within the HSA self-assemblies without disturbing the structure of the tubes. The tube radius increases slightly with respect to the R = 1 case at 210 nm for R=0.9 and 250 nm for R=0.75.
At intermediate R, for R = 0.6 and R = 0.5, all of the scattering features of multilamellar tubes are recovered, except for the low q oscillation of the tube form factor that is no longer present, the scattering decaying like q- [3] over the whole probed low q-range. It this thus likely that the distribution of the outer diameters of the tubes become very broad, which leads to the disappearance of the oscillation. This likely comes from the fact that the self-assemblies are made of both multi-lamellar tubes and twisted ribbons, the respective rigid and soft domains of the tubes observed by confocal and cryo-TEM microscopies, in agreement with reference [11]. Even if the interlamellar distance is well defined, it is also possible that both rigid and curved domains do not contain the same amount of lamella, as it depends on the degree of rolling of the lamella into the ribbons.
At R = 0.4, the behavior is different. Although the scattering features are similar to those of the intermediate R case, the correlation peak and harmonics are strongly attenuated and shifted towards larger q, which evidences that interactions between lamella within tubes are largely different for such R. It has however to be kept in mind that samples partially phase separate at the macroscopic scale for such R and that the two phases are present in the measurement cuvette, since it has been filled from an homogenous solution at 70°C that has been cooled down. Given that the neutron beam illuminates both phases (with a beam cross-section near 1 cm- [2] ), it is thus difficult to go deeper in the SANS analysis for such a sample.
For R ≤ 0.25, at large content in SA molecules, the scattering curves markedly differ from the other cases. First, the correlation peak and its harmonics are much narrower than in the other cases, evidencing either stronger repulsions between lamella leading to a more regular periodicity, or a larger number of lamella per stack. Second, the scattering decays like q- [4] in the low q regime and no longer like q- [3] , even if cryo-TEM images show that there are still tubes in sample. This is the regime where confocal microscopy shows facetted objects and cryo-TEM straight rigid lamella and spherically curved lamella joint to each other. Neutrons interact thus with surfaces of very different orientations within the typical scale of the coherence length of neutrons (a few micrometers), which enables to recover the q- [4] Porod law. We postulate that in this regime where SA molecules are in excess, there is a partitioning between the two types of surfactants within the self-assemblies with 2-D lamellar phases of SA that are capped by partial pieces of vesicles (unilamellar or multilamellar) made of HSA molecules.
These first qualitative descriptions pointed out that there is a large evolution of the broadening of correlation peaks as a function of R. This may come either because bilayers fluctuate with different amplitudes or because the amount of stacked bilayers in the tube walls/lamellar phase changes. In order to get a refined quantitative description, all scattering curves in the intermediate and large q-region were fitted by a model proposed by Nallet et al [53] that considers a form factor of the lamella and a structure factor between lamella; both the number of stacked bilayers Nlam and the Caillé parameter (η) were adjusted accounting for the thermal fluctuations of the bilayers. Such a model allows us to determine the structural parameters of lamella (thickness, d-spacing dinter, rigidity from the Caillé parameter). η is essentially determined from the region of the spectrum where the Bragg peaks arise at intermediate q and the thickness of the lamella from the oscillation at large q, which enables us to decouple these parameters rather confidently in the fitting process. It is however difficult to decouple unambiguously Nlam from the Caillé parameter since both parameters play on the Bragg peaks amplitudes. We have thus varied both parameters when minimizing χ [2] during the fitting procedure, with a range of Nlam varying from 3 to 8. This maximal tested Nlam was chosen from geometrical constrains, given that Nlam times the interlamellar spacing dinter cannot exceed the tube radius. Values of Nlam corresponding to the best fits are recalled in the Table S1. For samples at large R, Nlam has a value of 3 or 4, in agreement with cryo-TEM images and previous data reported in literature of 4 stacked bilayers for pure HSA system [37] , and reached a maximal value of 7 at low R.
This model is able to fit satisfactorily all the data for which multi-lamellar objects were formed at 20 °C for all R (see Figure 5A). The low q part of the curves was not fitted as it displays different behavior from one sample to another (q- [2] versus q- [3] versus q- [4] ), that comes from either planar objects, tubes or ribbons, and facetted objects. These different behaviors at low q are highlighted in Figure S1 in Supplementary Materials that show the experimental data with a I(q)qα versus q representation, with α = 2, α = 3 and α = 4 respectively ). In case of tubes that have a monodisperse radius, the radius was obtained from the fit of the low q part by a model of hollow tube, as explained before. The quantitative values obtained for such fits for dinter, η, and the bilayer thickness as a function of R are shown in Table 1 in supplementary materials.
The bilayer thickness has an almost constant value of ~ 24 Å in all cases – the slight differences from one sample to another being within fit precision – which is slightly larger than the chain length of the fatty acids (21 Å), [38] which is similar whether there are HSA or SA molecules. Such a low value of the bilayer thickness evidences that fatty acid chains are thus strongly interdigitated.
dinter is much larger for pure SA (dinter = 575 Å at R = 0) than for pure HSA (dinter = 240 Å at R = 1) and varies almost continuously with R between these two values with two clear-cut regimes: (i) at large R (> 0.5), in the regime where multilamellar tubes are formed, this interlamellar distance varies only very slightly from one R to another, (ii) while at lower R, it decreases continuously with R with a linear decrease in the regime of low R where partitioning between two types of fatty acids occurs (0.1 ≤ R ≤ 0.25). In this last regime of low R, one may hypothesize that this experimentally obtained dinter is just an effective interlamellar spacing resulting from the linear combination of pure planar lamellar spacing of large dinter and pieces of multilamellar tubes of low dinter. Such coexistence of zones of very different dinter is however very unlikely because it would have led to the broadening of the peak, and the reverse is observed, up to the appearance of two separate correlation peaks. Moreover, the objects depicted in cryo-TEM and confocal microscopy appear continuous. Finally, dinter is much smaller than for the other samples at R = 0.4, but there are uncertainties on the measurement for such a sample, as noted here before.
The evolution of η is shown on Figure 5B. The bilayers are as much rigid as the Caillé parameter is low. For such a parameter, we refrain ourselves to discuss too deeply some slight differences from one sample to another as since Nlam and η are coupled parameters during fitting, which gives an intrinsic uncertainty of the quantitative fitted values of η. To assess if such quantitative values were strongly influenced by Nlam, we have also fitted all scattering curves of Figure with a fixed number of Nlam that was equal to 4. It appears that the values of η obtained in this latter case are always very close to those obtained when Nlam is a floating parameter during fitting (see Table S1 in Supplementary Materials). The large variations of η evidenced in Figure 5B are thus representative of variations in the rigidity of layers. It appears that the partial doping of HSA multilamellar tubes by SA induces a progressive decrease of rigidity of the bilayer since η progressively increases from 0.11 at R = 1 to η = 0.18 at R = 0.75 when introducing progressively a small amount of HSA molecules. It keeps then such constant value of ~ 0.18 at intermediate R, which is also the rigidity obtained for pure SA lamellar phases at R = 0. Surprisingly, in the regime of low R (0.1 ≤ R ≤ 0.25), the bilayers are much more rigid since the value of the Caillé parameter is around 5 times smaller, with an almost constant value of 0.03.
2.5. Wide Angle X-ray Scattering
WAXS measurements were performed to determine if the fatty acids chains within the bilayers are fluid or in a gelled state for the whole range of HSA/SA mixtures (Figure 6), as well as for a reference sample of pure 12-HSA molecules at r = 0.5. Indeed, the value of the bilayer thickness of 24 Å we obtained by SANS is exactly similar to that obtained in references [3,39] in the case of pure 12-HSA at the r = 0.2 we consider here , i.e. in excess of counterions. Such state does not correspond to the Lβ gel one, for which the bilayer has a much larger value of around 42 Å, exactly twice the fatty acids length, as obtained when ethanolamine and 12-HSA are at equimolarity for r = 0.5. [38] Besides, when counterions are in excess, it has also been shown by coupled DSC and structural measurements that the multi-lamellar tubes/micelles transition matches the fluid/gel transition of the chains in case of 12-HSA. [3,39] Thus, we hypothesize that fatty chains are in a crystalline gel state in pure 12-HSA system at every r, but with very different crystalline structures whether ethanolamine and 12-HSA are at equimolarity or with an excess of ethanolamine, with a strong interdigitation of the fatty acids chains within the gelled bilayer in this later case. All spectra show some Bragg diffraction peaks at large q, demonstrating that the fatty acids are in a crystalline gel state in all cases; the main correlation peak of the lamellar phase and its harmonics, already evidenced by SANS, are also visible at low q. For the pure suspensions of 12-HSA molecules, the crystalline structure of the bilayer at r = 0.2 (R = 0) is strikingly different from the likely Lβ gel phase reference at r = 0.5, confirming our hypothesis that the 12-HSA/ethanolamine ratio tunes the crystalline structure. The r = 0.2 solution shows indeed an intense peak at 1.495 Å- [1] and a less marked one at 1.58 Å- [1] within the q-window we probed, while the r = 0.5 shows an intense peak at 1.391 Å- [1] and two others of lower intensity at 1.572 Å- [1] and 1.597 Å- [1] . The pure SA system (R = 0) has another crystalline structure with a single rather broad Bragg peak at 1.53 Å- [1] .
The mixtures show four distinct behaviors. In large excess of 12-HSA molecules (R ≥ 0.75), the suspension displays the same Bragg peaks as for the R = 1 case. Hence the introduction of a small content of doping SA molecules does not prevent the system to crystallize within the structure of the pure 12- HSA solution that is recovered. The amplitude of the peaks however decreases upon an increase of SA content, suggesting that the size of the crystalline domains reduces. Symmetrically, with a large excess of SA molecules (R = 0.05), the influence of the introduction as a small amount of 12-HSA doping molecules is minute since the structure is similar as that of pure HSA. In excess of SA fatty acids (0.1 ≤ R ≤ 0.5), the main crystalline structure is the one of the pure SA sample: the Bragg peak of SA remains and those of the 12-HSA crystalline structure at r = 0.2 are lacking. The intensity of such SA Bragg peak decreases upon an increase of R, showing the progressive decrease of the size of the crystalline phase in lamellar domains of SA molecules. At the same time, a peak of low intensity appears at ~ 1.39 Å- [1] whose amplitude increases concomitantly with the decrease of the SA main broad peak upon increasing R. At R = 0.5, both peaks have almost the same intensity. The origin of this new Bragg peak likely comes from the formation of crystals domains that contain the HSA molecules and coexist with domains of pure SA molecules. Such a local phase separation between small domains that would have variable HSA/SA ratios is consistent with the confocal microscopy and cryo-TEM experiments. The structure of the new crystalline phase that contain the HSA molecules is difficult to assess, but it likely contains some SA molecules embedded in HSA ones since some of the Bragg peaks obtained for pure solutions of 12-HSA are lacking on the diffractogram, whether for r = 0.2 or r = 0.5. Finally, at R = 0.6, the spectra can be viewed as a linear combination of the spectra of both pure systems of 12-HSA at r = 0.2 and SA, because it shows nicely all the Bragg peaks associated to their respective crystalline structures, while the Bragg peak of low intensity arising at lower R at 1.39 Å- [1] is not any longer present. Moreover, the intensities of the main peaks of both structures are similar. This suggests the coexistence of similarly sized local domains of either pure 12-HSA or pure SA.
In summary, the crystalline structure of the gelled bilayers shifts continuously from the pure SA one to the pure HSA one upon the progressive introduction of HSA molecules, with a partial demixion between two types of molecule at intermediate R.
2.6. Rheology
Rheology was used to correlate the variety of structures observed as a function of R with their mechanical properties. Shear-stress-amplitude sweep measurements were carried out at a frequency of 1 Hz for each ratio R from 0 to 1. All results are reported on Figure S2. Those measurements allow for the determination of the storage G’ and loss G’’ modulus of the samples which respectively represent the solid/elastic and viscous component of the samples mechanical response. Hereafter we focus on the properties in the viscoelastic linear domain (Figure S2a,b).
Figure 7A displays the evolution of the elastic modulus G0’and viscous modulus G0’’ determined for the linear domain as a function of R. The loss factor tan δ is shown as an inset for the sake of clarity. Three domains of R with distinctive behaviors can be distinguished, and correlates well with the main structures of self-assemblies of the mixtures.
Figure 1.
(A) Plateau value of the Storage G0’ and Loss G0’’ modulus measured at 1 Hz for the different samples ratio from pure SA (R=0) to pure HSA (R=1) at 20 °C (Loss Factor in inset) (B) Shear stress as a function of the strain amplitude at a constant frequency of 1 Hz for selected samples (R=0.4; 0.6 and 1). Asymptotic curves (dashed lines) depict the elastic regime followed by the solution yielding. The associated yield stress is shown in the inset for R ranging from 0.4 to 1).
Figure 1.
(A) Plateau value of the Storage G0’ and Loss G0’’ modulus measured at 1 Hz for the different samples ratio from pure SA (R=0) to pure HSA (R=1) at 20 °C (Loss Factor in inset) (B) Shear stress as a function of the strain amplitude at a constant frequency of 1 Hz for selected samples (R=0.4; 0.6 and 1). Asymptotic curves (dashed lines) depict the elastic regime followed by the solution yielding. The associated yield stress is shown in the inset for R ranging from 0.4 to 1).
Figure 2.
Schemes of the structures of the self-assembled aggregates as function of R from pure SA (R=0) to pure HSA (R=1) at 20°C. The SA molecules are shown in orange and the 12-HSA molecules in red. The scale is not kept constant from one structure to another. The dashed part of diagram correspond to the range of R where several structures coexist in solution.
For R=1, the elastic modulus G’0 of the pure HSA sample is significantly higher than the loss modulus and the loss factor tan δ = G’’/G’ is low (<<1). Furthermore, two asymptotic behaviors can be identified for the stress τ as function of strain γ. At low γ, τ varies linearly with γ, and then as γα , with α<1, once a critical stress τy is reached. τy is determined from the crossing point of the two asymptotic curves, as exemplified on Figure 7B for R=0.6. Those results indicate that, at 1 Hz, a pure 12-HSA sample at 2 wt% is an elastic gel at low stress and start to flow at large strain as we can observe in Figure S2a. Similar behavior was reported for the same system when multi-lamellar tubes, but with another ethanolamine/HSA ratio of r = 0.5, in reference [47] .
For R ≥ 0.75, the introduction of a few amount SA molecules in tubes causes a decrease of G’0 compared to the R = 1 samples while G’’0 stays unchanged. The loss factor increases thus accordingly but stays strictly inferior to 1 which indicates a gel-like behavior. As for R = 1, the samples display the features of yield stress gels, with a linear variation of τ(γ) at low γ, but the yield stress τy decreases. This evolution is consistent with the shortening of the multilamellar tubes when decreasing R evidenced with confocal microscopy. Given that the amount of fatty acids in solution is kept constant, the decrease of the length of multilamellar tubes decreases in turn the number of tubes entanglements and thereby G’0.
From 0.6 ≥ R ≥ 0.4, G’0 and G’’0 are almost constant, with G’0 slightly larger than G’’0. The samples are then also in a gel state in this regime of R, which is confirmed by the loss factor value that remains below 1. Similarly as for the regime at large R, samples display the features of yield stress gels, with a linear variation of τ(γ) at low γ. A decrease of R leads to both an increase of tan δ, i.e. a less solid-like behavior, and an increase of τy. This specific behavior arises from the fact that part of the rigid tubes turn into more flexible ribbons that bind the tubes to form longer objects, as observed in confocal microscopy. The self-assembled objects are then more flexible than at larger R but their overall length creates more entanglements.
Finally, in the regime of low content of SA (from 0.25 ≥ R ≥ 0), the behavior is completely different. Samples are no longer gels but viscous fluid since G’’ is larger than G’, the loss factor consequently rising above 1 (inset on Figure 7a). They have however G’0 values that are much larger than in the regime at larger R where tubes are formed, with values that can reach 20 times those obtained for R≥0.4 for some ratios (R= 0.15, R= 0.2 and R= 0.25), the maximum being at R = 0.25. This may come from the increased rigidity of the bilayers in this regime evidenced by SANS. In this regime, planar bilayers are formed, whether they are pure 2-D lamella at R = 0 or facetted objects where planar part are bound by curved parts at other R. These objects can entangle and organize themselves at mesoscopic scale in large domains that can move collectively (as observed by confocal microscopy) and slide one on the top of the other. Such a slippage would then explain the viscous fluid behavior of the solution.
For all samples, oscillatory measurements were completed with a frequency sweep between 0.05 and 5 Hz, with a constant strain of 0.1 %. They all display a shear thinning behavior (see Supplementary Materials). This is consistent with the yield stress fluid aspect in the case of gels. For the fluid viscous samples made of planar lamella, this may come from an induced transition into Multi Lamellar Vesicles under shear. The monitoring of the moduli did not enable us to determinate any relaxation time in the explored frequency range.
In summary, the mechanical properties of the samples display two main behaviors: at low content in SA, the samples are viscous fluids, with large G’0, and turn into gels at higher R of lower G’0, with a transition located between R = 0.25 and R = 0.4.
3. Discussion: Formation of the Different Aggregates Morphologies
The combination of the structural experiments carried out at 20 °C at all relevant scales of the system enable us to build the state diagram of the system as function of R at this temperature. The main structures are schematized in Figure 8. Please note that for the sake of simplicity we have chosen to show only one type of structure per R (tube, helical ribbon, facetted object, planar lamella) but several structures coexist in solution in the transition zones from one regime of structures to another. These transitions zones are likely rather broad with a progressive evolution from one morphology to another within such transitions zones. Overall, all structures are based on 2-D lamella stacked bilayers and display a very broad polymorphism depending on the ratio between the two type of fatty acids. At low R, when doping the SA molecules by a few amount of 12-HSA molecules, the planar multi-lamellar self-assemblies that are formed in pure SA solutions turn into complex multi-lamellar facetted structures with planar domains bounded by spherical curves domains. At large R, when doping the 12-HSA molecules by a few amount of SA molecules, the multi-lamellar long tubes that are formed in pure 12-HSA systems are preserved but their tube-length decreases upon addition of SA. At intermediate R, tubes and helical ribbons coexist and eventually fuse in spectacular long 1-D multilamellar objects made of tubes bonded by the helical ribbons. WAXS experiments revealed that two types of bilayers with different crystalline are present at low and intermediate R, which suggest a partial demixion between the two types of fatty acids for these ratios. There would then be a local distribution of variable 12-HSA ratios within the different part of the structures. At low R, the 12-HSA molecules would locate preferentially within the curved parts of the self-assemblies structures. At intermediate R, the SA would locate preferentially within the helical parts. These different morphologies of the self-assemblies (from 1-D multilamellar tubes to large domains of fatty acid lamellas) are associated with different clear-cut regimes of bilayers rigidities and drive the macroscopic rheological properties.
A first hypothesis to explain the occurrence of the various morphological transitions would be a variation of the ionization state of the carboxylated heads with R that would change the packing parameter. The pH is however almost constant for all samples at 10.85 ± 0.15 (see Table 1): All carboxyl heads are under their COO- form and negatively charged and probably associated with ethanolamine counter-ion since the pH remains almost constant for one sample to another 10.85 ± 0.15. The fact that 2-D self-assemblies are formed in every case originates then from the fact that all bilayers are in a crystalline gelled state and not in a fluid state, as demonstrated by WAXS, otherwise spherical micelles would have been formed, as usually obtained when long chain fatty acids are fluid and negatively charged. Also, the fact that all heads are negatively charged implies that electrostatic repulsions are similar on the whole range of R, whether they occur at the molecular level between heads or at the colloidal level between charged bilayers. Such electrostatic forces cannot thus be invoked to explain the strong variations of both the interlamellar layer dinter and the rigidity of the bilayer that occur when varying R (Figure 5B,C).
Another possibility to explain the partial local demixion between the two different fatty acids would come from a possible mismatch between the respective thicknesses of bilayers 12-HSA or SA when interacting with ethanolamine ions at r = 0.2, in spite of their alkyl chains having the same length (21 Å). The fatty acids indeed crystallize in bilayers with different in-plane structures (Figure 6). The thickness of the lamella is however the only structural parameter that remains constant for all R at ~ 24 Å (Figure 5D) which reveals a very strong interdigitation of the crystallized fatty acids within the bilayer. For the pure 12-HSA system, such an interdigitation comes from a mechanism related to the way the fatty acids interacts with the ethanolamine counterions because it occurs only in large excess of ethanolamine r = 0.2 but not at equimolarity at r = 0.5. For this latter ratio, when heads are not fully charged, there exists hydrogen bonds between them which leads to a more tight packing than at lower r when bilayers are non-interdigitated. The fatty acids crystallize in this non interdigitated bilayer then almost in the same way as monolayers of 12-HSA at the air/water interface. The Bragg peaks we obtain at r = 0.5 (respectively 1.391 Å- [1] , 1.572 Å- [1] and 1.597 Å- [1] ) indeed do almost correspond to those measured by GIXD on monolayers, [24,25] whose position vary slightly with the surface pressure and therefore with the tilt angle between the monolayer and the interface. The interdigitation process induces a full reorganization of the molecules since the interdigitated and non-interdigitated crystalline structures are completely different, although it remains impossible at this stage to determine if ethanolamine ions insert or not in the bilayer. Given that the crystalline bilayers of all samples at r = 0.2 are interdigitated roughly with the same thickness whatever R, it is likely that ethanolamine counterions interact in the same way with the fatty acids, whether they are SA or 12-HSA molecules. The interaction must takes then place between the heads of the fatty acids and ethanolamine.
The formation of the different morphologies with R, and their associated transitions, are then fully driven by the specific mechanisms induced by the presence of the OH hydroxyl function on the 12th carbon of the 12-HAS and the possibility of formation of hydrogen bonds with neighboring OH groups whenever possible. It is enthalpically favorable for the 12-HSA molecules to form homogeneous domains in which they have the same curvature and can interact one to each other through H-bonding of OH groups in position 12. The behavior of the mixtures is then driven by the competition between the mixing entropy, that favors a homogeneous distribution of two types of fatty acids within the bilayers, and enthalpic effects that would lead to the segregation of pure domains of SA molecules or 12-HSA molecules. Thus, depending on R, a local demixion can occur within a given type of self-assembled object, as for catanionic systems. [4,18,54] This likely arises in the low regime of R within the facetted objects. The demixion can even lead to the formation of different types of self-assembled structures that coexist in solution, as in the transition zone from facetted objects to tubes/ribbons around R = 0.4. Samples in which two very different types of self-assembled structures do coexist may undergo a gravity-induced phase separation due to difference of densities, which is partially arrested by the high viscosity of the samples. This may then create large macroscopic heterogeneities observed at R = 0.4 (see the inset of Figure 2) and that makes analysis of SANS data difficult for this regime.
The simplest case is the regime of low doping of 12-HSA multilamellar tubes by SA molecules (R ≥ 0.75). The doping molecules only create defects within the bilayer but do not modify the main arrangement of the self-assemblies: the crystalline structure of the bilayer of pure 12-HSA system is preserved, and the tubes’ external radius and interlamellar distances are of the same orders. Their introduction induces a progressive decrease of rigidity of the bilayer since η progressively slightly increases with R. This induces also a progressive concurrent increase of the tube radius and reduction of the length of the tubes. It is likely that part of the SA molecules mainly localizes at the edges of the 12-HSA bilayers that roll to form the tubes, which releases constraints and therefore decreases the bilayers rigidity. The progressive capping of the bilayers at the tubes ends mays also decrease their length.
At low R, in the regime of low doping of SA-self assemblies by a small amount of SA molecules (0.05 ≤ R ≤ 0.25), the multi-lamellar facetted structures with planar domains bounded by spherical curves domains suggest a local partitioning of the two fatty acids, which is confirmed by the presence of two type of crystalline structures by WAXS. The SA molecules would localize mainly in the planar domains, that have the curvature they adopt in pure solution, and 12-HSA would localize in the curved domains that make the edges of the facetted objects. Enthalpic effects would then predominate in this regime and lead to the formation of these domains enriched in 12-HSA molecules where they can form a rigid H-bond network and impose their curvature. Such domains would act then as rigid rafts within the bilayers, and therefore end up limiting membrane fluctuations. This may explain the high membrane rigidity evidenced in this regime, compared to all others R. In this regime, the interlamellar distance dinter decreases largely and linearly from R = 0 to R = 0.25. This may be explained by the specific topology of the self-assembled structures. Since dinter is much larger for the pure SA lamellar phase than for tubes (575 Å versus 240 Å), the junction of the planar lamellas of SA by bilayers of smaller interlamellar distance force them to approach themselves to fit the mismatch. The system adopts then an intermediate dinter that accounts for the respective contents of planar and curved parts domains, which explains why dinter decreases linearly with R. The increased rigidity of the membranes may also come from the fact that planar membranes of SA molecules are forced to come closer together.
When R tends to equimolarity at intermediate R, WAXS showed that demixion between the fatty acids occurs, as for the low R case. The main geometrical structures of the self-assemblies remain however close to those observed at large R in case of multilammellar tubes doped by HSA tubes. They are long tubular objects with very close rigidities and intermellar distances as for R = 0.75, while the crystalline structure stays close to that of pure SA. The large doping of the 12-HSA tubes by SA leads to the formation of helical ribbons, as already observed by Fameau et al in reference [11] that come from their partial unrolling when domains of SA of planar curvature insert within the tubes. The demixion between acids also lead to the formation of several types of tubular objects with various local contents in HSA/SA ratios, from rigid to helical ribbons, that eventually merge to form very long objects of various rigidities along the tubes. Also, close to the transition towards the low R regime art R = 0.4, it is likely that such tubular objects coexist with the facetted objects evidenced at low R.
4. Materials and Methods
4.1. Materials and Sample Preparation
12-Hydroxystearic acid (HSA) was purchased from Xilong Chemical Co., Ltd., Shantou, Stearic acid (SA) was purchased from Sigma-Aldrich and ethanolamine from Aldrich Chemistry (≥99.5%). H2O was provided by a Millipore system and D2O purchased from Eurisotop.
Aqueous stock-solutions of HSA and SA at a concentration of 100 g/L were prepared as follows. HSA (respectively SA) and ethanolamine were first weighted accurately in a sample tube into which ultrapure water was further added to reach the targeted molar concentration of fatty acid. The mass of ethanolamine was adjusted to set the molar ratio surfactant/counter ion r at 0.2, calculated by r = nfatty_acid/( nfatty_acid + nethanolamine). Then, the solutions were stirred and heated to 70 °C in an oven for 2 hours, a temperature at which solutions are non-viscous, and vortexed to ensure homogenization. They all look clear and homogeneous at 70 °C.
The mixture samples were then prepared at a fixed concentration of fatty acid molecules of 20 g/L by mixing stock-solutions and ultrapure water in appropriate dilutions to reach the targeted ratio of the two fatty acids R defined by:
where nHSA and nSA are the moles of the fatty acids. The mixtures were then heated back in an oven at 70 °C for two hours and vortexed for some seconds for homogenization. This concentration was chosen in order to compare the results with literature, where a large corpus of knowledge exists for the pure 12-HSA system. [11,38,39] In the case of SANS experiments, all samples were prepared in D2O at the same volume fraction.
We probed the following R values in the paper: 1 (pure sample of HSA fatty acids as reference), 0.9, 0.75, 0.6, 0.5, 0.4, 0.25, 0.1, 0.05 and 0 (reference sample of SA fatty acids).
In the following we systematically heated the samples at 70 °C for homogenization before any kind of measurement.
Table 1 shows the pH of each sample, it was measured with a Jenway 3510 pH Meter, at room temperature.
Table 1.
pH values for each ratio (R), measured at room temperature.
| R | pH |
|---|---|
| R=0 | [10.91;10.92] |
| R=0.05 | 10.94 |
| R=0.1 | [10.96;11.02] |
| R=0.15 | 10.75 |
| R=0.25 | 10.93 |
| R=0.4 | [10.75;10.79] |
| R=0.5 | [10.83;10.84] |
| R=0.6 | [10.86;10.88] |
| R=0.75 | [10.76;10.78] |
| R=0.9 | 10.85 |
| R=1 | [11.01;11.02] |
4.2. Confocal Microscopy
A Zeiss LSM 700 confocal system mounted on a Zeiss microscope with an AxioCam MRm and a ×100 oil-immersion objective was used to examine the samples with Nile Red (Aldrich Chemistry) in the proportion of 1 molecule of Nile Red per 2.10 [4] molecules of fatty acid. Each sample has been mixed with Nile red dye at 70°C and then measured at ambient temperature. The dye was excited by a laser at 514 nm.
4.3. Cryogenic Transmission Electron Microscopy (Cryo-TEM)
The cryo-transmission electron microscopy (Cryo-TEM) were performed at Institut de Minéralogie, de Physique des Matériaux et de Cosmochimie (IMPMC), Sorbonne Université. Samples were left in vials for two days at least to equilibrate at room temperature before being pipetted from vials. For each sample, a drop of the solution was deposited on “quantifoil”® carbon membrane grid (Quantifoil Micro Tools GmbH, Germany). The excess of liquid on the grid was absorbed with a filter paper and the grid was quench-frozen quickly in liquid ethane to form a thin vitreous ice film. Once placed in a Gatan 626 cryo-holder cooled with liquid nitrogen, the sample was transferred in the microscope and observed at low temperature (-180 °C). Cryo-TEM images were recorded on ultrascan 2k × 2k pixels CCD camera (Gatan, Pleasanton, California, USA), using a LaB6 JEOL JEM2100 (JEOL, Tokyo, Japan) cryo microscope operating at 200 kV with a JEOL low dose system (Minimum Dose System, MDS) to protect the thin ice film from any irradiation before imaging and reduce the irradiation during the image capture.
4.4. Small Angle Neutron Scattering (SANS)
Small angle neutron scattering experiments were performed at Institut Laue-Langevin (Grenoble, France) on the diffractometer D11 (DOI: http://dx.doi.org/10.5291/ILL-DATA.9-11-2041). We used four configurations (6 Å at 1.7 m, 6 Å 5.5 m, 6 Å at 20.5 m, and 13 Å at 38 m) to reach a very broad q-range spanning from 5.9 10- [4] Å- [1] to 0.53 Å- [1] . The samples were prepared in D2O in order to optimize neutron contrast with hydrogenated molecules and to reduce as much as possible incoherent scattering. We checked beforehand that the use of deuterated water instead of hydrogenated water does not modify the macroscopic aspect of samples. Samples were held in flat quartz cells (Hellma) with a 2 mm optical path.
All samples were measured at 20 °C. The temperature was set by a circulating bath that thermalizes the sample holder into which samples were placed. Transmissions, scattering of empty cell, [10] B4C ceramics (neutron absorber to value ambient background of experiment), scattering of hydrogenated water and differential scattering cross section of water were measured independently. Subtraction of parasitic contributions and normalization by water to take into account detectors heterogeneities were applied to raw data by the GRASP software (version Grasp Lockdown V.9.22e) to obtain corrected data in absolute units (cm- [1] ). [55] Contributions from solvent and incoherent scattering were then subtracted.
Fitting software used was SasView 5.0.4 (http://www.sasview.org/.). Fitting models are detailed in the supplementary information.
4.5. Wide Angle X-ray Scattering (WAXS)
WAXS measurements were carried out on a Xeuss 2.0 instrument from Xenocs, which uses a microfocused Cu Kα source with a wavelength of 1.54 Å and a PILATUS3 detector (Dectris, Switzerland). The experiments were performed at a sample-to-detector distance of 350 mm with a collimated beam size of 0.8 × 0.8 mm to achieve a q-range of 0.038 Å− [1] – 1.78 Å− [1] . The solutions were poured inside 1.5 mm glass capillaries that were placed onto a home-made sample holder thermalized with a circulating water flow coupled with a Huber bath, allowing to control the samples temperature to 20°C. The measurements were performed for 35 minutes per sample to achieve a good statistics. The respective scattering from empty beam, empty capillary and dark field were measured independently and subtracted from the sample scattering, taking account their relative transmission, and normalized with incident beam intensity to obtain scattering in absolute units (cm- [1] ). A reference water sample measurement was measured independently. The contribution from water to the samples scattering was then subtracted properly thanks to such reference water sample.
4.6. Rheology
Rheological measurements were carried out on an Anton Paar MCR 302 rheometer equipped with a cone-plate geometry (50mm diameter, 2° angle). The temperature during the experiment was set to 20°C and controlled through the lower plate with a Peltier device. The setup was covered with a hood to prevent the sample from drying.
Each solution was heated in an oven at 60°C for at least 45 minutes, then manipulated hot. In those conditions all solutions were homogeneous and fluid. . Once the gap set, the measurements were started after a resting time of 10 minutes for recovery and temperature homogenization.
Two types of oscillatory measurements were successively performed for each sample: an amplitude sweep measurement at a fixed frequency of 1Hz and a strain varying from 0.1 to 10% and a frequency sweep measurement at a fixed strain of 0.1% (which corresponds to the linear plateau) from 0.05 Hz to 5 Hz. The whole sequence took less than 40 minutes to be completed and no drying was observed at the end of the experiments. This protocol was repeated 3 times with renewed samples in order to estimate error bars.
5. Conclusion
We have demonstrated the proof-of-concept of the simple strategy we propose to tune the properties of aqueous solutions of long fatty chains based on a simple mixture of a saturated fatty acid and its hydroxylated counterpart, with the only variation of the ratio R between the two types of fatty keeping all other physicochemical parameters such as the ionization state or concentration constant. The specific effects induced by the variable amounts of hydroxyl functions along the fatty chains that are prone to make hydrogen bonds made indeed possible to create a wide range of nanostructures, from flat lamellar phases to entangled facetted objects, multilamellar rigid tubes up to very long tubular objects with rigid and more flexible parts. The rheological properties of the solutions correlate very well with the different morphologies, and show also a broad range of behavior, from viscous fluids to gels with a yield stress. Also, in the regime of large R, we demonstrated that the dimensions of the multilamellar tubes (radius and length) of 12-HSA fatty acids widely described in literature can be finely tuned by a partial doping by SA molecules, which tunes in turn their rheological properties by playing on the density of entanglements.
The behavior of the aqueous mixtures of SA/12HSA fatty acids on a large range temperature will be probed in a forthcoming paper in order to probe the potential of the self-assemblies as building blocks for the design of thermo-responsive systems.
Supplementary Materials
The following supporting information can be downloaded at the website of this paper posted on Preprints.org, Table S1: Values of the lamellas’ parameters by fitting the SANS data; Figure S1: SANS data in (q)qα versus q representation, with α = 2, α = 3 and α = 4; Figure S2a: Storage and Loss Modulus as a function of the strain, at 1Hz; Figure S2b: Storage and Loss Modulus as a function of the frequency, at 0.1% strain; Complex viscosity as a function of the frequency.
Funding
This research received no external funding.
Acknowledgments
The authors warmly thank Dr Anne-Laure Fameau for fruitful discussions. This work benefited from the use of the SasView application, originally developed under NSF award DMR-0520547. SasView contains code developed with funding from the European Union’s Horizon 2020 research and innovation programme under the SINE2020 project, grant agreement No 654000.
Conflicts of Interest
The authors declare no conflict of interest.
References
- Fameau, A.; Marangoni, A. G. Back to the Future: Fatty Acids, the Green Genie to Design Smart Soft Materials. J. Am. Oil Chem. Soc. 2022, 99 (7), 543–558. [Google Scholar] [CrossRef]
- Fameau, A.-L.; Rogers, M. A. The Curious Case of 12-Hydroxystearic Acid — the Dr. Jekyll & Mr. Hyde of Molecular Gelators. Curr. Opin. Colloid Interface Sci. 2020, 45, 68–82. [Google Scholar] [CrossRef]
- Fameau, A.-L.; Zemb, T. Self-Assembly of Fatty Acids in the Presence of Amines and Cationic Components. Adv. Colloid Interface Sci. 2014, 207, 43–64. [Google Scholar] [CrossRef] [PubMed]
- Michina, Y.; Carrière, D.; Charpentier, T.; Brito, R.; Marques, E. F.; Douliez, J.-P.; Zemb, T. Absence of Lateral Phase Segregation in Fatty Acid-Based Catanionic Mixtures. J. Phys. Chem. B 2010, 114 (5), 1932–1938. [Google Scholar] [CrossRef]
- Vautrin, C.; Zemb, T.; Schneider, M.; Tanaka, M. Balance of PH and Ionic Strength Influences on Chain Melting Transition in Catanionic Vesicles. J. Phys. Chem. B 2004, 108 (23), 7986–7991. [Google Scholar] [CrossRef]
- Dubois, M.; Lizunov, V.; Meister, A.; Gulik-Krzywicki, T.; Verbavatz, J. M.; Perez, E.; Zimmerberg, J.; Zemb, T. Shape Control through Molecular Segregation in Giant Surfactant Aggregates. Proc. Natl. Acad. Sci. 2004, 101 (42), 15082–15087. [Google Scholar] [CrossRef]
- Zemb, Th.; Dubois, M.; Demé, B.; Gulik-Krzywicki, Th. Self-Assembly of Flat Nanodiscs in Salt-Free Catanionic Surfactant Solutions. Science 1999, 283 (5403), 816–819. [Google Scholar] [CrossRef] [PubMed]
- Dubois, M.; Demé, B.; Gulik-Krzywicki, T.; Dedieu, J.-C.; Vautrin, C.; Désert, S.; Perez, E.; Zemb, T. Self-Assembly of Regular Hollow Icosahedra in Salt-Free Catanionic Solutions. Nature 2001, 411 (6838), 672–675. [Google Scholar] [CrossRef] [PubMed]
- Michina, Y.; Carrière, D.; Mariet, C.; Moskura, M.; Berthault, P.; Belloni, L.; Zemb, T. Ripening of Catanionic Aggregates upon Dialysis. Langmuir 2009, 25 (2),, 698–706. [Google Scholar] [CrossRef] [PubMed]
- Zana, R. Partial Phase Behavior and Micellar Properties of Tetrabutylammonium Salts of Fatty Acids: Unusual Solubility in Water and Formation of Unexpectedly Small Micelles. Langmuir 2004, 20 (14), 5666–5668. [Google Scholar] [CrossRef] [PubMed]
- Fameau, A.-L.; Houinsou-Houssou, B.; Novales, B.; Navailles, L.; Nallet, F.; Douliez, J.-P. 12-Hydroxystearic Acid Lipid Tubes under Various Experimental Conditions. J. Colloid Interface Sci. 2010, 341, 38–47. [Google Scholar] [CrossRef]
- Douliez, J.-P.; Navailles, L.; Nallet, F. Self-Assembly of Fatty Acid−Alkylboladiamine Salts. Langmuir 2006, 22, 622–627. [Google Scholar] [CrossRef]
- Novales, B.; Navailles, L.; Axelos, M.; Nallet, F.; Douliez, J.-P. Self-Assembly of Fatty Acids and Hydroxyl Derivative Salts. Langmuir 2008, 24 (1), 62–68. [Google Scholar] [CrossRef] [PubMed]
- Xu, W.; Gu, H.; Zhu, X.; Zhong, Y.; Jiang, L.; Xu, M.; Song, A.; Hao, J. CO 2 -Controllable Foaming and Emulsification Properties of the Stearic Acid Soap Systems. Langmuir 2015, 31 (21), 5758–5766. [Google Scholar] [CrossRef] [PubMed]
- Xu, W.; Zhang, H.; Zhong, Y.; Jiang, L.; Xu, M.; Zhu, X.; Hao, J. Bilayers at High PH in the Fatty Acid Soap Systems and the Applications for the Formation of Foams and Emulsions. J. Phys. Chem. B 2015, 119 (33), 10760–10767. [Google Scholar] [CrossRef] [PubMed]
- Xu, W.; Liu, H.; Song, A.; Hao, J. Bilayers and Wormlike Micelles at High PH in Fatty Acid Soap Systems. J. Colloid Interface Sci. 2016, 465, 304–310. [Google Scholar] [CrossRef] [PubMed]
- Fameau, A.-L.; Arnould, A.; Lehmann, M.; von Klitzing, R. Photoresponsive Self-Assemblies Based on Fatty Acids. Chem. Commun. 2015, 51 (14), 2907–2910. [Google Scholar] [CrossRef] [PubMed]
- Arnould, A.; Perez, A. A.; Gaillard, C.; Douliez, J.-P.; Cousin, F.; Santiago, L. G.; Zemb, T.; Anton, M.; Fameau, A.-L. Self-Assembly of Myristic Acid in the Presence of Choline Hydroxide: Effect of Molar Ratio and Temperature. J. Colloid Interface Sci. 2015, 445, 285–293. [Google Scholar] [CrossRef]
- Arnould, A.; Cousin, F.; Chabas, L.; Fameau, A.-L. Impact of the Molar Ratio and the Nature of the Counter-Ion on the Self-Assembly of Myristic Acid. J. Colloid Interface Sci. 2018, 510, 133–141. [Google Scholar] [CrossRef]
- Klein, R.; Kellermeier, M.; Drechsler, M.; Touraud, D.; Kunz, W. Solubilisation of Stearic Acid by the Organic Base Choline Hydroxide. Colloids Surf. Physicochem. Eng. Asp. 2009, 338 (1–3), 129–134. [CrossRef]
- Cistola, D. P.; Atkinson, D.; Hamilton, J. A.; Small, D. M. Phase Behavior and Bilayer Properties of Fatty Acids: Hydrated 1:1 Acid-Soaps. Biochemistry 1986, 25 (10), 2804–2812. [Google Scholar] [CrossRef]
- Klein, R.; Touraud, D.; Kunz, W. Choline Carboxylate Surfactants: Biocompatible and Highly Soluble in Water. Green Chem. 2008, 10 (4), 433. [CrossRef]
- Zana, R.; Schmidt, J.; Talmon, Y. Tetrabutylammonium Alkyl Carboxylate Surfactants in Aqueous Solution: Self-Association Behavior, Solution Nanostructure, and Comparison with Tetrabutylammonium Alkyl Sulfate Surfactants. Langmuir 2005, 21 (25), 11628–11636. [Google Scholar] [CrossRef]
- Cristofolini, L.; Fontana, M. P.; Boga, C.; Konovalov, O. Microscopic Structure of Crystalline Langmuir Monolayers of Hydroxystearic Acids by X-Ray Reflectivity and GID: OH Group Position and Dimensionality Effect. Langmuir 2005, 21 (24), 11213–11219. [Google Scholar] [CrossRef]
- Vollhardt, D.; Siegel, S.; Cadenhead, D. A. Characteristic Features of Hydroxystearic Acid Monolayers at the Air/Water Interface. J. Phys. Chem. B 2004, 108 (45),, 17448–17456. [Google Scholar] [CrossRef]
- Yim, K. S.; Rahaii, B.; Fuller, G. G. Surface Rheological Transitions in Langmuir Monolayers of Bi-Competitive Fatty Acids. Langmuir 2002, 18 (17), 6597–6601. [Google Scholar] [CrossRef]
- Overs, M.; Hoffmann, F.; Schäfer, H. J.; Hühnerfuss, H. Infrared Reflection−Absorption Spectroscopy of Racemic and Enantioenriched Methyl 17,18-Dihydroxyoctadecanoate at the Air−Water Interface. Langmuir 2000, 16 (17), 6995–6998. [Google Scholar] [CrossRef]
- Yang, H.-K.; Zhang, C.; He, X.-N.; Wang, P.-Y. Effects of Alkyl Chain Lengths on 12-Hydroxystearic Acid Derivatives Based Supramolecular Organogels. Colloids Surf. Physicochem. Eng. Asp. 2021, 616, 126319. [Google Scholar] [CrossRef]
- Terech, P.; Pasquier, D.; Bordas, V.; Rossat, C. Rheological Properties and Structural Correlations in Molecular Organogels. Langmuir 2000, 16 (10), 4485–4494. [Google Scholar] [CrossRef]
- Burkhardt, M.; Noirez, L.; Gradzielski, M. Organogels Based on 12-Hydroxy Stearic Acid as a Leitmotif: Dependence of Gelation Properties on Chemical Modifications. J. Colloid Interface Sci. 2016, 466, 369–376. [Google Scholar] [CrossRef] [PubMed]
- Gordon, R.; Stober, S. T.; Abrams, C. F. Effects of Optical Purity and Finite System Size on Self-Assembly of 12-Hydroxystearic Acid in Hexane: Molecular Dynamics Simulations. J. Phys. Chem. B 2017, 121 (39), 9223–9233. [Google Scholar] [CrossRef]
- Mallia, V. A.; Weiss, R. G. Self-Assembled Fibrillar Networks and Molecular Gels Employing 12-Hydroxystearic Acid and Its Isomers and Derivatives: FIBRILLAR NETWORKS AND GELS WITH 12-HYDROXYSTEARIC ACID DERIVATIVES. J. Phys. Org. Chem. 2014, 27 (4), 310–315. [Google Scholar] [CrossRef]
- Takeno, H.; Yanagita, M.; Motegi, Y.; Kondo, S. Relationship between Helical Aggregates and Polymorphs in a 12-Hydroxystearic Acid Gel: Their Thermal Stability and Formation Kinetics. Colloid Polym. Sci. 2015, 293 (1), 199–207. [Google Scholar] [CrossRef]
- Liu, C.; Corradini, M.; Rogers, M. A. Self-Assembly of 12-Hydroxystearic Acid Molecular Gels in Mixed Solvent Systems Rationalized Using Hansen Solubility Parameters. Colloid Polym. Sci. 2015, 293 (3), 975–983. [Google Scholar] [CrossRef]
- Tachibana, T.; Kambara, H. Studies of Helical Aggregates of Molecules. I. Enantiomorphism in the Helical Aggregates of Optically Active 12-Hydroxystearic Acid and Its Lithium Salt. Bull. Chem. Soc. Jpn. 1969, 42 (12), 3422–3424. [Google Scholar] [CrossRef]
- Nakagawa, M.; Kawai, T. Tuning Gel–Sol Transition Behavior of a Hydrogel Based on 12-Hydroxystearic Acid and a Long-Chain Amidoamine Derivative. Bull. Chem. Soc. Jpn. 2019, 92 (2), 435–440. [Google Scholar] [CrossRef]
- Douliez, J.-P.; Gaillard, C.; Navailles, L.; Nallet, F. Novel Lipid System Forming Hollow Microtubes at High Yields and Concentration. Langmuir 2006, 22 (7),, 2942–2945. [Google Scholar] [CrossRef]
- Fameau, A.-L.; Cousin, F.; Navailles, L.; Nallet, F.; Boué, F.; Douliez, J.-P. Multiscale Structural Characterizations of Fatty Acid Multilayered Tubes with a Temperature-Tunable Diameter. J. Phys. Chem. B 2011, 115 (29), 9033–9039. [Google Scholar] [CrossRef]
- Fameau, A.-L.; Cousin, F.; Saint-Jalmes, A. Morphological Transition in Fatty Acid Self-Assemblies: A Process Driven by the Interplay between the Chain-Melting and Surface-Melting Process of the Hydrogen Bonds. Langmuir 2017, 33 (45), 12943–12951. [Google Scholar] [CrossRef]
- Valéry, C.; Artzner, F.; Paternostre, M. Peptide Nanotubes: Molecular Organisations, Self‐Assembly Mechanisms and Applications. Soft Matter 2011, 7 (20), 9583. [CrossRef]
- Jiang, L.; Peng, Y.; Yan, Y.; Deng, M.; Wang, Y.; Huang, J. “Annular Ring” Microtubes Formed by SDS@2β‐ CD Complexes in Aqueous Solution. Soft Matter 2010, 6 (8), 1731. [CrossRef]
- Yang, S.; Yan, Y.; Huang, J.; Petukhov, A. V.; Kroon-Batenburg, L. M. J.; Drechsler, M.; Zhou, C.; Tu, M.; Granick, S.; Jiang, L. Giant Capsids from Lattice Self‐Assembly of Cyclodextrin Complexes. Nat. Commun. 2017, 8 (1), 15856. [CrossRef] [PubMed]
- Landman, J.; Ouhajji, S.; Prévost, S.; Narayanan, T.; Groenewold, J.; Philipse, A. P.; Kegel, W. K.; Petukhov, A. V. Inward Growth by Nucleation: Multiscale Self‐Assembly of Ordered Membranes. Sci. Adv. 2018, 4 (6), eaat1817. [CrossRef]
- dos Santos Silva Araújo, L.; Watson, L.; Traore, D. A. K.; Lazzara, G.; Chiappisi, L. Hierarchical Assembly of PH-Responsive Surfactant–Cyclodextrin Complexes. Soft Matter 2022, 18 (35), 6529–6537. [Google Scholar] [CrossRef] [PubMed]
- Ouhajji, S.; Landman, J.; Prévost, S.; Jiang, L.; Philipse, A. P.; Petukhov, A. V. In Situ Observation of Self-Assembly of Sugars and Surfactants from Nanometres to Microns. Soft Matter 2017, 13 (13), 2421–2425. [Google Scholar] [CrossRef] [PubMed]
- Douliez, J.-P.; Pontoire, B.; Gaillard, C. Lipid Tubes with a Temperature-Tunable Diameter. ChemPhysChem 2006, 7 (10), 2071–2073. [Google Scholar] [CrossRef]
- Fameau, A.-L.; Saint-Jalmes, A. Yielding and Flow of Solutions of Thermoresponsive Surfactant Tubes: Tuning Macroscopic Rheology by Supramolecular Assemblies. Soft Matter 2014, 10 (20), 3622. [CrossRef]
- Fameau, A.-L.; Saint-Jalmes, A.; Cousin, F.; Houinsou Houssou, B.; Novales, B.; Navailles, L.; Nallet, F.; Gaillard, C.; Boué, F.; Douliez, J.-P. Smart Foams: Switching Reversibly between Ultrastable and Unstable Foams. Angew. Chem. Int. Ed. 2011, 50 (36), 8264–8269. [Google Scholar] [CrossRef]
- Fameau, A.-L.; Cousin, F.; Derrien, R.; Saint-Jalmes, A. Design of Responsive Foams with an Adjustable Temperature Threshold of Destabilization. Soft Matter 2018, 14 (14), 2578–2581. [Google Scholar] [CrossRef]
- Salerno, C.; Chiappetta, D. A.; Arechavala, A.; Gorzalczany, S.; Scioscia, S. L.; Bregni, C. Lipid-Based Microtubes for Topical Delivery of Amphotericin B. Colloids Surf. B Biointerfaces 2013, 107, 160–166. [Google Scholar] [CrossRef]
- Matuo, H.; Mitsui, T.; Motomura, K.; Matuura, R. Eutectic Transformation in Mixed Monolayers of Long Normal Chain Fatty Acids with 12-Hydroxyoctadecanoic Acid. Chem. Phys. Lipids 1981, 29 (1), 55–67. [Google Scholar] [CrossRef]
- Paineau, E.; Krapf, M.-E. M.; Amara, M.-S.; Matskova, N. V.; Dozov, I.; Rouzière, S.; Thill, A.; Launois, P.; Davidson, P. A Liquid‐Crystalline Hexagonal Columnar Phase in Highly‐Dilute Suspensions of Imogolite Nanotubes. Nat. Commun. 2016, 7 (1), 10271. [CrossRef] [PubMed]
- Nallet, F.; Laversanne, R.; Roux, D. Modelling X-Ray or Neutron Scattering Spectra of Lyotropic Lamellar Phases : Interplay between Form and Structure Factors. J. Phys. II 1993, 3 (4),, 487–502. [Google Scholar] [CrossRef]
- Dubois, M.; Gulik-Krzywicki, T.; Demé, B.; Zemb, T. Rigid Organic Nanodisks of Controlled Size: A Catanionic Formulation. Comptes Rendus Académie Sci. - Ser. IIC - Chem. 1998, 1 (9),, 567–575. [Google Scholar] [CrossRef]
- Cousin, F. Small Angle Neutron Scattering. EPJ Web Conf. 2015, 104, 01004. [Google Scholar] [CrossRef]
Figure 1.
Representation of (A) stearic acid molecule and (B) 12-hydroxy stearic acid molecules.
Figure 2.
Photographs of the samples at all ratios R probed in the paper. The inset at R=0.4 is a zoom showing its heterogeneous macroscopic aspect.
Figure 2.
Photographs of the samples at all ratios R probed in the paper. The inset at R=0.4 is a zoom showing its heterogeneous macroscopic aspect.
Figure 3.
Confocal microscope images with an ×100 objective obtained for different HSA/SA samples at 2 wt% in presence of Nile red with different ratio from pure SA (R=0) on figure (A) to pure HSA (R=1) on figure (I). Figures (B), (C), (D), (E), (F), (G), (H), correspond respectively to sample with a ratio R equal to 0.2, 0.3, 0.4, 0.5, 0.6, 0.75 and 0.9.
Figure 4.
Cryo-TEM images obtained for different samples ratios from pure HSA (R=1) to pure SA (R=0), and intermediate surfactant concentrations R=0.4 and R=0.1.
Figure 4.
Cryo-TEM images obtained for different samples ratios from pure HSA (R=1) to pure SA (R=0), and intermediate surfactant concentrations R=0.4 and R=0.1.
Figure 5.
Right: (A) SANS intensity profiles at 20°C for the different samples in D2O for all HSA/SA ratios, from pure SA (R=0) to pure HSA (R=1). The spectra are successively shifted by a factor 10 in intensity for clarity (data for R=0 in absolute scale). The green lines correspond to the characteristic decays in the low q region. The black and red continuous lines correspond to the best fit of the data (see description of the model in supplementary information). The dotted part of the fitted model for R = 1, R = 0.9 and R = 0.75 correspond to the q-range where there is multiple scattering. The sample at R = 0.4 is not fitted as it is macroscopically heterogeneous (see main text). Left (B), (C) and (D) : Respectively the Caillé parameters, interlamellar distances and lamella thicknesses as a function of R, obtained by SANS data fitting.
Figure 6.
WAXS diffractograms for the different HSA/SA samples ratio, from pure SA (R=0) to pure HSA (R=1), as well as of a pure 12-HSA sample at a fatty acid/ethanolamine ratio of r = 0.5 for comparison. The spectra were shifted in intensity one from each other by 0.0025 cm- [1] for clarity.
Figure 6.
WAXS diffractograms for the different HSA/SA samples ratio, from pure SA (R=0) to pure HSA (R=1), as well as of a pure 12-HSA sample at a fatty acid/ethanolamine ratio of r = 0.5 for comparison. The spectra were shifted in intensity one from each other by 0.0025 cm- [1] for clarity.
Disclaimer/Publisher’s Note: The statements, opinions and data contained in all publications are solely those of the individual author(s) and contributor(s) and not of MDPI and/or the editor(s). MDPI and/or the editor(s) disclaim responsibility for any injury to people or property resulting from any ideas, methods, instructions or products referred to in the content. |
© 2023 by the authors. Licensee MDPI, Basel, Switzerland. This article is an open access article distributed under the terms and conditions of the Creative Commons Attribution (CC BY) license (http://creativecommons.org/licenses/by/4.0/).
Copyright: This open access article is published under a Creative Commons CC BY 4.0 license, which permit the free download, distribution, and reuse, provided that the author and preprint are cited in any reuse.
A Small-Angle Neutron Scattering, Calorimetry and Densitometry Study to Detect Phase Boundaries and Nanoscale Domain Structure in a Binary Lipid Mixture
Natalie Krzyzanowski
et al.
Membranes,
2023
Solvent-Induced Assembly of One-Patch Silica Nanoparticles into Robust Clusters, Wormlike Chains and Bilayers
Bin Liu
et al.
Nanomaterials,
2021
Structure of Langmuir Monolayers of Perfluorinated Fatty Acids: Evidence of a New 2D Smectic C Phase
Philippe Fontaine
et al.
Molecules,
2019


MDPI Initiatives
Important Links
© 2024 MDPI (Basel, Switzerland) unless otherwise stated