Preprint
Article

Liver Involvement in Patients With Systemic Sclerosis: Role of Transient Elastography in the Assessment of Hepatic Fibrosis and Steatosis

Altmetrics

Downloads

126

Views

46

Comments

0

A peer-reviewed article of this preprint also exists.

Submitted:

24 April 2023

Posted:

25 April 2023

You are already at the latest version

Alerts
Abstract
Background Systemic sclerosis (SSc) is a rare, multisystemic disorder of connective tissue, characterized by widespread inflammation, vascular abnormalities, and both skin and visceral organ fibrosis. Tissue fibrosis is the final phase of a complex biological process of immune activation and vascular damage. Objectives The aim of study was to assess hepatic fibrosis and steatosis in SSc patients by transient elastography (TE). Methods Fifty-nine SSc patients, satisfying the 2013 ACR/EULAR classification criteria, were recruited. Clinical and laboratory findings, modified Rodnan skin score (mRSS), ac-tivity index, video-capillaroscopy, echocardiography, and lung function data were ana-lyzed. Liver stiffness (LS) was measured by transient elastography (TE), with 7 kPa used as the cut-off value for significant liver fibrosis and steatosis. Specifically, values ≥ 238 CAP ≤ 259 dB/m were considered consistent with mild steatosis (S1), 260 ≥ CAP ≤ 290 dB/m with moderate steatosis (S2) and ≥291 dB/m with severe steatosis (S3) Results The median age of patients was 51 years, with a median disease duration of 6 years. Median LS was 4.5 (2.9–8.3) kPa; 41 patients (69.5%) had no evidence of fibrosis (F=0), 16 (27.1%) displayed LS values between 5.2 and 7 kPa; only 2 patients (3.4%) had LS values >7 kPa (F3). The median CAP value for liver steatosis was 223 dB/m (IQR: 164–343). Overall, 39 patients (66.1%) did not show evidence of steatosis (CAP values <238 dB/m); 9 patients (15.2%) showed values consistent with mild (S1) steatosis (CAP value ≥238 ≤259 dB/m); 8 patients (13.5%) had moderate (S2) steatosis (CAP value ≥260 ≤290 dB/m); 3 patients (5.1%) were deemed to have severe steatosis (S3) due to CAP values ≥291 dB/m. Conclusions Only 3.4% of our patient population showed evidence of marked liver fibrosis, which is the same prevalence as that expected in the general population. Likewise, the prevalence of significant steatosis was low (5.1%) and depending on the same variables associated with fatty liver in the general population. TE was shown to be an easy and valuable method for detection and screening of liver fibrosis in SSc patients with no additional risk factors for liver disease.
Keywords: 
Subject: Medicine and Pharmacology  -   Internal Medicine

1. Introduction

Systemic sclerosis (SSc) is a chronic multisystem connective tissue disease of unknown etiology and intricate pathogenesis [1]. The pathophysiology of SSc is indeed still under investigation, whereby chronic inflammation, deposition of collagen and fibrosis of the affected tissues my lead to thickening of the skin and possible involvement of internal organs, mainly the lungs, the gastrointestinal tract, the heart, and the kidneys. Briefly, vascular damage (proliferative and obliterative vasculopathy) in genetically susceptible individuals, triggered by environmental factors, prompts activation of endothelial cells, recruitment of innate and adaptive immune cells, and progressive fibrosis of internal organs [1,2]. Fibrotic changes of internal organs, such as the lungs, heart, kidneys, and the gastrointestinal tract characterize the clinical course of both limited (lcSSc) and diffuse cutaneous SSc (dcSSc), potentially leading to organ dysfunction [3]. However, liver involvement by fibrosis is less defined. Indeed, data are scarce about the real prevalence of disease-associated fibrotic changes in the liver of SSc patients, which appear to be around 13% according to the little literature available [4,5]. Notably, liver involvement in SSc, although uncommon, is a complication well-known to rheumatologists caring for these patients. However, when this occurs, it is mainly due to autoimmune comorbidities, such as primary biliary cholangitis (PBC), autoimmune hepatitis, or overlap syndromes [6,7]. Of these, primary biliary cholangitis is the most common cause of liver involvement in SSc patients [7]. This is not surprising, since both conditions are deemed to be autoimmune diseases. Indeed, several observations point to a shared autoimmune pathogenesis between SSc and PBC, among which: 1) the detection of SSc characteristic anti-centromere antibodies, which are associated with the limited SSc subset, in 9–30% of PBC patients with no apparent concurrent connective tissue disease; 2) the detection of the characteristic PBC anti-mitochondrial antibodies (AMA) in 25% of SSc with no apparent hepatobiliary involvement; 3) the relatively frequent association of SSc and PBC with other organ-specific and/or systemic autoimmune conditions, among which Hashimoto’s thyroiditis, Graves’ disease, Sjögren’s syndrome, and rheumatoid arthritis are the most frequently observed [7]. Thus, it is not surprising that SSc patients are first evaluated for an overlapping autoimmune hepatobiliary condition, in case of abnormal results of liver biochemistry tests, rather than for fibrosis also involving the liver along with the other organs and tissues characteristically damaged by the disease pathogenetic mechanism. A deeper knowledge is therefore required to assist clinicians in decision-making, particularly to establish the need for liver assessment when a diagnosis of SSc is made and for liver fibrosis monitoring during the clinical course of the disease. Transient elastography (TE) is a relatively new diagnostic method able to analyze the mechanical characteristics of the investigated tissues, thereby yielding non-invasive images of their density (elasticity). This technology has evolved rapidly in recent years [8,9]. Briefly, the device is equipped with a probe capable of emitting ultrasound which produces an elastic wave passing through the liver parenchyma; liver stiffness (LS) is then deduced by the software on board the machine following analysis of the data related to the crossing speed of the elastic wave in the liver. The final output is a numerical value for each measurement, expressed in kiloPascal (kPa) [8,9].
The aim of this study was, therefore, to evaluate the prevalence of hepatic fibrosis and fatty liver in SSc patients by means of TE. Secondary endpoints were the identification of predictors of liver steatosis or fibrosis and their analysis.

2. Materials and Methods

2.1. Study Population

A cross-sectional study was carried out on 59 patients at the Rheumatology Clinic of “Luigi Vanvitelli” University of Campania, Naples, Italy. From January 2022 to June 2022, the clinical records of all patients aged ≥18 years were retrieved from the clinic’s database. SSc diagnosis was based according to American College of Rheumatology (ACR)/European League Against Rheumatism (EULAR) 2013 classification criteria [10]. Briefly, the following items were considered: skin thickening of the fingers of both hands extending proximal to the metacarpophalangeal joints (sufficient stand-alone criterion), skin thickening of the fingers (puffy fingers or sclerodactyly of the fingers distal to the metacarpophalangeal joints but proximal to the proximal interphalangeal joints), fingertip lesions (digital tip ulcers, fingertip pitting scars), telangiectasia, abnormal nailfold capillaries, pulmonary arterial hypertension and/or interstitial lung disease, Raynaud’s phenomenon, SSc-related autoantibodies (namely, anti-centromere, anti–topoisomerase I [anti–Scl-70], anti–RNA polymerase III). Each of the above criteria was weighted differently, as per ACR/EULAR guidelines: for patients to be classified as having definite SSc, a total score of ≥ 9 had to be reached [10]. Scleroderma-mimicking conditions, including nephrogenic sclerosing fibrosis, generalized morphea, eosinophilic fasciitis, scleredema diabeticorum, scleromyxedema, erythromyalgia, porphyria, lichen sclerosis, graft-versus-host disease, diabetic cheiroarthropathy, were also considered in the differential diagnosis and excluded if recognized. Further exclusion criteria were HBV and/or HCV infection, alcoholism, autoimmune liver diseases, liver cirrhosis, malignancy, cardiac disease, or dialysis. All patients provided written informed consent for data storage and analysis. The study was carried out in accordance with the Declaration of Helsinki and its later amendments and was approved by the ethics committee of the teaching hospital of “Luigi Vanvitelli” University of Campania, Naples, Italy.

2.2. Clinical Features and Visceral Involvement

All patients underwent physical examination and treatment of SSc as appropriate. The following parameters were recorded: height, weight, body mass index (BMI), extent of cutaneous involvement, presence of telangiectasias, calcinosis, digital ulcers, pitting scars, Raynaud’s phenomenon, arthritis, esophageal involvement (X-ray hypomotility, with or without dysphagia), and scleroderma renal crisis (proteinuria > 300mg/24 h). Pulmonary involvement, with a particular focus on fibrosis, was also carefully investigated by means of high-resolution computed tomography (HRCT), spirometry (to search for a restrictive pulmonary function test pattern) and diffusing lung capacity for carbon monoxide (DLCO). M-mode, two-dimensional (2D), and color Doppler flow conventional echocardiography was also carried out in all patients to evaluate pulmonary systolic hypertension (PAPs) and diastolic dysfunction through transmitral E/A ratio (E/A) assessment. Fifty-four of the 59 patients underwent nailfold videocapillaroscopy (NVC) and the following patterns were used for classification [11]: (1) early NVC pattern (E), which included few capillary haemorrhages and enlarged/giant capillaries, a relatively well-preserved capillary distribution, and no evident loss of capillaries; (2) active NVC pattern (A), characterized by frequent giant capillaries and capillary haemorrhages, a moderate loss of capillaries, a mildly disorganized capillary architecture, some avascular areas, and absent/mild ramified capillaries; and (3) late NVC pattern (L), typically represented by irregular enlargement of the capillaries, few/absent giant capillaries, no evidence of haemorrhages, severe loss of capillaries and large avascular areas, a harshly disorganized normal capillary array, and frequent ramified/bushy capillaries [11]. SSc disease activity was assessed according to the criteria proposed by Valentini et al. [12], which allow disease activity assessment in the global SSc population, as well as in the two main subsets, namely, diffuse and limited SSc [3].

2.3. Serological Parameters

The following serological markers were evaluated using established techniques: antinuclear antibodies (ANAs, by indirect immunofluorescence on the Hep-2 cell line, with results expressed in titers and patterns), anti-extractable nuclear antigens (ENAs), including anti-topoisomerase (anti-Scl 70), anti-centromere (ACA), anti-RNA polymerase III (RNA Pol III); complement C3 and C4; inflammatory markers, such as C-reactive protein (CRP) and erythrocyte sedimentation rate (ESR); total cholesterol, LDL and HDL cholesterol, triglycerides; vitamin D. All patient sera were internally processed at the laboratories of “Luigi Vanvitelli” University of Campania teaching hospital, which are subjected to periodic quality control assessments, thus ensuring reliability of results and comparisons.

2.4. Procedures

Anthropometric clinical data and blood samples were collected on the same date of TE examination. FibroScan® Mini+ 430 powered with CAP (Echosens SA, France) was used for the present study (Figure 1). FibroScan®, powered with CAP (i.e., controlled attenuation parameter), is a non-invasive and not expensive diagnostic tool able to evaluate liver fibrosis by stiffness (rigidity) measurement, expressed in kiloPascals (kPa), and is able to quantify hepatic steatosis with good accuracy [13,14,15,16]. The TE technique and procedure have improved over time [8,9]. At the beginning, it relied on a transient mechanical vibration, which was used to create a distortion in the tissue (share wave) by vibrating the skin through a motor. Young's modulus, deduced under hypothesis of homogeneity, isotropy, and pure elasticity (E=3ρV²), reproduced an image of the motion of that distortion as it passed deeper into the body using a 1D ultrasound beam, and provided a quantitative one-dimensional (i.e., a line) image of "tissue" stiffness. As this technique improved, a specific implementation of 1D transient elastography, called vibration-controlled transient elastography, was developed to assess average liver stiffness which correlated with liver fibrosis assessed by liver biopsy. Finally, a further implementation led to the possibility of evaluating the CAP, which was firstly validated as an estimate of ultrasonic attenuation at 3.5 MHz using Field II simulations and tissue-mimicking phantoms [8,9].
The quality of TE is based on the congruence of ten measurements [17]. In particular, an interquartile range <30% represents a reliable test threshold according to the manufacturer's instructions. TE is a reproducible test, however, there are some elements to consider when carrying out the exam. Some points of the liver parenchyma, especially those closer to the capsule or vascular structures, have an altered LS; moreover, failure to comply with fasting can also lead to an overestimation of LS. In this case, the TE value may not be correct despite a low IQR [17]. In addition, the different physical conformation of the rib cage, the presence of excessive fat, and the different hepatic volumes are elements that may affect the correct identification of the suitable intercostal space and the distance from the anterior or middle axillary line as points on which to lay the probe for the ten measurements [17,18]. In this regard, the use of the ultrasound probe to identify an optimal measurement point is a modality that can offer advantages [19]. The latest generation of FibroScan® instruments have a standard ultrasound probe on board that allows the visualization of the liver segment on which to perform the measurement [20]. An additional parameter to consider for maintaining a high quality of the examination is the elastogram pattern that appears on the screen for each measurement. Three categories have been described based on the length of the graphic representation and shear wave dispersal (level of parallelism displayed in the elastogram) [21]. A comparison with biopsy data showed that the diagnostic accuracy of TE was significantly greater if based on the quality of each individual measurement.
Another important element that can affect the quality of the examination is the subcutaneous fat related to the condition of overweight/obesity. In this case, an excessive thickness of subcutaneous fat increases the distance between the skin surface and the liver capsule. In such circumstances, clinical studies have shown that the use of the XL probe improves the accuracy of LS in difficult patients with body mass index (BMI) >28 [22,23]. In light of these data, training in the use of FibroScan should always include knowledge of all cofactors that can impact performance. Interoperator variability and low IQR/M should be taken into account along with the other elements described above.
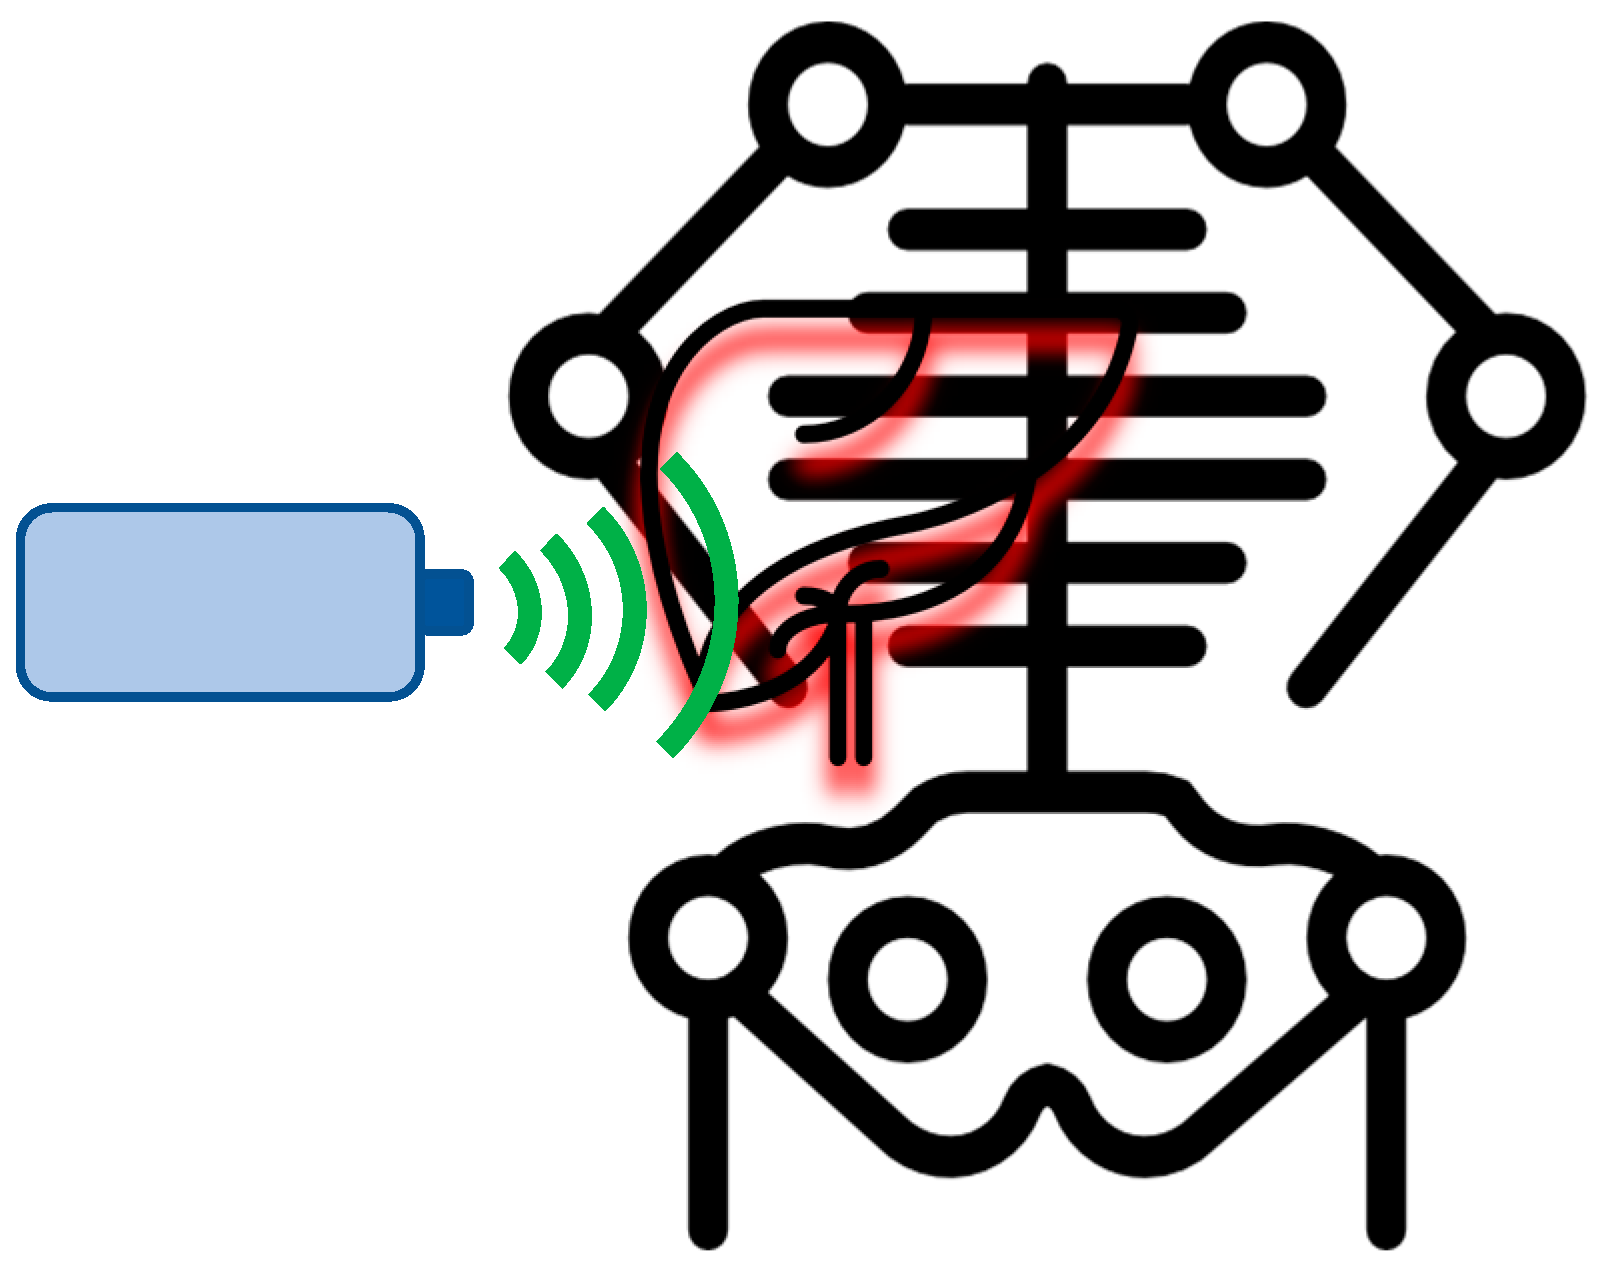
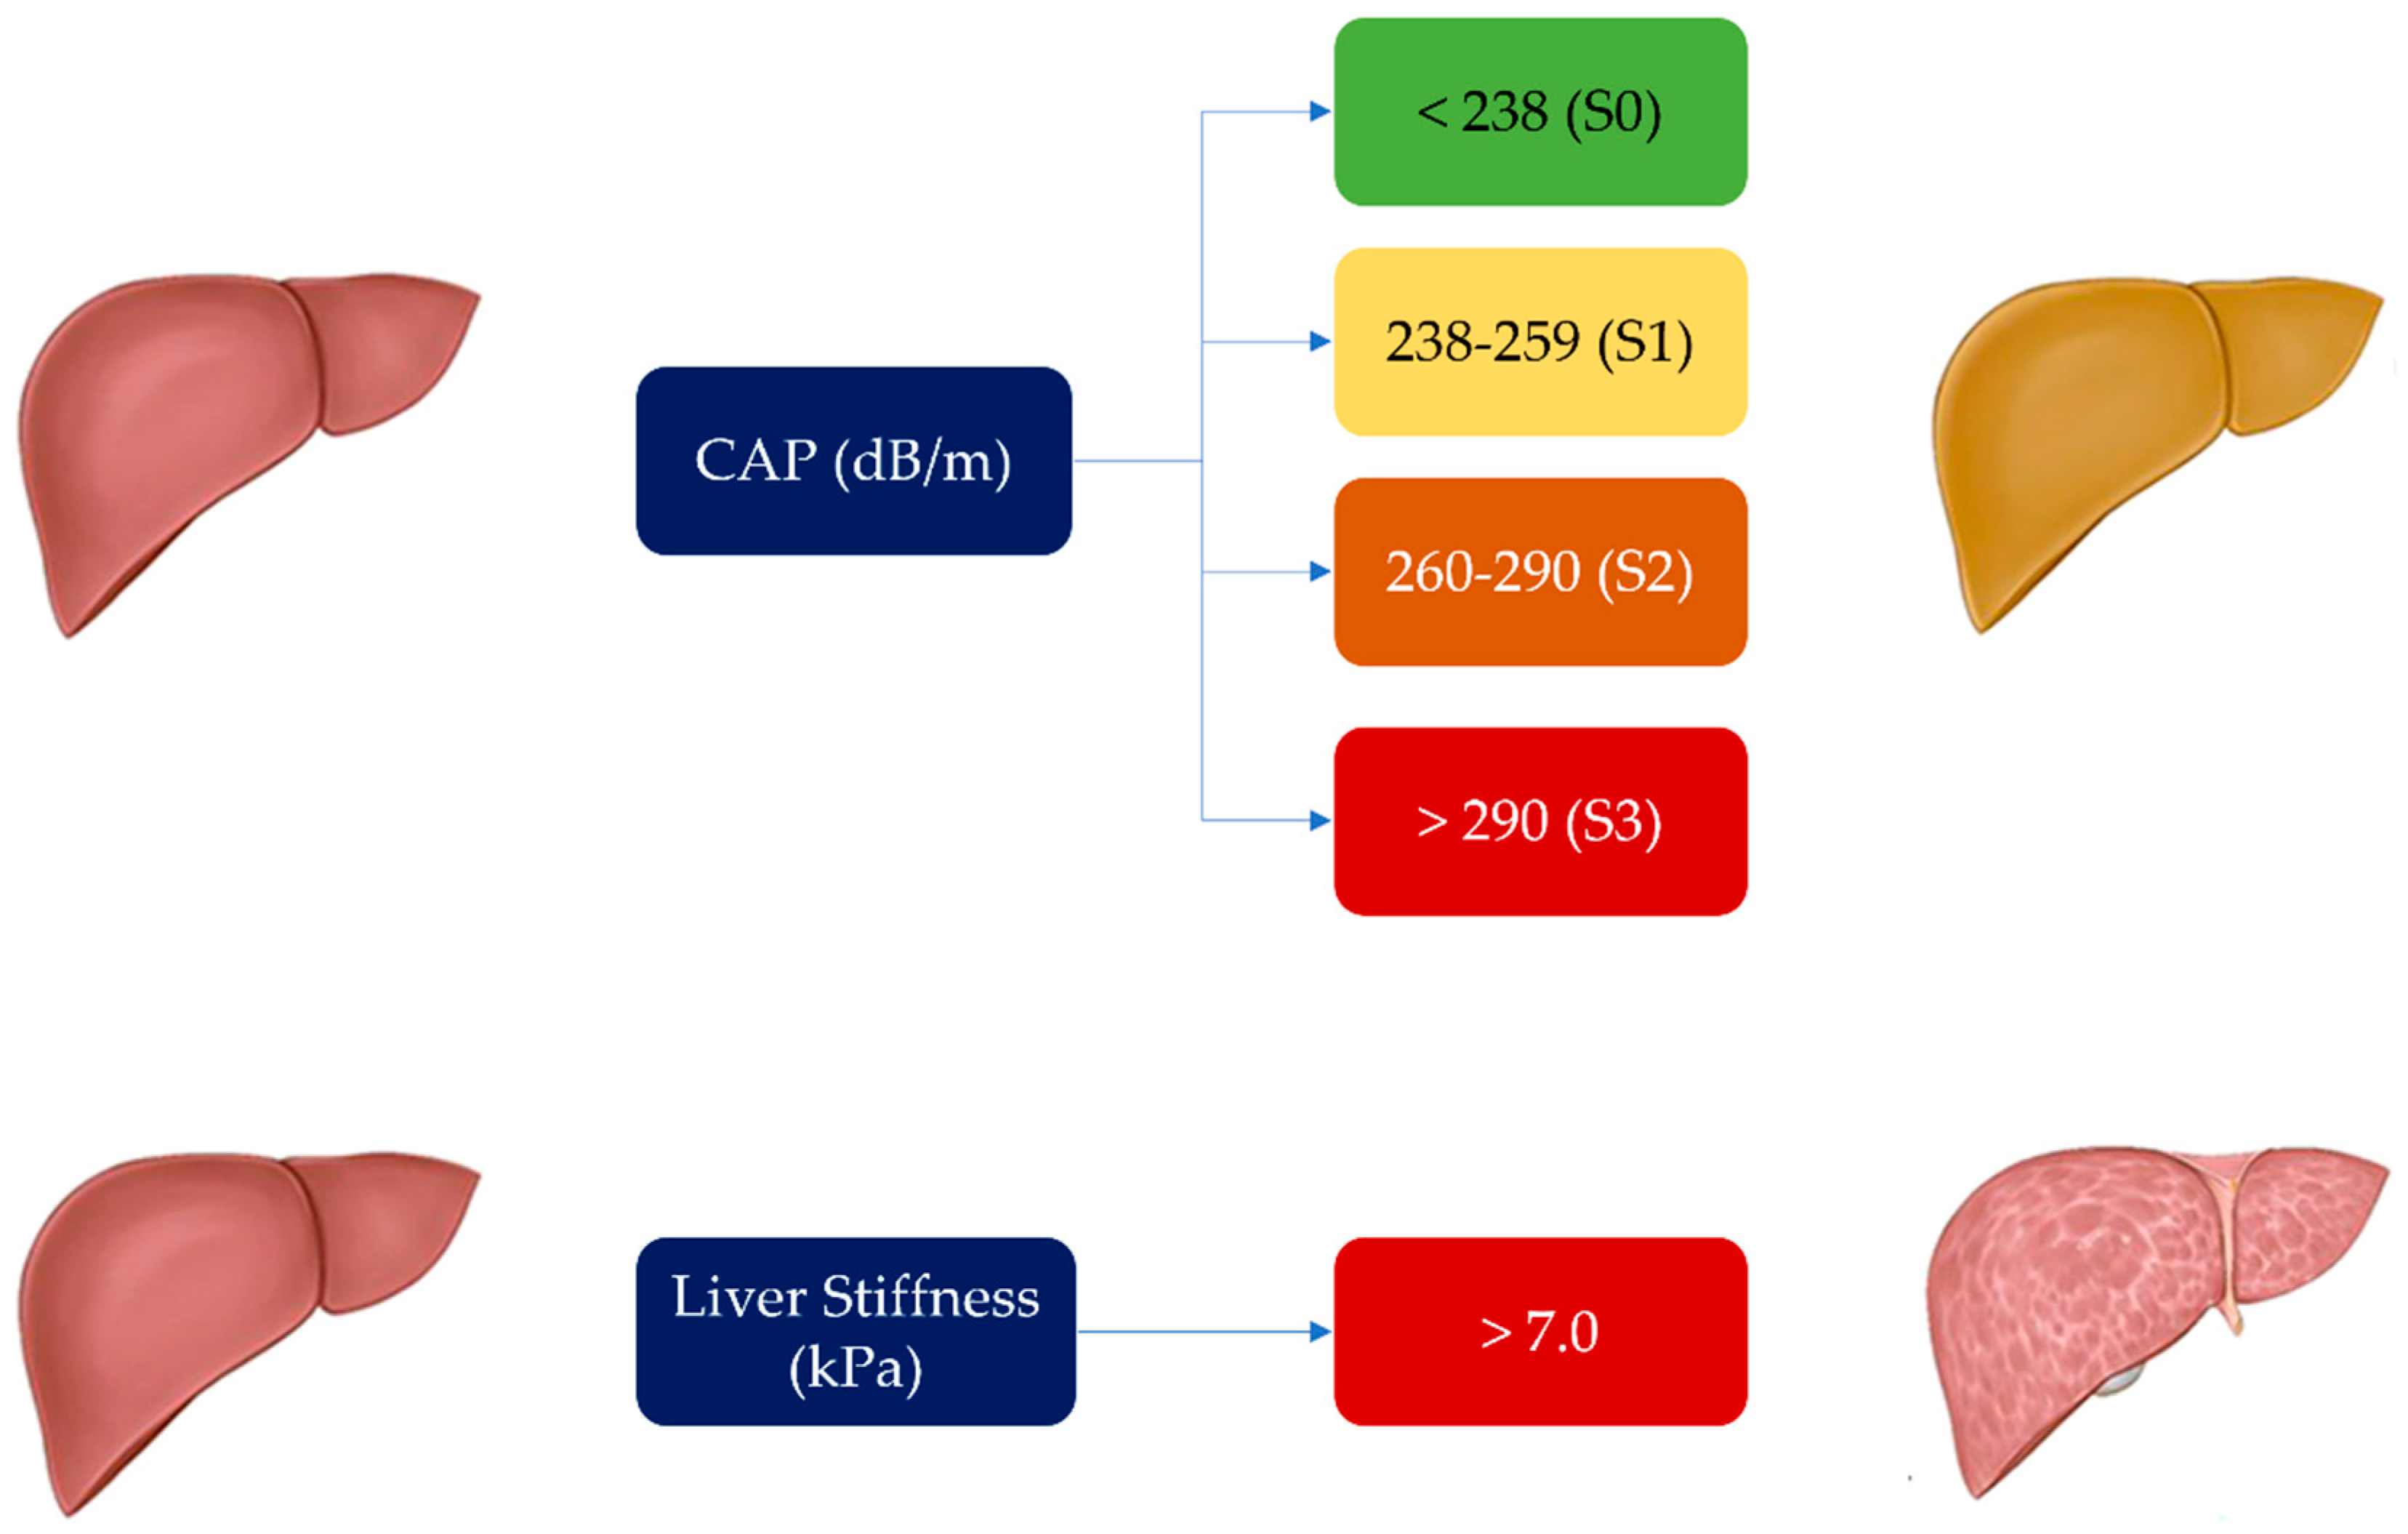
In this study, CAP and liver stiffness were measured by the same experienced operator aware of all the issues and pitfalls discussed above. An M probe (3.5 MHz) was used, which was placed on the skin in the intercostal space over the right lobe of the liver (Figure 2). The XL probe was not needed, as the median BMI in our patient population was 24.77 (Table 1). Patient preparation involved a 6-hour fasting preceding the examination (drink was allowed, but only non-carbonated beverages were permitted). As per good practice, liver stiffness was calculated over at least 10 valid measurements, with a ratio of the interquartile range (IQR) to the median of the liver stiffness (IQR/Median) of ≤25% [24,25,26]. Notably, CAP, through the SmartExam program, was continuously computed during the entire examination until the CAP gauge reached 100%. The hepatic steatosis grade was defined by CAP cut-off values previously established. A CAP value < 238 dB/m denoted absence of steatosis (S0), CAP values ≥238 ≤ 259 dB/m denoted mild steatosis (grade S1), CAP values ≥260 ≤ 290 dB/m denoted moderate steatosis (grade S2), and CAP values ≥291 dB/m denoted severe steatosis (grade S3). The cut-off value for severe hepatic fibrosis was set at > 7.0 kPa [27,28,29,30,31]. Patients were classified as having no fibrosis (F0, LS <5.2 kPa), mild to moderate fibrosis (F1-2, LS between 5.2 and 7 kPa), and severe fibrosis (F3, LS values >7 kPa) (Figure 3).

2.5. Statistical Analysis

Anthropometric, clinical, biochemical, and instrumental data were registered in a database and analyzed with MedCalc v.18.10.2 (MedCalc Software, Mariakerke, Belgium). For continuous variables, the measures of centrality and dispersion were medians and interquartile ranges (IQR). The rank correlation Spearman’s rho test was used to analyze the association between categorical variables. All variables found to have at least a trend (p value ≤ 0.10), suggesting an association with liver fibrosis or liver steatosis via univariate analysis, were entered into a multivariate logistic regression model with a stepwise approach. The threshold for statistical significance was set at p <0.05 (two-tailed).

3. Results

Clinical and demographic features of the 59 patients recruited in the study are detailed in Table 1. The median age of patients (53 women, 89.8%) was 51 years (range 20-80) and the median disease duration was 6 years (range 1-17). Clinical subsets of disease were as follows: 16 patients (27.1%) had a sine-scleroderma phenotype, 35 patients (59.3%) were classified as limited SSc, diffuse SSc was observed in 8 patients (13.5%).
Overall, 33 patients (55.9%) had gastrointestinal involvement, 20/57 patients (35%) had interstitial lung disease and 1/53 patients (1.9%) was diagnosed with pulmonary hypertension; only one patient (1.9%) displayed digital ulcers. With regard to SSc treatment, 32 patients (54.2%) were on immunosuppressants (14 patients on azathioprine and 18 patients on mycophenolate), 12 patients (20.3%) were receiving hydroxychloroquine, 38 patients (64.4%) were taking steroids (prednisone dose ≥ 5 mg and ≤10 mg) at the time of the evaluation.
According to the capillaroscopic pattern [11], 24 patients (44.4%) showed an early pattern, 15 patients (27.8%) had an active pattern, 6 patients (11.1%) presented with a late pattern, whereas 9 patients (16.7%) displayed nonspecific alterations.
Autoantibody prevalence was as follows: 20 patients (33.9%) tested positive for anti-centromere antibodies, 24 patients (40.7%) had Scl-70 antibodies, 5 patients (8.5%) were positive for RNA polymerase III autoantibodies, and 10 patients (16.9%) did not show any conventional autoantibody.
Concerning liver fibrosis, a median LS of 4.5 (2.9–8.3) kPa was recorded. Forty-one patients (69.5%) had no fibrosis (F0), 16 patients (27.1%) showed LS values between 5.2 and 7, 2 patients (3.4%) displayed LS values >7 (F3), suggesting significant liver fibrosis. For liver steatosis, the median CAP value was 223 dB/m (IQR: 164–343). In detail, 39 patients (66.1%) showed CAP values <238, consistent with no steatosis, 9 patients (15.2%) had CAP values ≥238 ≤259, reflecting mild (S1) steatosis, 8 (13.5%) patients had moderate (S2) steatosis, as suggested by CAP values ≥260 to ≤290, while 3 patients (5.1%) were deemed to harbor severe steatosis (S3), due to CAP values ≥291.
Table 2 shows the univariate analysis results according to LS and CAP findings. Briefly, gender (p=0.013), HDL-cholesterol (p=0.014), triglycerides (p= 0.006) and telangectasias (p=0.045) were all significantly associated with LS values, while activity index (p=0.007), PAPs (p=0.023), E/A (p=0.002), BMI (p<0.0001), age (p<0.0001), and MMF (p=0.013) were all significantly associated with CAP values.
According to multiple regression analysis by the stepwise method, only high triglyceride levels were significantly correlated with liver fibrosis in SSc patients (p=0.02); conversely, BMI and age were shown to be significantly correlated with liver steatosis (p=0.023 and p=0.022).

4. Discussion

Fibrosis is the pathological hallmark underlying much of the morbidity and mortality associated with SSc and should therefore be regarded as a lethal component of the disease [32]. The other two key features of SSc are immunological abnormalities and vasculopathy. The interplay between these factors likely results in the pathological changes seen in SSc [32,33]. However, sorting out the role of each mechanism in determining SSc pathogenesis has been thus far a daunting task. Indeed, several experimental observations have suggested immune dysregulation as a cause of, or at least a contributor to, fibrosis in SSc; on the other hand, fibrosis has also been shown to contribute to aberrant immune cell activation [32,33]. Besides, both immune abnormalities and fibrosis are also linked to vasculopathy in SSc, with vascular damage too shown as an activator of immune cells in experimental models. Whatever the mechanism, persistent fibroblast activation and increased myofibroblast differentiation lead to excessive extracellular matrix deposition, and, in turn, distortion of tissue architecture, impairment of organ function and, eventually, organ failure [32,33]. Fibrosis in SSc occurs mainly in the skin but may progress to visceral organs, particularly the heart, the lungs, and the gastrointestinal system [3]. With regard to the latter, the gastrointestinal tract is indeed the most commonly affected internal organ in SSc, since up to 90% of patients experience symptoms related to upper and/or lower gastrointestinal dysmotility, which may be associated with significant morbidity and mortality [34]. Specifically, esophageal dysmotility is often one of the earliest features of SSc, and may present with symptoms of dysphagia, heartburn, and regurgitation; gastric involvement may present with symptoms of gastroparesis (i.e., early satiety, bloating, and regurgitation), while small intestine involvement may be suggested by symptoms of small intestinal dysmotility (e.g. distention, bloating), small intestinal bacterial overgrowth, or both. Finally, constipation and fecal incontinence may suggest colon and anorectal involvement [34]. Conversely, distortion of the hepatic architecture by fibrosis in SSc patients has not been adequately investigated. This may be explained by the fact that autoimmune hepatobiliary conditions represent the best known liver comorbidities affecting SSc patients [6,7] and because of the need for invasive procedures (i.e., liver biopsy) to secure the diagnosis. The availability of transient elastography has now changed this scenario, as it allows for easy noninvasive measurement of liver fibrosis, as well as steatosis, with results that have been shown to agree with pathological examination of liver tissue following hepatic biopsy [21]. This study therefore aimed at assessing the prevalence and predictors of significant liver fibrosis and steatosis in SSc patients by means of TE. We speculated that liver fibrosis may possibly be found in SSc patients, even if asymptomatic or in absence of liver biochemistry test alterations. The reasons behind our hypothesis lie in the widespread involvement of organs and tissues in SSc patients as well as on the assumption that some of the known organ fibrotic changes may be asymptomatic for years: for instance, lung fibrosis may be detected through HRCT and/or DLCO even in asymptomatic patients [3]. Finally, it may also be hypothesized that fibrosis in the liver may not become symptomatic because it progresses slower than in other organs or the patients may die of other complications before liver fibrotic changes become clinically apparent. Indeed, consistent with our hypothesis, most patients in our cohort displayed only moderate liver fibrosis. Specifically, we found that the prevalence of significant liver fibrosis (F3) was relatively low (3.4%), but moderate liver fibrosis (F1-F2) was relatively high (27.1%). Our data are consistent with previously published data, reporting a prevalence of 1-9% for significant liver fibrosis in SSc patients [6,35,36]. The prevalence of significant liver fibrosis may appear to be low, considering that SSc is characterized by fibrosis involving several tissues and organs. Again, as hypothesized above, the degree of fibrosis may nonetheless depend on the different rate of progression in different tissues. It should be also remembered, however, that patients with viral hepatitis, drug or alcohol abuse, or other causes of significant liver disease, including autoimmune hepatobiliary conditions, were excluded from the study.
In real clinical settings, when SSc patients show no evidence of liver disease or abnormalities in liver laboratory tests, the possibility of fibrosis is typically ignored. Our study, however, suggests that moderate fibrosis may still be detected even if clinically silent.
In this study, the association between LS and CAP values and the epidemiological and clinical features of SSc patients was also investigated. Regarding LS, only high serum triglyceride levels correlated with liver fibrosis. This is not surprising, since this factor is a known predictor of fibrosis development in the general population as well, as lipids are mainly stored as triglycerides, an inert and non-cytotoxic form of lipids, in the liver [37].
We also evaluated the possible effects of concurrent immunosuppressive drug therapy on liver fibrosis. However, we did not find any relevant effects of these drugs on liver fibrosis or steatosis risk, presumably due to the limited number of patients in our cohort.
With regard to liver steatosis, the estimated prevalence of severe steatosis, as per CAP values above 291dB/m, was around 5.1% and did not differ from that of the general population [29]. Moderate (S2) steatosis was recorded in 13,5% of patients. The predictors of liver steatosis were found to be the same as those involved in otherwise healthy subjects [31]. Interestingly, although an elevated BMI was recognized as a predictor of liver steatosis, the median BMI in our SSc population was 24.77 [18.93-36.51], similar to that of the general Italian population, as recently reported by Maffoni et al (22.5, IQR: 20.3–25.2) [38]. According to multiple regression analysis with stepwise method, only BMI and age were significantly correlated with liver steatosis. Again, we also evaluated the possible effects of concurrent immunosuppressive drug therapy on liver steatosis risk. Although linear regression identified use of MMF as a possible risk factor for steatosis, multiple regression analysis did not confirm this association.
In conclusion, we reported a low prevalence of marked fibrosis (3.4% of patients), which is the same as that expected in the general population, in our SSc patient population. Moderate fibrosis, affecting a larger proportion of our patients, may be nonetheless a SSc “signature”, albeit asymptomatic. Likewise, the prevalence of significant steatosis was low and related to the same variables associated with steatosis in the general population.
In the medical literature, only few studies have investigated the prevalence of liver fibrosis in the general population and an accurate LS cut-off value in this population has not yet been established; therefore, prevalence estimates vary depending on the chosen LS value. Koehler et al [39] reported a 5.6% prevalence of liver fibrosis, with a cut-off value of 8.0 kPa, in 3040 subjects older than 45 years in Rotterdam. In a study from Hong Kong, the estimated prevalence among 922 subjects aged 18 to 72 years was 2%, with a cut-off of 9.6 kPa [40]. Finally, in a study from France, including 1358 subjects older than 45 years, the estimated prevalence was 7%, with a predefined cut-off value of 8 kPa [41]. In all 3 studies, the most common cause of liver disease was non-alcoholic fatty liver disease (NAFLD). Although we found a low prevalence of marked fibrosis, our study suggests that TE is a valuable method for detecting significant liver fibrosis in subjects with no known liver disease and is useful for screening of liver fibrosis in SSc patients. Finally, since liver steatosis in our SSc patients appeared to be favoured by the same factors that increase the risk in the general population, the same preventive and therapeutic measures for fatty liver disease should be advised [42].
There are, of course, some limitations of our study that need to be acknowledged. The first one is the small sample size of our patient population, although the rarity of SSc may be at least a partial justification for this issue; multicentre studies would be needed to sum up significant numbers of patients. In addition, the cross-sectional design did not allow us to draw conclusions about the variations in liver involvement over time.

5. Conclusions

Based on the findings of the current study, SSc patients do not appear to be at risk of significant liver fibrosis, despite fibrotic changes are usually detected in several other organs and tissues in patients affected by this disease, and moderate fibrosis may still be found in the liver. Likewise, liver steatosis in SSc patients appears to be a consequence of the same predisposing factors acting on the general population. Therefore, SSc patients should abide by the same preventive and therapeutic measures suggested for the reduction of the impact of NAFLD in the general population [42]. Finally, TE has been shown to be a valuable diagnostic procedure for screening and detection of liver fibrosis in SSc patients, with no known concomitant liver disease due to different etiologies (viral, alcoholic, etc.).

Author Contributions

Conceptualization, C.I., C.D.V., L.R. and G.C.; investigation, A.C., R.G., C.I., C.DV, P.R., D.P. and G.C.; formal analysis, G.C.; writing—original draft preparation, C.R. and G.C.; writing—review and editing, A.C., R.G., R.F., C.DV; L.R.; F.C.S. and G.C.; supervision, C.R., and G.C. All authors have read and agreed to the published version of the manuscript.

Funding

none.

Institutional Review Board Statement

This study was approved by the Ethics Committee of “Luigi Vanvitelli” University of Campania teaching hospital (prot. 0005382/i 17.02.2022).

Informed Consent Statement

Informed consent was obtained from all subjects involved in the study.

Data Availability Statement

Raw data are available from the corresponding author upon reasonable request.

Conflicts of Interest

The authors declare no conflict of interest.

References

  1. Varga J, Trojanowska M, Kuwana M (2017) Pathogenesis of systemic sclerosis: recent insights of molecular and cellular mechanisms and therapeutic opportunities. J Scleroderma Relat Disord 2:137–152. [CrossRef]
  2. Korman B. Evolving insights into the cellular and molecular pathogenesis of fibrosis in systemic sclerosis. Transl Res. 2019 Jul;209:77-89. Epub 2019 Feb 23. PMID: 30876809; PMCID: PMC6545260. [CrossRef]
  3. Denton, C.P.; Khanna, D. Systemic sclerosis. Lancet 2017, 390, 1685–1699.
  4. Lee, S.W.; Kim, B.K.; Park, J.Y.; et al. Disease duration and Medsger’s severity score are associated with significant liver fibrosis in patients with systemic sclerosis. Clin. Exp. Rheumatol. 2015, 33, S68–S74.
  5. Bergmann C, Distler JH. Epigenetic factors as drivers of fibrosis in systemic sclerosis. Epigenomics. 2017 Apr;9(4):463-477. Epub 2017 Mar 27. PMID: 28343418. [CrossRef]
  6. Efe C, Ozaslan E, Nasiroglu N, Tunca H, Purnak T, Altiparmak E. The development of autoimmune hepatitis and primary biliary cirrhosis overlap syndrome during the course of connective tissue diseases: report of three cases and review of the literature. Dig Dis Sci. 2010;55:2417-21. [CrossRef]
  7. Marí-Alfonso B, Simeón-Aznar CP, Guillén-Del Castillo A, Rubio-Rivas M, Trapiella-Martínez L, Todolí-Parra JA, Rodríguez Carballeira M, Marín-Ballvé A, Iniesta-Arandia N, Colunga-Argüelles D, Castillo-Palma MJ, Sáez-Comet L, Egurbide-Arberas MV, Ortego-Centeno N, Freire M, Vargas Hitos JA, Chamorro AJ, Madroñero-Vuelta AB, Perales-Fraile I, Pla-Salas X, Fernández-De-La-Puebla RA, Fonollosa-Pla V, Tolosa-Vilella C; RESCLE Investigators; Systemic Autoimmune Diseases Study Group (GEAS). Hepatobiliary involvement in systemic sclerosis and the cutaneous subsets: Characteristics and survival of patients from the Spanish RESCLE Registry. Semin Arthritis Rheum. 2018;47:849-857. [CrossRef]
  8. Barr R, Ferraioli G, Palmeri M, et al. (2016) Elastography assessment of liver fibrosis: society of radiologists in ultrasound consensus conference statement. Ultrasound Q 32(2):94–107. [CrossRef]
  9. Vetrano E, Rinaldi L, Mormone A, Giorgione C, Galiero R, Caturano A, Nevola R, Marfella R, Sasso FC. Non-alcoholic Fatty Liver Disease (NAFLD), Type 2 Diabetes, and Non-viral Hepatocarcinoma: Pathophysiological Mechanisms and New Therapeutic Strategies. Biomedicines. 2023 Feb 6;11(2):468. PMID: 36831004; PMCID: PMC9953066. [CrossRef]
  10. van den Hoogen F, Khanna D, Fransen J, et al. 2013 classification criteria for systemic sclerosis: an American college of rheumatology/European league against rheumatism collaborative initiative..Ann Rheum Dis. 2013 Nov;72(11):1747-55. [CrossRef]
  11. Cutolo M, Sulli A, Pizzorni C, et al. Nailfold videocapillaroscopy assessment of microvascular damage in systemic sclerosis. J Rheumatol 2000; 27: 155–160.
  12. Valentini G, Della Rossa A, Bombardieri S, et al. European multicentre study to define disease activity criteria for systemic sclerosis. II. Identification of disease activity variables and development of preliminary activity indexes. Ann Rheum Dis 2001; 60(6): 592–598.
  13. European Association for Study of Liver; Asociacion Latinoamericana para el Estudio del Higado. EASL-ALEH Clinical Practice Guidelines: Non-invasive tests for evaluation of liver disease severity and prognosis. J Hepatol. 2015 Jul;63(1):237-64. Epub 2015 Apr 21. PMID: 25911335. [CrossRef]
  14. Valente G, Rinaldi L, Moggio G, Piai G. Point shear wave elastography and vibration controlled transient elastography for estimating liver fibrosis in a cohort of liver transplant patients. Eur Rev Med Pharmacol Sci. 2020 Jul;24(13):7357-7365. PMID: 32706074. [CrossRef]
  15. Tsochatzis EA, Gurusamy KS, Ntaoula S, Cholongitas E, Davidson BR, Burroughs AK. Elastography for the diagnosis of severity of fibrosis in chronic liver disease: a meta-analysis of diagnostic accuracy. J Hepatol. 2011 Apr;54(4):650-9. Epub 2010 Sep 24. PMID: 21146892. [CrossRef]
  16. Boursier J, Vergniol J, Guillet A, Hiriart JB, Lannes A, Le Bail B, Michalak S, Chermak F, Bertrais S, Foucher J, Oberti F, Charbonnier M, Fouchard-Hubert I, Rousselet MC, Calès P, de Lédinghen V. Diagnostic accuracy and prognostic significance of blood fibrosis tests and liver stiffness measurement by FibroScan in non-alcoholic fatty liver disease. J Hepatol. 2016 Sep;65(3):570-8. Epub 2016 May 2. PMID: 27151181. [CrossRef]
  17. Boursier J, Decraecker M, Bourlière M, Bureau C, Ganne-Carrié N, de Lédinghen V. Quality criteria for the measurement of liver stiffness. Clin Res Hepatol Gastroenterol 2022; 46: 101761. [CrossRef]
  18. Kim SU, Kim JK, Park JY, Ahn SH, Lee JM, Baatarkhuu O, Choi EH, Han KH, Chon CY, Kim DY. Variability in liver stiffness values from different intercostal spaces. Liver Int 2009; 29: 760–766. [CrossRef]
  19. Lee J, Kang HJ, Yoon JH, Lee JM. Ultrasound-guided transient elastography and two-dimensional shear wave elastography for assessment of liver fibrosis: emphasis on technical success and reliable measurements. Ultrasonography 2021; 40: 217-227. [CrossRef]
  20. Gatos I, Yarmenitis S, Theotokas I, Koskinas J, Manesis E, Zoumpoulis SP, Zoumpoulis PS. Comparison of Visual Transient Elastography, Vibration Controlled Transient Elastography, Shear Wave Elastography and Sound Touch Elastography in Chronic liver Disease assessment using liver biopsy as 'Gold Standard'. Eur J Radiol 2022; 157: 110557. [CrossRef]
  21. Mendes LC, Ferreira PA, Miotto N, Zanaga L, Gonçales ESL, Pedro MN, Lazarini MS, Júnior FLG, Stucchi RSB, Vigani AG. Elastogram quality assessment score in vibration-controlled transient elastography: Diagnostic performance compared to digital morphometric analysis of liver biopsy in chronic hepatitis C. J Viral Hepat 2018; 25: 335-343. [CrossRef]
  22. Harris R, Card TR, Delahooke T, Aithal GP, Guha IN. The XL probe: A luxury or a necessity? Risk stratification in an obese community cohort using transient elastography. United European Gastroenterol J 2018; 6: 1372-1379. [CrossRef]
  23. Xia B, Wang F, Friedrich-Rust M, Zhou F, Zhu J, Yang H, Ruan W, Zeng Z. Feasibility and Efficacy of Transient Elastography using the XL probe to diagnose liver fibrosis and cirrhosis: A meta-analysis. Medicine (Baltimore) 2018; 97: e11816 [PMID: 30278481. [CrossRef]
  24. Singh S, Muir AJ, Dieterich DT, Falck-Ytter YT. American Gastroenterological Association Institute Technical Review on the Role of Elastography in Chronic Liver Diseases. Gastroenterology. 2017 May;152(6):1544-1577. PMID: 28442120. [CrossRef]
  25. Tapper EB, Castera L, Afdhal NH. FibroScan (vibration-controlled transient elastography): where does it stand in the United States practice. Clin Gastroenterol Hepatol. 2015 Jan;13(1):27-36. [CrossRef]
  26. Castera L. Noninvasive methods to assess liver disease in patients with hepatitis B or C. Gastroenterology. 2012 May;142(6):1293-1302.e4. PMID: 22537436. [CrossRef]
  27. Sasso M, Beaugrand M, de Ledinghen V, Douvin C, Marcellin P, Poupon R, Sandrin L, Miette V. Controlled attenuation parameter (CAP): a novel VCTE™ guided ultrasonic attenuation measurement for the evaluation of hepatic steatosis: preliminary study and validation in a cohort of patients with chronic liver disease from various causes. Ultrasound Med Biol. 2010 Nov;36(11):1825-35. Epub 2010 Sep 27. PMID: 20870345. [CrossRef]
  28. Eddowes PJ, Sasso M, Allison M, Tsochatzis E, Anstee QM, Sheridan D, Guha IN, Cobbold JF, Deeks JJ, Paradis V, Bedossa P, Newsome PN. Accuracy of FibroScan Controlled Attenuation Parameter and Liver Stiffness Measurement in Assessing Steatosis and Fibrosis in Patients With Nonalcoholic Fatty Liver Disease. Gastroenterology. 2019 May;156(6):1717-1730. Epub 2019 Jan 25. PMID: 30689971. [CrossRef]
  29. Kim JK, Lee KS, Choi JR, Chung HJ, Jung DH, Lee KA, Lee JI. Usefulness of the controlled attenuation parameter for detecting liver steatosis in health checkup examinees. Gut Liver. 2015 May 23;9(3):405-10. PMID: 25717046; PMCID: PMC4413975. [CrossRef]
  30. Caturano A, Galiero R, Loffredo G, Vetrano E, Medicamento G, Acierno C, Rinaldi L, Marrone A, Salvatore T, Monda M, Sardu C, Marfella R, Sasso FC. Effects of a Combination of Empagliflozin Plus Metformin vs. Metformin Monotherapy on NAFLD Progression in Type 2 Diabetes: The IMAGIN Pilot Study. Biomedicines. 2023 Jan 23;11(2):322.
  31. Huang, Z.; Ng, K.; Chen, H.; et al. Validation of Controlled Attenuation Parameter Measured by FibroScan as a Novel Surrogate Marker for the Evaluation of Metabolic Derangement. Front. Endocrinol. 2022, 12, 739875.
  32. 32. Ho YY, Lagares D, Tager AM, Kapoor M. Fibrosis - a lethal component of systemic sclerosis. Nat Rev Rheumatol. 2014;10:390-402. [CrossRef]
  33. Brown M, O'Reilly S. The immunopathogenesis of fibrosis in systemic sclerosis. Clin Exp Immunol. 2019;195:310-321. [CrossRef]
  34. McMahan ZH, Hummers LK. Gastrointestinal involvement in systemic sclerosis: diagnosis and management. Curr Opin Rheumatol. 2018;30:533-540. [CrossRef]
  35. Assassi S, Fritzler MJ, Arnett FC et al.: Primary biliary cirrhosis (PBC), PBC autoantibodies, and hepatic parameter abnormalities in a large population of systemic sclerosis patients. J Rheumatol 2009; 36: 2250-6.
  36. D’Angelo WA, Fries JF, Masi AT, et al. Pathologic observations in systemic sclerosis (scleroderma). A study of fifty eight autopsy cases and fifty-eight matched controls. Am J Med 1969; 46: 428-40.
  37. Chiappini F., Coilly A., Kadar H., et al. Metabolism dysregulation induces a specific lipid signature of nonalcoholic steatohepatitis in patients. Sci. Rep. 2017;7:46658. [CrossRef]
  38. Maffoni, S.; Brazzo, S.; De Giuseppe, R.; et al. Lifestyle changes and body mass index during COVID-19 pandemic lockdown: An Italian online-survey. Nutrients 2021, 13, 1117.
  39. Koehler EM.; Plompen E.P.C.; Schouten JN.L; et al. Presence of diabetes mellitus and steatosis is associated with liver stiffness in a general population: The Rotterdam study Hepatology 63(1):p 138-147, January 2016. |. [CrossRef]
  40. Wong VW, Chu WC, Wong GL, et al. Prevalence of non-alcoholic fatty liver disease and advanced fibrosis in Hong Kong Chinese: a population study using proton-magnetic resonance spectros-copy and transient elastography. Gut 2012; 61:409–415.
  41. Roulot D, Costes JL, Buyck JF, et al. Transient elastography as a screening tool for liver fibrosis and cirrhosis in a community-based population aged over 45 years. Gut 2011; 60:977–984).
  42. Rinella ME, Neuschwander-Tetri BA, Siddiqui MS, Abdelmalek MF, Caldwell S, Barb D, Kleiner DE, Loomba R. AASLD Practice Guidance on the clinical assessment and management of nonalcoholic fatty liver disease. Hepatology. 2023;77:1797-1835. [CrossRef]
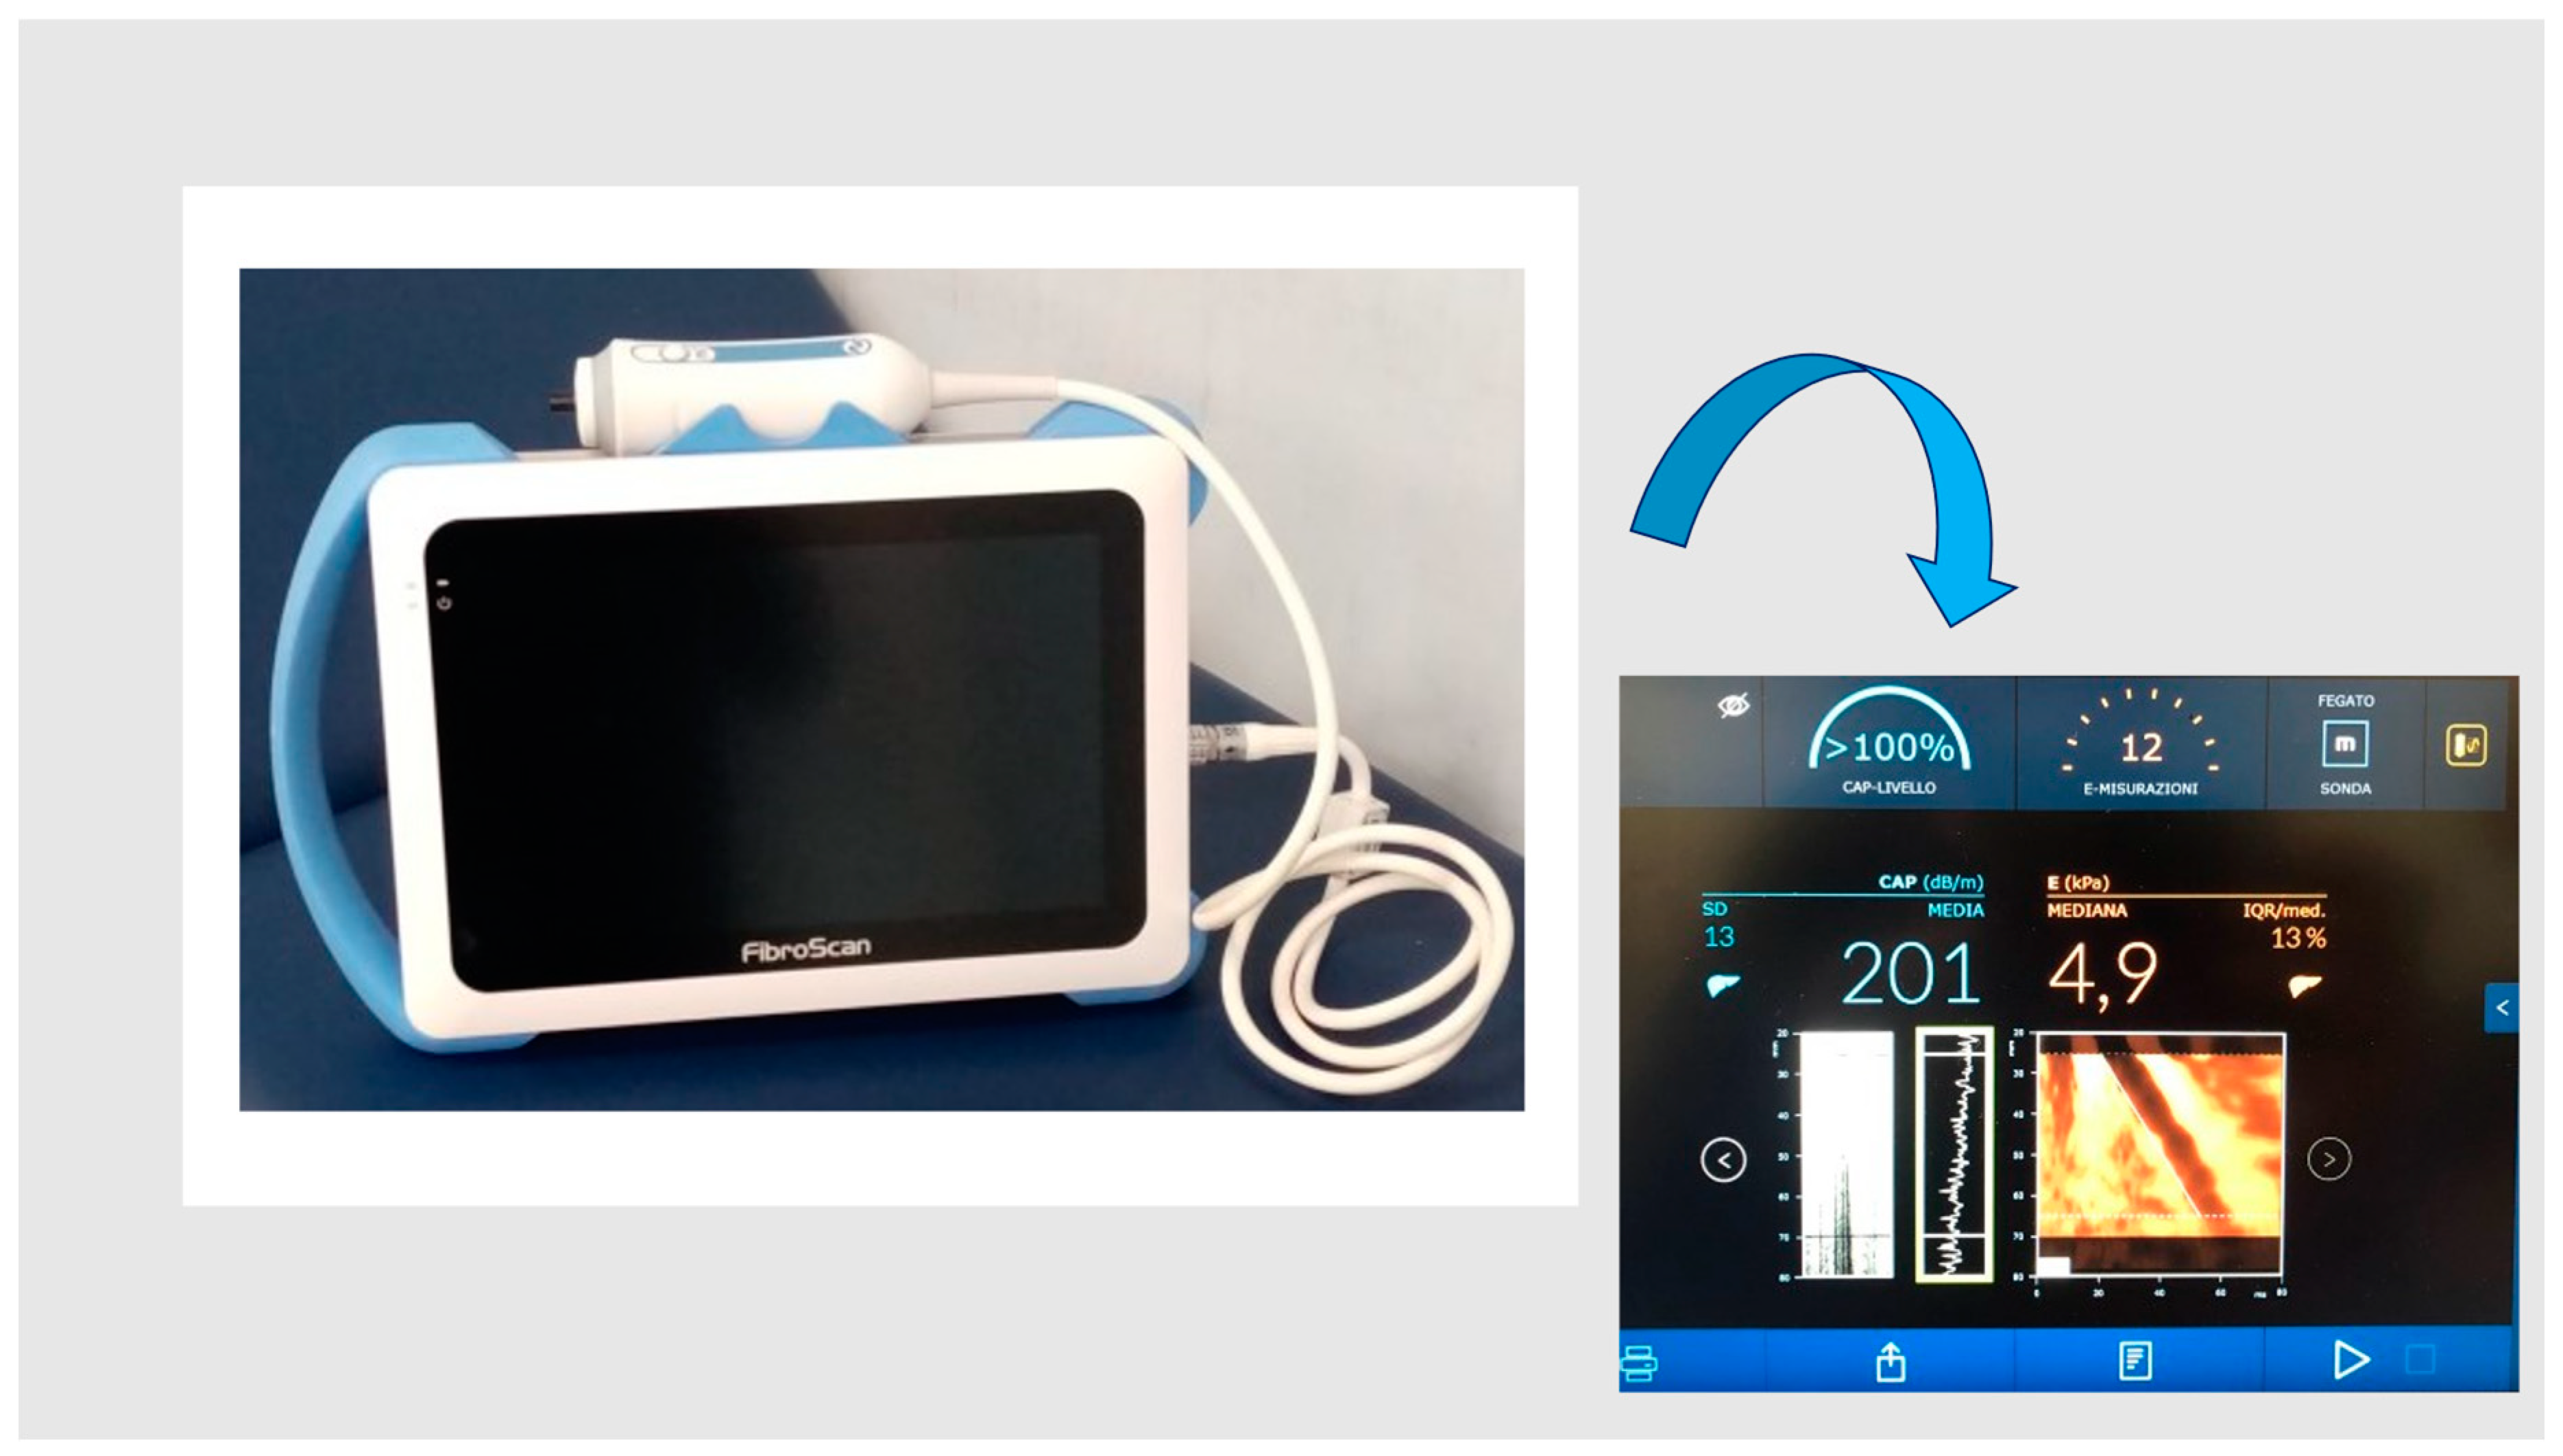
Figure 1. FibroScan® Mini+ 430.
Preprints 71758 g001
Figure 2. Schematic illustration of the noninvasive assessment of liver fibrosis and steatosis by transient elastography using the FibroScan® procedure.
Preprints 71758 g002
Figure 3. Controlled Attenuation Parameter (CAP) and liver stiffness cut-offs used for determination and degree of liver steatosis and fibrosis in our patient population.
Preprints 71758 g003
Table 1. Main characteristics of the study population (n=59).
Clinical and Epidemiological Data
Age (years), median [IQR] 51 [20–80]
Sex, n (%) M/F 6 (10.2%)/53 (89.8%)
BMI (kg/m2 ), median [IQR] 24.77 [18.93-36.51]
SSc characteristics
Duration of disease (years), median [IQR] 6 [1-17]
Activity index, median [IQR] 0.5 [0-4]
mRSS, mean (SD) 2.24 (2.95)
Cutaneous involvement, subset, n (%)
Sine
Limited
Diffuse
59 (100%)
16 (27.1%)
35 (59.3%)
8 (13.5%)
E/A ratio, n (%) normal/abnormal (54) 36 (66.6%)/18 (33.3%)
PAPs, median [IQR] 25 [0-65]
FVC, median [IQR] 98.5 [57.4–126]
DLCO, median [IQR] 85.5 [38–138]
Videocapillaroscopic pattern, n (%)
Normal
Early
Active
Late
54 (91.5%)
9 (16.7%)
24 (44.4%)
15 (27.8%)
6 (11.1)
Gastrointestinal involvement, n (%) 33 (55.9%)
Scleroderma renal crisis, n (%) -
ILD, n (%) (57 pts) 20 (35%)
ANA positive, n (%) 59 (100%)
ENA, n (%)
No autoantibodies
anti-centromere
anti-Scl70
anti-RNA polymerase III
59 (100%)
10 (16.9%)
20 (33.9%)
24 (40.7%)
5 (8.5%)
Ulcers, n (%) 1 (1.7%)
Pitting scars, n (%) 7 (11.9%)
Telangiectasias, n (%) 28 (48%)
Fibroscan results
CAP median [IQR] 223 [164-343]
LS median [IQR] 4.5 [2.9-8.3]
Concomitant therapies
Corticosteroids, n (%) 38 (64.4%)
Hydroxychloroquine, n (%) 12 (20.3%)
Immunosoppressants, n (%)
Azatioprine, n (%)
Micofenolate, n (%)
32 (54.2%)
14 (23.7%)
18 (30.5%)
Laboratory parameters
Total cholesterol (mg/dl) median [IQR] (52 pts)
HDL-cholesterol, (mg/dl) median [IQR] (40 pts)
LDL- cholesterol(mg/dl) median [IQR] (36 pts)
182.5 [101-307]
64.5 [37-130]
102.5 [40-172]
Triglycerides (mg/dl) median [IQR] (46 pts) 87 [33-268]
Vitamin D (UI) median [IQR] (47 pts) 28.5[7.7-53.9]
Abbreviations: ANA= Anti-Nuclear Antibodies; BMI= Body Mass Index; CAP= Controlled Attenuation Parameter; DLCO= Diffusing Capacity of the Lungs for Carbon Monoxide; ENA= Extractable Nuclear Antigens; F= Female; FVC= Forced Vital Capacity; HDL= High Density Lipoprotein; ILD= Interstitial Lung Disease; IQR= Interquartile Range; LDL= Low Density Lipoprotein; LS= Liver Stiffness; M= Male; mRSS= modified Rodnan Skin Score; n= number; PAPs= Systolic Pulmonary Artery Pressure; SD= Standard Deviation; SSc= Systemic Sclerosis.
Table 2. Linear regression analysis between liver fibrosis and liver stiffness values and other clinical variables (patients n=59).
Parameter
LS CAP
Correlation Coefficient 95 % CI P rho 95% CI p

Subset sine/L/D
L/D

0.24
0.24

-0.02 to 0.47
-0.01 to 0.48

0.068
0.059

0.06
0.02

-0.19 to0.32
-0.24 to 0.28

0.6
0.9
Gender 0.32 0.06 to 0.54 0.013 0.17 -0.10 to 0.41 0.2
HDL-cholesterol -0.38 -0.63 to -0.07 0.014 0.11 -0.21 to 0.42 0.4
TG 0.40 0.11 to 0.62 0.006 0.27 -0.03 to 0.53 0.06
ILD 0.23 -0.04 to 0.46 0.09 0.23 -0.04 to 0.47 0.09
Telangiectasias 0.26 -0.001 to 0.49 0.045 -0.09 -0.35 to 0.18 0.5
DLCO -0.23 -0.46 to 0.04 0.087 -0.12 -0.37 to 0.15 0.4
Activity index 0.16 -0.11 to 0.40 0.2 0.34 0.09 to 0.56 0.007
PAPs -0.08 -0.35 to 0.20 0.5 0.31 0.04 to 0.54 0.023
E/A 0.14 -0.14 to 0.40 0.3 0.41 0.15 to 0.62 0.002
BMI 0.09 -0.18 to 0.34 0.5 0.50 0.27 to 0.67 <0.0001
Age -0.17 -0.42 to 0.09 0.2 0.52 0.29 to .69 <0.0001
Immunosuppressive treatment
MMF
AZA
0.14

0.16
0.05
-0.12 to 0.38

-0.10 to 0.41
-0.21 to 0.3
0.3

0.22
0.7
0.24

0.32
-0.08
-0.01 to 0.47

0.07 to 0.53
-0.34 to 0.17
0.06

0.013
0.5
Legend: L= limited; D= Diffuse; AZA= Azatioprine; BMI= Body Mass Index; CAP= Controlled Attenuation Parameter; CI= Confidence Interval; DLCO= Diffusing Capacity of the Lungs for Carbon Monoxide; HDL= High Density Lipoprotein; ILD= Interstitial Lung Disease; LS= Liver Stiffness; MMF= Mycophenolate Mofetil; PAPs= Systolic Pulmonary Artery Pressure; TG= Triglycerides.
Table 3. Multiple regression (method enter) analysis according to LS and CAP (n=59).
Parameter
LS CAP
Coefficient Std. Error t p Coefficient std. Error t p
sesso 0.43 0.82 0.53 0.6
HDL -Chol -0.01 0.01 -1.23 0.23
Triglycerides 0.01 0.004 2.43 0.02
teleangectasie 0.32 0.34 0.95 0.35
Activity index 4.61 4.12 1,12 0.26
PAPs 0.33 0.31 1,08 0.28
E/A 11.7 10.17 1,12 0.25
BMI 2.28 0.96 2.36 0.023
Age 0.77 0.33 2,37 0.022
MMF 9.72 8.35 1.16 0.25
Legend: BMI= Body Mass Index; CAP= Controlled Attenuation Parameter; HDL= High Density Lipoprotein; LS= Liver Stiffness; MMF= Mycophenolate Mofetil; PAPs= Systolic Pulmonary Artery Pressure.
Disclaimer/Publisher’s Note: The statements, opinions and data contained in all publications are solely those of the individual author(s) and contributor(s) and not of MDPI and/or the editor(s). MDPI and/or the editor(s) disclaim responsibility for any injury to people or property resulting from any ideas, methods, instructions or products referred to in the content.
Copyright: This open access article is published under a Creative Commons CC BY 4.0 license, which permit the free download, distribution, and reuse, provided that the author and preprint are cited in any reuse.
Prerpints.org logo

Preprints.org is a free preprint server supported by MDPI in Basel, Switzerland.

Subscribe

© 2024 MDPI (Basel, Switzerland) unless otherwise stated