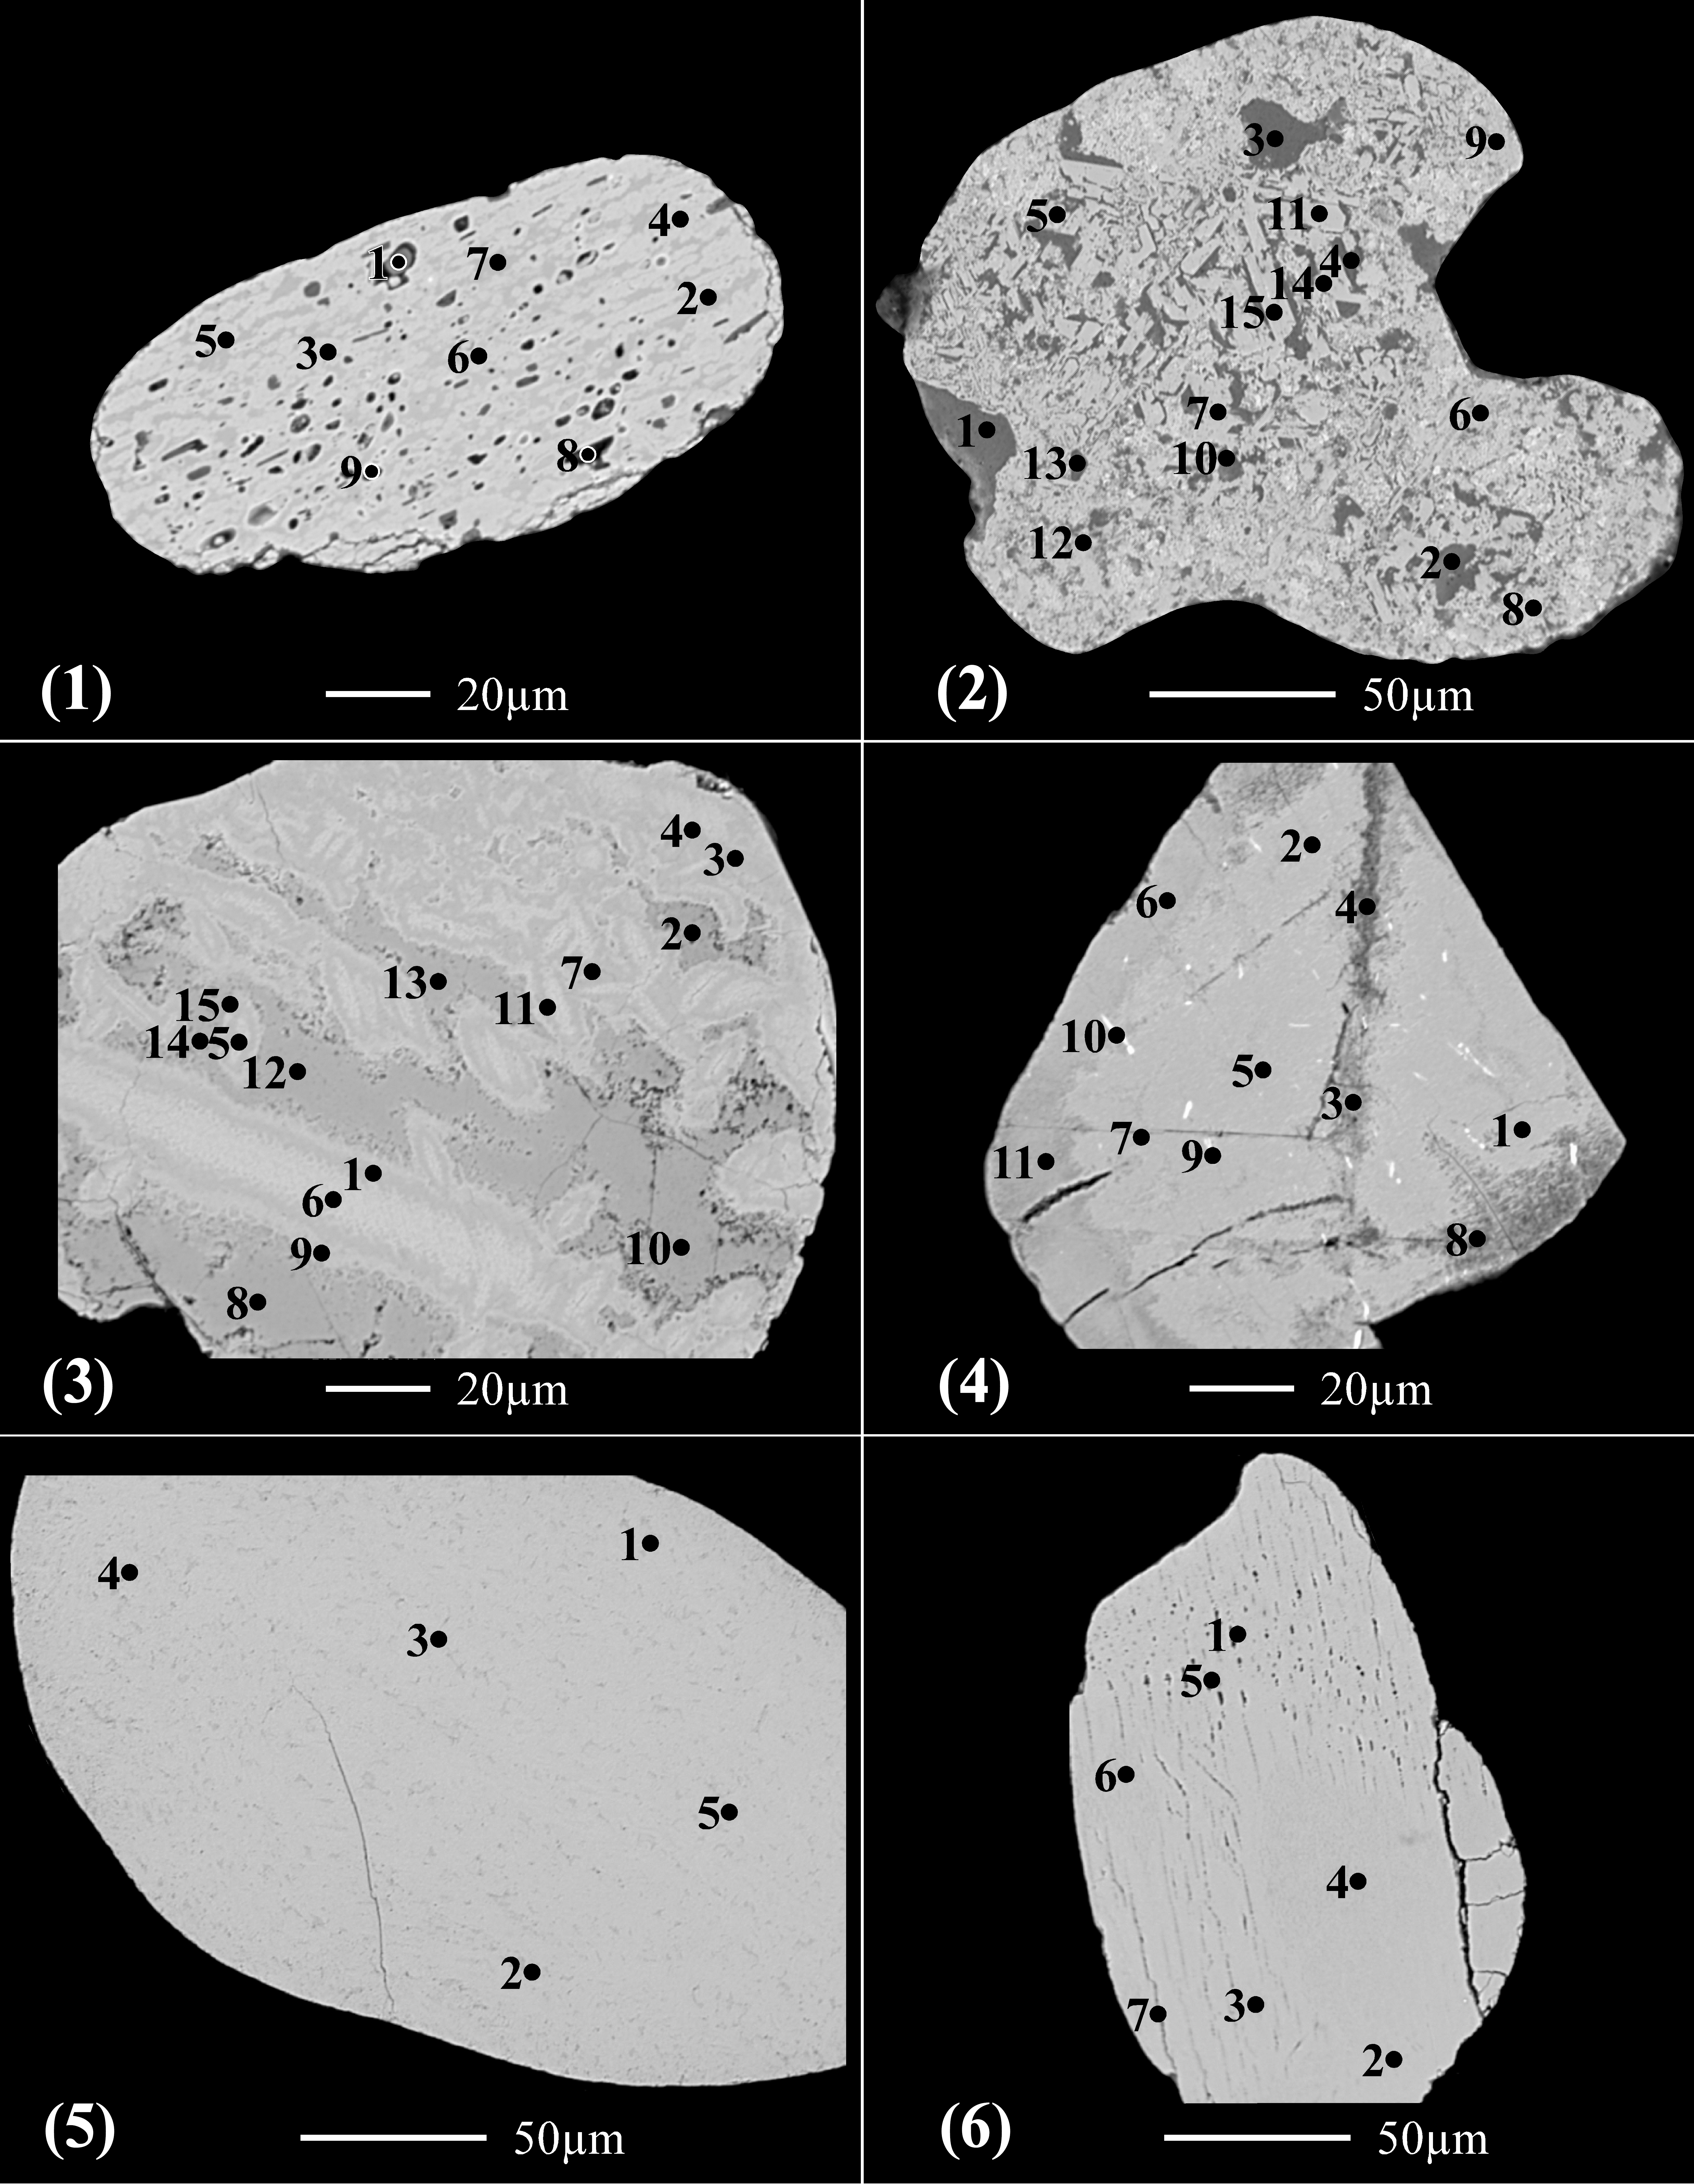
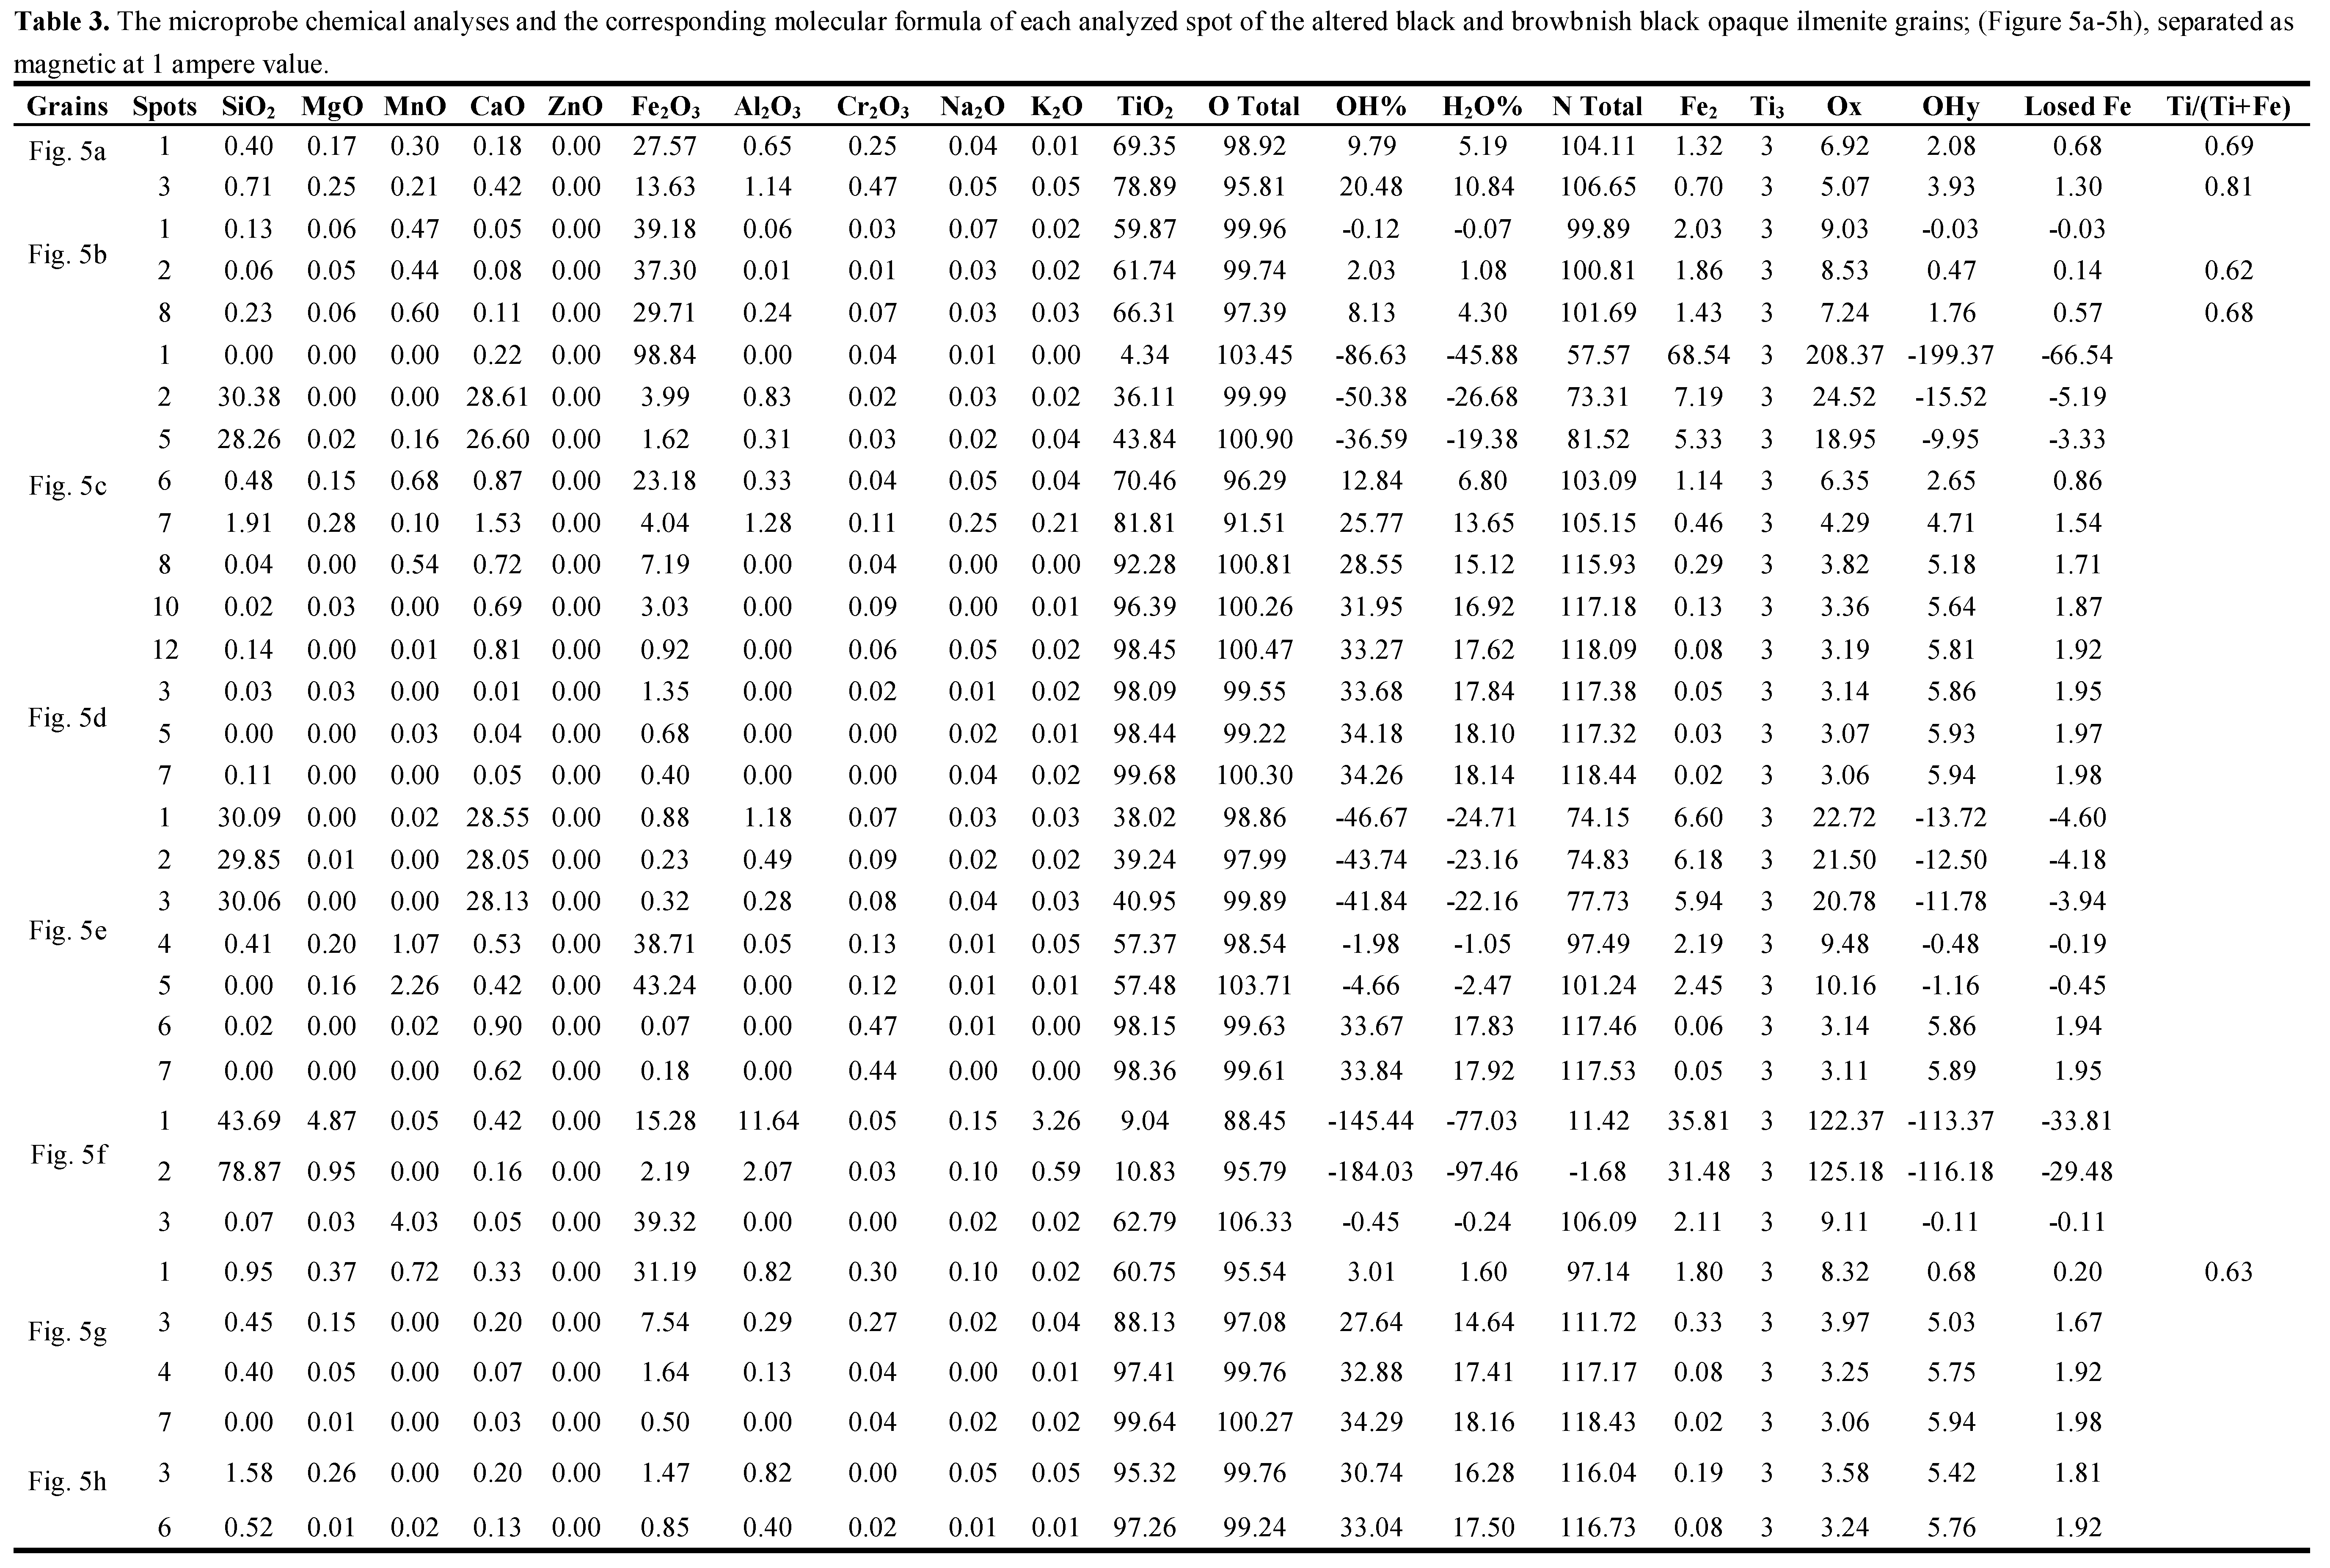
In this magnetic fraction several varieties of the brown coloured grains are detected. Three groups of grain varieties are investigated as follows:
3.1.1. The detected dark brown magnetic variety at 0.5 ampere
In this variety, seven dark brown grains are investigated. Some of the detected spots are either altered silicate minerals, or individual phases of TiO2 and Fe2O3 obtained due to the breakdown of the formed lpsr.
The psr and lpsr spots for the three grains (
Figure 1a-1c & Table 1), have TiO
2 contents range between 68.61 and 84.11% while Fe
2O
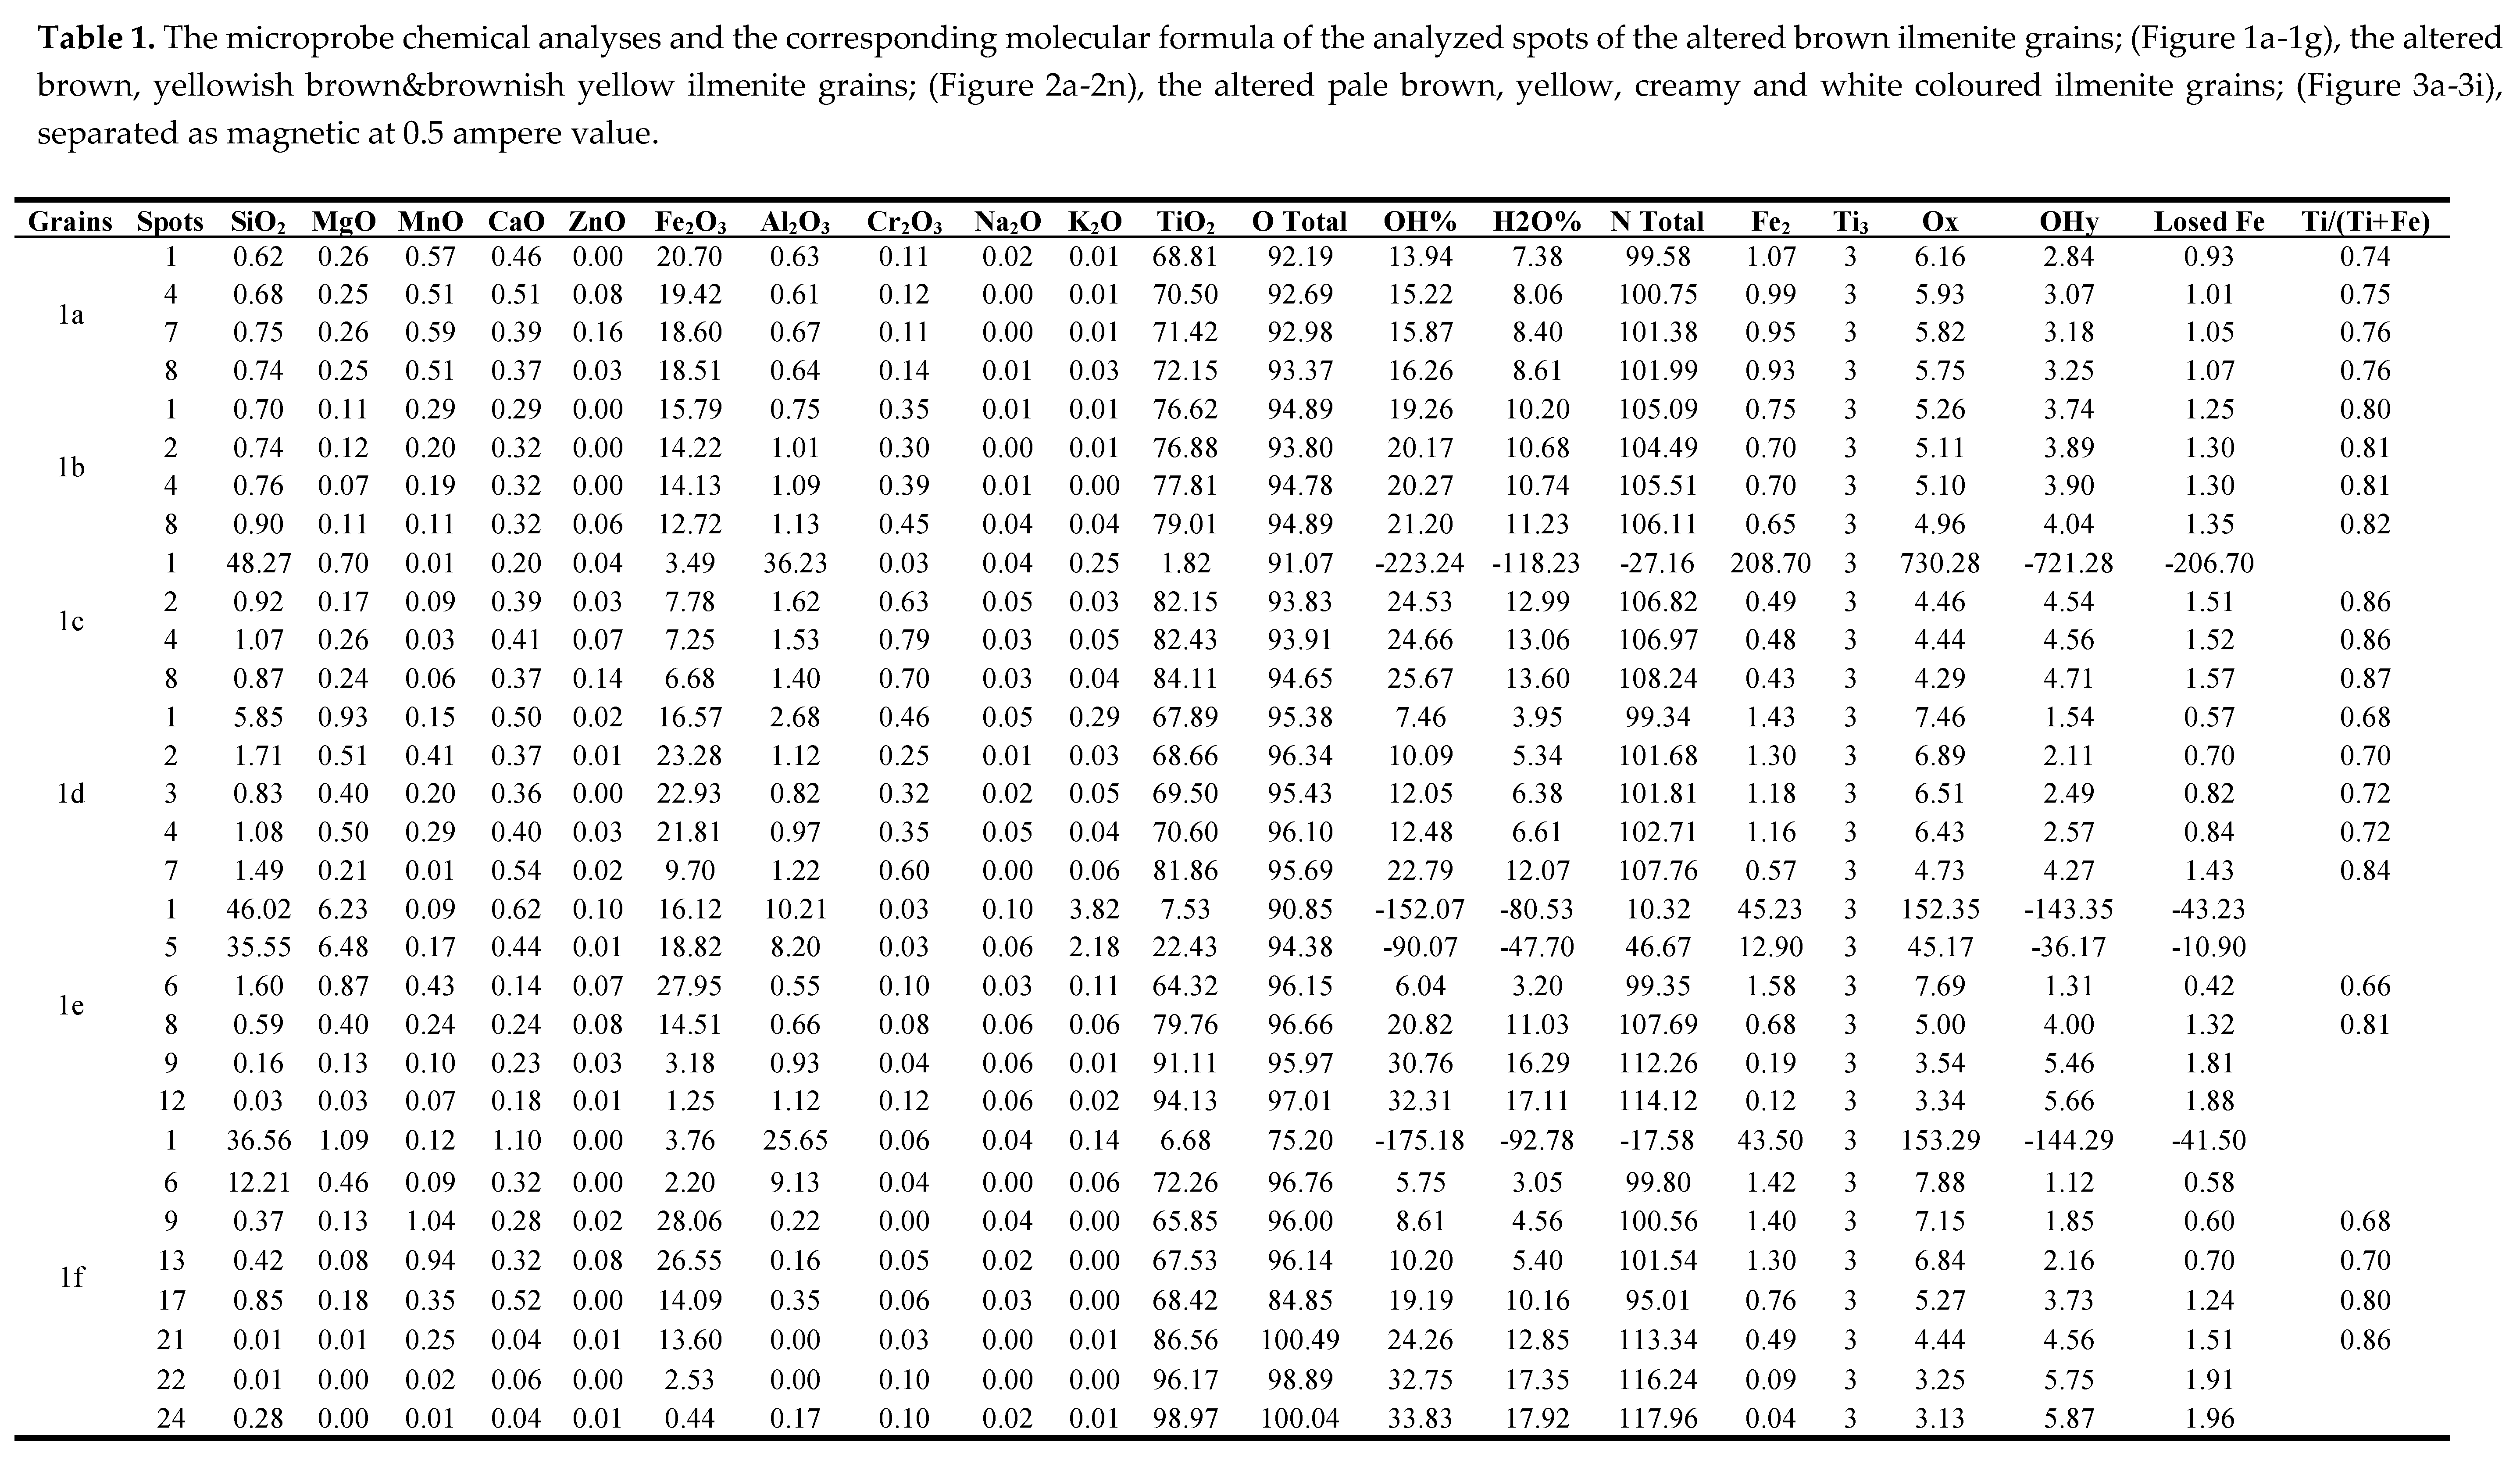
3 contents range between 6.68 and 20.7%. Their cationic iron ranges between 1.07 and 0.42 while the Ti/(Ti+Fe) ratio ranges between 0.74 and 0.88. The analyzed spot 1 of grain 1c is an impurity of a silicate mineral. All the analyzed spots of the grain (
Figure 1a), are lpsr. In grain of (
Figure 1b), the TiO
2 content attains 79.01% while the Fe
2O
3 content decreases to 12.72%. In grain of (
Figure 1c), the TiO
2 content attains 84.11%, while the Fe
2O
3 content decreases to 6.68%. The cationic iron content ranges between 0.42 and 0.49. In the two grains (
Figure 1b,1c), the new total oxides sum after applying the constructed psr Excel program (NT), is greater than 100% for each of the analyzed spots of the two grains; 104.5-106.11% for the grain 1b and 106.8-108.3% for the grain 1c. Then, either the calculated structural water and/or the content of the most abundant analyzed oxide (TiO
2) as included completely in the contained psr phase is incorrect. In both the two grains (
Figure 1b,1c), comparing the original total oxides sum; before applying the constructed psr Excel program (OT), and NT for each of them, it is difficult to accept the calculated values of the corresponding contained str water (Table 1). The lowest OT value is 93.8% which reflects the maximum existence of 6.2% of str and/or mol water. On the other hand, the highest calculated H
2O% by using the adopted psr Excel program is 13.73%. It is remarked that in the lpsr structure, on reaching a TiO
2 content around 68-70%, the mechanism of ilmenite alteration seems to be changed. Also, as the analyzed TiO
2 content increases, as the the darkness of the BSE image areas of the grain increases from 1a to 1c. This may reflect the existence of an individual TiO
2 phase; most probably rutile, mixed homogeneously with the still existed survived lpsr component. Also, as the content of TiO
2 content increases (within a definite range, 80-85%), as the contents of Al
2O
3& SiO
2 increase.
The careful investigation of these three last grains reflects that several spots of these three grains are composed of individual phases for TiO2 and Fe2O3. In such spots, it is incorrect to consider the analyzed contents of TiO2 and/or Fe2O3 included completely in psr phases.
In the grain of (
Figure 1d), the change of alteration mechanism is very obvious at TiO
2 contents in the range of 69-70%; spots 3&4 (Table 1). In each of the two spots 1&2, the individual content of TiO
2 and the individual value of the sum mixed contents Fe
2O
3+SiO
2+Al
2O
3 are very near. However, the investigation of the BSE images of the two spot areas reflects the breakdown of lpsr into individual phases where the formed Fe
2O
3 phase may be mixed with SiO
2 and Al
2O
3. The detected psr&lpsr spots of the grain have the chemical formulas of Fe
1.43-0.57Ti
3O
7.46-4.73(OH)
1.54-4.27 (Table1).
In the grain of (
Figure 1e), the spots from 1 to 5 are corresponding to a definite silicate mineral, which contains definite amount of TiO
2. In these five spots as the contents of SiO
2+Al
2O
3+K
2O decrease, as the contents of TiO
2 increase (Table 1). The spots 6, 7, & 8 are lpsr, the mechanism of alteration for spot 8 is different than that for the other two spots. In fact, the calculated H
2O%; corresponding for the structural OH
- of spot 8 seems to be incorrect. The sum weight% of NT equals 107.7% after the addition of 11.03% of the calculated H
2O corresponding to the contained OH
-%. Each of the spots 9, 10, 11 & 12 is an individual TiO
2 phase mixed with minor Fe
2O
3. It seems that the grain (
Figure 1e), was originally composed of major rutile component with minor exsolved intergrowths of ilmenite which altered to lpsr, and inclusions of a definite contained silicate mineral. In comparing the contents of SiO
2& Al
2O
3 and the values of OT & NT for the spots from 9 to 12, it can remarked that an appreciable contents of only Al
2O
3 are favorable with TiO
2 especially in the presence of str and/or mol water (Table 1). However, the detected psr&lpsr spots of the grain have the chemical formulas range of Fe
1.58-0.68Ti
3O
7.69-5(OH)
1.31-4 (Table 1).
In the grain of (
Figure 1f), the analyzed spots from 1 to 6 are corresponding to a definite silicate mineral containing a definite content of TiO
2. Due to its alteration, considerable contents of SiO
2, Al
2O
3, CaO, MgO and K
2O are lost and an enrichment of TiO
2 from 6.68 to 72.26% is occurred. It should remarked that if these spots; especially spot 6, are investigated in the absence of their BSE image, it may identified as lpsr. On the other hand, the analyzed spots from 7 to 21 are lpsr while the spots from 22 to 24 are individual TiO
2 phases; most probably rutile, after the collapse of the altered lpsr. In these last three spots, the contents of Al
2O
3 and SiO
2 almost equal zero where the values of OT equal 99-100.5%. Then, in comparing them with the spots from 9 to 12 of the grain of (
Figure 1e), it is remarked that with the removal of str and/or mol water, the presence of Al
2O
3 and SiO
2 with TiO
2 (more than 85% TiO
2), is not favorable. The detected psr&lpsr spots of the grain have the chemical formulas range of Fe
1.45-0.49Ti
3O
7.29-4.44(OH)
1.71-4.56 (Table 1).
In the grain of (
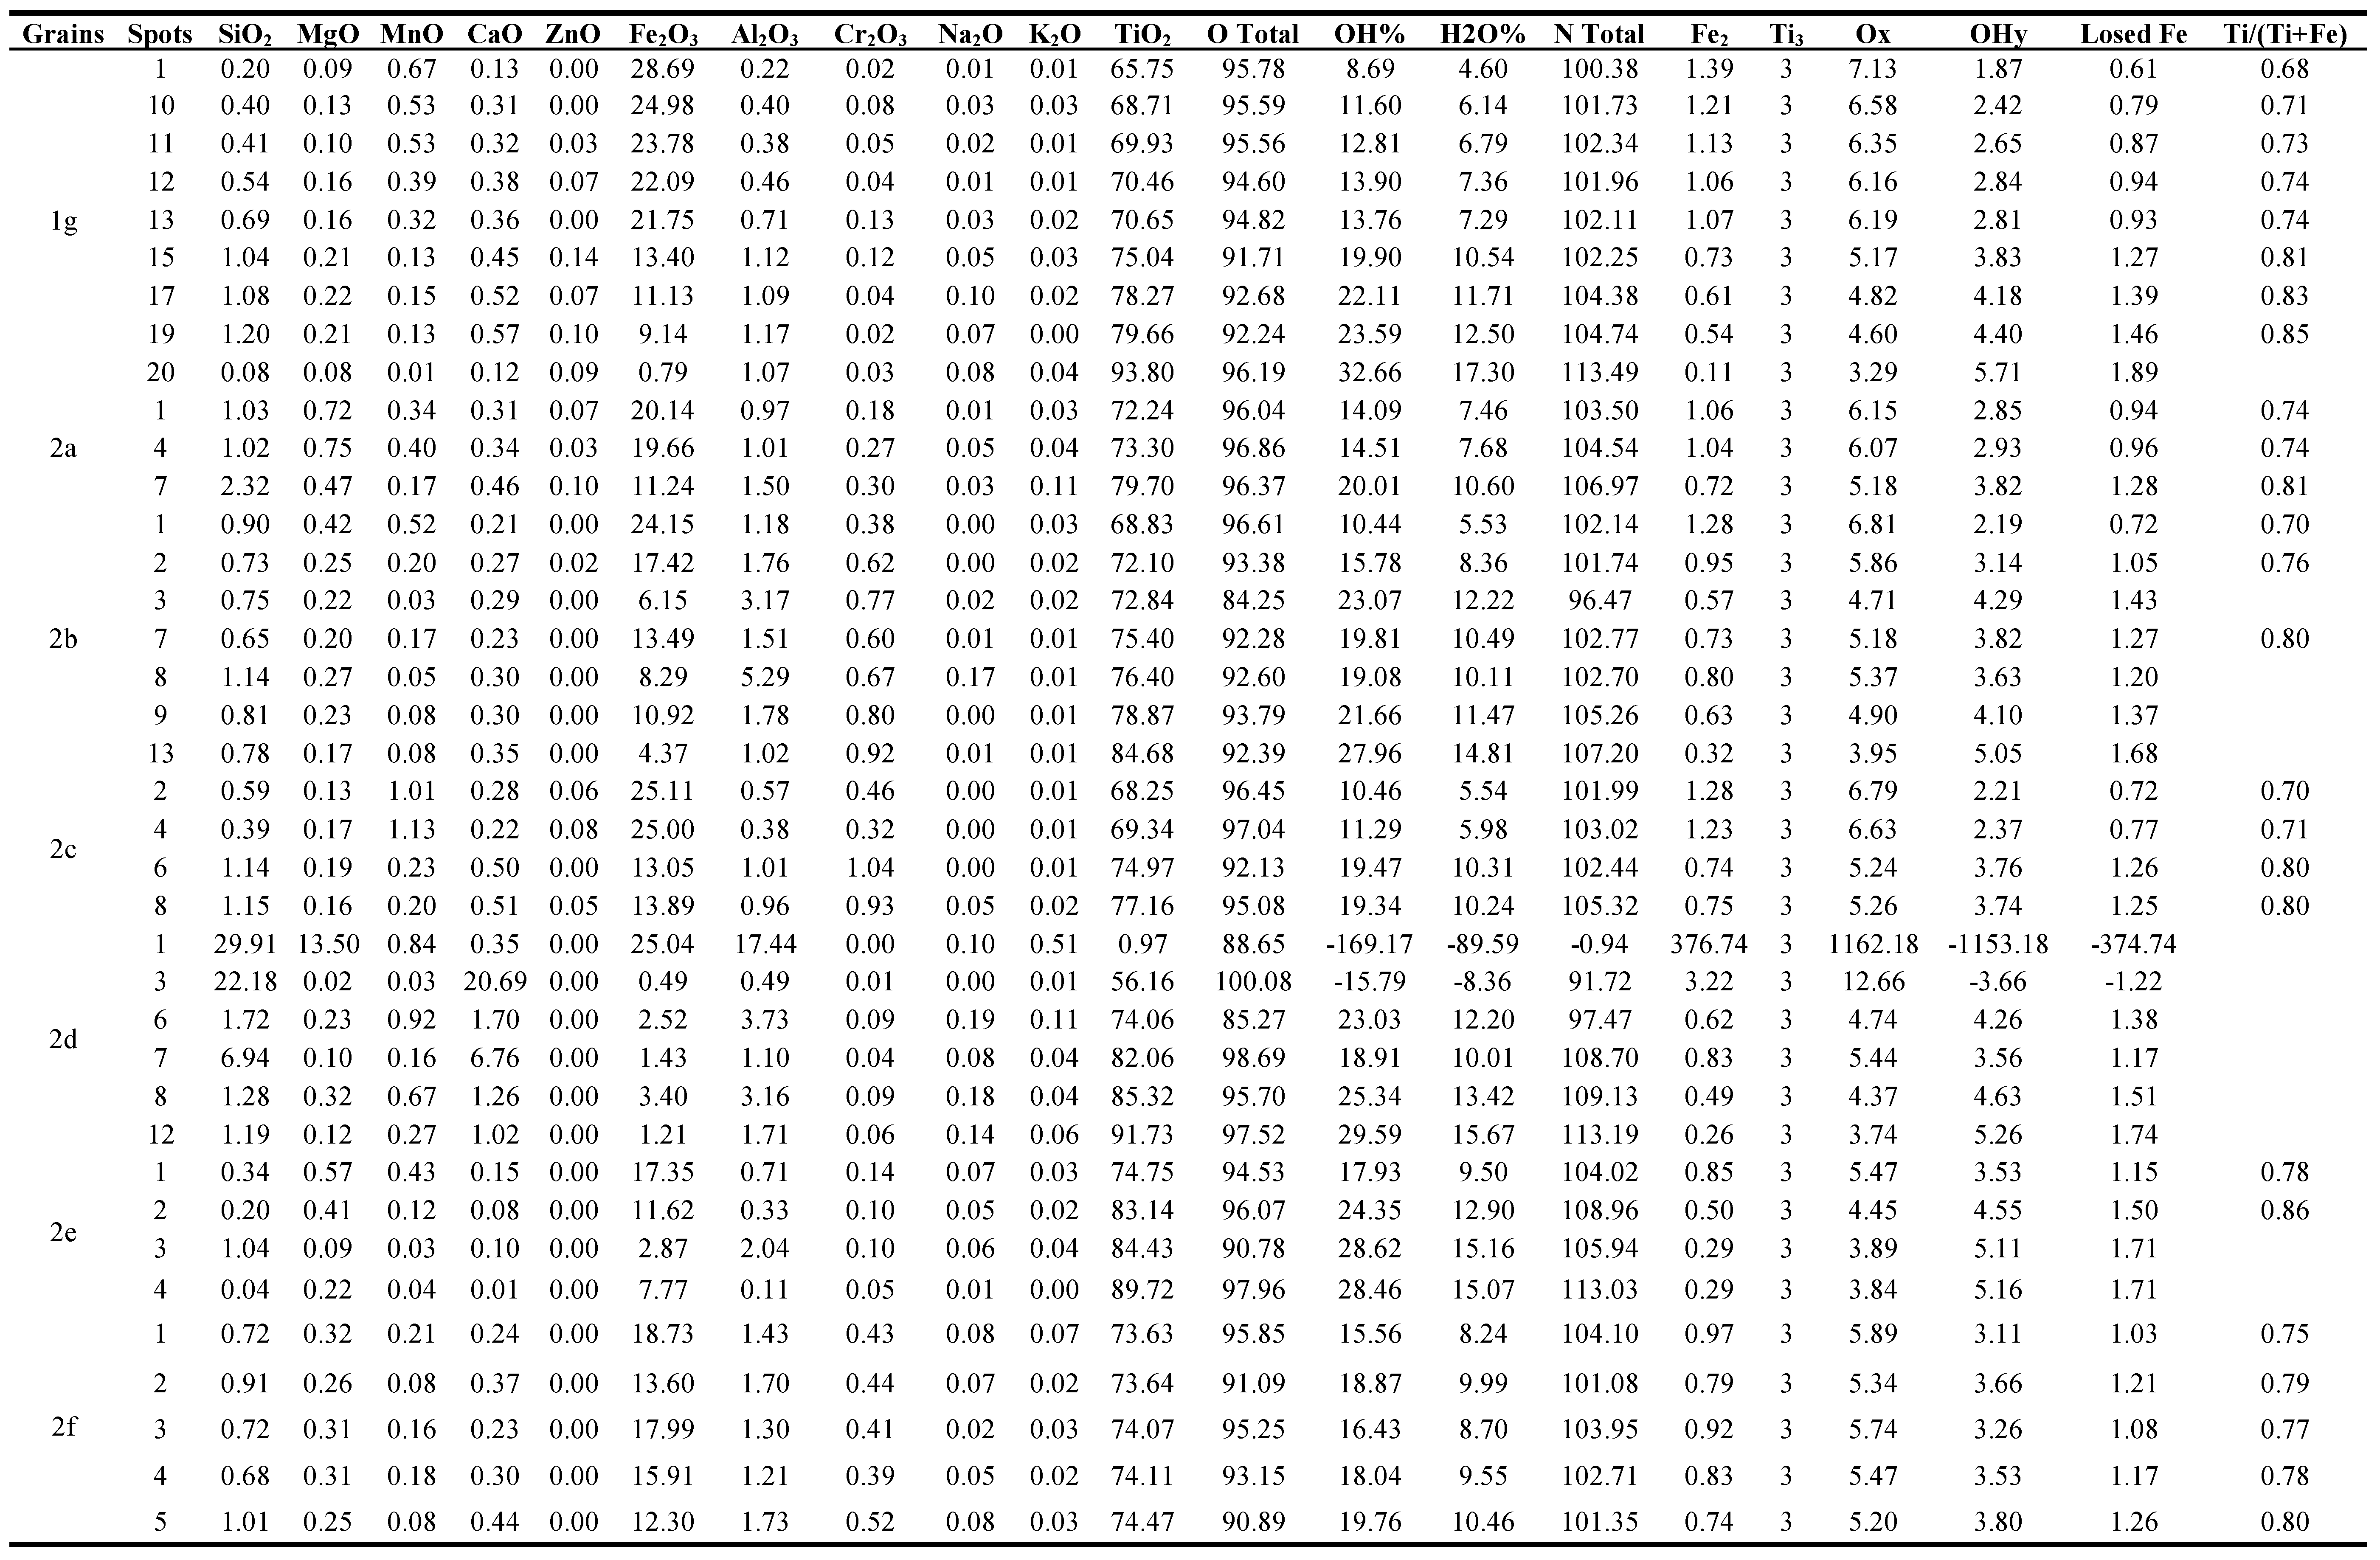
Figure 1g), the analyzed spots from 1 to 13 are psr and lpsr. The TiO
2 contents range between 65.75 and 70.65%, the Fe
2O
3 contents range between 29.7 and 21.75%, and the Ti/(Ti+Fe) ratio ranges between 0.68 and 0.74. The contents of SiO
2, Al
2O
3 MgO and CaO are relatively lower while the contents of MnO are relatively higher than those of the other analyzed spots from 14 to 20. Also, in comparing the values of OT & NT; especially for the three spots 11, 12, and 13, it can remarked that the calculated structural water contents are not correct and the mechanism of psr alteration is changed. The analyzed spots from 14 to 20 are lpsr. Their TiO
2 contents range between 74.54 and 79.66%, Fe
2O
3 contents range between 13.55 and 7.09 wt%, and the Ti/(Ti+Fe) ratio ranges between 0.8 and 0.88. The mechanism of alteration for the first six spots is similar to that of the spots 11, 12, and 13. The spot 20 is composed of an individual TiO
2 phase; most probably rutile, it have relatively darker BSE image than others. Their contents of SiO
2, MgO, MnO, and CaO in addition to Fe
2O
3 are minimum while the content of Al
2O
3 still relatively higher and the spot still contains structural and/or molecular water; OT equals 96.19%. The spots of the grain have the chemical formulas of Fe
1.43-0.42Ti
3O
7.25-4.26(OH)
1.75-4.74 (Table1). However, many of these spots of grain 1g are not totally psr/lpsr phases. Other individual phases TiO
2 and Fe
2O
3 are also contained.
In these detected 7 grains (
Figure 1a-1g), the analyzed spots have the chemical formulas range of Fe1.58-0.42Ti3O7.69-4.26(OH)1.31-4.74 (Table 1). The Ti/(Ti+Fe) ratio ranges between 0.66 and 0.88.
However, according to the BSE images of the grains of Figure (1), the spots having the lowest iron contents (0.49-0.42) are composed mainly of individual TiO2 and Fe2O3 phases due to collapse of the majority of contained psr/lpsr phases. Then, The cationic Fe contents ranges between 0.42 and 0.49 are discarded as minimum values for the existence of psr-lpsr phases.
3.1.2. The detected brown, yellowish brown & brownish yellow varieties at 0.5
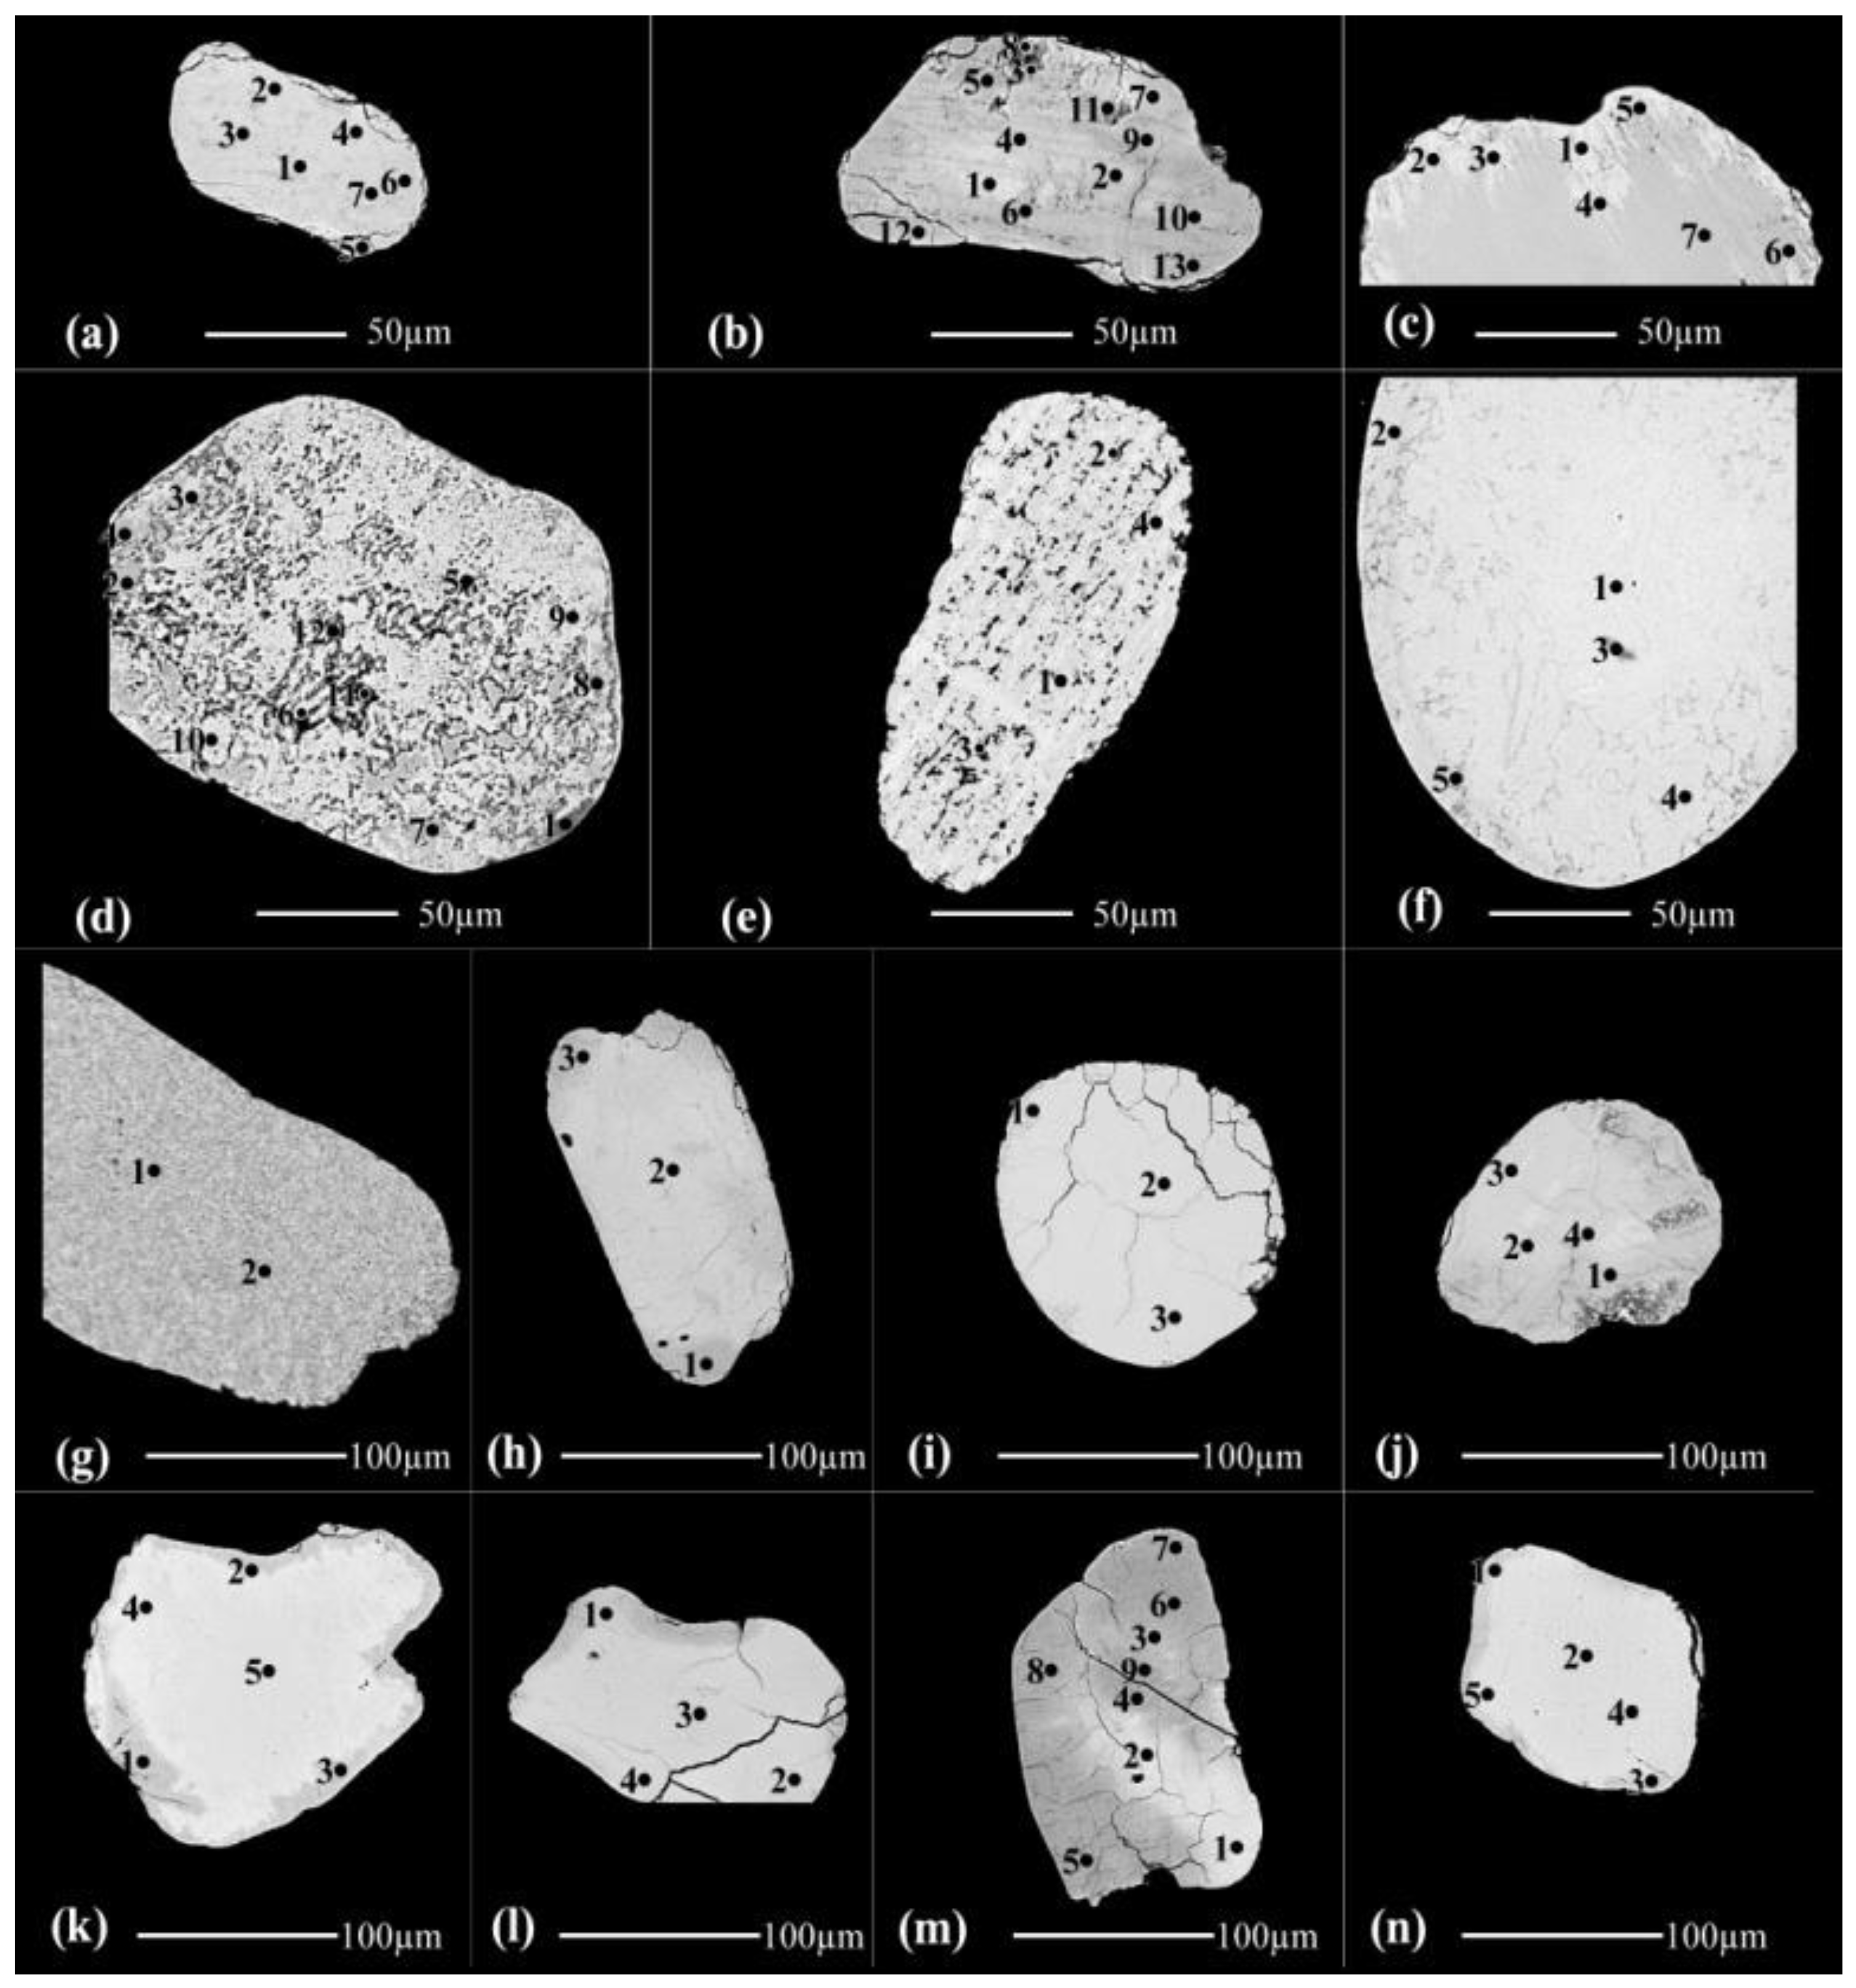
Forteen grains are investigated of this variety (
Figure 2, Table 1). In the grain of (
Figure 2a), all the analyzed spots are lpsr, the calculated structural water content in the calculated molecular formula are not accepted.
In the grain (
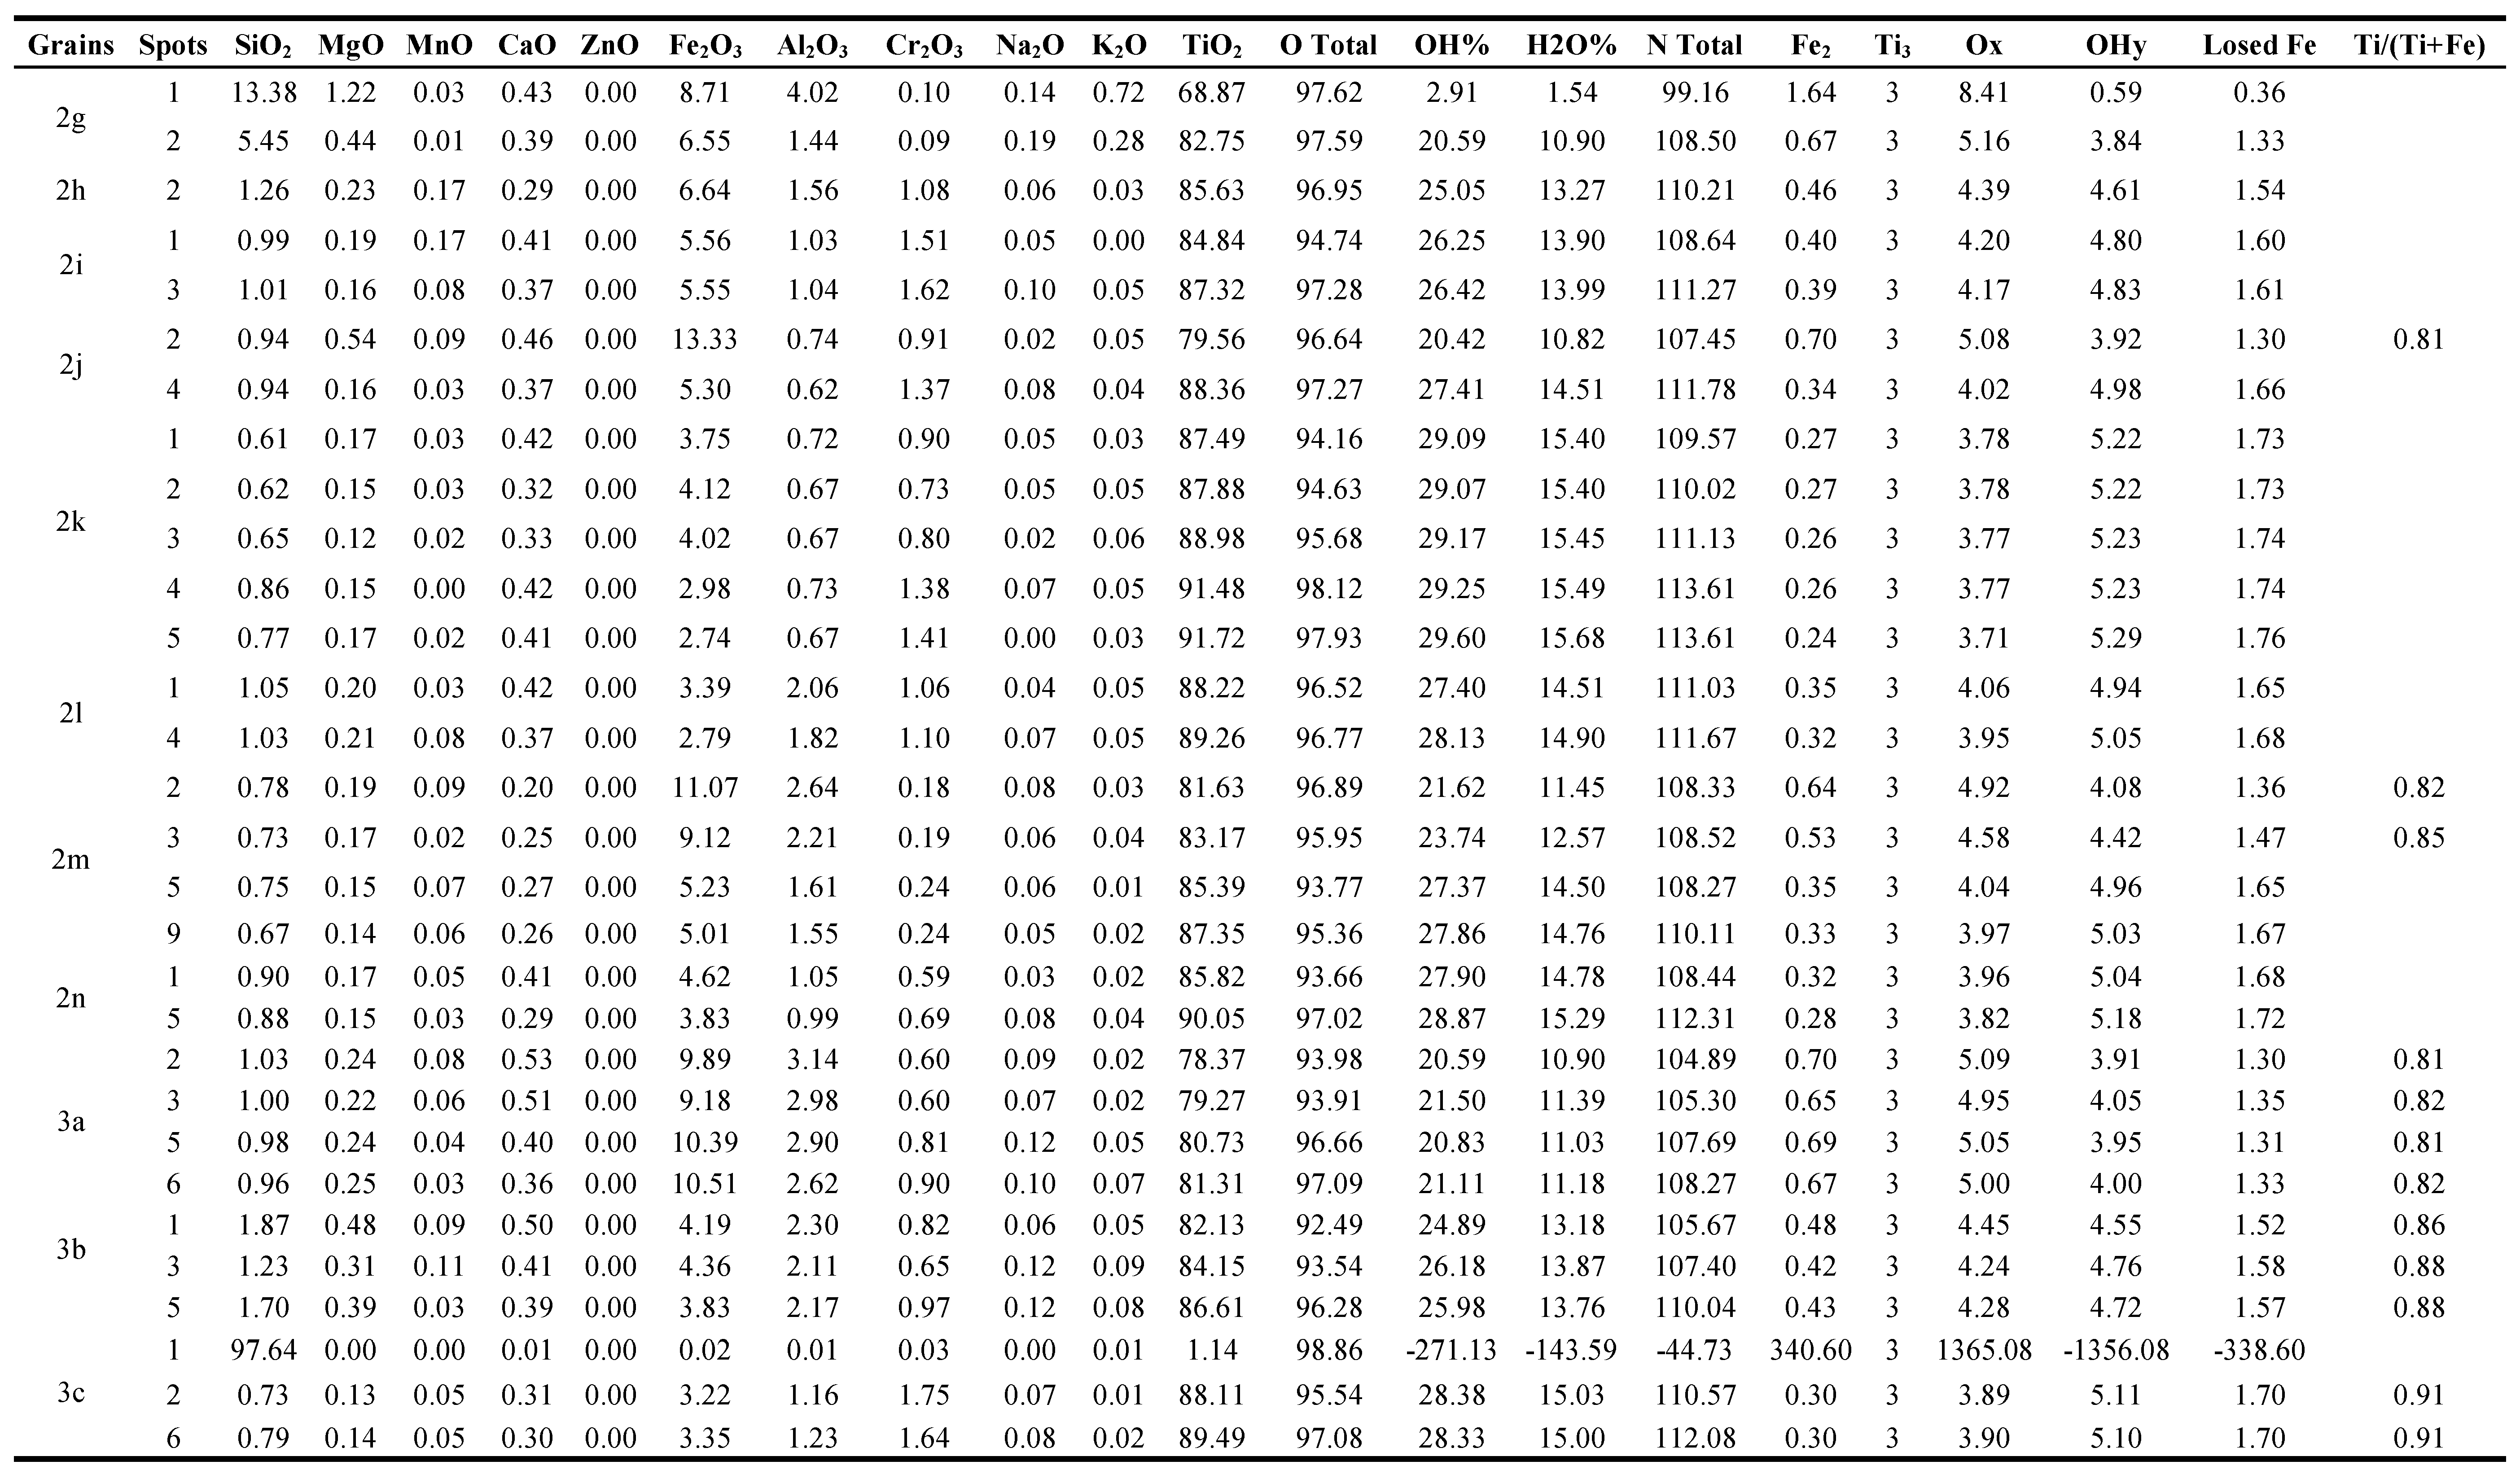
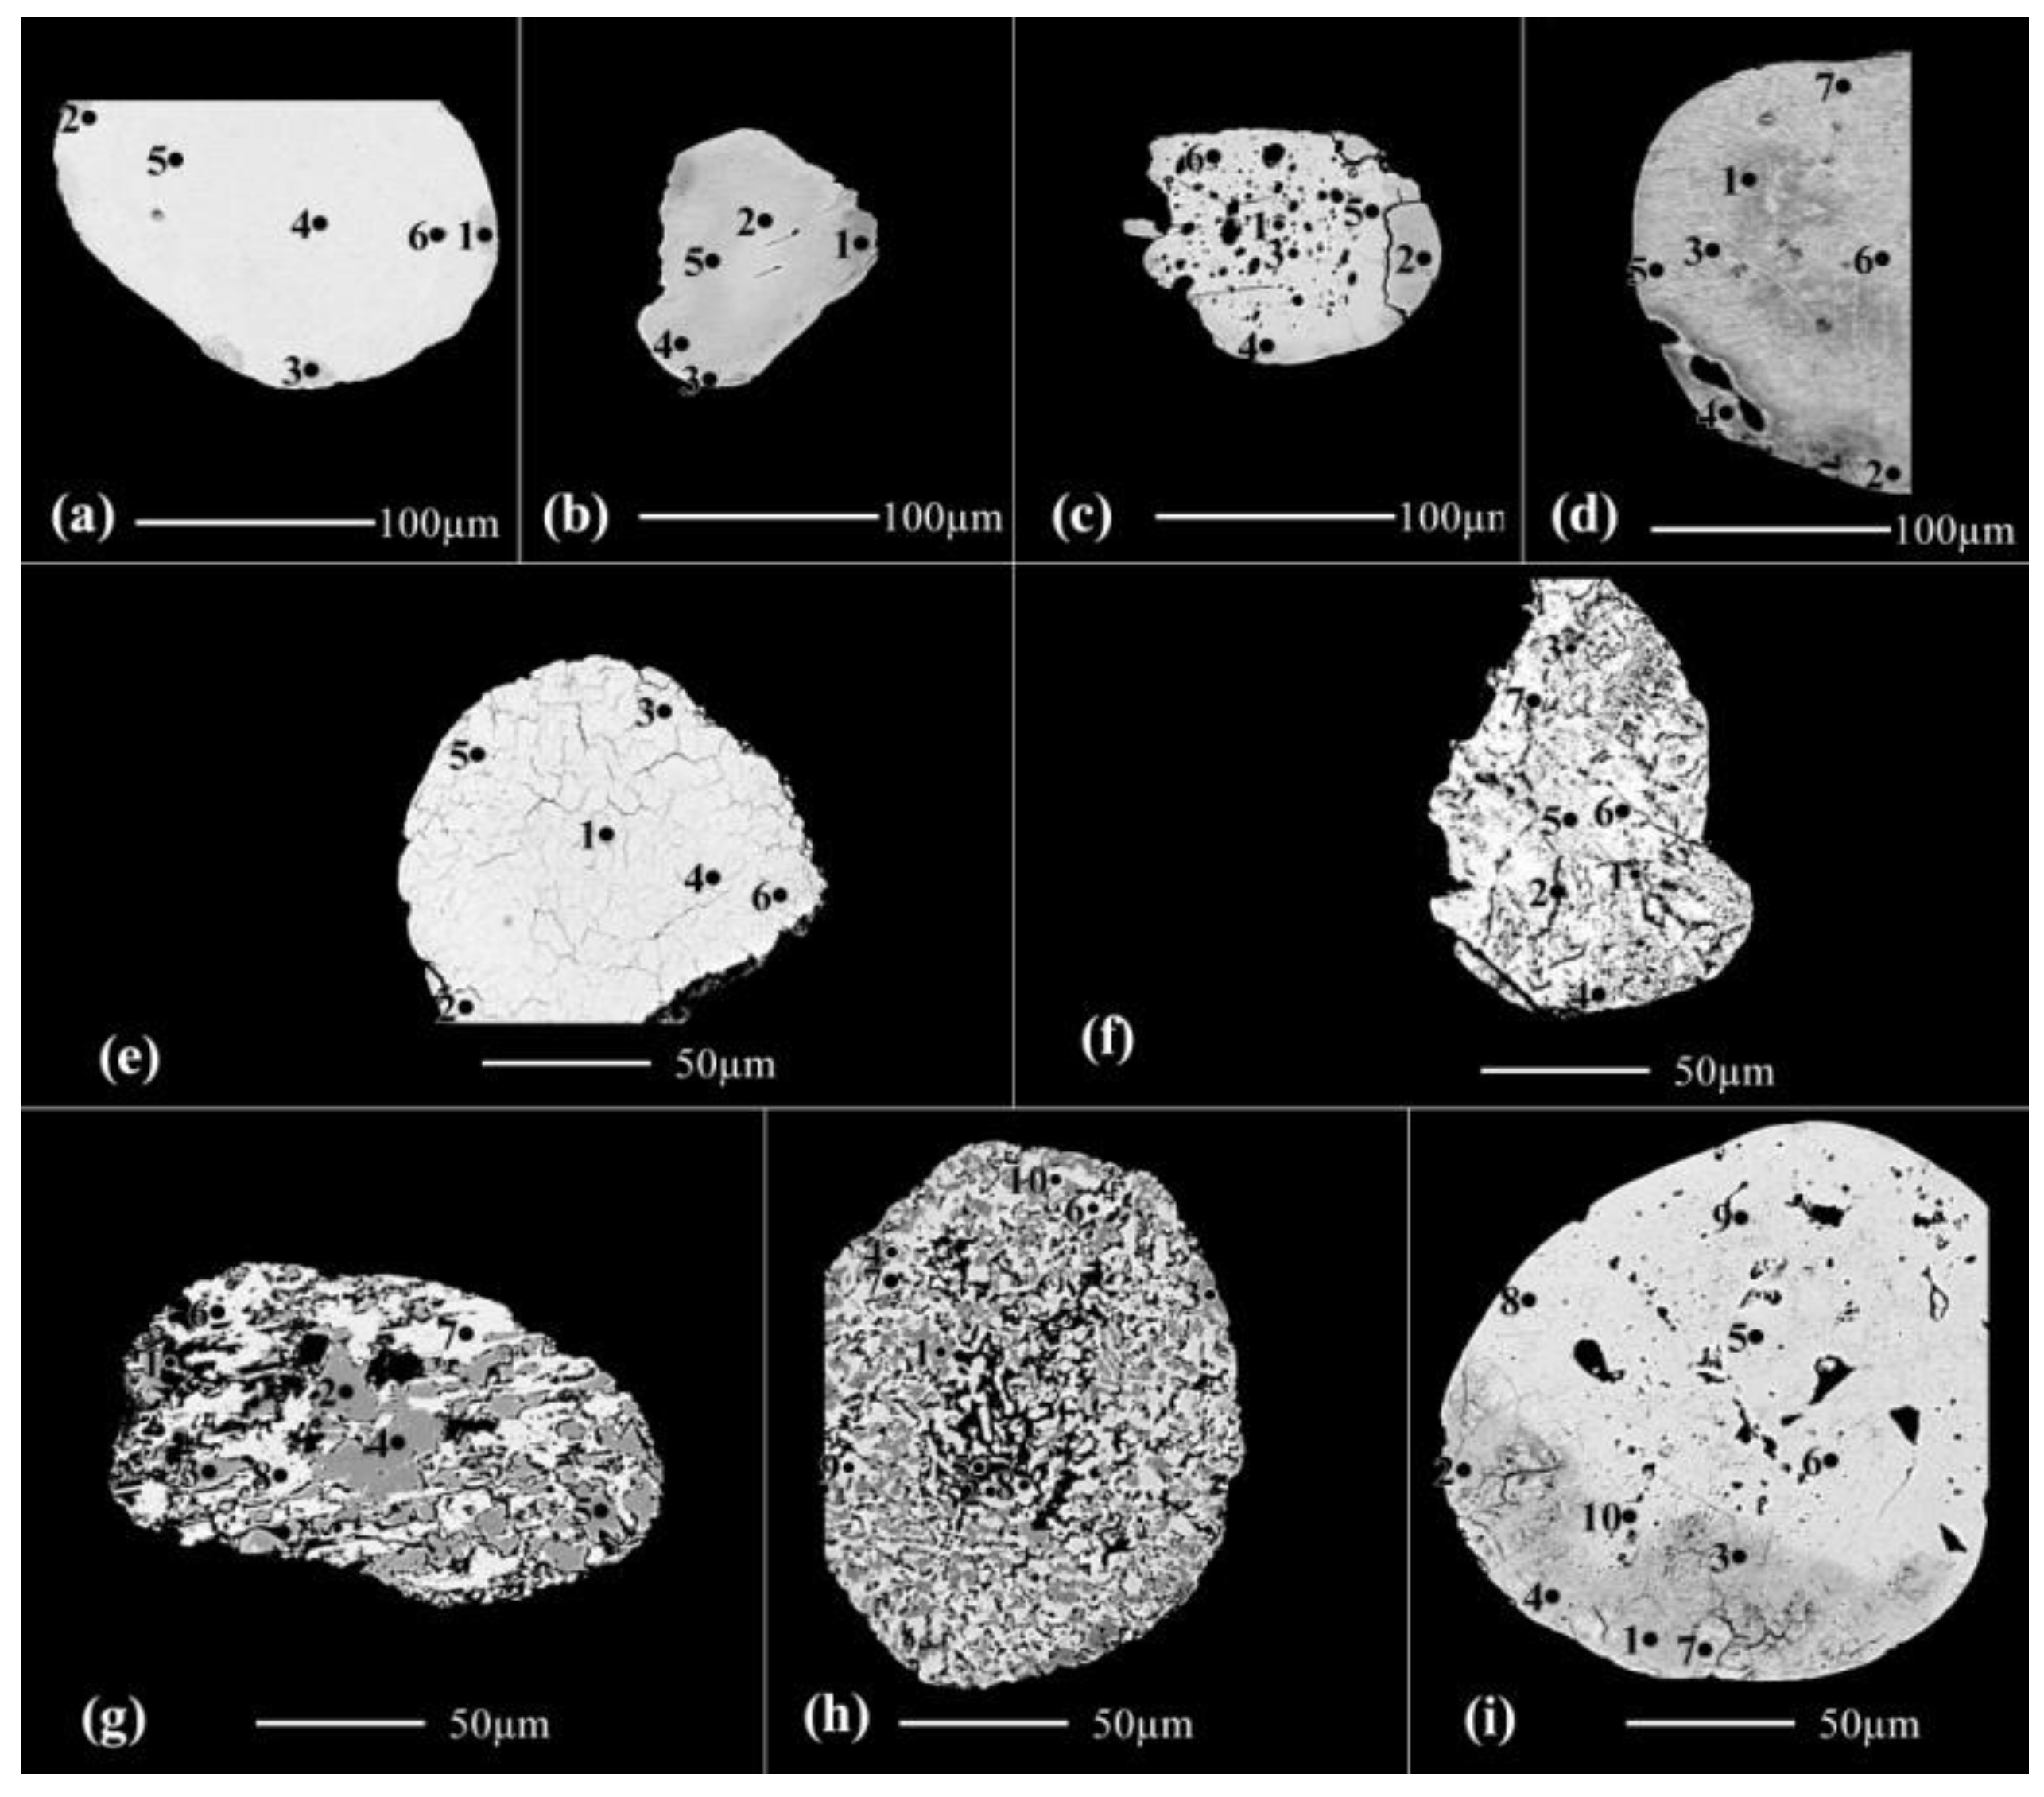
Figure 2b), the spots from 1 to 7; except of spot 3, are lpsr. Spots 3 and 8 are located at highly fissured locations enriched with voids which accelerate the alteration of lpsr and its broken into individual TiO
2 and Fe
2O
3 phases. A considerable amount of hematite is lost and/or replaced with Al
2O
3. The contents of MnO in spots 3&8 are similar for MnO contents of the spots from 9 to 13 indicating that these two last spots may be also lpsr collapsed into individual TiO
2 and Fe
2O
3 phases.
In the grain (
Figure 2c), , the spots from 1 to 4 are composed of lpsr and have relatively lighter BSE image tints, relatively lower contents of Al
2O
3, SiO
2, CaO & Cr
2O
3 and relatively higher contents of MnO while vice versa for the spots from 5 to 8.
The investigated psr-lpsr spots of the three last grains (
Figure 2a-2c), have contents of TiO
2, Fe
2O
3, Fe, and Ti/(Ti+Fe) ratio range between 65.07-79.7%, 28.96-13.05%, 1.49-0.7, and 0.67-0.81, respectively. The detected lpsr phases inside them have the chemical formulas range of Fe
1.49-0.7Ti
3O
7.4-5.11(OH)
1.6-3.89 (Table 1).
In the grain (
Figure 2d), spot 1 is a definite silicate mineral while the spots 2&3 are sphene. Both of the two spots 4&7 are mainly rutile with minor sphene. The spots 5&6 in addition to those from 8 to 12 are rutile with minor of Fe
2O
3 and sphene. Investigating the values of OT for these spots reflects the prescence of structural and/or molecular water. Also, it is detected that there are considerable contents of Al
2O
3, SiO
2 and CaO with the relatively higher contents of TiO
2. Then, both of the preexisting silicate mineral and sphene are altered and replaced with the enriched TiO
2 phase; most probably due to definite hydrothermal solutions affecting the area of source rocks bearing for them.
In the grain (
Figure 2e), the analyzed spots 1 and 2 are lpsr but of different alteration phases. The analyzed spot 3 is inside a void while the analyzed spot 4 is beside the edge of the grain where the rate of alteration is highly accelerated and the lpsr is broken into two individual phases of Fe
2O
3 and TiO
2. Most of the contained ferric iron phase is leached out. The grain (
Figure 2e), seems was originally ferriilmenite-titanhematite exsolved intergrowth where most of the hematite content is leached causing partially empty voids of various sizes and shapes. On the other hand, the ferriilmenite component is altered to lpsr. In comparing between the outside surrounding environment of spot 3 and the other three spots 1, 2 and 4 may reflects the association of Al
2O
3&SiO
2 at the spot location characterized by a relatively faster rate of alteration. In the grain (
Figure 2f), the analyzed spots 1, 3 and 4 are lpsr. They have relatively lower contents of SiO
2, Al
2O
3 and CaO and relatively higher contents of MnO and MgO. Both of spots 2&5 have almost similar contents of TiO
2 like that of spots 1, 3 and 4. In contrast, the two spots have relatively lower contents of Fe
2O
3, MnO and MgO and relatively higher contents of SiO
2, Al
2O
3 and CaO. Also, the two spots have relatively higher contents of str and /or mol water. The value of OT of spot 2 equals 91.09% and that of spot 5 equals 90.89%. It is clear that the lpsr phases of spots 1, 3 and 4 are different than those of spots 2&5 which their contents of SiO
2&Al
2O
3 seem to be associated with the str and/or mol water characteristic for them.
The lpsr spots of these two last grains have contents of TiO2, Fe2O3, Fe, and Ti/(Ti+Fe) ratio range between 73.63-83.14%, 18.73-11.62%, 0.97-0.5, and 0.75-0.86, respectively. The detected lpsr spots of the grains have the chemical formulas range of Fe0.97-0.5Ti3O5.89-4.45(OH)3.11-4.55 (Table 1).
The grain (
Figure 2g), was originally a definite altered silicate mineral where most of the contents of SiO
2, Al
2O
3, Fe
2O
3, MgO, Na
2O and K
2O are leached out with the enrichment of the minor contained TiO
2. The detection of the various analyzed spots of the grain reflects that the decreasing of these oxide contents almost equals the increasing content of TiO
2. Note that the chemical composition of spot 1 seems as lpsr (Table 1, grain 2g).
Both of the two grains (
Figure 2h,2i), have the similar lpsr phase which was broken into oxy- and/or oxyhydroxide iron and titanium individual phases. In the grain (
Figure 2j), spots 1&2 are lpsr of a definite phase while spots 3&4 are lpsr of another different phase.
Both of the two grains (
Figure 2k,2l), are collapsed lpsr into oxy- and/or oxyhydroxide iron and titanium individual phases. Comparing spots 1, 2 and 3 with spots 4&5 of grain 2k reflects the effect of the content of structural and/or molecular water on the darkness of BSE image of the analyzed spot areas. As their contents increase, as the darkness degree increases.
In the grain (
Figure 2m), both of the analyzed spots 1,2 and 3 are a definite lpsr phase mixed with an individual Ti-phase. Not all the analyzed TiO
2 content is included within the lpsr structure. The spots from 4 to 9 are composed of mixed two individual phases of iron and titanium which occur as oxy- and/or oxyhydroxides. See both of the BSE image of grain (
Figure 2m), and their corresponding OT% values (Table 1). The recorded lpsr spots of the two grains (
Figure 2j,2m), have contents of TiO
2, Fe
2O
3, Fe, and Ti/(Ti+Fe) ratio range between 76.99-83.17%, 15.45-9.12%, 0.85-0.53, and 0.78-0.85, respectively. The detected lpsr spots of the grains have the chemical formulas range of Fe
0.85-0.53Ti
3O
5.54-4.58(OH)
3.46-4.42 (Table 1).
Also, the grain (
Figure 2n, Table 1), is composed of mixed two individual phases of iron and titanium each as oxy- and/or oxyhydroxides. Spot 1 contains more structural and/or molecular water although have relatively lower TiO
2 content.
All the detected lpsr spots of the grains (
Figure 2a-2n), have the chemical formulas range of Fe
1.49-0.50Ti
3O
7.4-4.45(OH)
1.6-3.46 (Table 1). The Ti/(Ti+Fe) ratio ranges between 0.67 and 0.86.
Figure 2.
The back scattered electron (BSE) images of the altered brown, yellowish brown & brownish yellow ilmenite grains; (2a) to (2n), separated as magnetic at 0.5 ampere value.
Figure 2.
The back scattered electron (BSE) images of the altered brown, yellowish brown & brownish yellow ilmenite grains; (2a) to (2n), separated as magnetic at 0.5 ampere value.
3.1.3. The detected pale brown, yellow, and creamy coloured grain varieties at 0.5 ampere
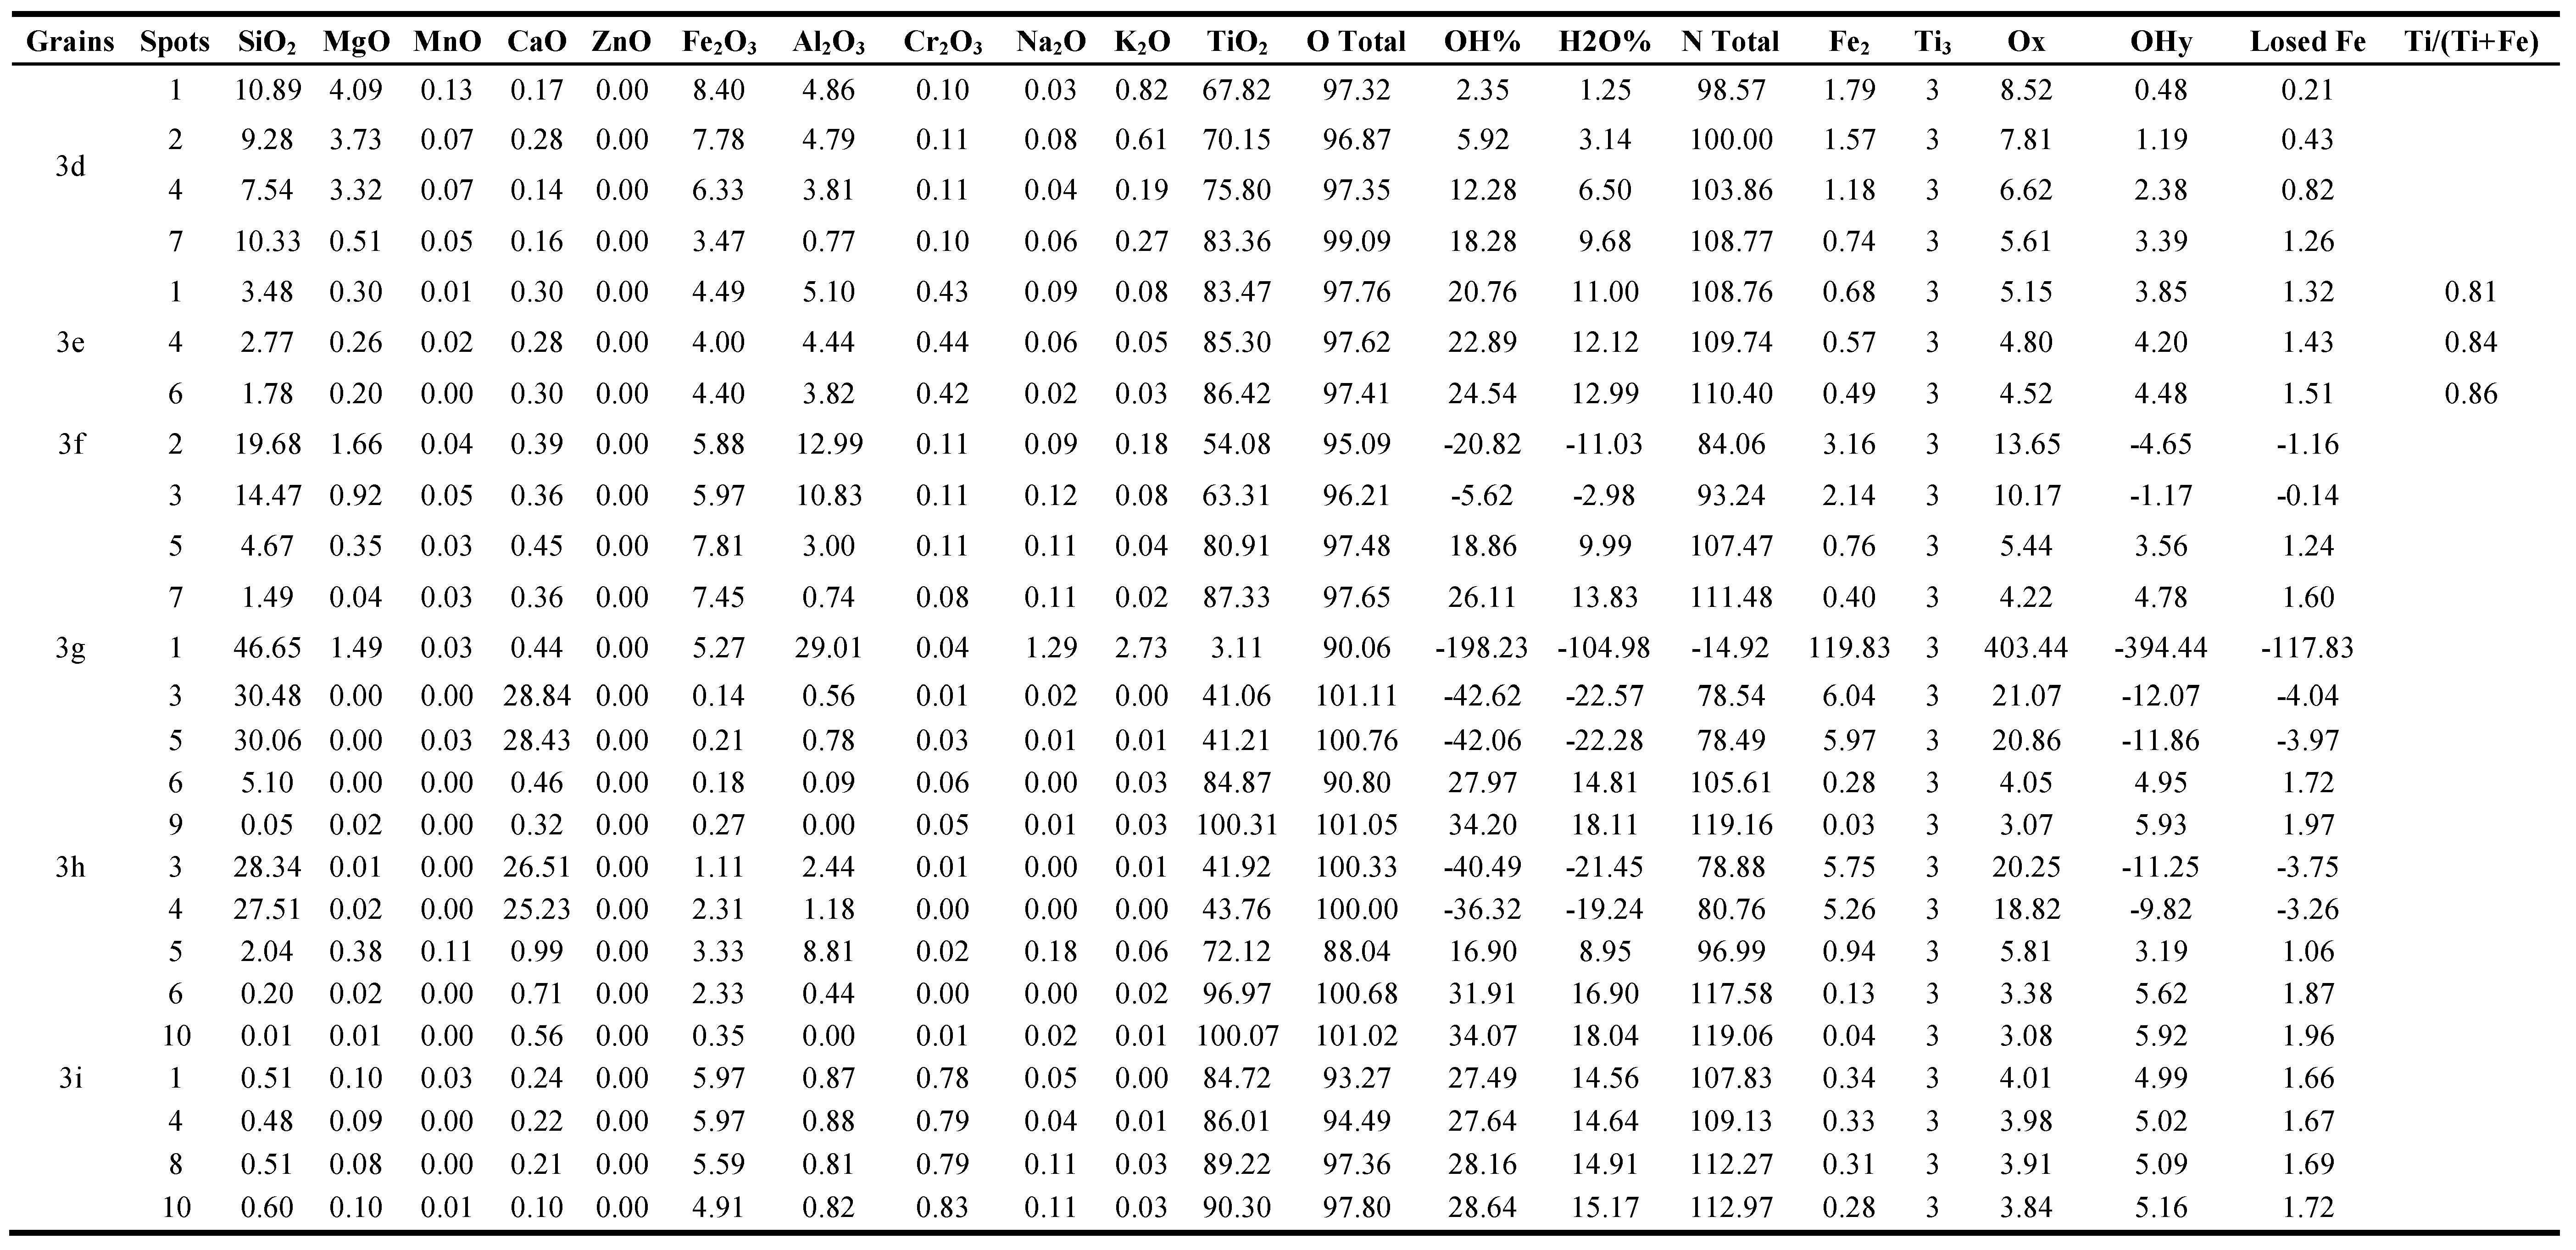
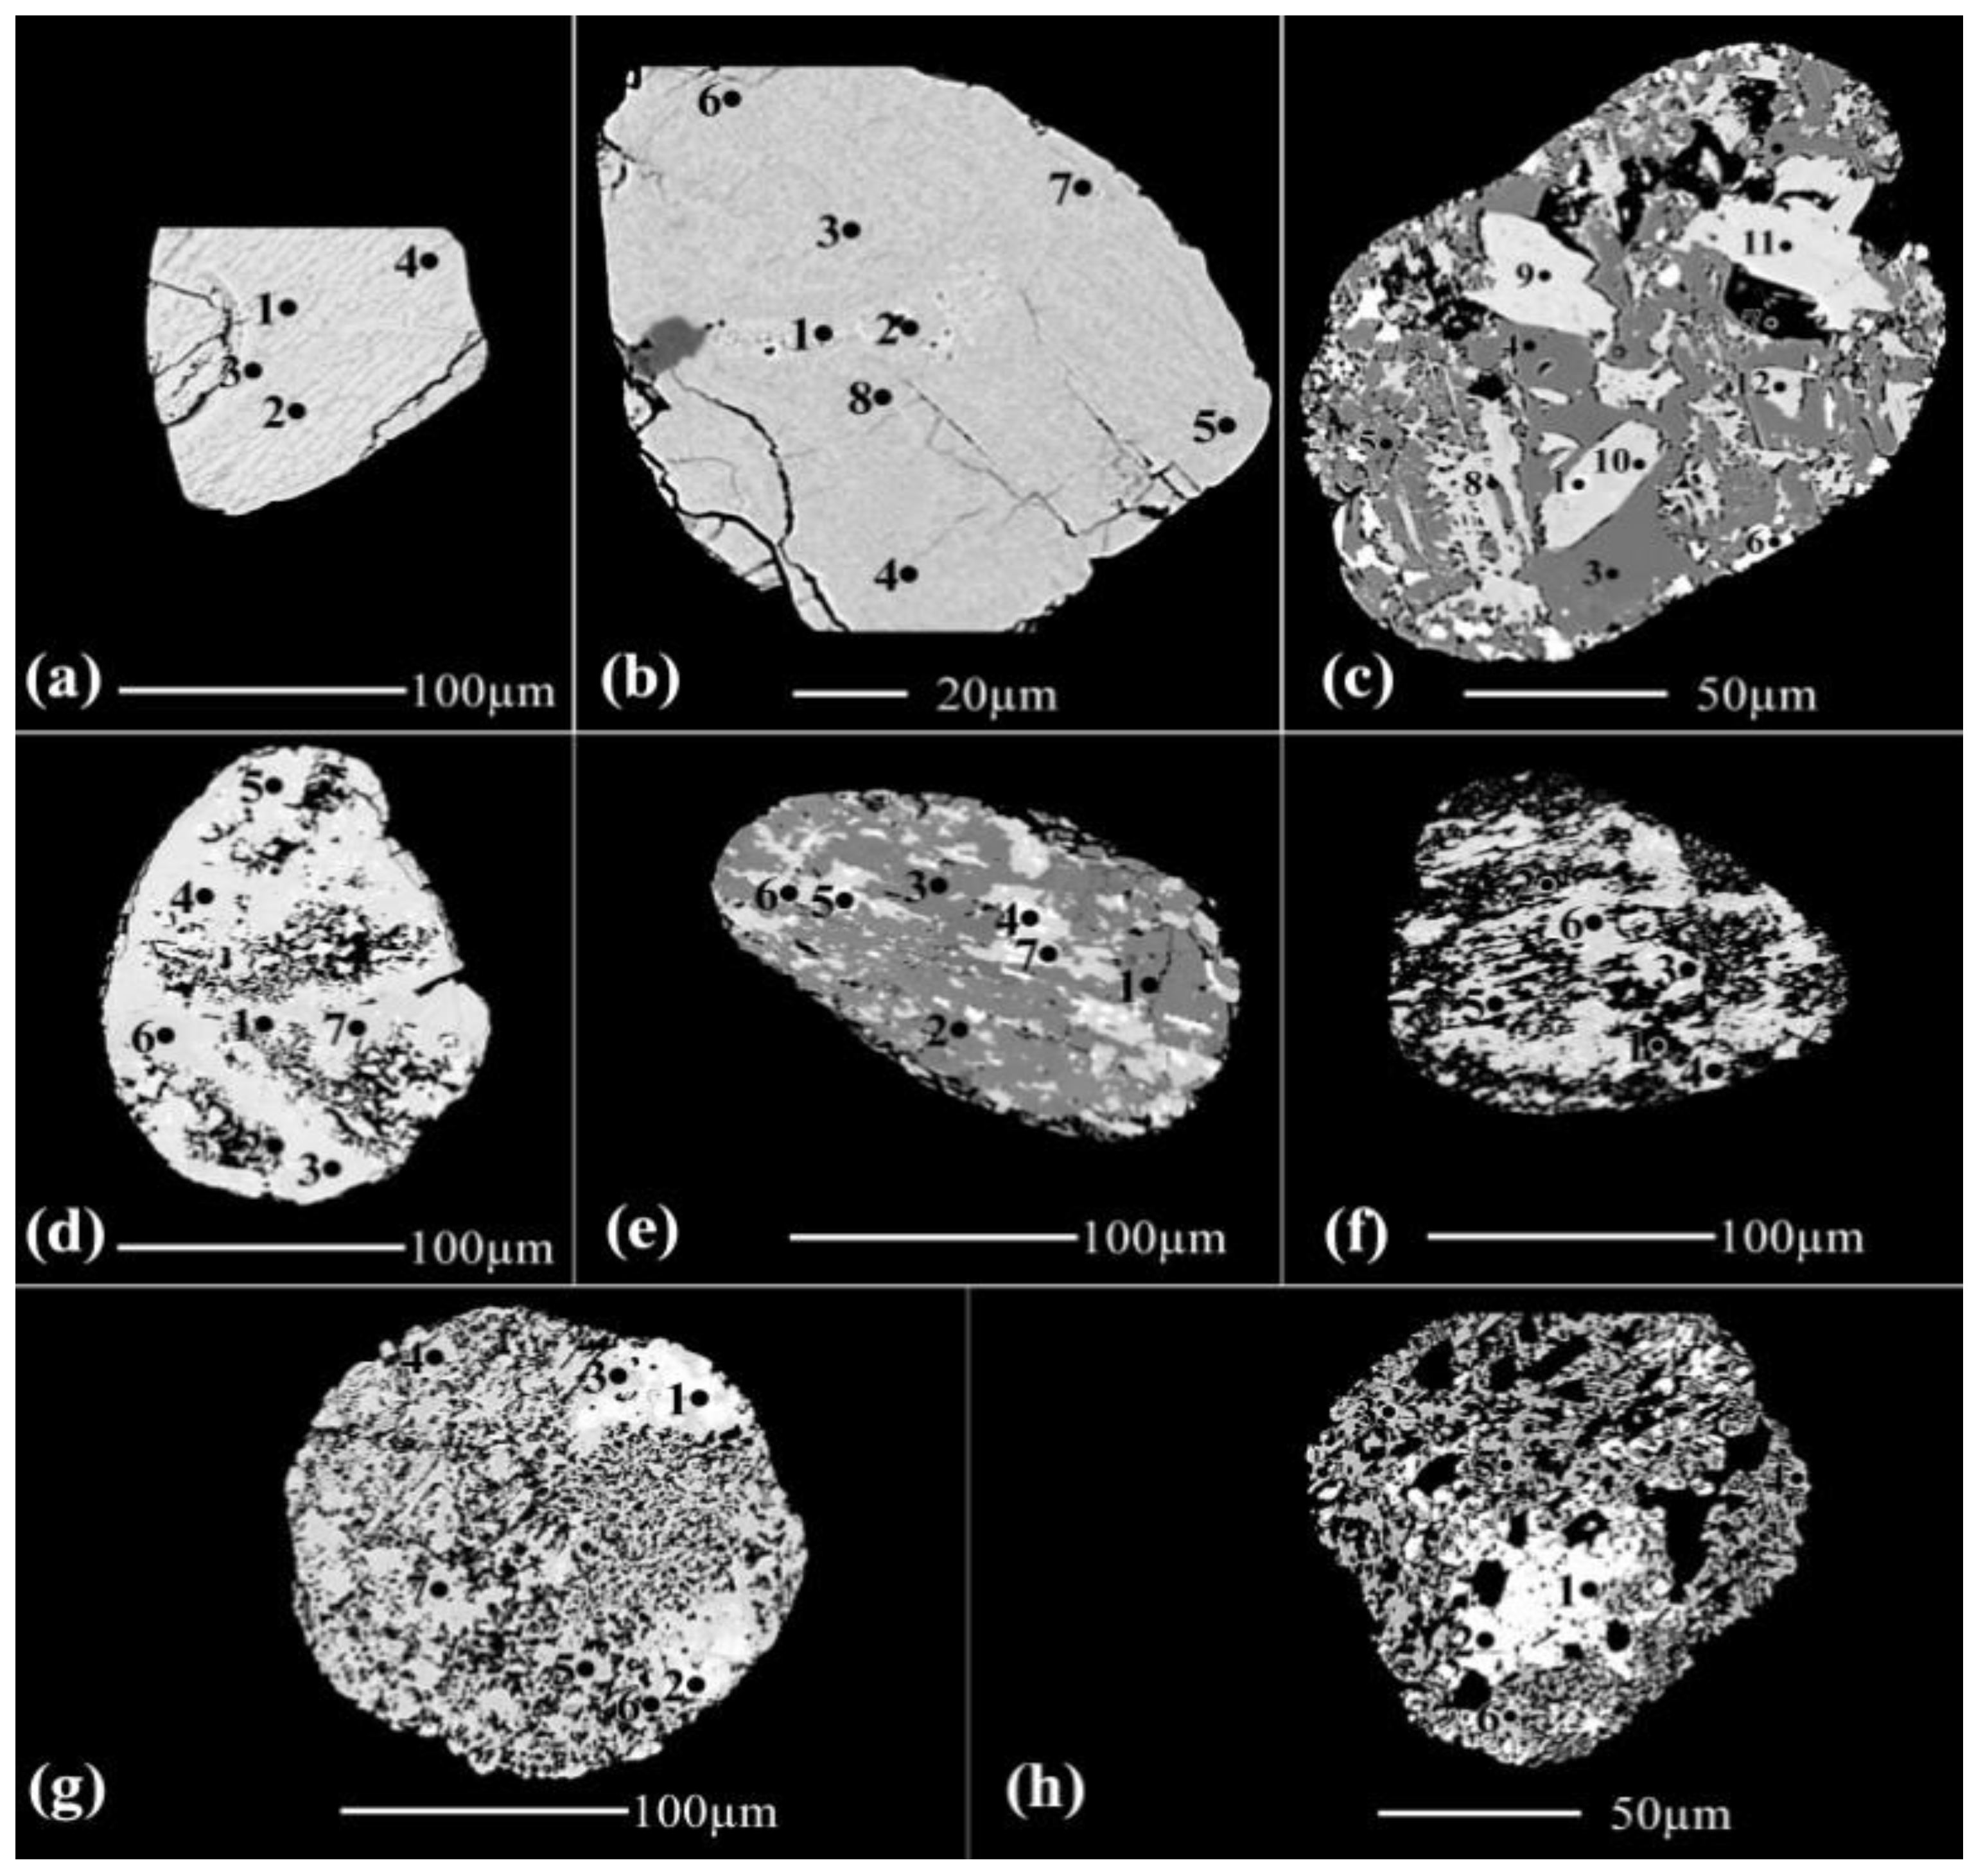
Nine grains are investigated of this coloured grain varieties (
Figure 3, Table 1). The grain (
Figure 3a), is composed of a definite lpsr phase with variable amounts of structural and/or molecular water. Both of spots 1, 2 and 3 contain relatively higher amounts of str and/or mol water than those of spots 4, 5 and 6. The detected lpsr spots have contents of TiO
2, Fe
2O
3, Fe, and Ti/(Ti+Fe) ratio range between 77.38-81.31%, 10.89-9.18%, 0.72-0.67, and 0.81-0.82, respectively. The chemical formulas range are of Fe
0.72-0.67Ti
3O
5.14-4.95(OH)
3.86-4.05 (Table 1).
Except of spot 1 in the grain (
Figure 3c), which is composed of silica, both of the three grains (
Figure 3b,3c and 3e), are broken lpsr.
In the grain (
Figure 3d), the contents of Al
2O
3 are varies directly with the contents of Fe
2O
3 in the analyzed spots. The contents of the analyzed Al
2O
3 are most probably related to the mechanism of psr alteration. It is clear that the contents of only SiO
2 are produced from an altered silicate mineral. In this grain as the TiO
2 contents enriched (more than 82%), as the contents of Al
2O
3 and structural and/or molecular water are highly decreases. The values of OT of the various analyzed spots are more than 98%.
In the grain (
Figure 3f), spots 1, 2 and 3 are for a definite altered silicate mineral where most of SiO
2, Al
2O
3 and MgO contents are leached out while the TiO
2 contents are enriched. The spots 4, 5, 6 and 7 are mixed individual phases of Ti and Fe oxides.
Spot 1 of the grain (
Figure 3g), is of a definite silicate mineral. The spots from 2 to 5 are sphene which seems have homogeneous chemical composition. The spots from 6 to 9 are for individual TiO
2 phase; most probably rutile. The contents of of Al
2O
3 in these last four spots indicate that the Al
2O
3 are not compatable with the well-defined rutile structure; TiO
2 ranges between 84.87 and 100.31%.
The spots from 1 to 4 of the grain (
Figure 3h), are sphene. Comparing the chemical composition of spots 3, 4, with spot 5 may ensure that in spot 5 both of SiO
2 and CaO of sphene are leached by solutions containing both Al
2O
3 and Na
2O, leading to the enrichment of the immobile TiO
2. The spots from 6 to 10 are rutile after the leaching of sphene. These spots reflect the incompatibility of SiO
2& Al
2O
3 in the structure of rutile.
In the grain (
Figure 3i), the spots of this grain are broken lpsr where they are composed mainly of individual TiO
2 phase and minor Fe
2O
3 phase.
3.1.4. The detected black coloured grains at 0.5 ampere
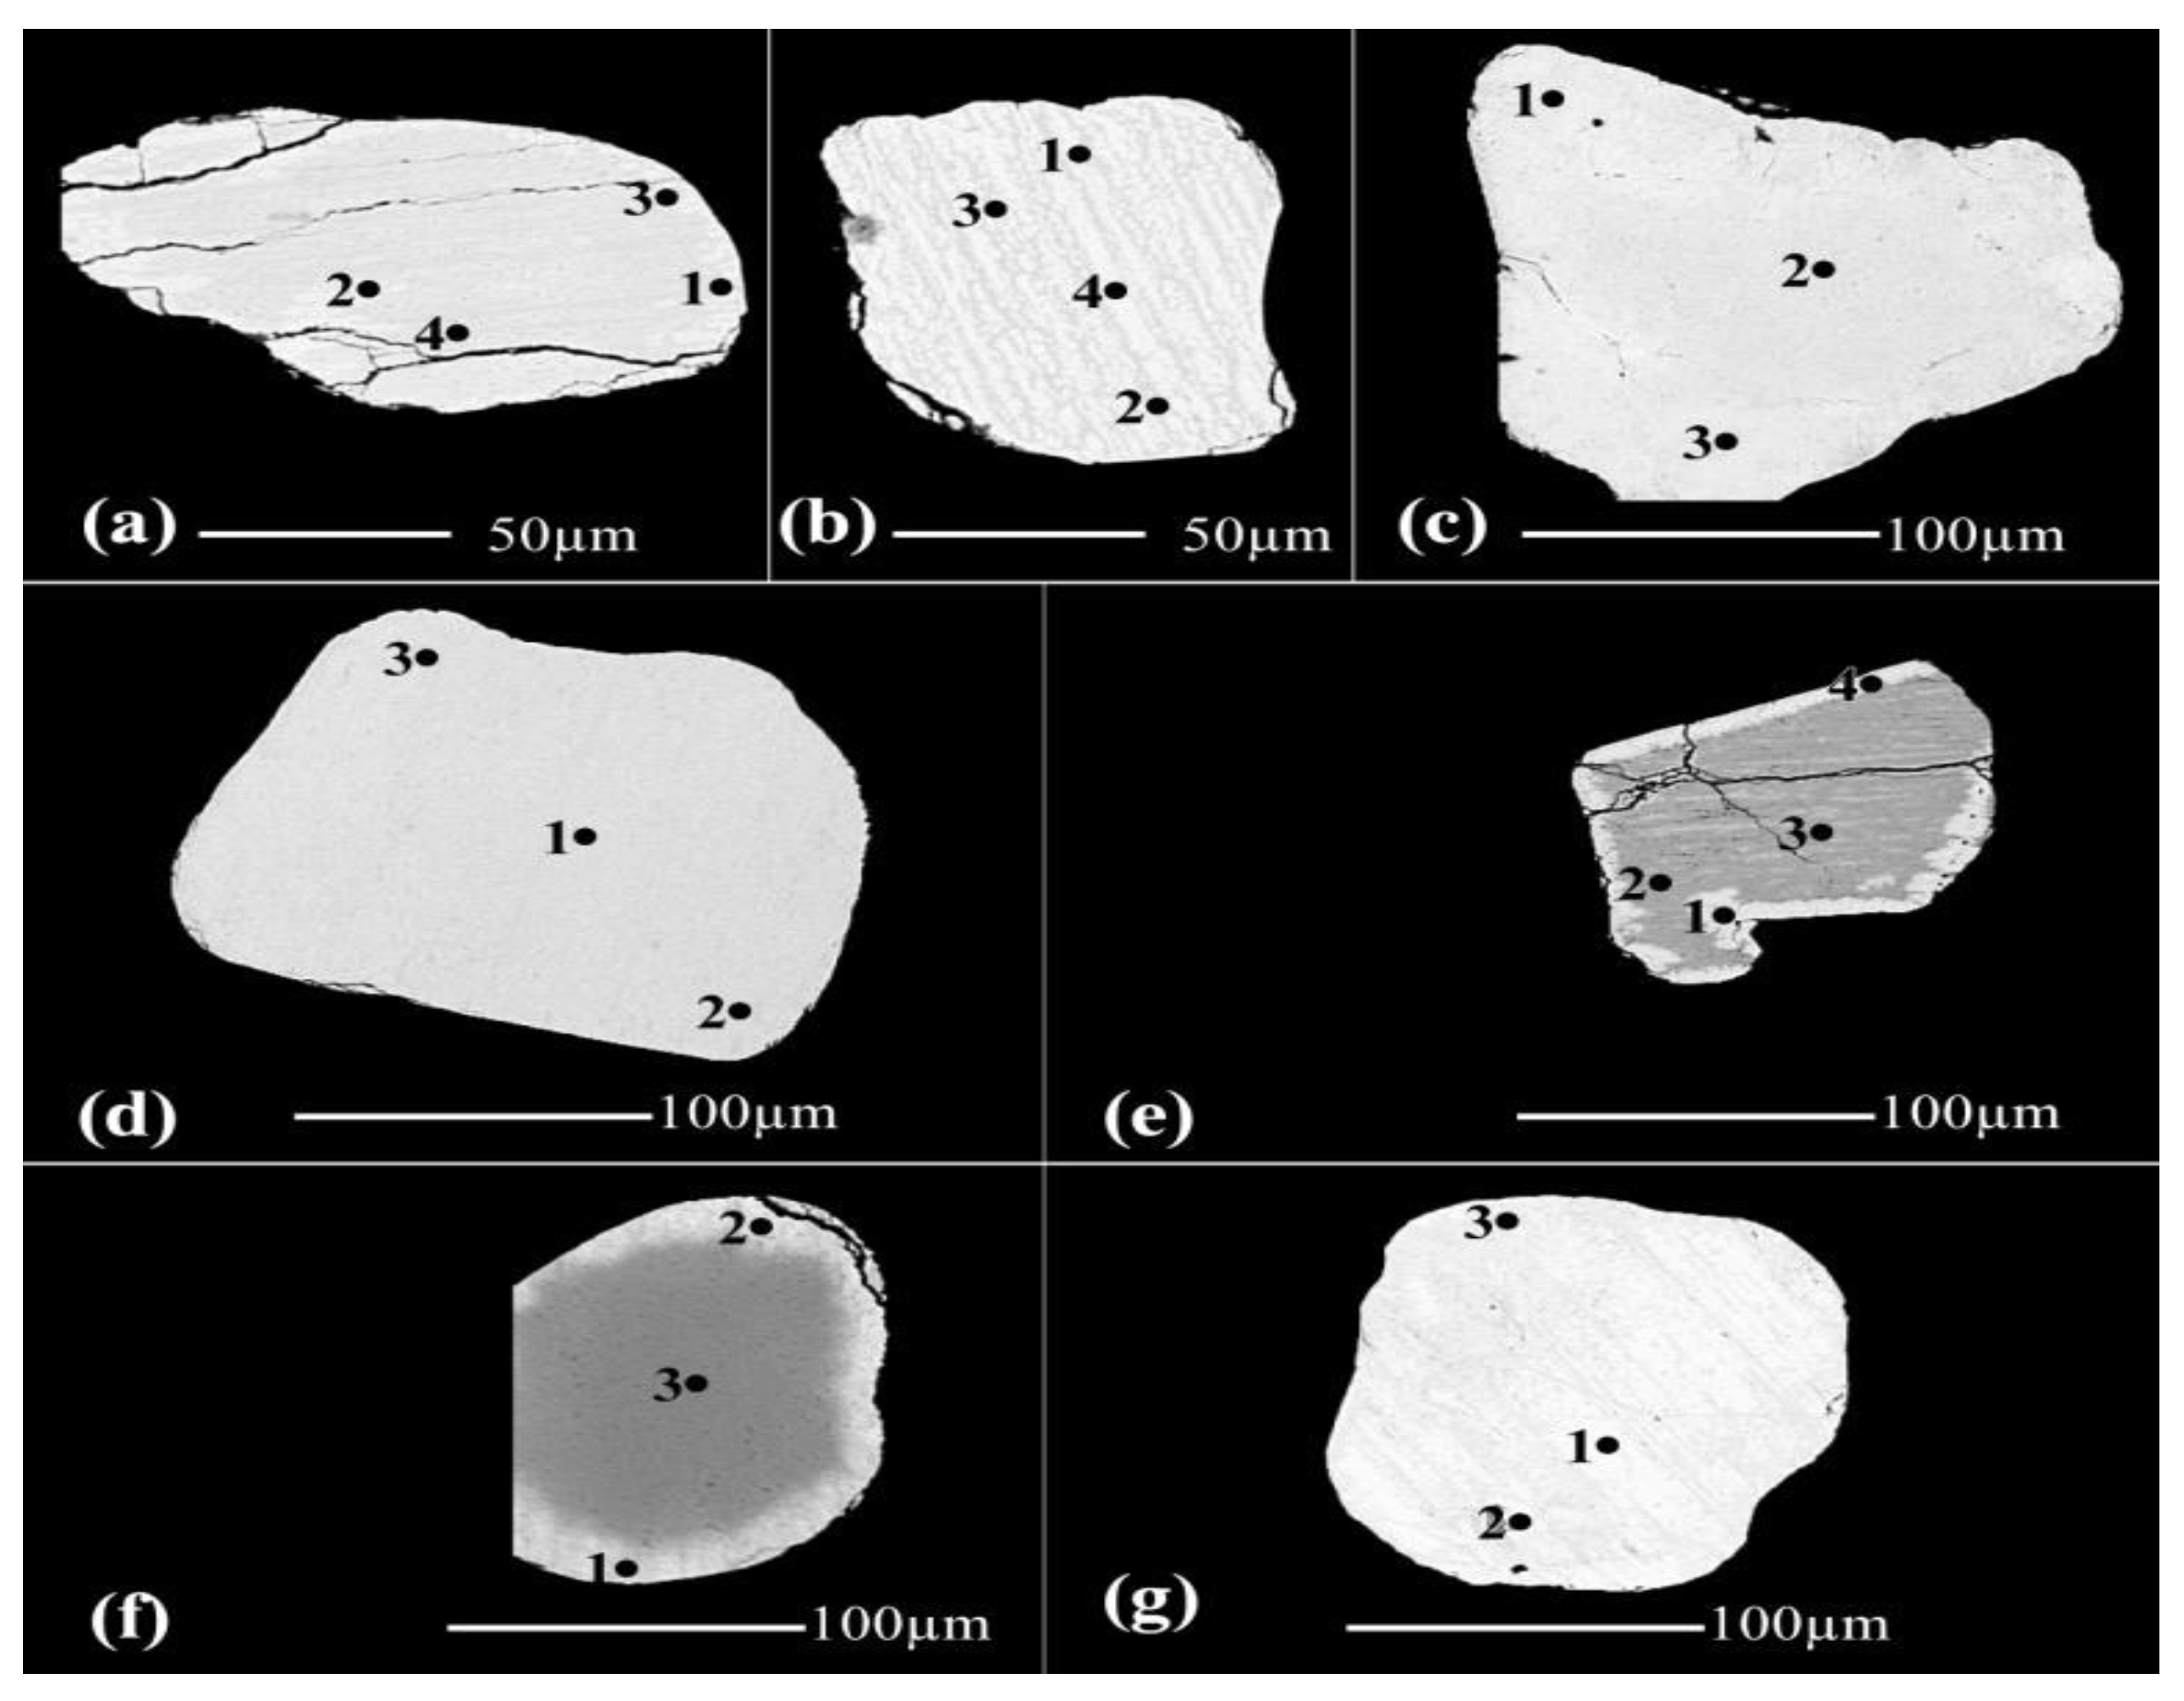
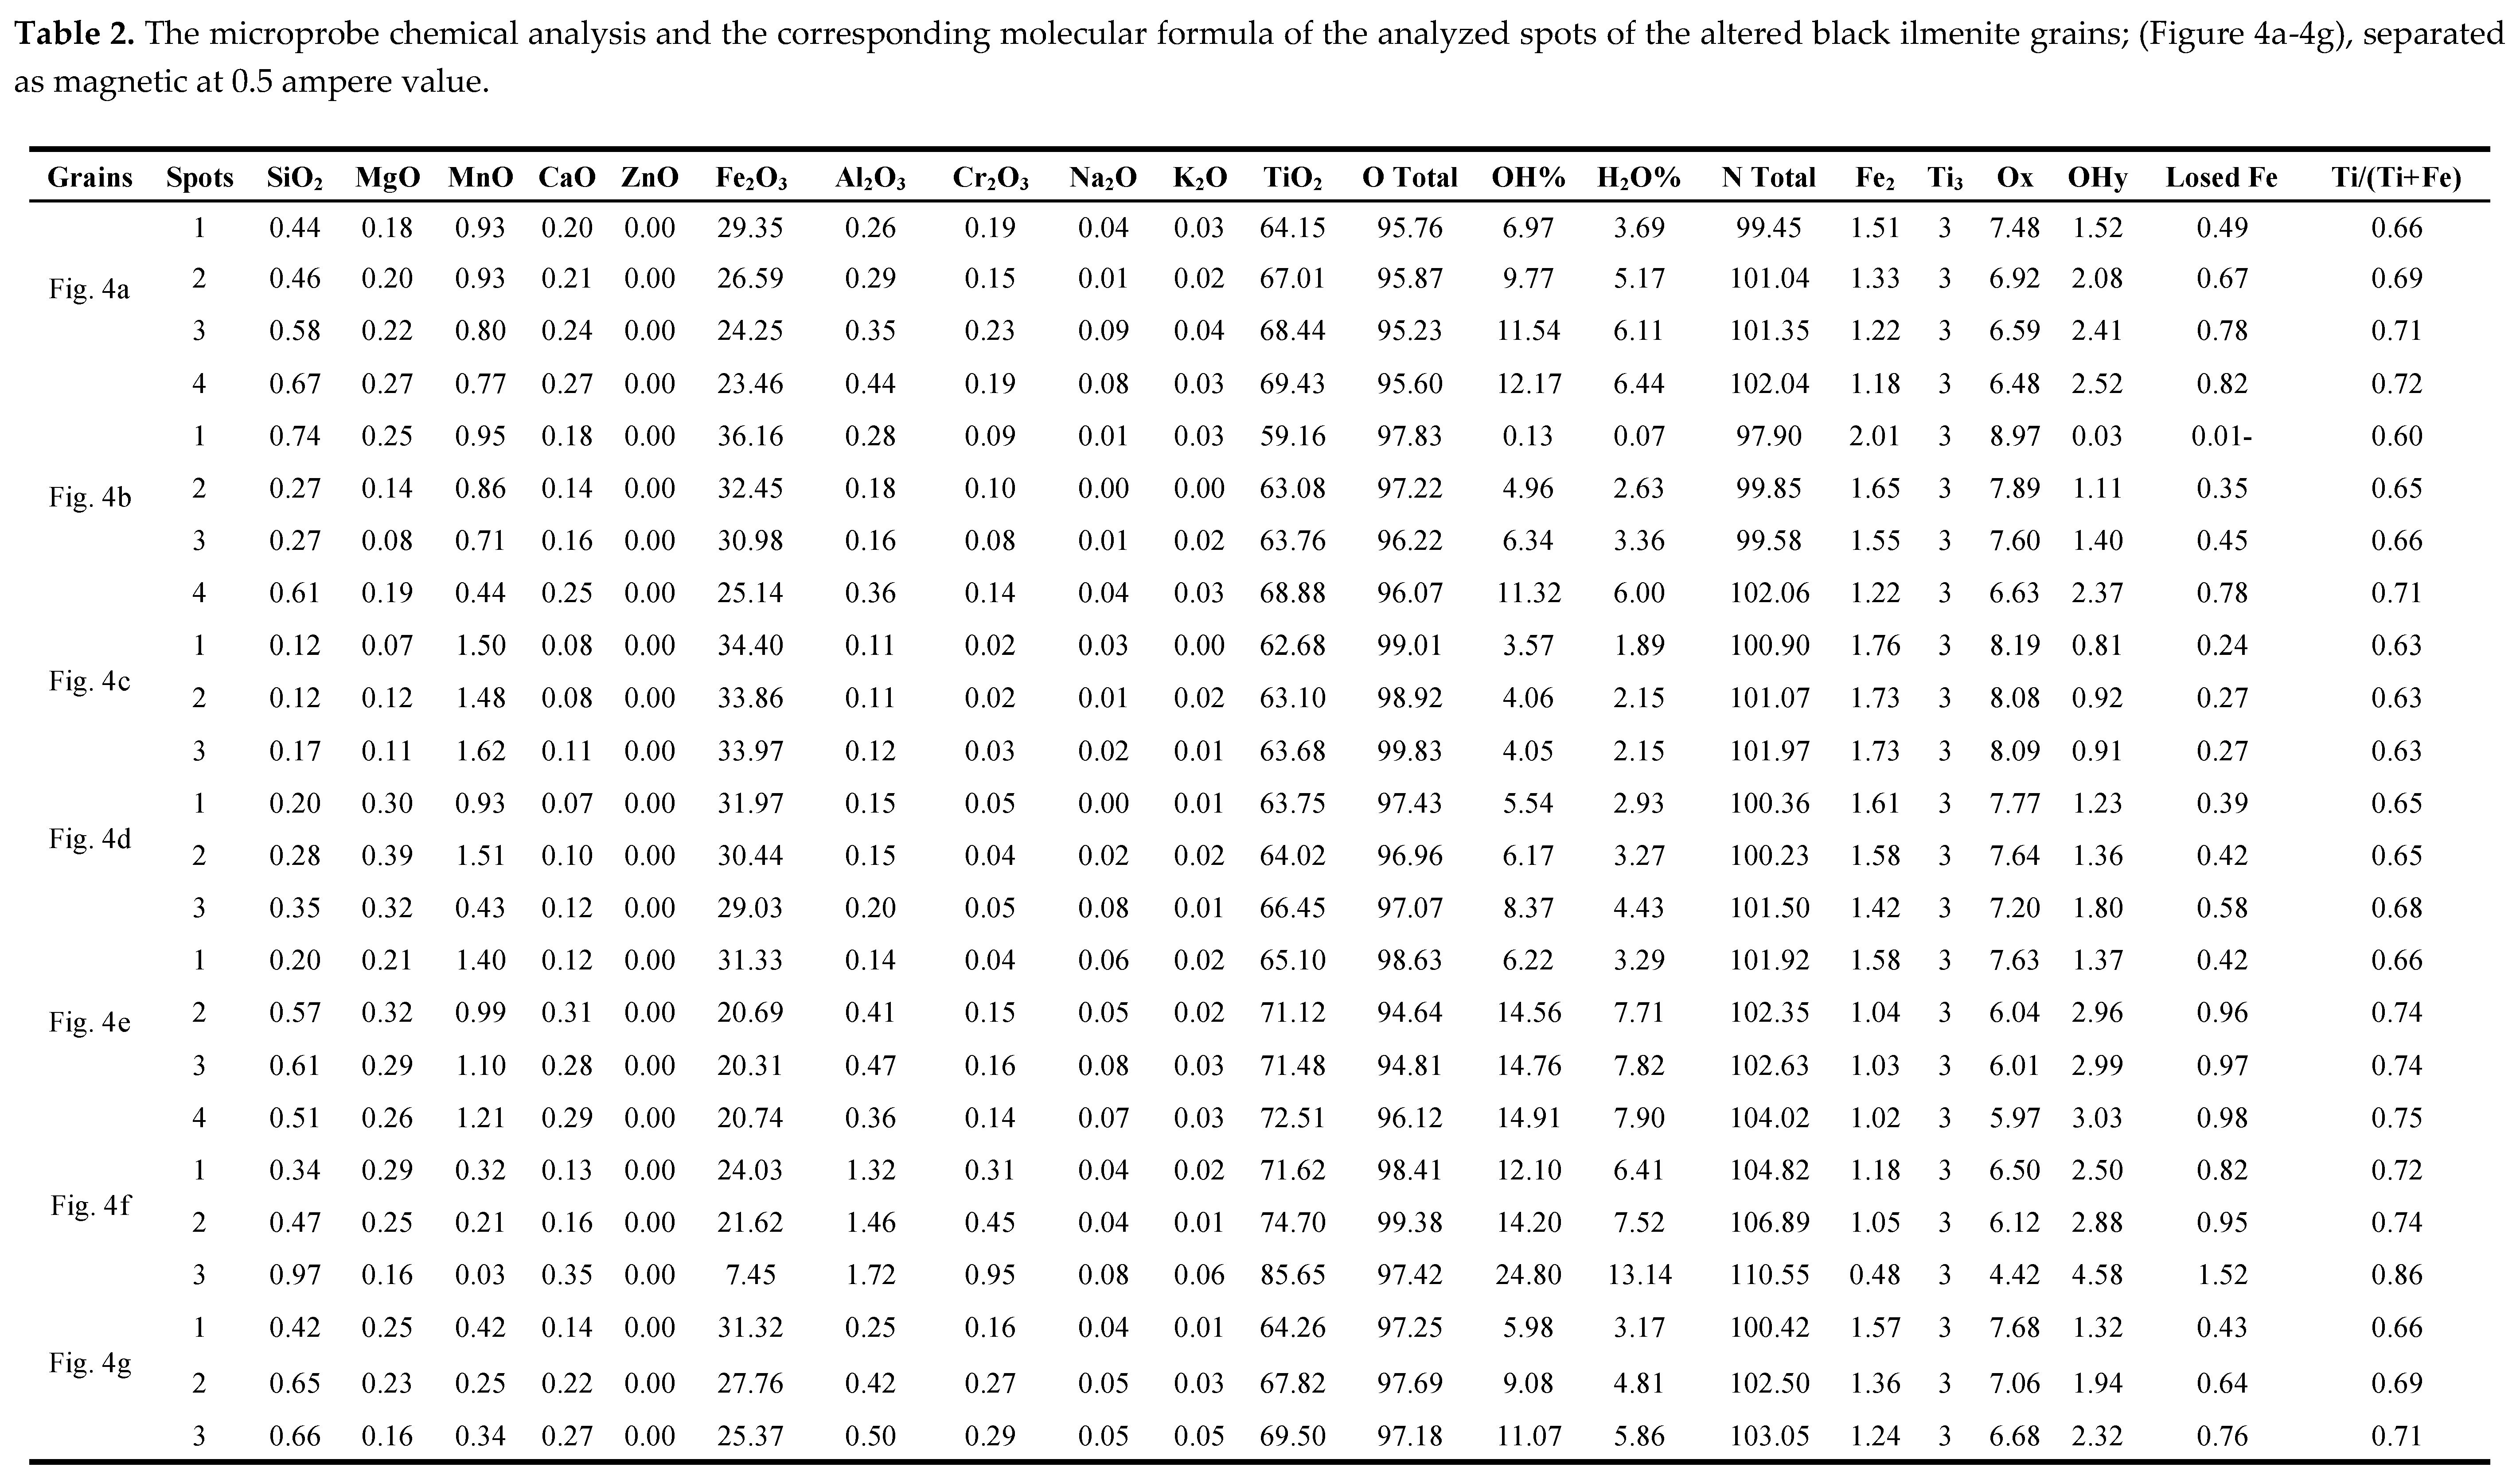
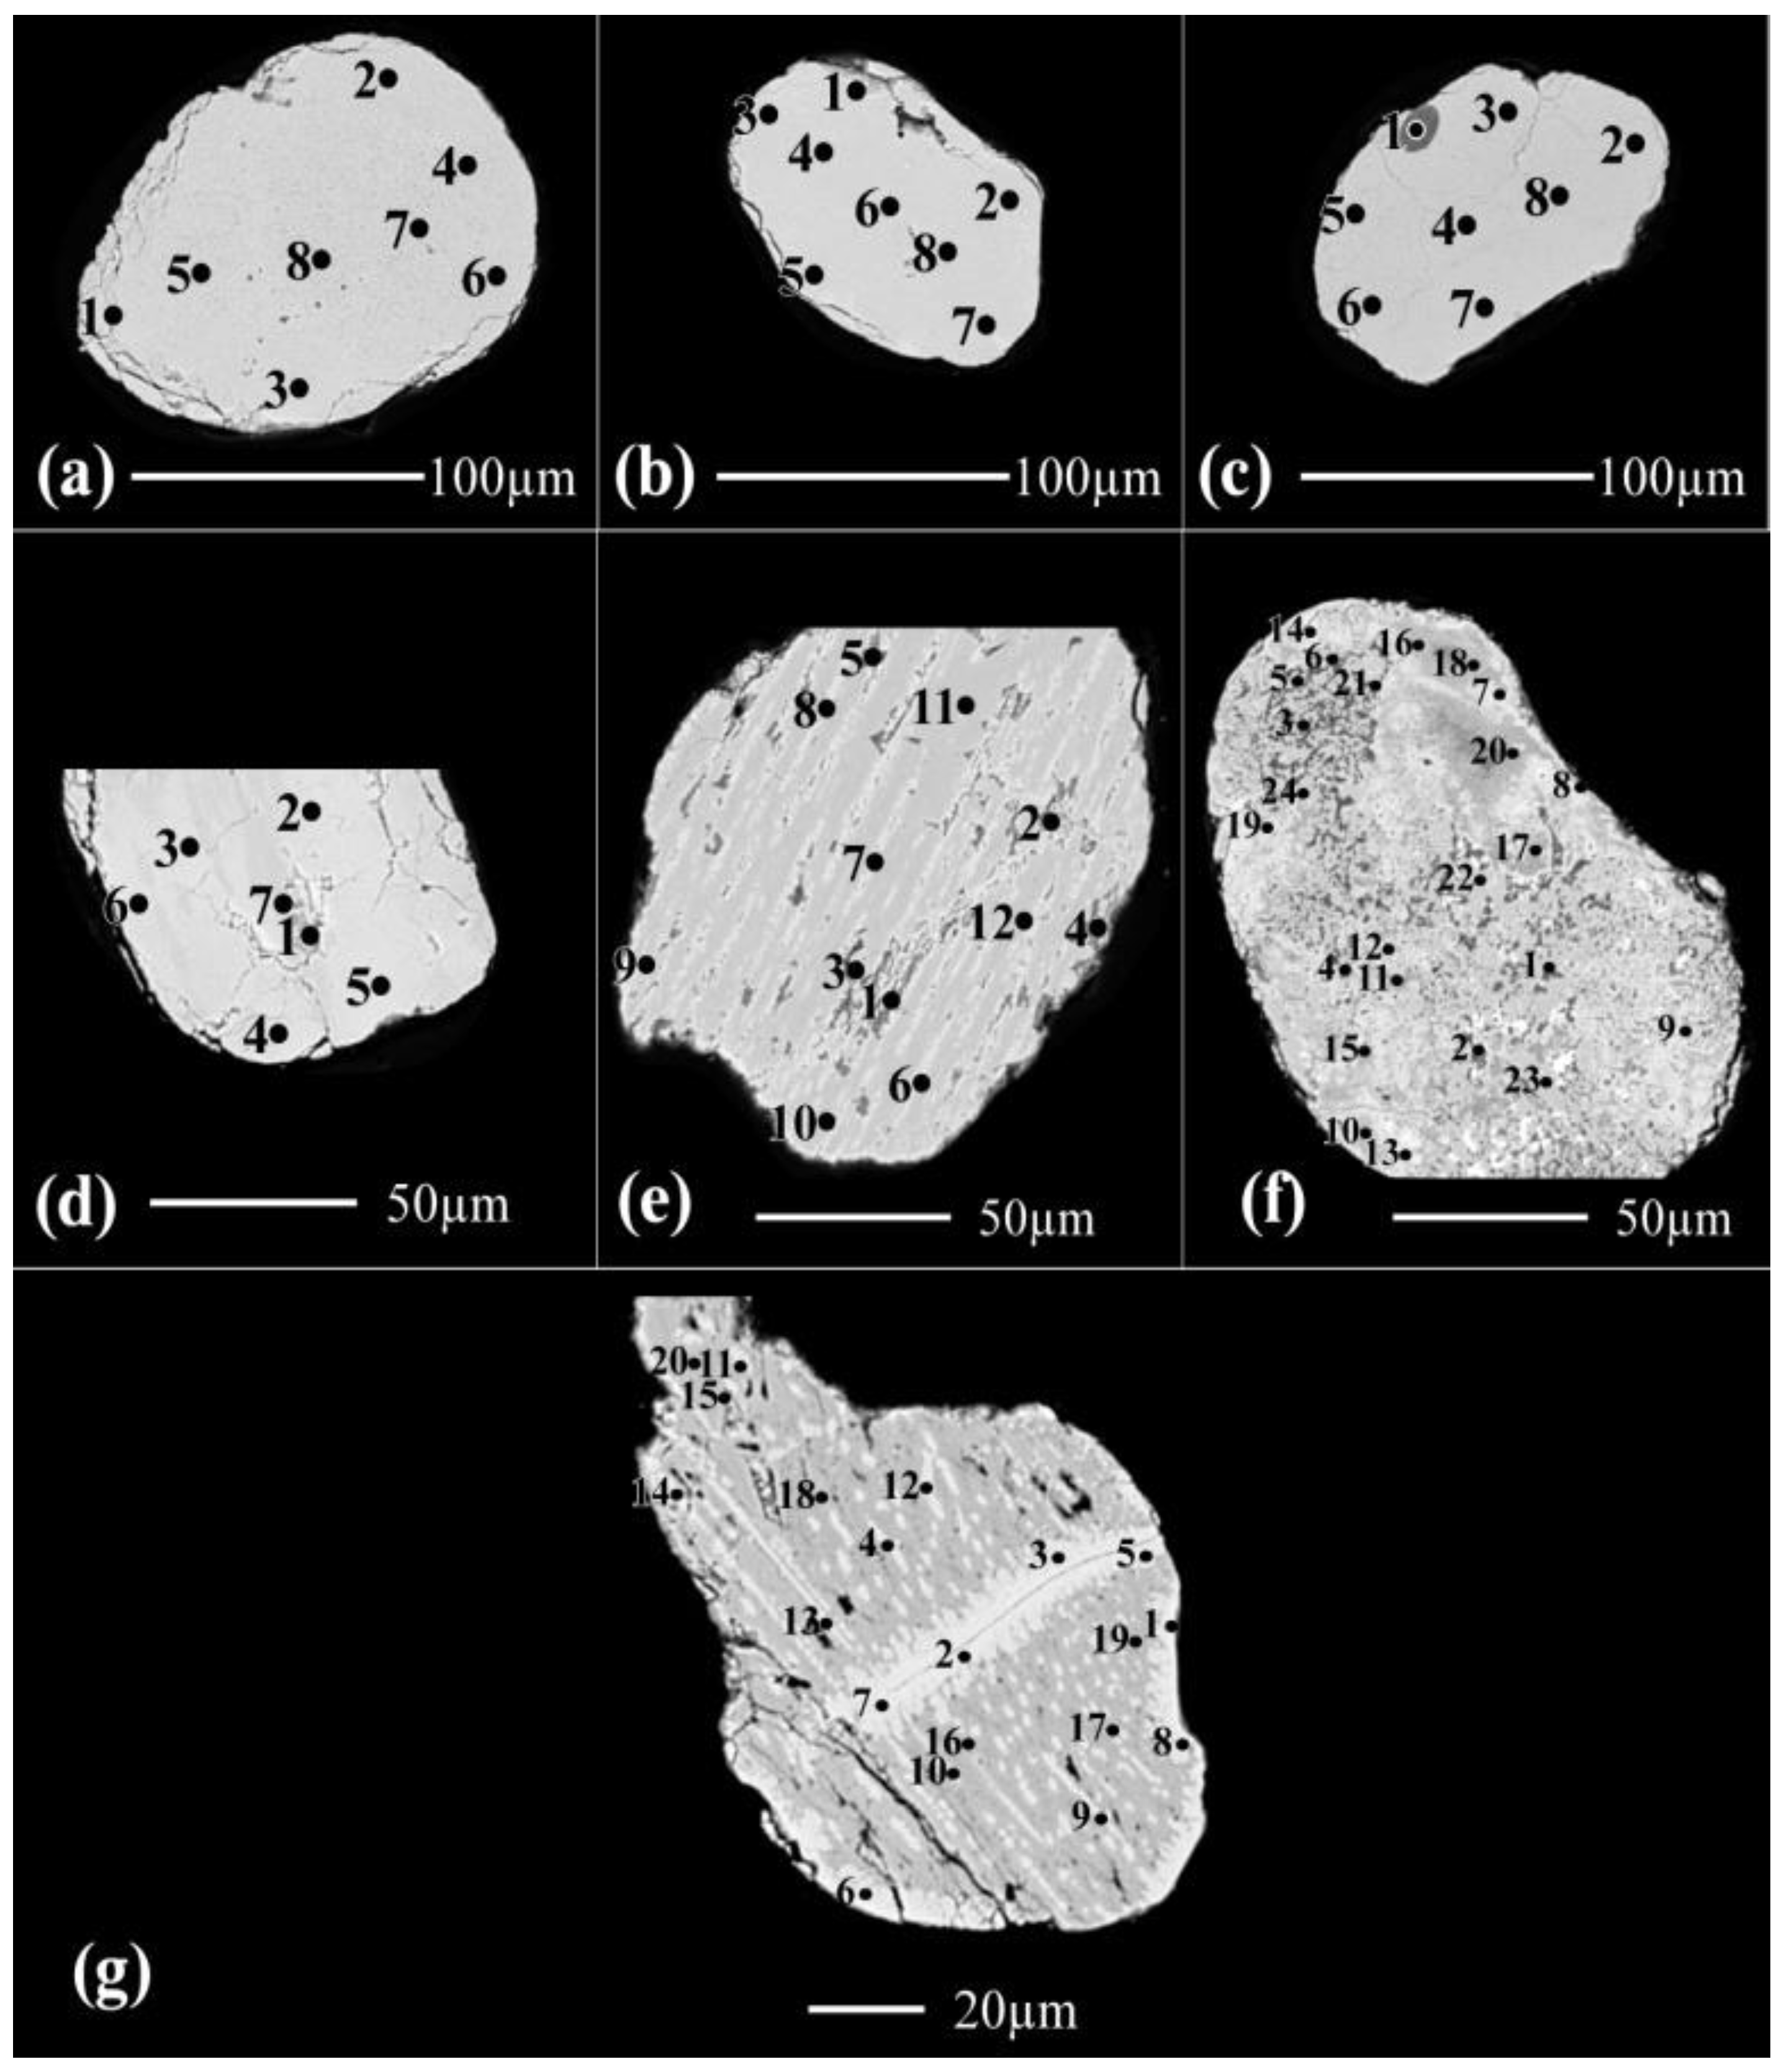
Seven black grains are investigated in the magnetic fraction of 0.5 ampere (
Figure 4, Table 2). The grain (
Figure 4a), is composed of Psr and lpsr phases. As the TiO
2 contents increase, as the contents of structural and/or molecular water increase. Also, according to the values of OT and NT of these spots, the calculated contents of structural water are not accepted. The presence of an individual TiO
2 phase associated with the lpsr phase is postulated (Table 2, grain 4a).
Figure 3.
The back scattered electron (BSE) images of the altered pale brown, yellow, creamy and whitecoloured ilmenite grains; (3a) to (3i), separated as magnetic at 0.5 ampere value.
Figure 3.
The back scattered electron (BSE) images of the altered pale brown, yellow, creamy and whitecoloured ilmenite grains; (3a) to (3i), separated as magnetic at 0.5 ampere value.
Figure 4.
The back scattered electron (BSE) images of the altered black ilmenite grains; (4a) to (4g), separated as magnetic at 0.5 ampere value.
Figure 4.
The back scattered electron (BSE) images of the altered black ilmenite grains; (4a) to (4g), separated as magnetic at 0.5 ampere value.
In the grain (
Figure 4b), spot 1 is psr. Taking the calculated value of cationic iron of this spot into consideration ( Table 2), it is detected that some amounts of analyzed iron still present as the divalent iron Fe
++. The psr of spot 1 is different than that of spots 2&3 which in turn are different than that of spot 4.
The values of OT for the analyzed spots of the other five grains (
Figure 4c-4f), reflect that the grains are psr-lpsr of various chemical formulas. Some of their analyzed spots contain individual phases of TiO
2 in addition to the lpsr phases. As for example, the spots of 2, 3, and 4 of grain (
Figure 4e), are lpsr of the same phase. The calculated NT values ensures that the calculated structural water is incorrect where the mechanism of alteration at these TiO
2 contents of the spots is changed.
The recorded psr-lpsr spots of the grains of (
Figure 4), have contents of TiO
2, Fe
2O
3, Fe, and Ti/(Ti+Fe) ratio range between 59.16-74.7%, 36.16-20.31%, 2.01-0.48, and 0.6-0.75, respectively. The psr-lpsr spots of the grains have the chemical formulas range of Fe
2.01-0.48Ti
3O
8.97-4.42(OH)
0.03-4.48 (Table 2).
According to [
33], within the pseudorutile composition range (60-71% TiO
2), the water content increased from ~ 2 to 4.5 wt.% with decreasing iron oxide content. The intermediate alteration phases comprised mixtures of TiO
2 with iron hydroxides.
In fact, within the given composition range of [
33], the maximum limit of water content for the produced lpsr phases may be much more than the given maximum limit value. Even the lower limit value may be relatively lower than ~ 2%.
