Submitted:
25 April 2023
Posted:
26 April 2023
You are already at the latest version
Abstract
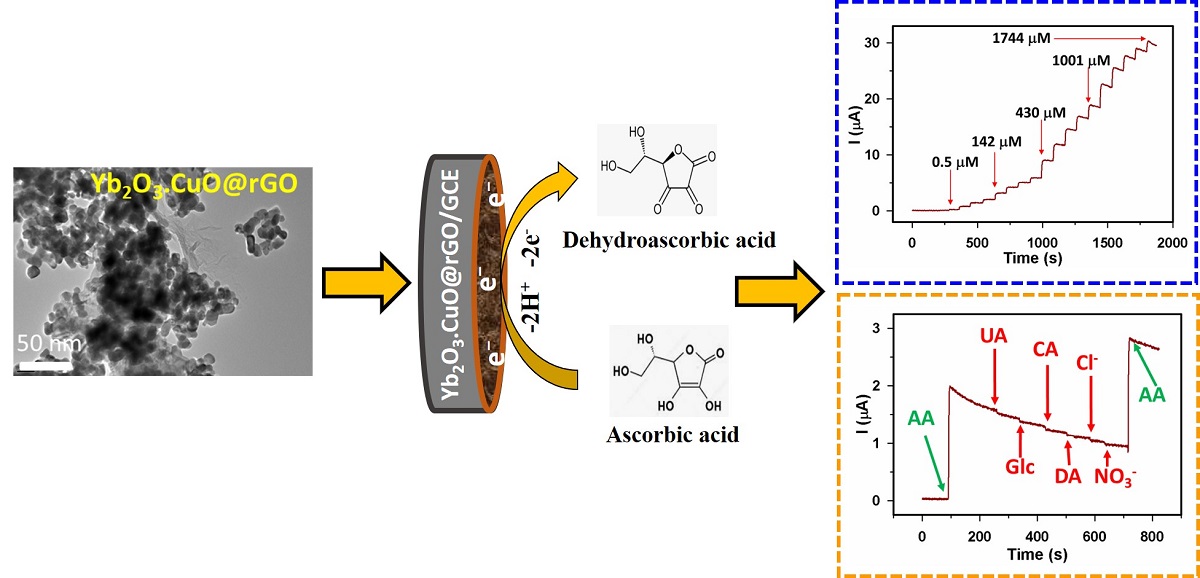
Keywords:
1. Introduction
2. Materials and Methods
2.1. Materials
2.2. Synthesis of CuO, Yb2O3, Yb2O3.CuO, and Yb2O3.CuO@rGO nanocomposite
2.3. GCE modification using Yb2O3.CuO@rGO nanocomposite
3. Results and Discussion
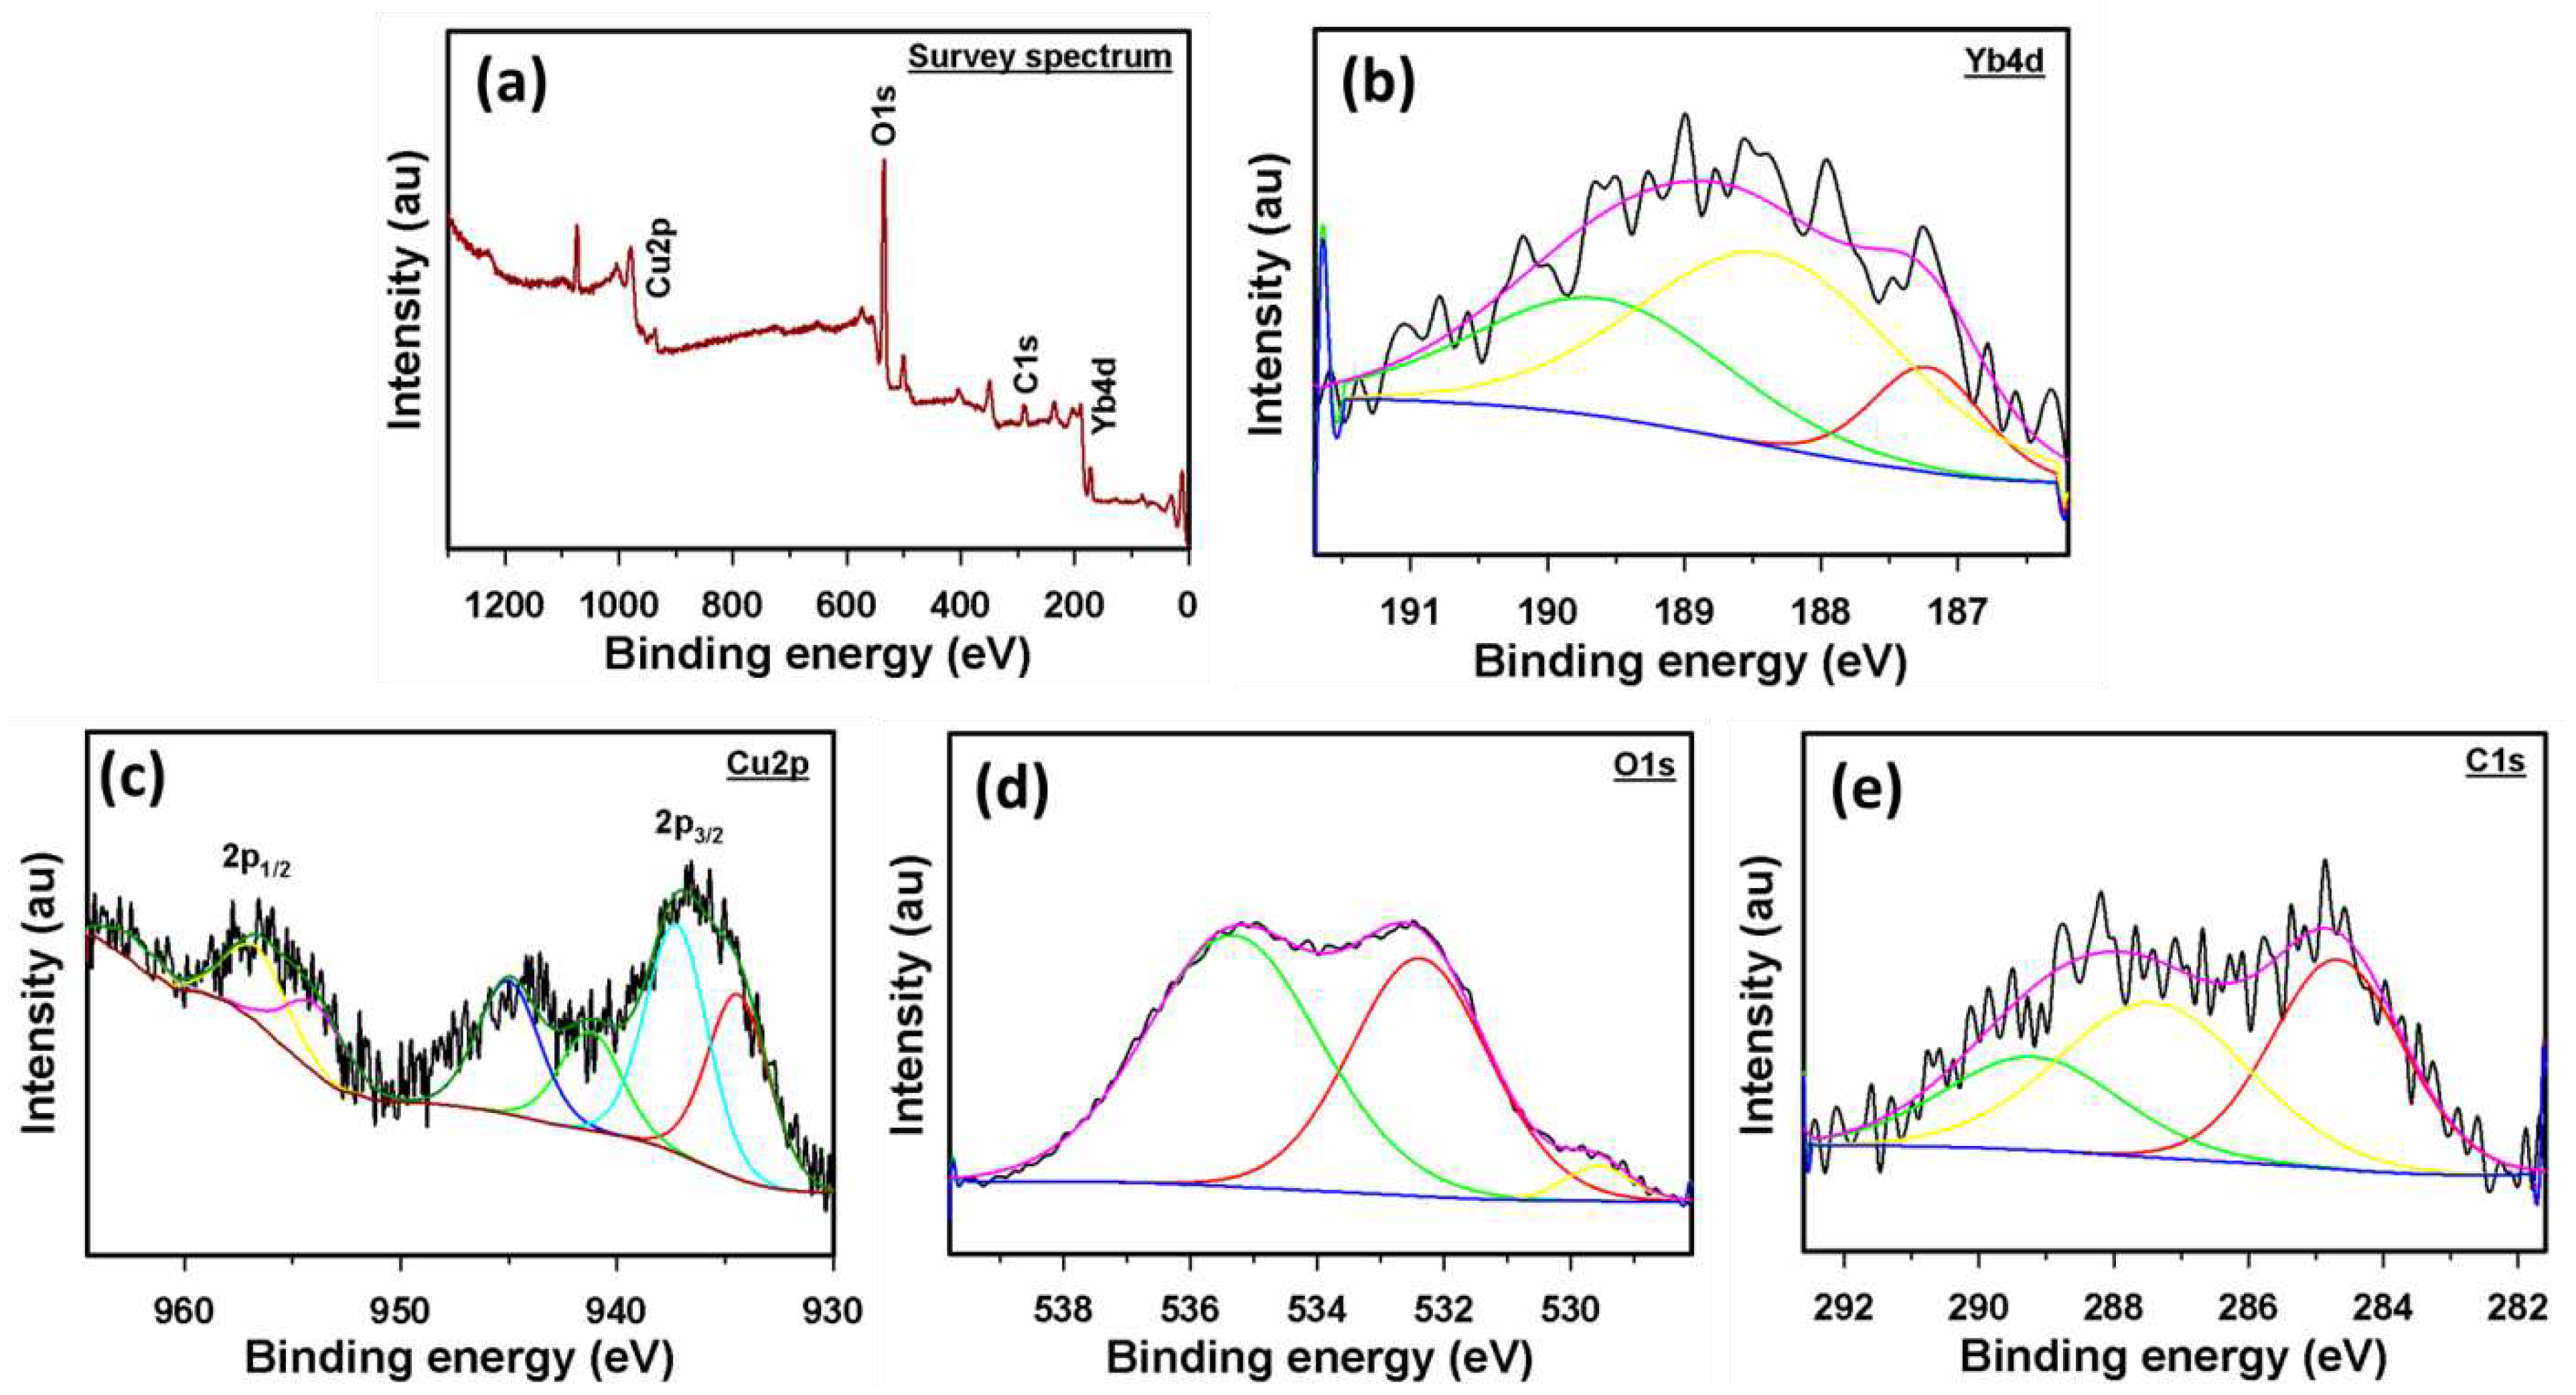
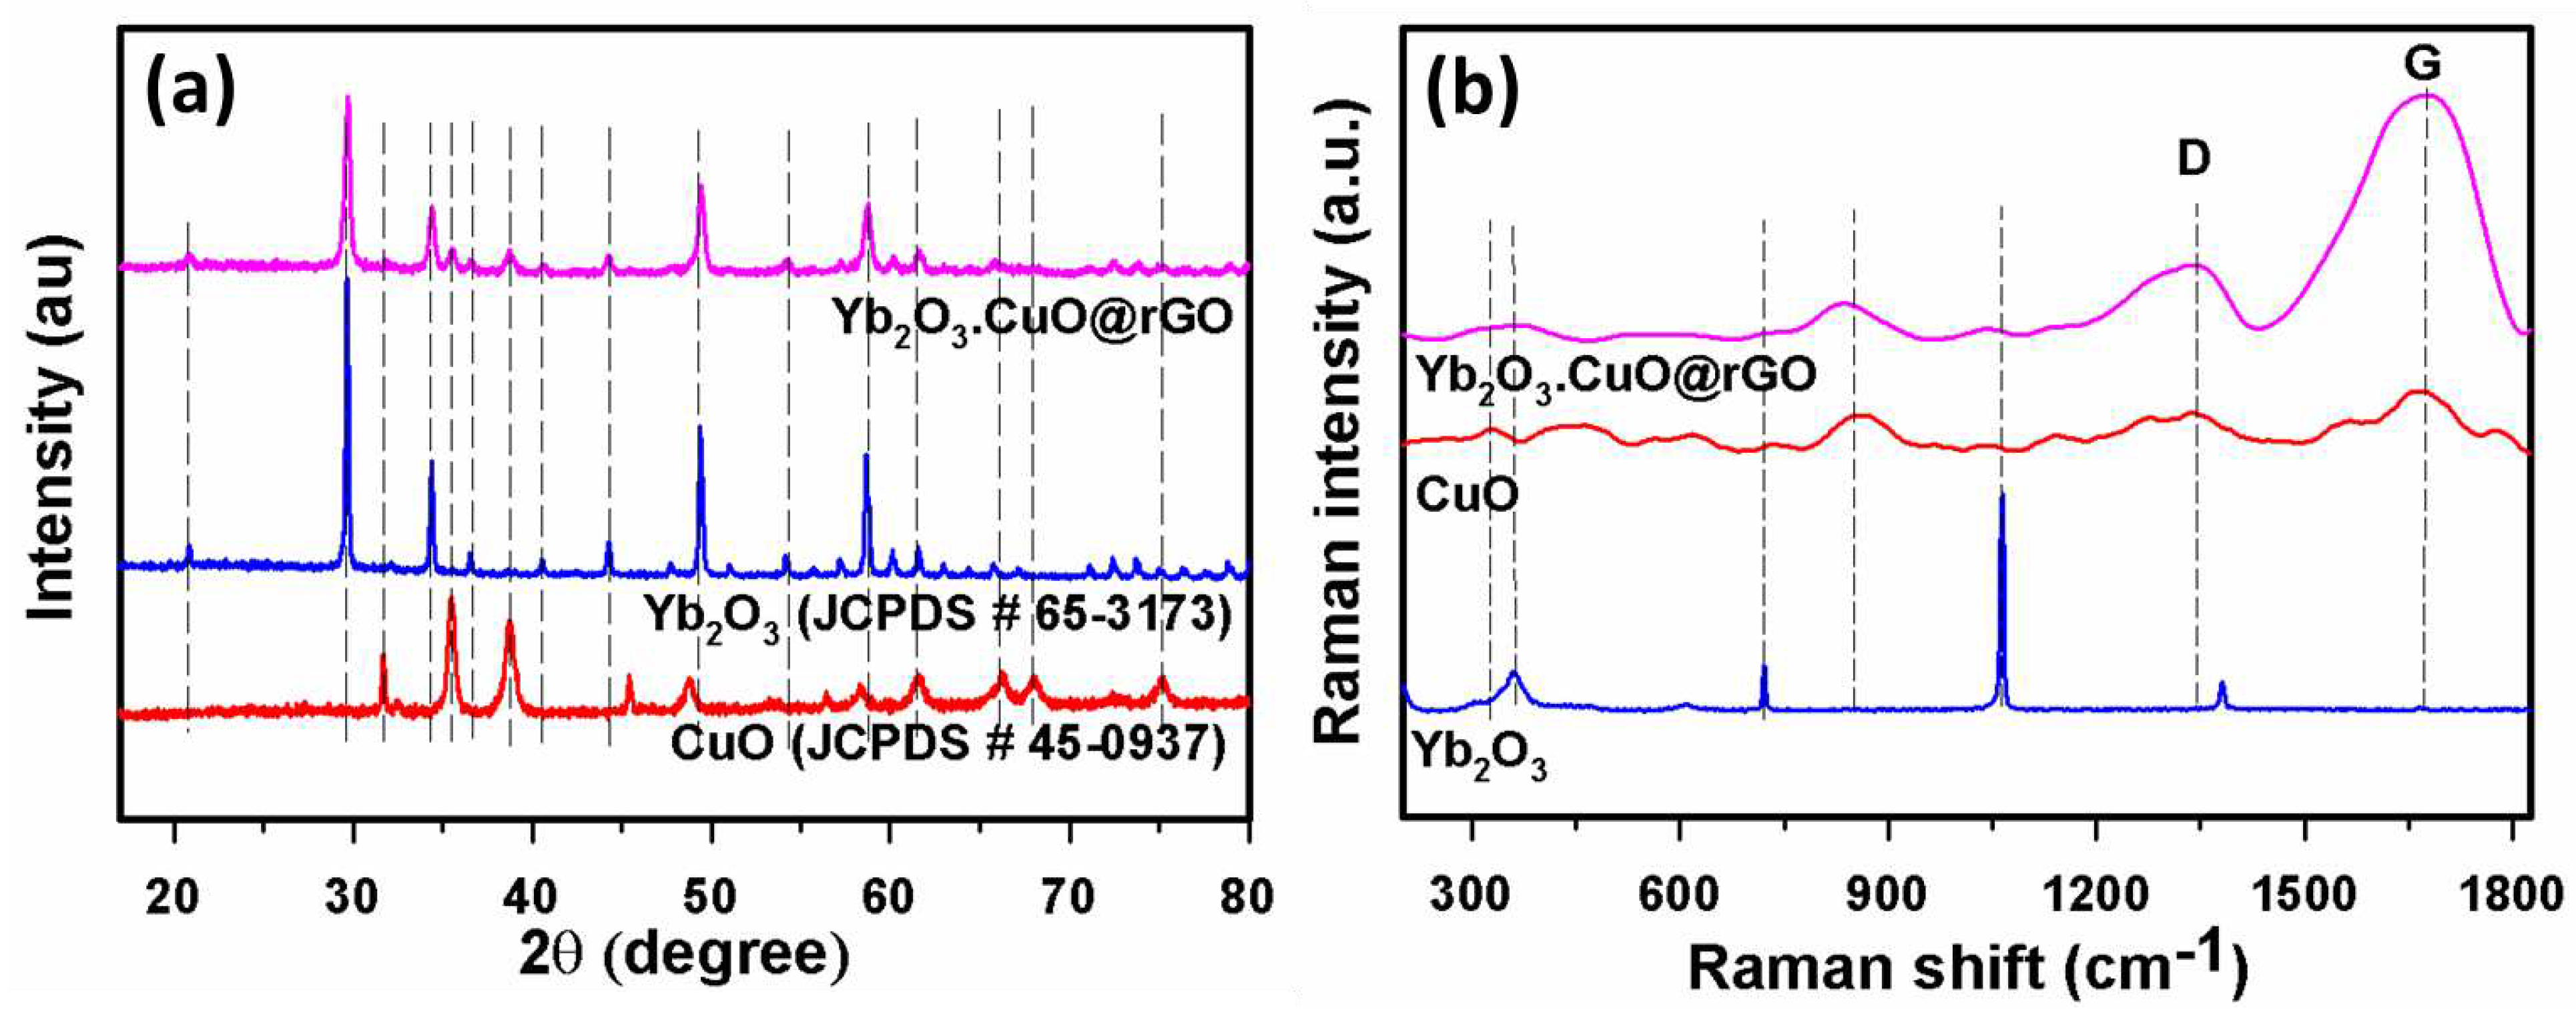
3.1. Characterization of Yb2O3.CuO@rGO nanocomposite
3.2. Ascorbic acid sensor development
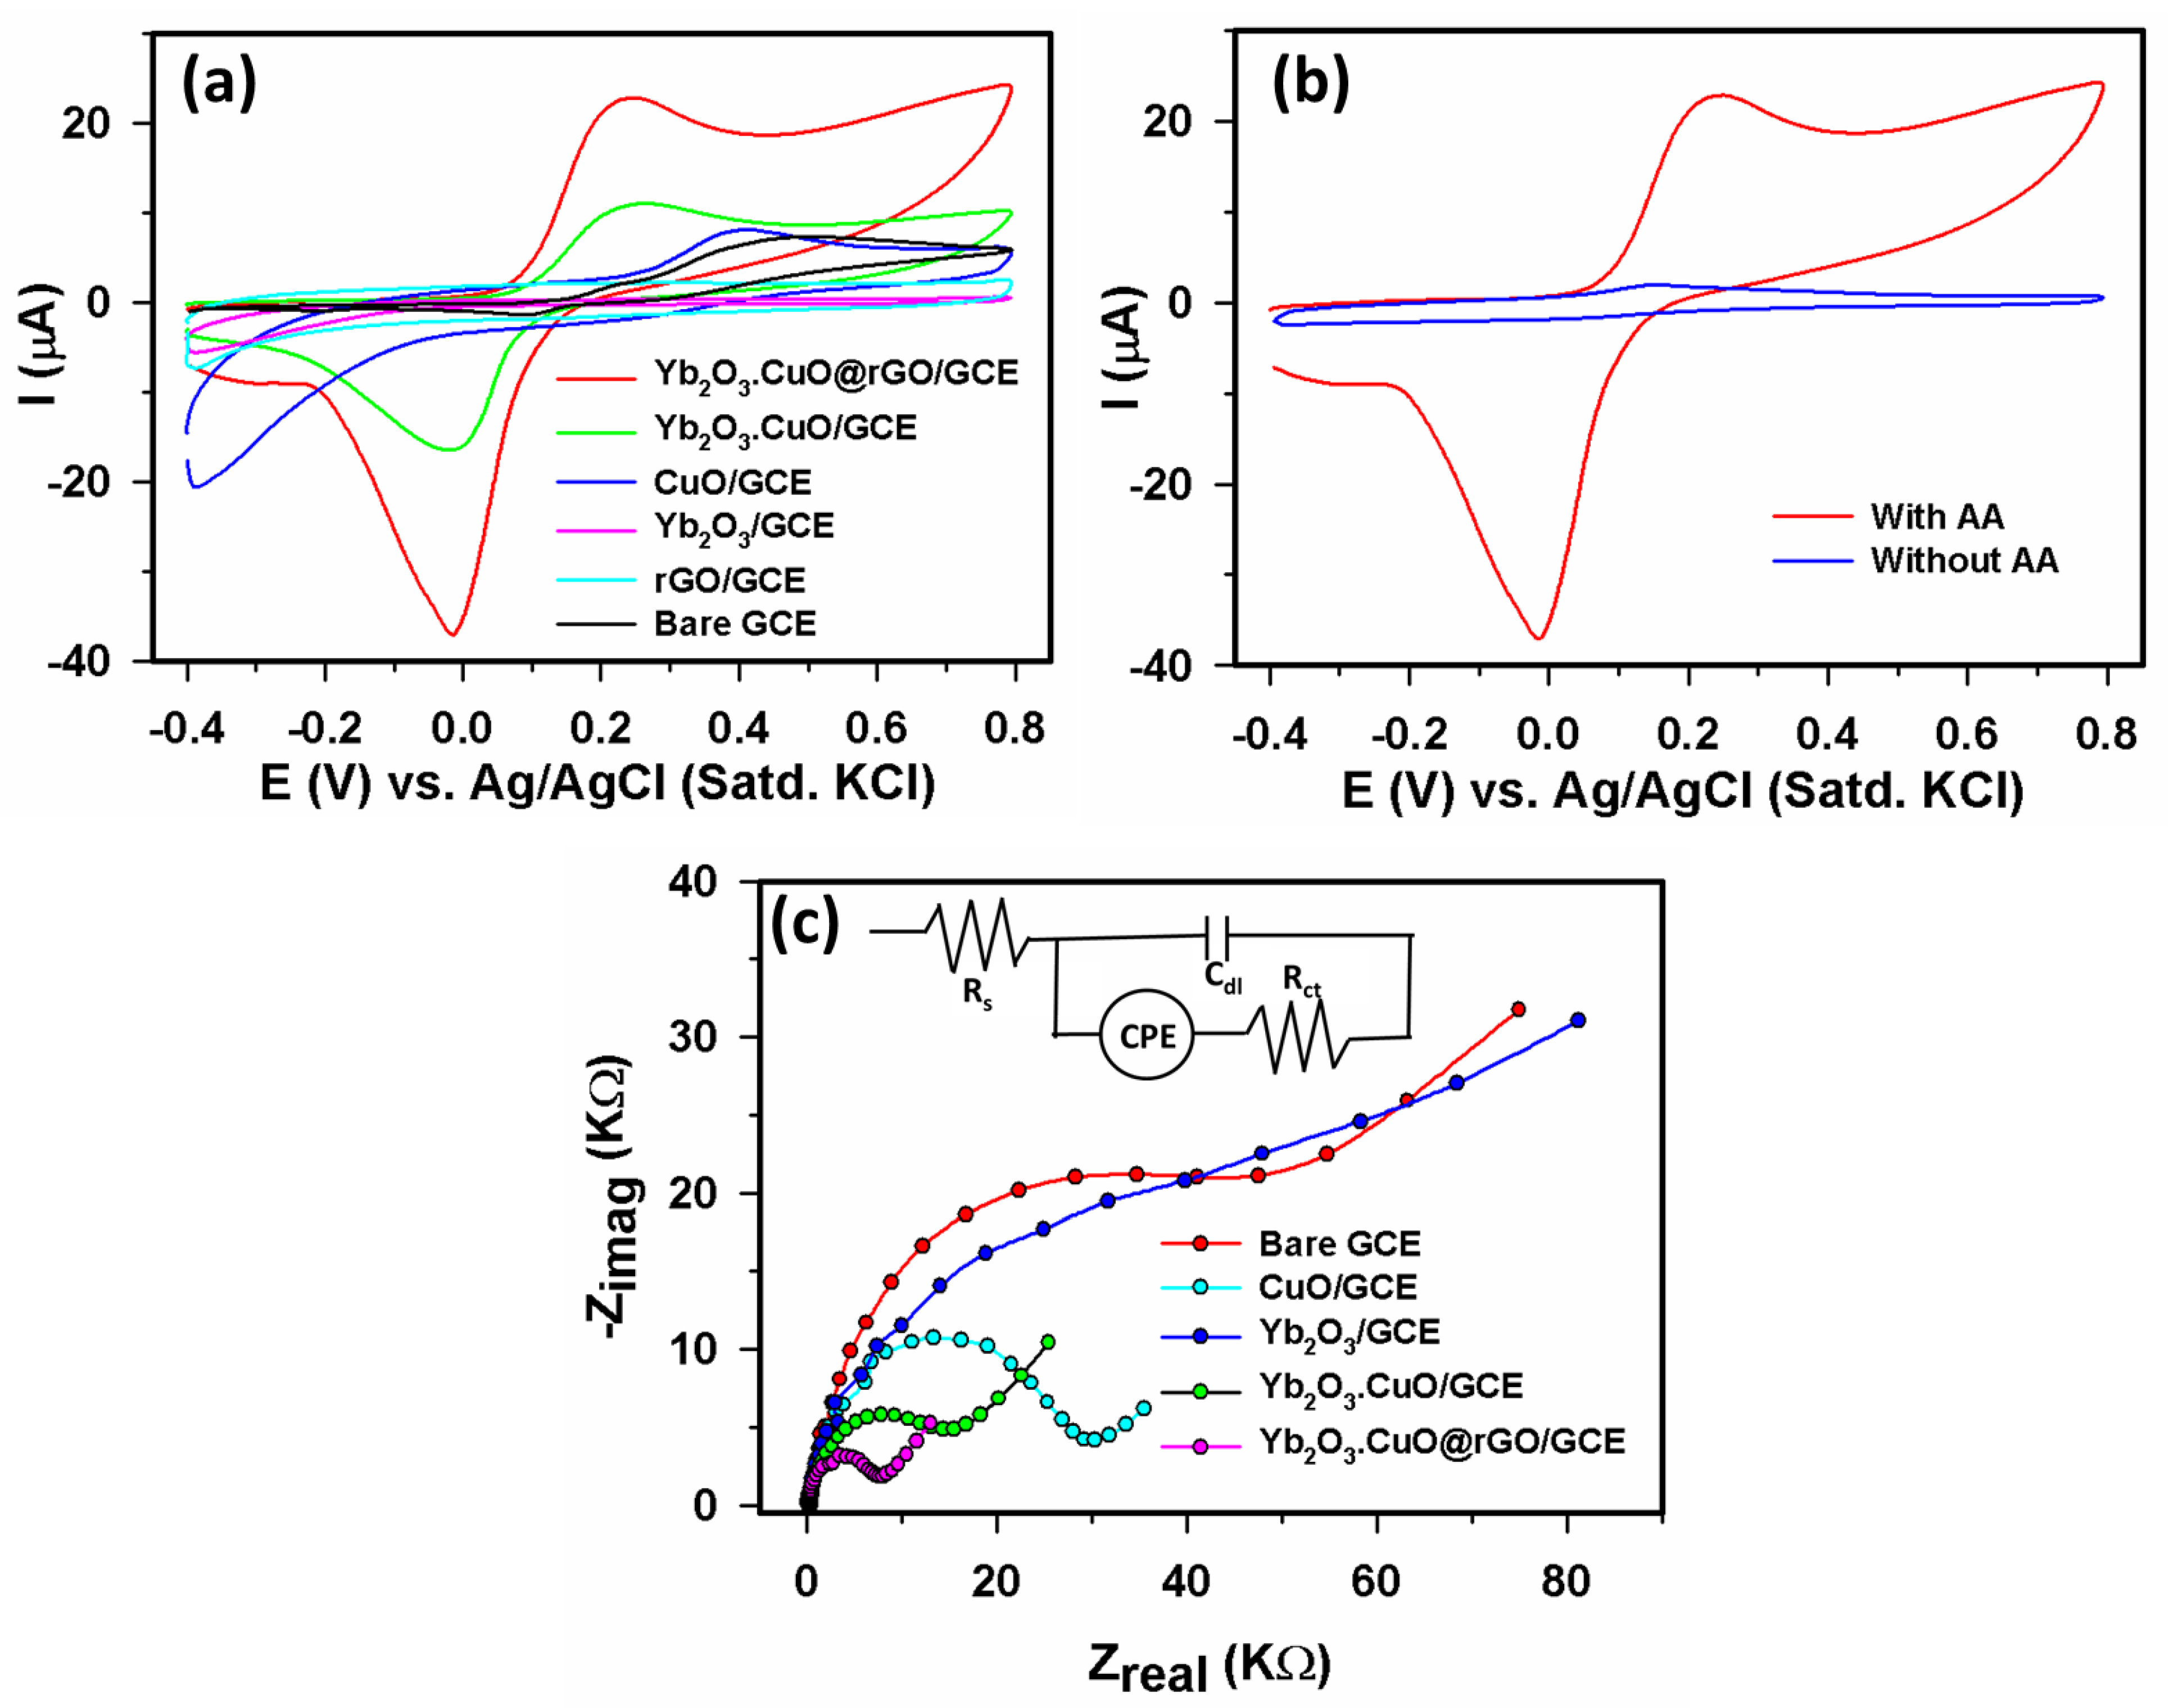
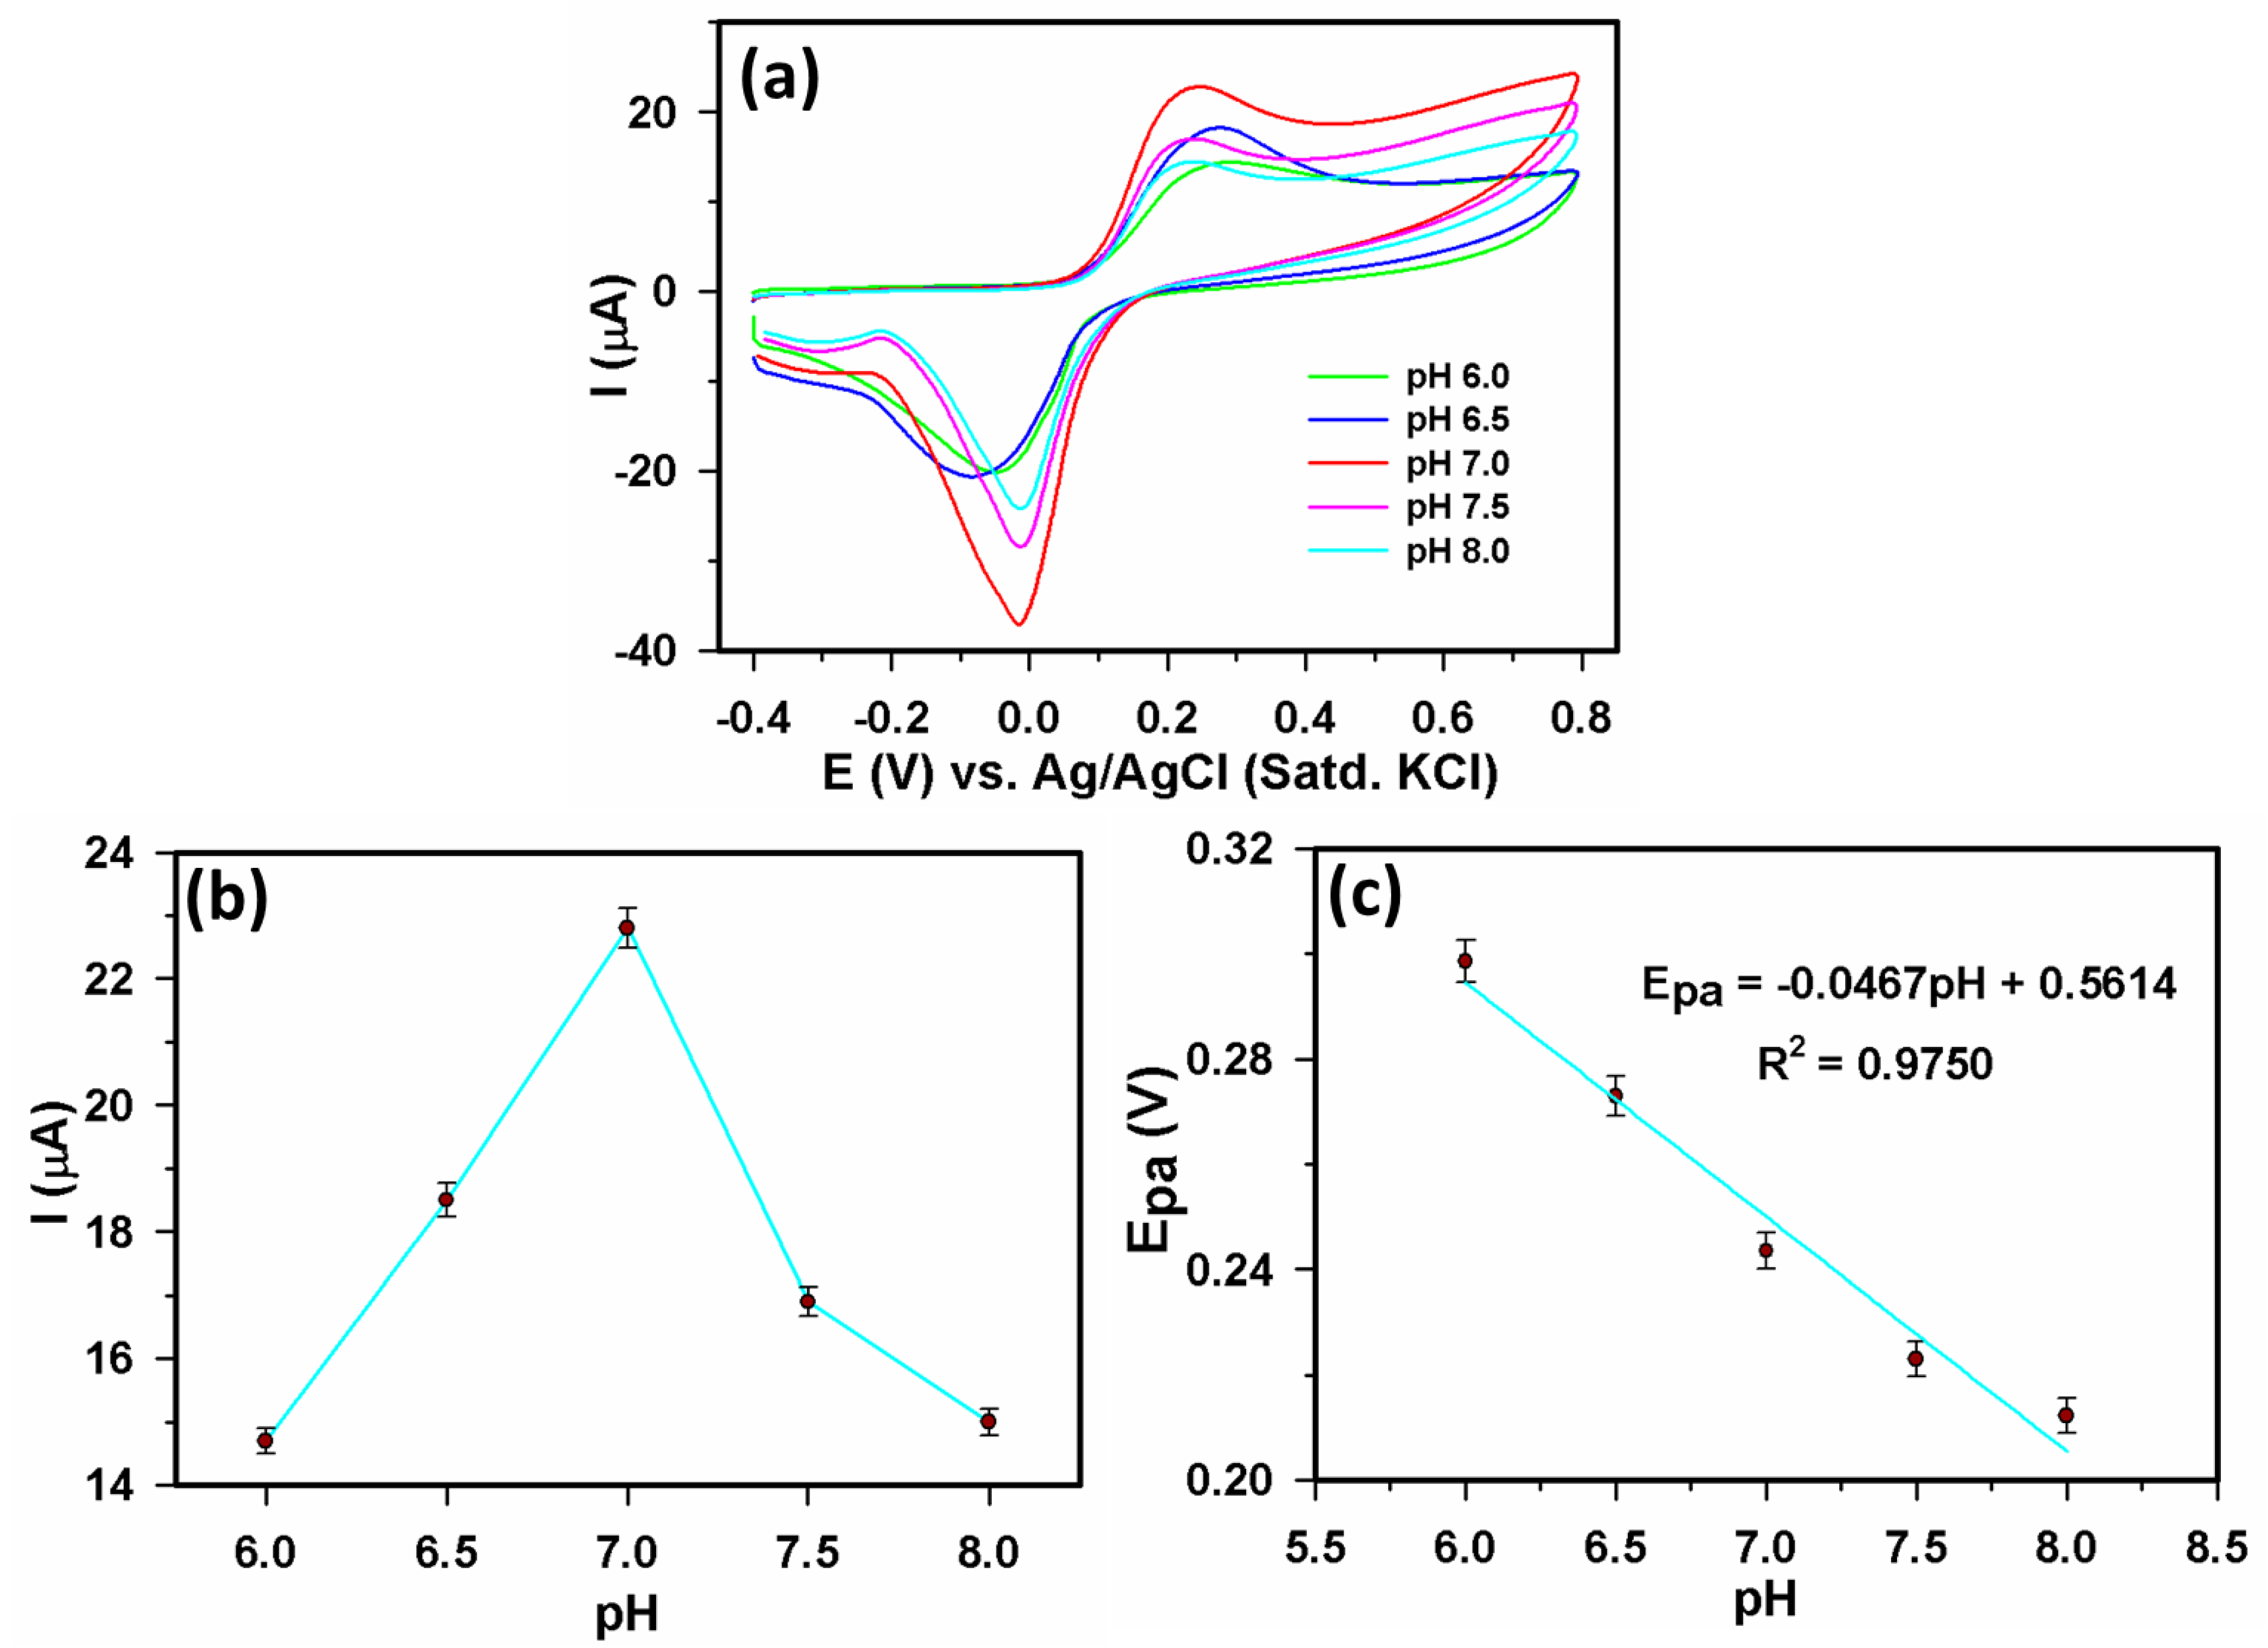
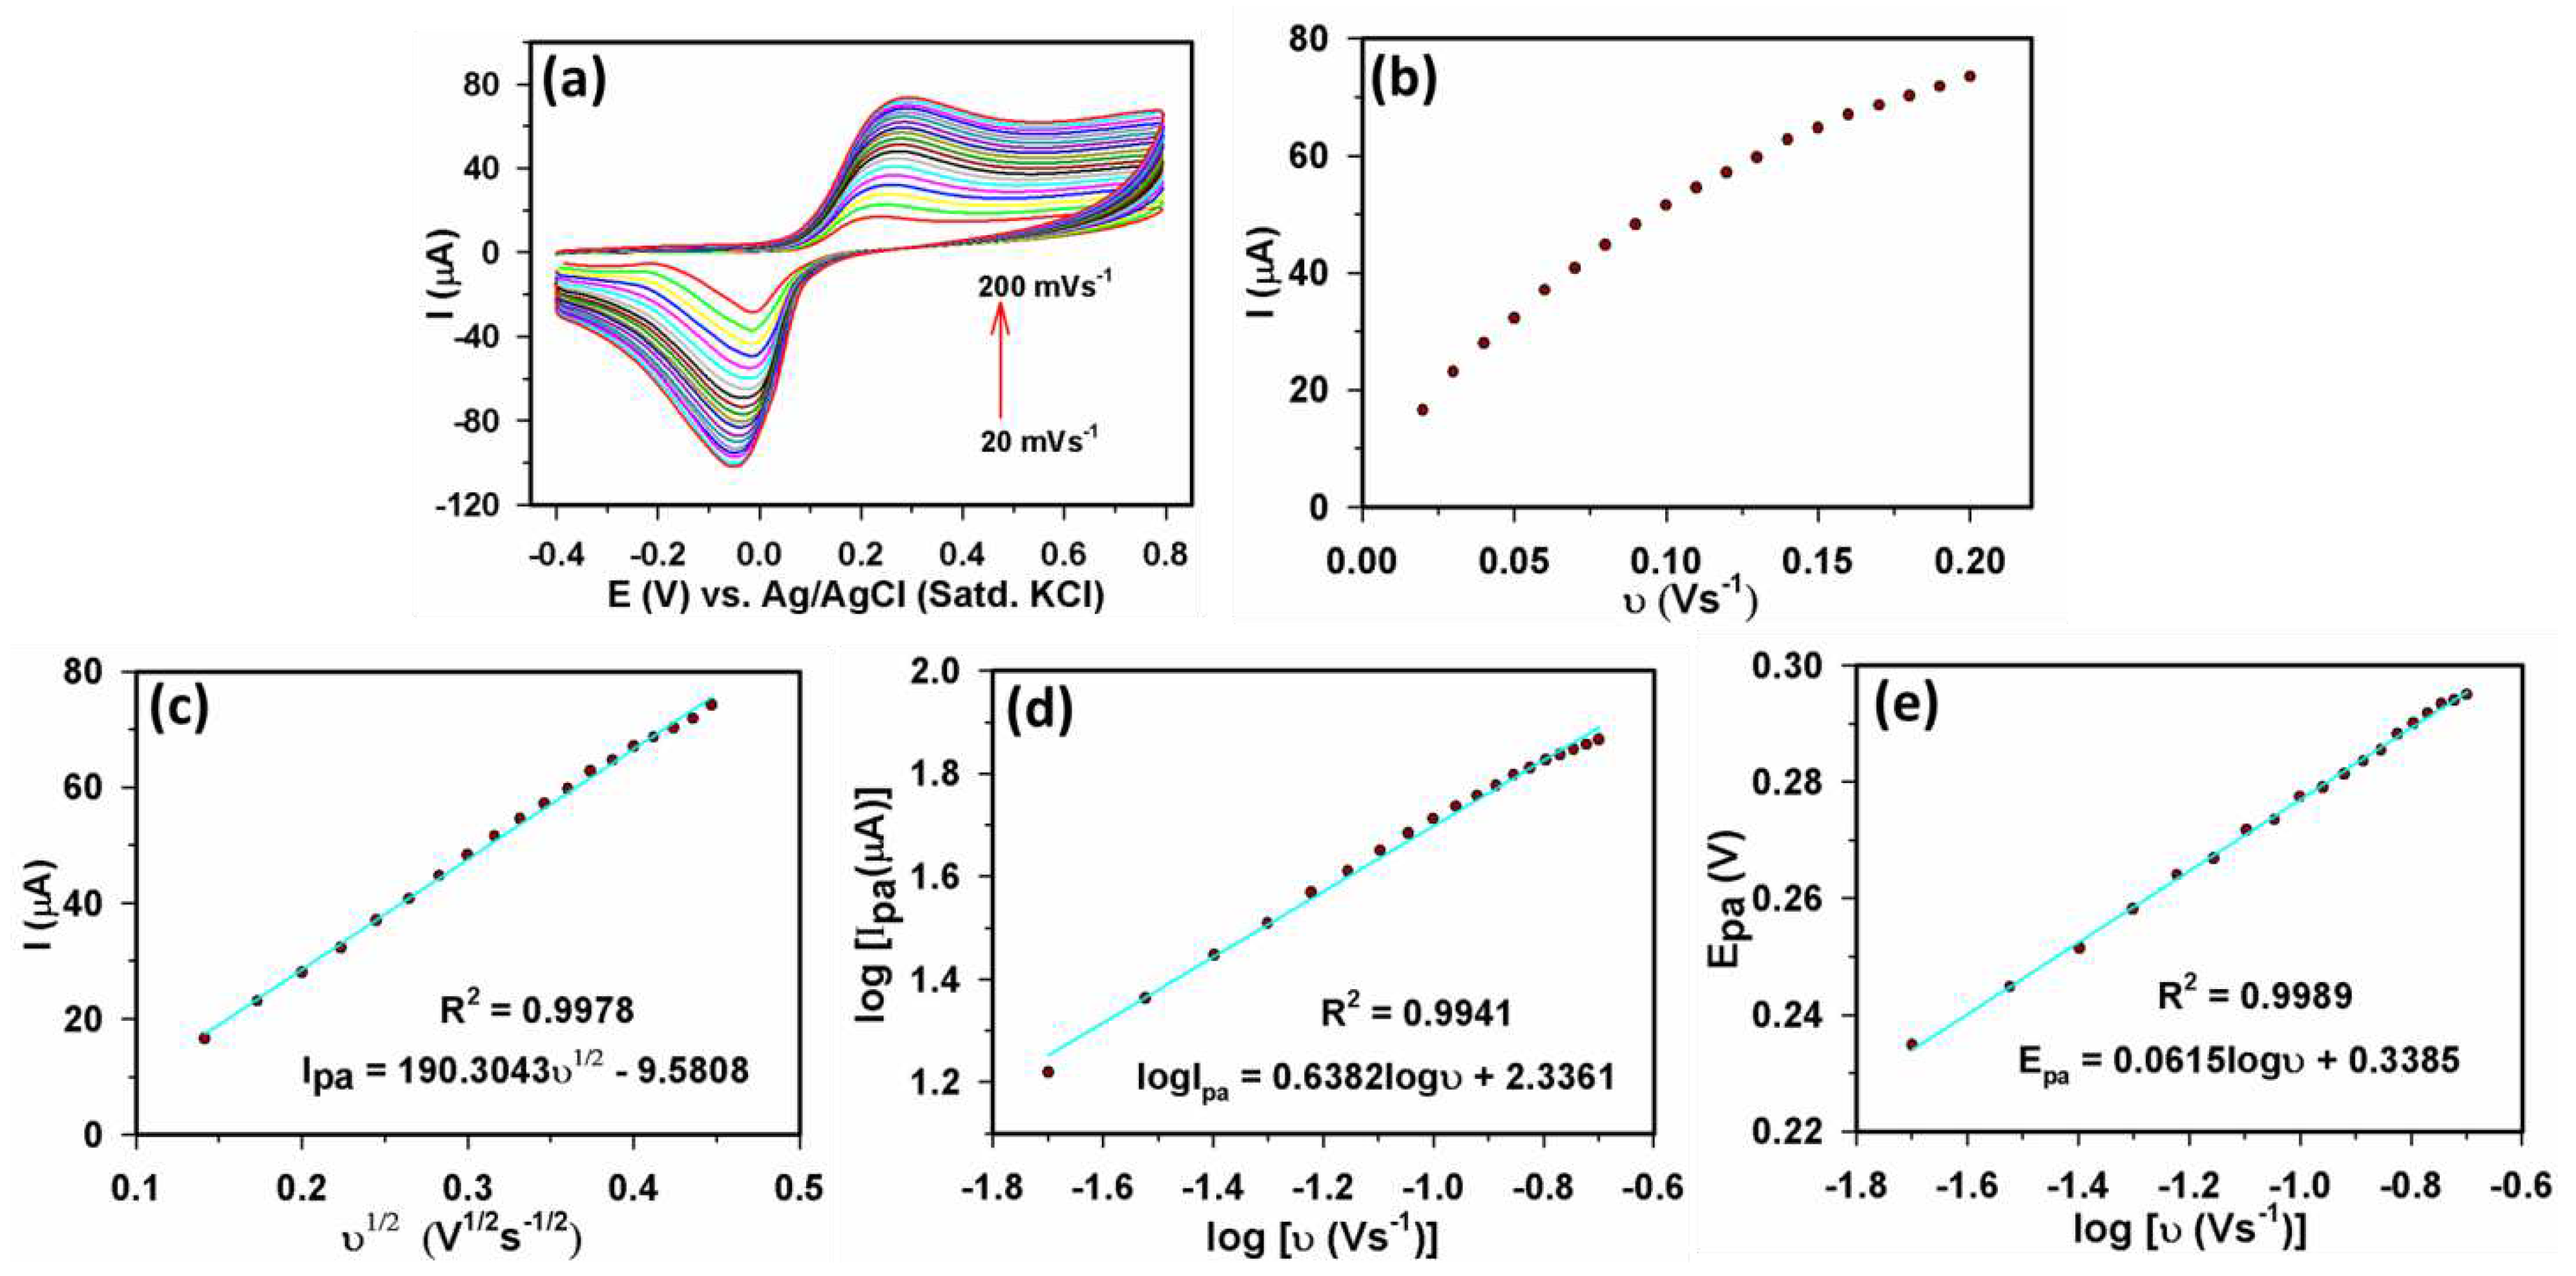
3.2.1. Electrochemical study of Yb2O3.CuO@rGO/GCE assembly
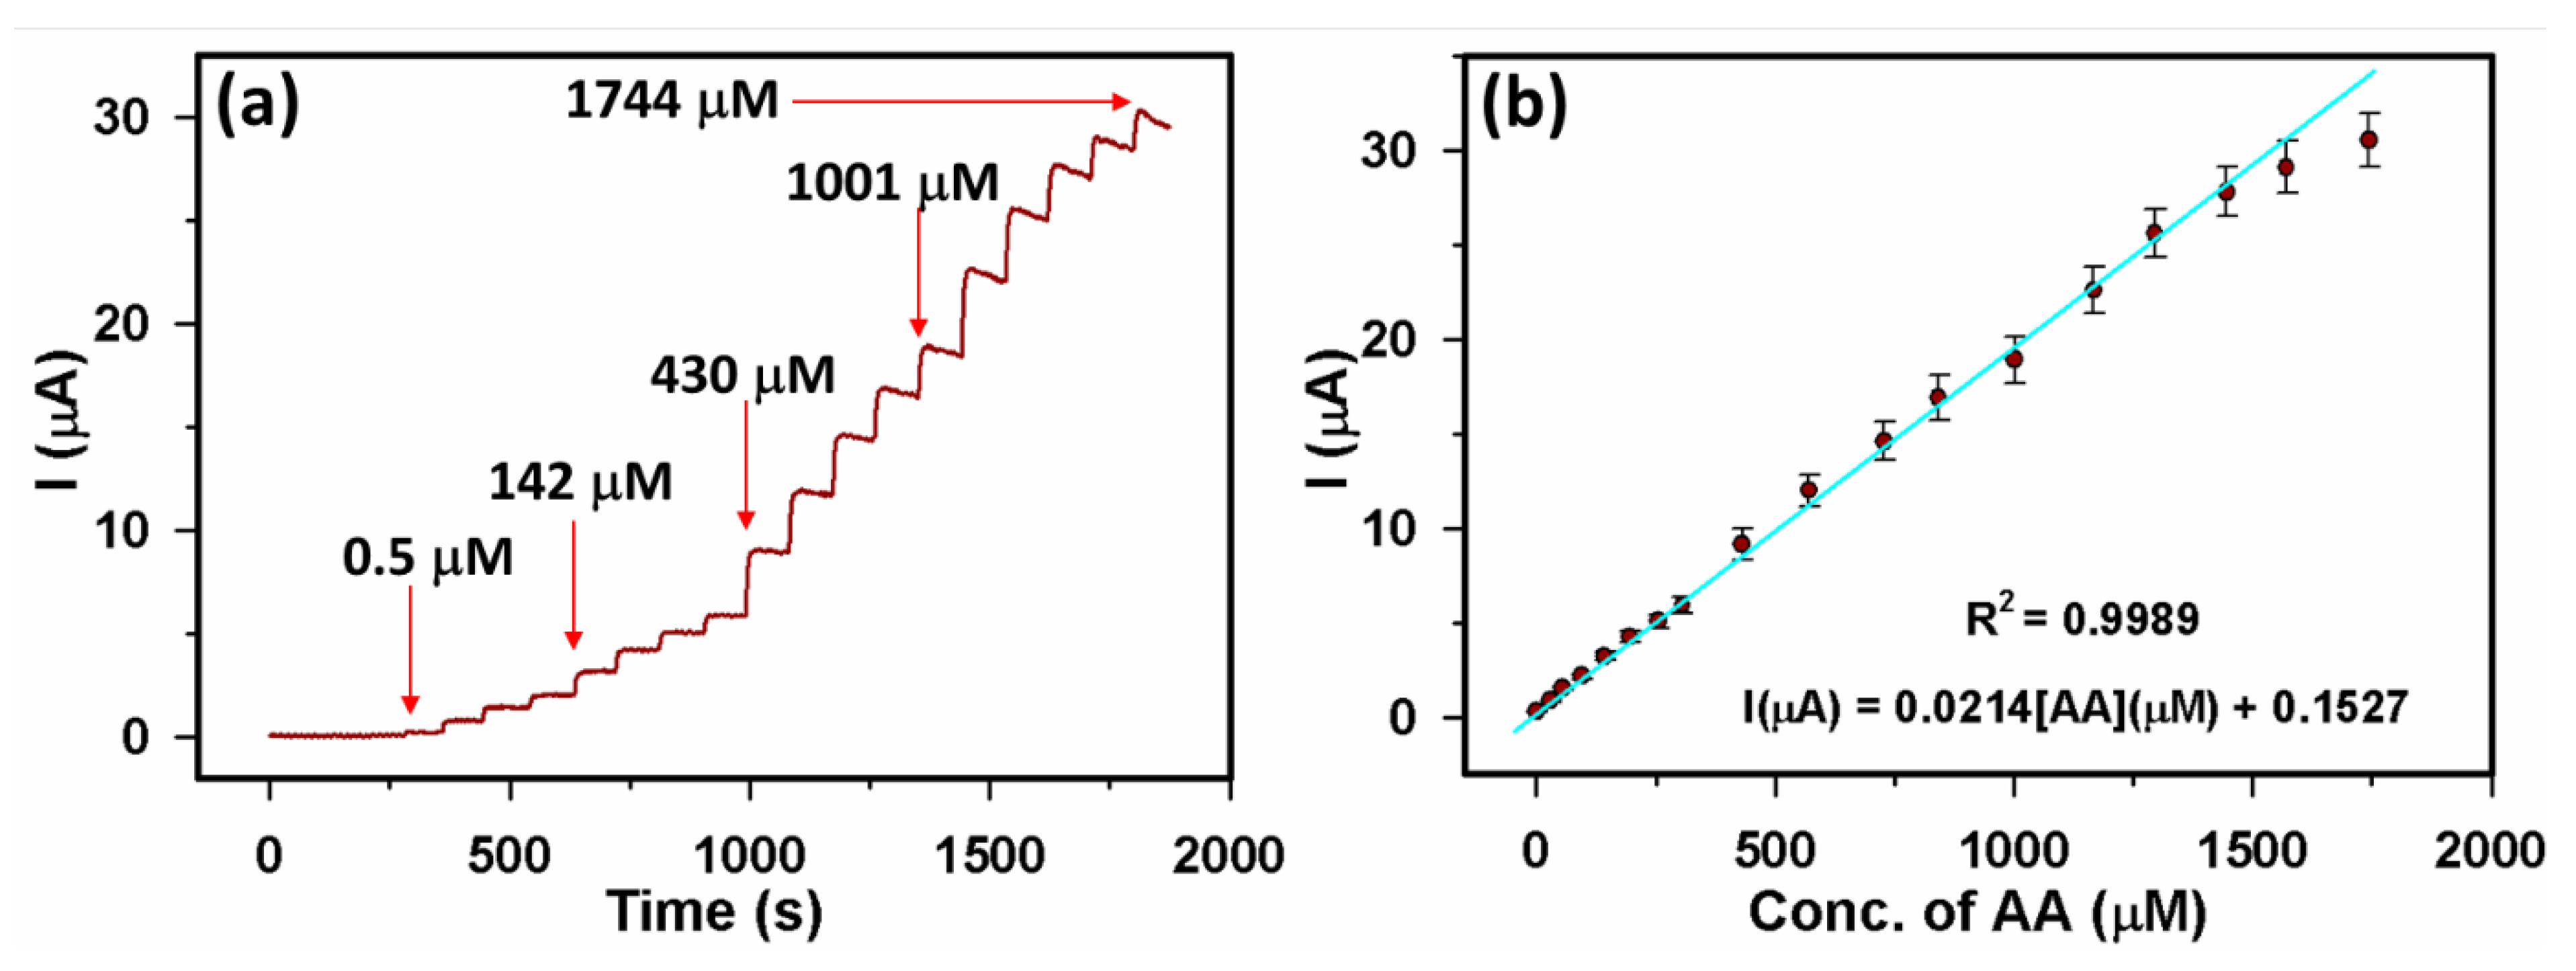
3.2.2. Sensor parameters determination
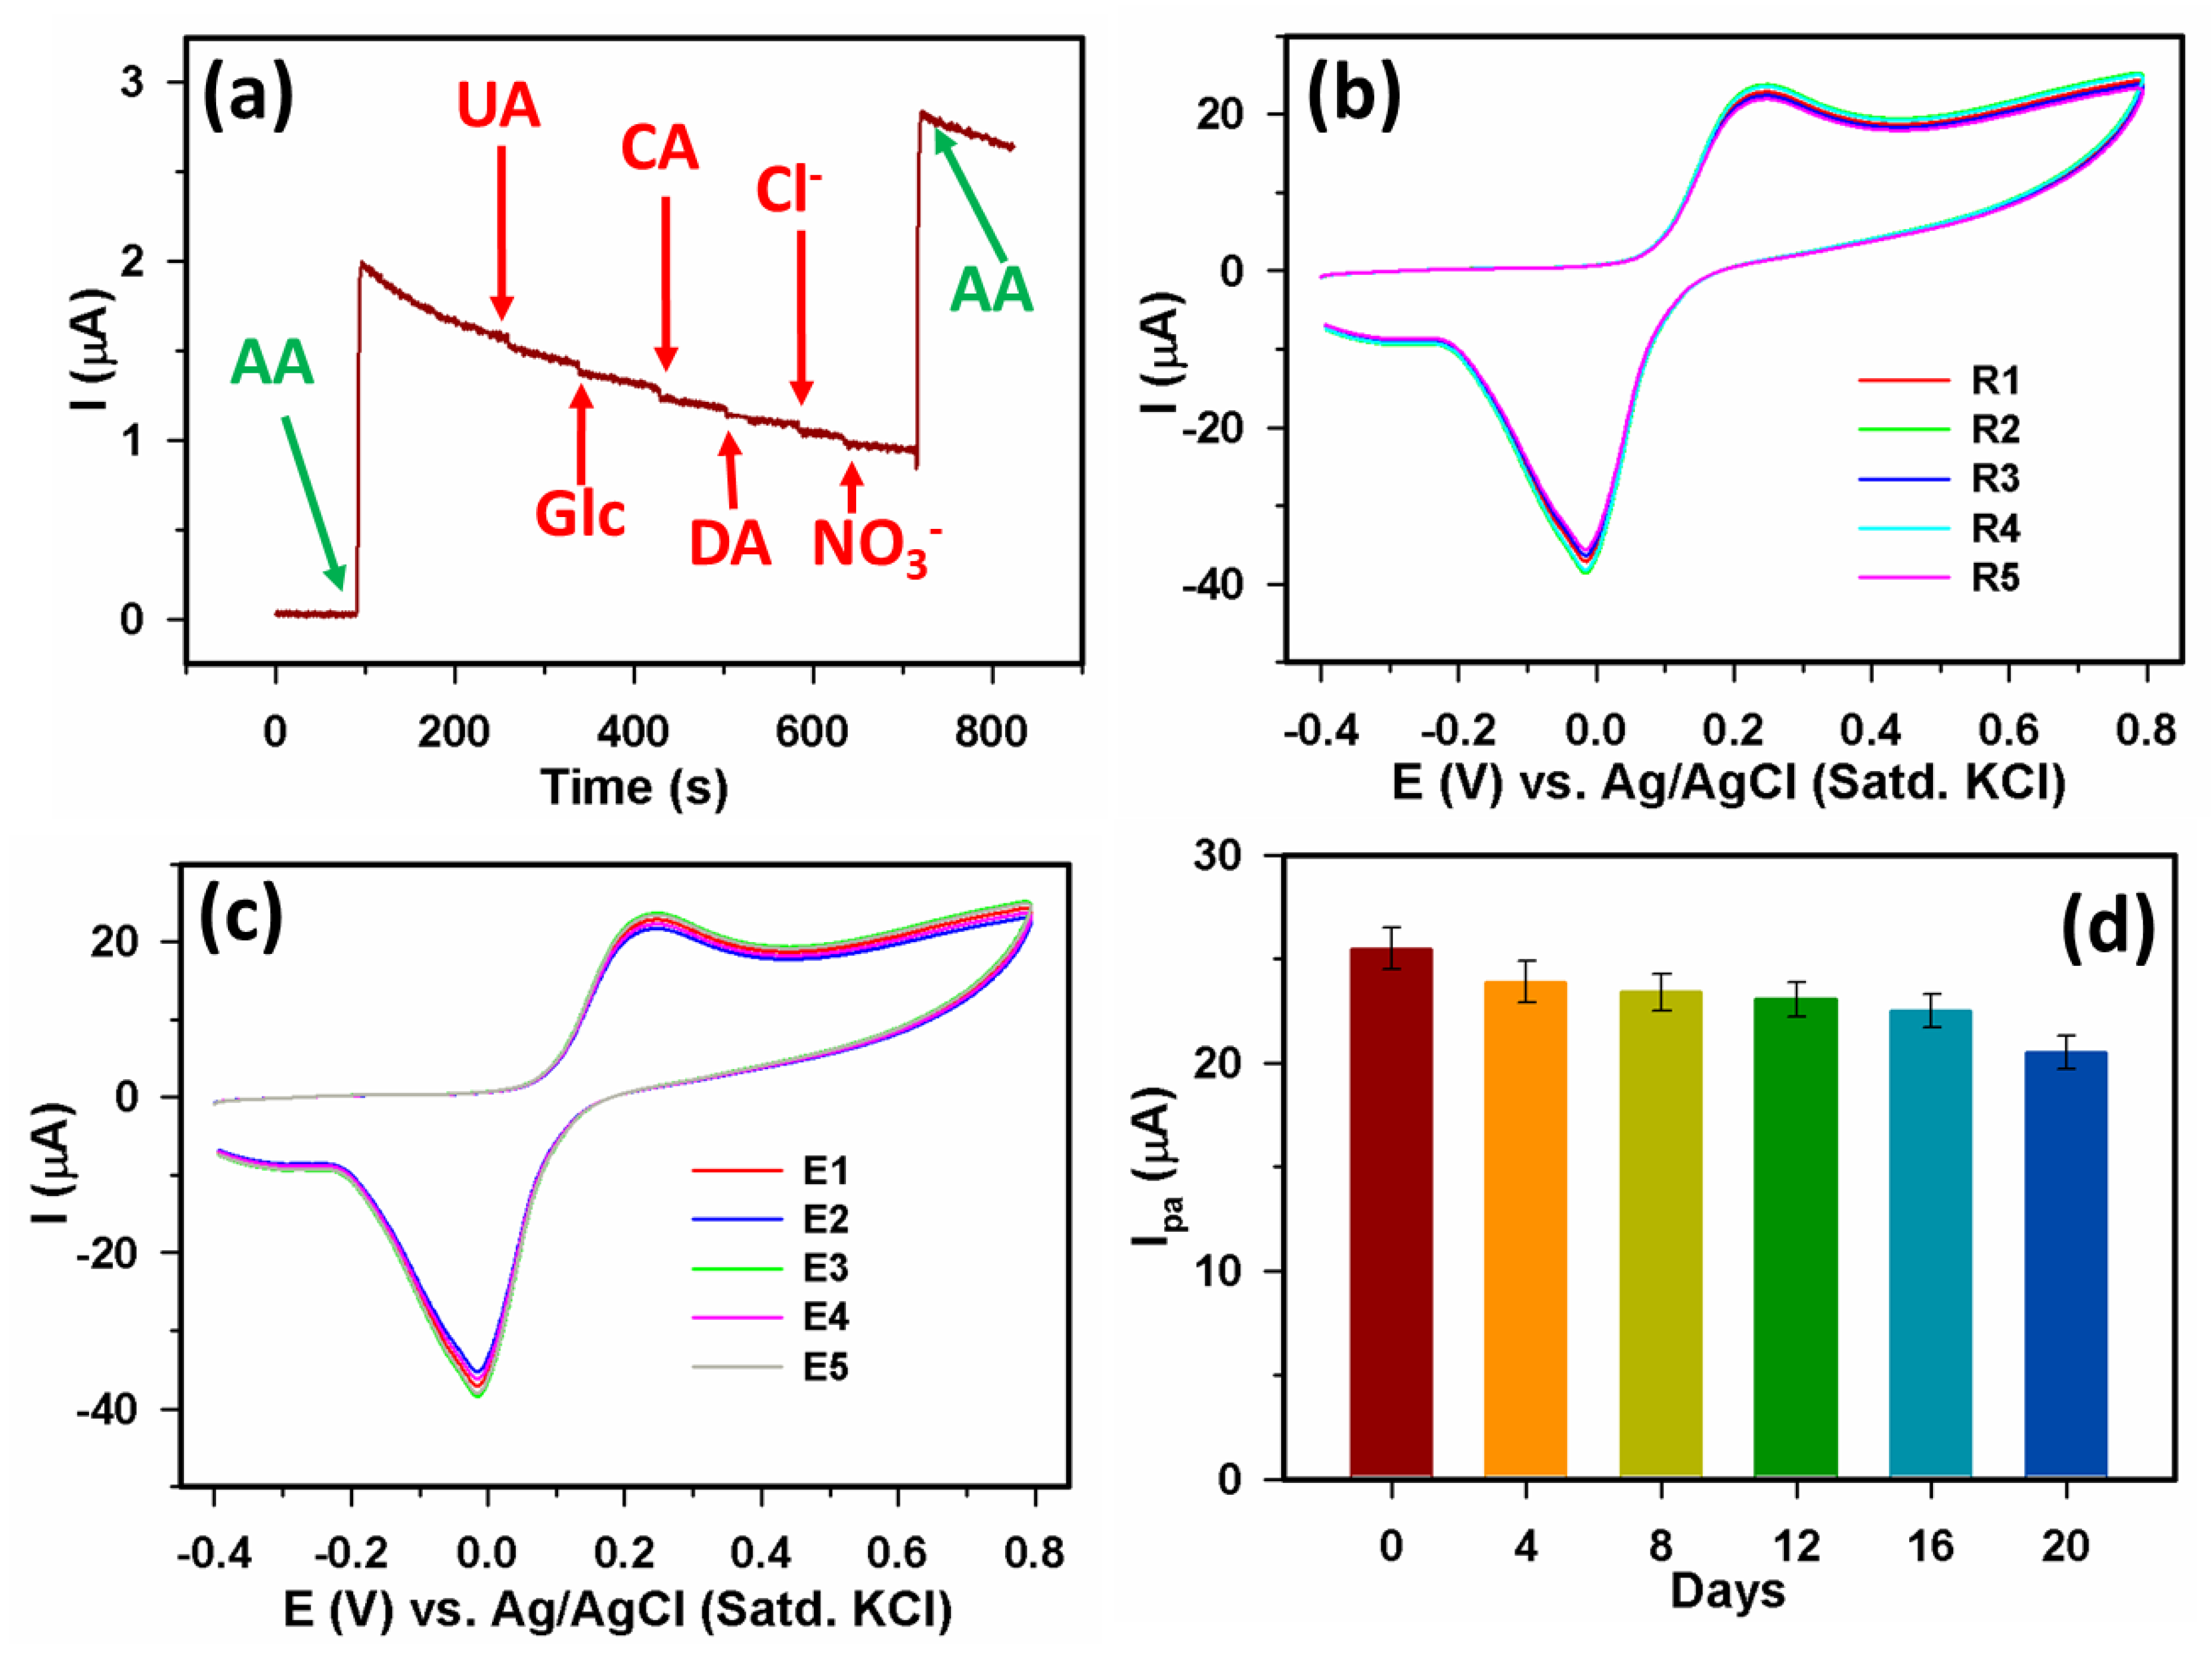
3.2.3. Selectivity, repeatability, reproducibility, and stability
3.3. Analyses of real samples: AA detection from blood serum and vitamin C tablet
4. Conclusions
Acknowledgments
References
- Bilal, S.; Akbar, A.; Shah, A.U.H.A. Highly Selective and Reproducible Electrochemical Sensing of Ascorbic Acid through a Conductive Polymer Coated Electrode. Polymers (Basel). 2019, 11. [Google Scholar] [CrossRef] [PubMed]
- Erdurak-Kiliç, C.S.; Uslu, B.; Dogan, B.; Ozgen, U.; Ozkan, S.A.; Coskun, M. Anodic Voltammetric Behavior of Ascorbic Acid and Its Selective Determination in Pharmaceutical Dosage Forms and Some Rosa Species of Turkey. J. Anal. Chem. 2006, 61, 1113–1120. [Google Scholar] [CrossRef]
- Tkachenko, A.B.; Onizhuk, M.O.; Tkachenko, O.S.; Arenas, L.T.; Benvenutti, E. V.; Gushikem, Y.; Panteleimonov, A. V. An Electrochemical Sensor Based on Graphite Electrode Modified with Silica Containing 1-n-Propyl-3-Methylimidazolium Species for Determination of Ascorbic Acid. Methods Objects Chem. Anal. 2019, 14, 5–14. [Google Scholar] [CrossRef]
- Chen, F.; Li, Q.; Yu, Y.; Yang, W.; Shi, F.; Qu, Y. Association of Vitamin C, Vitamin D, Vitamin E and Risk of Bladder Cancer: A Dose-Response Meta-Analysis. Sci. Rep. 2015, 5, 9599. [Google Scholar] [CrossRef] [PubMed]
- Liu, S.; Jiang, X.; Yang, M. Electrochemical Sensing of L-Ascorbic Acid by Using a Glassy Carbon Electrode Modified with a Molybdophosphate Film. Microchim. Acta 2019, 186. [Google Scholar] [CrossRef] [PubMed]
- Mandl, J.; Szarka, A.; Bánhegyi, G. Vitamin C: Update on Physiology and Pharmacology. Br. J. Pharmacol. 2009, 157, 1097–1110. [Google Scholar] [CrossRef] [PubMed]
- Hagel, A.F.; Albrecht, H.; Dauth, W.; Hagel, W.; Vitali, F.; Ganzleben, I.; Schultis, H.W.; Konturek, P.C.; Stein, J.; Neurath, M.F.; et al. Plasma Concentrations of Ascorbic Acid in a Cross Section of the German Population. J. Int. Med. Res. 2018, 46, 168–174. [Google Scholar] [CrossRef] [PubMed]
- Massey, L.K.; Liebman, M.; Kynast-Gales, S.A. Ascorbate Increases Human Oxaluria and Kidney Stone Risk. J. Nutr. 2005, 135, 1673–1677. [Google Scholar] [CrossRef]
- Lenghor, N.; Jakmunee, J.; Vilen, M.; Sara, R.; Christian, G.D.; Grudpan, K. Sequential Injection Redox or Acid-Base Titration for Determination of Ascorbic Acid or Acetic Acid. Talanta 2002, 58, 1139–1144. [Google Scholar] [CrossRef]
- Klimczak, I.; Gliszczyńska-Świgło, A. Comparison of UPLC and HPLC Methods for Determination of Vitamin C. Food Chem. 2015, 175, 100–105. [Google Scholar] [CrossRef]
- Gómez Ruiz, B.; Roux, S.; Courtois, F.; Bonazzi, C. Spectrophotometric Method for Fast Quantification of Ascorbic Acid and Dehydroascorbic Acid in Simple Matrix for Kinetics Measurements. Food Chem. 2016, 211, 583–589. [Google Scholar] [CrossRef] [PubMed]
- Morosanova, M.A.; Morosanova, E.I. Silica-Titania Xerogel Doped with Mo,P-Heteropoly Compounds for Solid Phase Spectrophotometric Determination of Ascorbic Acid in Fruit Juices, Pharmaceuticals, and Synthetic Urine. Chem. Cent. J. 2017, 11, 3. [Google Scholar] [CrossRef] [PubMed]
- Ahmed, J.; Faisal, M.; Harraz, F.A.; Jalalah, M.; Alsareii, S.A. Porous Silicon-Mesoporous Carbon Nanocomposite Based Electrochemical Sensor for Sensitive and Selective Detection of Ascorbic Acid in Real Samples. J. Taiwan Inst. Chem. Eng. 2021, 125, 360–371. [Google Scholar] [CrossRef]
- Hameed, S.; Munawar, A.; Khan, W.S.; Mujahid, A.; Ihsan, A.; Rehman, A.; Ahmed, I.; Bajwa, S.Z. Assessing Manganese Nanostructures Based Carbon Nanotubes Composite for the Highly Sensitive Determination of Vitamin C in Pharmaceutical Formulation. Biosens. & Bioelectron. 2017, 89, 822–828. [Google Scholar] [CrossRef] [PubMed]
- Arabali, V.; Ebrahimi, M.; Abbasghorbani, M.; Gupta, V.K.; Farsi, M.; Ganjali, M.R.; Karimi, F. Electrochemical Determination of Vitamin C in the Presence of NADH Using a CdO Nanoparticle/Ionic Liquid Modified Carbon Paste Electrode as a Sensor. J. Mol. Liq. 2016, 213, 312–316. [Google Scholar] [CrossRef]
- Tadayon, F.; Vahed, S.; Bagheri, H. Au-Pd/Reduced Graphene Oxide Composite as a New Sensing Layer for Electrochemical Determination of Ascorbic Acid, Acetaminophen and Tyrosine. Mater. Sci. & Eng. C, Mater. Biol. Appl. 2016, 68, 805–813. [Google Scholar] [CrossRef] [PubMed]
- CL, Y.; Liu, X.; RX, Z.; YJ, C.; GK, W. A Selective Strategy for Determination of Ascorbic Acid Based on Molecular Imprinted Copolymer of O-Phenylenediamine and Pyrrole. J. Electroanal. Chem. 2016, 780, 276–281. [Google Scholar] [CrossRef]
- Ahmed, J.; Faisal, M.; Alsareii, S.A.; Harraz, F.A. Highly Sensitive and Selective Non-Enzymatic Uric Acid Electrochemical Sensor Based on Novel Polypyrrole-Carbon Black-Co3O4 Nanocomposite. Adv. Compos. Hybrid Mater. 2022, 5, 920–933. [Google Scholar] [CrossRef]
- Ahmed, J.; Faisal, M.; Jalalah, M.; Alsaiari, M.; Alsareii, S.A.; Harraz, F.A. An Efficient Amperometric Catechol Sensor Based on Novel Polypyrrole-Carbon Black Doped α-Fe2O3 Nanocomposite. Colloids Surfaces A Physicochem. Eng. Asp. 2021, 619, 126469. [Google Scholar] [CrossRef]
- Rahman, M.M.; Ahmed, J.; Asiri, A.M.; Alamry, K.A. Fabrication of a Hydrazine Chemical Sensor Based on Facile Synthesis of Doped NZO Nanostructure Materials. New J. Chem. 2020, 44, 13018–13029. [Google Scholar] [CrossRef]
- Rahman, M.M.; Ahmed, J.; Asiri, A.M.; Alfaifi, S.Y. Ultra-Sensitive, Selective and Rapid Carcinogenic Bisphenol A Contaminant Determination Using Low-Dimensional Facile Binary Mg-SnO2 Doped Microcube by Potential Electro-Analytical Technique for the Safety of Environment. J. Ind. Eng. Chem. 2022, 109, 147–154. [Google Scholar] [CrossRef]
- Mahmoud, B.G.; Khairy, M.; Rashwan, F.A.; Foster, C.W.; Banks, C.E. Self-Assembly of Porous Copper Oxide Hierarchical Nanostructures for Selective Determinations of Glucose and Ascorbic Acid. RSC Adv. 2016, 6, 14474–14482. [Google Scholar] [CrossRef]
- Wang, X.; Han, Q.; Cai, S.; Wang, T.; Qi, C.; Yang, R.; Wang, C. Excellent Peroxidase Mimicking Property of CuO/Pt Nanocomposites and Their Application as an Ascorbic Acid Sensor. Analyst 2017, 142, 2500–2506. [Google Scholar] [CrossRef] [PubMed]
- Šljukić, B.R.; Kadara, R.O.; Banks, C.E. Disposable Manganese Oxide Screen Printed Electrodes for Electroanalytical Sensing. Anal. Methods 2011, 3, 105–109. [Google Scholar] [CrossRef] [PubMed]
- Zhu, S.; Xie, A.; Wei, B.; Tao, X.; Zhang, J.; Peng, W.; Liu, C.; Gu, L.; Xu, C.; Luo, S. Construction and Application of a Nonenzymatic Ascorbic Acid Sensor Based on a NiO1.0/Polyaniline3.0hybrid. New J. Chem. 2020, 44, 9288–9297. [Google Scholar] [CrossRef]
- Yin, Y.; Zhao, J.; Qin, L.; Yang, Y.; He, L. Synthesis of an Ordered Nanoporous Fe2O3/Au Film for Application in Ascorbic Acid Detection. RSC Adv. 2016, 6, 63358–63364. [Google Scholar] [CrossRef]
- Pan, Y.; Zuo, J.; Hou, Z.; Huang, Y.; Huang, C. Preparation of Electrochemical Sensor Based on Zinc Oxide Nanoparticles for Simultaneous Determination of AA, DA, and UA. Front. Chem. 2020, 8, 1–7. [Google Scholar] [CrossRef]
- Zhang, X.; Yu, S.; He, W.; Uyama, H.; Xie, Q.; Zhang, L.; Yang, F. Electrochemical Sensor Based on Carbon-Supported NiCoO2 Nanoparticles for Selective Detection of Ascorbic Acid. Biosens. Bioelectron. 2014, 55, 446–451. [Google Scholar] [CrossRef]
- Alam, M.M.; Asiri, A.M.; Rahman, M.M.; Islam, M.A. Selective Detection of Ascorbic Acid with Wet-Chemically Prepared CdO/SnO2/V2O5 Micro-Sheets by Electrochemical Approach. SN Appl. Sci. 2020, 2, 1–15. [Google Scholar] [CrossRef]
- Xing, R.; Sheng, K.; Xu, L.; Liu, W.; Song, J.; Song, H. Three-Dimensional In2O3-CuO Inverse Opals: Synthesis and Improved Gas Sensing Properties towards Acetone. RSC Adv. 2016, 6, 57389–57395. [Google Scholar] [CrossRef]
- Purbia, R.; Kwon, Y.M.; Choi, S.Y.; Kim, S.H.; Lee, Y.S.; Ahi, Z.B.; Park, H.; Baik, J.M. A Thermodynamic Approach toward Selective and Reversible Sub-Ppm H2S Sensing Using Ultra-Small CuO Nanorods Impregnated with Nb2O5nanoparticles. J. Mater. Chem. A 2021, 9, 17425–17433. [Google Scholar] [CrossRef]
- Hossain, R.; Hassan, K.; Sahajwalla, V. Utilising Problematic Waste to Detect Toxic Gas Release in the Environment: Fabricating a NiO Doped CuO Nanoflake Based Ammonia Sensor from e-Waste. Nanoscale Adv. 2022, 4, 4066–4079. [Google Scholar] [CrossRef] [PubMed]
- Chen, Y.; Shen, Z.; Jia, Q.; Zhao, J.; Zhao, Z.; Ji, H. A CuO-ZnO Nanostructured p-n Junction Sensor for Enhanced N-Butanol Detection. RSC Adv. 2016, 6, 2504–2511. [Google Scholar] [CrossRef]
- Hussain, M.M.; Hussain, M.M.; Hussain, M.M.; Asiri, A.M.; Rahman, M.M.; Rahman, M.M.; Hussain, M.M. A Non-Enzymatic Electrochemical Approach for l-Lactic Acid Sensor Development Based on CuO·MWCNT Nanocomposites Modified with a Nafion Matrix. New J. Chem. 2020, 44, 9775–9787. [Google Scholar] [CrossRef]
- Tobaldi, D.M.; Espro, C.; Leonardi, S.G.; Lajaunie, L.; Seabra, M.P.; Calvino, J.J.; Marini, S.; Labrincha, J.A.; Neri, G. Photo-Electrochemical Properties of CuO-TiO2heterojunctions for Glucose Sensing. J. Mater. Chem. C 2020, 8, 9529–9539. [Google Scholar] [CrossRef]
- Sun, G.J.; Choi, S.W.; Katoch, A.; Wu, P.; Kim, S.S. Bi-Functional Mechanism of H2S Detection Using CuO-SnO 2 Nanowires. J. Mater. Chem. C 2013, 1, 5454–5462. [Google Scholar] [CrossRef]
- Rahman, M.M. Rapid and Sensitive Detection of Selective 1,2-Diaminobenzene Based on Facile Hydrothermally Prepared Doped Co3O4/Yb2O3 Nanoparticles. PLoS One 2021, 16, 1–14. [Google Scholar] [CrossRef] [PubMed]
- Rahman, M.M.; Alam, M.M.; Asiri, A.M.; Islam, M.A. Ethanol Sensor Development Based on Ternary-Doped Metal Oxides (CdO/ZnO/Yb2O3) Nanosheets for Environmental Safety. RSC Adv. 2017, 7, 22627–22639. [Google Scholar] [CrossRef]
- Xu, C.; Liu, B.; Ning, W.; Wang, X. Highly Sensitive Ascorbic Acid Sensor Based on Ionic Liquid Functionalized Graphene Oxide Nanocomposite. Int. J. Electrochem. Sci. 2019, 14, 1670–1683. [Google Scholar] [CrossRef]
- Rahman, M.M.; Alam, M.M.; Asiri, A.M.; Awual, M.R. Fabrication of 4-Aminophenol Sensor Based on Hydrothermally Prepared ZnO/Yb2O3 Nanosheets. New J. Chem. 2017, 41, 9159–9169. [Google Scholar] [CrossRef]
- Wang, Y.; Liu, L.; Sun, F.; Li, T.; Zhang, T.; Qin, S. Humidity-Insensitive NO2 Sensors Based on SnO2/RGO Composites. Front. Chem. 2021, 9, 1–9. [Google Scholar] [CrossRef] [PubMed]
- Gupta, M.; Hawari, H.F.; Kumar, P.; Burhanudin, Z.A.; Tansu, N. Functionalized Reduced Graphene Oxide Thin Films for Ultrahigh Co2 Gas Sensing Performance at Room Temperature. Nanomaterials 2021, 11, 1–18. [Google Scholar] [CrossRef] [PubMed]
- Jiang, W.; Chen, X.; Wang, T.; Li, B.; Zeng, M.; Yang, J.; Hu, N.; Su, Y.; Zhou, Z.; Yang, Z. Enhancing Room-Temperature NO2gas Sensing Performance Based on a Metal Phthalocyanine/Graphene Quantum Dot Hybrid Material. RSC Adv. 2021, 11, 5618–5628. [Google Scholar] [CrossRef]
- Feizollahi, A.; Rafati, A.A.; Assari, P.; Asadpour Joghani, R. Development of an Electrochemical Sensor for the Determination of Antibiotic Sulfamethazine in Cow Milk Using Graphene Oxide Decorated with Cu-Ag Core-Shell Nanoparticles. Anal. Methods 2021, 13, 910–917. [Google Scholar] [CrossRef]
- Yu, H.; Guo, W.; Lu, X.; Xu, H.; Yang, Q.; Tan, J.; Zhang, W. Reduced Graphene Oxide Nanocomposite Based Electrochemical Biosensors for Monitoring Foodborne Pathogenic Bacteria: A Review. Food Control 2021, 127, 108117. [Google Scholar] [CrossRef]
- Fauzi, A.S.A.; Hamidah, N.L.; Kitamura, S.; Kodama, T.; Sonda, K.; Putri, G.K.; Shinkai, T.; Ahmad, M.S.; Inomata, Y.; Quitain, A.T.; et al. Electrochemical Detection of Ethanol in Air Using Graphene Oxide Nanosheets Combined with Au-WO3. Sensors 2022, 22. [Google Scholar] [CrossRef] [PubMed]
- Wu, S.; Liang, Y.; Xu, Y.; Tong, Y.; Chen, Y.; Chen, X. Graphene-Based Electrochemical Sensor for Detection of Hepatocellular Carcinoma Markers. Front. Chem. 2022, 10, 1–6. [Google Scholar] [CrossRef]
- Boroujerdi, R.; Paul, R. Graphene-Based Electrochemical Sensors for Psychoactive Drugs. Nanomaterials 2022, 12. [Google Scholar] [CrossRef]
- Fu, L.; Mao, S.; Chen, F.; Zhao, S.; Su, W.; Lai, G.; Yu, A.; Lin, C.-T. Graphene-Based Electrochemical Sensors for Antibiotic Detection in Water, Food and Soil: A Scientometric Analysis in CiteSpace (2011–2021). Chemosphere 2022, 297, 134127. [Google Scholar] [CrossRef]
- Saravanan, T.; Anandan, P.; Shanmugam, M.; Azhagurajan, M.; Mohamed Ismail, M.; Arivanandhan, M.; Hayakawa, Y.; Jayavel, R. Facile Synthesis of Yb2O3–Graphene Nanocomposites for Enhanced Energy and Environmental Applications. Polym. Bull. 2020, 77, 3891–3906. [Google Scholar] [CrossRef]
- Aftab, U.; Tahira, A.; Mazzaro, R.; Abro, M.I.; Baloch, M.M.; Willander, M.; Nur, O.; Yu, C.; Ibupoto, Z.H. The Chemically Reduced CuO-Co3O4 Composite as a Highly Efficient Electrocatalyst for Oxygen Evolution Reaction in Alkaline Media. Catal. Sci. Technol. 2019, 9, 6274–6284. [Google Scholar] [CrossRef]
- Baig, N.; Saleh, T.A. Superhydrophobic Polypropylene Functionalized with Nanoparticles for Efficient Fast Static and Dynamic Separation of Spilled Oil from Water. Glob. Challenges 2019, 3, 1800115. [Google Scholar] [CrossRef] [PubMed]
- Gongalsky, M.B.; Kargina, J. V; Cruz, J.F.; Sánchez-Royo, J.F.; Chirvony, V.S.; Osminkina, L.A.; Sailor, M.J. Formation of Si/SiO2 Luminescent Quantum Dots From Mesoporous Silicon by Sodium Tetraborate/Citric Acid Oxidation Treatment. Front. Chem. 2019, 7, 165. [Google Scholar] [CrossRef] [PubMed]
- Yu, L.; Zhang, P.; Dai, H.; Chen, L.; Ma, H.; Lin, M.; Shen, D. An Electrochemical Sensor Based on Co3O4 Nanosheets for Lead Ions Determination. RSC Adv. 2017, 7, 39611–39616. [Google Scholar] [CrossRef]
- Eslami, A.; Juibari, N.M.; Hosseini, S.G.; Abbasi, M. Synthesis and Characterization of CuO Nanoparticles by the Chemical Liquid Deposition Method and Investigation of Its Catalytic Effect on the Thermal Decomposition of Ammonium Perchlorate. Cent. Eur. J. Energ. Mater. 2017, 14, 152–168. [Google Scholar] [CrossRef] [PubMed]
- Rahman, M.M.; Ahmed, J.; Asiri, A.M. Ultra-Sensitive, Selective, and Rapid Carcinogenic 1,2-Diaminobenzene Chemical Determination Using Sol–Gel Coating Low-Dimensional Facile CuS Modified-CNT Nanocomposites by Electrochemical Approach. Microchem. J. 2022, 175, 107230. [Google Scholar] [CrossRef]
- Cao, Z.; An, S.; Song, X. Effect of Thermal Treatment at High Temperature on Phase Stability and Transformation of Yb2O3 and Y2O3 Co-Doped ZrO2 Ceramics. Sci. Rep. 2022, 12, 1–8. [Google Scholar] [CrossRef]
- Ahmed, J.; Rashed, M.A.; Faisal, M.; Harraz, F.A.; Jalalah, M.; Alsareii, S.A. Novel SWCNTs-Mesoporous Silicon Nanocomposite as Efficient Non-Enzymatic Glucose Biosensor. Appl. Surf. Sci. 2021, 552, 149477. [Google Scholar] [CrossRef]
- El-Raheem, H.A.; Hassan, R.Y.A.; Khaled, R.; Farghali, A.; El-Sherbiny, I.M. New Sensing Platform of Poly(Ester-Urethane)Urea Doped with Gold Nanoparticles for Rapid Detection of Mercury Ions in Fish Tissue. RSC Adv. 2021, 11, 31845–31854. [Google Scholar] [CrossRef]
- Ahmed, J.; Rahman, M.M.; Siddiquey, I.A.; Asiri, A.M.; Hasnat, M.A. Efficient Bisphenol-A Detection Based on the Ternary Metal Oxide (TMO) Composite by Electrochemical Approaches. Electrochim. Acta 2017, 246, 597–605. [Google Scholar] [CrossRef]
- Ahmed, J.; Faisal, M.; Jalalah, M.; Alsareii, S.A.; Harraz, F.A. Novel Polypyrrole-Carbon Black Doped ZnO Nanocomposite for Efficient Amperometric Detection of Hydroquinone. J. Electroanal. Chem. 2021, 898, 115631. [Google Scholar] [CrossRef]
- Ahmed, J.; Rahman, M.M.; Siddiquey, I.A.; Asiri, A.M.; Hasnat, M.A. Efficient Hydroquinone Sensor Based on Zinc, Strontium and Nickel Based Ternary Metal Oxide (TMO) Composites by Differential Pulse Voltammetry. Sensors Actuators, B Chem. 2018, 256, 383–392. [Google Scholar] [CrossRef]
- Ahmed, J.; Faisal, M.; Alsareii, S.A.; Jalalah, M.; Harraz, F.A. A Novel Gold-Decorated Porous Silicon-Poly(3-Hexylthiophene) Ternary Nanocomposite as a Highly Sensitive and Selective Non-Enzymatic Dopamine Electrochemical Sensor. J. Alloys Compd. 2023, 931, 167403. [Google Scholar] [CrossRef]
- Ahmed, J.; Faisal, M.; Alsareii, S.A.; Jalalah, M.; Alsaiari, M.; Harraz, F.A. Mn2O3 Nanoparticle-Porous Silicon Nanocomposite Based Amperometric Sensor for Sensitive Detection and Quantification of Acetaminophen in Real Samples. Ceram. Int. 2023, 49, 933–943. [Google Scholar] [CrossRef]
- Roy, P.R.; Saha, M.S.; Okajima, T.; Ohsaka, T. Electrooxidation and Amperometric Detection of Ascorbic Acid at GC Electrode Modified by Electropolymerization of N,N-Dimethylaniline. Electroanalysis 2004, 16, 289–297. [Google Scholar] [CrossRef]
- Kong, Y.; Shan, X.; Ma, J.; Chen, M.; Chen, Z. A Novel Voltammetric Sensor for Ascorbic Acid Based on Molecularly Imprinted Poly(o-Phenylenediamine-Co-o-Aminophenol). Anal. Chim. Acta 2014, 809, 54–60. [Google Scholar] [CrossRef] [PubMed]
- Salahandish, R.; Ghaffarinejad, A.; Naghib, S.M.; Niyazi, A.; Majidzadeh-A, K.; Janmaleki, M.; Sanati-Nezhad, A. Sandwich-Structured Nanoparticles-Grafted Functionalized Graphene Based 3D Nanocomposites for High-Performance Biosensors to Detect Ascorbic Acid Biomolecule. Sci. Rep. 2019, 9, 1–11. [Google Scholar] [CrossRef] [PubMed]
- Qi, S.; Zhao, B.; Tang, H.; Jiang, X. Determination of Ascorbic Acid, Dopamine, and Uric Acid by a Novel Electrochemical Sensor Based on Pristine Graphene. Electrochim. Acta 2015, 161, 395–402. [Google Scholar] [CrossRef]
- Zhu, H.; Xu, G. Electrochemical Determination of Ascorbic Acid Based on Hydrothermal Synthesized ZnO Nanoparticles. Int. J. Electrochem. Sci. 2017, 12, 3873–3882. [Google Scholar] [CrossRef]
- Yang, L.; Liu, D.; Huang, J.; You, T. Simultaneous Determination of Dopamine, Ascorbic Acid and Uric Acid at Electrochemically Reduced Graphene Oxide Modified Electrode. Sensors Actuators, B Chem. 2014, 193, 166–172. [Google Scholar] [CrossRef]
- Zhang, K.; Zhang, N.; Zhang, L.; Wang, H.; Shi, H.; Liu, Q. Simultaneous Voltammetric Detection of Dopamine, Ascorbic Acid and Uric Acid Using a Poly(2-(N-Morpholine)Ethane Sulfonic Acid)/RGO Modified Electrode. RSC Adv. 2018, 8, 5280–5285. [Google Scholar] [CrossRef] [PubMed]
- Kumar, A.; Furtado, V.L.; Gonçalves, J.M.; Bannitz-Fernandes, R.; Netto, L.E.S.; Araki, K.; Bertotti, M. Amperometric Microsensor Based on Nanoporous Gold for Ascorbic Acid Detection in Highly Acidic Biological Extracts. Anal. Chim. Acta 2020, 1095, 61–70. [Google Scholar] [CrossRef] [PubMed]
- Jiang, J.; Du, X. Sensitive Electrochemical Sensors for Simultaneous Determination of Ascorbic Acid, Dopamine, and Uric Acid Based on Au@Pd-Reduced Graphene Oxide Nanocomposites. Nanoscale 2014, 6, 11303–11309. [Google Scholar] [CrossRef] [PubMed]


| Electrode | Technique | LDR/ μM |
LOD/ µM |
Sensitivity/ μAμM-1cm-2 |
Applied potential/V | Ref. |
|---|---|---|---|---|---|---|
| PSi-MC/GCE | Amp | 0.5–2473 | 0.03 | 0.1982 | +0.7 | [13] |
| Poly(Py-oPD)/PGE | SWV | 1-1000 | 0.026 | - | - | [17] |
| GO-IL/GCE | Amp | 10-4000 | 3.33 | - | +0.8 | [39] |
| DMA/GCE | Amp | 25-1650 | - | 0.178 | +0.35 | [65] |
| PoPDoAP/GCE | DPV | 100-1000 | 36.4 | 0.0306 μAμM-1 | - | [66] |
| NFG/Ag/PANI | Amp | 10-11460 | 8.0 | - | +1.2 | [67] |
| PG/GCE | Amp | 9.0-2314 | 6.45 | 0.0667 μAμM-1 | -0.01 | [68] |
| ZnO/GCE | Amp | 1-800 | 0.27 | 0.1156 μAμM-1 | +0.36 | [69] |
| ERGO/GCE | DPV | 500-2000 | 150 | 0.0054 μAμM-1 | - | [70] |
| PMES/RGO/GCE | DPV | 30-100 | 0.43 | - | - | [71] |
| NPG | Amp | 10-1100 | 2.0 | 0.0021 μAμM-1 | +0.3 | [72] |
| GCE/Au@Pd-RGO | DPV | 0.01–100 | 0.002 | - | - | [73] |
| Yb2O3.CuO@rGO/GCE | Amp | 0.5–1571 | 0.062 | 0.4341 | +0.25 | This work |
| Real samples | Added std. AA (µM) | Total AA measured (µM) | AA measured in real samples (µM) | Recovery (%) | RSD (%) (n = 3) |
|---|---|---|---|---|---|
| BS1 | 48.8 | 96.2 | 46.2 | 102.4 | 4.52 |
| 97.6 | 147.4 | 103.7 | |||
| BS2 | 48.8 | 88.1 | 36.5 | 105.7 | 4.13 |
| 97.6 | 137.0 | 103.0 | |||
| Vit-C | 98.0 | 176.6 | 82.4 | 96.1 | 4.37 |
| 194.2 | 271.1 | 97.2 |
Disclaimer/Publisher’s Note: The statements, opinions and data contained in all publications are solely those of the individual author(s) and contributor(s) and not of MDPI and/or the editor(s). MDPI and/or the editor(s) disclaim responsibility for any injury to people or property resulting from any ideas, methods, instructions or products referred to in the content. |
© 2023 by the authors. Licensee MDPI, Basel, Switzerland. This article is an open access article distributed under the terms and conditions of the Creative Commons Attribution (CC BY) license (http://creativecommons.org/licenses/by/4.0/).


