Preprint
Article

First Retrievals of Surface and Atmospheric Properties Using EnMAP Measurements over Antarctica

Altmetrics

Downloads

176

Views

87

Comments

0

A peer-reviewed article of this preprint also exists.

Submitted:

25 April 2023

Posted:

26 April 2023

You are already at the latest version

Alerts
Abstract
The paper presents the first retrievals of clean snow properties using spaceborne hyperspectral The Environmental Mapping and Analysis Program (EnMAP) observations. The location close to the Dome C in Antarctica has been selected. At this location the atmospheric effects except molecular light scattering and absorption are weak and the simplified atmospheric correction scheme can be applied. The ice grain size, snow specific surface area and snow spectral and broadband albedos have been retrieved using single view EnMAP measurements. In addition, we propose the technique to retrieve trace gas concentrations (e.g., water vapor, ozone) from EnMAP observations over the snow surfaces. Close correspondence of satellite and ground measured parameters has been found.
Keywords: 
Subject: Environmental and Earth Sciences  -   Remote Sensing

1. Introduction

Cryosphere is an integral part of the terrestrial ecosystem with important linkages and feedbacks generated through its influence on moisture fluxes, hydrology, hydrosphere, clouds, radiation, water cycle and climate change due to temporal changes in snow/ice cover and albedo. Therefore, snow and ice properties are monitored using ground and satellite instrumentation [1,2,3]. The measurements are performed at various temporal and spatial scales using in situ measurements and also passive and active remote sensing instrumentation in a broad spectral range. The high spatial resolution is highly relevant for studies of cryosphere due to the horizontal variability of snow properties and impurity load (dust outbreaks, algae, soot). The instruments with a coarser spatial resolution (say, 0.3–1 km) are not capable to resolve fine scales of snow and ice variability. In particular, he accurate information on specific snow features (e.g., spatial distribution of algal blooms) can be hardly detected using measurements performed on the scale 0.3–1.0 km. The Environmental Mapping and Analysis Program (EnMAP) is a German hyperspectral satellite mission [4], which provides information on the evolution of aquatic and terrestrial ecosystems including cryosphere on the spatial scale of 30 m with 224 bands in the wavelength range between 400 and 2500 nm, which means a better spectral and spatial resolution compared to many other satellite missions (e.g., Ocean and Land Colour Instrument (OLCI) on board Sentinel—3 (S-3)). The measurements of EnMAP can be also used to assess the sub-pixel snow variability for coarse spatial resolution satellite missions, estimate the accuracy of satellite products derived on coarser spatial grids (e.g., snow fraction), and also for the calibration and validation of spatially and spectrally coarser products as optimized input for numerical climate products.This paper is aimed at the adaptation of the previously proposed optical snow remote sensing technique [5,6,7,8] to EnMAP measurements over areas with clean dry snow. We use the fact that the intensity of the shortwave infrared (SWIR) radiation reflected from snow depends on the snow grain size, which is the main parameter governing snow optical properties. This is also the main basis of other available snow remote sensing algorithms relying on optical (including hyperspectral) measurements [9,10,11,12,13,14]. In particular, we derive the snow grain size, snow specific surface area, spectral and broadband snow albedo and snow bidirectional reflection distribution function (BRDF) from single–view spectral measurements of snow reflectance over Antarctica. It is assumed that snow does not contain impurities and can be modelled as a vertically and horizontally homogeneous semi-infinite light scattering layer. This technique has been successfully applied to Ocean and Land Colour Instrument on board Sentinel—3 measurements as reported in [15]. The validation results are given in [6,7,15,16,17]. The respective software is available in both Python and Fortran implementations at https://github.com/GEUS-SICE/pySICE (accessed on 20 April 2023) [18]. In addition, we derive total ozone column (TOC) and precipitable water vapor (PWV) over the selected area in Antarctica from EnMAP measurements. The retrieval is based on the analysis of the depth of the gaseous absorption bands as seen in the reflected light, which is a common technique as far as spaceborne trace gas remote sensing is of concern [19]. The observation of TOC is of importance due to the frequent occurrence of ozone holes (TOC < 220 DU) over Antarctica with harmful effects on the biosphere. Since water vapor is the most important greenhouse gas in the atmosphere, accurate PWV information is essential. Heat radiated from the Earth's surface is absorbed by water vapor molecules in the lower atmosphere. The water vapor molecules, in turn, radiate heat in all directions. Some of the heat returns to the underlying surface. Thus, water vapor is a second source of warmth (in addition to sunlight) at the Antarctic surface. The atmosphere in inner Antarctica is very dry with values of PWV around 0.4—0.5mm on average [20,21,22].

2. EnMAP

EnMAP has been launched on April 1, 2022 and is scheduled to operate till 2027. The swath is 30 km and the spatial resolution is 30 m. The nadir re-visit time is 27 days. Off-nadir (30 degrees) pointing feature provides an opportunity for more frequent revisit times (once every four days). The EnMAP contains two detectors that have a wavelength overlap:
  • Visible-near infrared (VNIR)–operating in the range 418 nm to 993 nm;
  • Short-wave infrared (SWIR)–operating in the range 902 nm to 2445 nm.
There exist three levels of EnMAP data products that can be ordered by the users:
  • L1B: top-of-atmosphere (TOA) radiance; Level 1B Processor converts digital numbers into calibrated at-sensor radiances, applying dark signal, non-linearity, gain matching, response non-uniformity and straylight corrections as well as radiometric calibration.
  • L1C: orthorectified L1B data; The Level 1C Processor carries out a direct georeferencing of the L1B product, which accounts for sensor-, satellite motion-, and terrain-related geometric distortions. The L1C product is an orthorectified single data cube, resampled and transformed to a map projection system (e.g. UTM Universal Transverse Mercator projection with WGS84 datum).
  • L2A: bottom of atmosphere (BOA) reflectance (atmospherically corrected L1C data) and in case of water surfaces optionally normalized water leaving reflectance or underwater reflectance. It also includes the correction for thin cirrus, haze, terrain, and adjacency effects. The land product is fully compliant with the CEOS CARD4L guidelines [23].
The spectral ranges 1400–1450 nm and 1770–1930 nm are masked out. The results of measurements t these spectral intervals are not utilized due to the influence of strong water absorption bands centered at 1380 nm and 1870 nm. The full width at half maximum (FWHM) of the instrument response function depends on the channel. It is in the range of 5.8–10.8 nm for the VNIR and 7.1–11.5 nm for the SWIR detectors.
The features of the instrument, which are of importance for snow research, are the capability to make the measurements over the polar regions and also the coverage of the spectral regions with the maximum sensitivity to the snow parameters (e.g., snow grain size). Further details on the instrument are given in [4].
This study is based on TOA reflectance data in sensor and map geometry that is not provided by the ENMAP L1B and L1C products directly. However, it can be converted using the following equation: R = π I / s F μ 0 , where R is the TOA reflectance, I is the TOA radiance, μ 0 is the cosine of the solar zenith angle (SZA), F is the extraterrestrial solar flux at the surface perpendicular to the solar beam and s is the parameter close to 1, which accounts for the Earth-Sun distance variation. The value of F is not measured by the EnMAP directly and is convolved from solar irradiance model presented in [24].

3. Theory

3.1. Retrieval of Snow Properties

The snow grain size is an important parameter of snow surfaces. A change of grain size at the ground may serve as an indication of recent snowfalls, melting events, or blowing snow drifts. This is related to the fact that snow covers with larger snow grains are characterized by larger absorption (smaller reflection) of electromagnetic radiation in the SWIR spectral range and thus controlling the amount of solar radiation, which is reflected back to outer space. As a matter of fact, the following relationship between snow reflectance R s and effective absorption length (EAL) L in the VNIR and SWIR regions of the electromagnetic spectrum exists [3,25]:
R s = R 0 r s f ,
where
r s = e x p α L
is the spherical albedo, α = 4 π χ / λ is the bulk ice absorption coefficient at the wavelength λ, χ is the imaginary part of the ice refractive index [26,27], R 0 is the value of the snow reflectance at α = 0 . It is assumed that snow is a horizontally and vertically inhomogeneous semi–infinite turbid medium although it is not always the case of the scale of the EnMAP ground scene. The parameter f is given by the following approximate equation [25]:
f = u μ 0 u ν R 0 ,
where ν is the cosine of the viewing zenith angle (VZA) and μ 0 is the cosine of the solar zenith angle (SZA). The escape function u μ 0 can be parameterized as follows [3]:
u μ 0 = 3 5 μ 0 + 1 + μ 0 3 .
The accuracy of Equations (1), (2) increases in the weak absorption approximation range (the single scattering albedo ω 0 1 ) [3,6].
The values of L, R 0 can be derived from Equations (1), (2) analytically using EnMAP measurements at two wavelengths λ 1 , λ 2 of the SWIR detector R m e a s 1 , R m e a s 2 , where atmospheric light scattering and absorption processes can be neglected. Namely, it follows from Equations (1), (2) [8]:
R 0 = R m e a s , 1 ϵ R m e a s , 2 1 ϵ   ,   L = 1 α 2 f 2 l n 2 ( R m e a s , 2 R 0 )
where ϵ = 1 1 b , b = α 1 α 2 , α i = 4 π χ i λ i . Here χ 1 , χ 2 are imaginary parts of ice absorption coefficients at the wavelengths λ 1 , λ 2 . We shall use the following wavelengths of EnMAP free of gaseous absorption: λ 1 = 1026   n m , λ 2 = 1235   n m . Then it follows:
χ 1 = 2.298 × 10 6 , χ 2 = 1.178 × 10 5 ,
where we used the linear interpolation of data given in [26]. The effective absorption length (EAL) L can be used to calculate multiple snow properties including broadband albedo [28] and BRDF (see Table 1). In particular, the effective grain diameter (EGD) d can be found using the following linear relationship[8]:
L = κ d ,
where the constant κ depends on the snow type and the shape of the grains. The effective grain diameter is defined as [29]:
d = 3 V 2 Σ ,
where V is the average volume of grains and Σ is their average projected area [29]. We sg=hall use the following value for the constant in Equation (7): κ = 16 [8,30,31,32].
One can also derive the snow specific surface area (SSA) σ [33] from the value of EAL. Namely, it follows:
σ = S M ,
where S is the average surface area and M is the average mass of snow grains. Also, one can derive from Equations (8), (9):
σ = ξ ρ d ,
where ξ=3S/2 Σ. Therefore, it follows:
σ = C ρ L ,
where
C = 3 κ S 2 Σ .
The calibration constant C depends on the shape of grains and snow type. It does not depend on the size of snow grains and can be derived from independent measurements of SSA (say, using microtomography or adsorption techniques [34] and EAL using, e.g., snow albedo measurements. In particular, it follows from Equation (2):
L = l n 2 r s λ s w i r α λ s w i r ,
where λ s w i r is the wavelength in the SWIR region of the electromagnetic spectrum (e.g., 1235 nm). It follows for the surface area of randomly oriented convex particles [35]: S = γ Σ , where γ = 4 , and, therefore, C = 6 κ . We shall use this assumption in the retrieval of SSA based on spaceborne observations (see Table 1). It should be pointed out that concave particles exist in snow as well [3]. In particular, it follows that γ = 7.35 for the so-called concave Koch snowflakes [29]. In this case, the constant C is almost two times larger as compared to the assumption used in this paper. Therefore, the surface area is substantially increased for concave particles having the same parameter Σ as for convex particles. The expected range of the parameter C is between 90 and 180 and, therefore, more accurate estimations of the calibration constant C based on experimental measurements are needed.
The bottom of atmosphere snow spectral reflectance and snow spherical/plane (spectral and broadband) albedo can be easily derived if the value of L is known [3] (see Table 1). We conclude that EAL is the major parameter of snow covers and must be reported in current and future snow remote sensing algorithms based on the measurements in the SWIR range of the electromagnetic spectrum.

3.2. Retrieval of Precipitable Water Vapor and Total Ozone Column

The differences between retrieved bottom of atmosphere reflectance (see Table 1) and EnMAP measured top of atmosphere reflectance can be attributed to atmospheric scattering and absorption processes. Therefore, there is a way to get atmospheric properties from EnMAP measurements.
To demonstrate this statement, we have applied the retrieval procedure described above to the EnMAP measurements at Dome C in the vicinity of the Concordia station (75.1° S, 123.35° E) in Antarctica (EnMAP data take ID: 4946, acquisition datetime: 2022-10-29 00:11:38 (UTC+0), tile: 002, processing version: 010111, processing date: 13 December 2022, off-nadir pointing (across-track): 13.84 degrees, off-nadir pointing (along-track): 0.16 degrees, solar zenith angle: 67.26 degrees, solar azimuth angle: 53.31 degrees).
The EnMAP L1B top-of-atmosphere radiance product in sensor geometry data has been used. The data cubes were scaled band-wise based on the gain and offset information provided in the metadata to mW/ m 2 /sr/nm. Slight EnMAP inherent across-track radiometric misregistrations, which result in striping artifacts in the L1B data product and the derivatives based on them, have been compensated by an in-house de-striping algorithm (which will be implemented in the official data product in the future). The de-striped TOA radiance data has then been converted into TOA reflectance as discussed above. All derived snow parameters in this paper are based on TOA reflectance in sensor geometry generated based on the de-striped L1B data set.
A comparison of the derived spectral BOA reflectance and EnMAP–measured TOA reflectance is shown in Figure 1. The calculation of BOA spectral reflectance is based on two retrieved snow parameters (L = 2.3163 mm and R 0 = 0.9534 ) and bulk ice spectral absorption coefficient provided in [26] (in the near infrared and SWIR) and in [27] (in the visible). As underlined in the previous section, the SWIR channels located at 1026   n m   a n d   1235   n m have been used. As can be seen from the analysis of the EnMAP TOA reflectance given in Figure 1, the measurements at these channels are not affected by gaseous absorption and atmospheric light scattering effects in an optically thin atmosphere at Dome C [37]. Actually, BOA and TOA reflectances at these channels almost coincide, which is used in this work to generate snow properties from EnMAP measurements.
The difference of BOA and TOA reflectances around 450nm, where atmospheric light absorption processes can be neglected, is very small, which points out to the fact that this difference can be attributed to molecular scattering processes with negligible contribution from aerosol particles present at very small concentrations at this highly elevated Antarctic site.
The difference of curves shown in Figure 1 in the spectral range 400-1300 nm is mostly due to gaseous absorption. The depths of gaseous absorption bands (see, e.g., the ozone absorption band at 600 nm in Figure 1) can be used to retrieve their total columns from EnMAP reflectance spectra [19]. The differences for the range of reflectance below 0.3, where BOA and TOA reflectance must almost coincide for the optically thin Antarctic atmosphere (outside gaseous absorption bands), are mostly due to the limited range applicability of the theory described in the previous Section. The presented theory is valid only for weakly absorbing strongly light scattering media [6,25]. In addition, the layered nature of snowpack may play a role [38,39,40].
We propose to use the measurements at the wavelength λ 3 = 1128.47   n m to estimate the precipitable water vapour from EnMAP data. As one can see from Figure 1, the TOA atmosphere reflectance just outside of the water absorption band located at 1130 nm is well described by the derived BOA reflectance. Therefore, we can propose the following simple analytical model for the TOA reflectance in the studied water absorption band:
R T O A λ = R T O A , n o g a s λ T H 2 O λ ,
where R T O A , n o g a s λ can be approximated by the snow reflection function R s λ given by Equations (1), (2) and the pair ( L , R 0 ) is derived as explained above. Equation (14) makes it possible to determine the water vapor spectral transmission function:
T H 2 O λ = R T O A λ R s λ .
We can also introduce the slant water vapor optical thickness τ H 2 O λ   such that
T H 2 O λ = e x p τ H 2 O λ
Or
τ H 2 O λ = l n T H 2 O 1 λ .
One can see that the task of the precipitable water vapor (PWV) determination from TOA EnMAP spectra is reduced to the determination of the precipitable water vapor from the spectrum τ H 2 O λ . The spectrum τ H 2 O λ can be simulated for various illumination and observation geometries and also air pressure, temperature, and water vapor profiles using suitable radiative transfer models. Corresponding look-up-tables can be used to derive the value of PWV from the analysis of the spectrum τ H 2 O λ .
In this work we shall use the approximation for the slant water vapor optical thickness proposed in [41,42,43]:
τ H 2 O λ = x n λ ,
where n = 0.646 for the water vapor absorption band located at 1130 nm [41] and
x λ = B M N H 2 O k λ .
Here, N H 2 O is the precipitable water vapor column to be determined, k λ is the absorption coefficient of water vapor, M is the airmass factor, and B is the correction coefficient, which accounts for the air pressure and temperature profiles. We have used the following expression for the correction coefficient [41]:
B = P / P 0 a T 0 / T b ,
where a = 0.781, b = 0.439 for the considered absorption band T 0 = 273.16   K ,   P 0 = 1013.25   h P a . T h e p a i r (P, T) is the average pressure and temperature for a given location calculated using respective vertical profiles. It has been derived in this work using the average profiles for these parameters at Dome C for October (491 hPa and 229 K, respectively). The set is obtained through an average of all the radiosoundings (up to the height H = 7 km, see Figure 3 in [44]) performed by the Antarctic Meteo–Climatological Observatory (AMCO) (https://www.climantartide.it/) between 2012 and 2017, binning the soundings monthly. It should be pointed out that the average ground values of these parameters for October at Dome C at the ground level are equal to 639 hPa and 220 K, respectively. The AMCO reports ground pressure and temperature equal to 651 hPa and 225 K for the moment of satellite measurements, which is close to the average values. The recorded wind speed was 4.6 m/s and the relative humidity was 51%. The sky was clean and clouds were absent.
Equation (19) makes it possible to avoid the use of look-up-tables and derive the PWV from the following analytical equation:
N H 2 O = x λ 3 B M k λ 3 ,
where we use the following EnMAP channel: λ 3 = 1128.45   n m . It follows from Equations (18), (21):
N H 2 O = τ H 2 O 1 / n λ 3 B M k λ 3 ,
where τ H 2 O λ 3 can be obtained from Equations (17), (15), (1), where R T O A λ 3 = R m e a s λ 3 . This equation makes it possible to determine the precipitable water vapor for a given air mass factor M and the correction coefficient B using the EnMAP measurements at the wavelength λ 3 . We have used the following value for the absorption coefficient of water vapor [41]: k λ 3 = 1.793   c m 1 , where we have accounted for the relatively broad (11 nm) width of the used EnMAP channel.
The same arguments as explained above can be applied to other trace gases including ozone. In particular, we can derive for the total ozone column (TOC) using arguments similar to those used to obtain Equation (22) [45]:
N O 3 = τ O 3 λ 0 M C a b s ,   O 3 λ 0 ,
where
τ O 3 λ = l n R T O A , n o g a s λ 0 R T O A λ 0
and we assume that λ 0 = 599.267   n m (close to the center of the ozone Chappuis absorption band). We have also used the fact that n = B = 1 for the ozone Chappuis absorption band[43,46]. The spectra of ozone absorption cross section C a b s ,   O 3 ( λ ) measured by Serdyuchenko et al. [47] have been used. The value of C a b s ,   O 3 ( λ ) is almost not influenced by air temperature and pressure for typical atmospheric conditions in the spectral range studied, which is an important feature as far as practical applications of the described algorithm are of concerned. In particular, we use the following cross section value at T = 213 K[47]:
C H 2 O 599.27 n m = 5.06707 × 10 21 c m 2 m o l e c .
Then the value of the total ozone column is expressed in mol/ c m 2 . Usually the value of TOC is expressed in Dobson Units (DU). Using the fact that 1 DU = 2.689 × 10 16 m o l e c c m 2 , we can derive from Equations (23) and (24) the total ozone column expressed in DU:
N O 3 = K τ O 3 λ 0 M ,
where K = 7339.26 DU. It should be pointed out that t h e r e t r i e v e d   τ O 3 λ 0   and thus TOC derived using Equation (26) under assumption that R T O A , n o g a s λ 0 = R s λ 0 is biased because the atmospheric light scattering cannot be neglected in this spectral range. This conclusion can be drawn from the analysis of Figure 1 in the spectral range 400—700 nm as well. In particular, one can see that the derived BOA reflectance and TOA reflectance differ around 400nm due to mostly molecular scattering effects. Therefore, we have estimated the value of R T O A , n o g a s λ 0 using the third order polynomial derived from EnMAP measurements at the channels 429.29, 486.94, 706.40, and 839.73 nm. In addition, we used the geometrical approximation for the airmass factor:
M = 1 / ν + 1 / μ 0 .
This completes the description of our retrieval procedure based entirely on analytical equations. The proposed theory makes it possible to perform fast and accurate retrievals of snow properties and also PWV and TOC over snow using EnMAP measurements.

4. Application of the Retrieval Algorithm to L1B Top-of-Atmosphere EnMAP Radiance Data
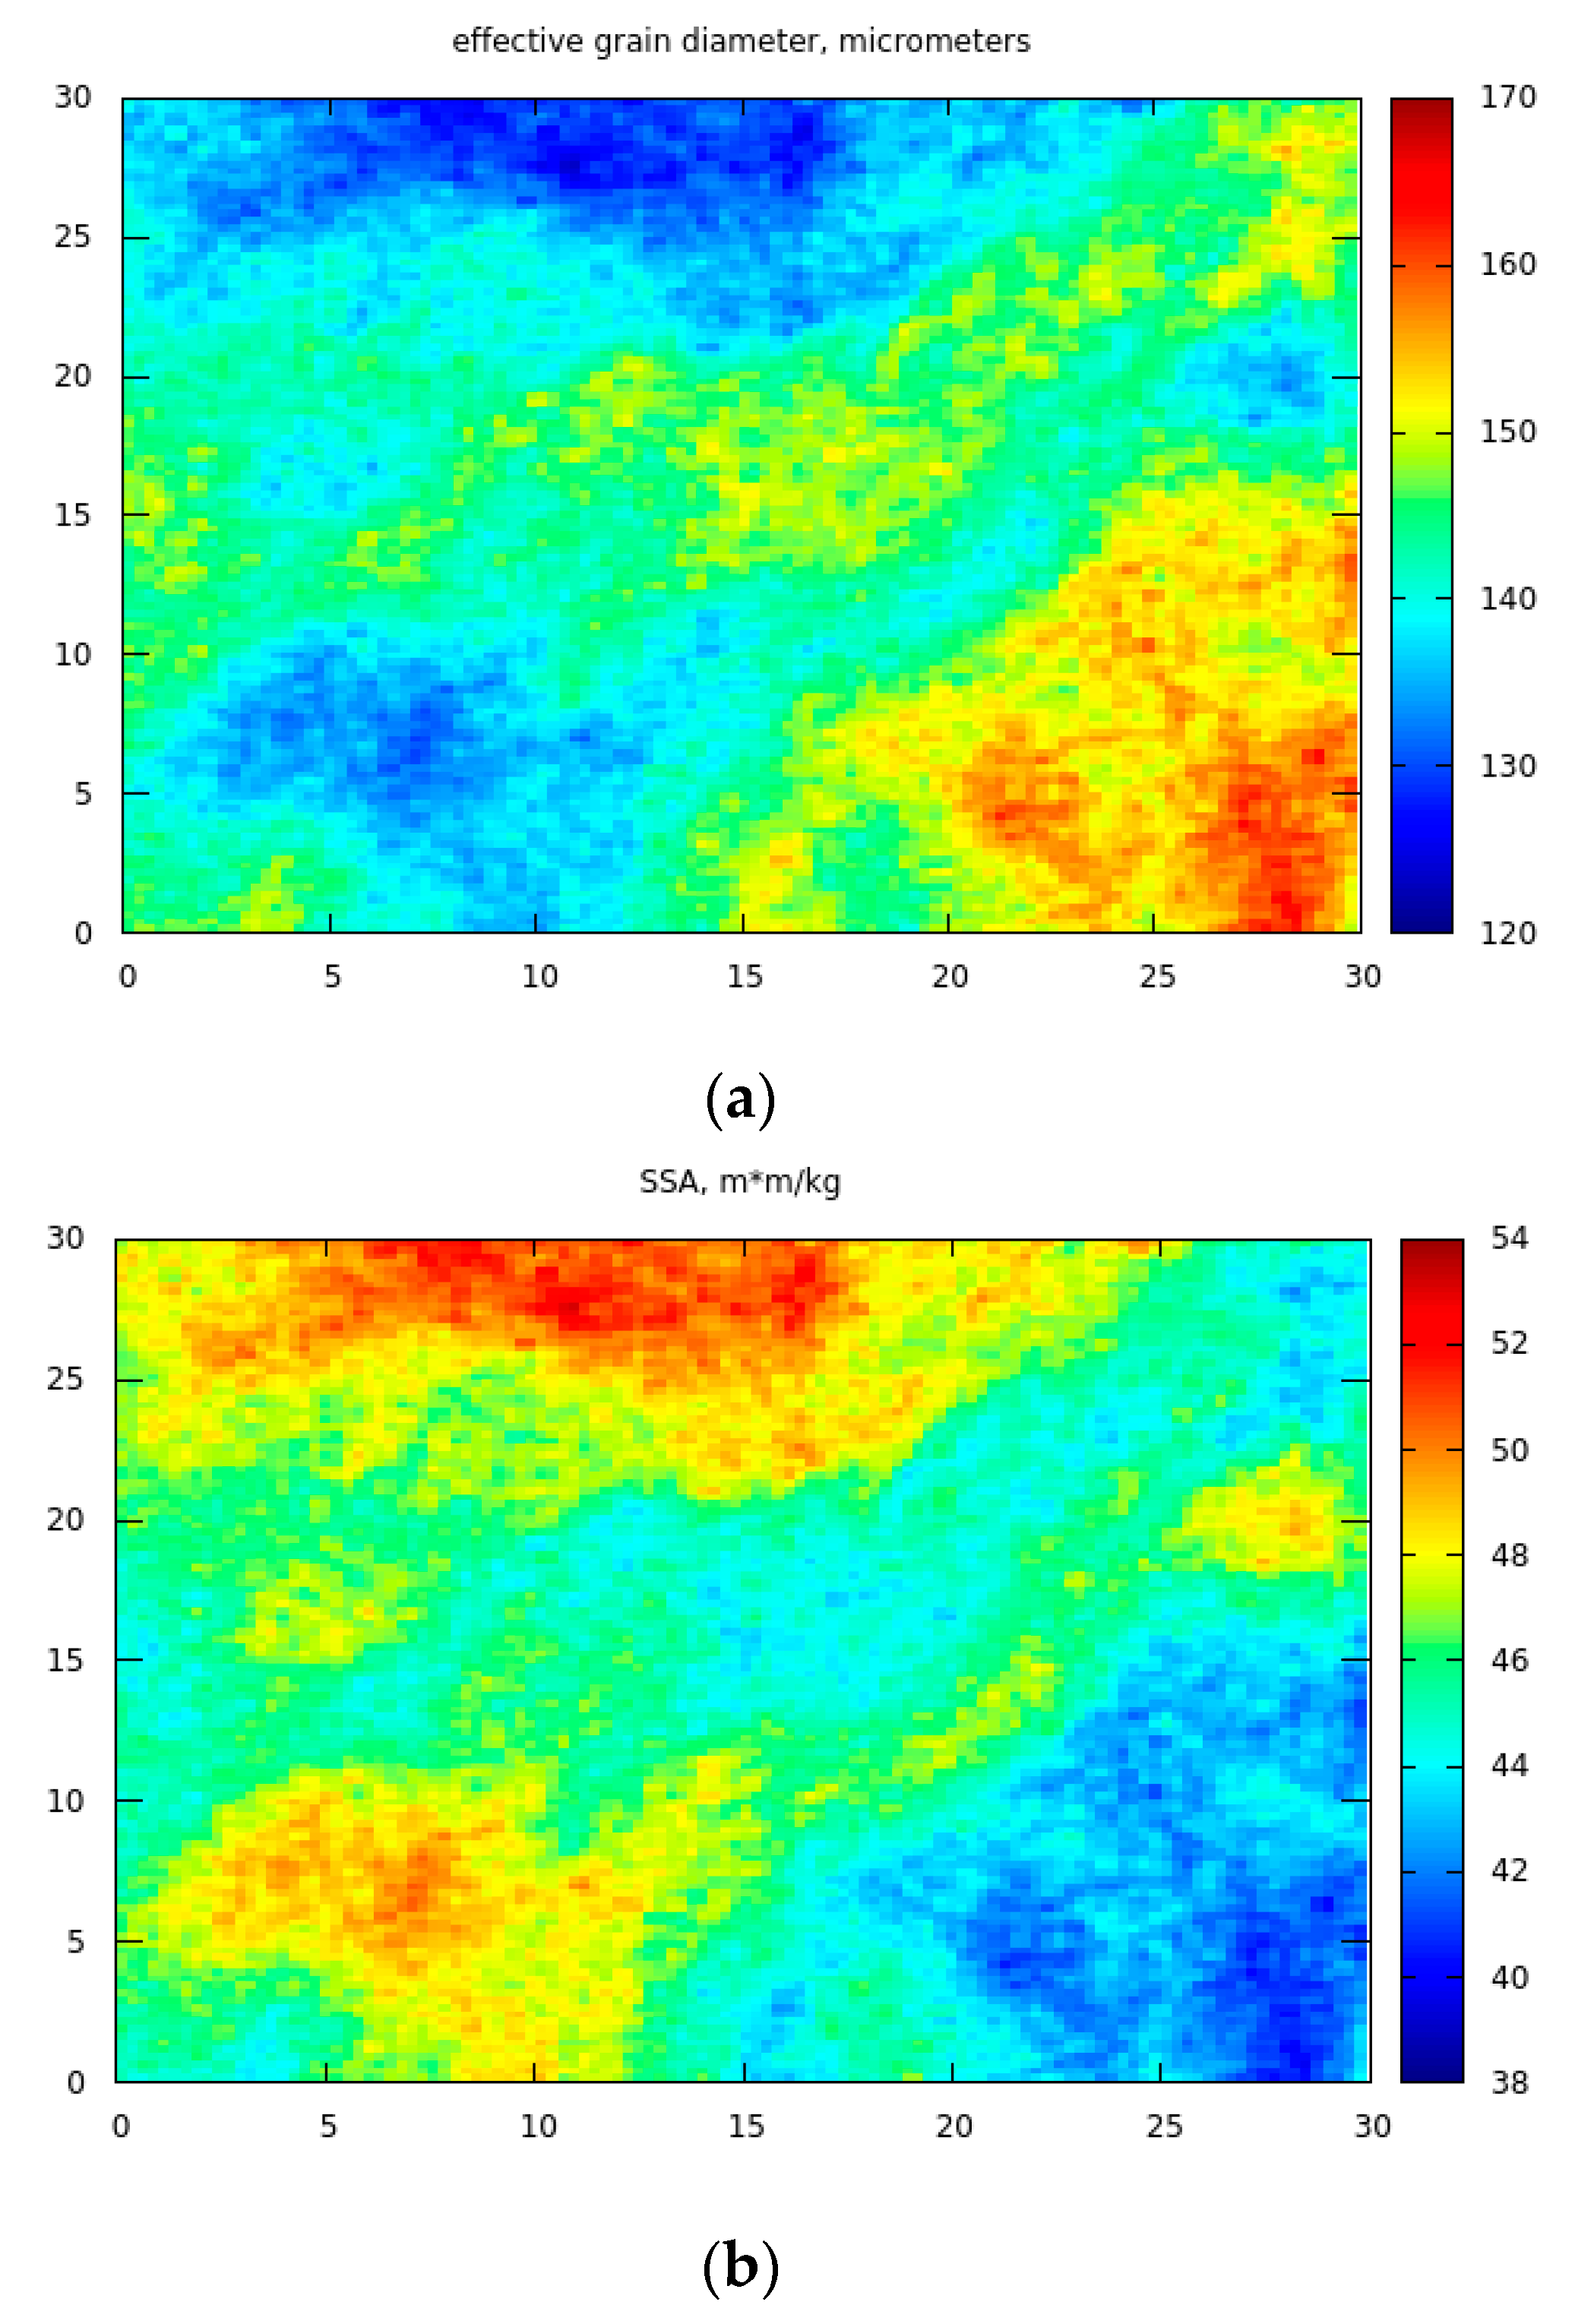
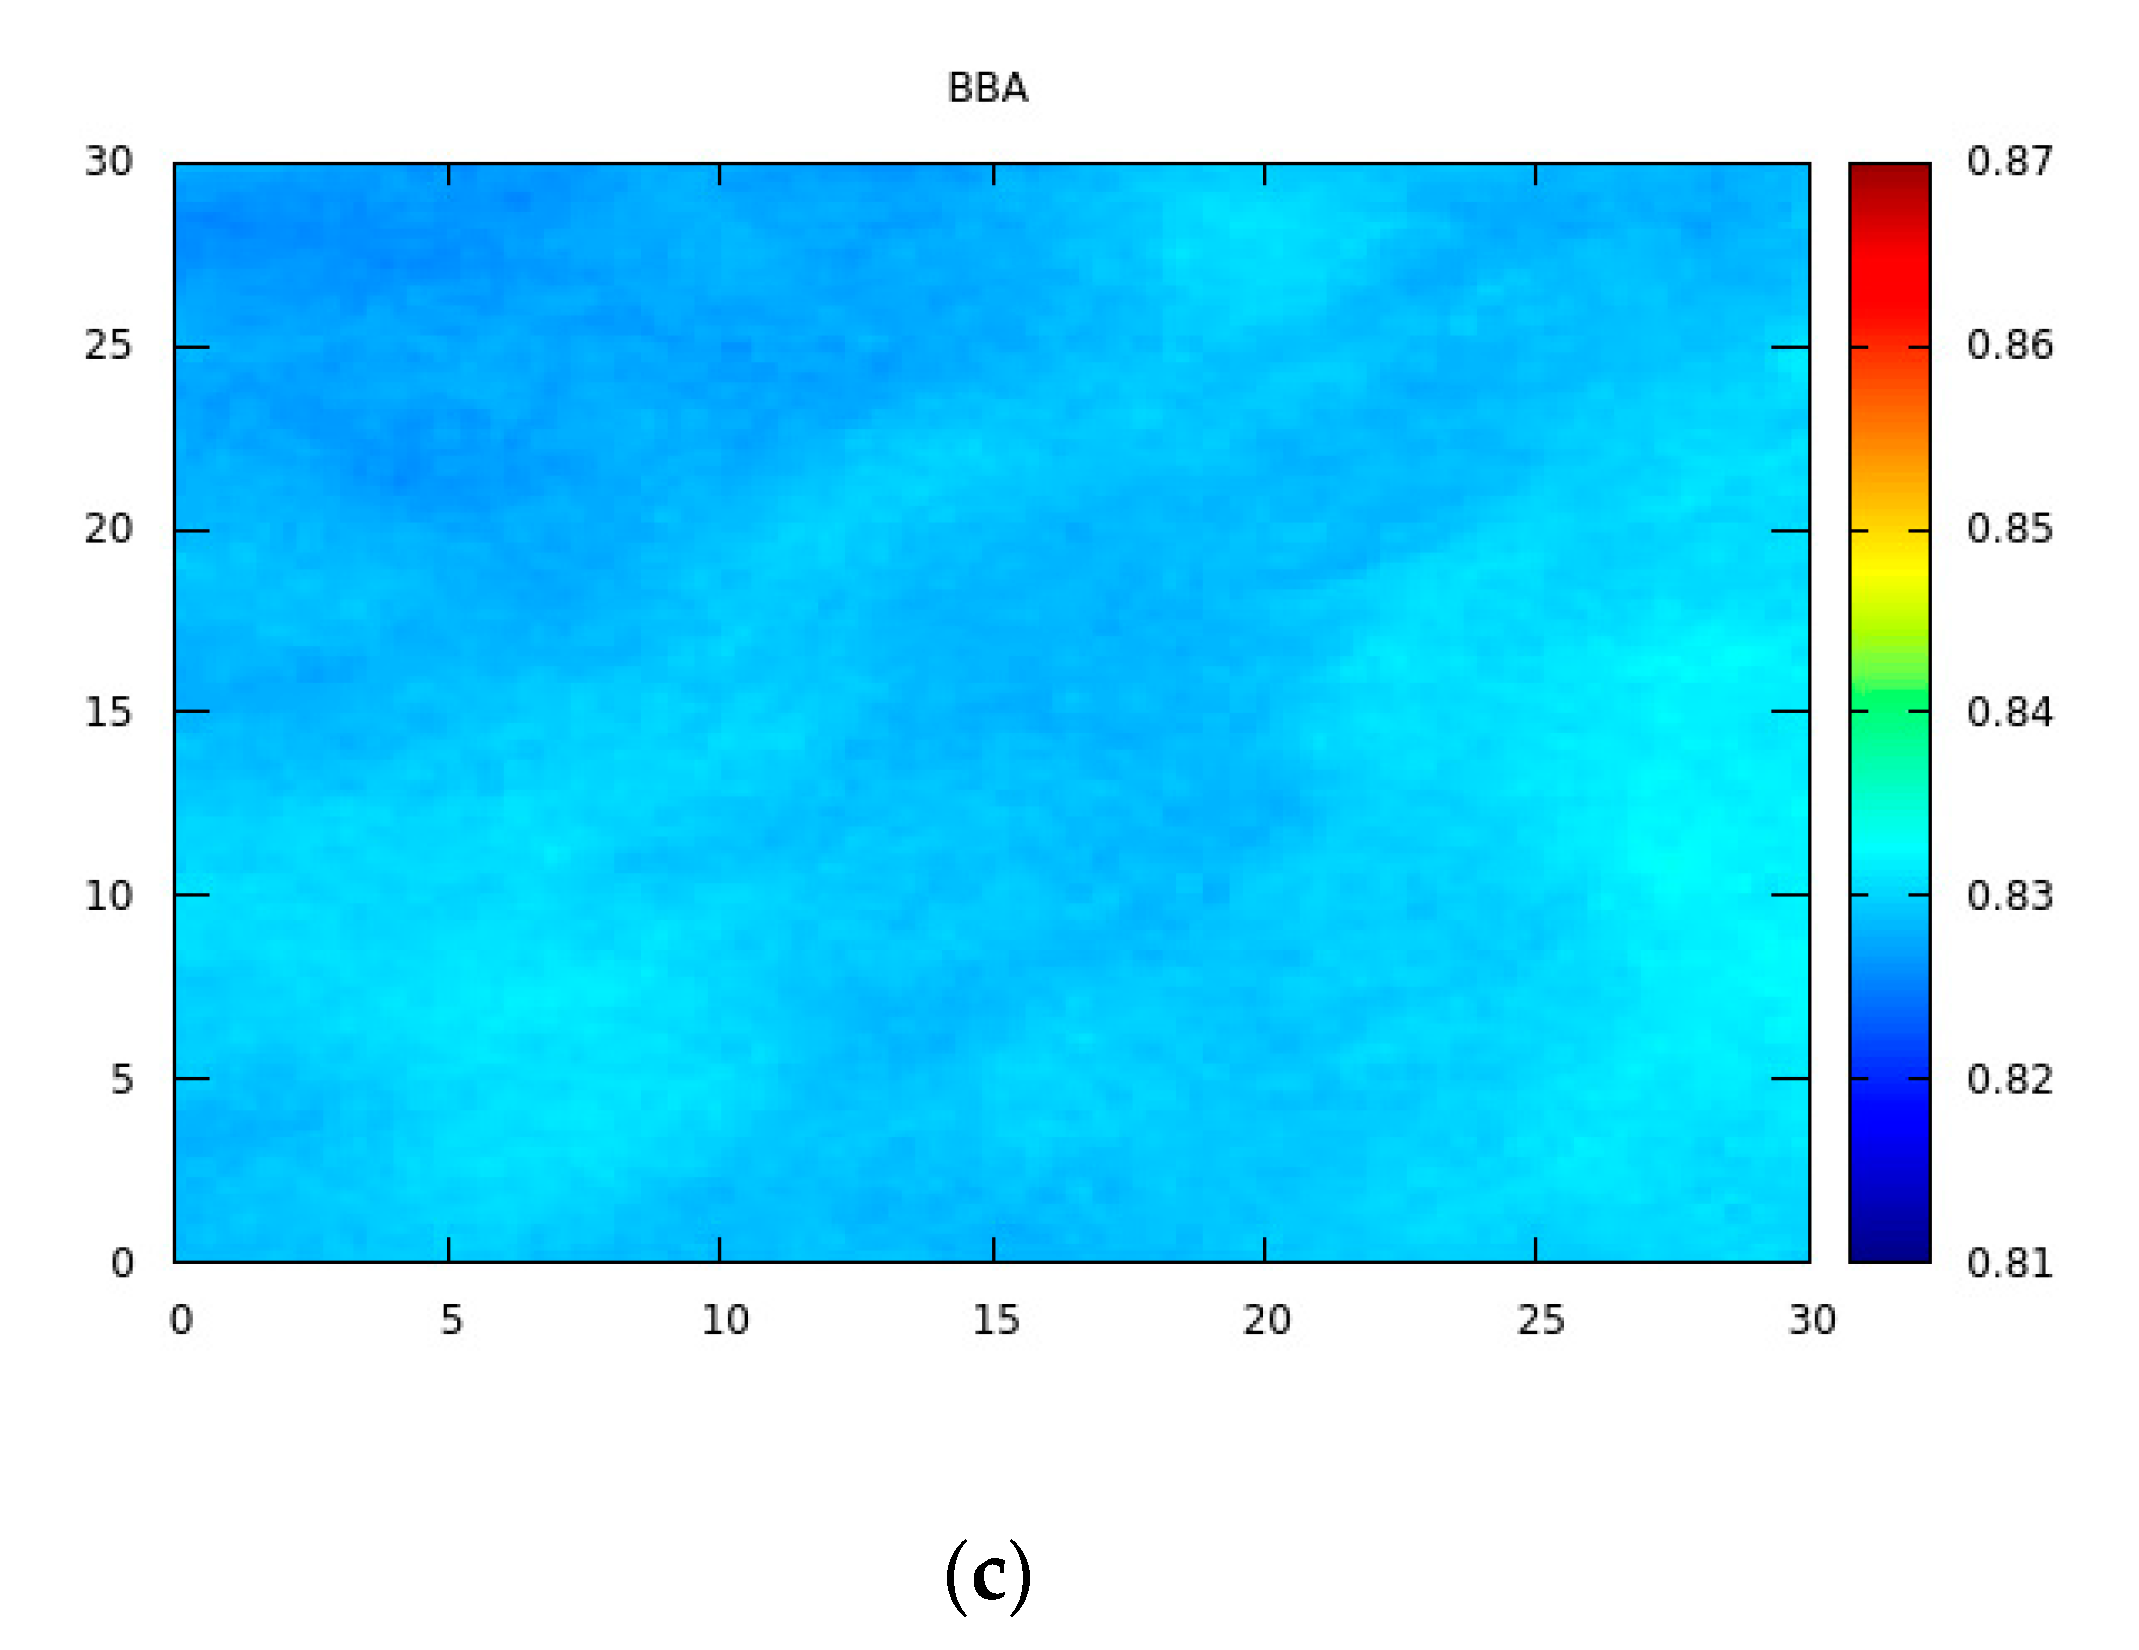
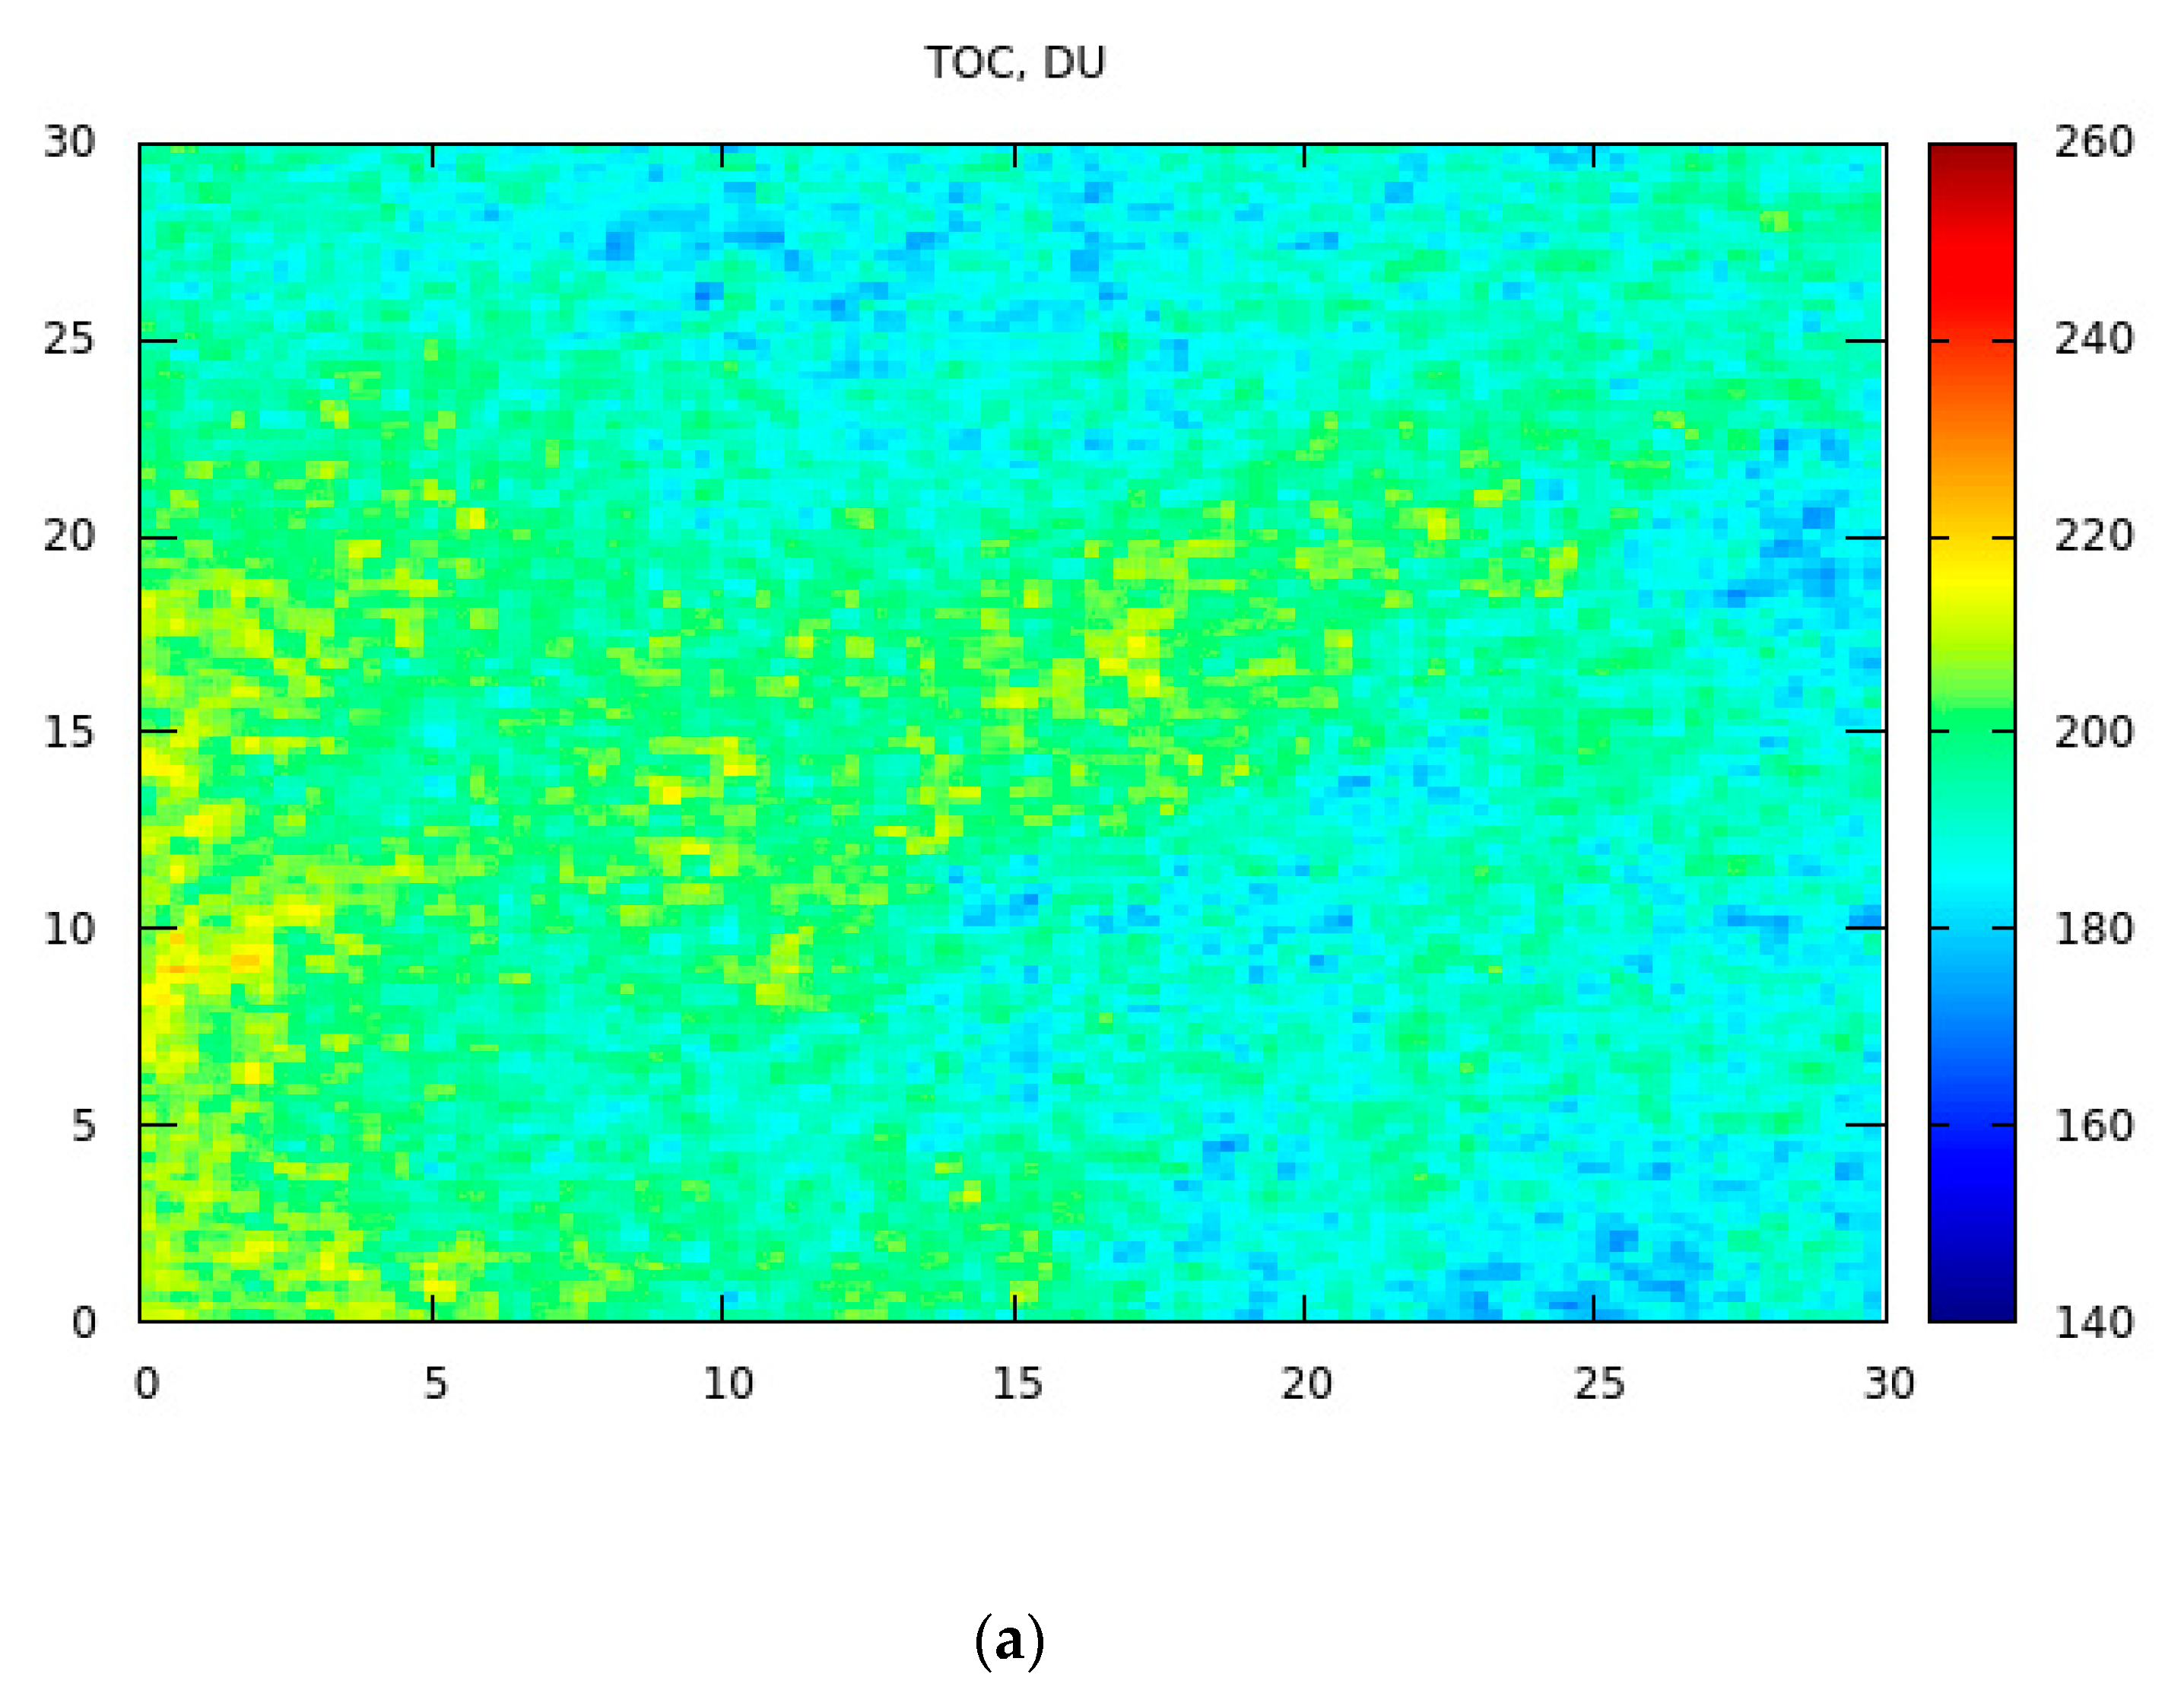
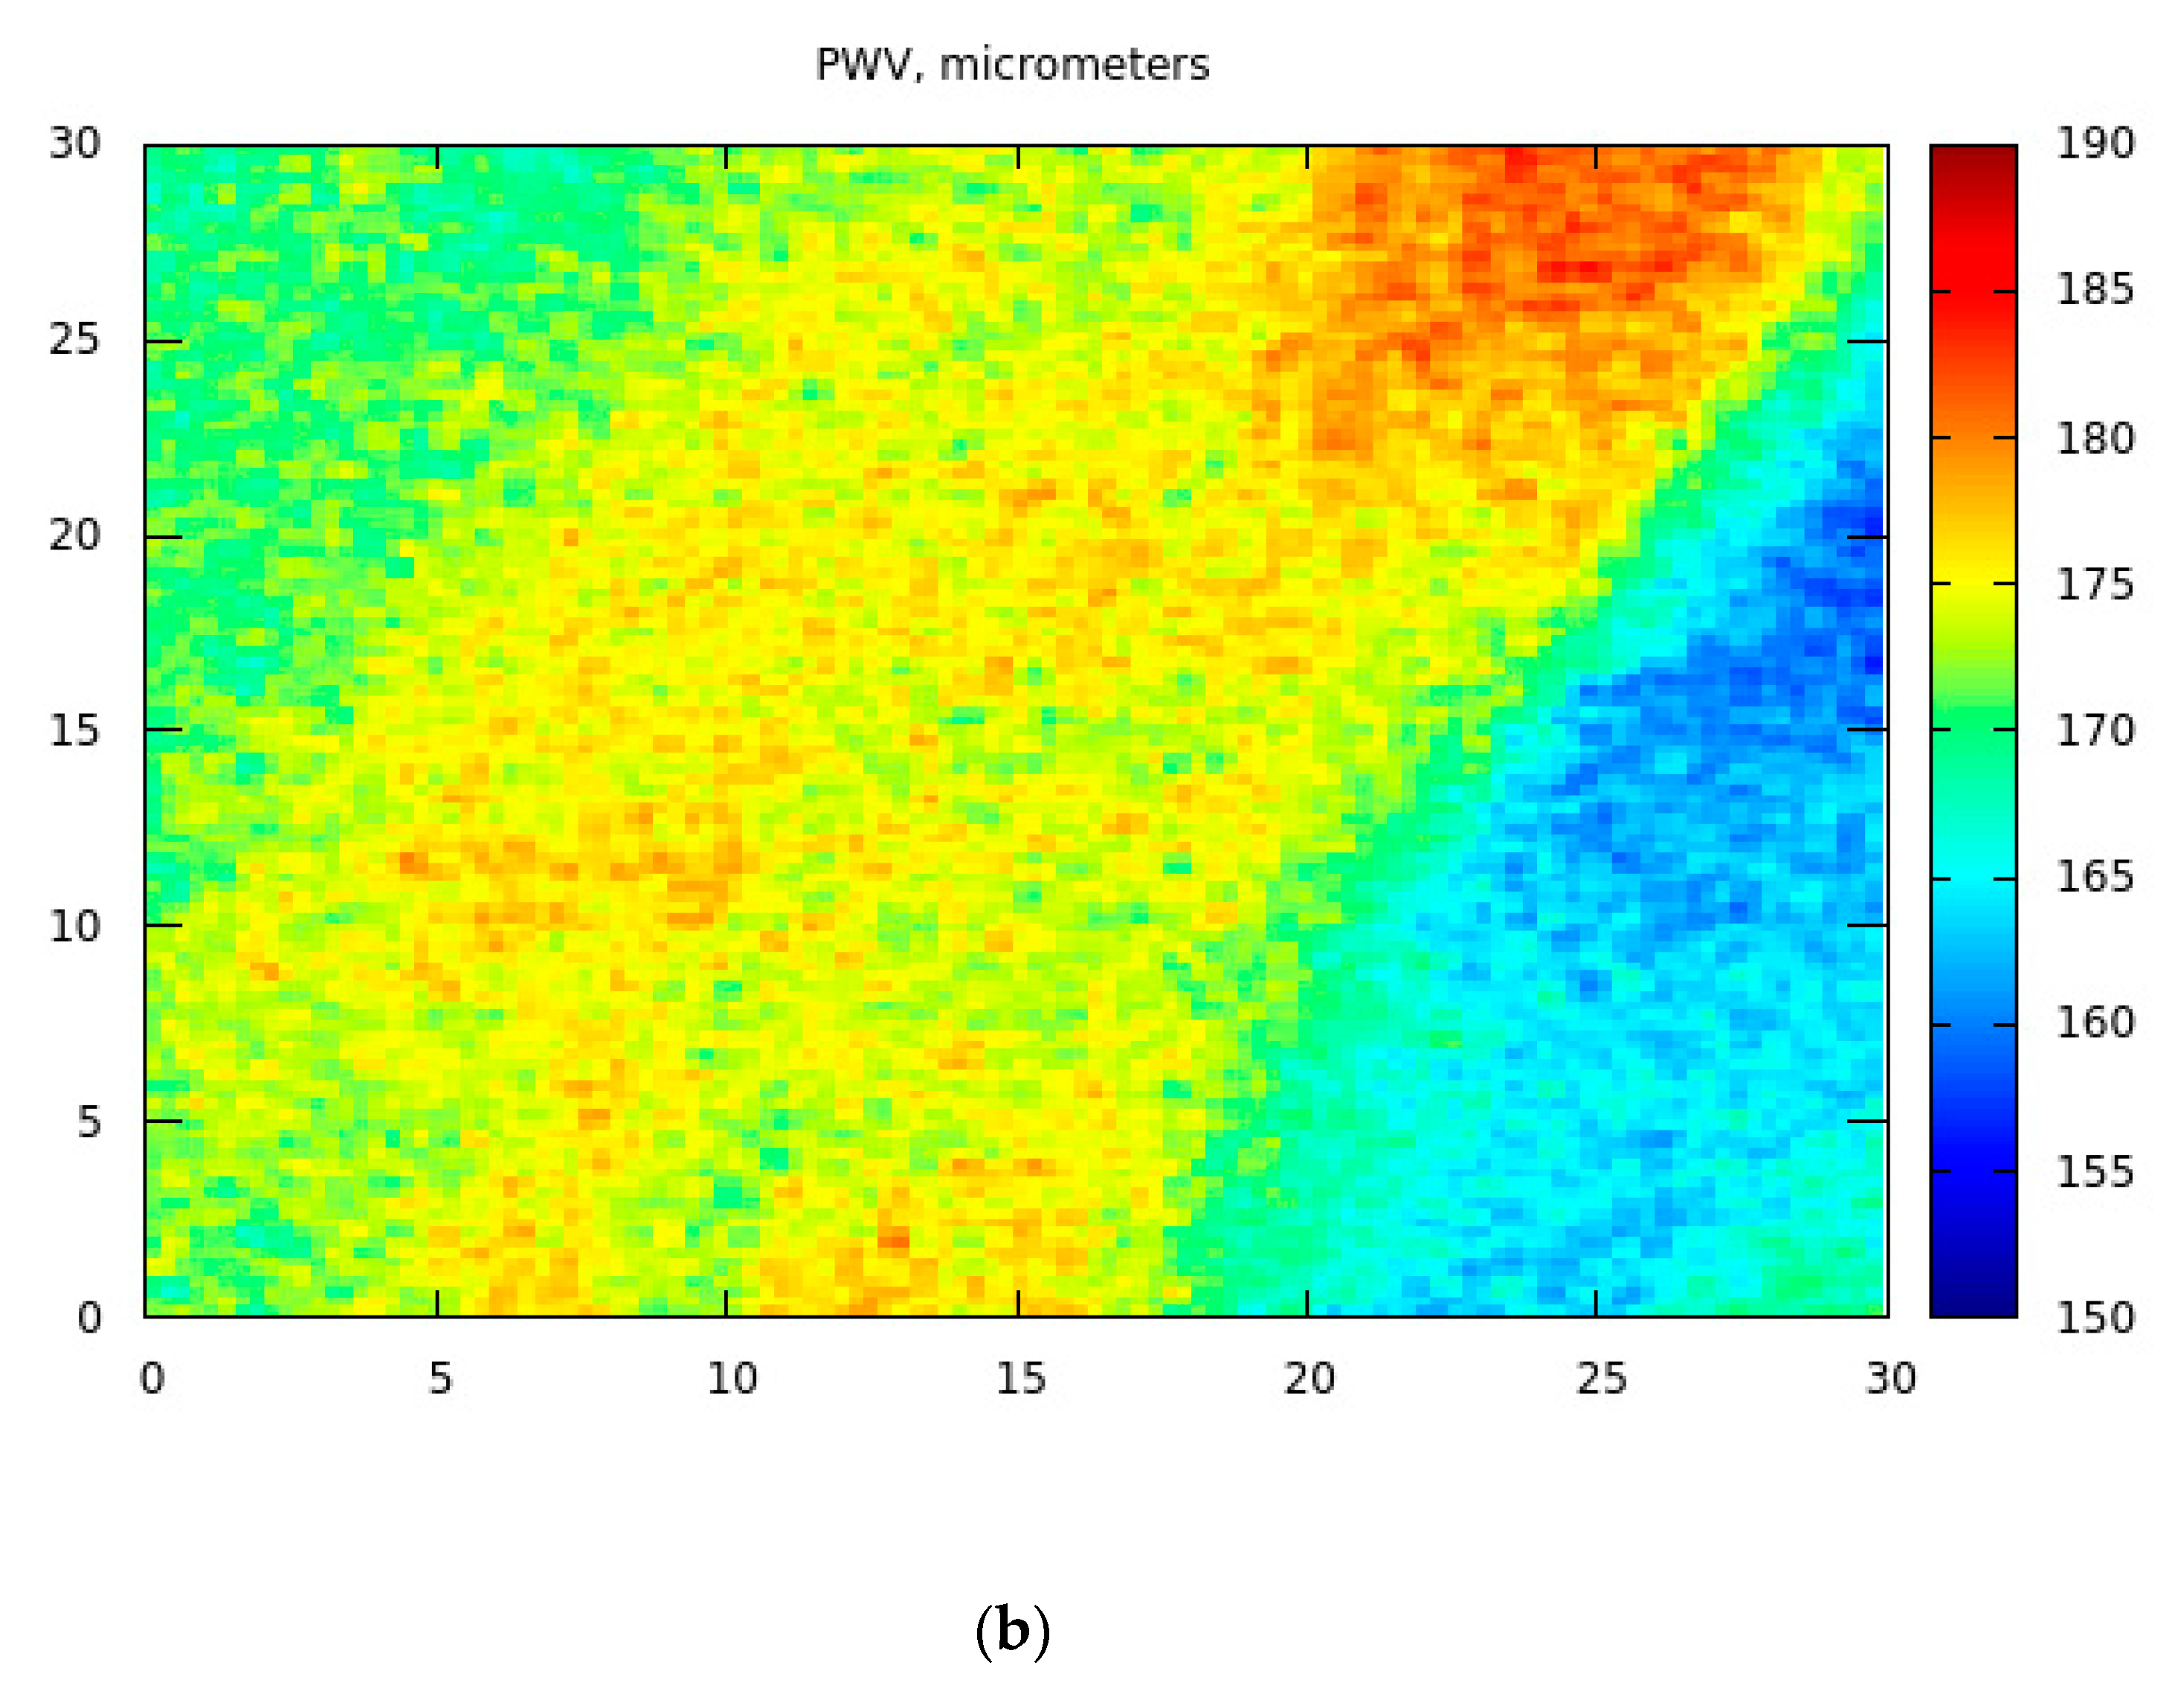
We have applied the described retrieval algorithm for the whole EnMAP scene ( a b o u t   10 6   p i x e l s ) in the vicinity of Concordia station at Dome C (75°06′00″ S, 123°19′58″ E, 3233 m elevation) in Antarctica (October 29, 2022, 00:14:38 UTC, SZA= 67.26 degrees, VZA=13.84 degrees). The results for the snow specific surface area, the effective grain diameter, BBA, TOC and PWV are shown in Figure 2 and Figure 3.
The histograms of retrieved parameters closely follow Gaussian distributions f x = A e 1 2     x µ σ 2   where A = 1 2 π σ , σ is the standard deviation, μ is mean shown in Table 3, where we present average values for the retrieved parameters for the scene studied. The coefficient of variance (CV; average/STDV) is rather small for all retrieved parameters on the scale of the EnMAP scene (30 km × 30 km) at the location studied (see Table 3).
The variation of surface parameters shown in Figure 2 is rather small and can be expected due to variability of local snow cover characteristics (existence and abundance of sastrugi, their orientation, etc.). The derived spatial distribution of total ozone and water vapor column derived on the scale 30m and shown in Figure 3 can be partially attributed to the uncertainties of the algorithm and violation of assumptions on the underlying surface properties. Therefore, additional validation of data shown in Figure 3 is needed. It is common for satellite optical instrumentation to deliver total ozone data on the scale of several kilometres and even tens of kilometres, which corresponds just one number as reported in Table 3 (194   ±   14   DU). The retrievals as shown in Figure 3 are of additional value at the boarders of ozone holes and also in the cases, where sharp variations of gaseous emissions at the surface (plumes) are present.
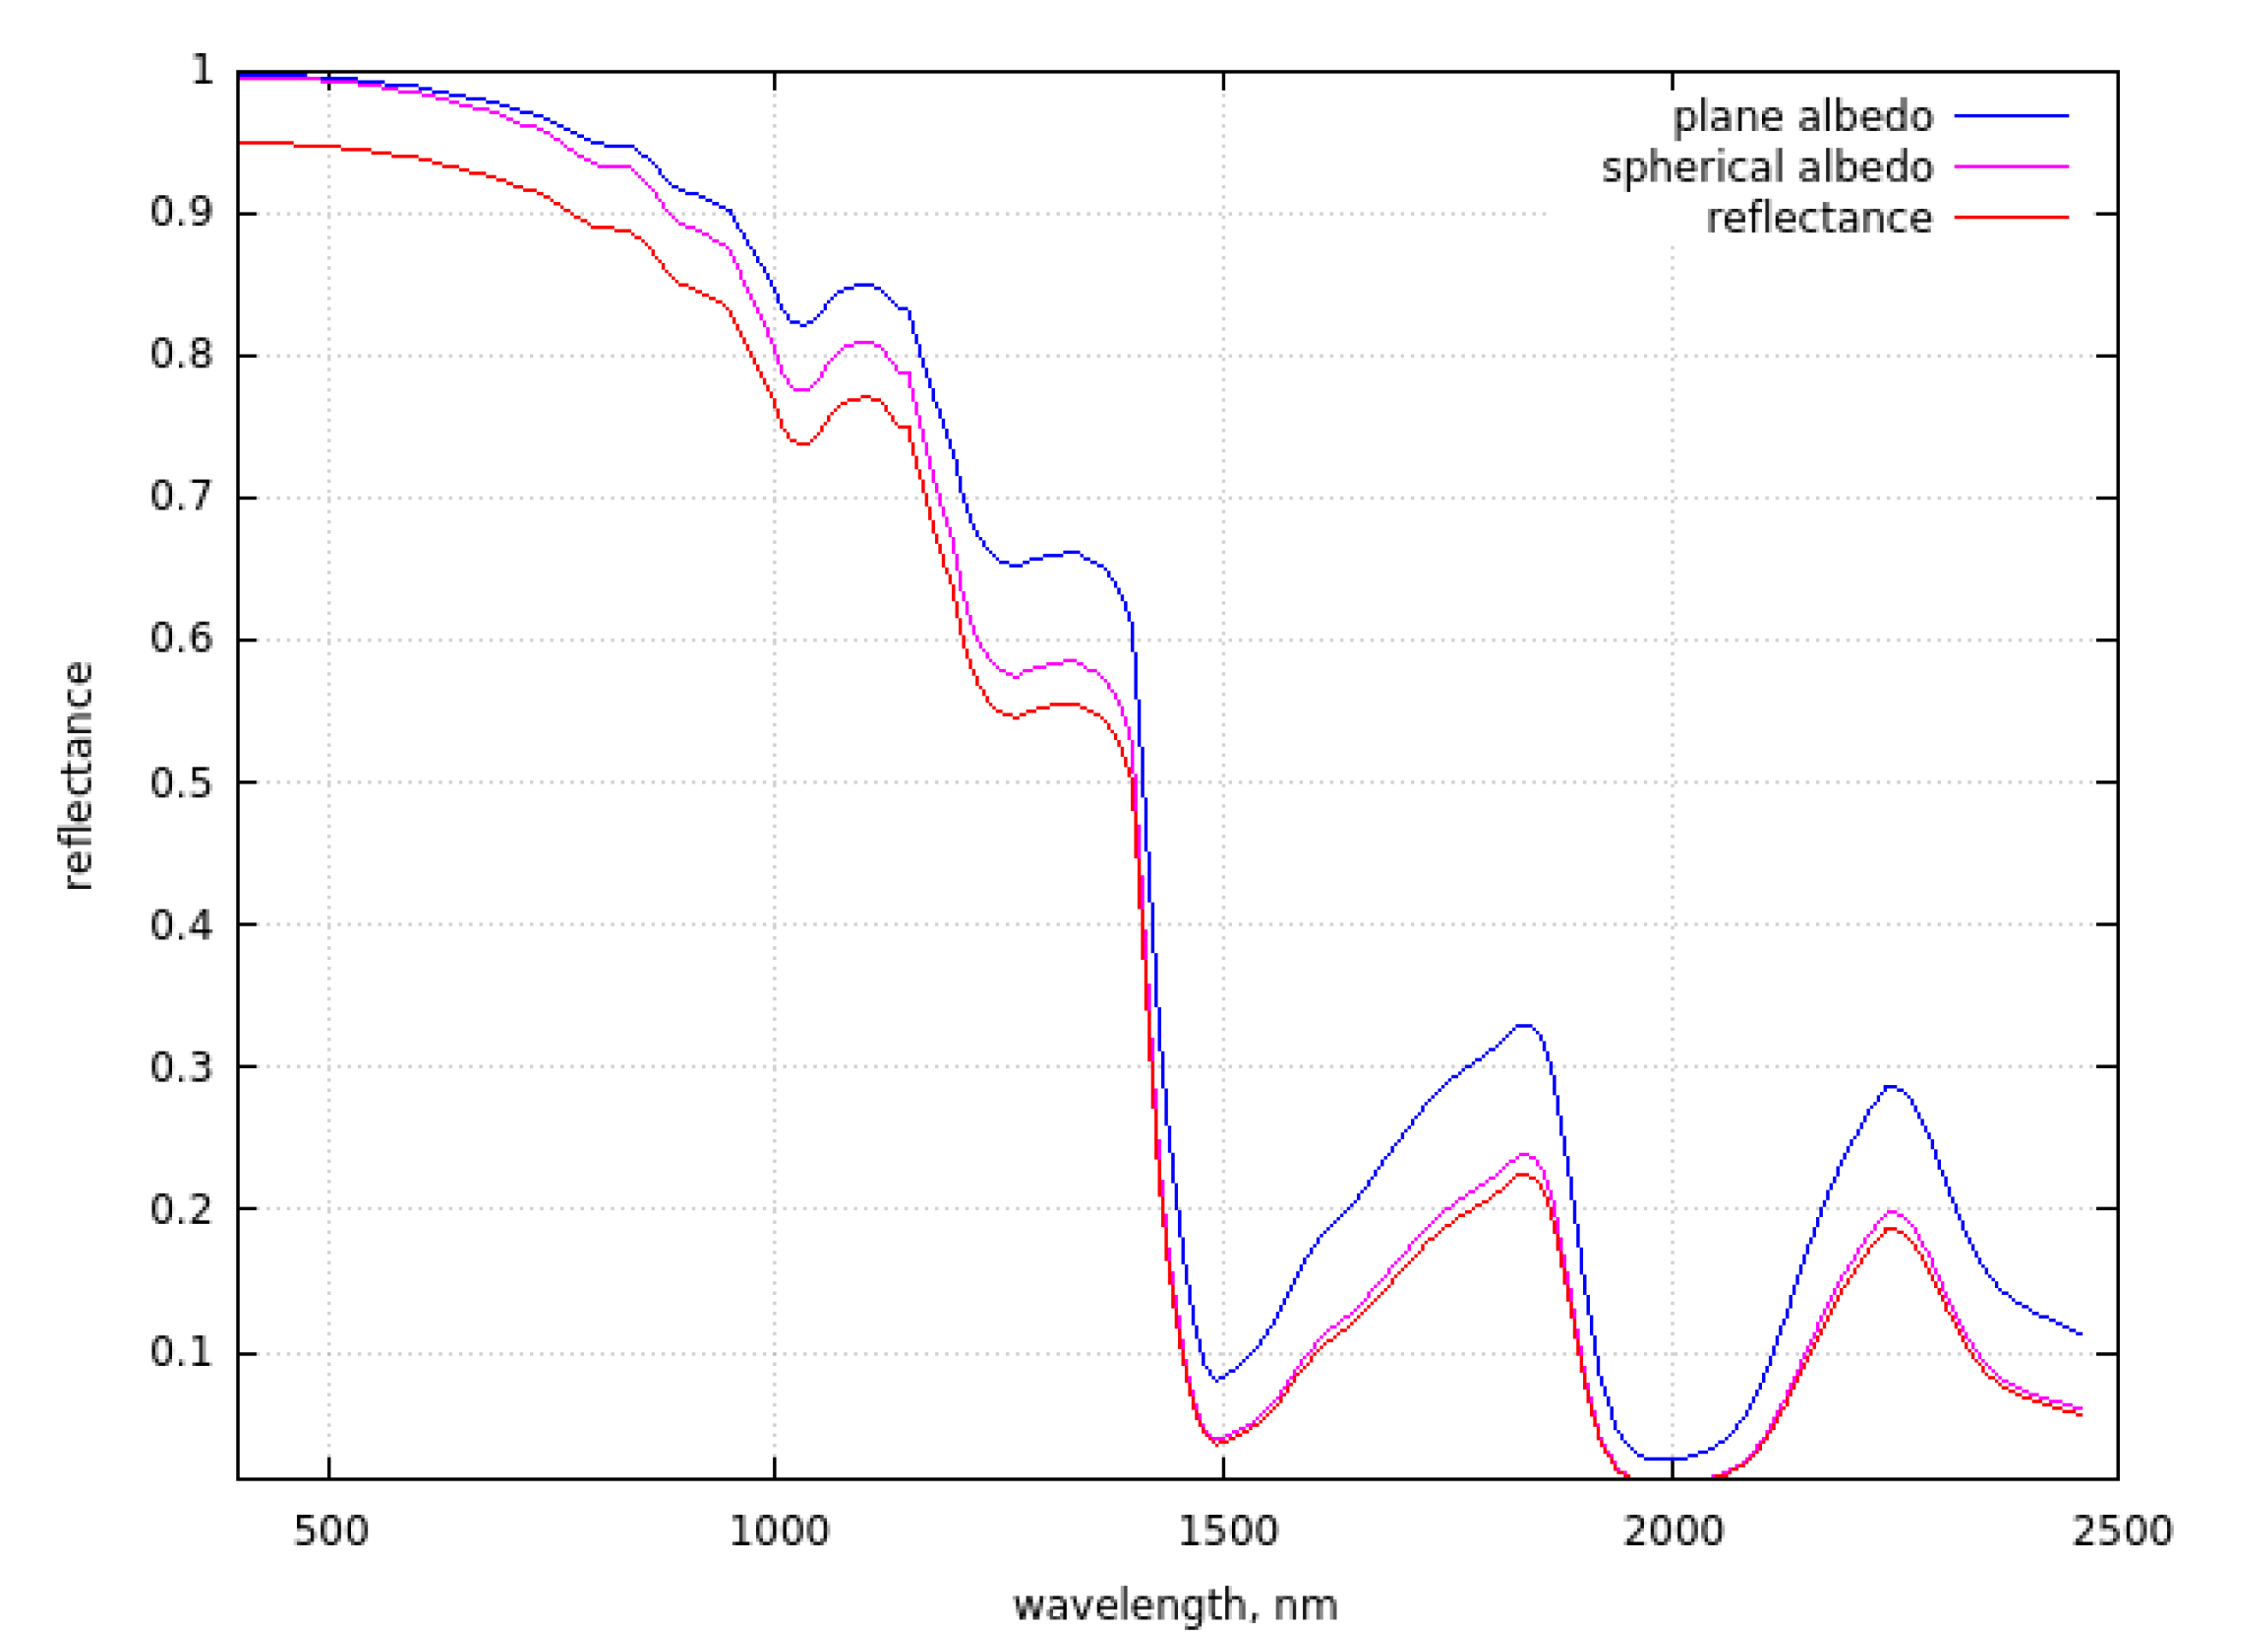
We also derived spectral plane/spherical albedo and snow reflection function using the algorithm described above. Data for a randomly chosen pixel is presented in Figure 4. One can see that the plane and spherical albedos behave in expected way approaching 1.0 in the visible and having several oscillations in the SWIR due to the corresponding bulk ice absorption bands. The results at the wavelengths above 1300 nm are less accurate due to the decreased accuracy of the weak absorption approximation [25] as discussed before.
Figure 2. The retrieved effective grain diameter, the specific surface area, and broadband albedor spatial distributions. The axes give distance in km.
Preprints 71847 g002aPreprints 71847 g002b
Figure 3. The retrieved total ozone and precipitable water vapor. The axes give distance in km.
Preprints 71847 g003aPreprints 71847 g003b
Figure 4. The retrieved BOA nadir reflectance, plane albedo and spherical albedo.
Preprints 71847 g004

5. The Comparison with Ground Measurements

We have performed the comparison of data shown in Table 3 with ground measurements performed at Concordia station in Antarctica on October 29, 2022. The ground and satellite measurements were not precisely aligned in space and time. However, as it follows from Table 3, the variation of various parameters at the Dome C plateau is quite low and average parameters presented in Table 3 well represent the underlying snow—atmosphere system. The list of instruments used for validation is given in Table 4.
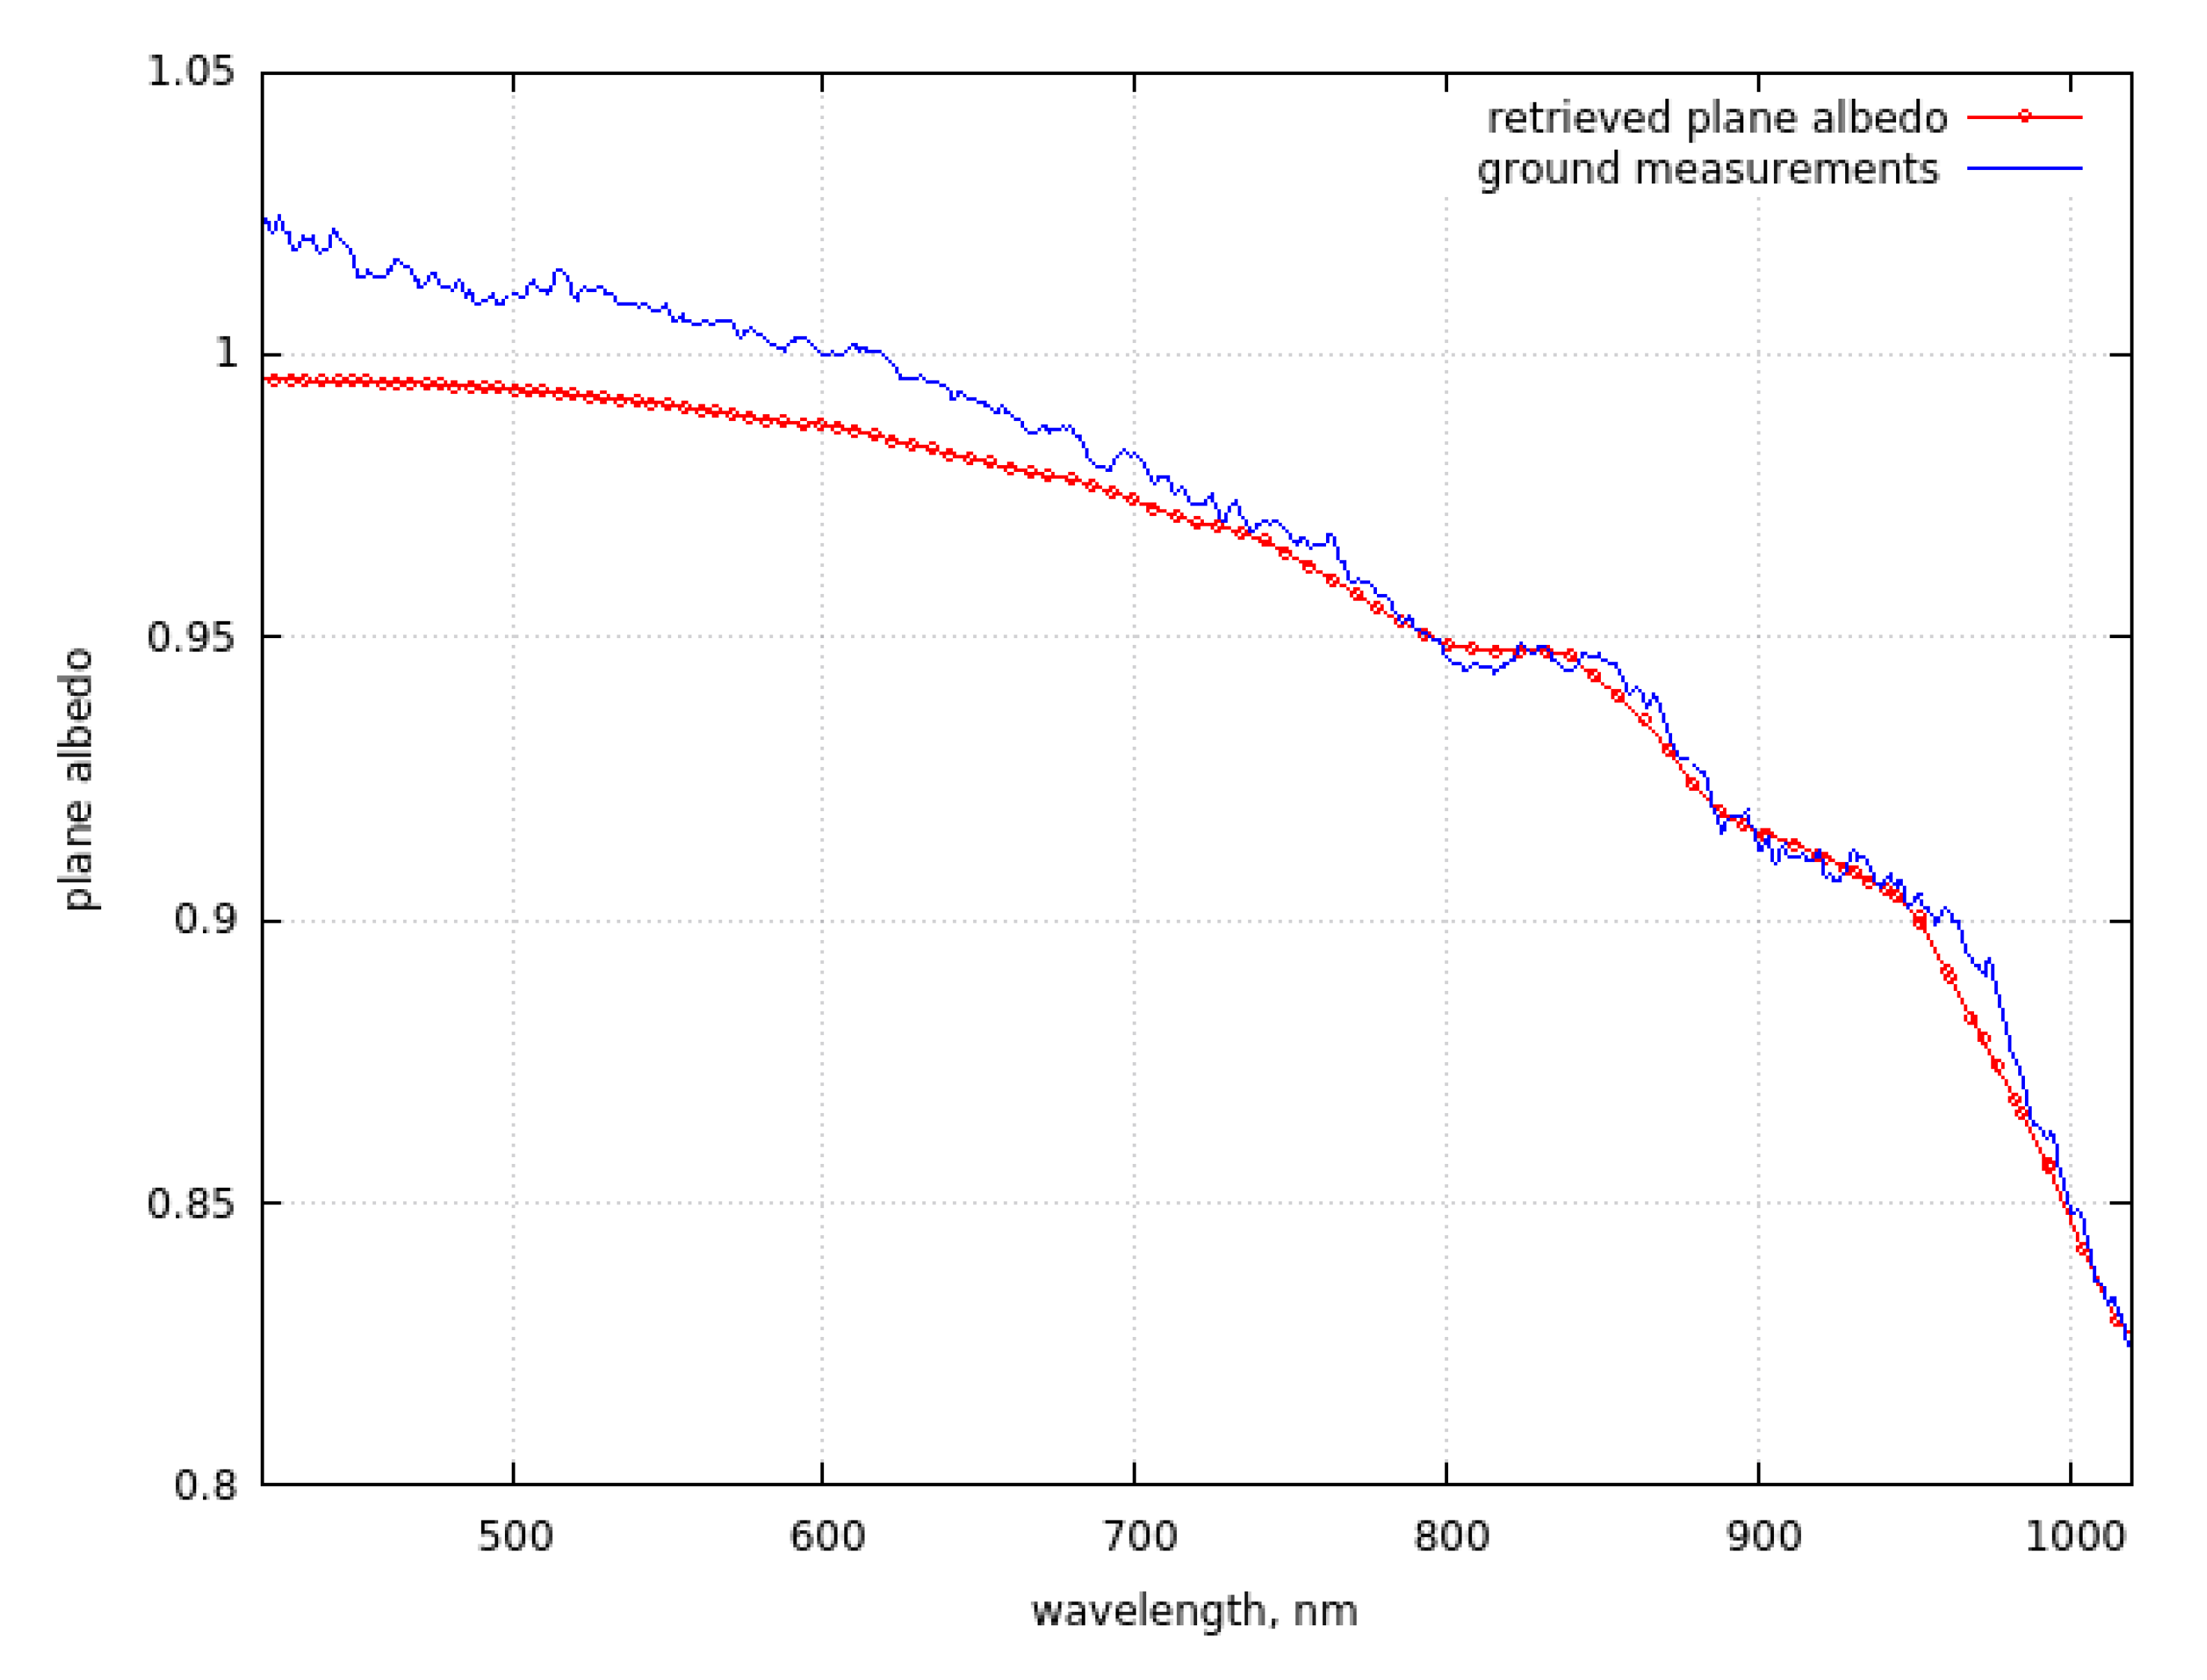
The spectral plane albedo (PA) was measured at Dome C using the Autosolexs instrument (Picard et al., 2016b), an automated visible—near infrared (VNIR) spectrometer that has been acquiring surface albedo measurement every 12 min between October and March, since 2012. Autosolexs is composed of two measurement heads located approximately 1.5 m above the surface, each containing two upward and downward facing cosine receptors. At such a height, the downward facing collectors were estimated to receive most of the reflected signal (75%) from the surface from an area of approximately 3.5 m in radius. The receptors are connected to an Ocean Optics Maya2000 Pro spectrometer with fiber optics passing through an optical switch. Autosolexs measures the downward and upward (reflected) solar radiation. Using the calibration and processing steps described in [27], the spectral albedo was calculated as the ratio of the upwelling to downwelling spectral irradiances, providing usable data across the 400–1050 nm range. Owing to the negligible amount of diffuse illumination, the bi-hemispherical reflectance measured by the instrument (here called albedo) was directly compared to the directional–hemispherical reflectance (plane albedo) retrieved from EnMAP images. The spectral albedo measured at ground by head 1 on October 29, 2022, 03:00 UTC+0 (63 degrees solar zenith angle) is given in Figure 5. Measurements of head 2 are strongly affected by a steep surface just under the sensor during the period, and were discarded. The slope under head 1 is much less, but nevertheless due to the low Sun in this season, this slope is sufficient to disturb our measured albedo in the visible range with an unexpected trend and values above 1. These artefacts are documented in [48].
The EnMAP measurements were recorded at a solar zenith angle of 67 degrees and the retrieved plane albedo at Dome C is also shown in the same figure. The selected acquisition of the ground measurements is 3h later, when the Sun was at the highest in the sky in order to minimize the slope effect. EnMAP is less affected by such effects due to the larger footprint (30 m). The coincidence of the satellite and ground-based albedo in the spectral range of 700–1050 nm is excellent. The slight difference in the visible is mostly related to the problems with ground measurements. The small differences in the NIR (say, around 975 nm) could be due to the errors related to the spectral ice refractive index database.
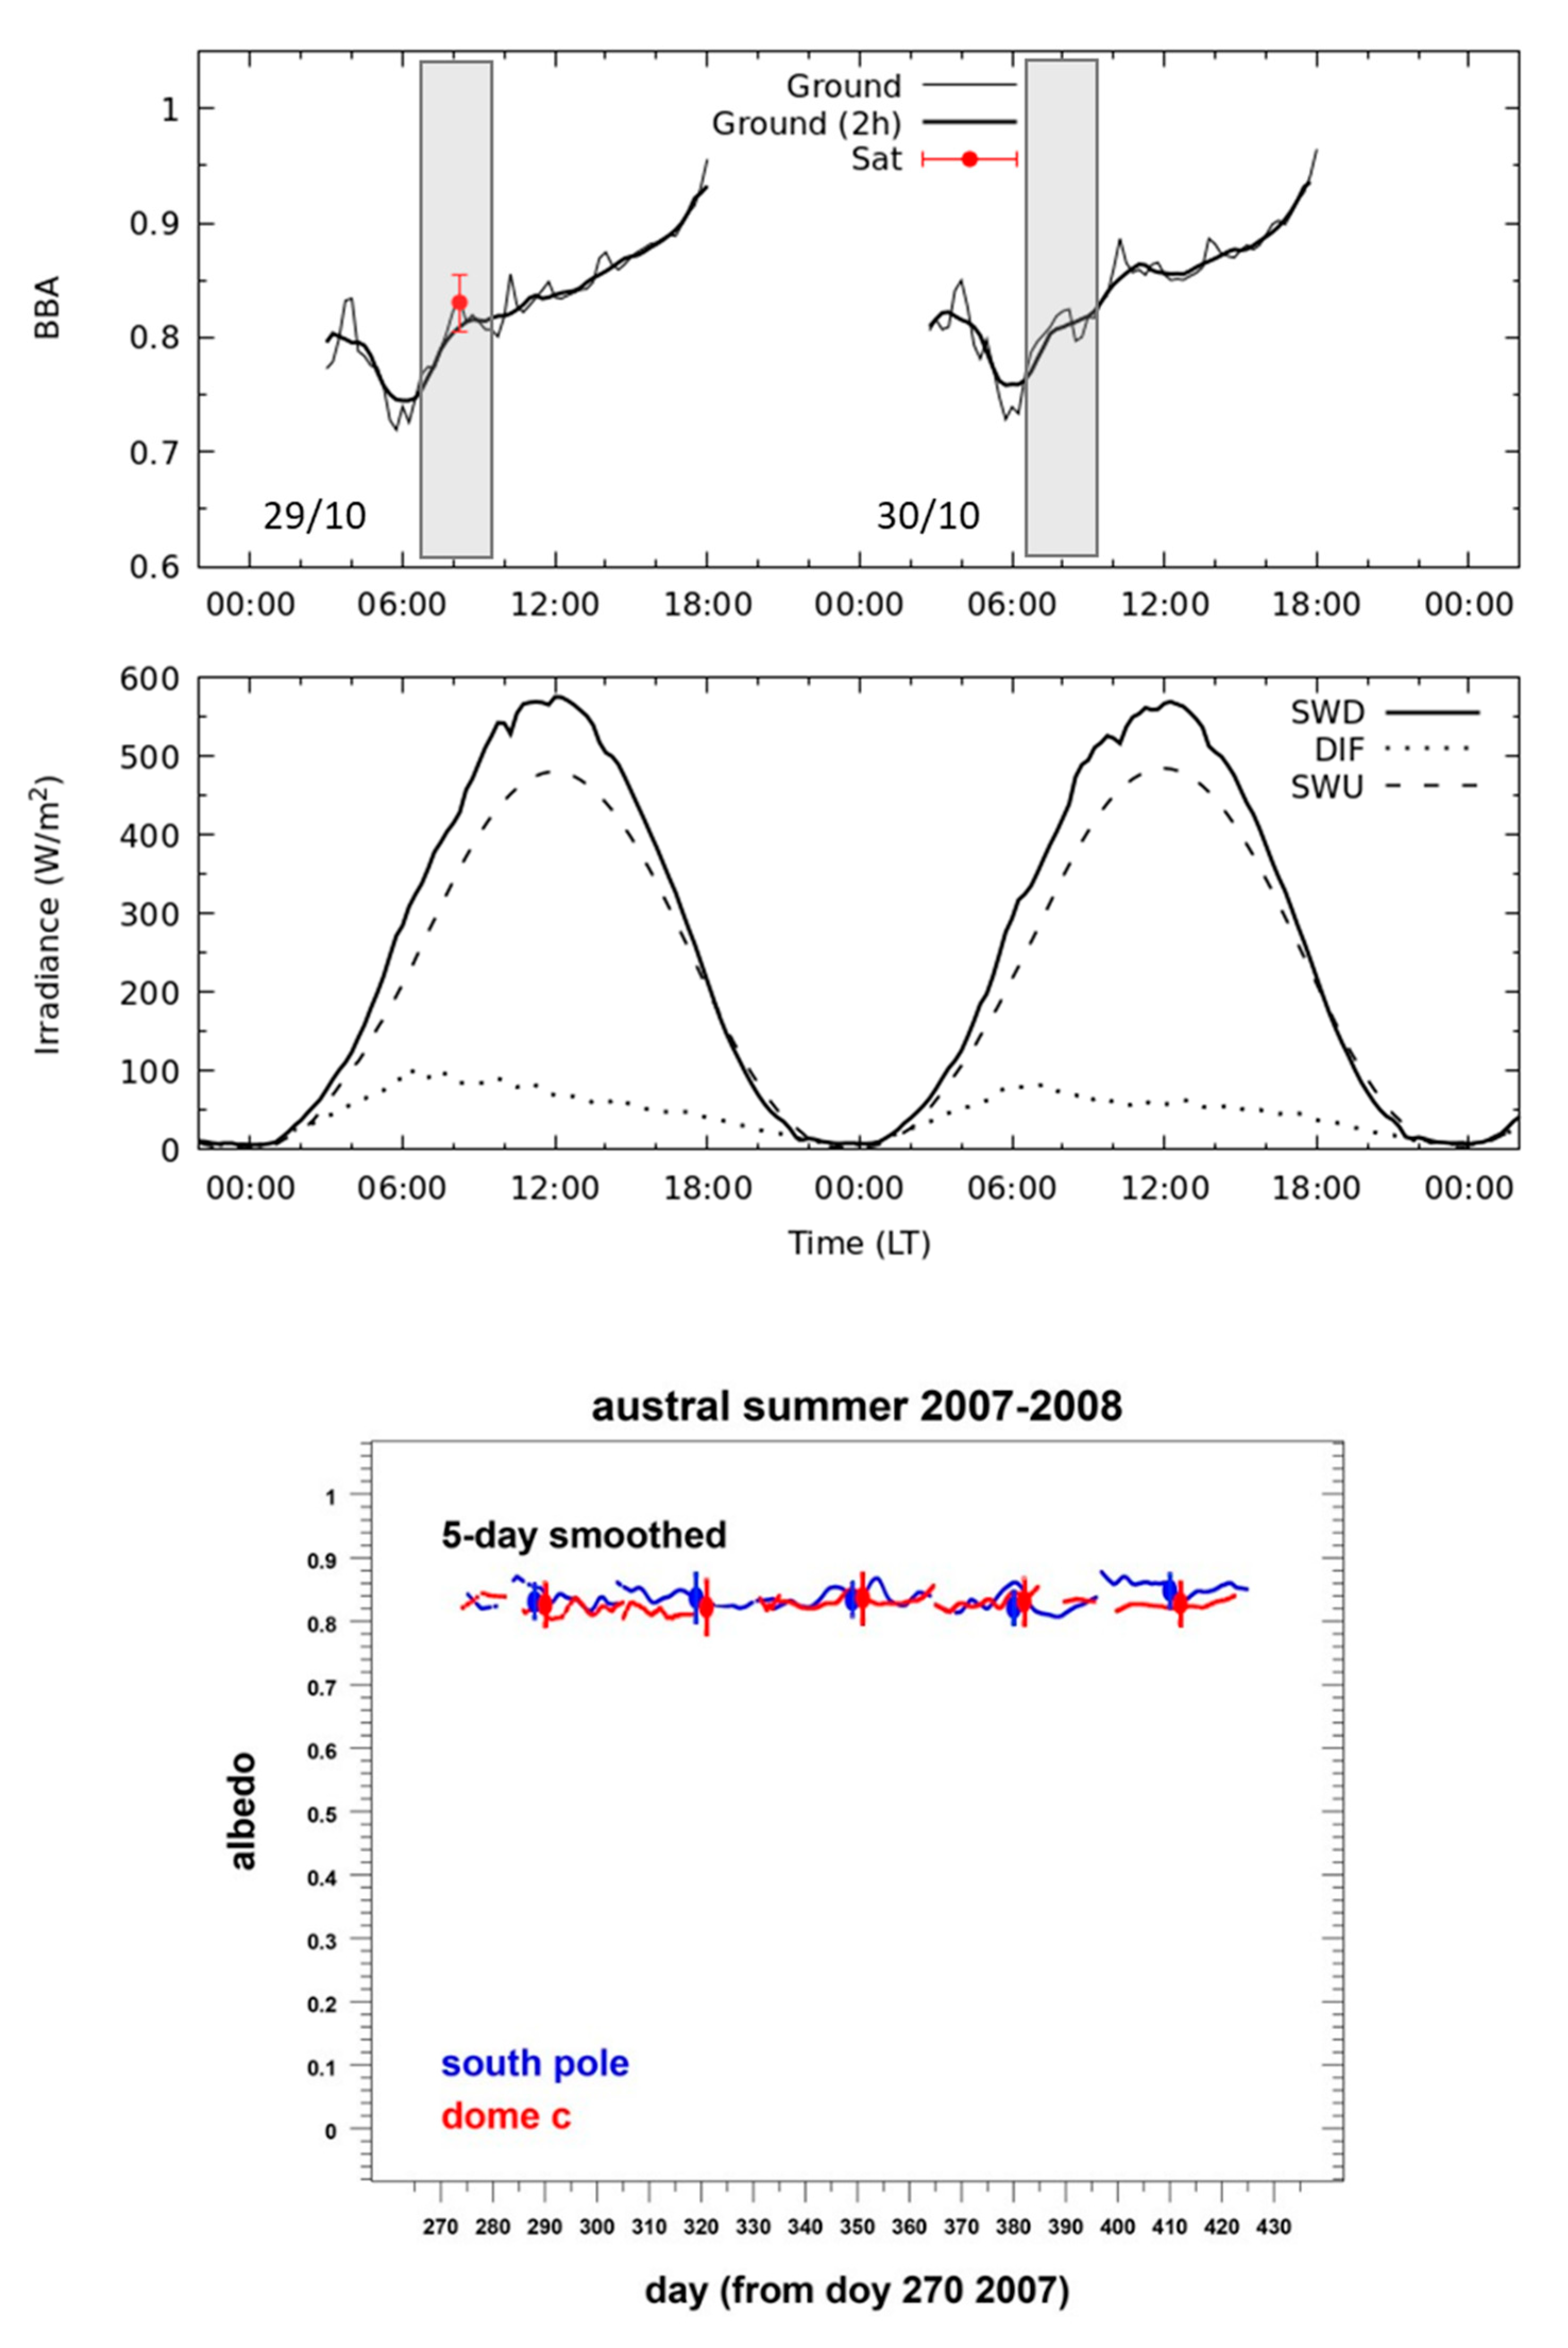
The broadband albedo (BBA) derived by us is around 0.83, which is consistent with ground observations of BBA at Concordia station on October 29, 2022 (see Figure 6a). The slight overestimation of the EnMAP-derived BBA could be due imperfect temporal and spatial collocation and also difficulties related to the BBA automatic ground measurements. The albedometer works in the automatic regime, therefore, the measurements could be affected by sunglint, 3-D effects (e.g., sastrugi), and diamond dust. Our results are consistent with other ground and also OLCI/S-3 observations [15,49,54,55,56,57]. In particular, Lanconelli et al. [49] report that the austral summer albedo 2007/2008 measured at the ground at Dome C and also at the South Pole are essentially equal (see Figure 6b), having a value of 0.83   ±   0.03 , which is similar to our finding (see Table 3). It should be mentioned that austral summer albedo is quite robust and does not vary considerably from year to year. Because BBA is determined by the effective grain diameter for clean snow, this indirectly confirms the derived EGD using EnMAP SWIR measurements.
We also derived the NIR and visible plane BBA (0.69 and 0.99). These values are close to the earlier reported values (0.66 and 0.96) but at another location and time period in Antarctica [58].
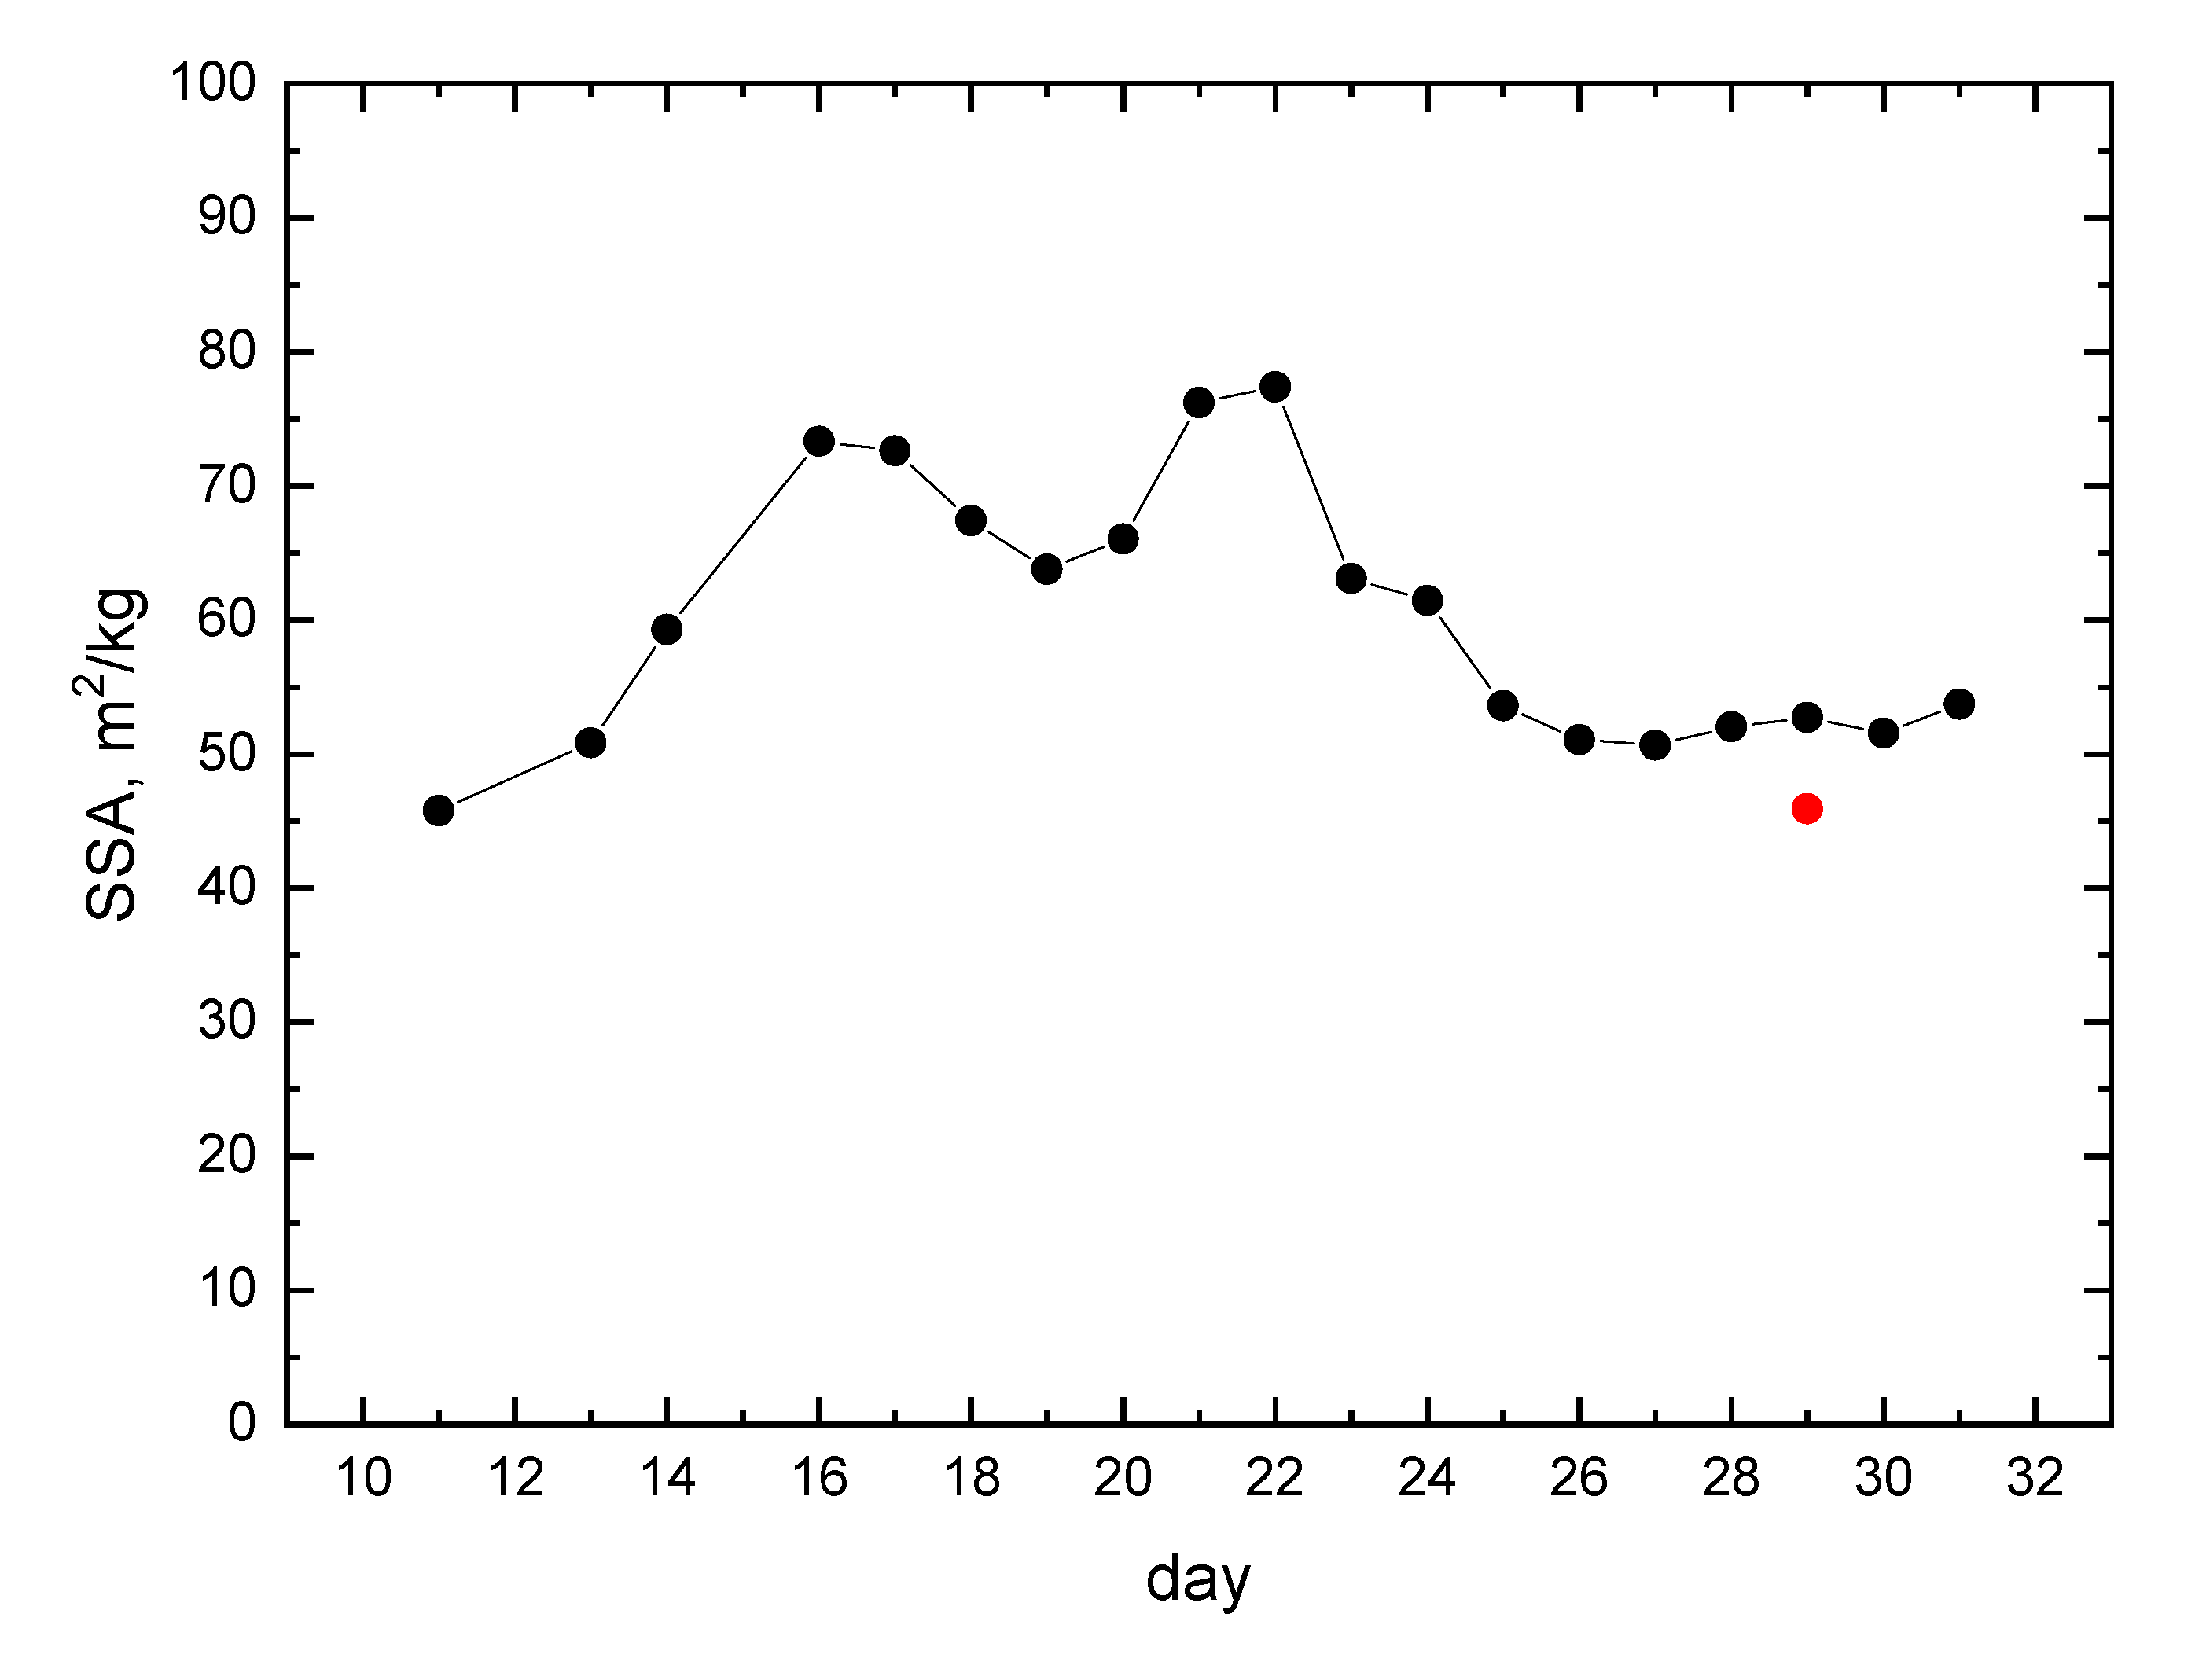
The snow specific area (SSA) derived from the ground spectral albedo measurements reported above (see Figure 5) was 52.7   m 2 / k g [59], which is consistent with EnMAP satellite observations at Dome C on the same day (46 m 2 / k g , see Figure 7). The difference between satellite and ground observations of SSA could be due different assumptions on the snow grain shape used in the retrieval process and also due to temporal and spatial mismatch of satellite and ground observations. It should be pointed out that the 13% difference between ground and satellite observations is close to the error of the ground measurements themselves [60]. The validation of the technique for the determination of SSA at other sites has been performed using OLCI/S-3 data [6,7].
The effective ice grain diameter (EGD) retrieved by us was 0.14 mm. Therefore, the respective effective radius r = d/2 retrieved by us is 0.07 mm, which is consistent with the ground observations at Dome C and also at other places in Antarctica [38,61]. In particular, Gay et al. [61] have measured the value of the grain radius in the range 0.05-0.18 mm at the top layer of the snow at Dome C. The derived value of the grain size is closer to the lower border of this interval although one should account the differences in the definition of the effective grain size (see Equation (8)) derived from EnMAP observations and the grain size measured on the ground using digital image processing, where the mean radius of all the convex parts of the ice/air boundaries or the mean convex radius is measured. Only for spherical particles, both sizes coincide. Grenfell et al. (1994) has measured the values of the snow grain radius in the range 0.05–0.15 mm at the Vostok station in Antarctica. These measurements are consistent with those performed at Dome C and confirm small spatial variations of the grain size in central Antarctica [61].
(52.7   m 2 / k g for the ground measurements) as given by the red crossed circle.
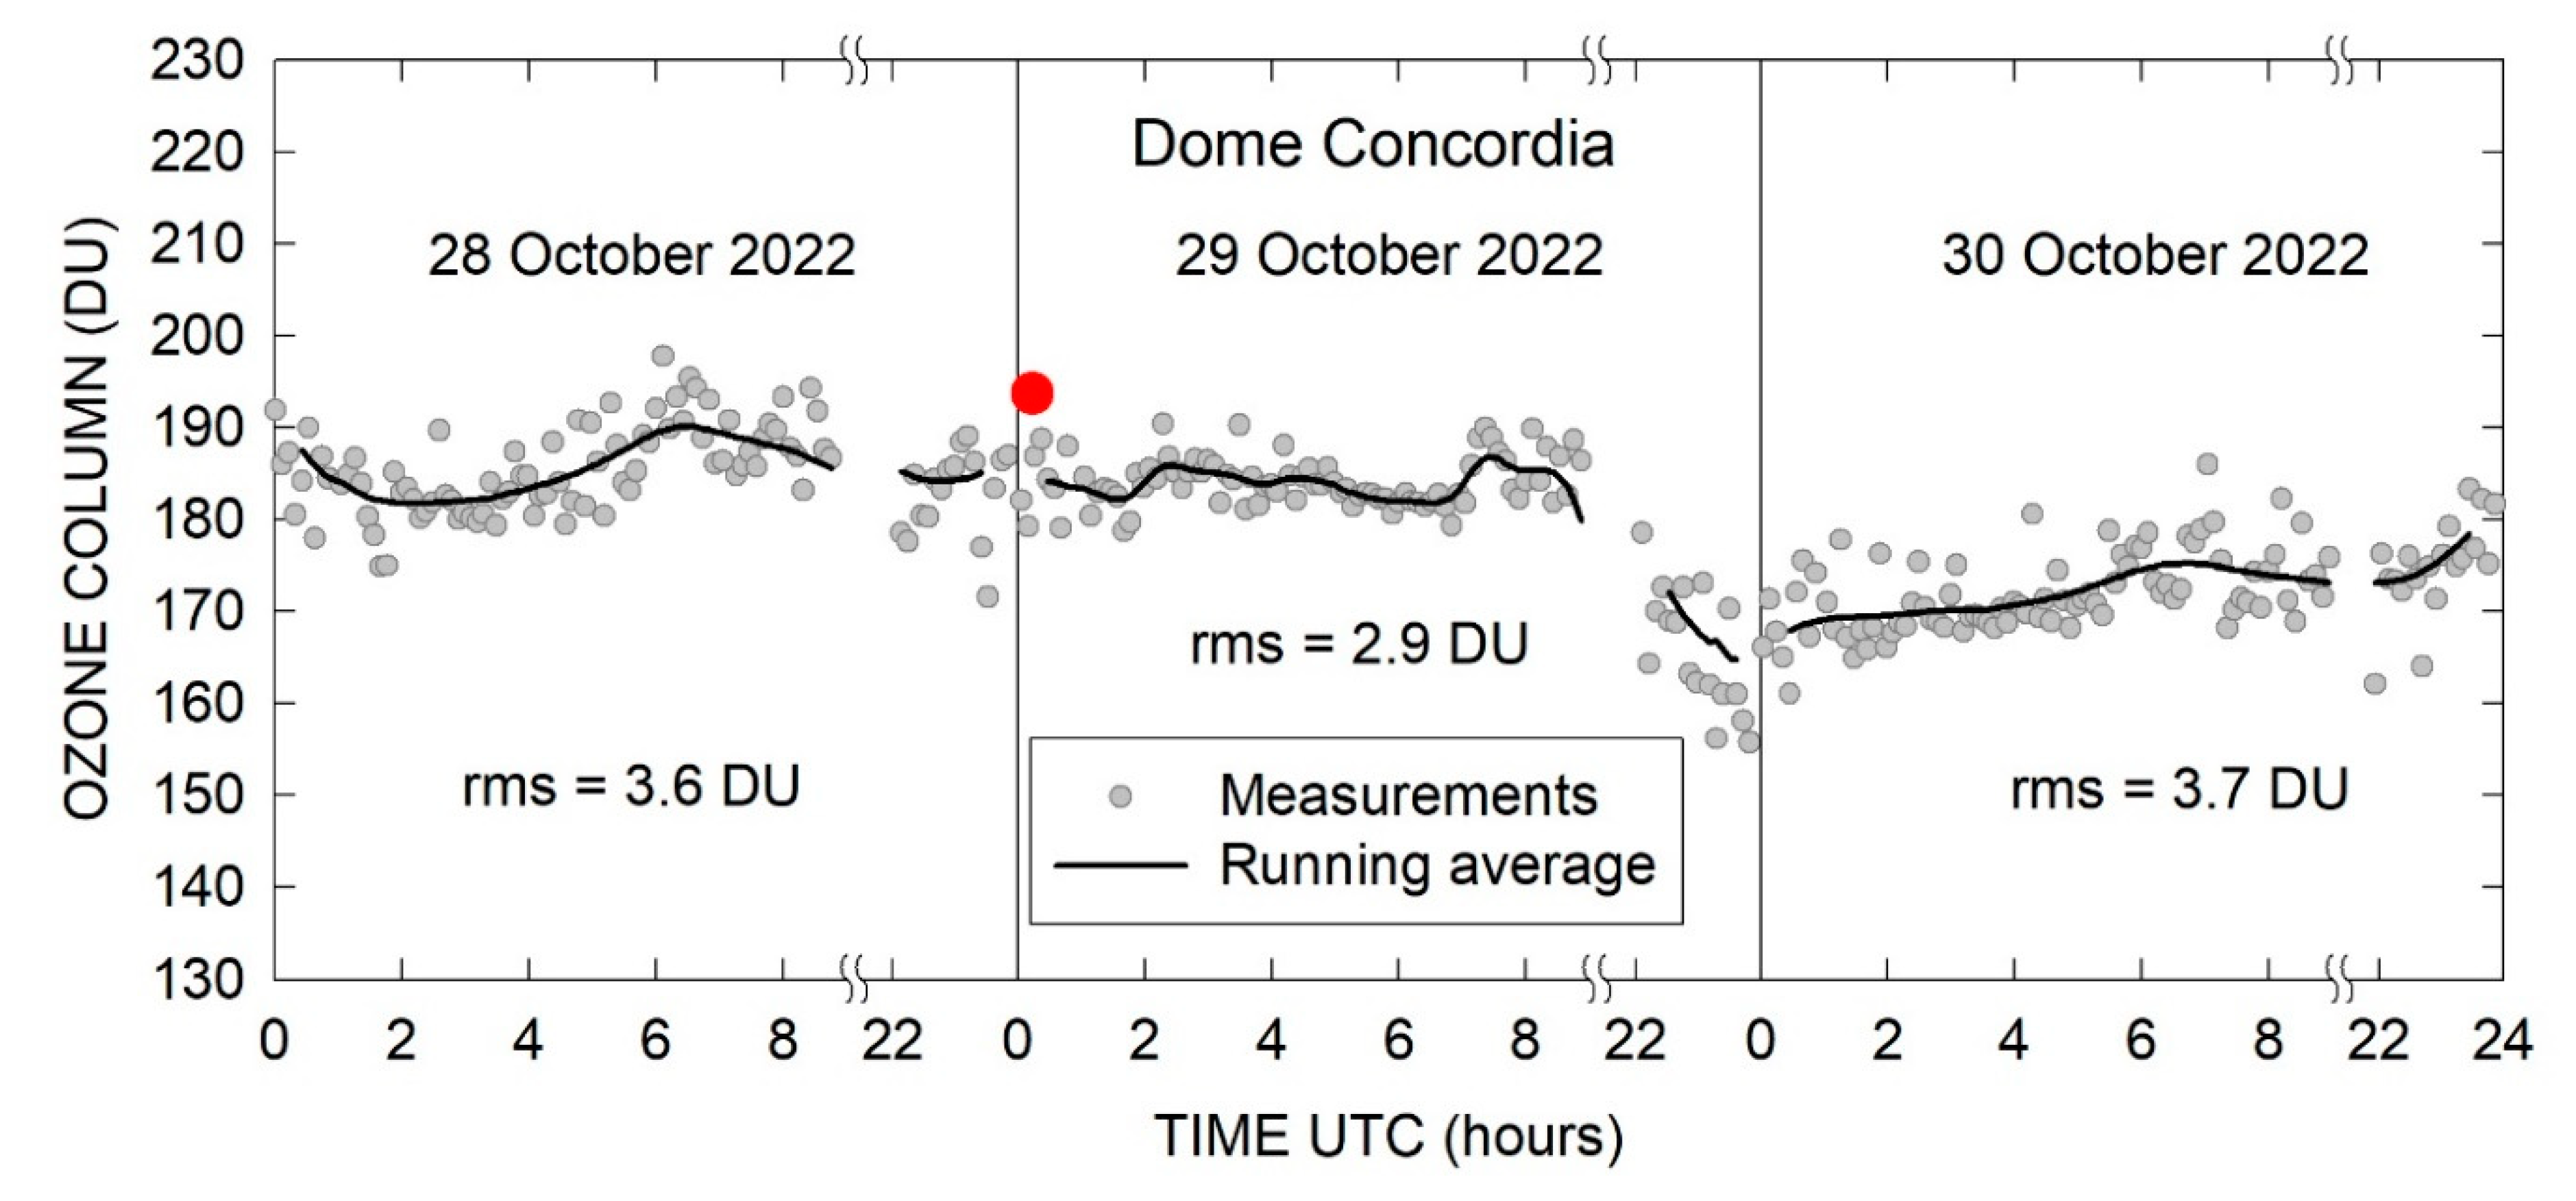
The total ozone column (TOC) has been measured on the ground as well. The ultraviolet radiometer UV-RAD was used for this purpose. The instrument is designed to monitor solar UV radiance and ozone column in the polar regions [63]. The instrument measures UV irradiance at 7 channels equipped with narrow-band interference filters with a width at half maximum of about 1 nm. In addition, two optical passbands elements attenuate the wings of the filters and the 7 channels are centered at 300, 306, 310, 314, 325, 338, and 364 nm. The filters are mounted on a rotating wheel which is contained inside an isolated and thermostated box together with the photomultiplier used as a sensor. The estimation of ozone column from the UV-RAD measurements is performed by using the Stamnes method developed for the case of global irradiance measurements[64]. This approach compares the ratio of irradiances measured at two wavelengths with the corresponding ratio calculated for different solar zenith angles and ozone columns using radiative transfer modelling. One of the wavelengths is chosen to be among the spectral band of stronger ozone absorption while the other has to be negligibly absorbed. For the operating at Concordia, 314 and 338 nm were selected as the first and second wavelengths and the lookup table with the model estimations of the corresponding irradiance ratios was composed using Tropospheric Ultraviolet-Visible (TUV) computer code [65]. The scanning of all UV-RAD channels takes usually 100–120 s depending on the weather conditions and the radiometer performs such a scanning with 5 min intervals. The irradiance at 338 nm is additionally measured after the 310 nm channel to reduce the time between wavelengths selected for the ozone calculation. The ozone column is determined from the measurements carried out for SZAs below 75° and the values obtained within the day are smoothed by an averaging procedure. The root mean square (rms) of deviations from the smoothed curve is considered as an estimate of the measurement error during the day. In clear sky conditions such an error was found to be between 2 and 5 DU, while in the presence of broken clouds it can increase up to 10 DU. The last comparison of UV-RAD with a similar radiometer was performed in summer 2019 and the stability of the instrument is continuously controlled by comparing the measured and computed by TUV model irradiances. Figure 8 illustrates the temporal ozone evolution for October 28, 29, and 30, 2022. The EnMAP-retrieved TOC (193.7 DU) is shown by a red point, which is close to the ground measurements. The average values of TOC derived from ground measurements were 187 DU for October 28 and 183 DU for October 29 (respectively, 3.5 and 5.8% difference from the EnMAP derived value). A comprehensive validation of the satellite TOC estimations using OLCI/S-3 over snow in the Chappuis absorption band has been done in [45]. It has been found that the average bias of total ozone OLCI retrievals is below 3%. We expect the same accuracy for the EnMAP 30 m measurements and plan to validate our EnMAP TOC retrieval technique using a larger dataset in our next publication.
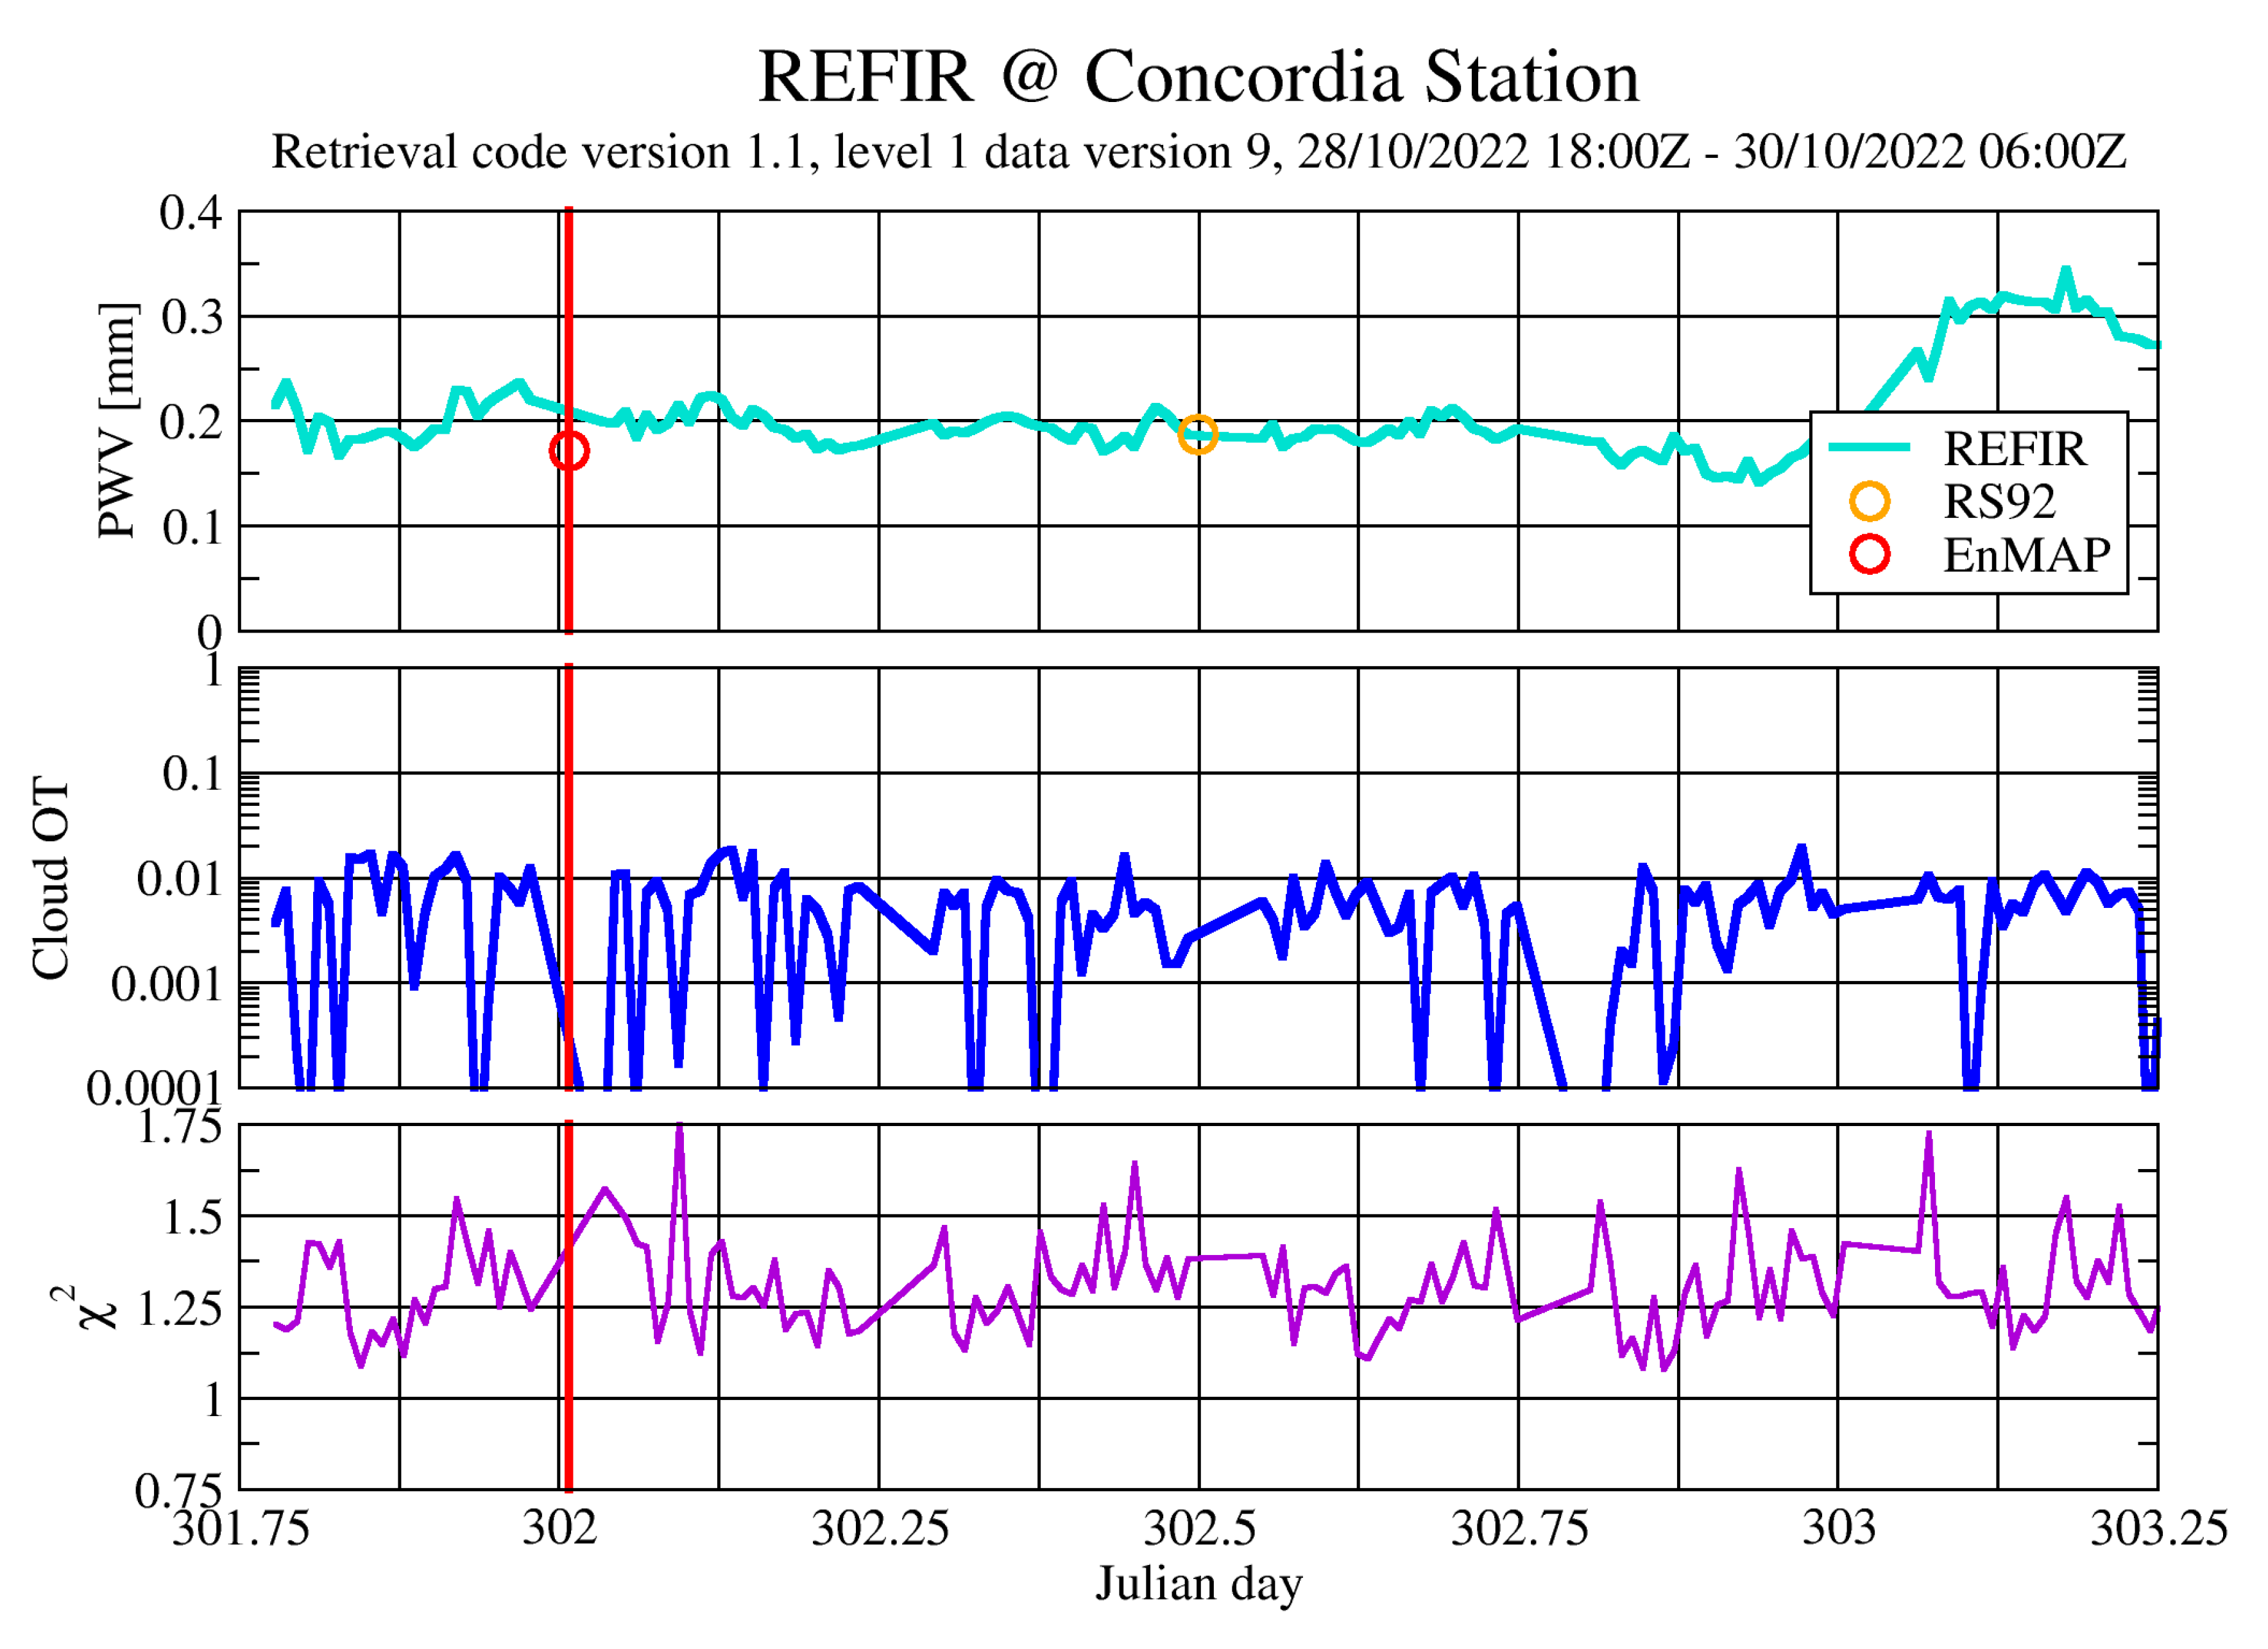
The total precipitable water vapor (PWV) in the Dome C region, East Antarctic Plateau, is obtained through the analysis of infrared atmospheric radiance spectra measured by the REFIR-PAD instrument. The results of measurements are given in Figure 9. REFIR-PAD (Radiation Explorer in the Far-Infrared—Prototype for Applications And Development) (Bianchini et al., 2019) is a Fourier transform spectroradiometer designed to measure the emitted atmospheric radiance in the 100-1500 cm−1 (6.67–100 µm) spectral range with a spectral resolution up to 0.25 cm−1, and has been successfully deployed in the 2006–2011 period in several campaigns, both in ground based zenith-looking and in stratospheric balloon-borne nadir-looking configurations. In December, 2011 the REFIR-PAD instrument has been permanently installed at Concordia Station, Antarctica, where it performs a continuous monitoring of the downwelling infrared radiation with a nominal resolution of 0.4 cm−1 and a measurement repetition rate of about 12 min. To retrieve the vertical profiles of temperature and water vapor, the measured spectra are processed through an inversion code based on the LBLRTM atmospheric forward model described in [66]. The retrieval is performed on a 21-level logarithmically spaced vertical grid covering the range between ground and 23 km. The grid provides a layer thickness which increases with altitude, to compensate for the decrease of vertical resolution which is an inherent property of the retrieval in the zenith-looking observation geometry. The number of fitted levels was 4 for water vapor (3 m, 170 m, 1 km, 6 km) and 6 for temperature (ground, 3 m, 30 m, 170 m, 1 km, 6 km). The PWV values corresponding to the retrieved vertical profiles are provided as a direct output by the LBLRTM forward model, the uncertainty on the PWV is estimated through the fitting errors provided by the MINUIT routine, and is about 5%. The PWV retrieval process has been successfully validated through comparison with a microwave radiometer, a Raman lidar and radiosondes [52]. It follows that the retrieved PWV is 0.20 mm for the case studied in this work (0.03 mm or 15% difference to the value derived by us (0.17 mm at 00:14UTC, October 29, 2022).
These results are very encouraging and point out to the fact that reliable algorithms for the determination of the TOC and PWV derived from EnMAP data can be developed in the future.
) are given. The red vertical line corresponds to the time of satellite measurements. The red point corresponds to the EnMAP measurements and the radiosonde measurements are represented by the yellow point. It follows from the middle plot that there were no clouds during measurements.

6. Conclusions

In this work we have performed for the first time retrievals of the atmosphere—underlying snow surface system parameters using the EnMAP observations over Antarctica. The retrieval of snow grain size is based on measurements at two EnMAP SWIR channels (1026 nm and 1235 nm) for which the influence of atmospheric parameters on the TOA reflectance can be neglected. This makes it possible to determine the spectral bottom of atmosphere snow reflectance and also snow specific surface area and broadband albedo in the framework of the weak absorption approximation of the radiative transfer theory [25,31] under the assumption that snow is a semi-infinite layer, which contains no impurities and is homogeneous in vertical and horizontal directions. The manual cloud screening procedure has been used. Clearly, the deviations of the derived BOA reflectance and EnMAP TOA reflectance in the SWIR are mostly due to atmospheric trace gases. This assumption made it possible to estimate the total precipitable water vapour (PWV) from EnMAP TOA reflectance at the wavelength 1128.5nm over snow. The total ozone column (TOC) has been derived using the EnMAP measurements at the wavelength 600 nm following the procedure described in [45] for OLCI/S-3. We did not perform the estimation of aerosol characteristics from EnMAP measurements because BOA and TOA reflectances in the visible outside ozone absorption band are very close (see Figure 1) and the differences originate mostly due to molecular light scattering pointing to the fact that aerosol optical thickness in the visible is very low (0.02 or even lower at 550nm). The preliminary validation of the derived results has been performed with independent ground measurements and satisfactory close correspondence has been found between derived and retrieved parameters. The detailed validation of the proposed retrieval algorithm will be presented in a future work.
Overall, it has been shown that EnMAP measurements can be used to assess the environmental conditions around Concordia station in Antarctica. Extremely low levels of water vapor and aerosol load are detected. The derived total ozone was equal to 194DU, which points out to the existence of the ozone hole over Concordia at the time of measurements. As it is well known [67], low levels of total ozone are harmful for the terrestrial biosphere. In addition, the parameters of snow cover such as the snow grain size and snow albedo have been derived from EnMAP measurements. It has been found that the diameter of ice grains is quite small (0.14mm), which is consistent with independent ground measurements [61]. The derived broadband snow albedo was equal to 0.83, which is also consistent with local and long–term ground measurements [49]. The retrieval technique is very fast and based on the analytical solution of the inverse problem described in the paper and elsewhere [15]. The technique can be applied to multiple current and future hyperspectral instrumentation positioned at bottom of atmosphere, top of atmosphere and also within terrestrial atmosphere.
The EnMAP measurements confirm that the environment around Concordia is very dry with low aerosol and total ozone (as known, the ozone hole occurred in October 2022 over Concordia) loads and very bright clean snow surface with small ice grains. Although these parameters are known with a high precision for the Concordia station due to efforts related to the maintenance of ground–based instrumentation, this is not the case for other places in Antarctica, where ground measurements are absent and EnMAP measurements can be used for the assessment of key environmental parameters as shown in this paper. A similar spaceborne instrumentation can be also used for survey of atmosphere and underlying surface of other planets.

Author Contributions

Conceptualization, A.K., M.B., K.S., S.C.; methodology, A.K., M.B; software, A.K., K.S.; validation, A.K., M.B., G. B., C. L., A. L., B.P., G. P., L. A., and R.S.; formal analysis, A.K.; investigation, A.K., M. B.; resources, K.S., S.C.; data curation, A.K., M.B.; writing—original draft preparation, A.K.; writing—review and editing, all co-authors visualization, A.K.; supervision, K.S., S.C.; project administration, K.S., S.C.; funding acquisition, K.S., S.C. All authors have read and agreed to the published version of the manuscript.

Funding

The research was funded by the EnMAP science program under the Space Agency at DLR with resources from the German Federal Ministry of Economic Affairs and Climate Action (grant number 50EE1923).

Acknowledgments

The authors are grateful to the Antarctic Meteo–Climatological Observatory (AMCO) for providing data used in this work (https://www.climantartide.it/) and also to DLR for providing EnMAP data. The spectral albedo ground measurements have been acquired by the NIVO program supported the French Polar Institute (IPEV).

Conflicts of Interest

The authors declare no conflict of interest. The funders had no role in the design of the study; in the collection, analyses, or interpretation of data; in the writing of the manuscript; or in the decision to publish the results.

References

  1. Rees, G.W. Remote Sensing of Snow and Ice; CRC Press: 2005.
  2. Tedesco, M., Ed. Remote Sensing of the Cryosphere; Wiley Blackwell: 2015.
  3. Kokhanovsky, A.A. Snow Optics; Springer Nature: Cham, Switzerland, 2021. [Google Scholar]
  4. Guanter, L.; Kaufmann, H.; Segl, K.; et al. The EnMAP spaceborne imaging spectroscopy mission for Earth Observation. Remote Sensing 2015, 7, 8830–8857. [Google Scholar] [CrossRef]
  5. Kokhanovsky, A.; Lamare, M.; Di Mauro, B.; et al. On the reflectance spectroscopy of snow. The Cryosphere 2018, 12, 2371–2382. [Google Scholar] [CrossRef]
  6. Kokhanovsky, A.A.; Lamare, M.; Danne, O.; et al. Retrieval of snow properties from the Sentinel-3 Ocean and Land Colour Instrument. Remote Sens. 2019, 11, 2280. [Google Scholar] [CrossRef]
  7. Kokhanovsky, A.; Box, J.E.; Vandecrux, B.; Mankoff, K.D.; Lamare, M.; Smirnov, A.; Kern, M. The determination of snow albedo from satellite measurements using fast atmospheric correction technique. Remote Sens. 2020, 12, 234. [Google Scholar] [CrossRef]
  8. Kokhanovsky, A.; Vandecrux, B.; Wehrlé, A.; Danne, O.; Brockmann, C.; Box, J.E. An improved retrieval of snow and ice properties using spaceborne OLCI/S-3 spectral reflectance measurements: updated atmospheric correction and snow impurity load estimation. Remote Sensing. 2023, 15, 77. [Google Scholar] [CrossRef]
  9. Dozier, J. Snow reflectance from Lansat 4 Thematic Mapper. IEEE Trans. Geosci. Remote Sens. 1984, 17, 1213–1221. [Google Scholar]
  10. Boudelles, B.; Fily, M. Snow grain—size determination from Landsat imagery over Terre Adelie, Antarctica. Annals Glaciology 1993, 17, 86–92. [Google Scholar] [CrossRef]
  11. Nolin, A.W.; Dozier, J. Estimating snow grain size using AVIRIS data. Remote Sensing Environ. 1993, 44, 231–238. [Google Scholar] [CrossRef]
  12. Green, R.O.; Dozier, J.; Roberts, D.; Painter, T. Spectral snow-reflectance models for grain size and liquid water fraction in melting snow for the solar-reflected spectrum. Annals of Glaciology 2002, 34, 71–73. [Google Scholar] [CrossRef]
  13. Zege, E.P.; Katsev, I.L.; Malinka, A.V.; Prikhach, A.S.; Heygster, G.; Wiebe, H. Algorithm for retrieval of the effective snow grain size and pollution amount from satellite measurements. Rem. Sens. Env. 2011, 115, 2674–2685. [Google Scholar] [CrossRef]
  14. Bohn, N.; Painter, T.; Thompson, D.R.; et al. Optimal estimation of snow and ice surface parameters from imaging spectroscopy measurements. Rem. Sens. 2021, 264, 112613. [Google Scholar] [CrossRef]
  15. Kokhanovsky, A.; Vandecrux, B.; Wehrlé, A.; Danne, O.; Brockmann, C.; Box, J.E. An improved retrieval of snow and ice properties using spaceborne OLCI/S-3 spectral reflectance measurements: updated atmospheric correction and snow impurity load estimation. Remote Sensing 2023, 15, 77. [Google Scholar] [CrossRef]
  16. Vandecrux, B.; Box, J.E.; Wehrlé, A.; Kokhanovsky, A.A.; Picard, G.; Niwano, M.; Hörhold, M.; Faber, A.-K.; Steen-Larsen, H.C. The determination of the snow optical grain diameter and snowmelt area on the Greenland Ice Sheet using spaceborne optical observations. Remote Sens. 2022, 14, 932. [Google Scholar] [CrossRef]
  17. Arioli, S.; Picard, G.; Arnaud, L.; Favier, V. Dynamics of the snow grain size in a windy coastal area of Antarctica from continuous in-situ spectral albedo measurements. The Cryosphere Discuss in press.. 2022. [Google Scholar] [CrossRef]
  18. Vandecrux, B.; Kokhanovsky, A.; Picard, G.; Box, J. pySICE: A python package for the retrieval of snow surface properties from Sentinel 3 OLCI reflectances (v2.1). Zenodo 2022. [CrossRef]
  19. Platt, U.; Stutz, J. Differential optical absorption spectroscopy: principles and applications; Springer: Weinheim, 2008; 597p. [Google Scholar]
  20. Tomasi, C.; Petkov, B.; Benedetti, E.; Valenziano, L.; Vitale, V. Analysis of a 4 year radiosonde data set at Dome C for characterizing temperature and moisture conditions of the Antarctic atmosphere. J. Geophys. Res. 2011, 116, D15304. [Google Scholar] [CrossRef]
  21. Ricaud, P.; Griogioni, P.; Zbuinden, R. Review of tropospheric temperature, absolute humidity and integrated water vapour from the HAMSTRAD radiometer installed at Dome C, Antartctica, 2009-2014. Antarctic Science 2015, 6, 598–616. [Google Scholar] [CrossRef]
  22. Negusini, M.; Petkov, B.H.; Tornatore, V.; Barindelli, S.; Martelli, L.; Sarti, P.; Tomasi, C. Water vapour assessment using GNSS and radiosondes over polar regions and estimation of climatological trends from long-term time series analysis. Remote Sens. 2021, 13, 4871. [Google Scholar] [CrossRef]
  23. Bachmann, M.; Alonso, K.; Carmona, E.; et al. The CEOS CARD4L Conform EnMAP L2A 'Land' Product. In Proceedings of the 12th EARSeL Workshop on Imaging Spectroscopy, Potsdam, Germany; 2022. [Google Scholar]
  24. Fontenla, J.N.; Harder, J.; Livingston, W.; Snow, M.; Woods, T. High-resolution solar spectral irradiance from extreme ultraviolet to far infrared. Journal of Geophysical Research: Atmospheres 2011, Bd. 116, Nr. D20. [CrossRef]
  25. Zege, E.P.; Ivanov, A.P.; Katsev, I.L. Image Transfer through Light Scattering Media; Springer: Berlin, Germany, 1991. [Google Scholar]
  26. Warren, S.G.; Brandt, R.E. Optical constants of ice from the ultraviolet to the microwave: A revised compilation. J. Geophys. Res. Atmos. 2008, 113, D14220. [Google Scholar] [CrossRef]
  27. Picard, G.; Libois, Q.; Arnaud, L. Refinement of the ice absorption spectrum in the visible using radiance profile measurements in Antarctic snow. The Cryosphere 2016, 10, 2655–2672. [Google Scholar] [CrossRef]
  28. Qu, Y.; Liang, S.; Liu, Q.; He, T.; Liu, S.; Li, X. Mapping surface broadband albedo from satellite observations: A review of literatures on algorithms and products. Remote Sens. 2015, 7, 990–1020. [Google Scholar] [CrossRef]
  29. He, C.; Takano, Y.; Liou, K.-N.; Yang, P.; Li, Q.; Chen, F. Impact of snow grain shape and black carbon-snow internal mixing on snow optical properties: Parameterizations for climate models. Journal of Climate 2017, 30, 10,019– 10,036. [CrossRef]
  30. Kokhanovsky, A.A. Scaling constant and its determination from simultaneous measurements of light reflection and methane adsorption by snow samples. Opt. Lett. 2006, 31, 3282–3284. [Google Scholar] [CrossRef] [PubMed]
  31. Kokhanovsky, A.A.; Iodice, F.; Lelli, L.; et al. Retrieval of total ozone column using high spatial resolution top-of-atmosphere measurements by OLCI/S-3 in the ozone Chappuis absorption band over bright underlying surfaces. Journal of Quantitative Spectroscopy and Radiative Transfer 2021, 276, 107903. [Google Scholar] [CrossRef]
  32. Libois, Q.; Picard, G.; Dumont, M.; Arnaud, L.; Sergent, C.; Pougatch, E.; Sudul, M.; Vial, D. Experimental determination of the absorption enhancement parameter of snow. J. Glaciol. 2014, 60, 714–724. [Google Scholar] [CrossRef]
  33. Carlsen, T.; Birnbaum, G.; Ehrlich, A.; et al. Comparison of different methods to retrieve optical-equivalent snow grain size in central Antarctica. The Cryosphere 2017, 11, 2727–2741. [Google Scholar] [CrossRef]
  34. Kerbrat, M.; Pinzer, B.; Huthwelker, T.; Gäggeler, H.W.; Ammann, M.; Schneebeli, M. Measuring the specific surface area of snow with X-ray tomography and gas adsorption: comparison and implications for surface smoothness. Atmos. Chem. Phys. 2008, 8, 1261–1275. [Google Scholar] [CrossRef]
  35. Cauchy, A. Memeoire sur la rectification des courbes et la quadrature des surfaces, 1832.
  36. Kokhanovsky, A.A. Broadband albedo of snow. Front. Environ. Sci. Inform. Remote Sens. 2021, 9, 757575. [Google Scholar] [CrossRef]
  37. Six, D.; Fily, M.; Blarel, L.; Goloub, P. First aerosol optical thickness measurements at Dome C (East Antarctica), summer season 2003–2004. Atmos. Environ. 2005, 39, 5041–5050. [Google Scholar] [CrossRef]
  38. Grenfell, T.C.; Warren, S.G.; Mullen, P.C. Reflection of solar radiation by the Antarctic snow surface at ultraviolet, visible, and near-infrared wavelengths. J. Geophys. Res. Earth Surf. 1994, 99, 18669–18684. [Google Scholar] [CrossRef]
  39. Gallet, J.-C.; Domine, F.; Zender, C.; Picard, G. Measurement of the specific surface area of snow using infrared reflectance in an integrating sphere at 1310 and 1550 nm, The Cryosphere 2009, 3, 167–182. [CrossRef]
  40. Carmagnola, C.M.; Domine, F.; Dumont, M.; et al. Snow spectral albedo at Summit, Greenland: measurements and numerical simulations based on physical and chemical properties of the snowpack, The Cryosphere 2013, 7, 1139–1160, 2013. [CrossRef]
  41. Green, A.E.; Wagner, J.C.; Mann, A. Analytic spectral functions for atmospheric transmittance calculations. Appl Opt. 1988, 27, 2266–227. [Google Scholar] [CrossRef]
  42. Pierluissi, J.H.; Maragoudakis, C.E.; Tehrani-Mohaved, F. New LOWTRAN band model for water vapor, Appl. Optics 1989, 18, 3792–3795. [Google Scholar]
  43. Cachorro, V.E.; Antuña-Sanchez, J.C.; de Frutos, A.M. SSolar-GOA v1.0: A simple, fast, and accurate Spectral solar radiative transfer for clear skies. Geosci. Model Dev. 2022, 15, 1689–1712.
  44. Walden, V. P.; W. L. Roth; R. S. Stone; B. Halter. Radiometric validation of the Atmospheric Infrared Sounder over the Antarctic Plateu, J. Geophys. Res. 2006, 111, D09S03.
  45. Kokhanovsky, A.A.; Iodice, F.; Lelli, L.; et al. Retrieval of total ozone column using high spatial resolution top-of-atmosphere measurements by OLCI/S-3 in the ozone Chappuis absorption band over bright underlying surfaces, Journal of Quantitative Spectroscopy and Radiative Transfer 2021, 276,107903. [CrossRef]
  46. Kokhanovsky, A.A.; Lamare, M.; Rozanov, V. Retrieval of the total ozone over Antarctica using Sentinel-3 ocean and land colour instrument, J. Quant. Spectrosc. Radiat. Transf. 2020, 251, 107045. [Google Scholar] [CrossRef]
  47. Serdyuchenko, A.; Gorshelev, V.; Weber, M.; Chehade, W.; Burrows, J.P. High spectral resolution ozone absorption cross-sections—Part 2: Temperature dependence, Atmos. Meas. Tech. 2014, 7, 625–636. [Google Scholar] [CrossRef]
  48. Picard, G.; Dumont, M.; Lamare, M.; Tuzet, F.; Larue, F.; Pirazzini, R.; Arnaud, L. Spectral albedo measurements over snow-covered tilted terrain: theory and slope effect corrections. The Cryosphere 2020, 14, 1497–1517. [Google Scholar] [CrossRef]
  49. Lanconelli, C.; et al. 2014: https://www.isac.cnr.it/~radiclim/bsrn2014/userfiles/downloads/TALKS/Lanconelli_TueA.pdf.
  50. Tomasi, C.; Petkov, B.H. Spectral calculations of Rayleigh-scattering optical depth at Arctic and Antarctic sites using a two-term algorithm, J. Geophys. Res. Atmos. 2015, 120, 9514–9538. [Google Scholar] [CrossRef]
  51. Fiorucci, L.; Muscari, G.; Bianchi, C.; et al. Measurements of low amounts of precipitable water vapor by mm-wave spectroscopy: an intercomparison with radiosonde, Raman Lidar and FTIR data, Journal of Geophysical Research 2008, 113, D14314. [CrossRef]
  52. Bianchini, G.; Palchetti, L.; Muscari, G.; et al. Water vapor sounding with the far infrared Refir-Pad spectroradiometer from a high-altitude ground-based station during the Ecowar campaign. Journal of Geophysical Research 2011, 116, D02310. [Google Scholar] [CrossRef]
  53. Bianchini, G.; Castagnoli, F.; Di Natale, G.; Palchetti, L. A Fourier transform spectroradiometer for ground-based remote sensing of the atmospheric downwelling long-wave radiance. Atmospheric Measurement Techniques 2019, 12, 619–635. [Google Scholar] [CrossRef]
  54. Broeke, M.V.D.; Reijmer, C.; Van De Wal, R. Surface radiation balance in Antarctica as measured with automatic weather stations. J. Geophys. Res. Atmos. 2004, 109. [Google Scholar]
  55. Pirazzini, R. Surface albedo measurements over Antarctic sites in summer. J. Geophys. Res. Earth Surf. 2004, 109. [Google Scholar] [CrossRef]
  56. Kuipers Munneke, P.; Reijmer, C.H.; van den Broeke, M.R.; König-Langlo, G.; Stammes, P.; Knap, W.H. Analysis of clear-sky Antarctic snow albedo using observations and radiative transfer modeling. J. Geophys. Res. Earth Surf. 2008. [Google Scholar] [CrossRef]
  57. Kuipers Munnike, P. Snow, Ice and Solar Radiation. Ph.D. Thesis, Institute for Marine and Atmospheric Research, Utrecht, Holland, The Netherlands, 2009. [Google Scholar]
  58. Yamanouchi, T. Variations of incident solar flux and snow albedo on the solar zenith angle and cloud cover, at Mizuno Station, Antarctica. J. Meteorol. Soc. Japan 1983, 61, 879–893. [Google Scholar] [CrossRef]
  59. Picard, G.; Libois, Q.; Arnaud, L.; Vérin, G.; Dumont, M. Development and calibration of an automatic spectral albedometer to estimate near-surface snow SSA time series. The Cryosphere 2016, 10, 1297–1316. [Google Scholar] [CrossRef]
  60. Gallet, J.C.; Domine, F.; Arnaud, L.; Picard, G.; Savarino, J. Vertical profiles of the specific surface area of the snow at Dome C, Antarctica. The Cryosphere 2011, 4, 631–649. [Google Scholar] [CrossRef]
  61. Gay, M.; Fily, M.; Genthon, C.; Frezzotti, M.; Oerter, H.; Winther, J.-G. Snow grain size measurements in Antarctica. J. Glaciol. 2002, 48, 527–535. [Google Scholar] [CrossRef]
  62. Picard, G.; Dumont, M.; Lamare, M.; Tuzet, F.; Larue, F.; Pirazzini, R.; Arnaud, L. Spectral albedo measurements over snow-covered tilted terrain: theory and slope effect corrections. The Cryosphere 2020, 14, 1497–1517. [Google Scholar] [CrossRef]
  63. Petkov, B.; Vitale, V.; Tomasi, C.; Bonafè, U.; Scaglione, S.; Flori, D.; Santaguida, R.; Gausa, M.; Hansen, G.; Colombo, T. Narrow-band filter radiometer for ground-based measurements of global UV solar irradiance and total ozone. Appl Opt 2006, 45, 4383–439. [Google Scholar] [CrossRef] [PubMed]
  64. Stamnes, K.; Slusser, J.; Bowen, M. Derivation of total ozone abundance and cloud effects from spectral irradiance measurements. Appl. Opt. 1991, 30, 4418–4426. [Google Scholar] [CrossRef] [PubMed]
  65. Madronich, S. UV radiation in the natural and perturbed atmosphere, in Environmental Effects of UV (Ultraviolet) Radiation; Tevini, M., Ed.; Lewis: Boca Raton, 1993; pp. 17–69. [Google Scholar]
  66. Clough, S.A.; Shephard, M.W.; Mlawer, E.J.; Delamere, J.S.; Iacono, M.J.; Cady-Pereira, K.; Boukabara, S.; Brown, P. D. Atmospheric radiative transfer modeling: a summary of the AER codes, Short communication. J. Quant. Spectrosc. Rad. Transfer 2005, 91, 233–244. [Google Scholar] [CrossRef]
  67. WMO: Scientific assessment of ozone depletion: Global Ozone Research and Monitoring Project, Report No. 58, 2018.
Figure 1. Retrieved BOA reflectance spectrum and TOA EnMAP reflectance spectrum near Concordia station on 2022-10-29 00:11:38 UTC. The circles give the positions of main channels used in the retrieval process.
Preprints 71847 g001
Figure 5. The plane spectral albedo measured on ground (line) and using EnMAP satellite data (red points) at Dome C on October 29, 2022.
Preprints 71847 g005
Figure 6. (a) The upper panel shows the broadband albedo measured at Concordia on 29 and 30 October 2022. The solid thick line is the run average over a temporal window of 2 h. The shadows highlight the local time close to the satellite overpass. EnMAP-based estimation described in this work is reported here for 29 October (0.14 UTC or 8.14 LT) in red with an estimated uncertainty of 2%. The lower panel shows the components of the SW radiation indicated as global (SWD), diffuse (DIF) and reflected. The solar zenith angle is in the range 62–68 degrees 8:00–15:00 LT. The solar zenith angle is in the range 68–78 degrees for time period 15:00–18:00LT. (b). The broadband albedo measured at Dome C (red lines) and South pole (blue lines) for the austral summer 2007–2008. The points correspond to the average values for the months October, November, December, January, and February [49].
Preprints 71847 g006
Figure 7. The ground—measured SSA at Dome C in October, 2022 (measured according to the technique proposed in [62]). The retrieved value of SSA on October 29 was 46 m 2 / k g
Preprints 71847 g007
Figure 8. Ground measurements of TOC (DU) at Concordia station performed every 5 min. The EnMAP measurements occurred at 00:14 UTC time (08:14 (local time)).
Preprints 71847 g008
Figure 9. Ground measurements of PWV (mm) at Concordia station around October 29, 2022 (Julian day: 302). Also the cloud optical thickness (OT) and goodness of fit ( χ 2
Preprints 71847 g009
Table 1. The EnMAP clean snow products [3,15,36]. The plane albedo is defined as an integral of the azimuthally averaged reflection function with respect to the viewing zenith angle. The spherical albedo is the integral of the plane albedo with respect to the solar zenith angle.
Satellite Snow Product Abbreviation Equation Comments
Effective absorption length EAL, mm L
Effective grain diameter EGD, mm d=L/κ κ=16
Specific surface area SSA,
m 2 / k g
σ = 6κ/ρL ρ=0.917 g c m 3 is the density of bulk ice
Broadband albedoPlane BBA: Spherical BBA: BBA
pBBA
sBBA
r = a + b e p L The values of a, b, p depend on the spectral ranges used to compute BBA (see Table 2)
Spherical albedo SA r s = e α L α is the bulk ice absorption coefficient
Plane albedo PA r p = e u μ 0 α L u μ 0
is givenby Eq. (4)
BOA reflectance BOAR R B O A = R 0 e f α L f is given by Equation (3)
Table 2. The parameters of the spherical broadband albedo (sBBA) parameterization for different spectral regions. The parameters for the plane broadband albedo (pBBA) parameterization are the same except p is substituted by u 2 μ 0 p   [ 36 ] .
BBA a b
p m m 1
spectral range: 0.3–0.7 μm 0 1 7.86 × 10 5
spectral range: 0.7–2.5 μm 0.2335 0.6600 3.27 × 10 2
spectral range: 0.3–2.5 μm 0.5721 0.3612 2.35 × 10 2
Table 3. The statistical characteristics of the retrieved parameters.
Parameter Average Value Standard Deviation CV [%]
Effective grain diameter, mm 0.1429 0.0078 5.5
pBBA (0.3–2.5 μm) 0.8291 0.0015 0.2
SSA, m 2 /kg 45.93 2.51 5.5
TOC, DU 193.67 13.98 7.2
PWV, mm 0.172 0.0058 3.4
Table 4. The ground optical instrumentations used for the validation of satellite products.
Instrument Target Spectral Range Reference
VNIR spectrometer Spectral albedo, specific surface area 0.4–1.1 μm [27]
Pyranometer Broadband albedo 0.35–2.5 μm [49]
UV radiometer Total ozone 0.300, 0.306, 0.310, 0.314, 0.325, 0.338 and 0.364 μm [50]
FTIR spectrometer Precipitable water vapor 7.1–100 μm [51,52,53]
Disclaimer/Publisher’s Note: The statements, opinions and data contained in all publications are solely those of the individual author(s) and contributor(s) and not of MDPI and/or the editor(s). MDPI and/or the editor(s) disclaim responsibility for any injury to people or property resulting from any ideas, methods, instructions or products referred to in the content.
Copyright: This open access article is published under a Creative Commons CC BY 4.0 license, which permit the free download, distribution, and reuse, provided that the author and preprint are cited in any reuse.
Prerpints.org logo

Preprints.org is a free preprint server supported by MDPI in Basel, Switzerland.

Subscribe

© 2024 MDPI (Basel, Switzerland) unless otherwise stated