Preprint
Article

Performance of Non-compliant Reinforced Concrete Frame Structures Under Seismic Loading

Altmetrics

Downloads

123

Views

66

Comments

0

Submitted:

26 April 2023

Posted:

26 April 2023

You are already at the latest version

Alerts
Abstract
Non-compliant (NC) structures are often encountered in building construction in developing countries. This is a condition whereby erected buildings do not follow regulatory standards, especially in the provision of reinforcements. Therefore, under an earthquake load, the structures do not have sufficient resistance against such load. The structural elements of the building, which often have NC conditions, are the beam-column joints because they do not contain adequate shear reinforcements due to installation difficulty. This study aims to determine the structural performance of the reinforced concrete (RC) frame, which has a reinforcement deficiency in the beam-column joints. Numerical simulation was conducted on the Kakaletsis structure model by modifying the reinforcement details at the joints to represent the NC conditions. The non-linear modeling and analysis of the structural model were carried out using ATENA software. The analysis showed that the reduction in shear reinforcements in the NC model joint caused a decrease in load-carrying capacity by about 26.04%. A shift was also observed in the collapse pattern, i.e., from the beam to the end of the column, causing global failure and reducing the undamaged but increasing more severely damaged condition. This showed that the NC structure, due to the non-conformance of reinforcement, significantly reduced the structure's performance.
Keywords: 
Subject: Engineering  -   Architecture, Building and Construction

1. Introduction

Every year, Indonesia experiences frequent earthquakes that often result in the collapse of many buildings. The typical buildings unable to withstand the earthquake loads are the Non-Compliance (NC) structures, resulting from poor construction quality and workmanship. NC behavior refers to structures that do not follow or conform to expert rules, regulations, and advice. One of the structural elements that are often categorized as NC is the beam-column joint. Due to non-standard hooks and the absence of shear reinforcement, the quality of the beam-column joint elements is compromised [1,2,3,4,5]. Moreover, the bad quality of concrete and its imperfect restraint by the stirrup in the beam-column joint reduces the concrete and reinforcement bonds significantly. These poor beam-column joint elements are often found in non-technical and technical work, making them NC elements leading to building collapse due to earthquake loads. This NC beam-column joint is very common in developing countries [6]. NC condition induces several damages, such as the splitting of concrete joints and the loosening of reinforcement in beam-column joints. The cause of these damages is due to the low structural capacity and large displacement, which further leads to the separation of the beam and column elements [7].
This study evaluates the effect of NC condition on the structural performance of the Reinforced Concrete (RC) frame. For this purpose, a numerical analysis was carried out on two structural models: the standard model from the experimental test by Kakaletsis (KK) [8] as a control model and the NC model. The Kakaletsis model was modified by reducing the shear reinforcements in the beam-column joints to simulate the NC model. The insufficient shear reinforcement in the joint causes the concrete in the area to be unconfined with a lessened bond. Both structures were simulated numerically with non-linear modeling and analysis using the ATENA software [9,10,11].

2. Methods

2.1. Model Building Type

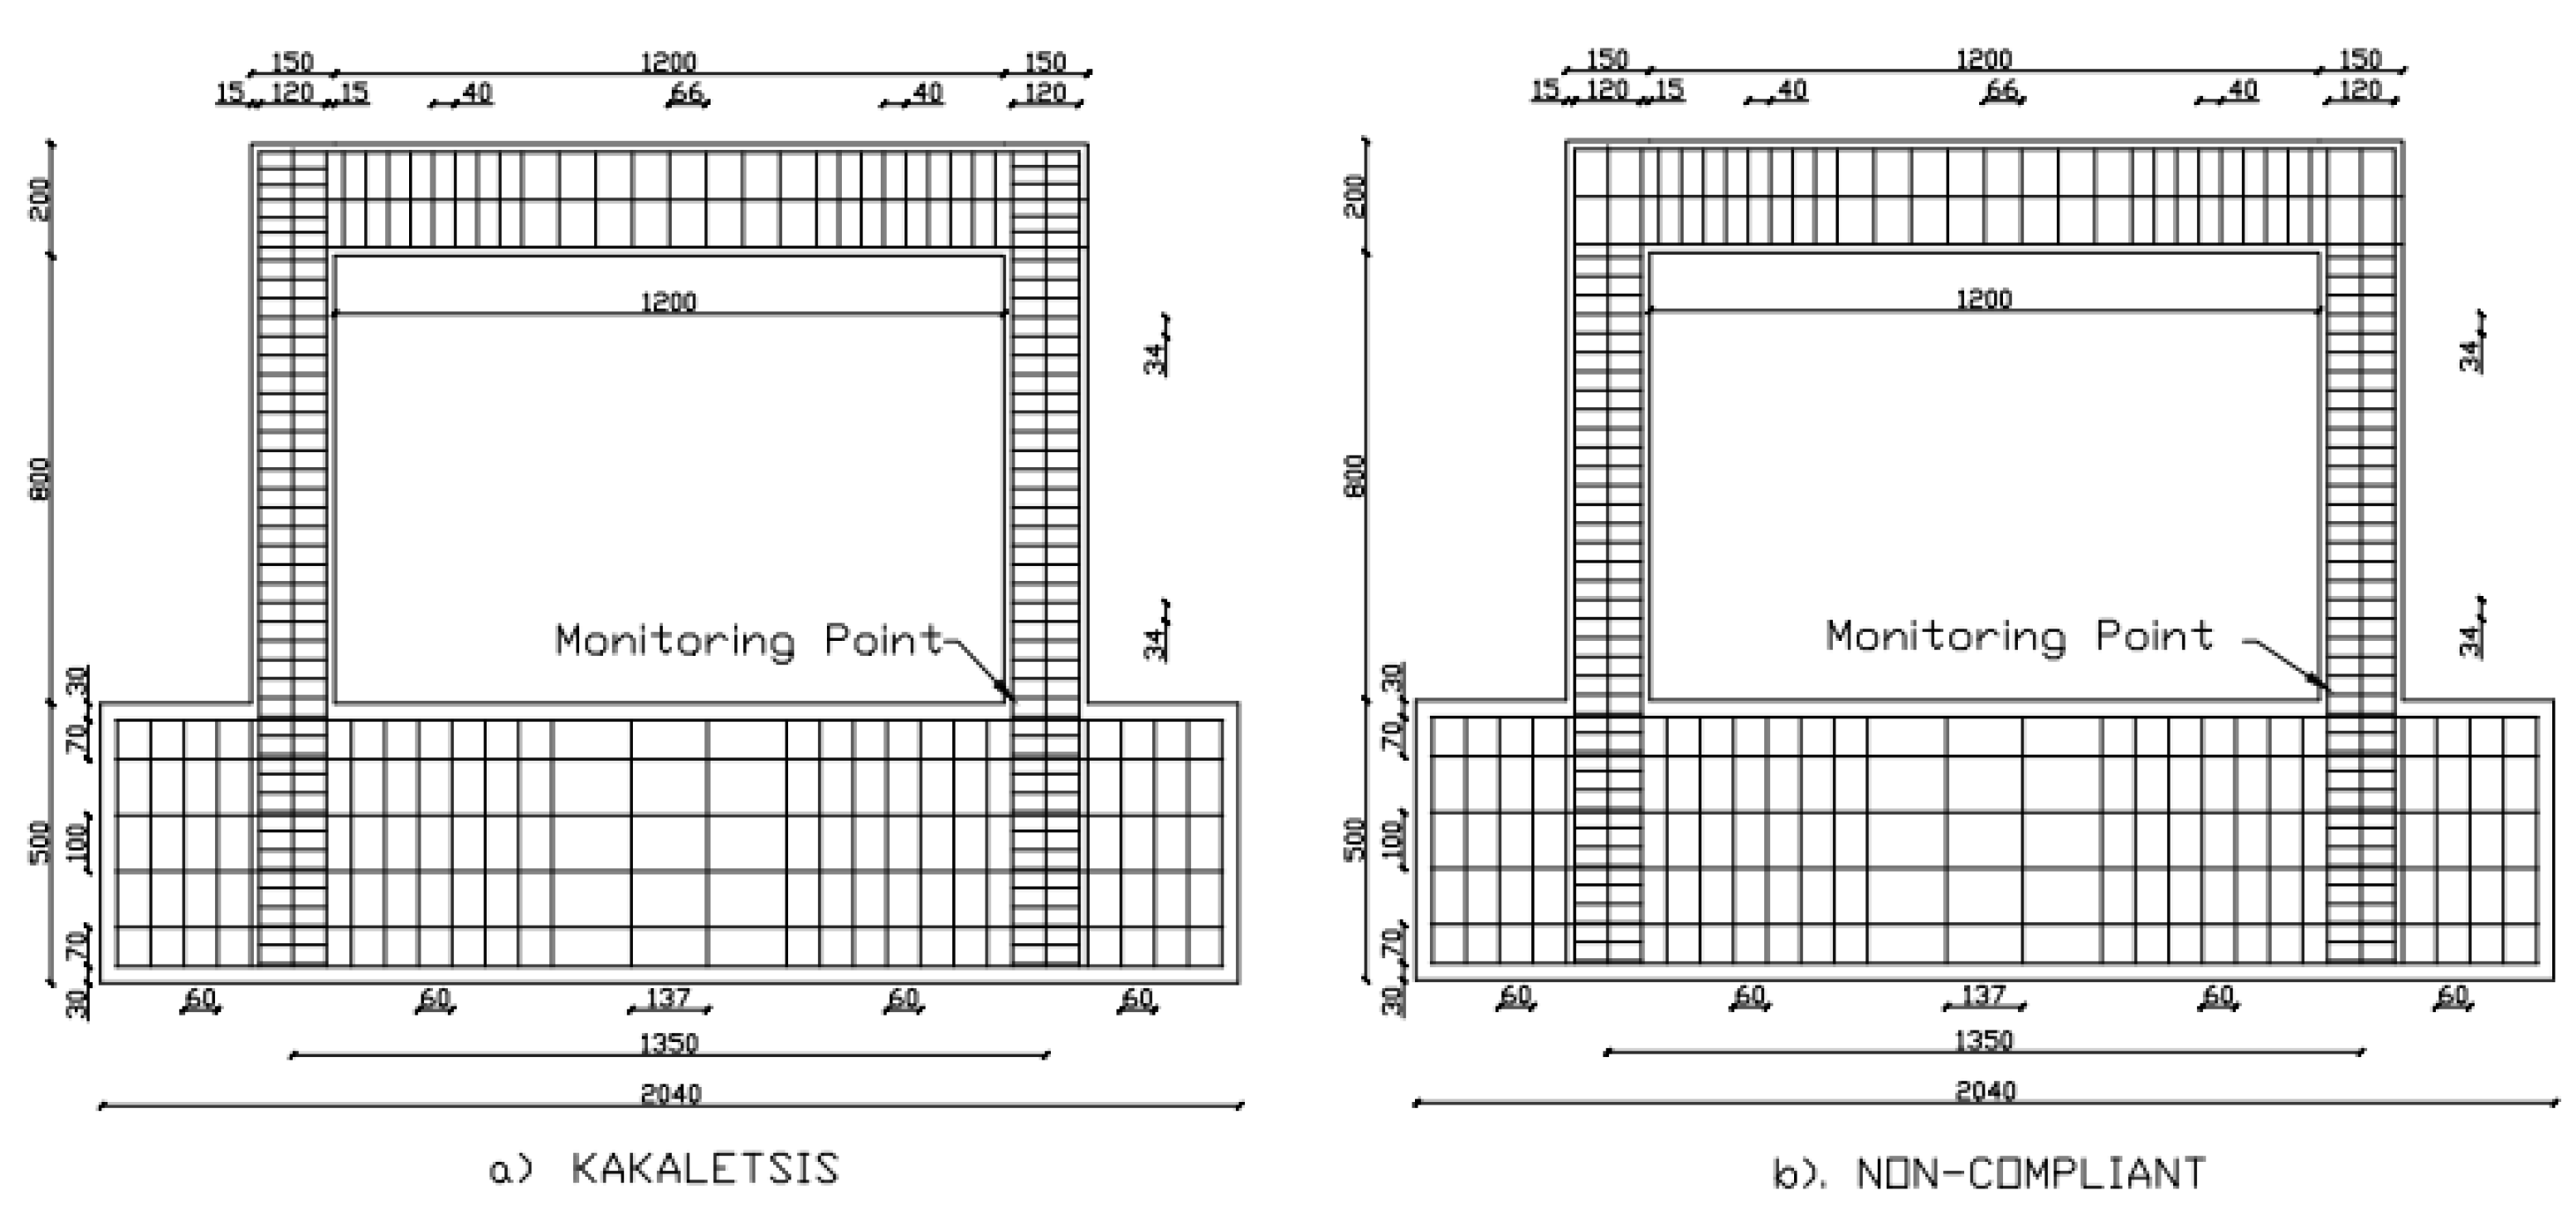
The structural model that represents the RC frame control (KK) and the NC structure is shown in Figure 1. The RC frame control model is obtained from Kakaletsis research [8]. In contrast, the NC model is a Kakaletsis model modified with reinforcement details in the joint area by eliminating shear reinforcement and considering unconfined concrete conditions (see Figure 1).
The materials used in this numerical simulation refer to the RC concrete frame in the Kakaletsis experimental research. The compressive strength of concrete (f'cu) is 28.51 MPa except in the joint of NC, where the value is reduced to 24.23 MPa to account for non-comformity condition. For the flexural reinforcement, the yield (fy) and ultimate strength (fu) of the steel are 390.475 MPa and 516.70 MPa, respectively, and for the shear reinforcement, the corresponding values are 212.20 MPa and 321.07 MPa.
Based on the ATENA theory [12,13,14,15], the software defines concrete as a fracture-plastic material that combines constitutive models for tensile (fracturing) and compressive (plastic) behavior. The fracture model is formulated using the classical orthotropic smeared crack approach and band technique, which employs the Rankine failure criterion and exponential softening. This model can be used as a rotated or fixed crack. The hardening and softening plasticity model is based on the Menétrey-Willam failure surface and uses the return mapping algorithm to integrate constitutive equations. The algorithm for the combination of the two models is developed separately, using a recursive substitution process. The algorithm can handle situations when both models' failure surfaces are active, and physical changes such as crack closure occur. Furthermore, the model can simulate concrete cracking, crushing, and closure under high confinement and in other material directions, while also paying special attention to these aspects.
Reinforcement can be discretely modeled as bars and represented by truss elements. The multi-linear law, which consists of four lines, is used to model all four stages of steel behavior: elastic state, yield plateau, hardening, and fracture. The multi-line is defined by four points that can be specified by the input.
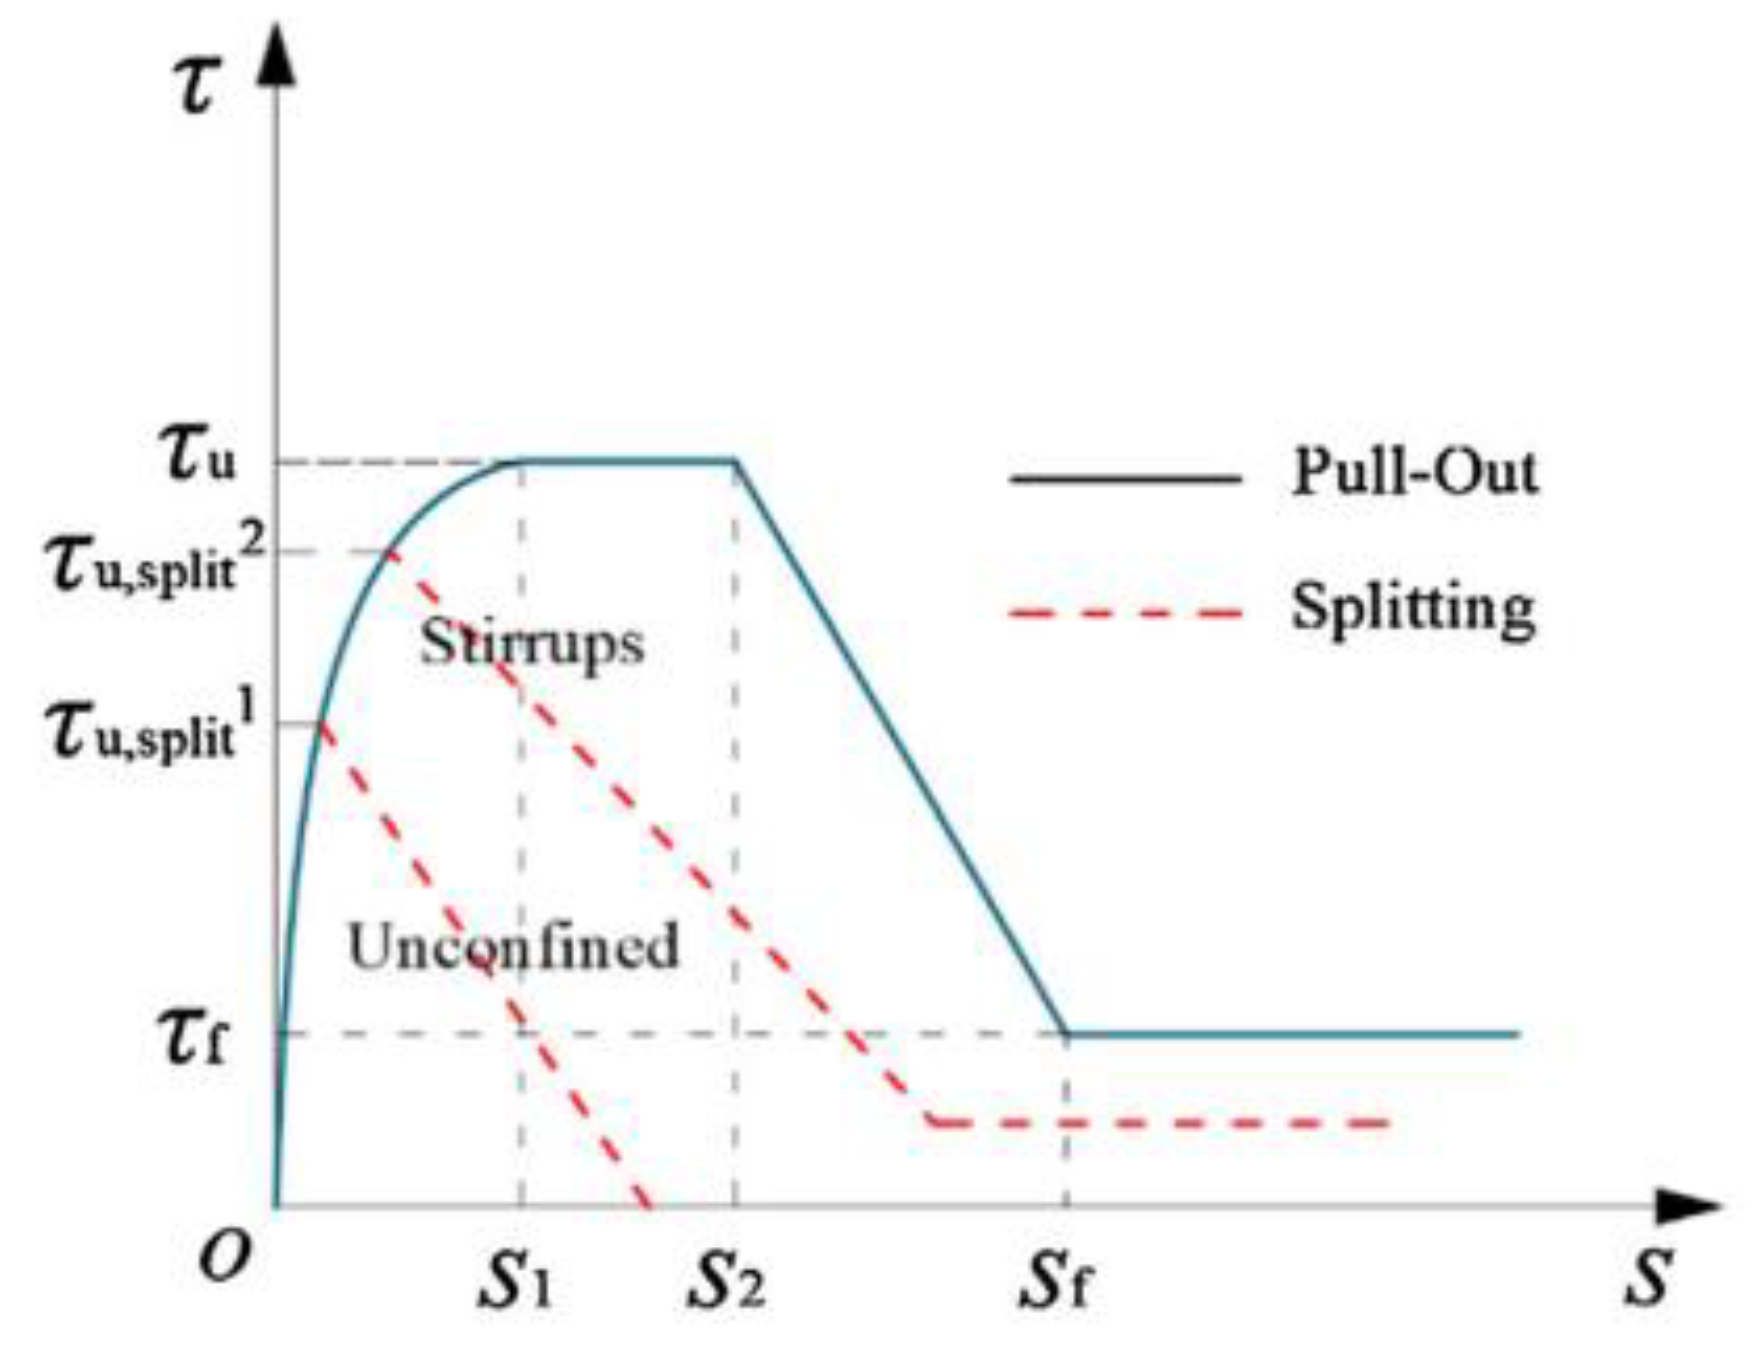
The bond between concrete and reinforcement is affected, among others, by the quality of concrete and the confinement of the stirrup. In the NC structure, the difficulty in compaction in the beam-column joint area results in low-quality concrete. Moreover, the shear reinforcements (stirrups) are often missing, so no concrete confinement in the beam-column joint can be expected. Therefore, the bond-slip behavior must take into account these conditions. The bond-slip behavior of Kakaletsis’s model follows the CEB-FIP Model Code 1990 [16,17], and a perfect bond is assumed between concrete and reinforcements. For the area of the beam-column joint of the NC model, a poor bond is assumed, and the bond-slip model is given in Figure 2.
Where is :
τ b =   τ b m a x s / s 1 α                                                                                                                                   f o r   0 s s 1
τ b =   τ b m a x                                                                                                                                                                 f o r   s 1 s s 2
τ b =   τ b m a x (   τ b m a x   τ b f ) ( s s 2 ) / ( s 3 s 2 )                     f o r   s 2 s s 3
τ b =   τ b f                                                                                                                                                                           f o r   s 3 s
Based on Table 1, with fcm = 24.23 MPa, the value τ b   m a x = 12.31 mm, τ b u ,   s p l i t = 4.96, S1 = 1.00 mm, S2 = 1.80 mm and S3 = 3.00 mm.
In the numerical simulation conducted by ATENA, a steel plate was used to transfer the load into the model structure, which helped avoid any concentration of loads that could potentially impact the concrete fracture. The steel's behavior is modeled using the isotropic elastic law. To model spring-like boundary conditions for the foundation element of the structure in the horizontal direction, a spring element was utilized.
The ATENA software automatically performs the meshing process to model structures into small finite elements. The basic elements used for meshing are brick, tetra, and brick-tetra combinations. The tetra element has a higher analysis order than the brick element. Computational complexity was the primary factor considered in selecting the finite element model. Usually, a simpler model is preferred as long as the results are accurate enough. For this study, the brick element was used.
In the ATENA program, solid element geometries are modeled as macro-elements. Both Kakaletsis and NC models were created using seven macro-elements, of which six represent concrete elements comprising one, two, two, and one beam, column, joint, and foundation elements. The other macro-element was used to represent a steel plate for load transfer. The connection between macro-elements was defined by surface contact with the perfect connection type. Meanwhile, the line elements were used to geometrically model the reinforcement bars embedded in the macro-elements of concrete. The quality of concrete is the same in both models, with the exception of the beam-column joint of the NC structure, which is considered lower quality and unconfined. Numerical models and model parameter values used in numerical analysis using ATENA software are shown in Table 2.
The numerical model of the control structure (KK) has been validated using the Kakaletsis’s experiment [18], and the same approach and modeling to [18] is used in this study both for KK and NC structure.

3. Simulation Results

3.1. Load Displacement

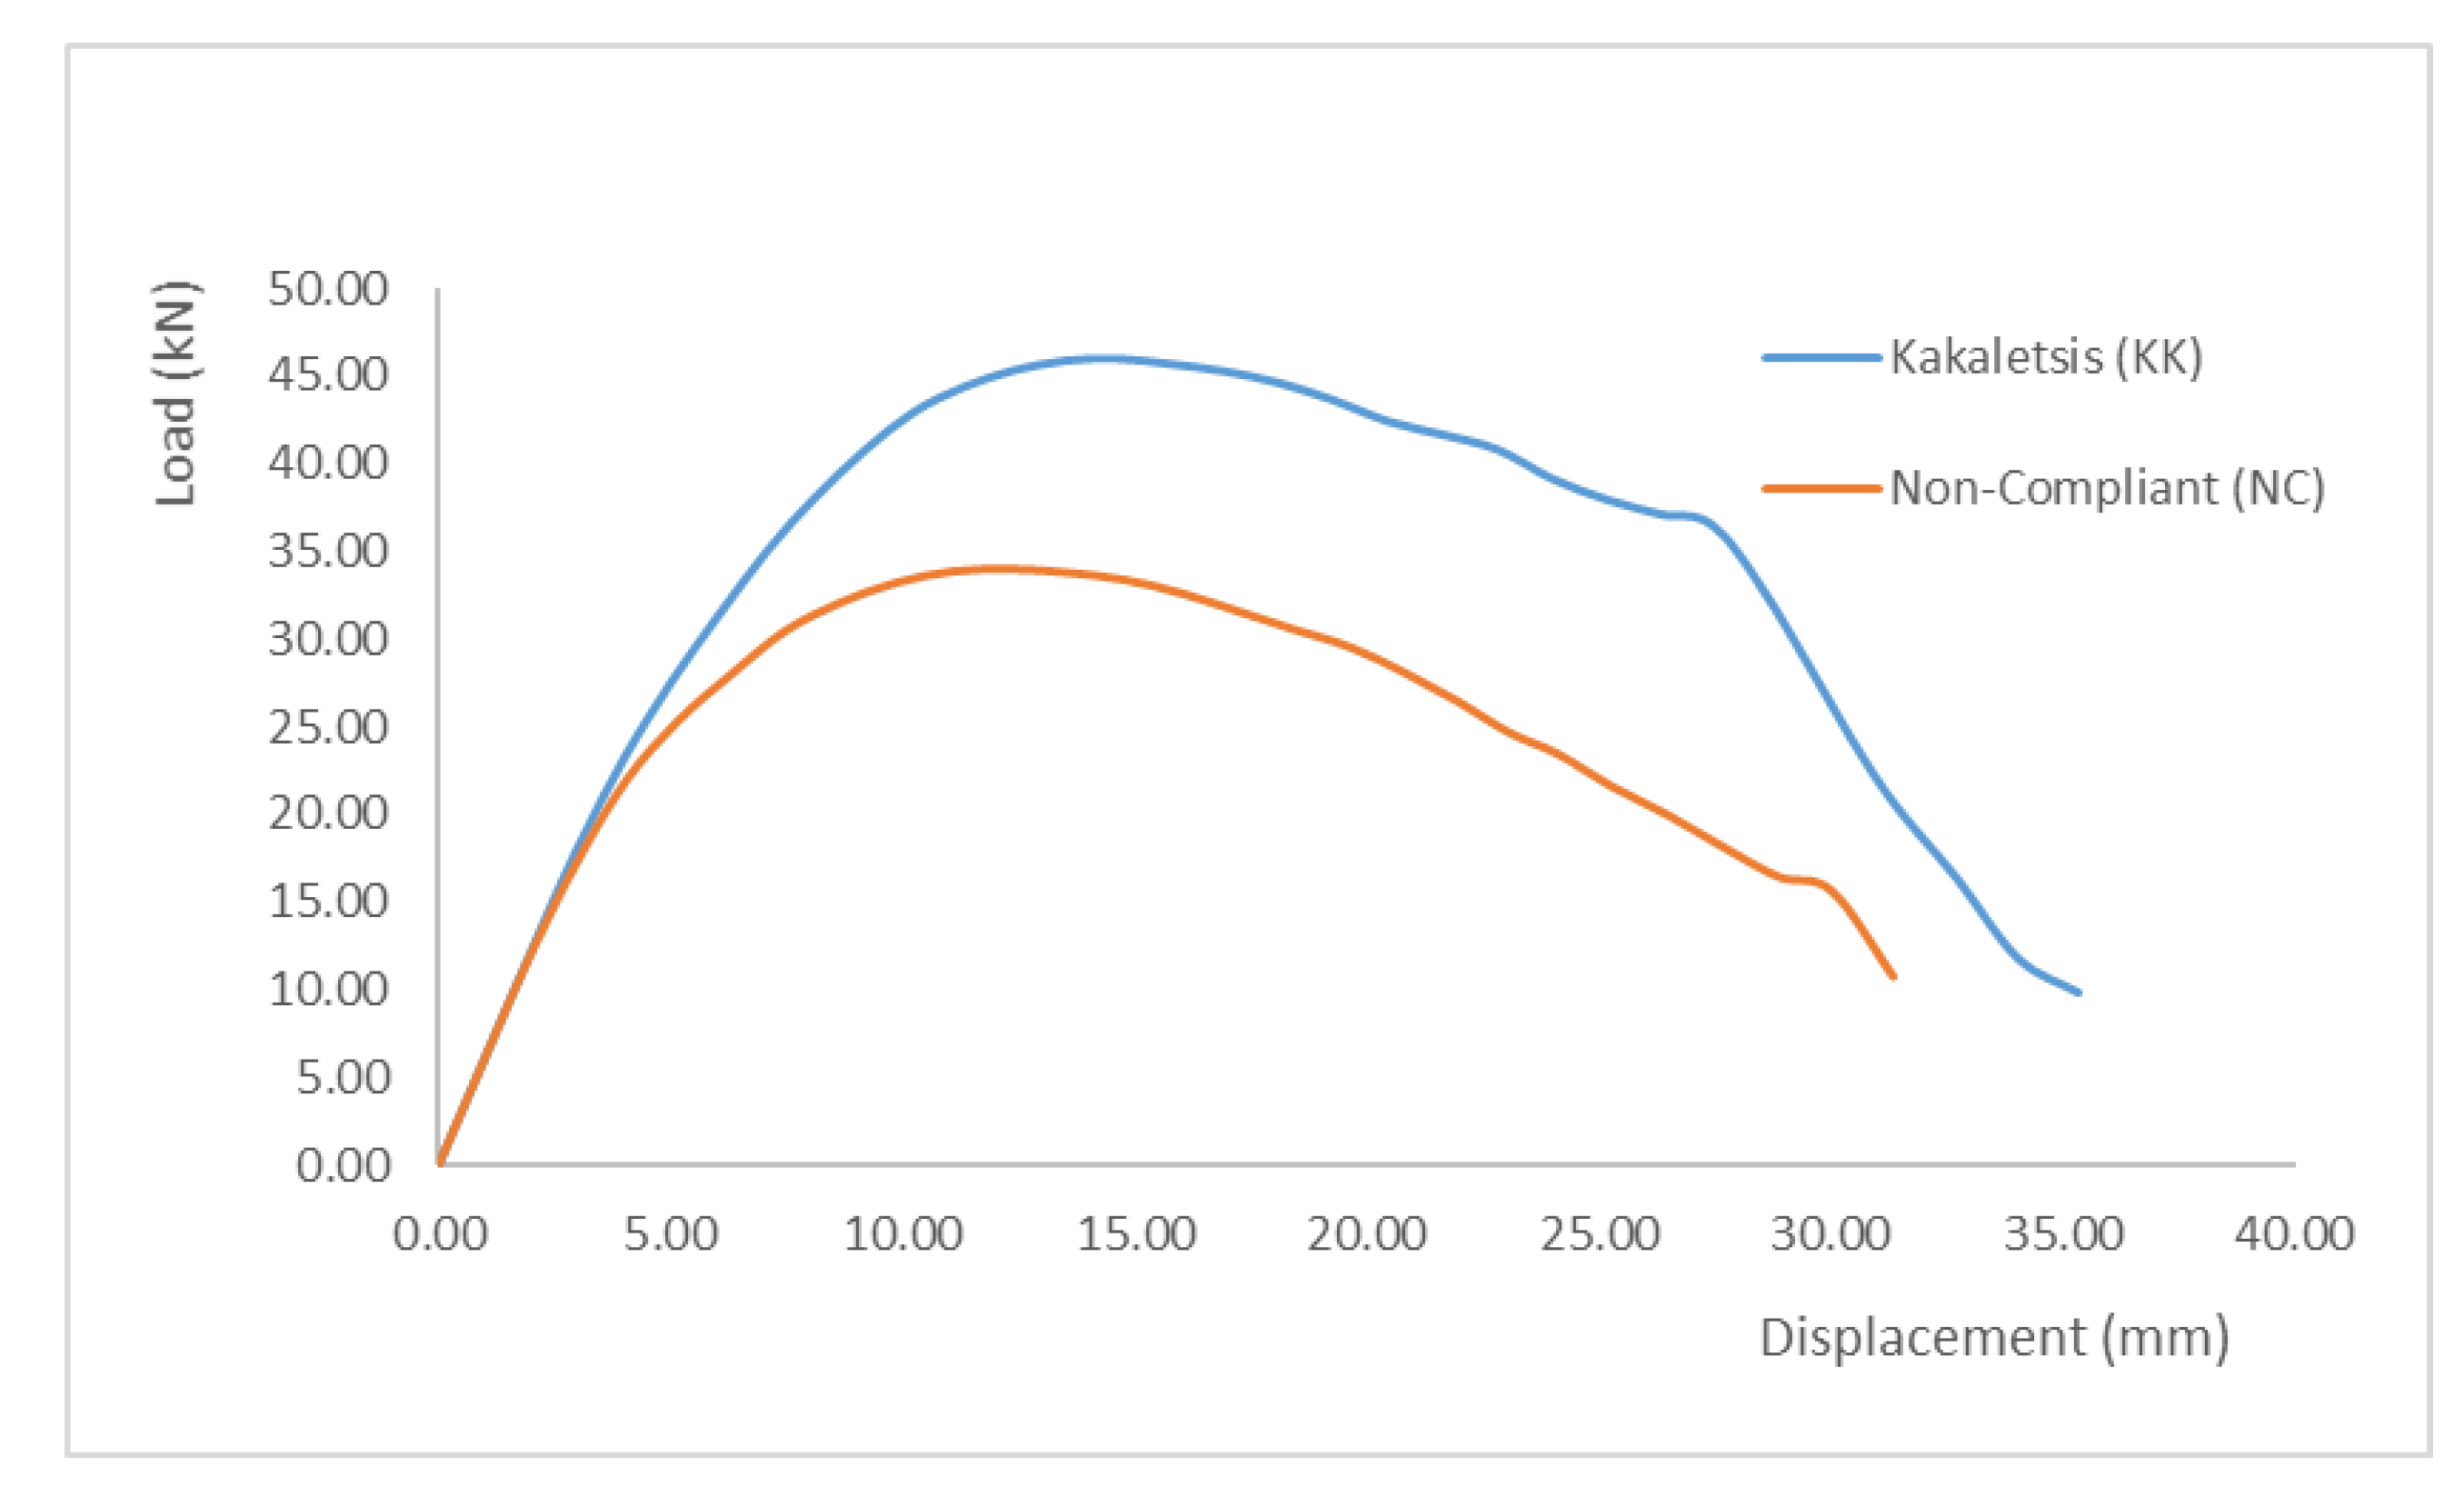
The obtained load and displacement relationship of the two models is shown in Figure 3 and summarized in Table 3. According to Table 3, there is a decline in the NC structure's capacity when compared to the Kakaletsis model. The NC beam-column joints' condition plays a significant role in reducing the ultimate capacity by 26.04%. The table also provides information on the displacements that occur at the beam-column joints for both models. The results indicate that the NC model is less ductile than the KK model.

3.2. Reinforcement Stress

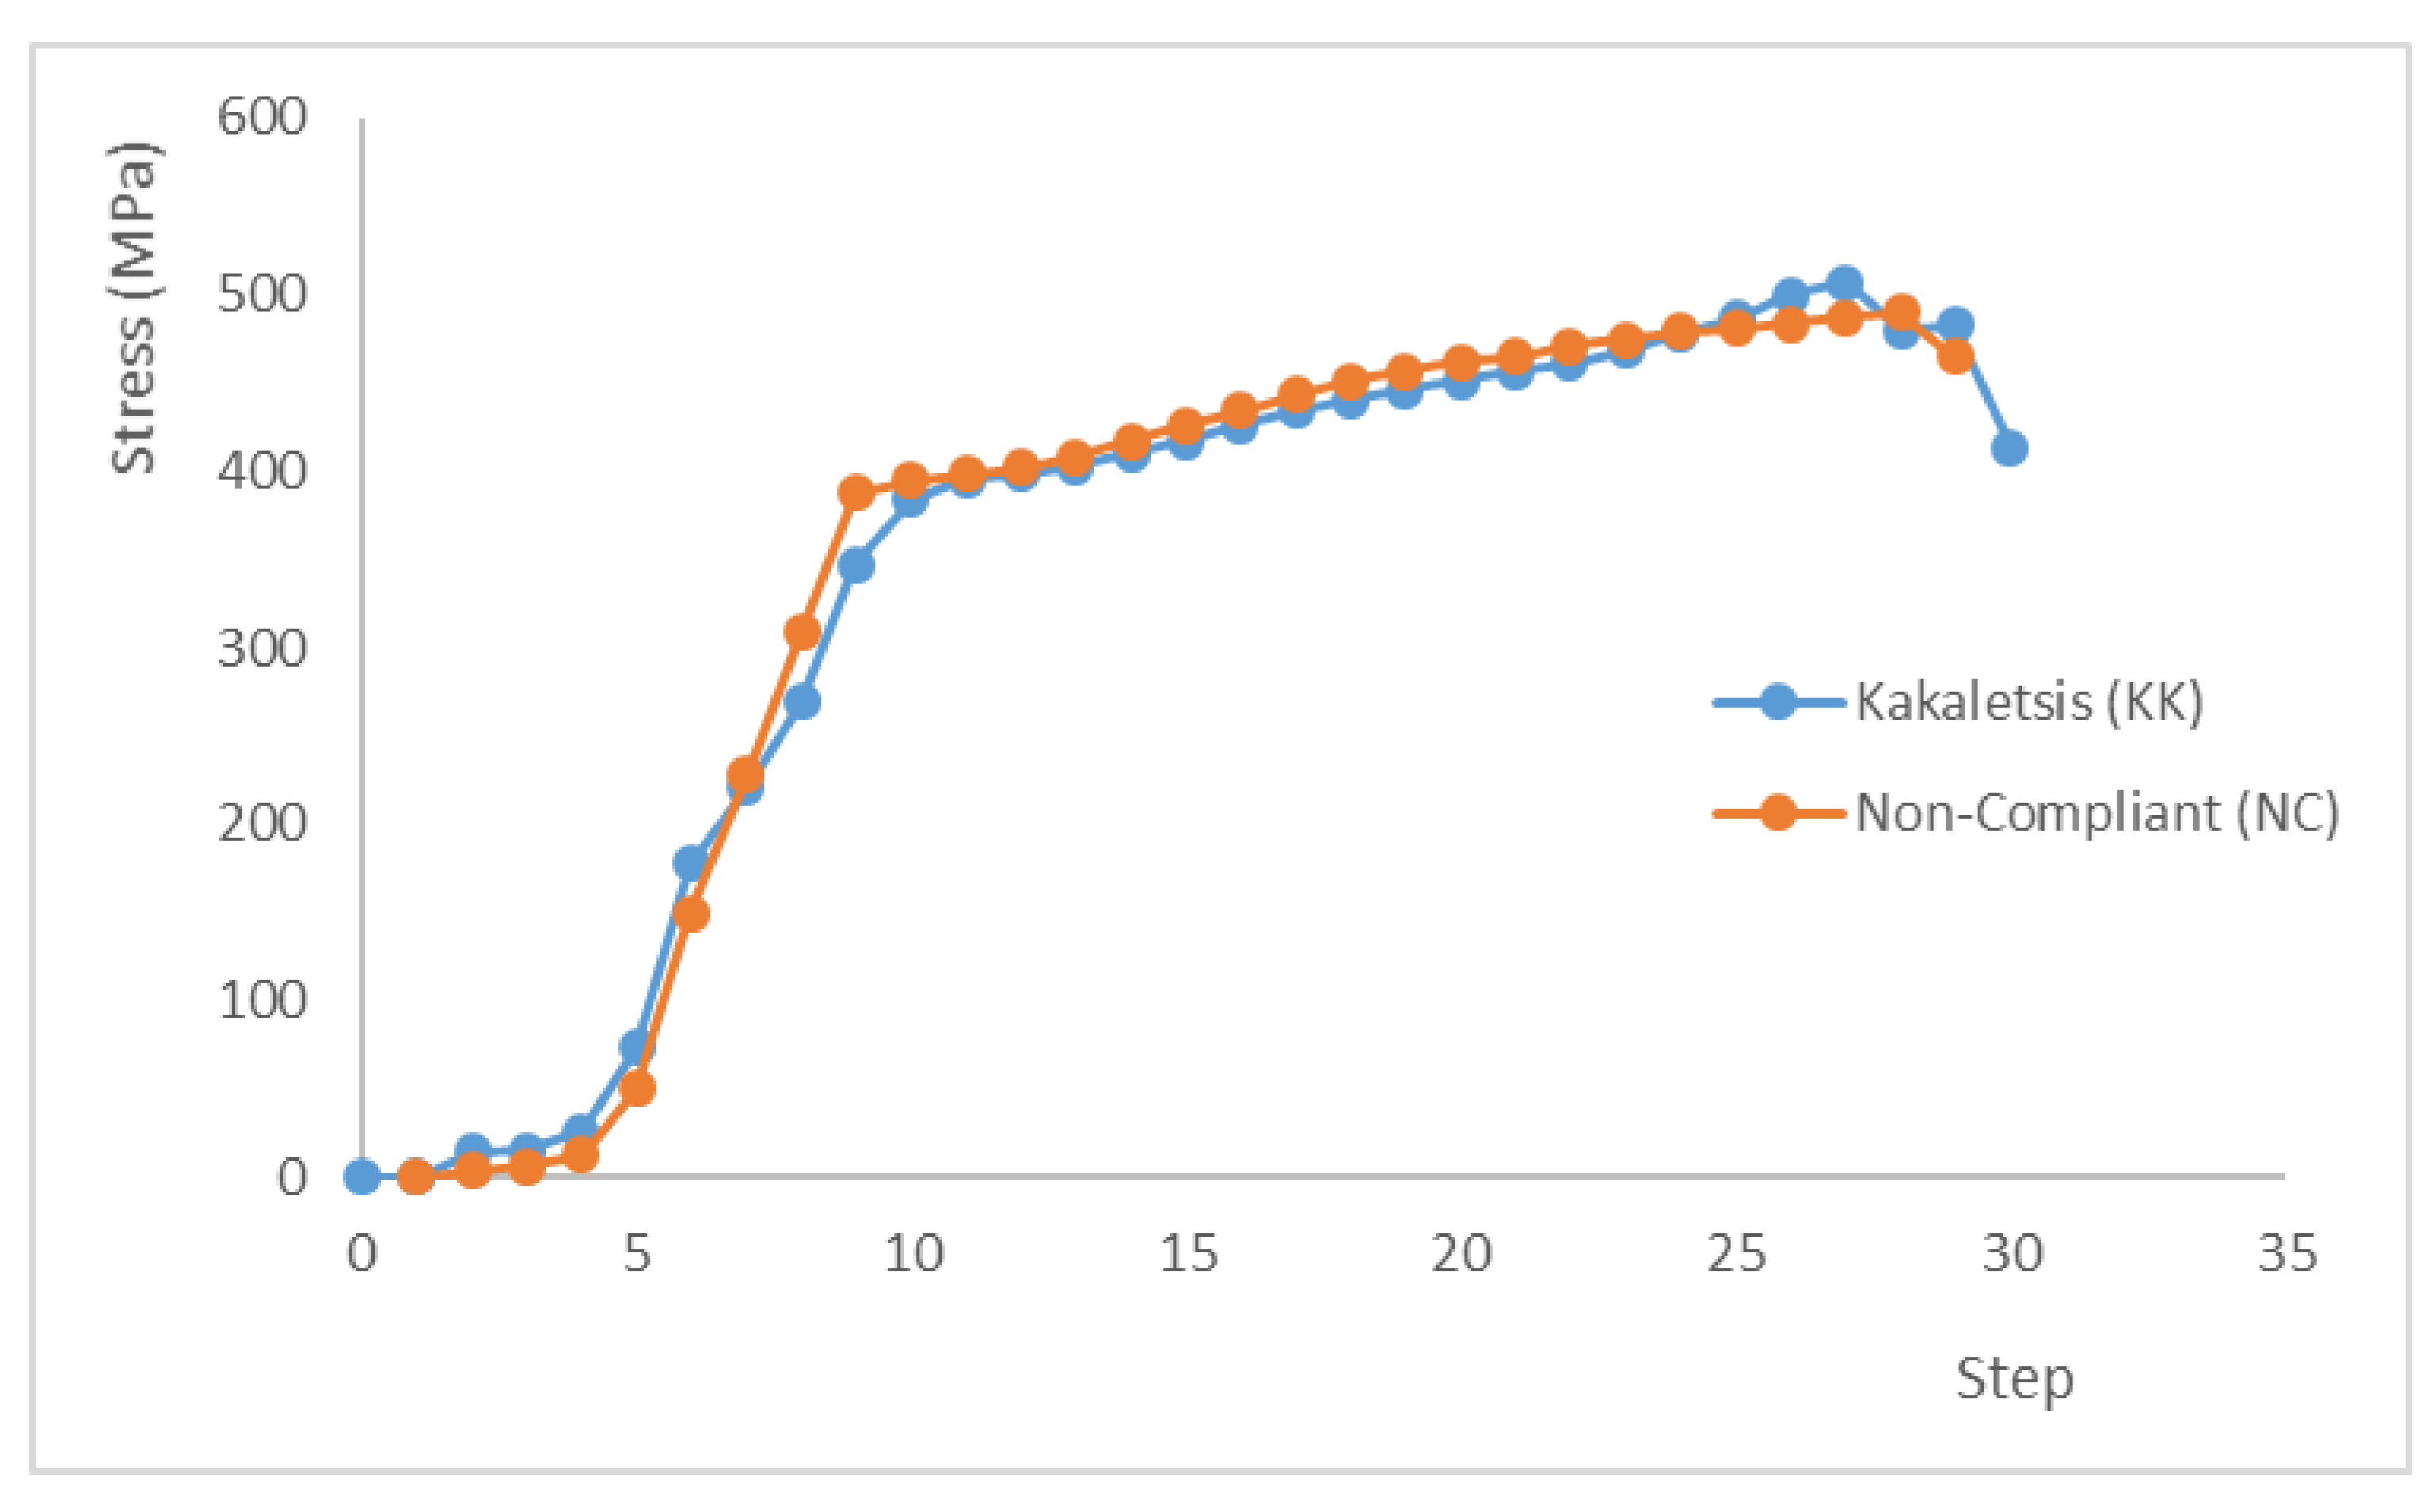
Determining the failure hierarchy of a structure is crucial as it influences the structure's redundancy. Avoiding non-redundant behavior is necessary to prevent significant casualties. The level of stress in the reinforcement can provide insights into the failure behavior. After analyzing the post-processing output of the reinforcing steel stress, it was found that in both the Kakaletsis and NC models, the reinforcement would yield at the lower column. Consequently, the reinforcement stress at this location was investigated, and the results are presented in Figure 4 in the form of a load-stress relationship.
Figure 5 shows that the load-bearing capacity of the Kakaletsis model is higher than the NC model. The stress that passed through the yield condition of the Kakaletsis model (395.1 MPa) occurred at step 10 with a load of 40.77 kN. Meanwhile, in the NC model, the stress that passed through the yield condition of the reinforcement (394.3 MPa) occurred at step 9 with a load of 33.24 kN. Thus, the NC model withstands a lower load before experiencing reinforcement yielding.

3.3. Failure Mode

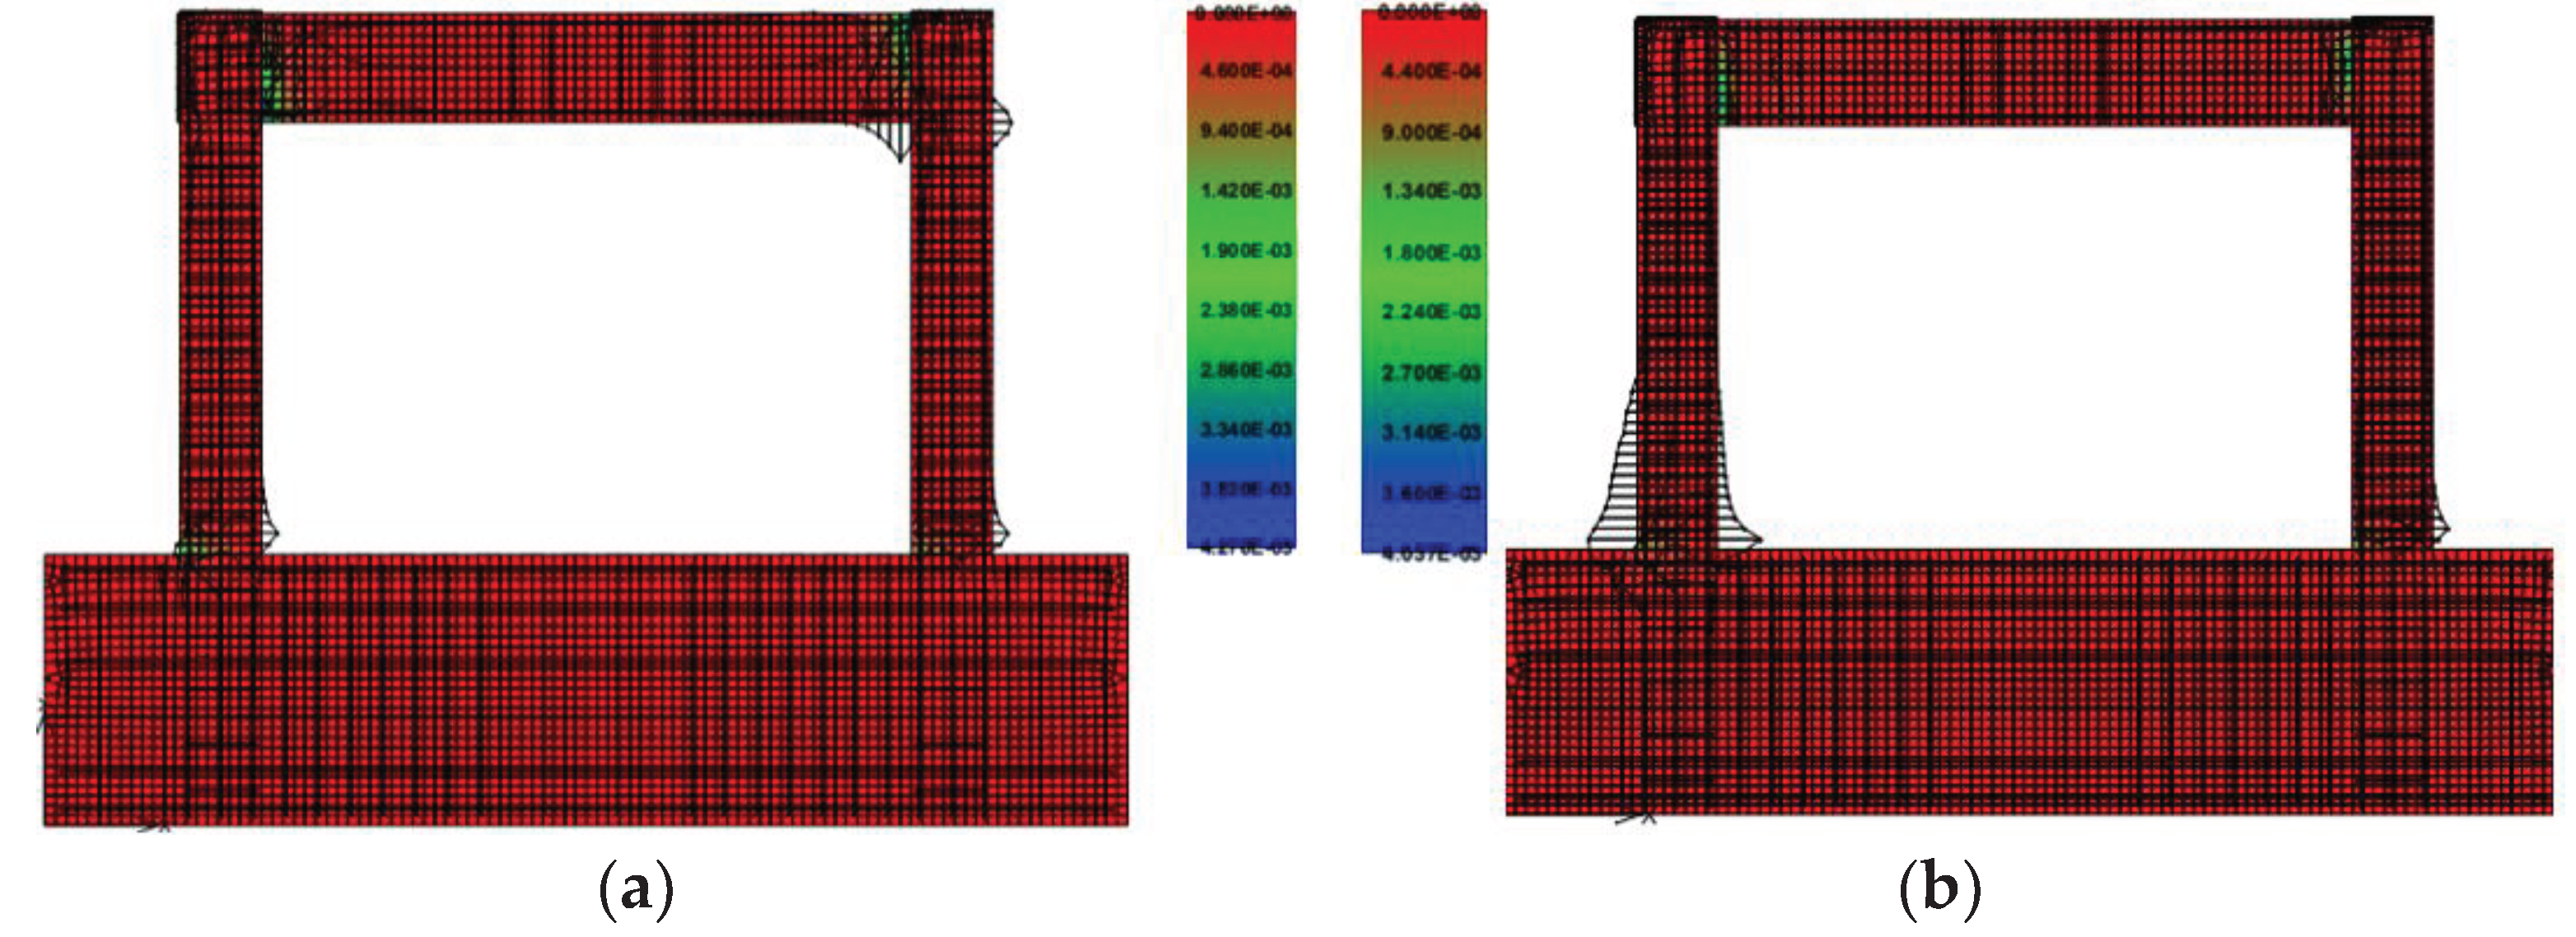
Crack patterns and failure modes at the beam-column joints area are the primary concern in the case of NC structures because this type of failure can cause the collapse of the building. Failure in the joint area can be in the form of beam failure, column failure, or joint failure, either by reinforcement yielding or concrete splitting. Numerical simulations of both models show that the maximum stress of the reinforcing steel in the KK and NC models occurs at a different locations. In the Kakaletsis model, the failure mode occurs at the end of the beam, while in the NC model, the failure shifts to the lower end of the column, as shown in Figure 6. A failure in the column will usually precede the global collapse of a building [19,20]. Therefore, the insufficient shear reinforcement at the beam-column joints of the NC is detrimental to the safety of the building and its occupants.

4. Fragilty Curve

4.1. Capacity and Spectrum Capacity Curve

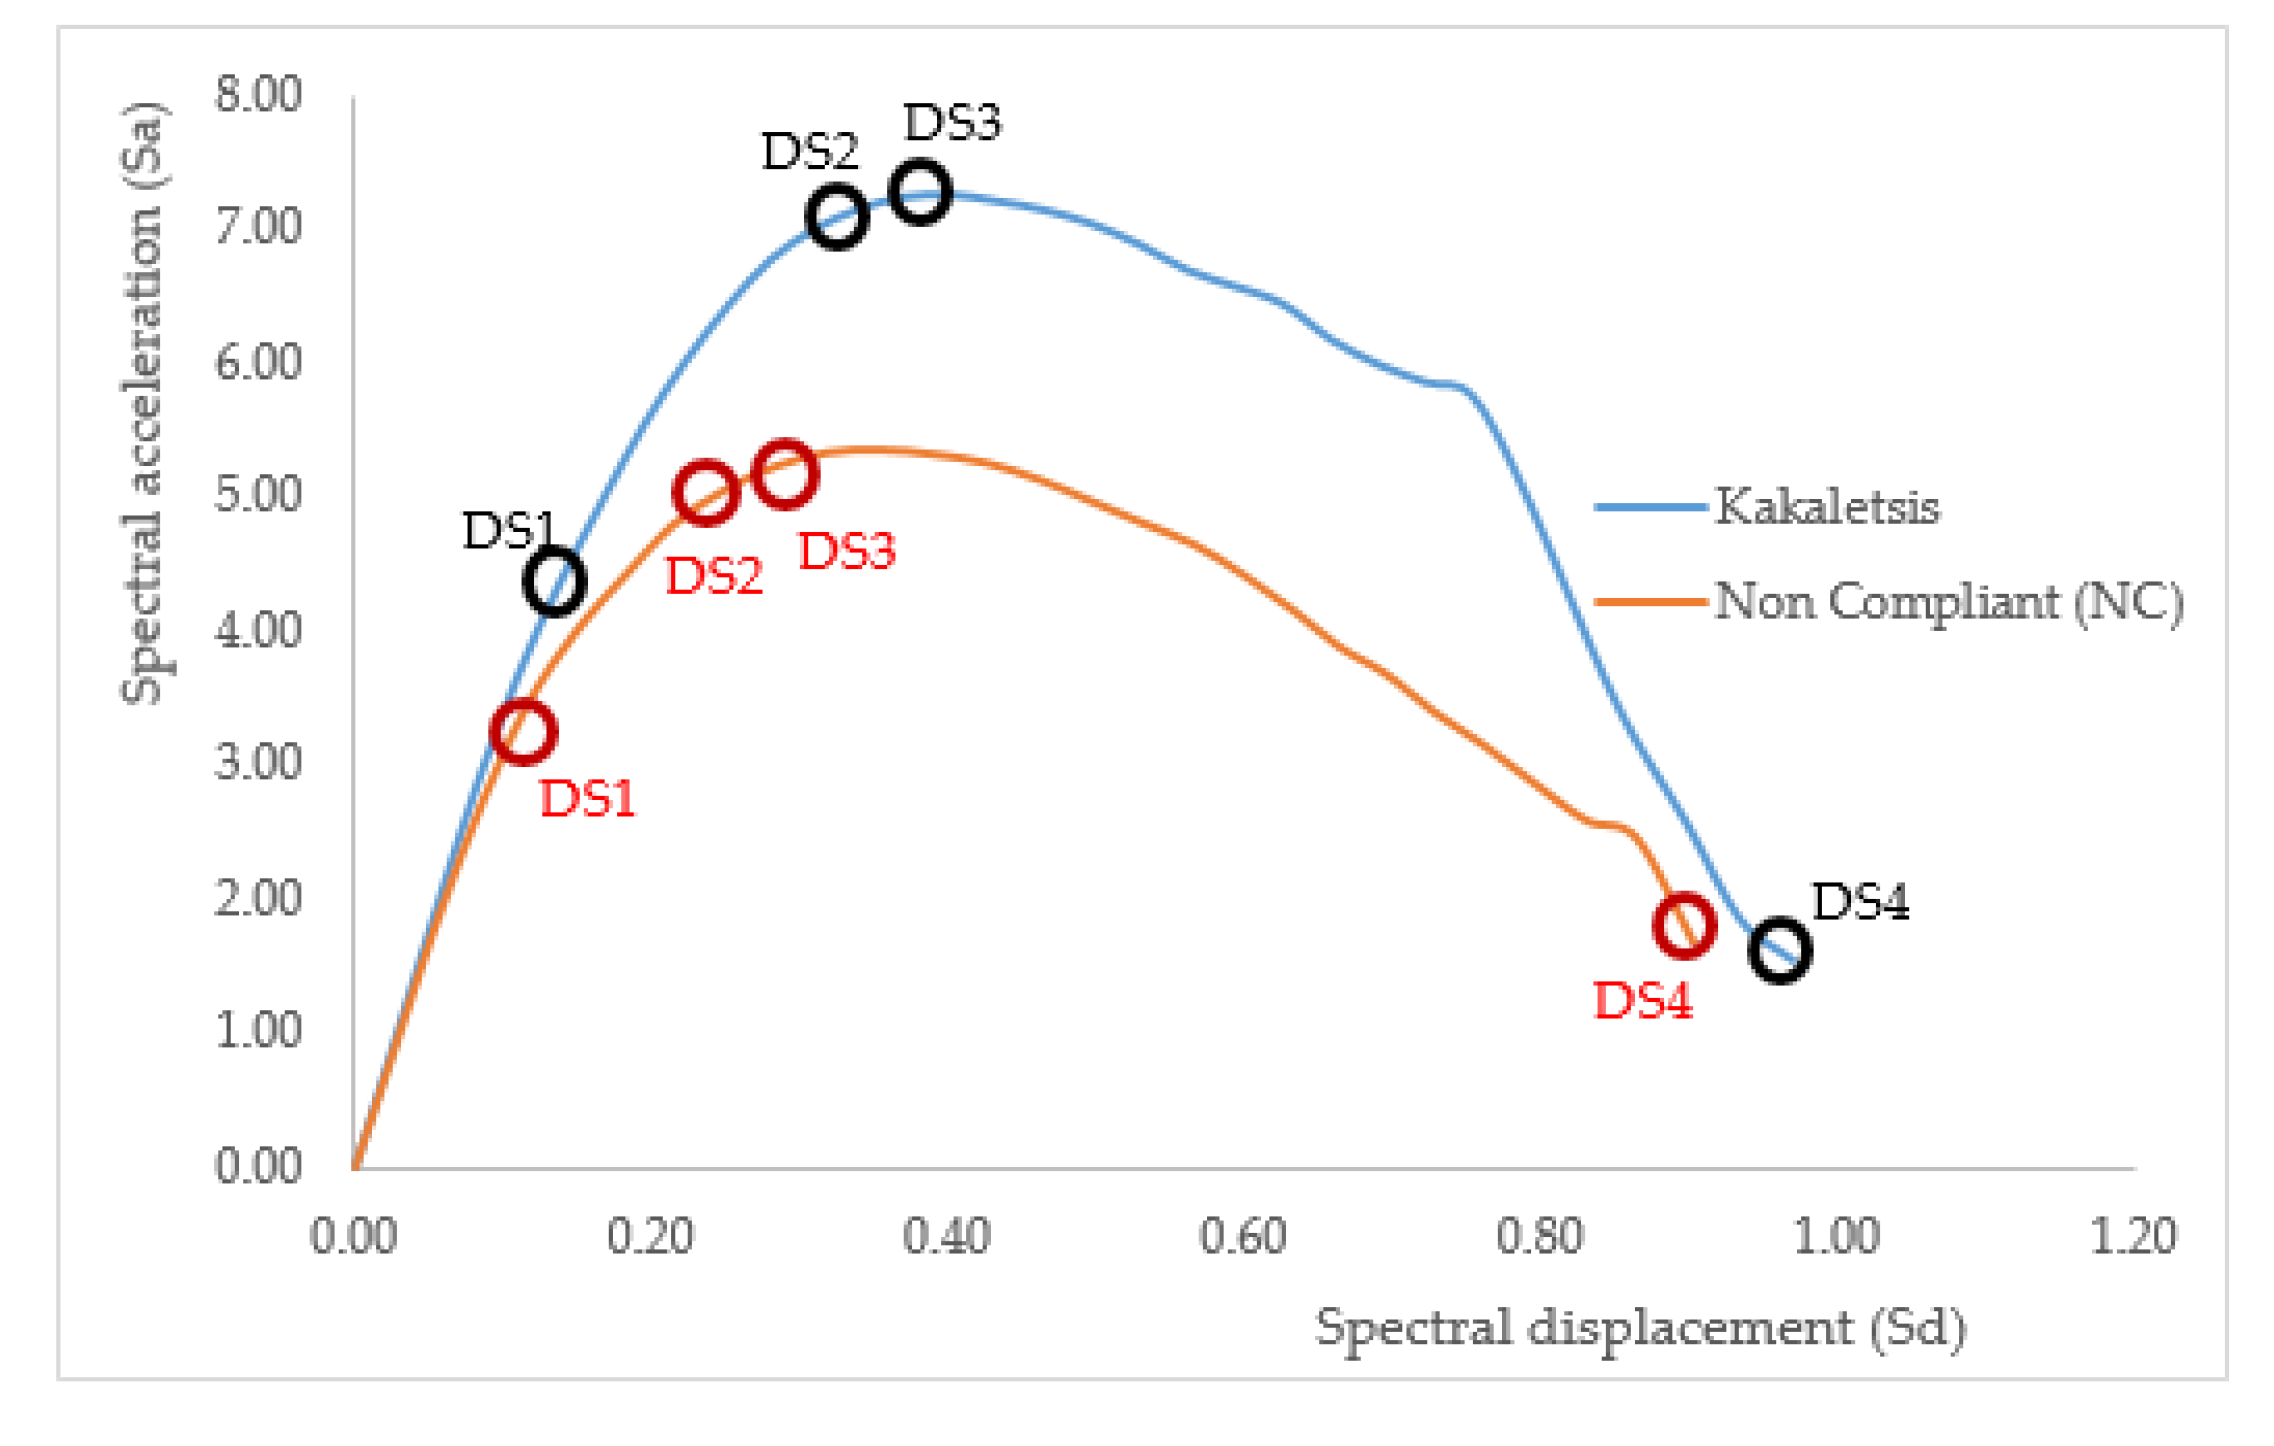
One of the numerical simulation results using ATENA was a capacity curve graph showing the relationship between base shear and displacement that occurred when the structure underwent ground acceleration. The capacity curve (Figure 3) would then be converted into a capacity spectrum curve in the development of the seismic fragility of the structure (fragility curve). The capacity spectrum curve shows the relationship between spectral acceleration (Sa) and spectral displacement (Sd). The values of Sa and Sd were obtained from the conversion of the base shear and displacement values on the capacity curve in ADRS format according to ATC-4018 [21]. The values of Sa and Sd were calculated at each analysis stage. The results of converting the capacity curve into a capacity spectrum curve are presented in Fig. 6. This figure will be further analyzed to determine the damage limit state as discussed in the following sub-section.

4.2. Damage State

According to HAZUS-MZ, the level of damage to buildings is classified into four categories, namely Light (DS1/Slight), Medium (DS2/Moderate), Near Collapse (DS3/Near Collapse), and Collapse (DS4/Collapse) [18-20]. Furthermore, several engineering demand parameters have been proposed to determine the damage limit state. This current study is determined based on FEMA [19]. These criteria were used to evaluate the damage limit presented in Table 4, and the results are inserted in Figure 6 and tabulated in Table 5 for the current model structures.

4.3. Structure Uncertainty

The dispersion measurement of the capacity curve is calculated to determine the standard deviation of uncertainty (β) and the fragility curve using the Hazus procedure. The standard deviation of the total uncertainty of each damage condition (βds) is a combination of the limit value of the damage state (βM(ds)), structural capacity (βc), and demand spectrum in the form of ground motion (βd). Based on Hazus-MH MR, the relationship is shown in Equation (5).
β d s =   [ C O N V β c β d ] 2 +   [ β M d s ] 2
The uncertainty parameters of the structural models were taken as follows: βM(ds) and βd are 0.400 and 0.4500, respectively. This is because the models have a short period, while βc was calculated using Equation (6).
β c =   ln ( s 2 m 2 + 1 )
where m is the average of the accelerating capacity spectra of the structure and s is its standard deviation. The calculated structural uncertainty results are shown in Table 6

4.4. Fragility Curve of the Investigated Frame Structures

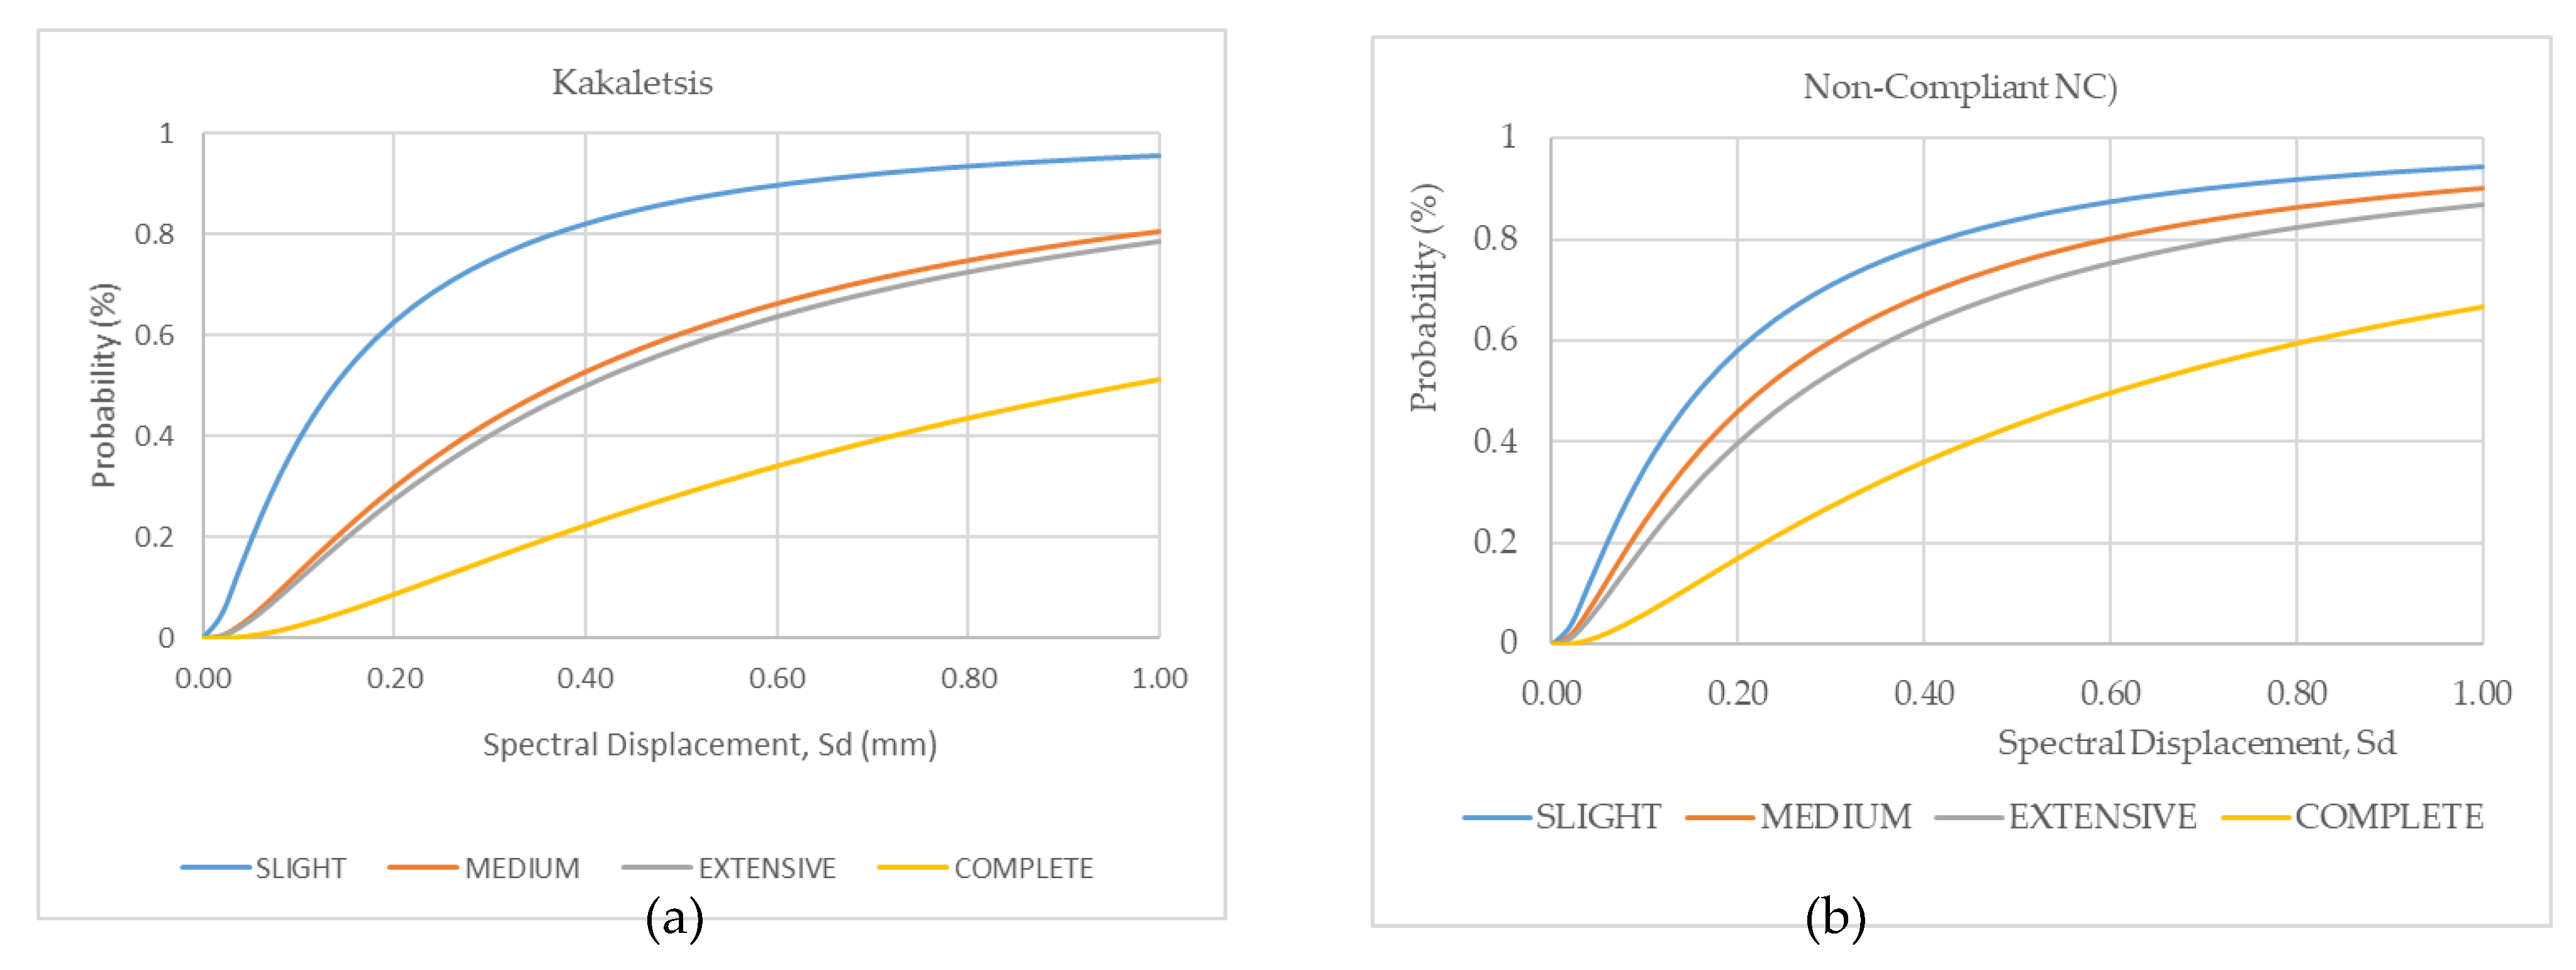
The fragility curve shows the relationship between probability and various demand parameters. The Hazus-MH MR Standard formula is used to determine the failure probability that occurs in particular damage, as shown in Equation (7).
P d s I s d =   ϕ 1 β d s l n s d s d , d s ¯
where P denotes the probability of exceeding a particular damage state, Sd,ds is the median value of the spectral displacement achieved at a certain level of damage, β d s represents the standard deviation of the lognormal of the spectral displacement, and φ is the standard cumulative probability function. The results of calculating the probability of damage to the Kakaletsis model and the NC model are shown in Figure 7.
Figure 7 can be used to conduct further analysis to determine the discrete damage representing the probability of damage at each level. This study calculated the discrete damage by taking the Surakarta area using an earthquake load of 500 year return period (DBE) and 2500 (MCE) year return period. The calculation results are shown in Tables 7 and Table 8.
Table 7 and Table 8 show that NC condition of the beam-column joint causes a reduction of the undamaged but an increase of more severely damaged condition. The level of undamaged structure of DBE in the Kakaletsis and NC models are 48.78 % and 42.67 %, respectively, with a damage difference of 6.11%. Meanwhile, in terms of MCE conditions, the undamaged value in the Kakaletsis and NC models are 35.21% and 28.71%, with a damage difference of 6.49%.

5. Conclusions

The Kakaletsis and the Non-compliant models provide an overview of the performance of structural elements against seismic loads. Therefore, the numerical analysis and study using ATENA software of both models resulted in the following conclusions:
  • Load capacity on Non-compliant models decreases by 26.04% at maximum load condition.
  • The reinforcement stress in the NC model occurs faster than in the KK model.
  • The failure in Kakaletsis occurs in the beams and in the Non-Compliant model it occurs in the columns, thus changing the collapse of the building from local to global.
  • The undamaged state of the Non-compliant model decreased by 6.11% and 6.49% under earthquake load at DBE and MCE levels, respectively. This reduction of the undamaged condition results from the more severe damage occurring in the NC structure.
  • Based on the review of load capacity, displacement, and level of damage in numerical analysis, the Non-compliant model will decrease seismic performance due to the absence of shear reinforcement in the beam-column joint. This will enable the reinforcement in the joint area to be detailed according to the applicable regulatory standards for seismic performance to function optimally and protect the building from damage due to seismic loads.

Supplementary Materials

The following supporting information can be downloaded at the website of this paper posted on Preprints.org.

Author Contributions

EP designed research numerically and data processing. SAK performs control and guidance as well as makes corrections to the discussion. SS provides guidance on the basis of theory and discussion. HAS provides basic theoretical corrections and numerical modeling. All authors have read and agreed to the published version of the manuscript.

Funding

This research was funded by MINISTRY of RESEARCh and TECHNOLOGY, INDONESIA via Research Assigment of PTNBH under programme Fundamental Research Grant, grant number 254UN27.22/PT.01.03/2022.

Data Availability Statement

The data presented in this study are available on request from the corresponding author.

Acknowledgments

The authors are grateful to the Institute for Research and Community Service, Universitas Sebelas Maret who has funded this research through SMARTCrete Research Group Civil Engineering Study Program.

Conflicts of Interest

The authors declare no conflict of interest.

References

  1. Kristianto, I. Imran, M. Suarjana, and I. Pane, “Confinement of reinforced-concrete columns with non- code compliant confining reinforcement plus supplemental pen-binder,” ITB J. Eng. Sci., vol. 44 B, no. 3, 2012. [CrossRef]
  2. M. Rizwan, N. Ahmad, A. Naeem Khan, S. Qazi, J. Akbar, and M. Fahad, “Shake table investigations on code non-compliant reinforced concrete frames,” Alexandria Eng. J., vol. 59, no. 1, 2020. [CrossRef]
  3. A. Wali et al., “Evaluation of code compliant/non-compliant ECC-RC IMRF structures,” Structures, vol. 32, 2021. [CrossRef]
  4. W. C. Santiago and A. Beck, “A study of brazilian concrete strength ( non-)compliance and its effects on reliability of short columns,” IBRACON Struct. Mater. J., vol. 4, no. 4, 2011.
  5. M. Rizwan, N. Ahmad, and A. N. Khan, “Seismic performance of compliant and noncompliant special moment-resisting reinforced concrete frames,” ACI Struct. J., vol. 115, no. 4, 2018. [CrossRef]
  6. N. Ahmad, A. Shahzad, Q. Ali, M. Rizwan, and A. N. Khan, “Seismic fragility functions for code compliant and non-compliant RC SMRF structures in Pakistan,” Bull. Earthq. Eng., vol. 16, no. 10, 2018. [CrossRef]
  7. T. Boen, “Earthquake Resistant Design of Non-Engineered Buildings In Indonesia1 Earthquake Resistant Design of Non-Engineered Buildings In Indonesia 1.” Accessed: Nov. 02, 2019. [Online]. Available: https://www.researchgate.net/publication/238659833.
  8. D. J. K. and C. G. Karayannis, “Experimental Investigation of Infilled Reinforced Concrete Frames with Openings,” ACI Struct. J., vol. 106, no. 2. [CrossRef]
  9. L. Pierot and L. Spelle, “Derniers résultats de l’étude Atena,” J. Neuroradiol., vol. 35, no. 1, p. 30, 2008. [CrossRef]
  10. L. Pierot, L. Spelle, and F. Vitry, “ATENA: The first prospective, multicentric evaluation of the endovascular treatment of unruptured intracranial aneurysms,” J. Neuroradiol., vol. 35, no. 2, pp. 67–70, 2008. [CrossRef]
  11. J. Marín-Cañada et al., “Neumonía adquirida en la comunidad: tasa de incidencia en Madrid. Estudio ATENAS,” Atención Primaria, vol. 48, no. 9, pp. 615–616, 2016. [CrossRef]
  12. ATENA 5.6, “ATENA Program Documentation Part 1 Theory Manual,” p. Cervenka Consulting, Prague, Czech Republic., 2016, [Online]. Available: https://www.cervenka.cz/.
  13. “ATENA Version 5 – Technical Specifications,” p. 1920, 2014.
  14. J. Červenka, “ATENA Program Documentation Part 2-1 User ’ s Manual for ATENA 2D,” ATENA Progr. Doc. Part 4-1 Tutor. Program. ATENA 2D, pp. 1–62, 2015.
  15. J. Červenka, “ATENA Program Documentation Part 4-1 Tutorial for Program ATENA 2D Written by :,” Cerv. Consult., vol. May, pp. 1–61, 2001.
  16. J. H. Aly, A. Farghl Maree, M. Kohail, and A. H. Khalil, “Modeling of bond stress-slip relationships of mono-prestressing strands with H-anchorage dead end,” Ain Shams Eng. J., vol. 14, no. 6, p. 102105, 2023. [CrossRef]
  17. H. Lin, Y. Zhao, J. Ozbolt, P. Feng, C. Jiang, and R. Eligehausen, “Analytical model for the bond stress-slip relationship of deformed bars in normal strength concrete,” Constr. Build. Mater., vol. 198, pp. 570–586, 2019. [CrossRef]
  18. S. A. Kristiawan, I. R. Hapsari, E. Purwanto, and M. Marwahyudi, “Evaluation of damage limit state for rc frame based on fe modeling,” Buildings, vol. 12, no. 1, pp. 1–22, 2022. [CrossRef]
  19. N. M. Mary Treasa Shinu and S. Needhidasan, “Structural analysis and design of a multistoried RCC building to prevent disproportionate collapse using E-Tabs,” Mater. Today Proc., vol. 43, pp. 1911–1918, 2021. [CrossRef]
  20. D. Gautam, R. Adhikari, and R. Rupakhety, “Seismic fragility of structural and non-structural elements of Nepali RC buildings,” Eng. Struct., vol. 232, p. 111879, 2021. [CrossRef]
  21. Federal Emergency Management Agency (FEMA), “HAZUS-MH MR4 Multi-Hazar d Loss Estimation Methodology – Earthquake Model: Technical Manual. Department of Homeland Security,” Fed. Emerg. Manag. Agency, Washington, …, 2003, [Online]. Available: www.fema.gov/plan/prevent/hazus.
  22. A. Engineering, “Technical and User’s Manual of Advanced Engineering Building Module (AEBM) ‘Hazus MH 2.1,’” Fed. Emerg. Manag. Agency, p. 121, 2015.
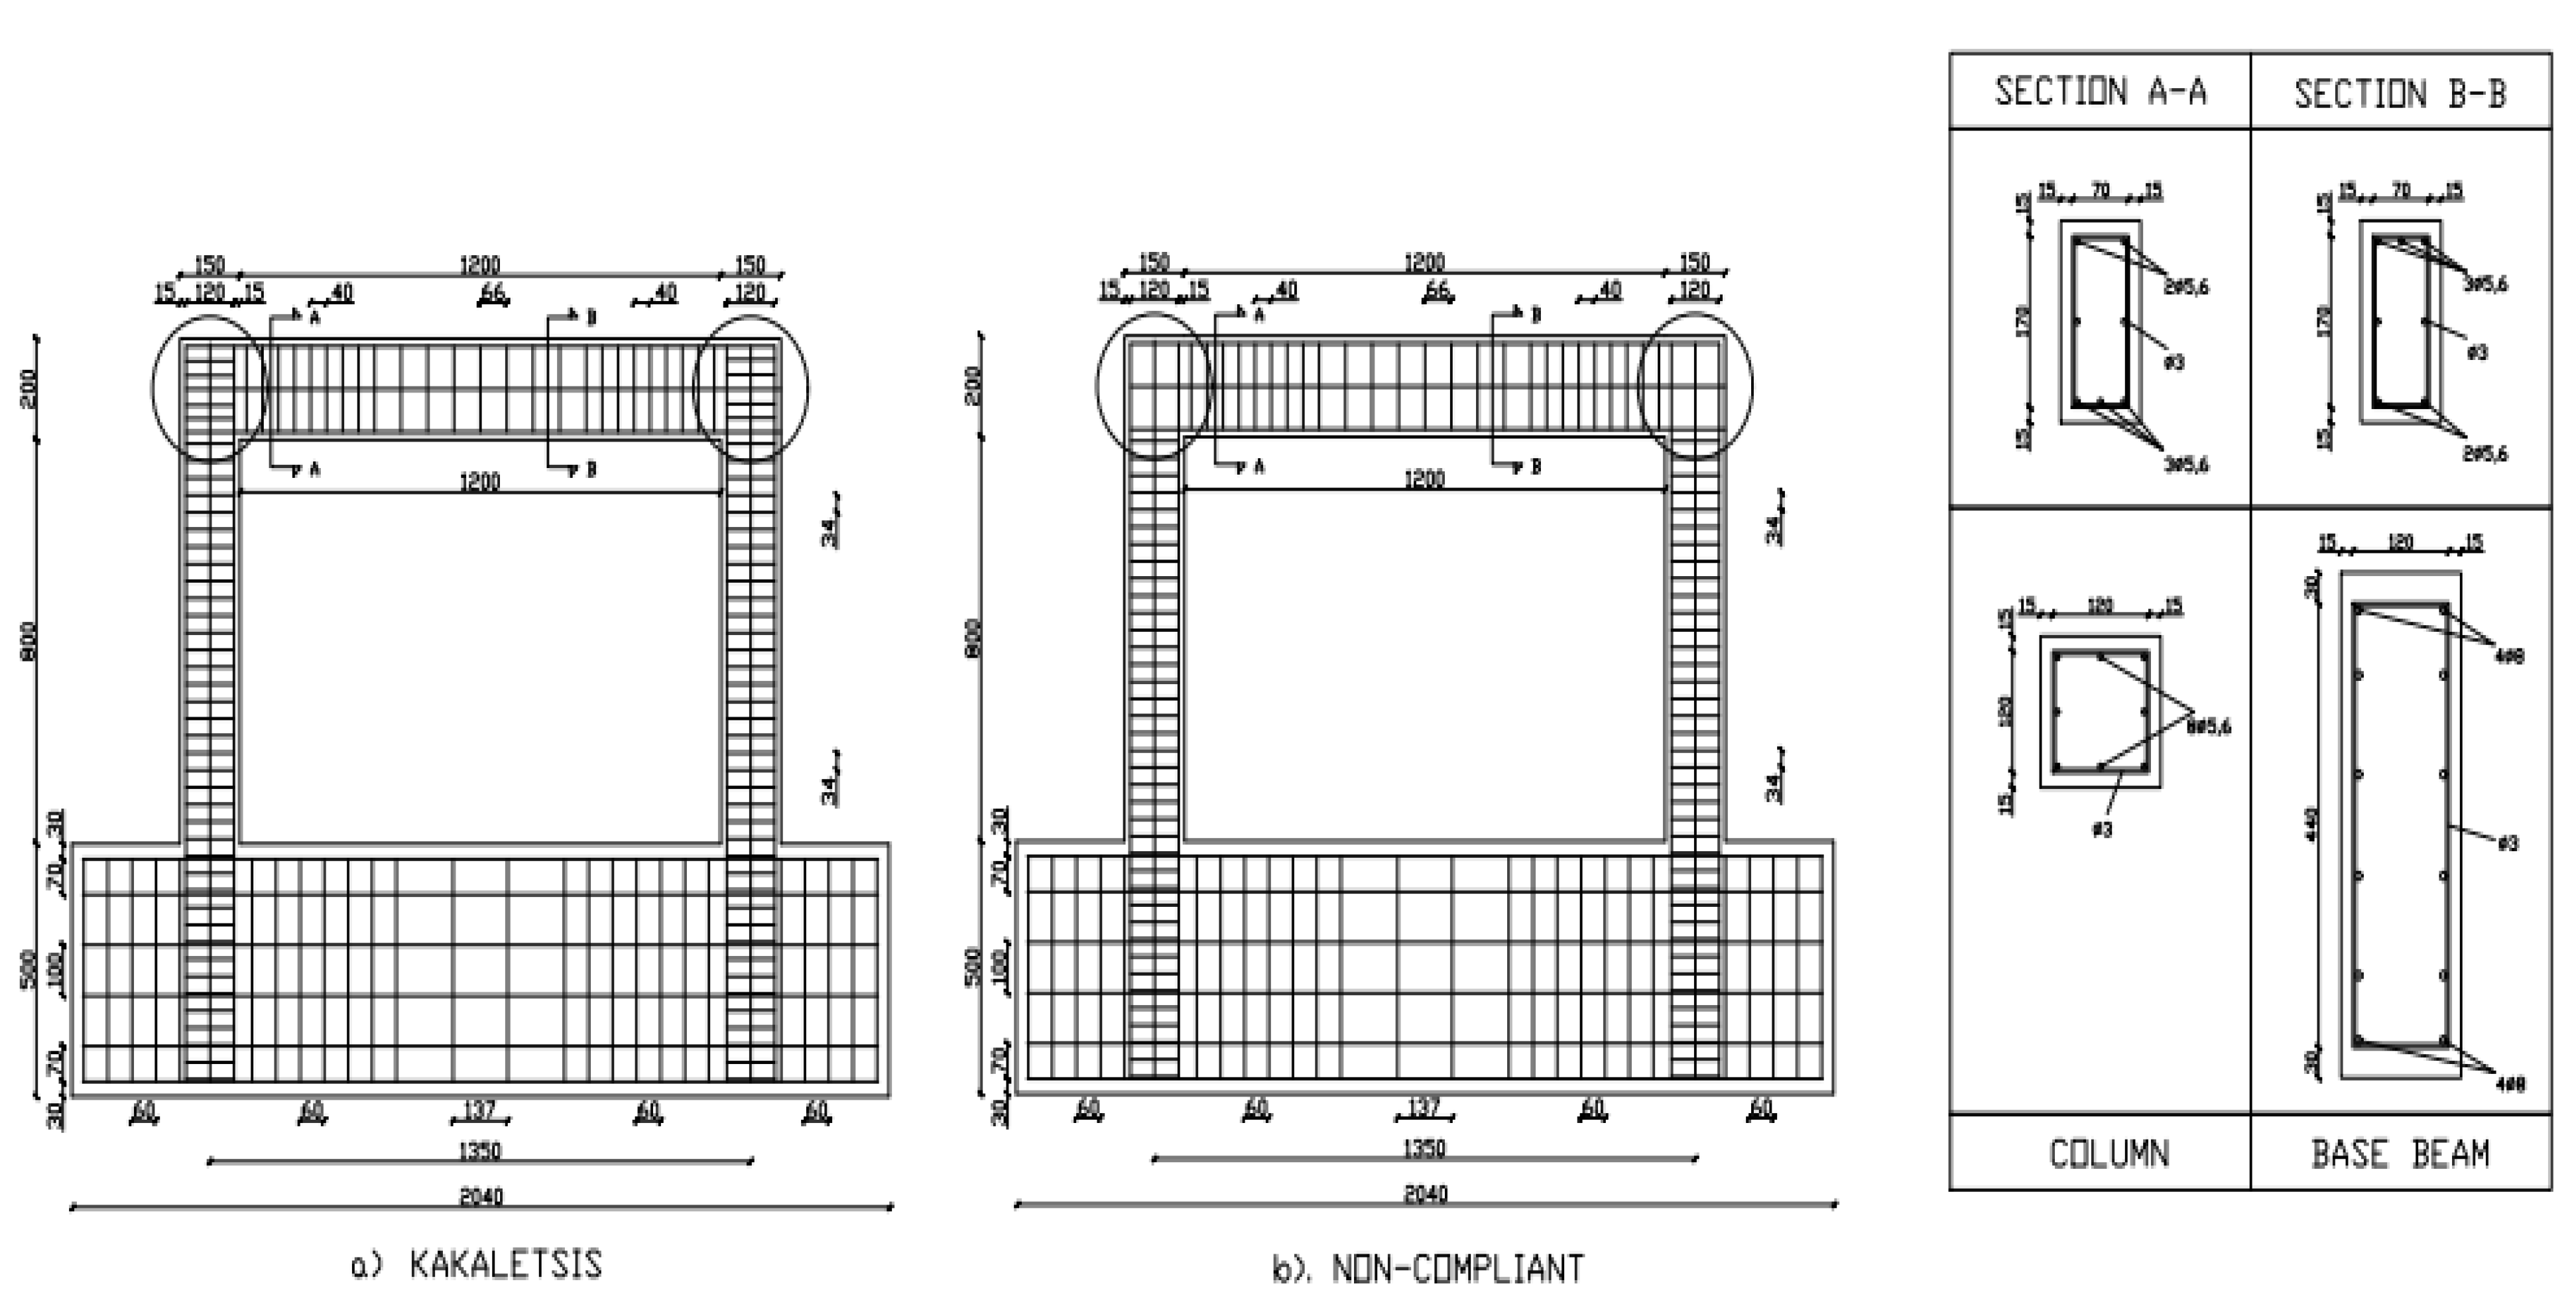
Figure 1. Numerical test object model of (a) Kakaletsis as control (b) non-compliant joint.
Preprints 71899 g001
Figure 2. Bond stress-slip model CEB-FIP 1990.
Preprints 71899 g002
Figure 3. Graph of load and displacement models (a) Kakalestsis and (b) Non-compliant.
Preprints 71899 g003
Figure 4. Reinforcement stress monitoring points in (a) Kakalestis model and (b) Non-compliant model.
Preprints 71899 g004
Figure 5. Step – Steel Reinforcement Stress relationship.
Preprints 71899 g005
Figure 6. Crack pattern and failure model (a) Kakaletsis model and (b) Non-compliant model.
Preprints 71899 g006
Figure 6. Capacity spectrum curves in (a) Kakaletsis model and (b) Non-compliant model.
Preprints 71899 g007
Figure 7. Fragility curve of the test object model (a) Kakaletsis and (b) Non-compliant based on the Hazus Method.
Preprints 71899 g008
Table 1. Parameters defining the mean bond stress-slip relationship of ribbed bars (acoording to Eqs (1 -4).
1 2 3 4 5 6
Pull-out (PO) Splitting (SP)
ε s < ε s , y ε s < ε s , y
Good bond condition All other bond condition Good bond condition All other bond condition
Unconfined Stirrups Unconfined Stirrups
τ b   m a x 2.5 f c m 1.25 f c m 2.5 f c m 2.5 f c m 1.25 f c m 1.25 f c m
τ b u ,   s p l i t - - 7.0 f c m 25 0.25 8.0 f c m 25 0.25 5.0 f c m 25 0.25 5.5 f c m 25 0.25
τ b   m a x 3.733 1.867 12.306 12.306 6.153 6.153
τ b u ,   s p l i t - - 6.945 7.938 4.961 5.457
S1 1.0 mm 1.8 mm s ( τ b u ,   s p l i t ) s ( τ b u ,   s p l i t ) s ( τ b u ,   s p l i t ) s ( τ b u ,   s p l i t )
S2 2.0 mm 3.6 mm S1 S1 S1 S1
S3 cclear1) 7 mm 3 mm 1.2 S1 0.5 Cclear1) 1.2 S1 0.5 Cclear1)
a 0.4 0.4 0.4 0.4 0.4 0.4
τ b f 0.4 τ m a x 0.4 τ m a x 0 0.4 τ b u ,   s p l i t 0 0.4 τ b u ,   s p l i t
Cclear1) is the clear distance between ribs.
Table 2. Numerical model parameters.
Materials Numerical model Parameters
Concrete 3D Non-Linear Cementitious f’cU = 28.51 MPa, ft= 3.31 MPa, E= 2.510E+04 MPa
Reinforcement Bilinear with Hardening E = 2.000E+5 MPa,fy = 390.475 MPa ft = 516.70 MPa εlim =0.05Transversal bars fy = 212.200 MPa, ft = 321.07 MPa
Plate 3D BiLinear Steel Von Mises, fy 550 MPa E = 2.000E+05, ν = 0.300 fy = 550 MPa
Spring Elastic, Stiffness 20.000 MPa Initial stiffness K = 20 MPa
Bond for Reinforcements CEB-FIP Model Code 1990 Kakaletsis = Good, NC = Poor
FE Mesh Mesh type Quadrilaterals Size 20 mm x 20 mm
Table 3. Load carrying capacity and Displacement of the structures.
Structural Model Maximum load (kN) Displacement (mm)
Yield Peak Load Collapse Yield Peak Load Collapse
Kakaletsis (KK) 40.77 46.01 9.78 9.17 14.62 35.32
Non-compliant (NC) 33.90 34.03 10.69 11.06 12.30 31.33
Table 4. Description of structural damage state of reinforced concrete frame (C1).
Damage State Description of the structural damage
Slight (DS1) Flexural or shear type hairline cracks in some beams and colums near joints or within joints
Moderate (DS2) Most beams and columns exhibit hairline cracks. In ductile frames some of the frame elements have reached yield capacity indicated by larger flexural cracks and some concrete spalling. Nonductile frames may exhibit lager shear cracks and spalling
Extensive (DS3) Some of the frame elements have reached their ultimate capacity indicated in ductile frames by large flexural cracks, spalled concrete and buckled main reinforcement; nonductile frame elements may have suffered shear failures or bond failures at reinforcement splices, or broken ties or buckled main reforcement in columns which may result in partial collapse
Complete (DS4) Structure is collapsed or in imminent danger of collapse due to brittle failure of nonductile frame elements or loss of fame stability. Approximately 13%(lowrise), 10%(mid-rise) of the total area of C1 buildings with Complete damage is expected to the collapsed.
Table 5. The damage limit state of the current model structures.
Model DS1
(Slight)
DS2
(Medium)
DS3 (Extensive) DS4 (Complete)
Sd Sa Sd Sa Sd Sa Sd Sa
Kakaletsis 0.1372 4.3383 0.3702 7.2290 0.4012 7.2479 0.9692 1.5408
Non-compliant 0.1165 3.4625 0.3190 5.3402 0.3547 5.3607 0.8317 2.5882
Table 6. Structural uncertainty value.
Model Limit State Sd βM(ds) βC βD βTotal
Kakaletsis DS1 0.1372 0.4000 2.4223 0.4500 1.1611
DS2 0.3702 0.4000 2.4223 0.4500 1.1611
DS3 0.4012 0.4000 2.4223 0.4500 1.1611
DS4 0.9692 0.4000 2.4223 0.4500 1.1611
Non-compliant DS1 0.1165 0.4000 2.2187 0.4500 1.0756
DS2 0.3190 0.4000 2.2187 0.4500 1.0756
DS3 0.3547 0.4000 2.2187 0.4500 1.0756
DS4 0.8317 0.4000 2.2187 0.4500 1.0756
Table 7. Discrete Damaged on Kakaletsis Model.
Limit State DBE = 0.142g MCE = 0,213g
Probability Discrete Damage Probability Discrete Damage
Undamaged 48.78% 35.21%
Slight 51.22% 30.72% 64.79% 33.05%
Medium 20.49% 1.91% 31.74% 2.43%
Extensive 18.58% 13.67% 29.31% 19.70%
Complete 4.92% 4.92% 9.61% 9.61%
Table 8. Discrete Damaged on The Non-compliant Model.
Limit State DBE = 0.142g MCE = 0.213g
Probability Discrete Damage Probability Discrete Damage
Undamaged 42.67 % 28.71 %
Slight 57.33 % 34.71 % 71.29 % 35.88 %
Medium 22.62 % 2.86 % 35.41 % 3.60 %
Extensive 19.76 % 14.74 % 31.81 % 21.52 %
Complete 5.03 % 5.03 % 10.29 % 10.29 %
Disclaimer/Publisher’s Note: The statements, opinions and data contained in all publications are solely those of the individual author(s) and contributor(s) and not of MDPI and/or the editor(s). MDPI and/or the editor(s) disclaim responsibility for any injury to people or property resulting from any ideas, methods, instructions or products referred to in the content.
Copyright: This open access article is published under a Creative Commons CC BY 4.0 license, which permit the free download, distribution, and reuse, provided that the author and preprint are cited in any reuse.
Prerpints.org logo

Preprints.org is a free preprint server supported by MDPI in Basel, Switzerland.

Subscribe

© 2024 MDPI (Basel, Switzerland) unless otherwise stated