Introduction
The primary symptoms of SARS-CoV-2 infection are similar to those of other coronaviruses, such as fever, cough, and fatigue, and tend to present as flu-like symptoms [
1]. However, certain high-risk groups, such as the elderly and those with preexisting medical conditions, are at a greater risk of experiencing severe respiratory issues, including acute respiratory distress syndrome, interstitial pneumonia, and multiple organ failure, which may result in varying levels of shortness of breath and specific radiological signs [
2,
3].
Bilateral interstitial infiltration is the most prevalent manifestation of COVID-19 in the lungs, which can significantly disrupt the balance between ventilation and perfusion [
4,
5]. In severe cases, this can lead to respiratory failure and even death. While chest computed tomography (CT) has been the preferred diagnostic and monitoring tool for COVID-19, logistical challenges associated with patient transportation and disinfection of CT rooms have posed significant challenges. Moreover, chest CT is not readily available in many low- and middle-income countries, further limiting its utility as a diagnostic tool [
6,
7].
In addition, in recent studies, attention has been drawn to the importance of computed tomography of the chest, since in examined COVID-19) patients with a false-negative PCR result [
8,
9], the sensitivity of chest CT was 98% and chest CT is of great importance. not only for the diagnosis of COVID-19, but also for monitoring the progression and severity of the disease and assessing the therapeutic effect. However, due to the problems of infection control associated with the transportation of the patient, as well as the disinfection of chest CT rooms after examining the patient and the lack of availability of chest CT, created some kind of obstacles [
10,
11].
Furthermore, for the diagnosis of pneumonia, chest CT is not always available in remote regions, and researchers have proposed using passive microwave radiometry (MWR) as an alternative diagnostic method, which was previously used in practical medicine [
12,
13].
MWR is a non-invasive technique that measures the temperature of internal tissues using microwave radiometry and skin temperature measurements obtained through infrared thermometry. It is a safe and side-effect-free technique, as it only measures the patient's own radio-thermal radiation. The system is accurate to within ±0.2 °C and can detect temperature differences in soft tissues at depths of 3 to 7 cm. The measurement area is usually 3–5 cm in diameter [
15]. While MWR is not yet widely used, it has the potential to be an effective substitute for chest CT, particularly in regions where CT is not easily accessible. We study the experience of using the MWR method as a diagnostic screening in patients with COVID-19 complicated pneumonia.
Materials and Methods
A study was approved by the Bioethics Committee (protocol N4 November 11, 2021) . The study included 142 patients from the main group who were admitted to the emergency department and diagnosed with COVID-19 complicated pneumonia between June 2020 and June 2021. The patients' age ranged from 20 to 87 years, with 67 men and 75 women. A control group of 50 healthy individuals, consisting of 24 men and 26 women, ranging in age from 20 to 70 years, was also included. Before the study, each participant signed informed consent.
To collect data, skin and lung temperatures were measured at 14 points on each side of the chest, with 2 additional reference points, using a method previously described [
14]. The lung temperature data were obtained using the MWR2020 device (formerly RTM-01-RES) MMWR Ltd, Edinburgh, UK, which has a CE Class I certification.
To ensure safety, strict and standardized procedures were implemented to protect the operators and decontaminate the instruments during and after the procedure [
16]. The time difference between lung MWR and chest CT measurements in patients with COVID-19 complicated pneumonia was no more than 48 hours.
Patients who did not exhibit clinical presentation of COVID-19, tested negative for reverse transcriptase polymerase chain reaction (RT-PCR) for SARS-CoV-2, or had unconfirmed bilateral pneumonia on chest CT were excluded from the main group. The patients from the control group were excluded if any member exhibited symptoms or complaints or tested positive for RT-PCR for SARS-CoV-2.
All participants in the main group underwent clinical examinations with auscultation of the lungs, body temperature measurement, laboratory tests including C-reactive protein (CRP), chest CT, MWR of the lungs and RT-PCR test for SARS-CoV-2. It's important to note that the medical rooms used for the study were designed according to hygienic standards and microclimatic conditions. The humidity in the room ranged from 40% to 50% for all measurements, and the room temperature was maintained between 22–25 °C to ensure the accuracy and consistency of the results.
IBM SPSS Statistics (USA) was used to perform the statistical analysis. Receiver operating characteristics (ROC) curves were employed to determine the most effective classifier for diagnosis, with the area under the curve (AUC) analyzed. The logistic regression model was used as the predictive model, and its sensitivity and specificity were calculated, along with the coefficients of determination of Cox-Snell and Nagelkerke. The Hosmer-Lemeshow test and the Chi-square test were conducted to evaluate the significance of the final model. Additionally, the Pearson correlation coefficient was used to measure the correlation between the predictors.
ROC curves provide an estimate of the overall accuracy of a diagnostic test by plotting the sensitivity against the false positive rate for a range of cut-off values. The AUC is a summary statistic of the ROC curve, with a higher value indicating better diagnostic performance.
Logistic regression models are frequently used to predict the probability of an outcome, such as the presence or absence of a disease. Sensitivity and specificity are important measures for assessing the model's ability to identify positive and negative cases, while the Cox-Snell and Nagelkerke coefficients of determination provide insight into the proportion of variation in the outcome explained by the predictor variables. The Hosmer-Lemeshow test evaluates the goodness-of-fit of the model, while the Chi-square test assesses its overall significance.
The Pearson correlation coefficient measures the linear relationship between two variables, ranging from −1 to 1, with 0 indicating no correlation. It helps to determine the strength and direction of the relationship between predictor variables and can reveal any potential interactions or dependencies between them.
Results
The data obtained from MWR includes variations in temperature between the skin and internal (lung) temperatures. The measurements were taken at a total of 30 points on the chest, with each point recording both skin and lung temperatures.
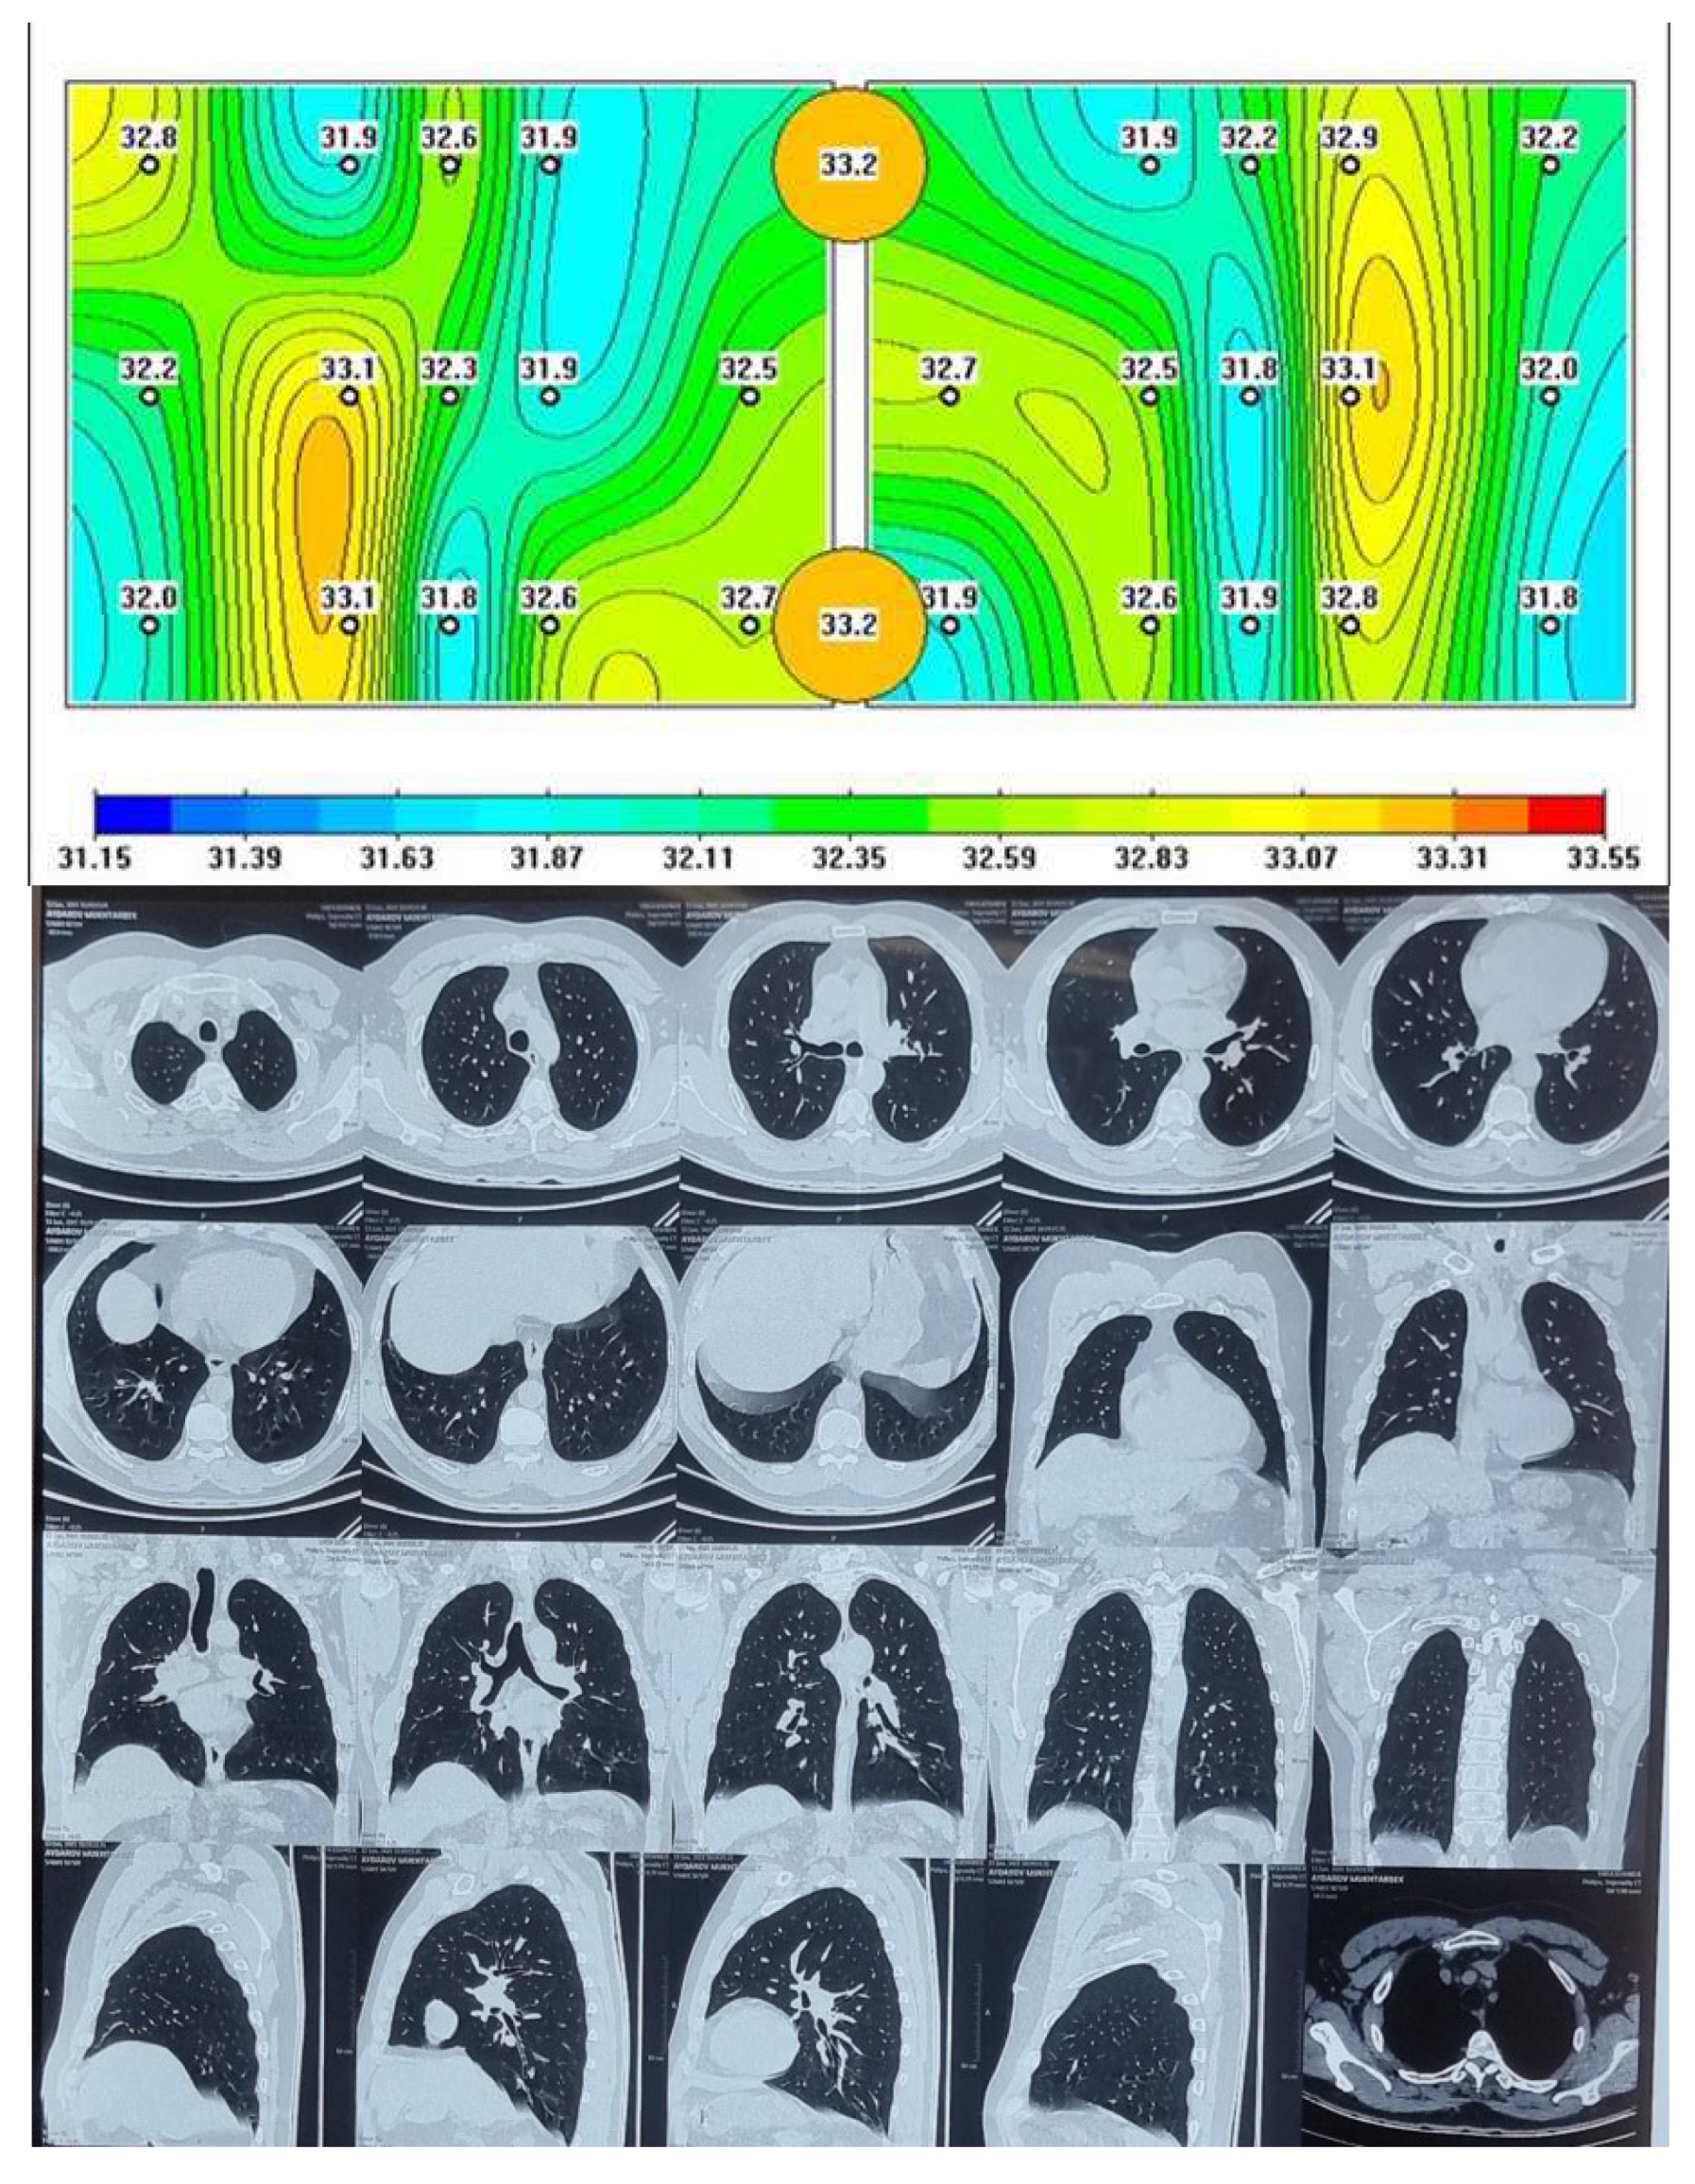
Figure 1.
Passive microwave radiometry image and chest CT of the healthy person.
Figure 1.
Passive microwave radiometry image and chest CT of the healthy person.
The lungs of a healthy person are shown, where red areas of active inflammation are not visible, which is confirmed by a chest CT.
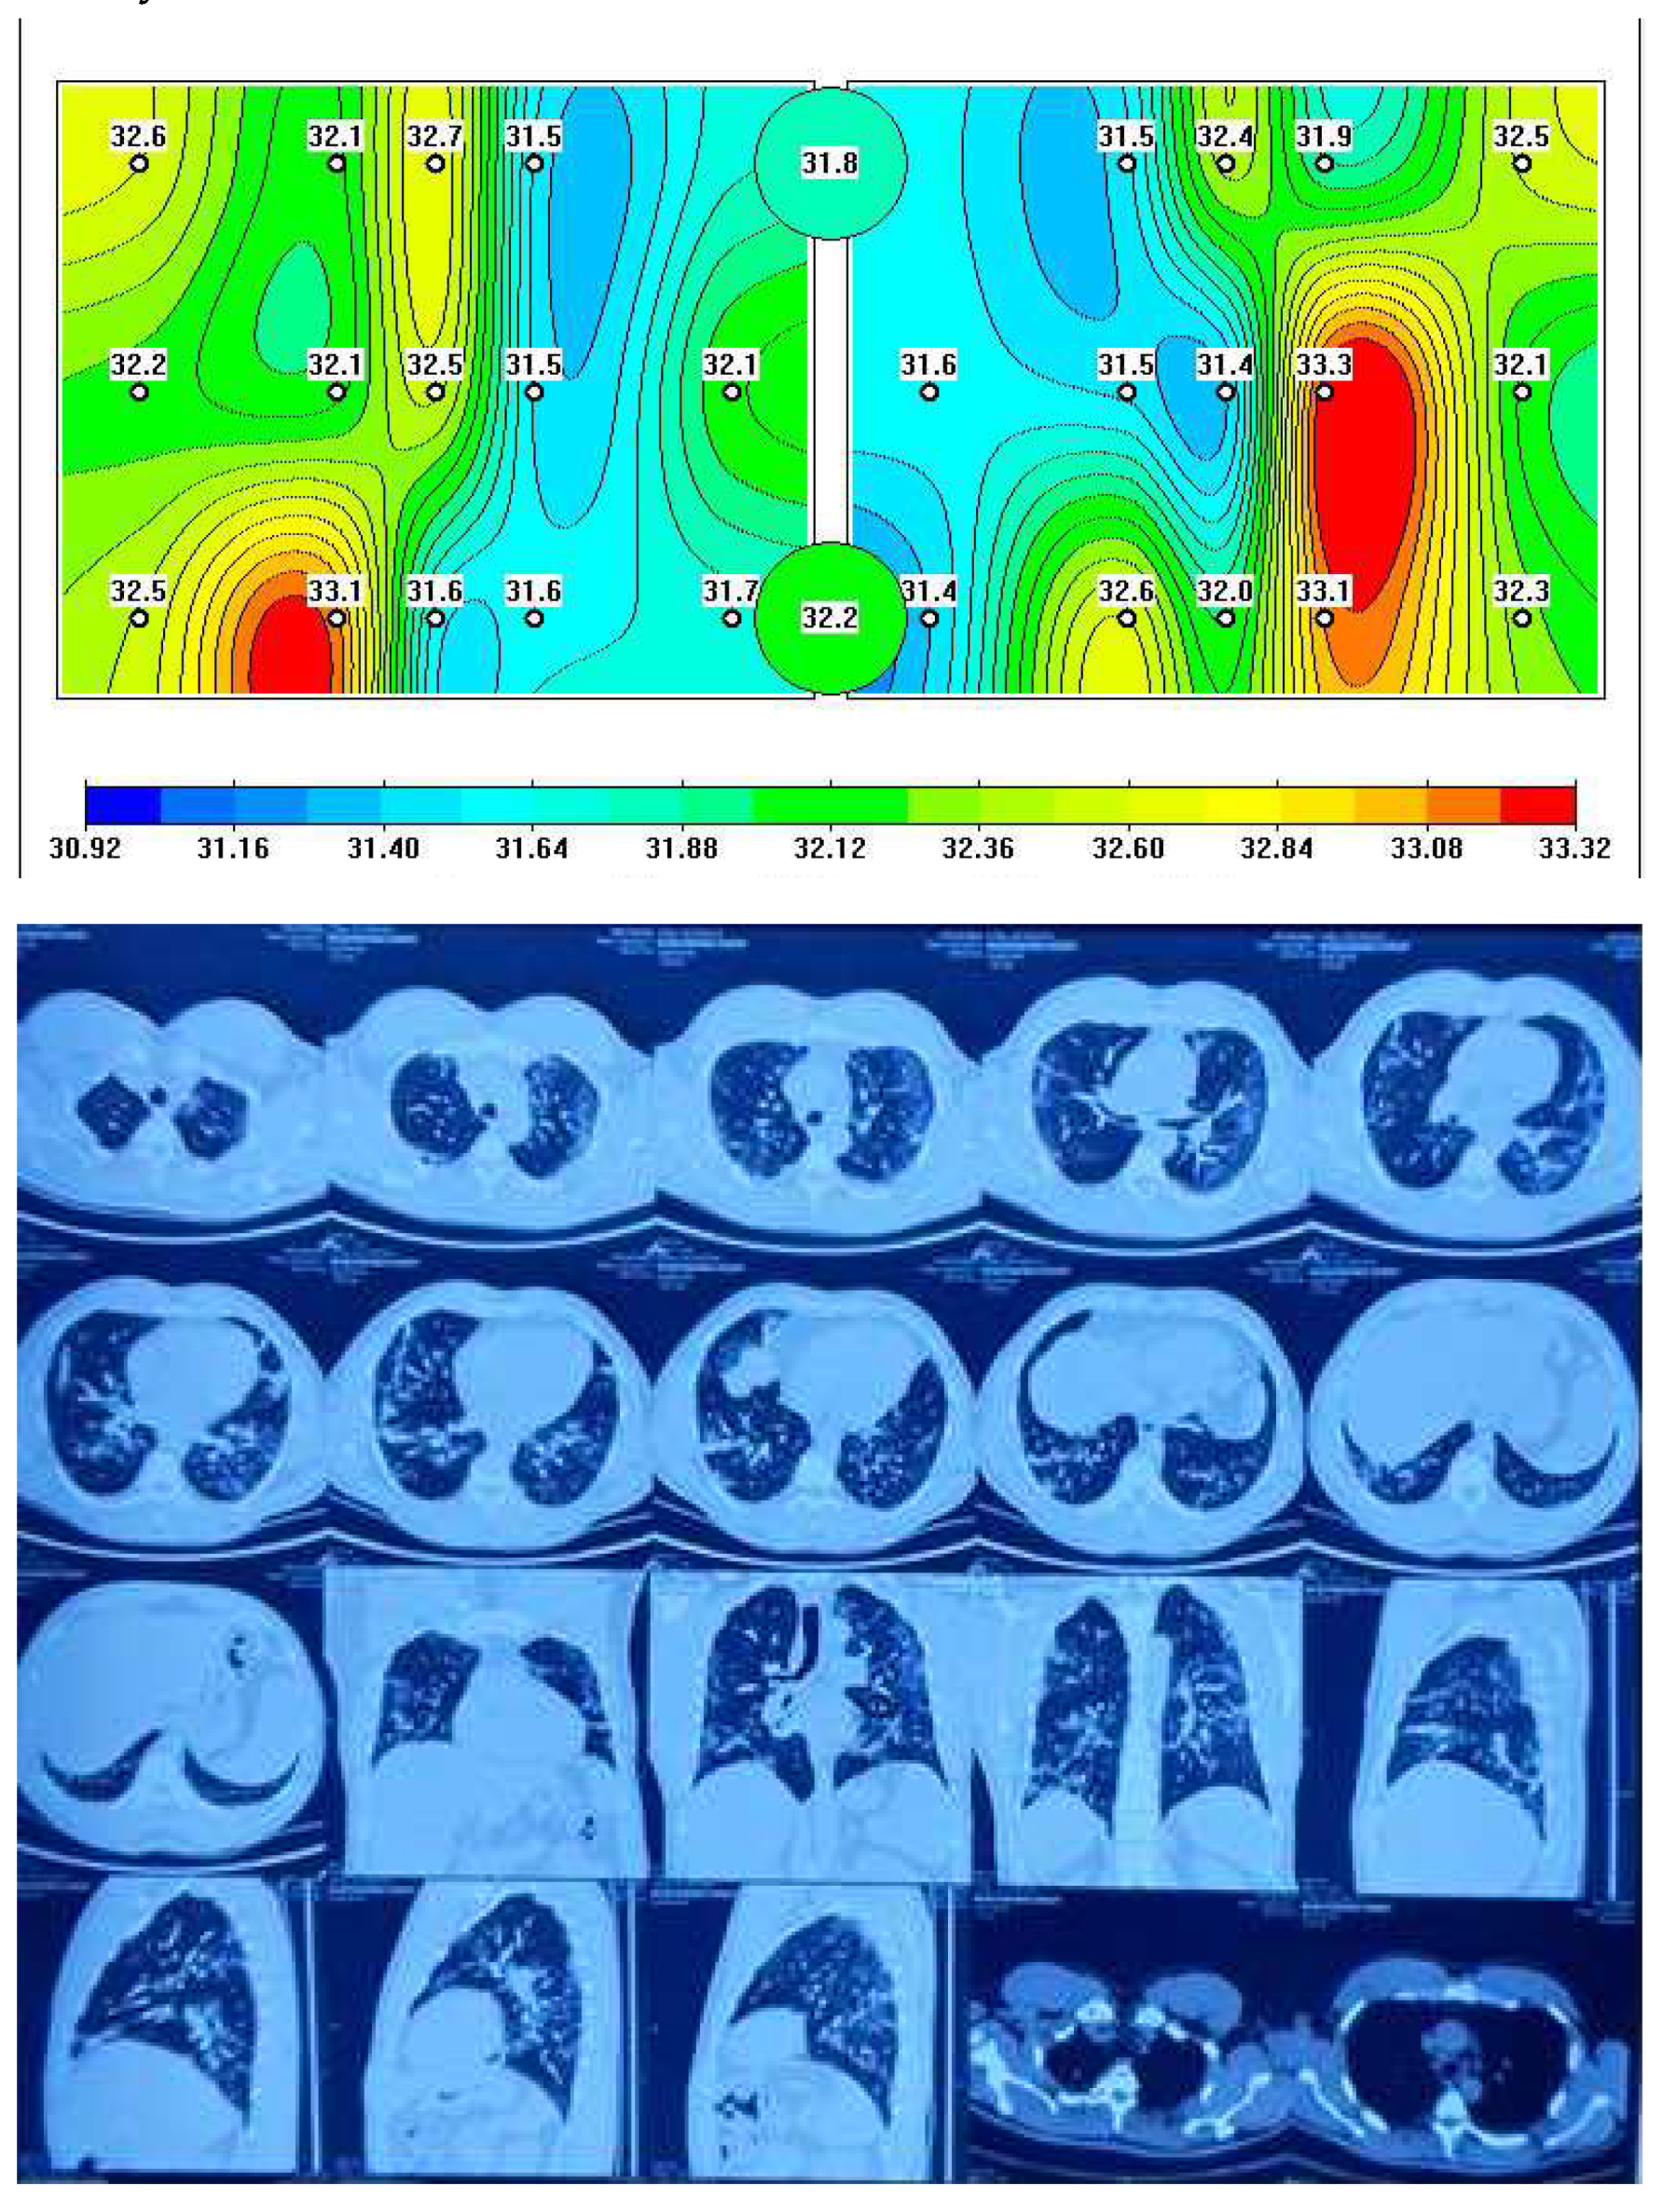
Figure 2 depicts a representative MWR image of COVID-19 pneumonia, where a significant difference in core temperature is observed in blue (indicating low temperature due to fibrosis) and red areas (indicating high temperature due to inflammation) in the left and right lung, which is similarly detected in chest CT as ground-glass opacity (GGO).
As anticipated, temperature differences were observed between healthy individuals and COVID-19 patients with complicated pneumonia.
The MWR lung study generated a large volume of temperature data, and to identify COVID-19 pneumonia, we employed ROC analysis.
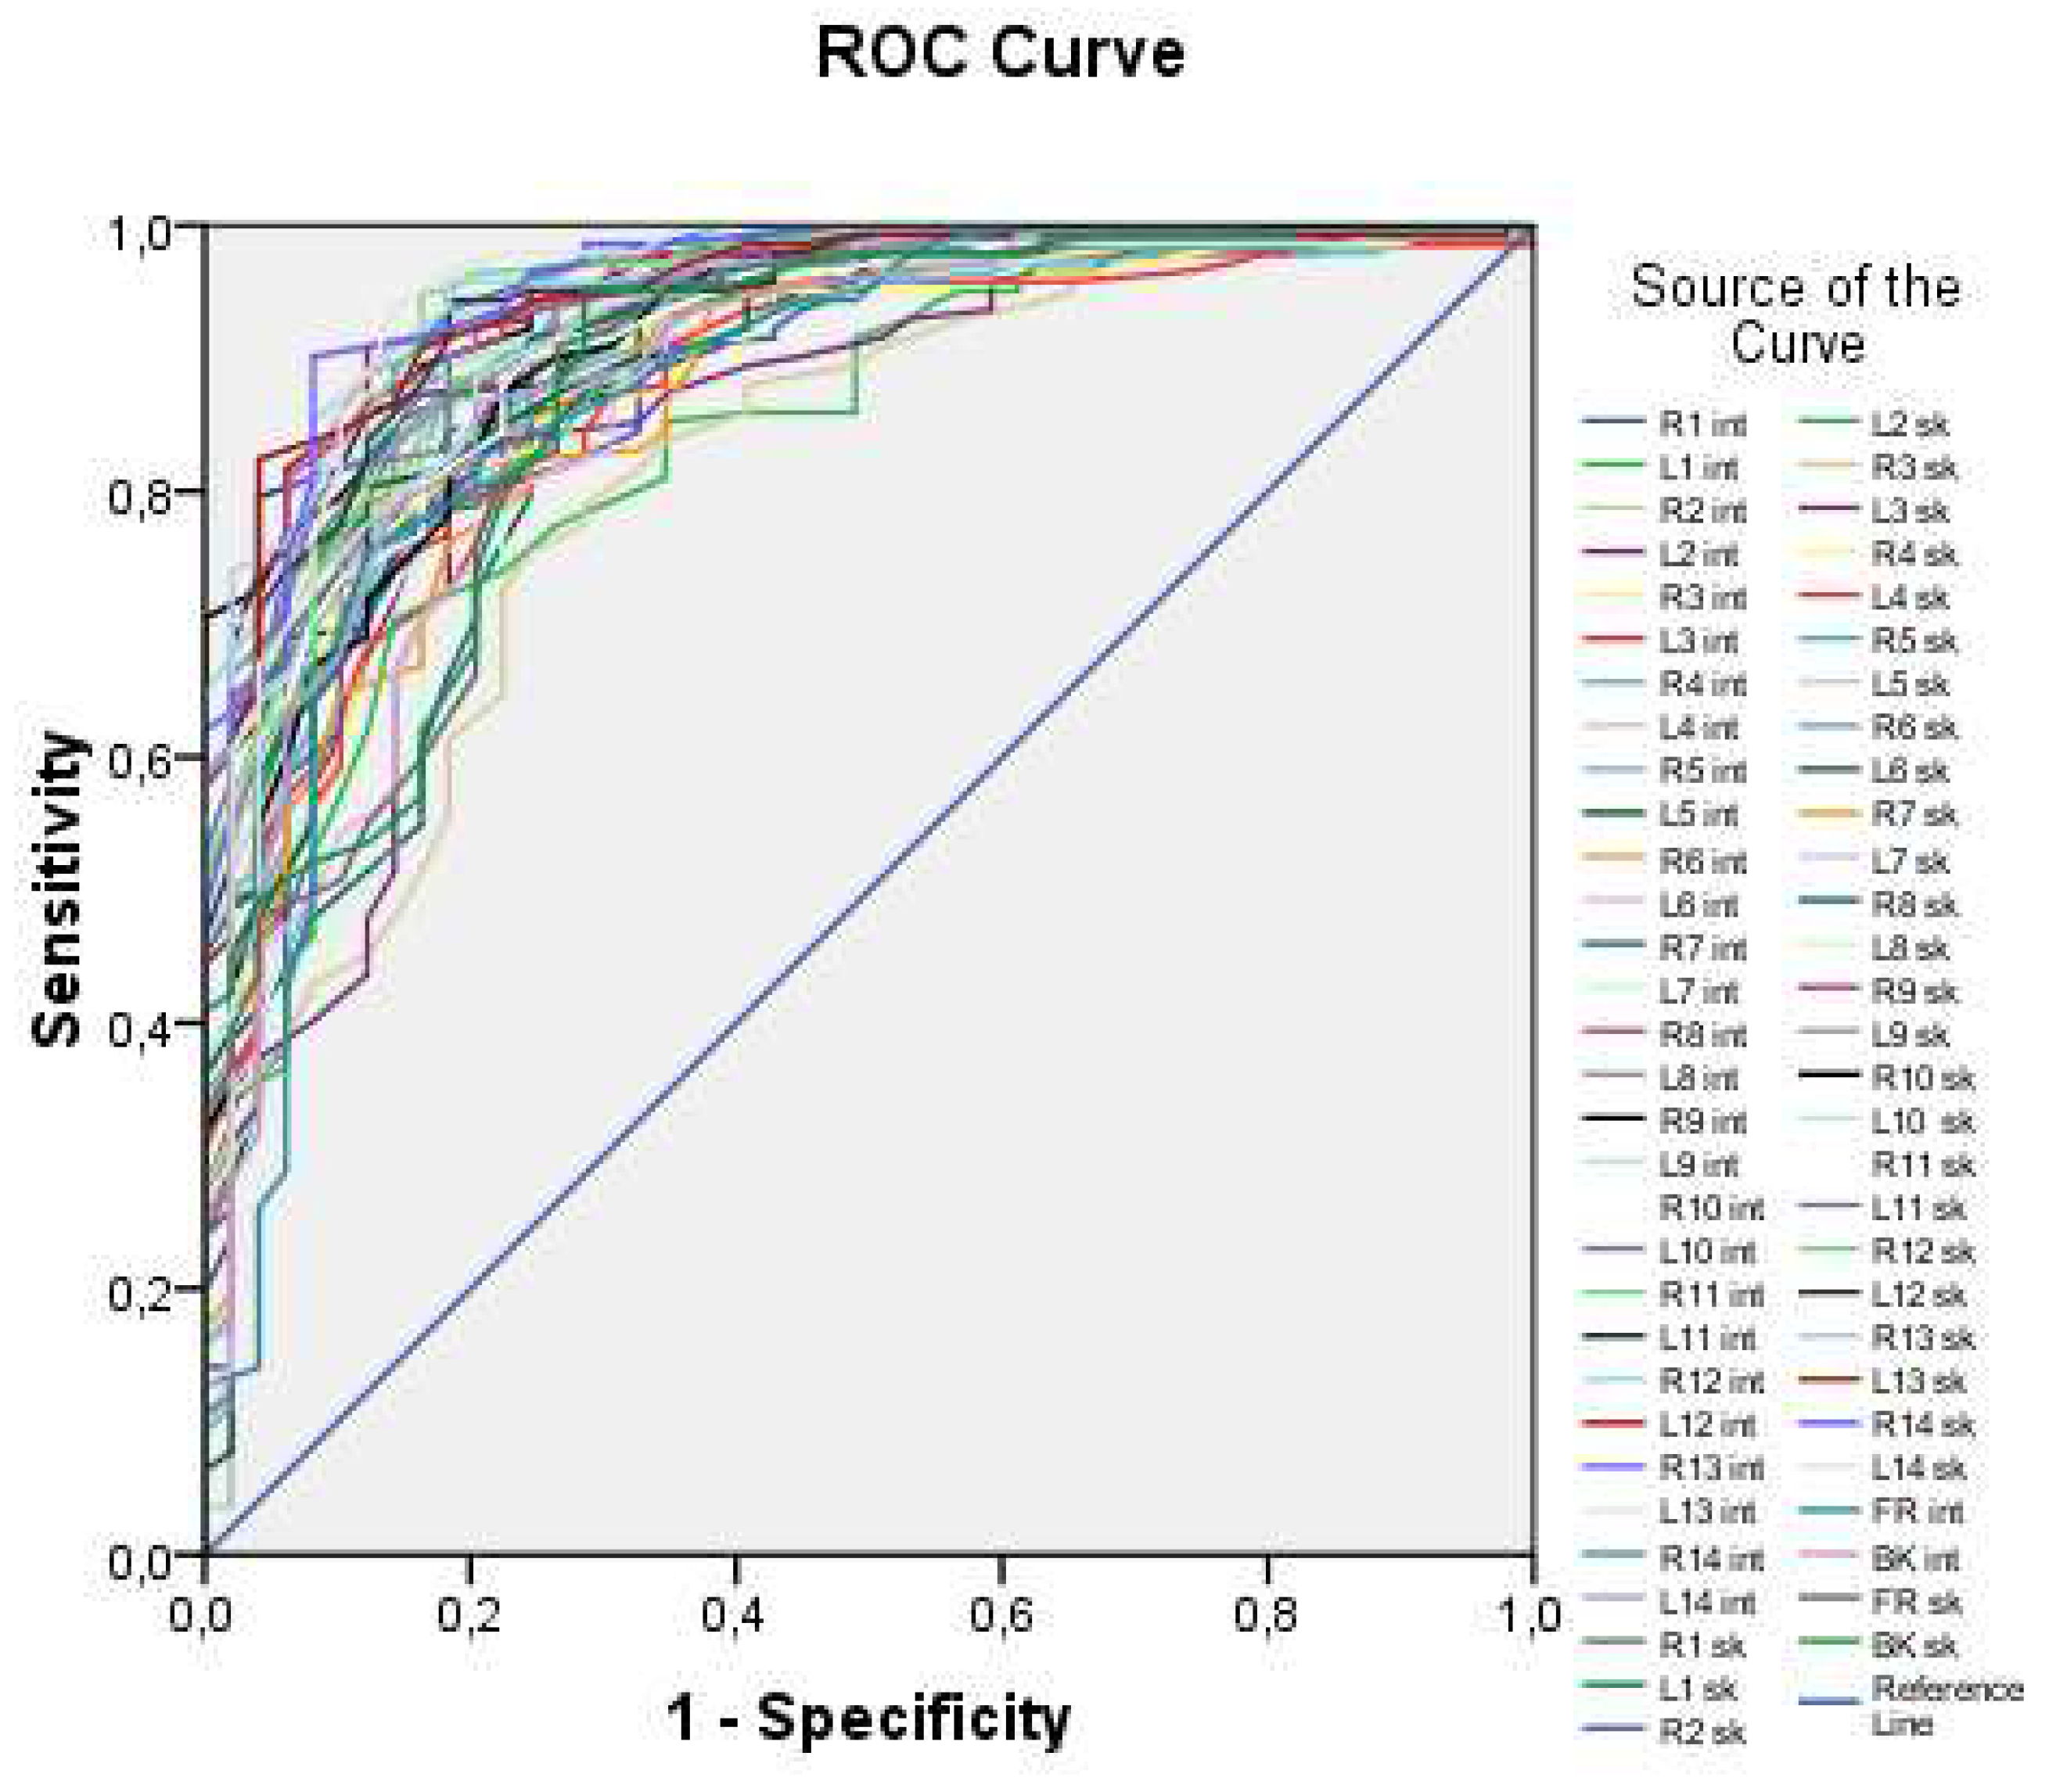
Figure 3 illustrates all 60 ROC curves generated based on measuring both external (skin) and internal (lung) temperatures at each of the examined points.
The ROC curves in
Figure 1 demonstrate high values of the area under the curve, ranging from 0.816 to 0.956, indicating that temperature values can be used as a predictor for the logistic model. However, it is impractical to work with all 60 predictors, as this approach lacks generality. Thus, an integral variable that can be applied in any case needs to be formulated. To achieve this, average skin and internal temperature values were taken, providing an average over surface points and internal points, respectively. These integral variables offer a more generalizable approach compared to working with individual temperature values at each point.
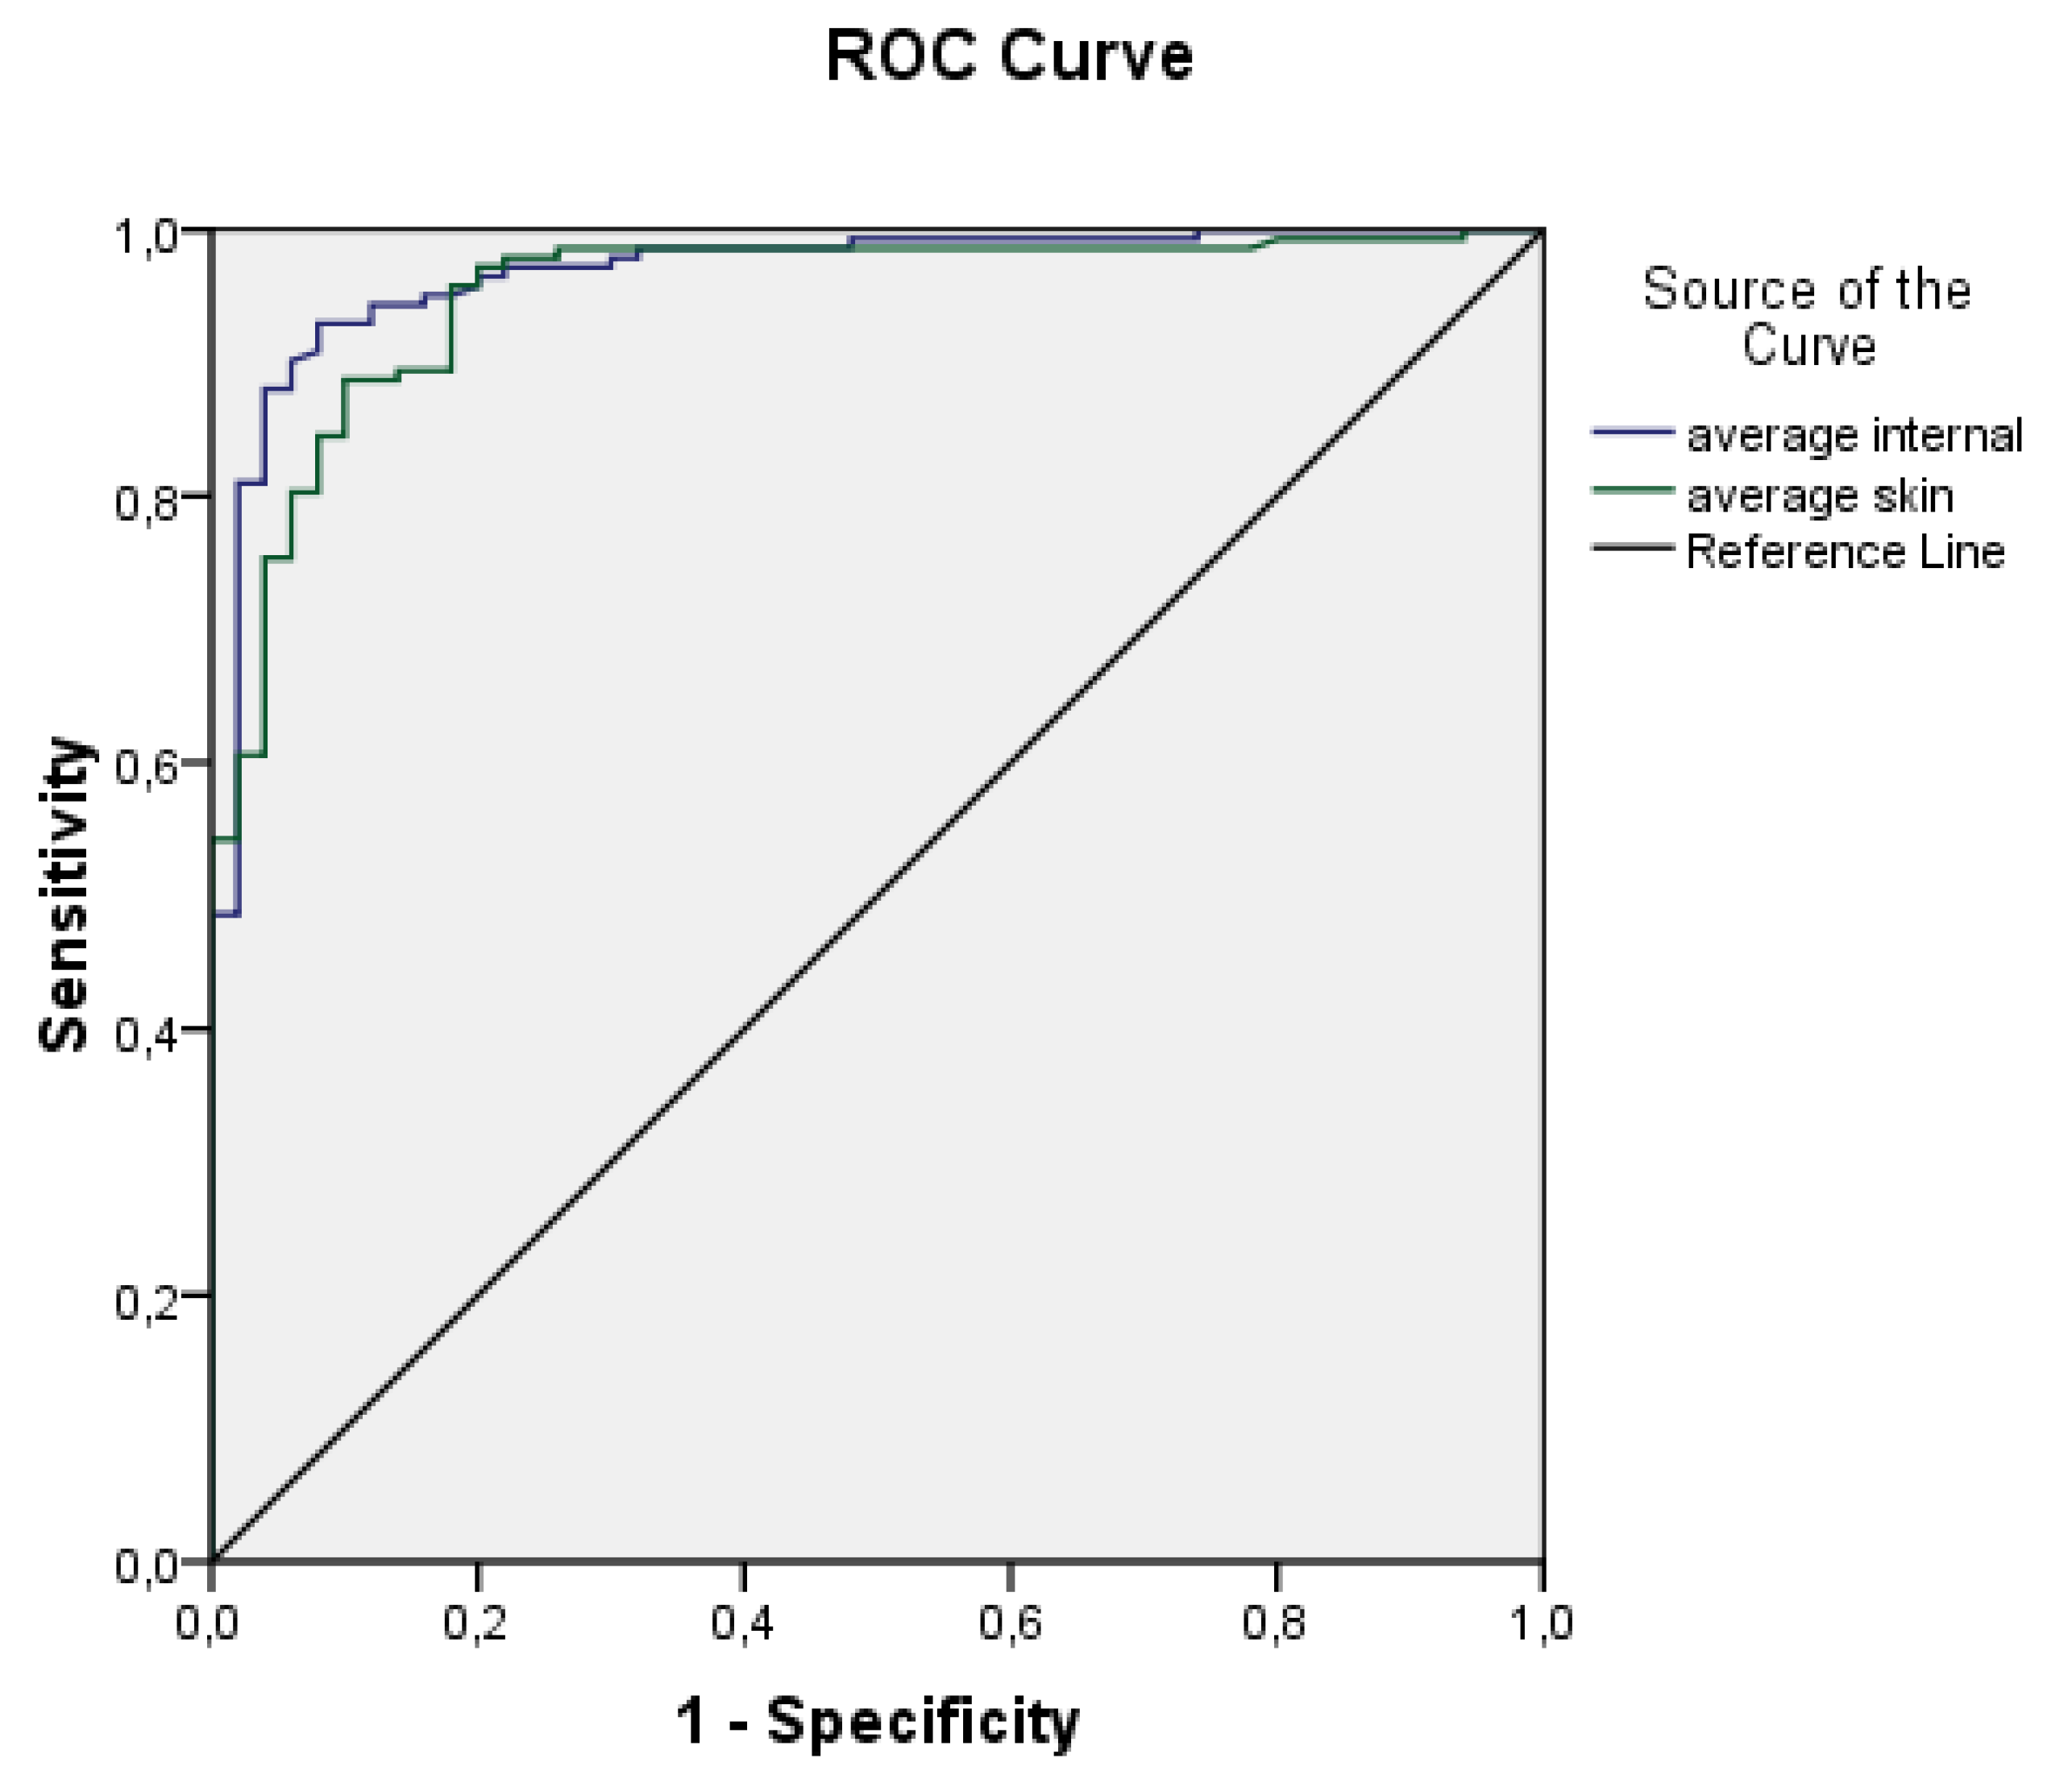
ROC curves for the average internal and external temperatures are displayed in
Figure 4. Based on the plot and the parameters presented in
Table 1, it could be concluded that both variables are highly effective predictors.
Both ROC curves exhibit high values of the area under the curve and relatively narrow confidence intervals. The area under the curve for average internal temperature is 0.967 ± 0.013 (95% CI 0.941–0.993), while for average skin temperature it is 0.951 ± 0.016 (95% CI 919–0.983). These findings suggest that both variables are effective predictors. Consequently, a logistic regression model was developed using the aforementioned predictors, and its parameters are reported in
Table 2 and
Table 3.
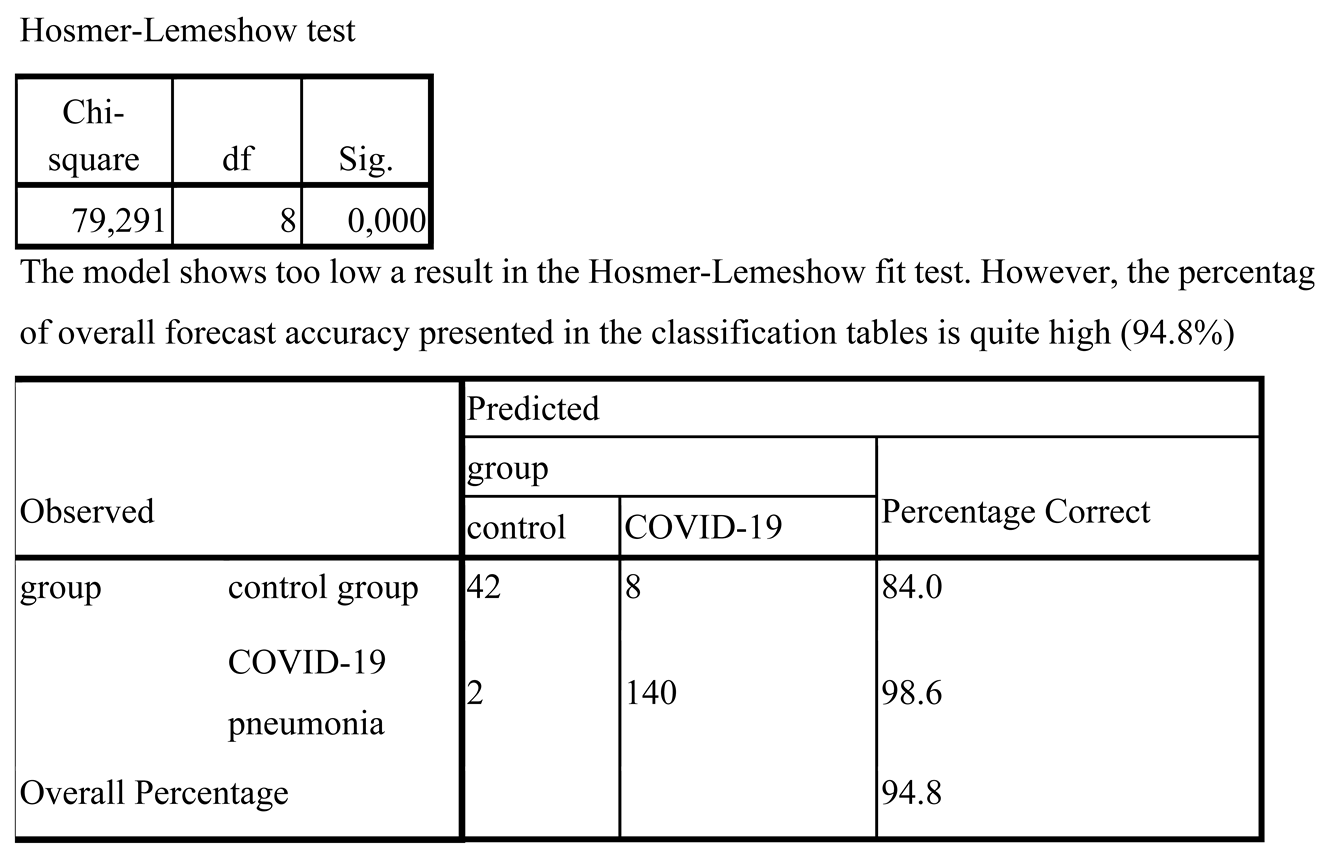
The model achieved sensitivity of 98.6% and a specificity of 84.0%. It is important to ensure that the predictors used in logistic regression are not affected by multicollinearity, where the independent variables exhibit a strong correlation with each other (r > 0.9) [
17]. However, in our study, we found only a moderate correlation (r = 0.663) between the predictors, which allowed us to proceed with building the model without accounting for this correlation. The specific predictions were made using the following equation
The provided equation can be used to calculate the probability (P) of a patient has a pneumonia caused by COVID-19. On the other hand, the probability of being healthy can be calculated as 1-P. The equation is formulated as:
—average skin temperature
—average internal temperature
This equation can be applied in practical situations for diagnosing COVID-19 pneumonia.
Discussion
The technique of using MWR (microwave radiometry) to diagnose pneumonia in COVID-19 patients has shown reasonable precision. However, it is important to keep in mind that chest CT scans remain the primary method for diagnosing COVID-19 pneumonia with complications and have shown the best efficacy [
18]. Despite this, chest CT scans are expensive and have limitations, such as immobility. Therefore, it is worth noting that mobile chest x-ray methods have also demonstrated positive attributes [
19]. MWR is a simple and harmless diagnostic test that provides a convenient option for examining the lungs of COVID-19 pneumonia patients, both at the bedside and in other field settings. However, it is essential to note that MWR can only detect temperature differences in the peripheral zones of the lungs, so it may not be effective in investigating deep lung lesions [
15]. Conducting MWR studies in patients with complicated COVID-19 pneumonia can provide healthcare providers with diagnostic support to prevent and manage infections associated with this pandemic.
Conclusions
The MWR (microwave radiometry) of the lungs has emerged as a promising diagnostic tool for pneumonia in COVID-19 patients, especially when chest CT is not feasible or unavailable. MWR is non-invasive, harmless, and easy-to-use, making it a more convenient option for examining the lungs of COVID-19 pneumonia patients, both at the bedside and in field settings. While chest CT is considered the gold standard for diagnosing COVID-19 complicated pneumonia and has shown high accuracy, it has some drawbacks such as cost and limited mobility.
However, it is important to note that MWR has its limitations, including its ability to only detect temperature differences in the peripheral zones of the lungs and may not be able to investigate deep lung lesions. Therefore, MWR should not be considered a substitute for chest CT in all cases but rather an alternative when chest CT is not feasible.
Despite its limitations, the study of MWR in patients with COVID-19 complicated pneumonia provides valuable diagnostic support to physicians in preventing and controlling infections related to the pandemic. In addition, MWR is a safer option than chest x-rays, which have been widely used in the past, since it does not involve radiation exposure. Therefore, the use of MWR in clinical practice may become more widespread in the future as a useful tool for diagnosing COVID-19 pneumonia.
References
- Di Wu, Tiantian Wu, Qun Liu, Zhicong Yang. The SARS-CoV-2 outbreak: what we know. International Journal of Infectious Diseases. 2020 May;94:44-48. Epub 2020 Mar 12. [CrossRef]
- Kai Liu, Ying Chen, Ruzheng Lin, Kunyuan Han. Clinical feature of COVID-19 in elderly patients: a comparison with young and middle-aged patients. Journal of Infection. 2020 Jun;80(6):e14-e18. [CrossRef]
- Mary A Lake. What we know so far: COVID-19 current clinical knowledge and research. Clin Med (Lond) 2020 Mar;20(2):124-127. [CrossRef]
- Wei-Jie Guan, Zheng-Yi Ni, Yu Hu, Wen-Hua Liang, Chun-Quan Ou, Jian-Xing He et al. Clinical characteristics of Coronavirus disease 2019 in China. N Engl J Med 2020 Apr 30;382(18):1708-1720. Epub 2020 Feb 28. [CrossRef]
- Sameera Al Johani, Ali H Hajeer . MERS-CoV diagnosis: an update. J. Infect. Public Health 2016 May-Jun;9(3):216-9. [CrossRef]
- Shuchang Zhou, Yujin Wang, Tingting Zhu, Liming Xia. CT features of coronavirus disease 2019 (COVID-19) pneumonia in 62 patients in Wuhan, China. AJR Am J Roentgenol. 2020 Jun;214(6):1287-1294. Epub 2020 Mar 5. [CrossRef]
- Chung M, Bernheim A, Mei X, et al. CT imaging features of 2019 novel coronavirus (2019-nCoV). Radiology February 2020;200230. [CrossRef]
- Xie X, Zhong Z, Zhao W, Zheng C, Wang F, Liu J (2020) Chest CT for typical 2019-nCoV pneumonia: relationship to negative RTPCR testing. Radiology. [CrossRef]
- Huang P, Liu T, Huang L et al (2020) Use of chest CT in combination with negative RT-PCR assay for the 2019 novel coronavirus but high clinical suspicion. Radiology. [CrossRef]
- Fang Y, Zhang H, Xie J et al (2020) Sensitivity of chest CT for COVID-19: comparison to RT-PCR. Radiology. [CrossRef]
- National Health Commission of the People’s Republic of China (2020) The diagnostic and treatment protocol of COVID-19. China. Available via http://www.gov.cn/zhengce/zhengceku/2020- 02/19/content_5480948.htm Accessed 3 Mar 2020.
- Goryanin I. et al. Passive microwave radiometry in biomedical studies //Drug Discovery Today. – 2020. – Т. 25. – №. 4. – С. 757-763.
- Raiko J., Koskensalo K., Sainio T. Imaging-based internal body temperature measurements: The journal Temperature toolbox //Temperature. – 2020. – Т. 7. – №. 4. – С. 363-388. [CrossRef] [PubMed]
- Batyr Osmonov, Lev Ovchinnikov, Christopher Galazis, Berik Emilov, Mustafa Karaibragimov, Meder Seitov, Sergey Vesnin, Alexander Losev, Vladislav Levshinskii, Illarion Popov, Chingiz Mustafin, Turat Kasymbekov, Igor Goryanin. Passive Microwave Radiometry for the Diagnosis of Coronavirus Disease 2019 Lung Complications in Kyrgyzstan. Diagnostics 2021, 11, 259. https://www.mdpi.com/journal/diagnostics. [CrossRef]
- Manual MMWR2020 (RTM-01-RES) www.mmwr.co.uk.
- A. Gogna, P. Yogendra, S.H.E. Lee, A. Aziz, E. Cheong, L.P. Chan, N. Venkatanarasimha, Diagnostic ultrasound services during the coronavirus disease (COVID-19) pandemic, Am. J. Roentgenol. (2020) 1–6.
- Sharashova E.E., Kholmatova K.K., Gorbatova M.A., Grjibovsky A.M. Application of multiple logistic regression analysis in healthcare using the SPSS statistical software package / Science and Healthcare. 2017. No. 4. pp. 5-26. [CrossRef]
- Ai T, Yang Z, Hou H, Zhan C, Chen C, Lv W, et al. Correlation of Chest CT and RT-PCR Testing in Coronavirus Disease 2019 (COVID-19) in China: A Report of 1014 Cases. Radiology 2020:200642. [CrossRef]
- Adam Jacobi, Michael Chung, Adam Bernheim, Corey Eber. Portable chest X-ray in coronavirus disease-19 (COVID-19): A pictorial review. Elsevie, 6 April 2020. [CrossRef]
|
Disclaimer/Publisher’s Note: The statements, opinions and data contained in all publications are solely those of the individual author(s) and contributor(s) and not of MDPI and/or the editor(s). MDPI and/or the editor(s) disclaim responsibility for any injury to people or property resulting from any ideas, methods, instructions or products referred to in the content. |
© 2023 by the authors. Licensee MDPI, Basel, Switzerland. This article is an open access article distributed under the terms and conditions of the Creative Commons Attribution (CC BY) license (http://creativecommons.org/licenses/by/4.0/).
