Preprint
Article

Experimental Investigation on the Stochastically Forced Rijke-Type Supercritical Thermoacoustic Systems

Altmetrics

Downloads

123

Views

65

Comments

0

A peer-reviewed article of this preprint also exists.

  † The first two authors contributed equally to this work.

This version is not peer-reviewed

Submitted:

26 April 2023

Posted:

26 April 2023

You are already at the latest version

Alerts
Abstract
Intense thermoacoustic oscillations may lead to severe deterioration due to the induced intolerable damage to combustors. A better understanding of unstable behaviors is important to prevent or suppress these oscillations. Active thermoacoustic coupling in practical combustors is caused primarily by two approaches: inherent turbulent fluctuations and the flame response to acoustic waves. Turbulent fluctuations are generally characterized by random noise. This paper experimentally expands on previous analytic studies regarding the influence of colored disturbances on the thermoacoustic response near the supercritical bifurcation point. Therein, a laboratory-scale Rijke-type thermoacoustic system is established, and both supercritical and subcritical bifurcations are observed. Then, Ornstein–Uhlenbeck (OU)-type external colored noise is introduced near the supercritical bifurcation point, and the effects of the corresponding correlation time τc and noise intensity D are studied. The experimental results show that these variables of the colored noise significantly influence the dynamics of thermoacoustic oscillations in terms of the most probable amplitude, autocorrelation, and correlation time. A resonance-like behavior is observed as the noise intensity or the autocorrelation time of the colored noise is continuously varied, which means that the coherent resonance occurs in the thermoacoustic system. Finally, when the system is configured closer to the stability boundary, the extent of the coherence motion is intensified in the stochastic system response. Meanwhile, the Signal to Noise Ratios (SNRs) of the colored-noise-induced response are found to become more distinguished, the optimal colored noise intensity decreases, and the optimal autocorrelation time increases. This provides valuable guidance to predict the onset of thermoacoustic instabilities.
Keywords: 
Subject: Engineering  -   Energy and Fuel Technology

1. Introduction

Energy conversion from heat to sound is desired in thermoacoustic engines [1,2,3], because there are no or fewer moving parts and non-exotic materials involved. When this occurs in most modern combustion equipment with high energy densities (such as in liquid/solid rocket engines [4,5,6], aero-engines [7,8,9], or land-based gas turbines [10,11,12]), intense thermoacoustic oscillations may occur, which pose a significant risk due to destructive damage [13,14,15]. This may include, structural vibration fatigue, overloaded heating to the combustor walls, and even explosion. Generally, thermoacoustic instabilities are caused by coupling between the unsteady combustion process, acoustic waves, and turbulence flow inside the combustors, which are characterized by large-amplitude pressure or heat oscillations. To avoid or at least suppress these detrimental oscillations, it is necessary to achieve a better understanding of the process responsible for transitions to instability [16,17,18].
Many previous researches have focused on deterministic stability analyses of thermoacoustic systems [19,20,21]. However, the combustion systems in propulsion instruments are inherently noisy, and measured acoustic signals and heat release rates present some obvious random characteristics [22,23], especially when the thermoacoustic system is configured near stability boundaries. For example, the responses of a linearly stable thermoacoustic system are no longer a single state, as shown in deterministic analyses, but exhibit random pressure bursts. In such a case, the deterministic analysis of the thermoacoustic system cannot explain the stochastic behaviors. Furthermore, it is difficult to predict the onset of thermoacoustic instability in a deterministic framework.
Random disturbances in thermoacoustic systems may be generated directly by the unsteady combustion processes or indirectly by flow separation and turbulence [24]. It has been found that [25,26] these random disturbances occurring in the combustion response, frequency, and damping rate may work as additive or multiplicative excitation sources to the acoustic propagation system inside the combustors. At the early stage for easy implementation, the assumption of white noise is often used to represent these random disturbances. Interestingly, it is found that increasing the noise intensity can induce a drift in the stability boundary and narrows down the combustor stability margin [27,28,29]. Lieuwen [27] numerically illustrated that the stable region of the combustor decreases as the intensity of the white noise grows. Some small-amplitude random noise can even lead to noise-induced transitions (NIT) [30,31,32,33] and noise-induced coherence resonances [34,35,36], which have been evidenced experimentally in prototypical thermoacoustic systems.
However, such assumptions of white noise only work in the limited situation of rapidly varying fluctuations. That is, stochastic disturbances are assumed to be serially uncorrelated with a constant power spectral density. By comparison, colored noise with some finite correlation time would be closer to reality [37], as spectra for unsteady heat release have been experimentally evidenced as having a low-pass nature [38]. The non-vanishing correlation time in these disturbances is often called the `color’ of the noise. The influence of the colored noise on the thermoacoustic system have been investigated by Waugh et al. [39] and they found that the colored noise with the low-pass characteristics is more effective in triggering large-amplitude thermoacoustic oscillations than white noise. Bonciolini et al. [40] evaluated the influence of the autocorrelation time of colored noise on the probability density function (PDF) of thermoacoustic systems and observed strong deviations from the white noise forcing case. Li et al. [41] utilized stochastic nonlinear dynamic theories to analytically study the influence of additive colored noise on the coherence behaviors of thermoacoustic systems, and found that the optimal noise intensity corresponding to the maximum the signal-to-noise ratio (SNR) is strongly dependent on the variations in the correlation time. In addition, the role of the additive and multiplicative colored noise on the stability behaviors of a Rijke-type thermoacoustic system [21] was also studied and identified. Most relevant works about the influence of colored noise on thermoacoustic systems are constrained in analytic and numerical frameworks with a lack of experimental data, which motivates this work.
The rest of this paper is divided into three main sections. Firstly, an experimental configuration of the Rijke-type standing-wave thermoacoustic system and the external colored noise is introduced in Section 2. The colored noise is generated by solving the corresponding governing equation, and a random signal is produced from the signal generators before reaching the loudspeakers. Secondly, the effects of colored noise on the response of thermoacoustic systems are evaluated with relevant results discussed in Section 3. Finally, the key findings are summarized in Section 4.

2. Experimental Configuration of the Rijke-type Thermoacoustic System Driven by Colored Noise

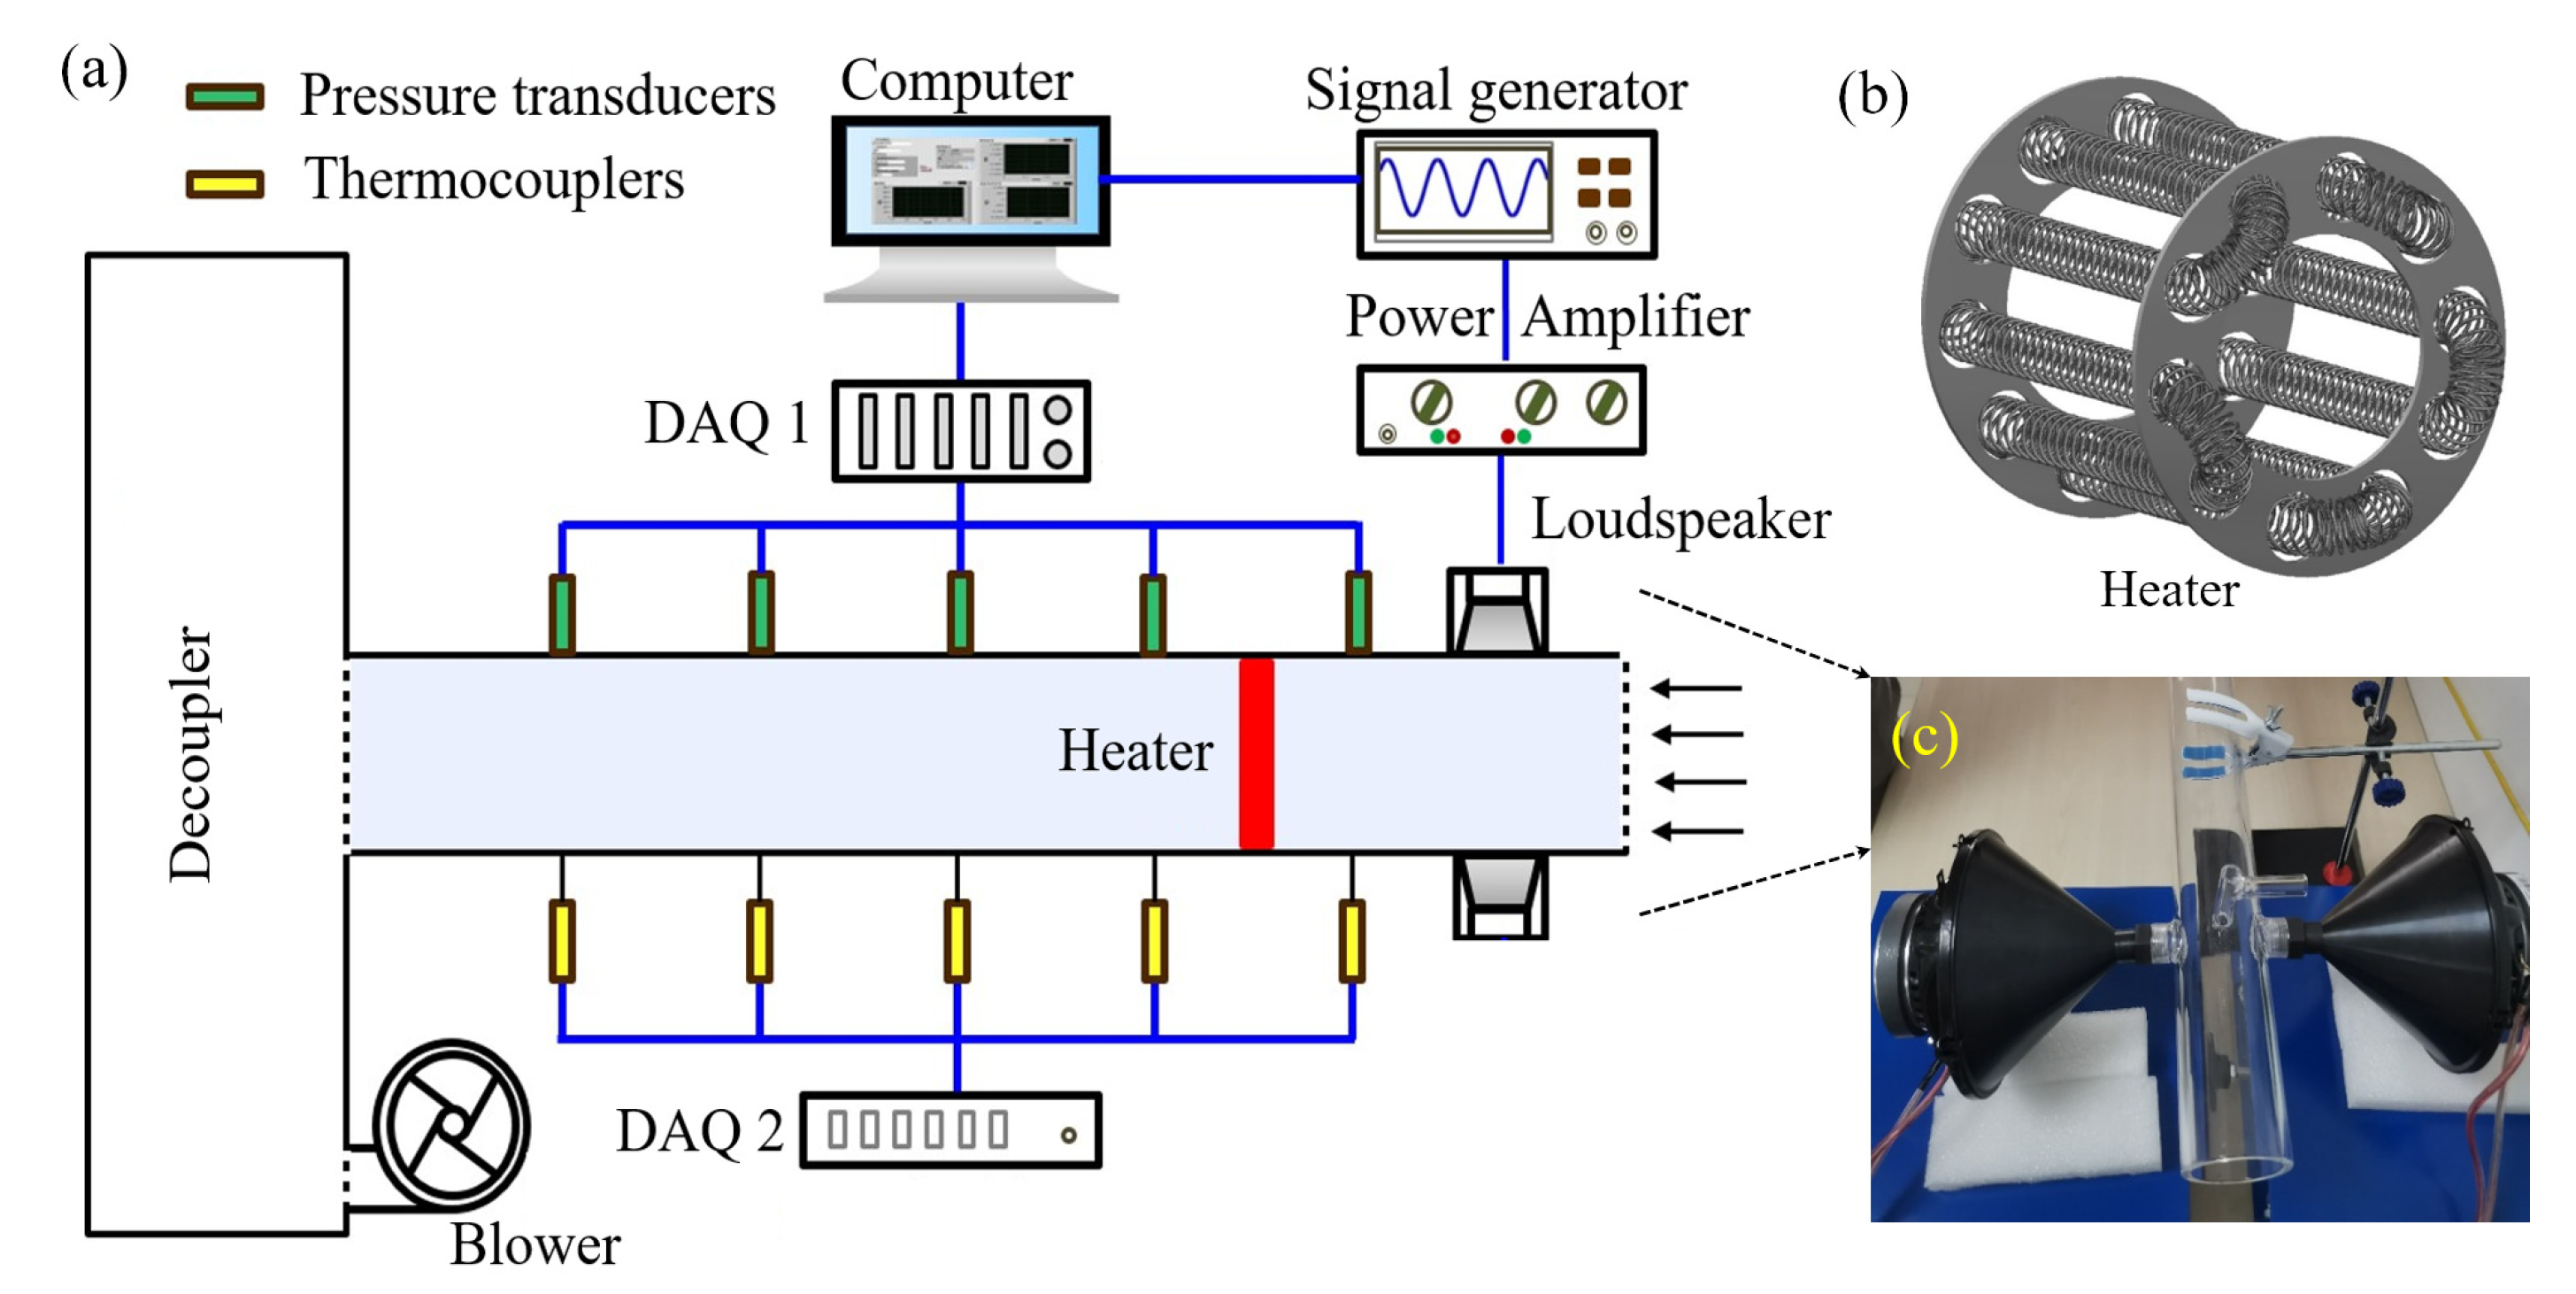
A schematic diagram of the experimental setup for the stochastic Rijke-type standing-wave thermoacoustic system is shown in Figure 1. The acoustic resonator is made of silicon with an overall length of 1 m and it is placed horizontally so that the interaction between the mean flow and heat power in the vertical Rijke tube is decoupled. The cross section of the resonator is circular with a radius of 50 mm, and both ends are acoustically open, where the acoustic pressure equals zero. Through operating a blower (Model JABSCO-35440 with a voltage range of 0–24 V) in the suction mode, a mean flow can be constructed. A hot wire anemometer (SMART Testo) is used to measure the volume flow rate, and a decoupler (1200 mm × 600 mm × 600 mm) is placed between the the blower and the Rijke tube, where some absorbing material is installed inside to stop the flow disturbances and noise pollution from the blower.
The heat source is provided by an axially-distributed electrical heater, as shown in Figure 1(b). It is made of nichrome, and the heating coils are wound over two ceramic rings such that each ring of wires cannot touch the adjacent structure. This heater has the benefit of releasing large amounts of thermal power without geometry changes, which is a convenient approach to modify the characteristics of the heat source. The electrical energy is supplied by DC-stabilized power, which produces 100 V at 100 A. The power supplied is controlled by changing the loaded voltage of the heater.
Two loudspeakers are used to introduce noisy disturbances in the Rijke tube, as is shown in Figure 1(c). These loudspeakers are mounted diametrically opposite to each other along the circumference of the tube and located upstream of the heater. To model the turbulence-induced fluctuations, these loudspeakers are excited by the colored noise signals. It is assumed that [36,41] the random disturbance with low-pass filter properties is characterized by Ornstein–Uhlenbeck (OU)-type colored noise ξ O U ( t ) , which is governed by the following equation [42,43]:
ξ ˙ O U ( t ) = 1 τ c ξ O U ( t ) + 2 D τ c n ( t )
where τ c is the autocorrelation time of the stochastic forcing ξ O U ( t ) , and it is a measure of the extent of the current process depending on the past. D denotes the noise intensity. n ( t ) is Gaussian white noise, which has zero mean and unit variance. The statistical properties of the OU-type colored noise is given as follows:
< ξ O U ( t ) > = 0 , < ξ O U ( t ) ξ O U ( t ) > = D τ c exp | t t | τ c
where < · > denotes the operator of expectation for the stochastic signals. It is noted that as τ c 0 , this OU-type colored noise degenerates into white noise.
The colored noise signal is generated by solving Equation (1) with the stochastic second-order Euler method. These stochastic signals are then transmitted to TTi TGF4042 arbitrary waveform generators to create an electrical signal, and amplified by the Crown XTi-1002A amplifier before driving the two JBL CLUB-6522 loudspeakers. To record the system response, several K-type thermocouples are utilized to measure the gas temperature inside the tube, and they has the measuring ranges of - 129 1372 C and an accuracy of ± 1 . 2 C . In addition, some pressure transducers (BSWA-MP401) are installed along the duct with sensitivities of 5 mV/Pa to measure the acoustic pressure inside the tube. These sensors are placed such that the first two eigenmodes of the thermoacoustic oscillations can be identified. The measured signals are recorded simultaneously via Labview and National Instruments PXIe-4464 data acquisition cards which has a sample rate of 10 kHz.

3. Results and Discussions

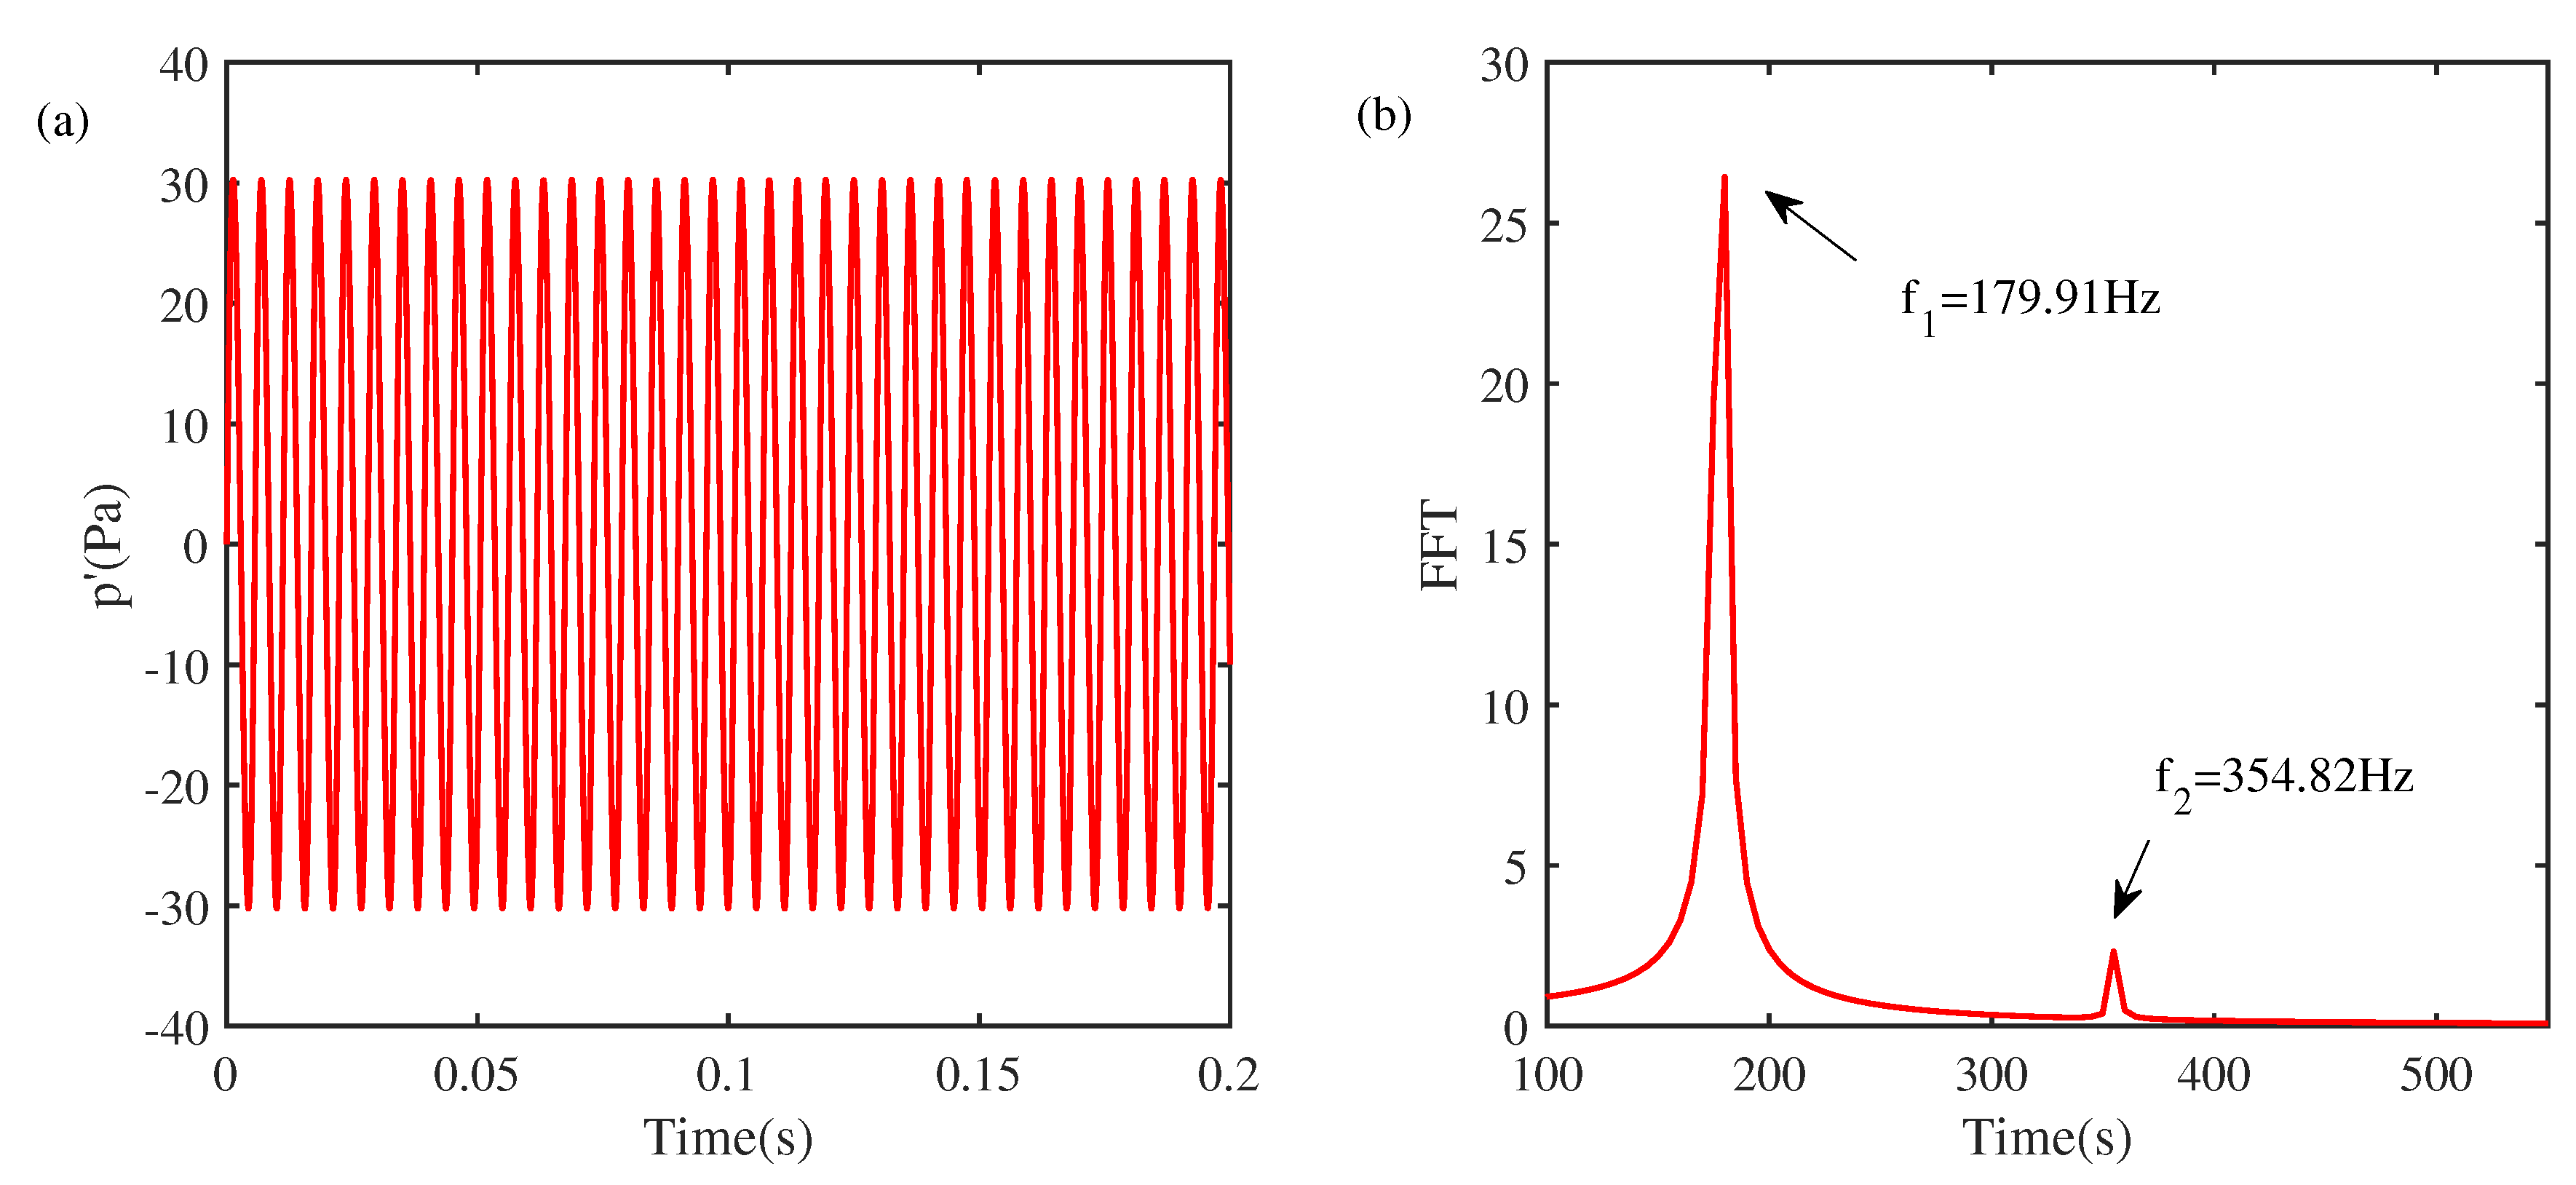
The effects of the colored noise on the Rijke-type standing-wave thermoacoustic system are studied. The nonlinear dynamic behaviors of the Rijke-type thermoacoustic system are first evaluated in the absence of noisy disturbances. Figure 2 shows the measured acoustic pressure oscillations and the corresponding frequency spectrum. When thermoacoustic instability occurs in the experimental system, the large-amplitude regular acoustic limit cycle is observed, as is shown in Figure 2(a). Here, all the local maxima and minima have the same amplitude. Figure 2(b) shows the acoustic pressure signal in the frequency domain using a fast Fourier transformation (FFT). The frequency at the peak is around 179.9 Hz, which is close to the first-order acoustic frequency of the Rijke tube with a / 2 L = 170 Hz.
Based on the previous studies [34], external white noise significantly influences the system response when configured near the stability boundary. Similarly, the stability boundaries of the Rijke-type thermoacoustic system are also explored for various heater powers. Two different transition behaviors are obtained in Figure . When the incoming flow velocity is around 0.41 m/s, Figure (a) shows that increasing the heater power makes the system unstable at around 242 W. Further increasing the heater power leads to an increased acoustic pressure, as denoted by the red-starred curve. If the heater power decreases, the acoustic pressure oscillations also decrease, and the system becomes stabilized at the original transition point. Therefore, the Rijke thermoacoustic system becomes unstable via supercritical Hopf bifurcation. When the incoming flow velocity is 0.36 m/s, an obvious hysteresis region is observed between 328 and 338 W, which is where the heater power increases initially to destabilize the system and then decreases continuously to reach the stable state. Therefore, the thermoacoustic system becomes unstable via subcritical Hopf bifurcation. The effects of colored noise on the response of the thermoacoustic system are considered near this supercritical bifurcation point.
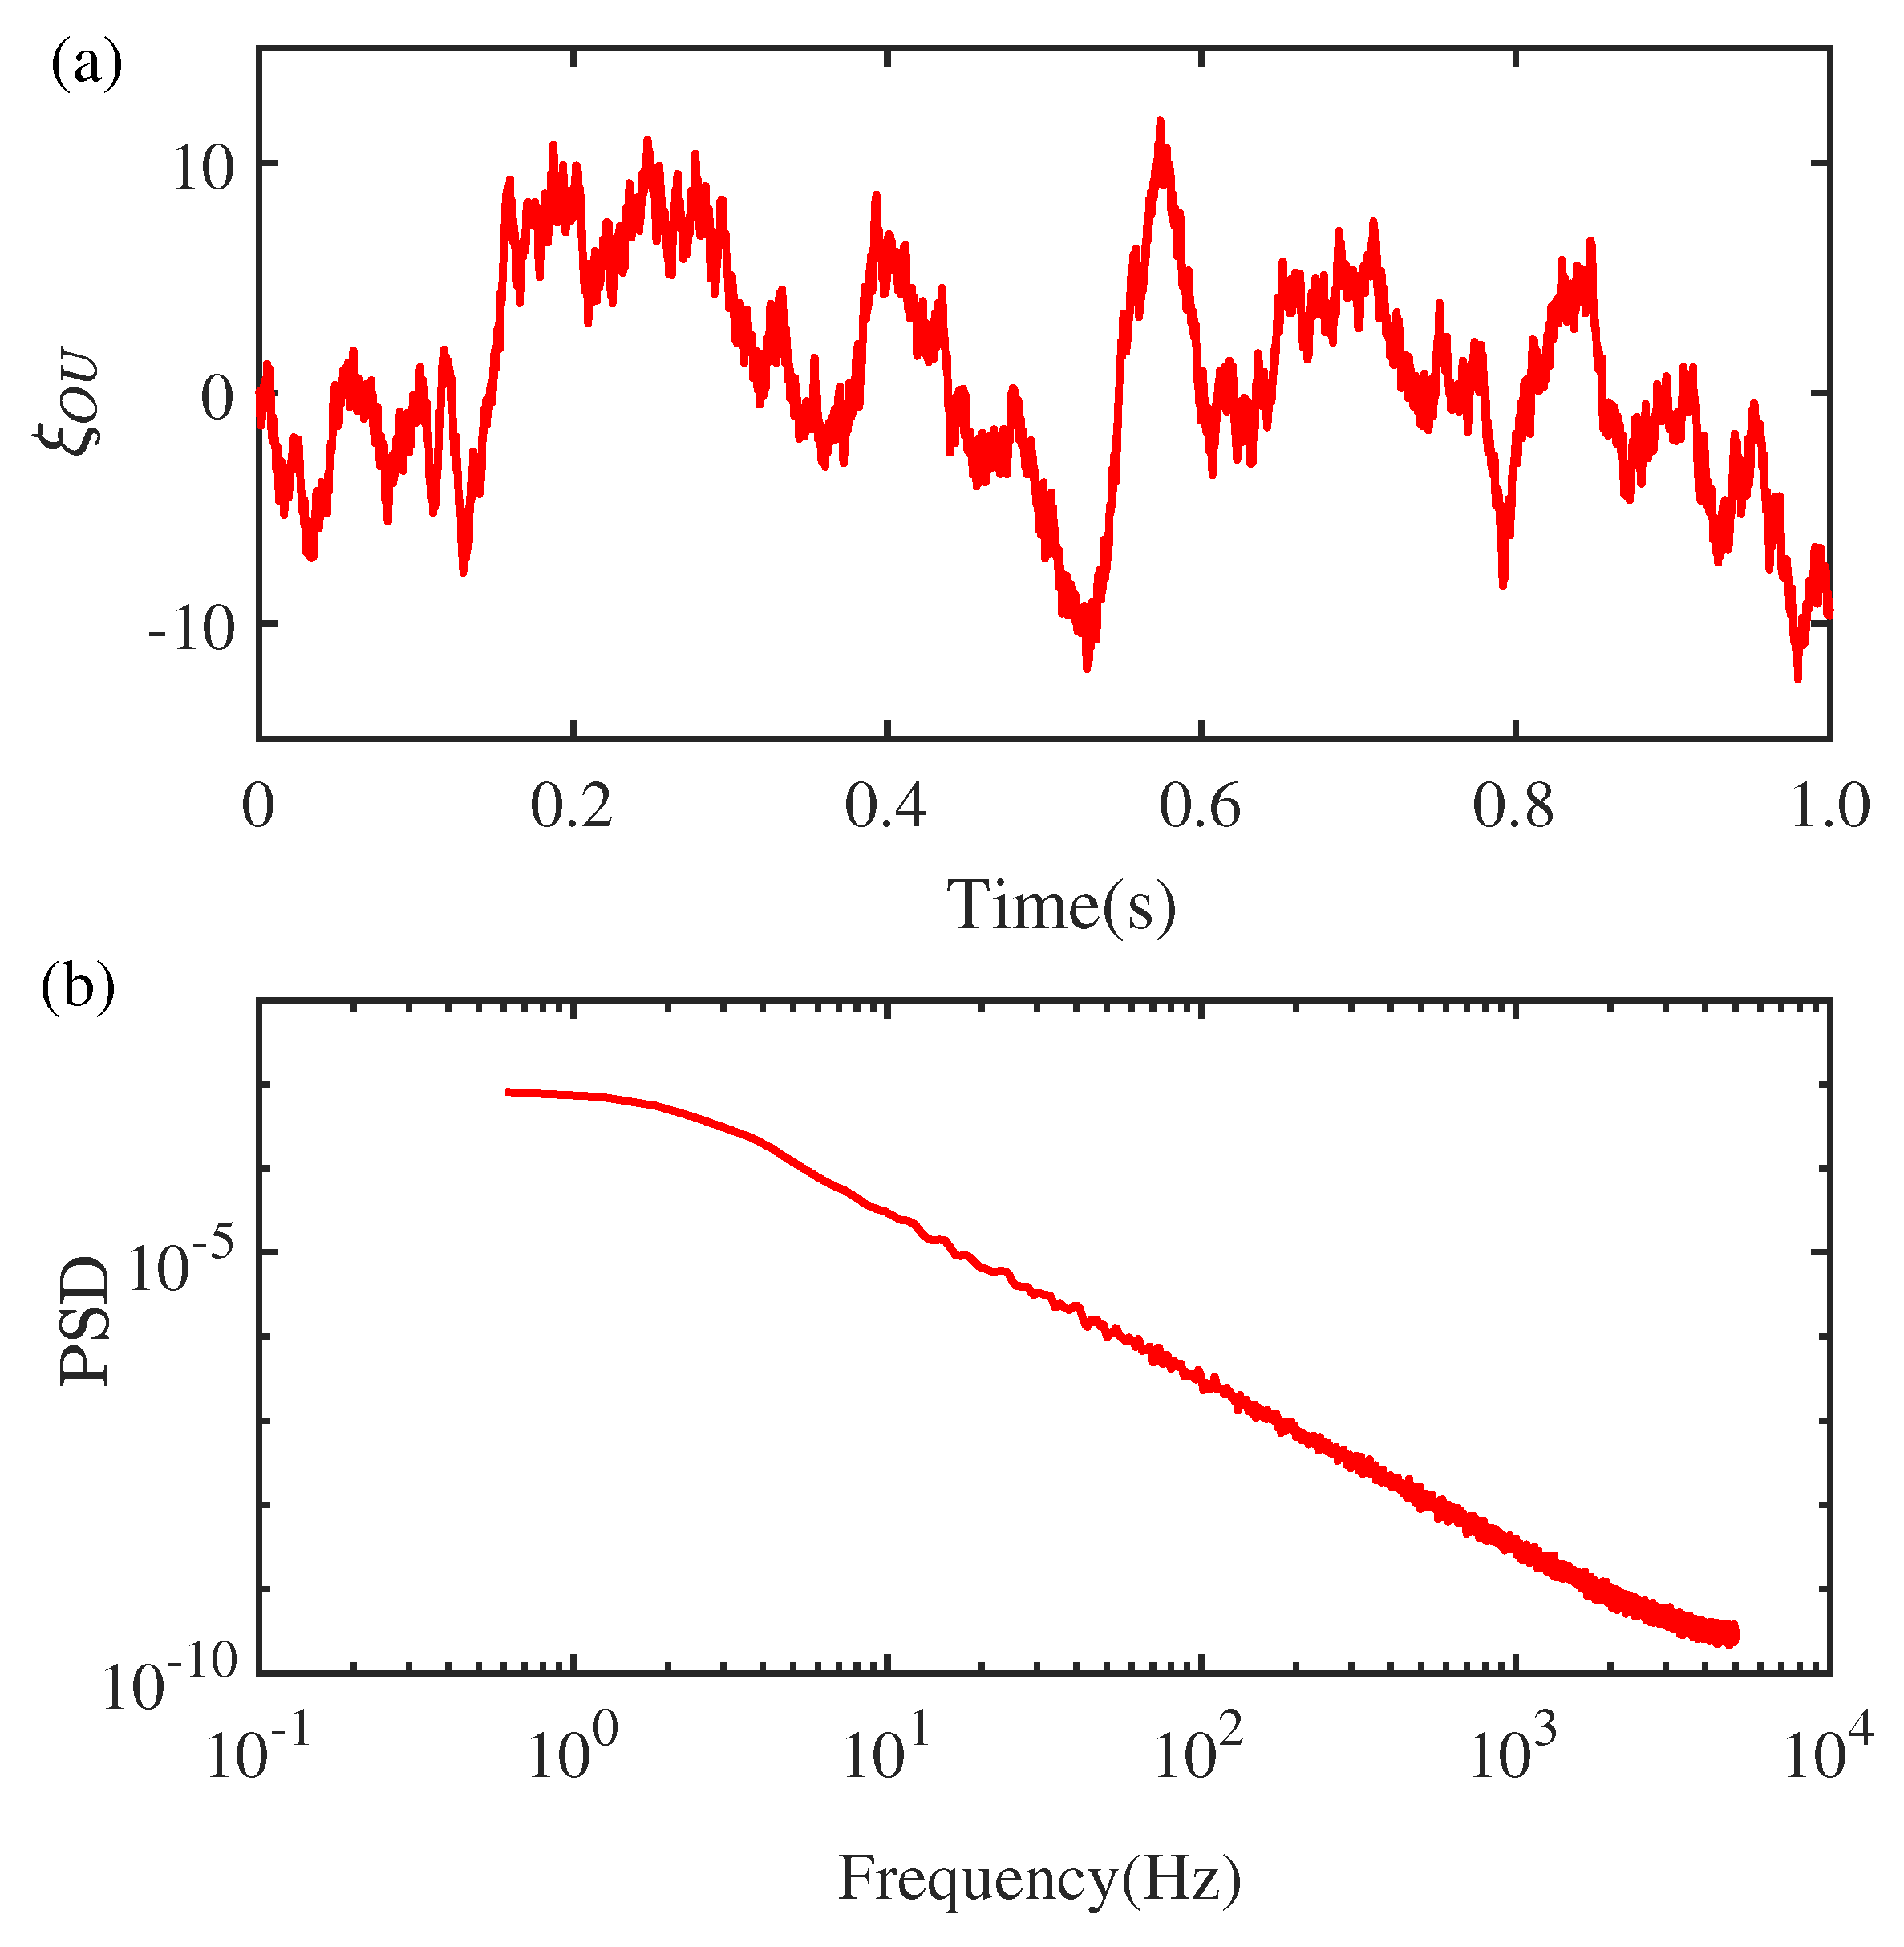
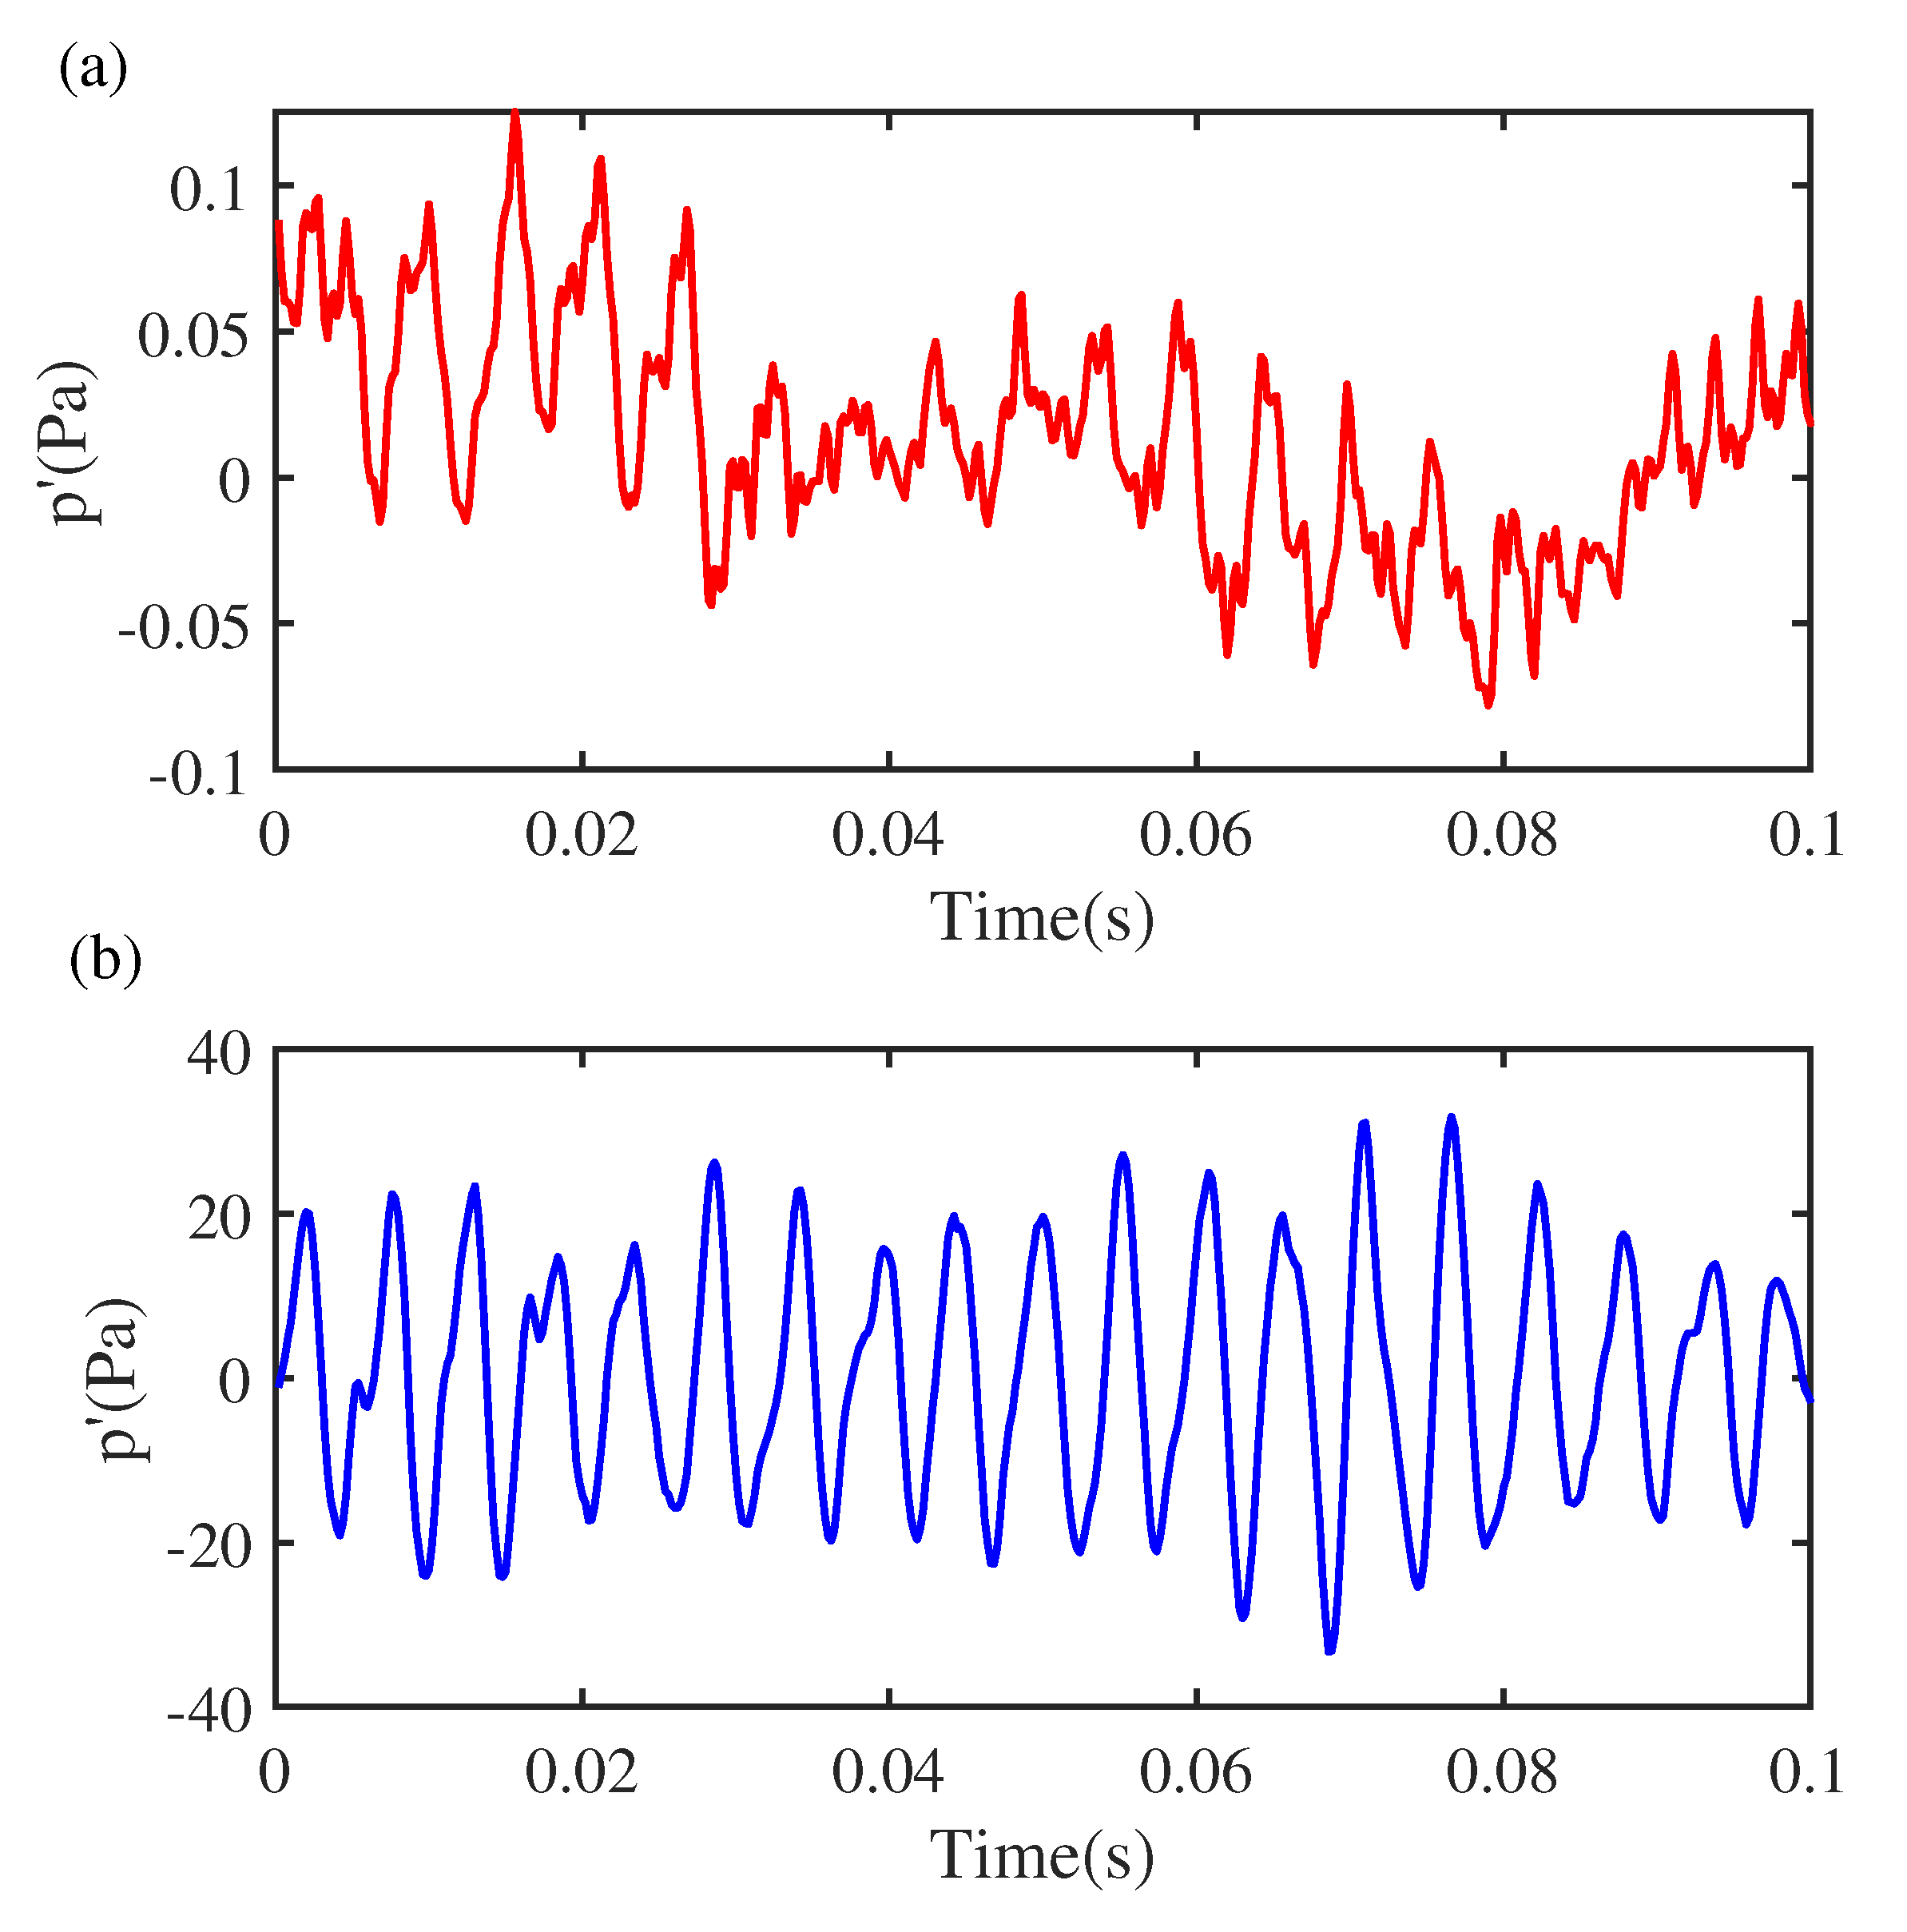
Figure 3(a) illustrates a time series of Gaussian colored noise ξ O U as obtained by solving Equation (1), and the corresponding power spectral density is shown in Figure 3(b). The response of ξ O U depends on the past time, and the power spectrum density has low-pass filtering properties. When random colored noise ξ O U is added to the thermoacoustic system, Figure 4 shows that the original unregular acoustic pressure oscillations become organized in the sub-threshold region, and the amplitude of the acoustic pressure increases from 0.1 to 20 Pa.
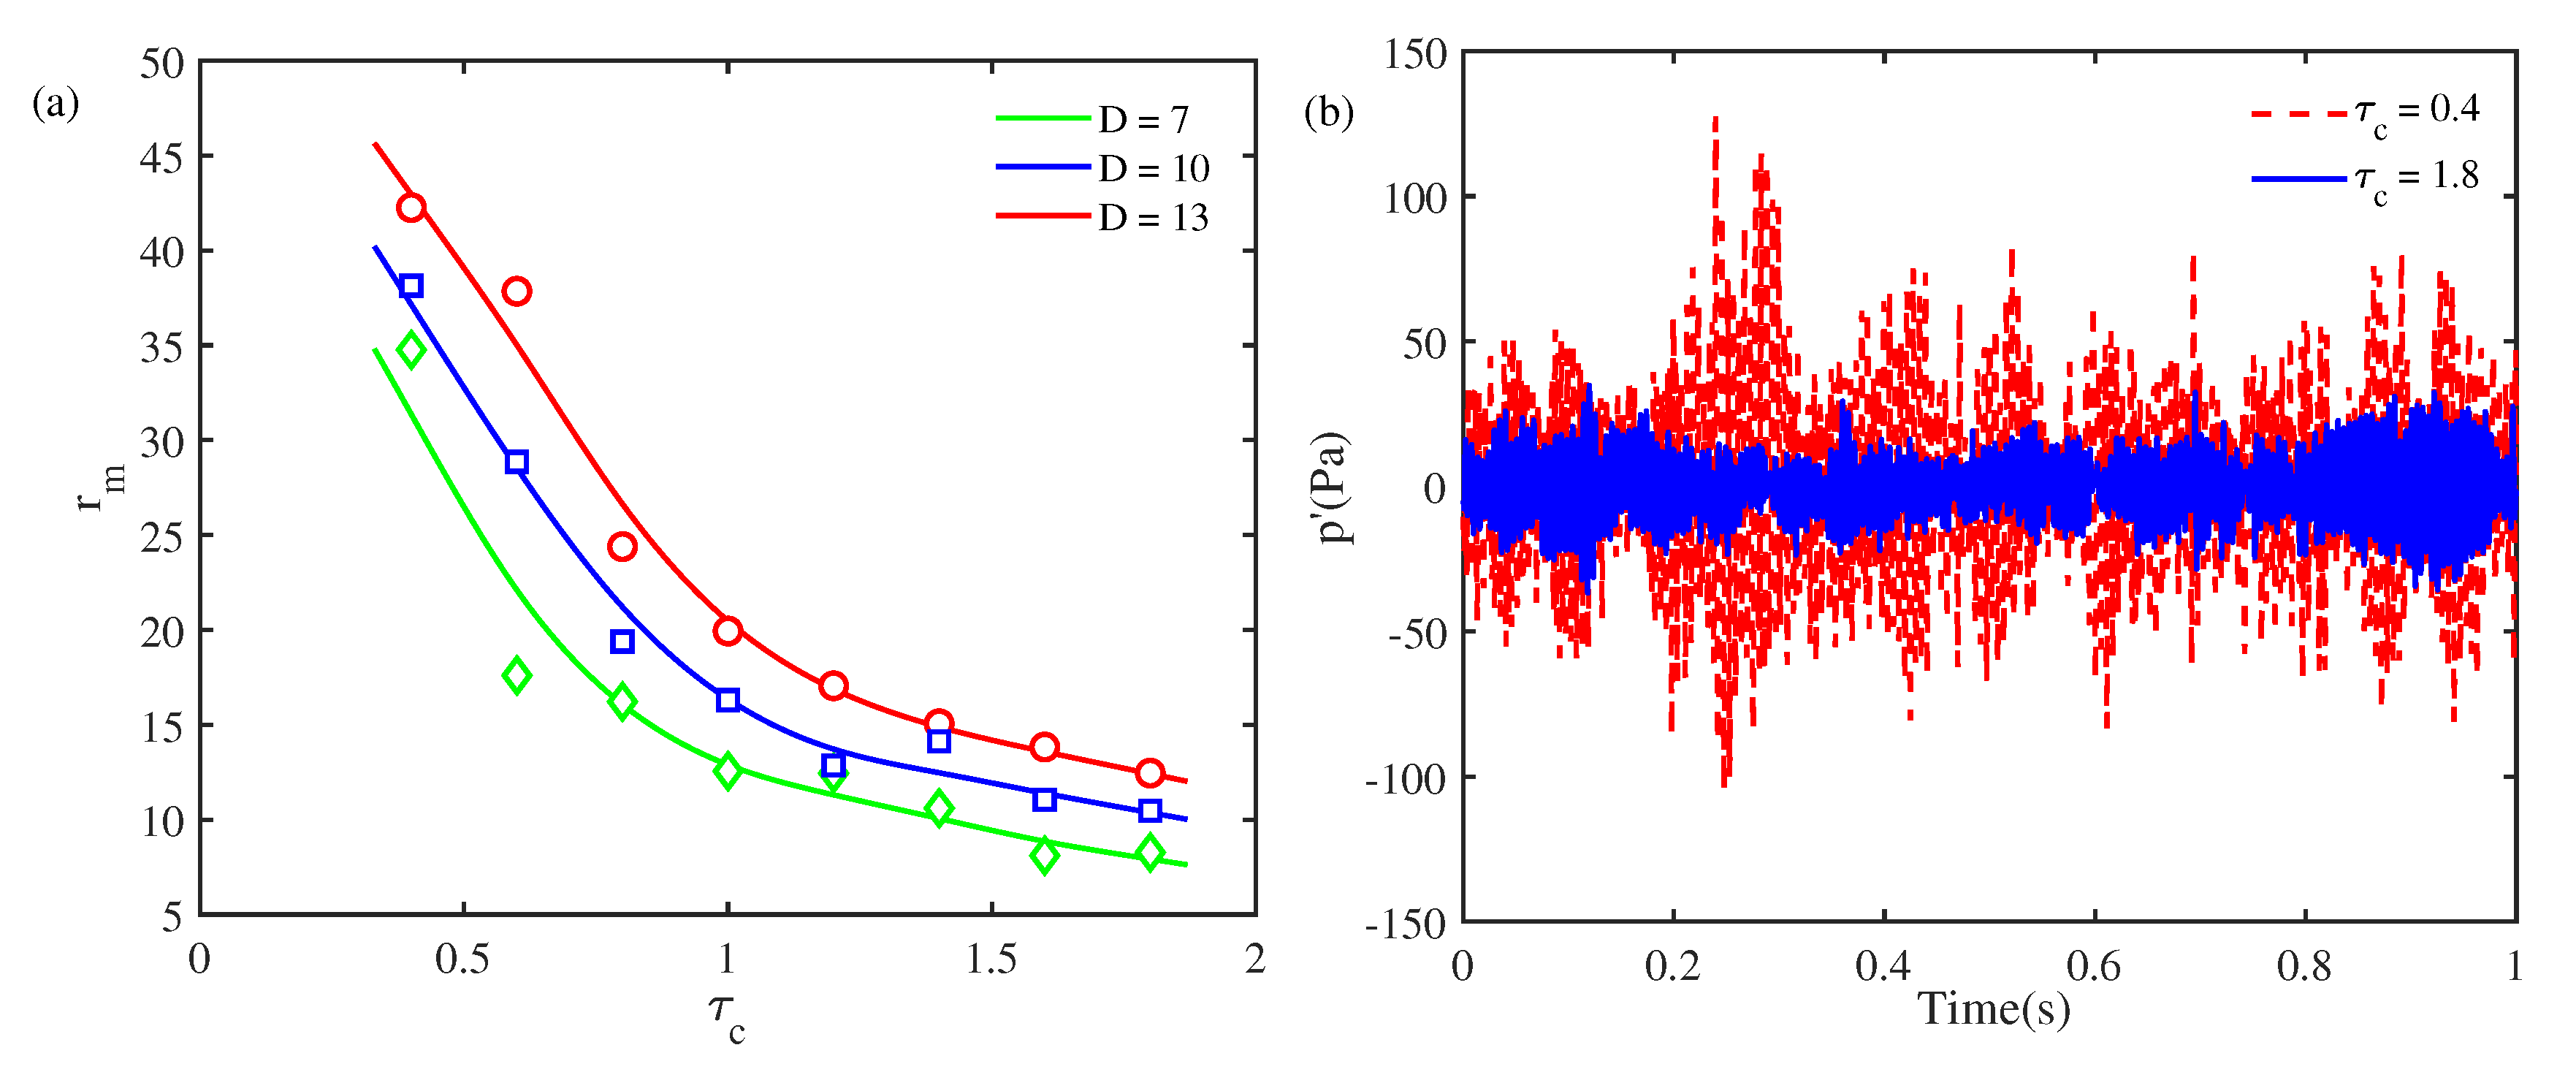
The amplitude of the measured stochastic acoustic pressure is obtained to investigate the statistical properties of the thermoacoustic system, as is shown in Figure 5(a). The corresponding PDF of the amplitude r ( t ) is given in Figure 5(b). The most probable amplitude corresponds to a maximized stationary PDF. Figure 6 shows the effects of colored noise (including the noise intensity D and the autocorrelation time τ c ) on the most probable amplitude of Rijke-type thermoacoustic systems. When the noise intensity D is fixed, Figure 6(a) shows that an increased autocorrelation time τ c causes the most probable amplitude r m to drop sharply at the initial stage, and when the autocorrelation time τ c is larger than 1, the most probable amplitude r m decrease slowly. Figure 6(b) shows the time evolutions of the thermoacoustic system at two different autocorrelation times. As the autocorrelation time increases from τ c = 0 . 4 to τ c = 1 . 8 , although the noise intensity D remains unchanged, the acoustic pressure fluctuations increase significantly. For any autocorrelation time τ c in Figure 6(a), increasing the noise intensity D causes the most probable amplitude to increase and generate more intense oscillations in the system.
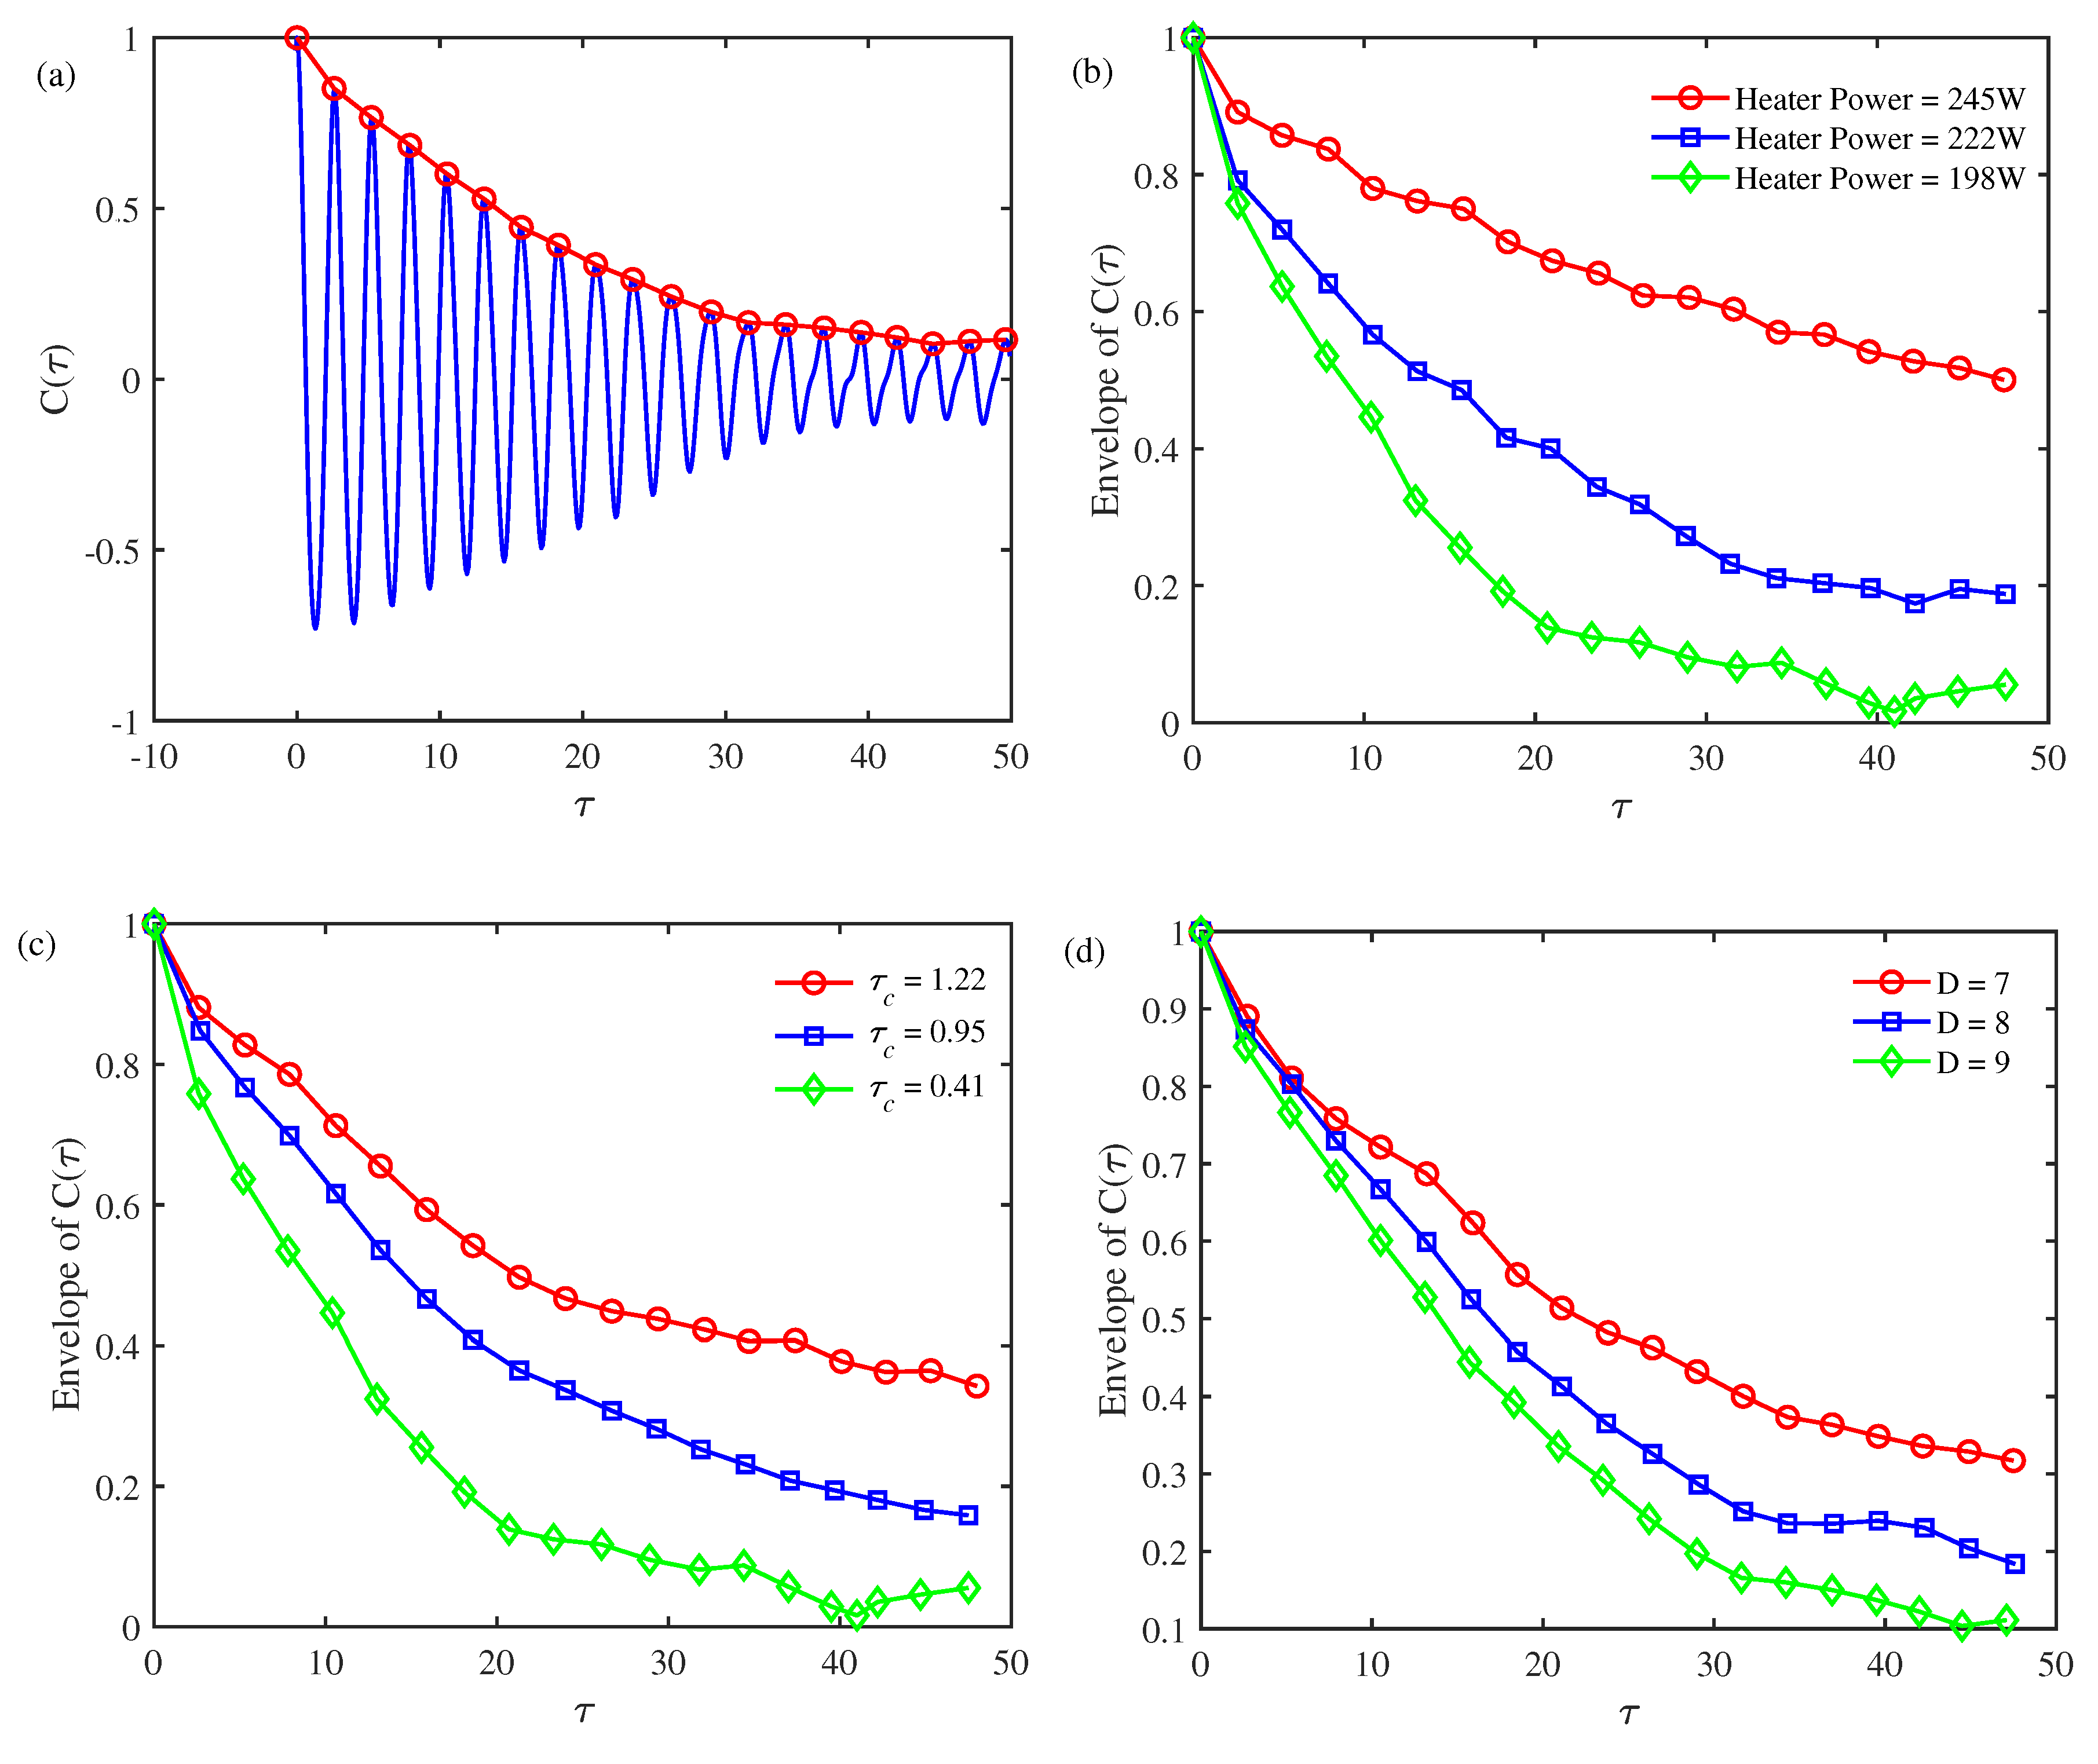
The stochastic properties of the Rijke-type thermoacoustic system can be evaluated based on the autocorrelation function C ( τ ) of the measured stochastic pressure. Figure 7(a) shows variations in the autocorrelation function when the time lag of the two acoustic pressure signals increases. When τ = 0 , C ( τ ) = 1 , which agrees with intuition. In addition, a strong oscillatory property is observed, and the envelope of the autocorrelation function C ( τ ) initially decreases exponentially. When the time lag τ is larger than approximately 35, C ( τ ) oscillates with a nearly constant amplitude. Figures. Figure 7(b)–Figure 7(d) study the roles of the operation condition (heater power) and the colored noise disturbance ( τ c and D) on the envelope of the autocorrelation function C ( τ ) . As the heater power increases from 198 to 245 W, the thermoacoustic system is more prone to instability, and Figure 7(b) shows that the autocorrelation function C ( τ ) decreases more slowly. That is, the correlation of the acoustic pressure oscillations at different times intensifies when the stochastic Rijke-type thermoacoustic system is configured closer to the supercritical bifurcation point. Figures. Figure 7(c) and Figure 7(d) illustrate that increasing the autocorrelation time of colored noise or decreasing its noise intensity can slow the decreasing trend of C ( τ ) in terms of the time lag, which enhances the correlation of the thermoacoustic response in the time domain.
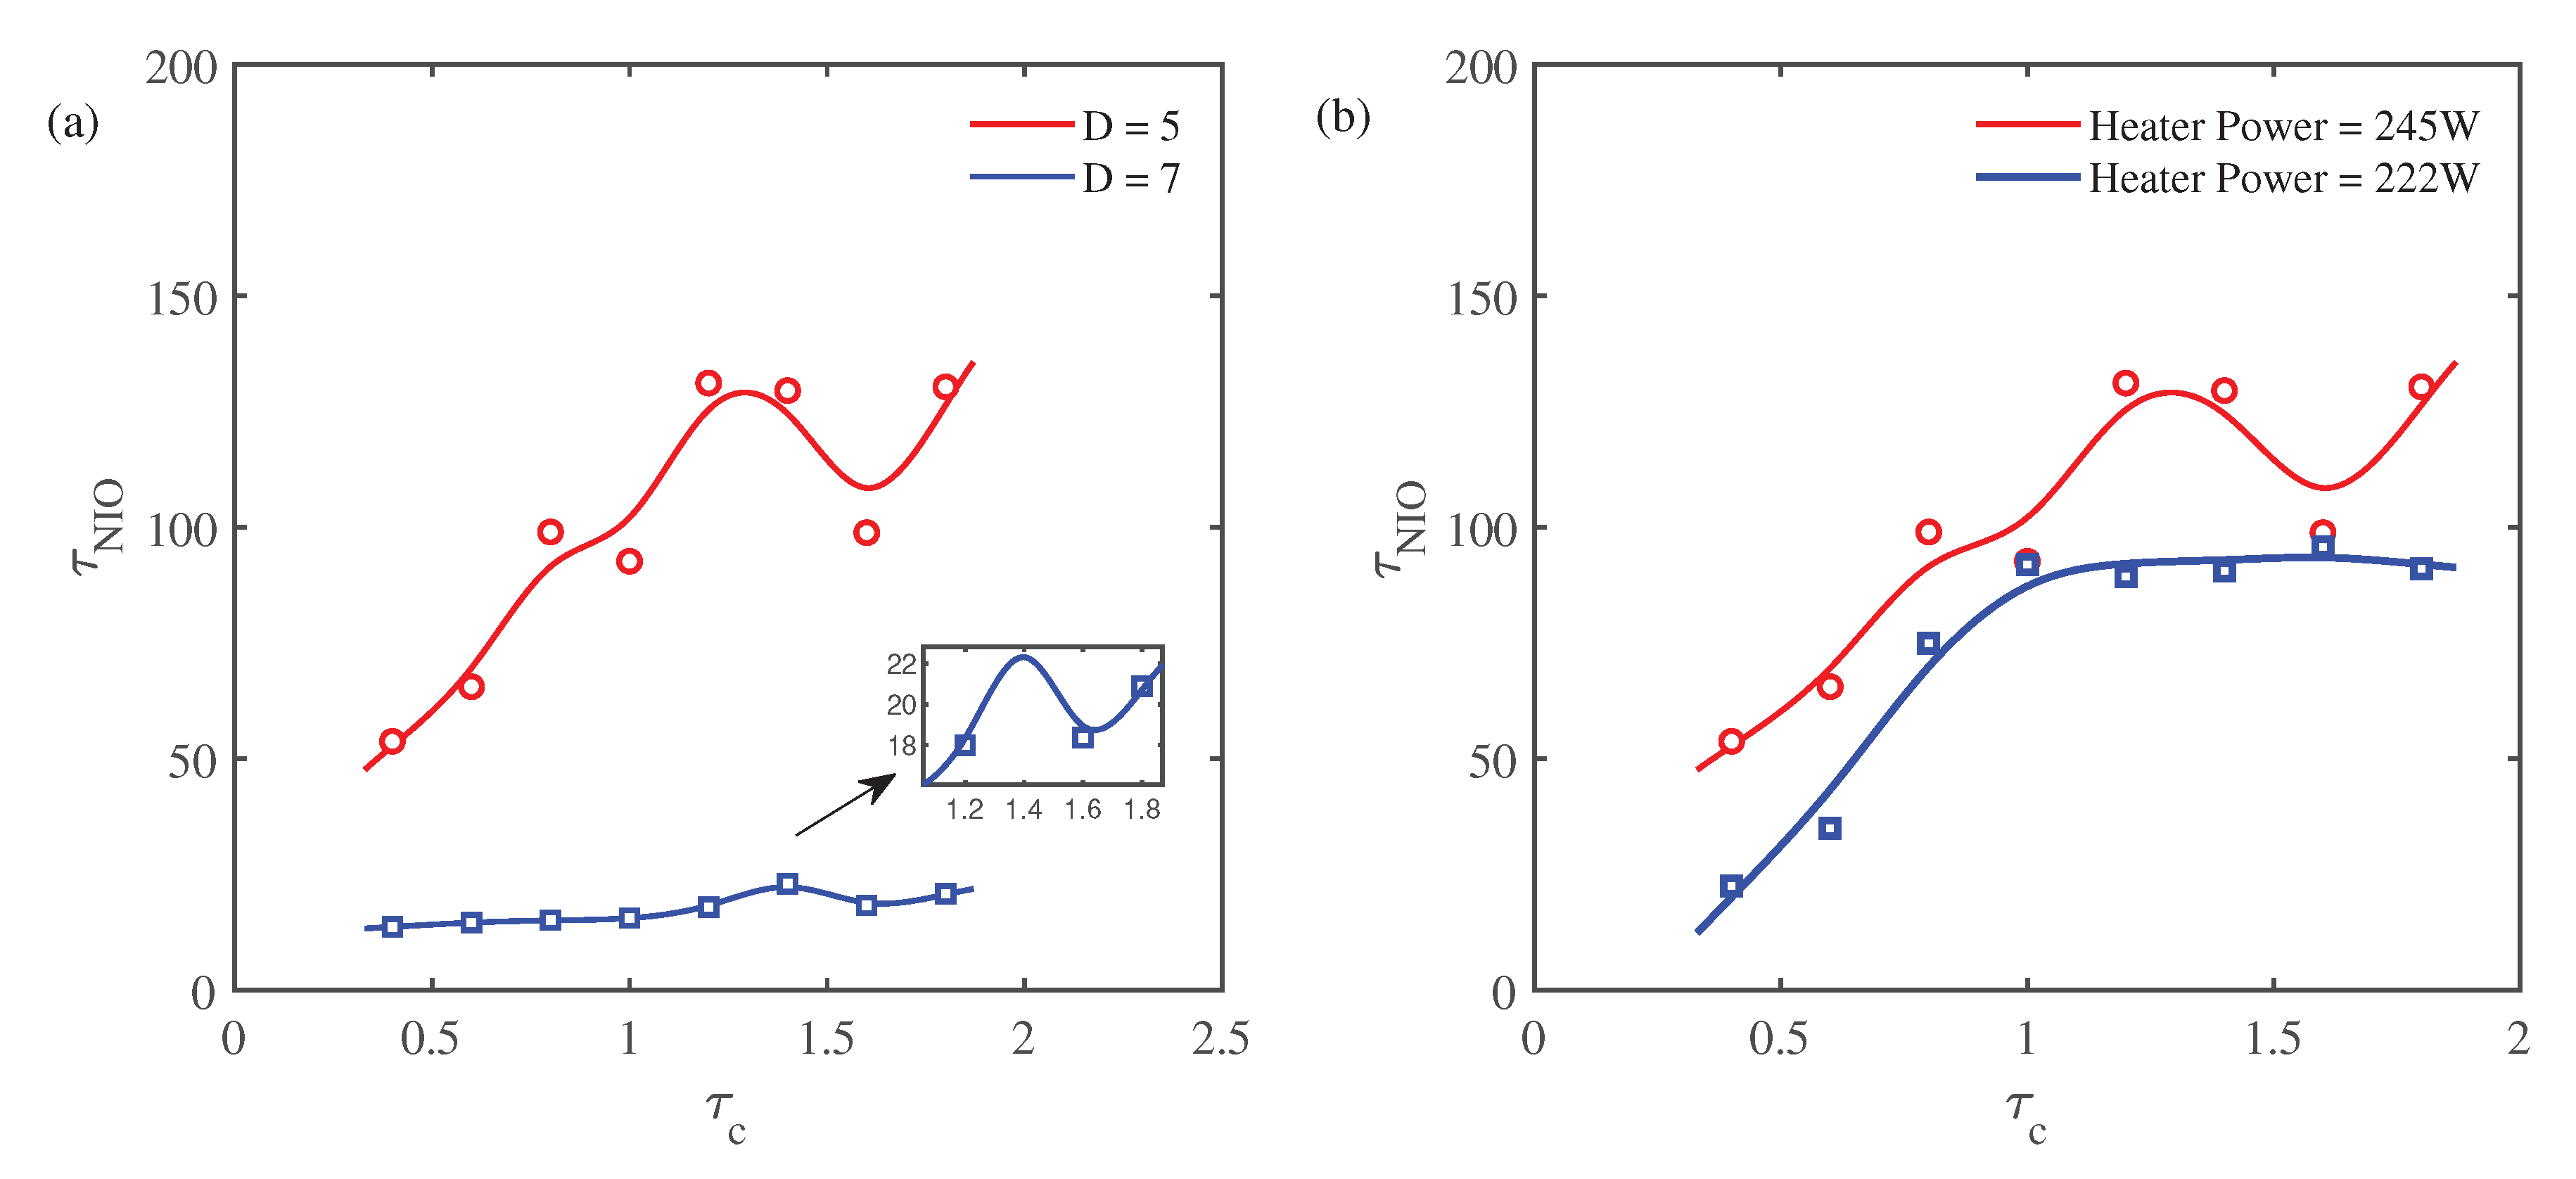
The correlation time of the acoustic pressure τ N I O is evaluated in Figure 8. When the heater power is around 245 W, the correlation time of the acoustic pressure τ N I O increases linearly with respect to the autocorrelation time of the colored noise τ c and becomes nonlinearly when τ c is greater than 1.4, as seen in Figure 8(a). Increasing the colored noise intensity D from 5 to 7 leads to a significant decrease in the correlation time. When the thermoacoustic system is configured to be further from the bifurcation point, i.e., P w = 222 W, Figure 8(b) shows that both the correlation time τ N I O and saturation point for τ c decrease. Therefore, colored noise with a larger autocorrelation time and smaller noise intensity creates more intense oscillations in the Rijke-type thermoacoustic system, especially when configured to be closer to the stability boundary.
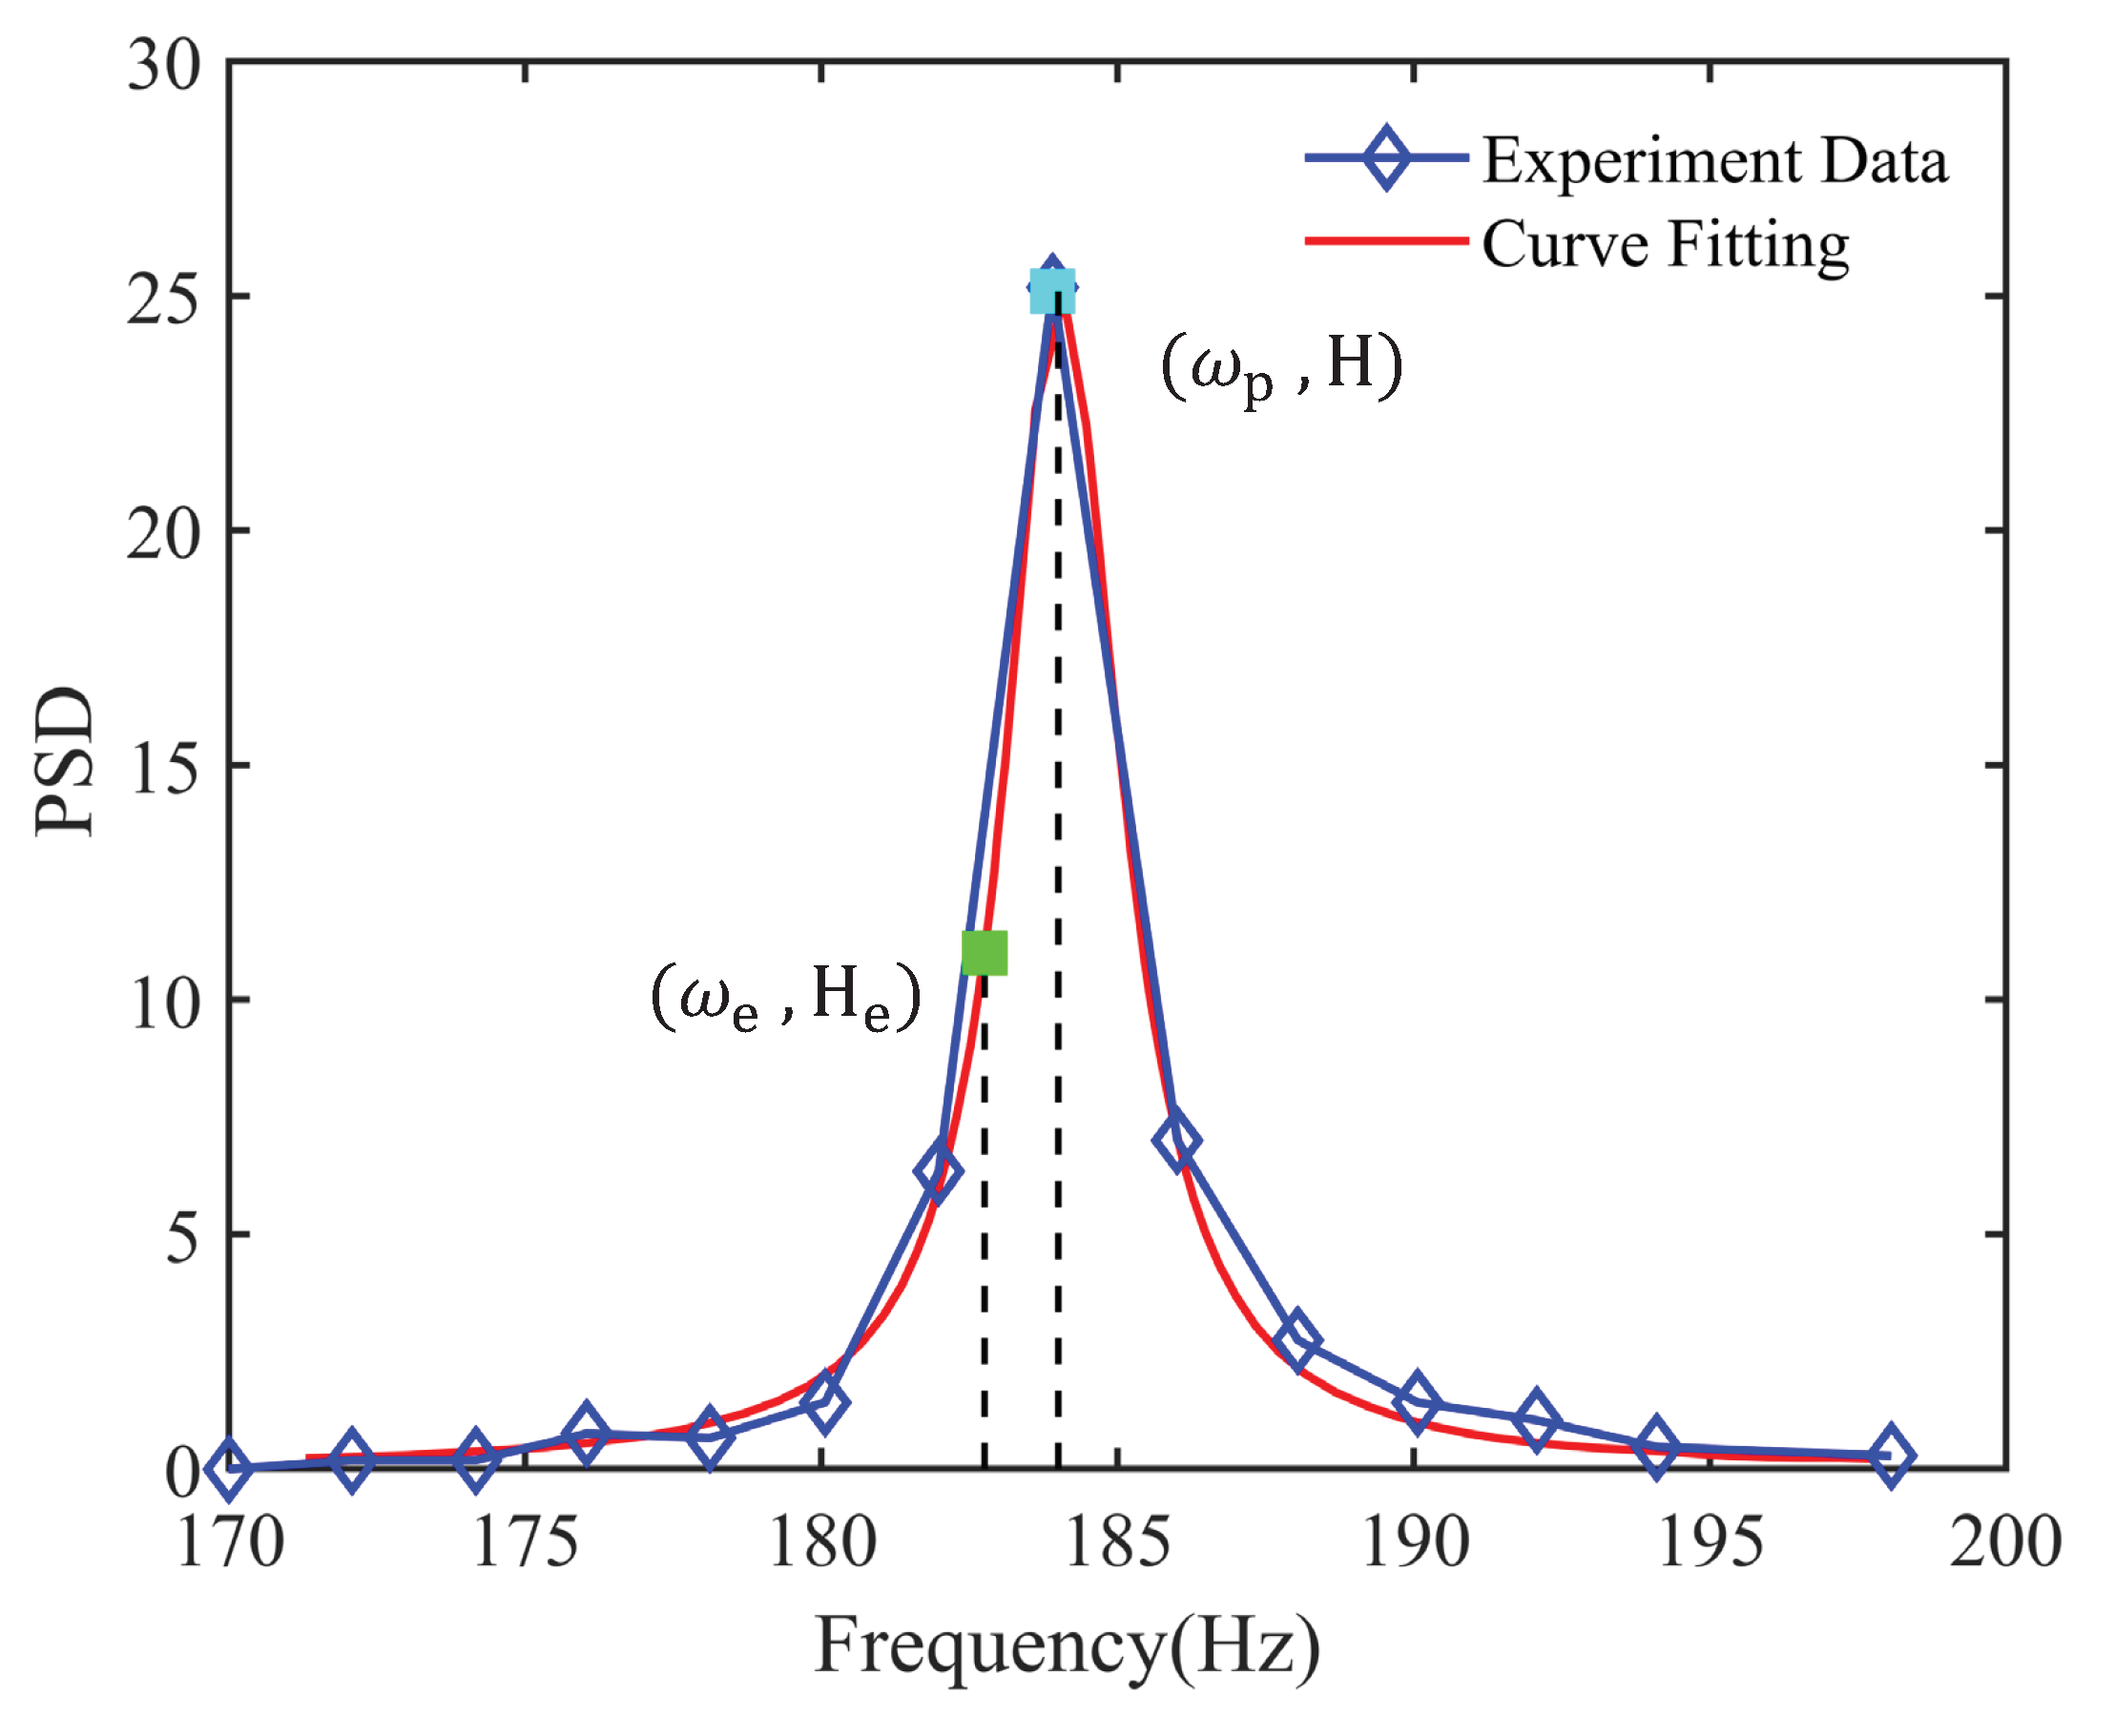
The SNR of the acoustic pressure fluctuations is utilized to characterize the regularity of the noise-induced motion in the Rijke-type thermoacoustic system. This is defined by the power spectral density of the stochastic signal [43], as shown in Figure 9.
SNR = H / ( Δ ω / ω p )
In the figure, H represents the peak height of the power spectrum, ω p is the corresponding peak frequency, and Δ ω is the width of the frequency between the peak and the frequency for the SNR value of H e = e ( 1 2 ) H . In Figure 9, the blue curve denotes the experimentally-obtained power spectral density, while the red curve is obtained via curve fitting. The power spectrum density of the noise-induced oscillation (NIO) exhibits a distinguishable peak, and the corresponding frequency is close to the theoretical prediction of the first-order acoustic frequency of the Rijke tube.
The dependencies of the SNR for the Rijke-type thermoacoustic system response on the autocorrelation time of the colored noise τ c at different noise intensities are studied in Figure 10. The dots represent the experimental data, and the smooth curves are obtained via curve fitting. For a fixed noise intensity D, Figure 10(a) shows that the SNR of the thermoacoustic system response increases initially and then decreases with the autocorrelation time τ c . Thus, there is an optimal autocorrelation time τ c for which the SNR is maximized. When the noise intensity D varies, all three SNR curves show bell-shaped variations, which indicates coherence resonance. In addition, a stronger colored noise intensity D corresponds to a larger optimal autocorrelation time τ c . These findings are consistent with Li’s analytical predictions in annular gas turbine systems [41]. Figure 10(b) shows the sound pressure time series signals at different SNRs with a fixed colored noise intensity of D = 25 . The red dashed line for the maximum SNR value has more intense oscillations than the blue curve for the system with a lower SNR.
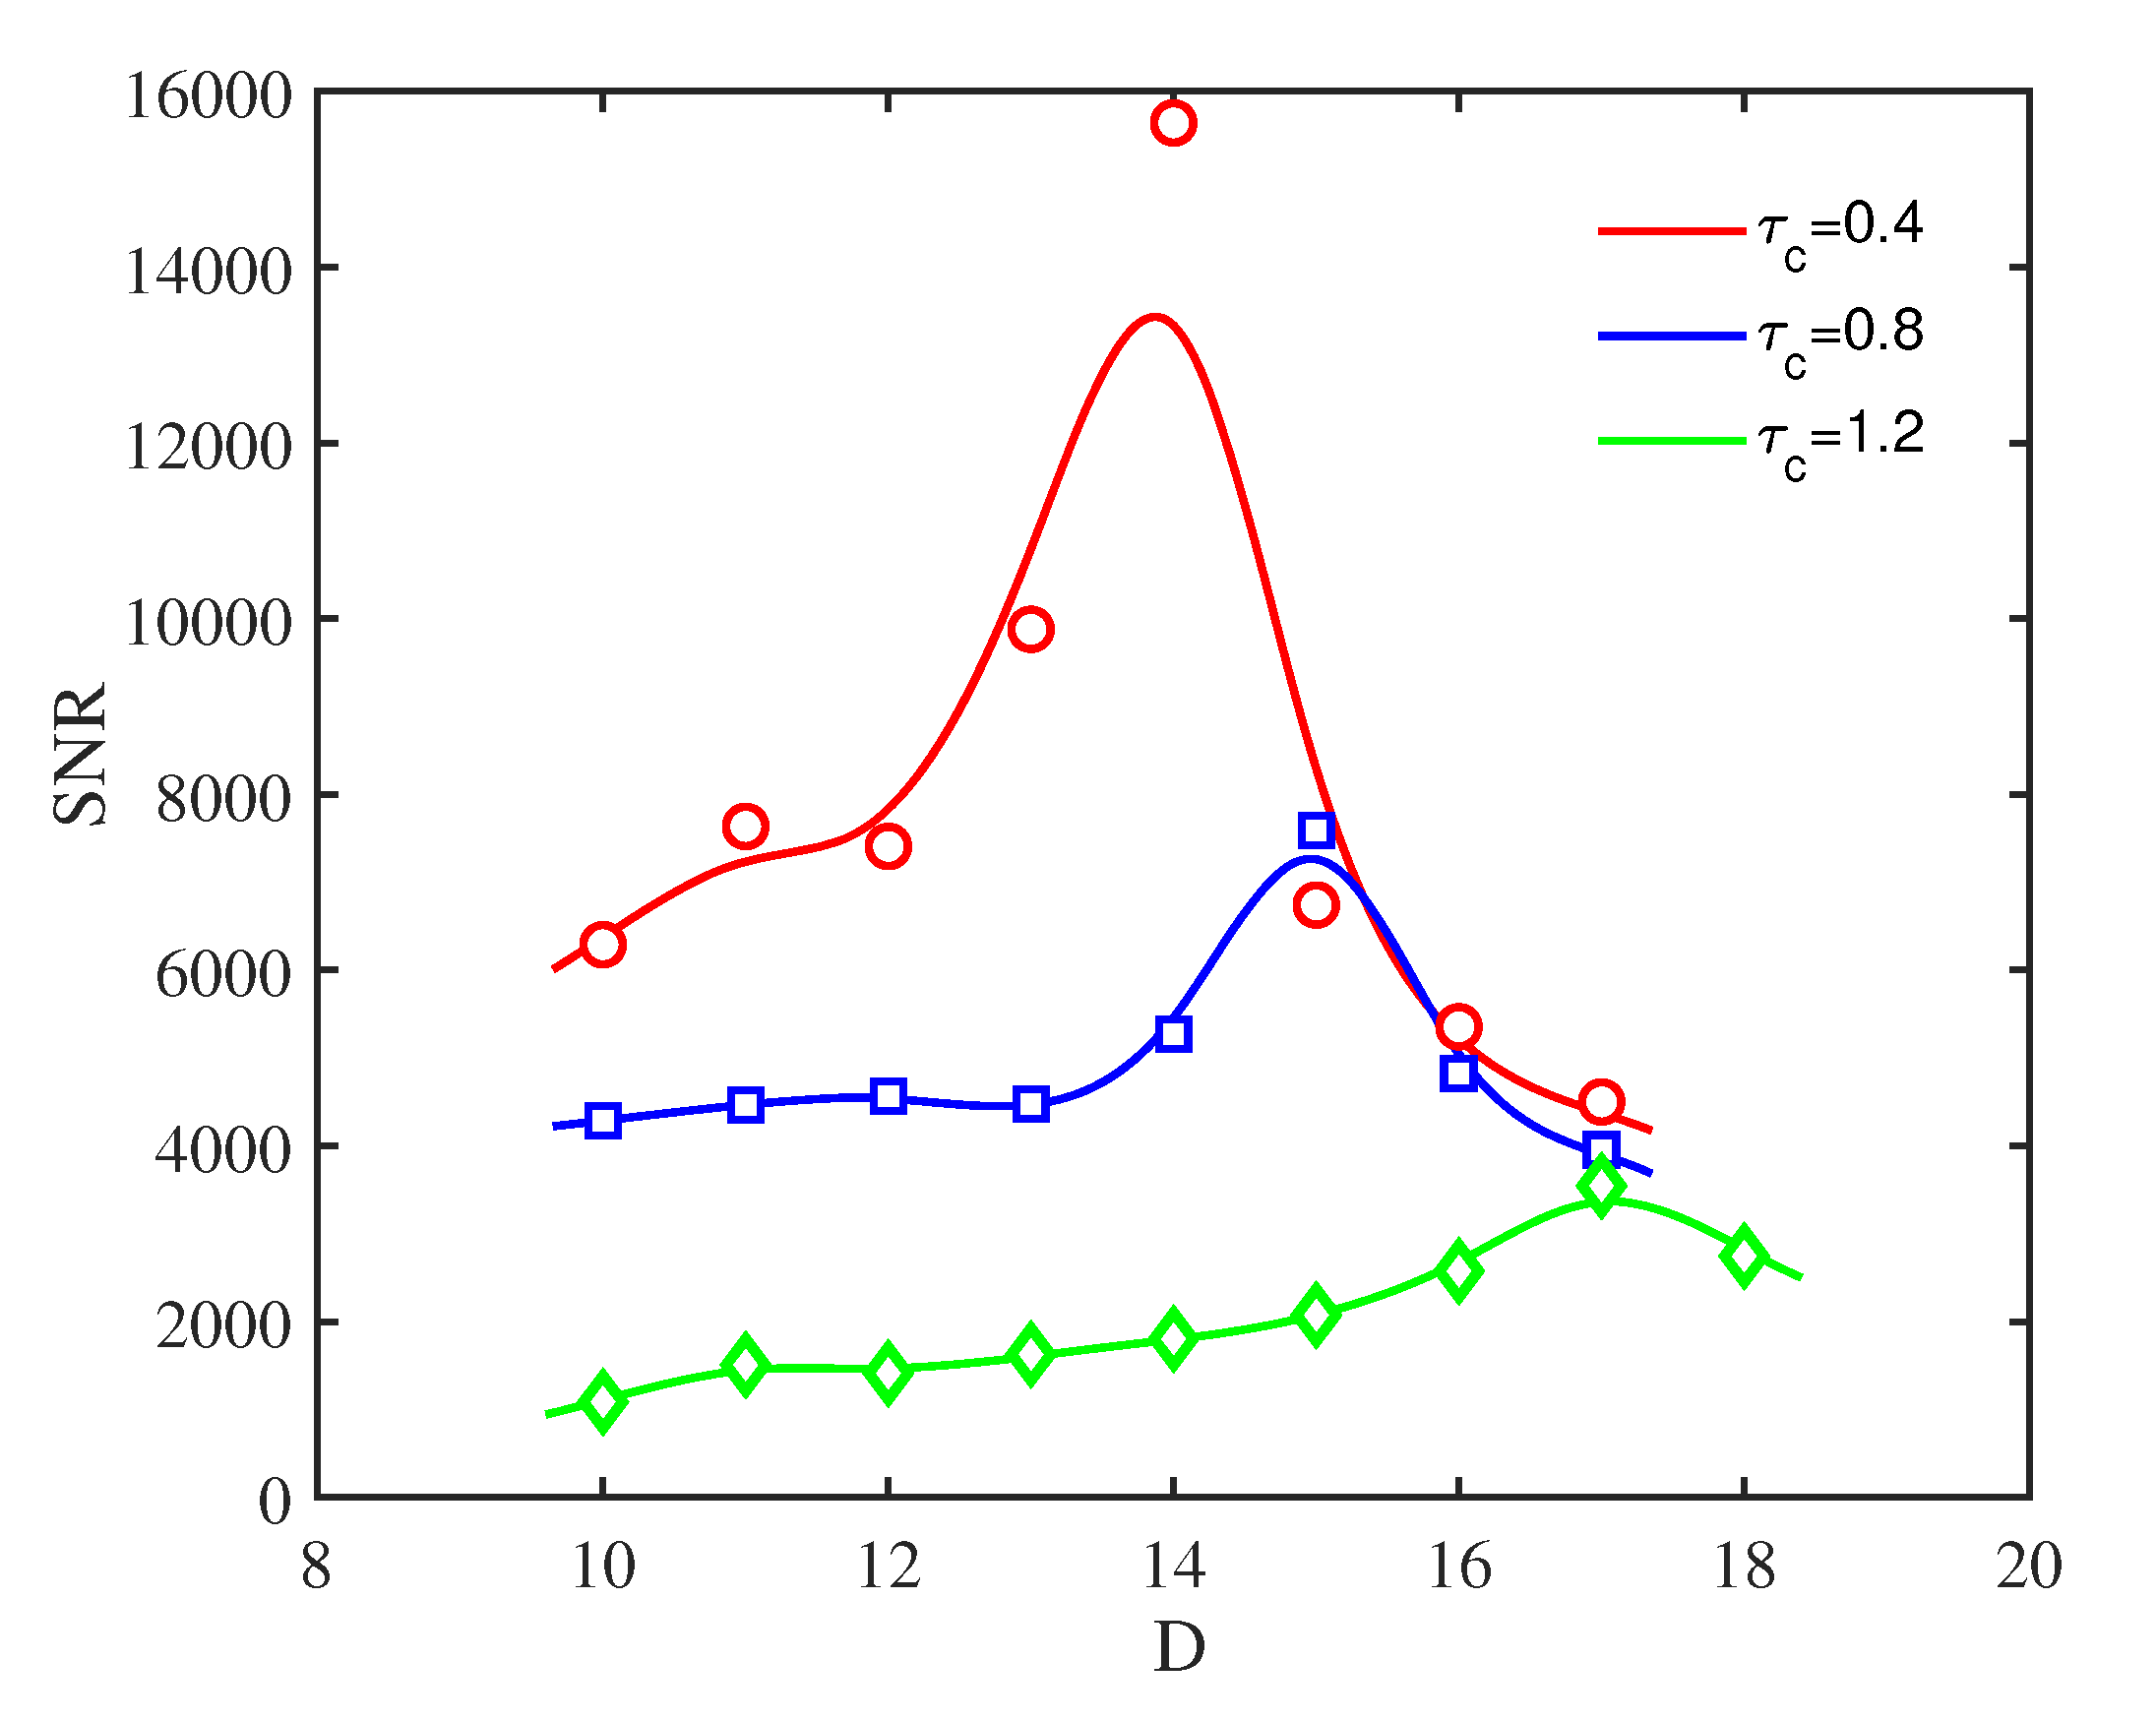
The dependence of the SNR on the noise intensity D is evaluated in Figure 11. With an increased colored noise intensity D, the SNRs of the thermoacoustic system have resonance-like behaviors, and there is an optimal noise intensity where the SNR is maximized. Therefore, coherence resonance also occurs with respect to the noise intensity. Meanwhile, a larger τ c corresponds to a greater optimal noise intensity for coherence resonance.
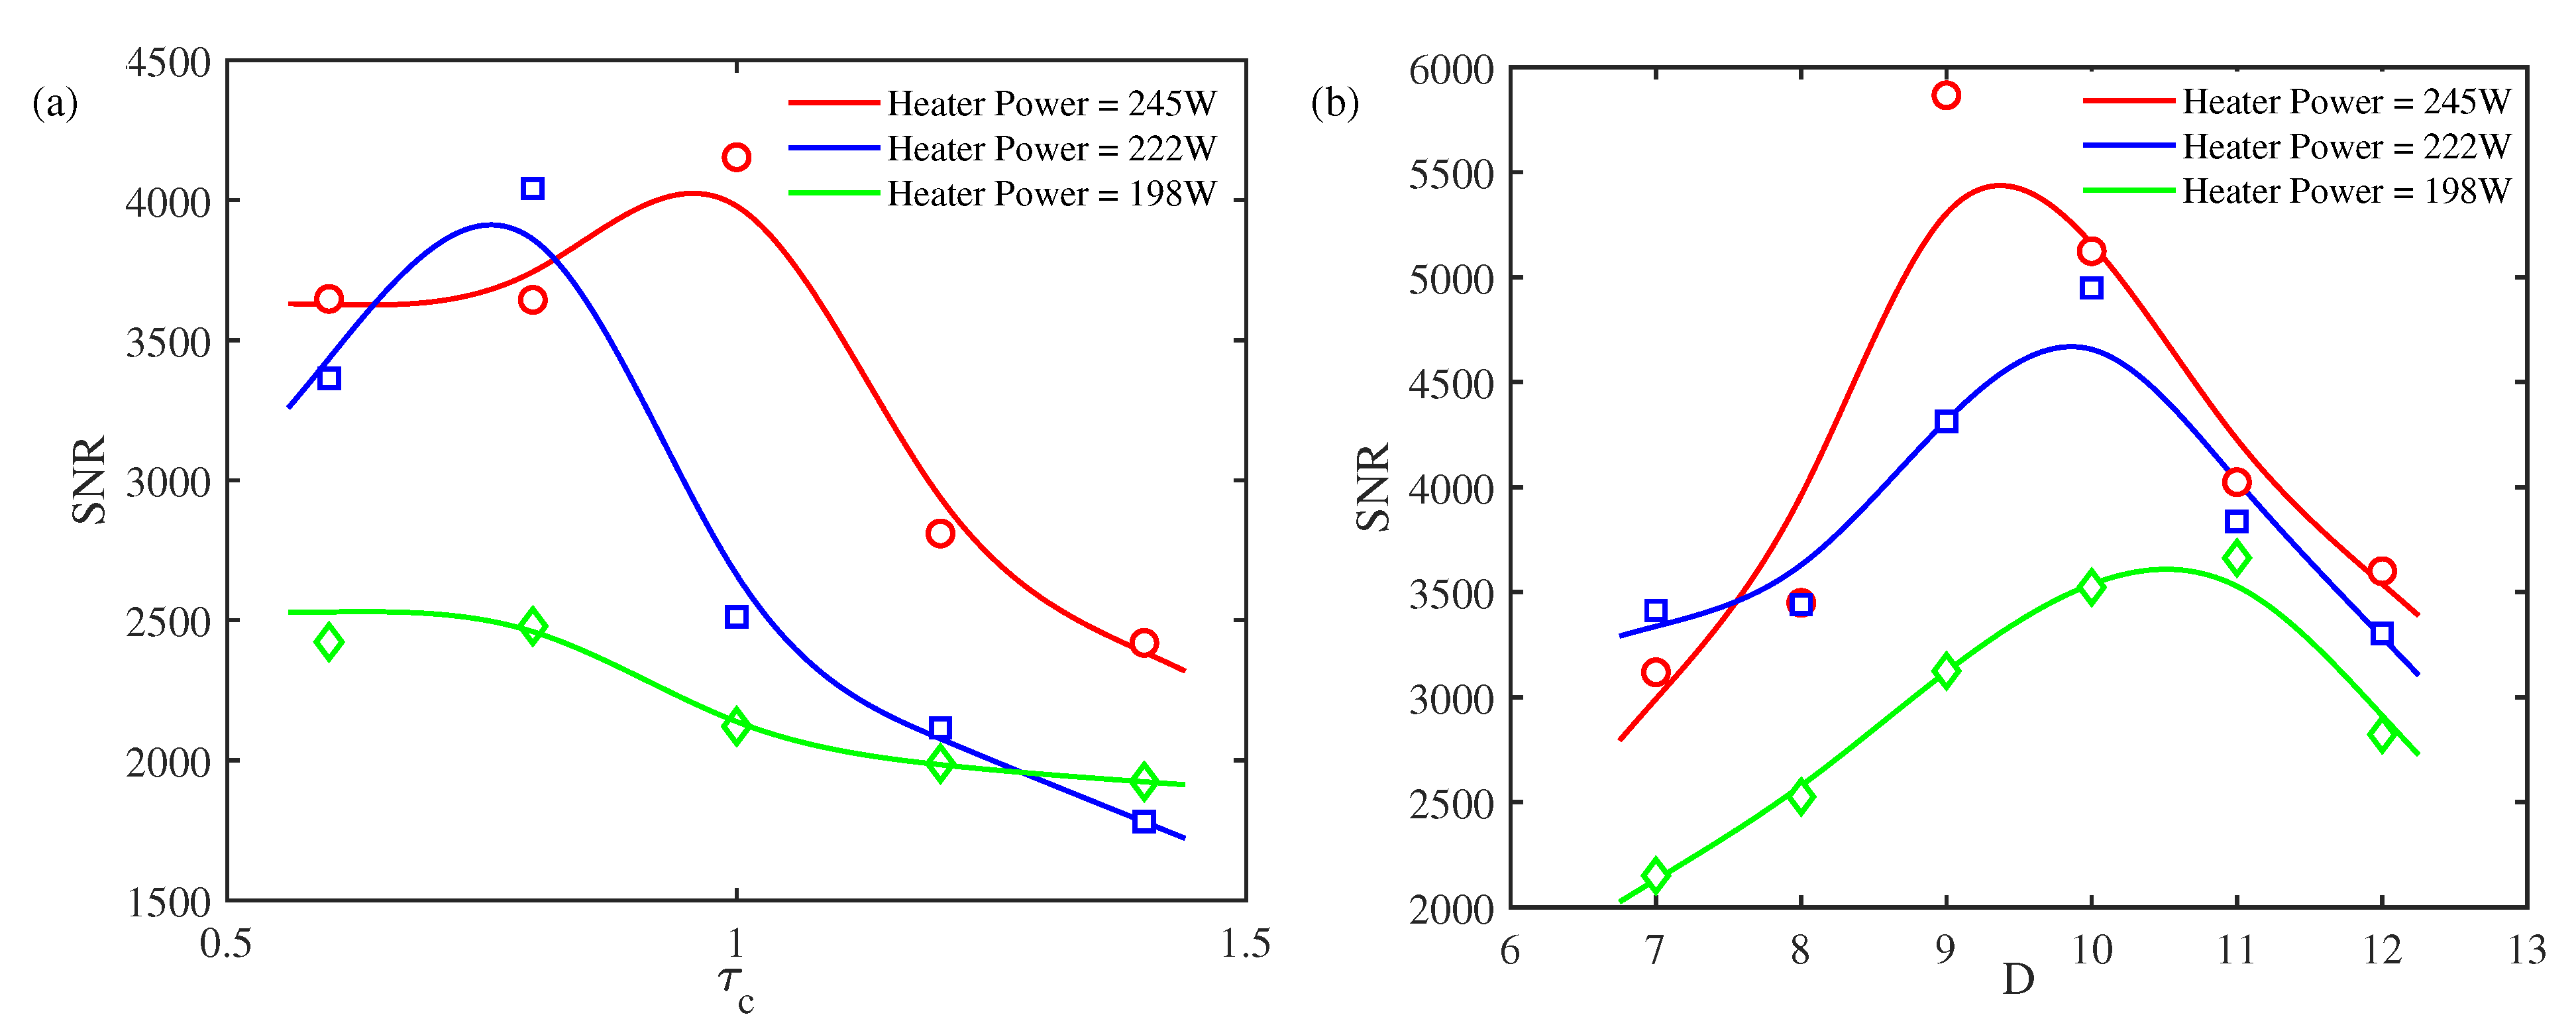
Finally, the dependence of the thermoacoustic system response SNR on the operating conditions (i.e., heating power) is evaluated in Figure 12. Figure 12(a) shows variations in the SNR with respect to the autocorrelation time τ c of the colored noise when the noise intensity is fixed at D = 7 . When the heating power is 198 W, the system is away from the bifurcation point, and an increased autocorrelation time for the colored noise leads to a nearly monotonic decrease in the SNR of the thermoacoustic system response. Thus, no coherence resonance is observed. By comparison, when the heating power is increased, a greater autocorrelation time τ c causes the blue and red SNR curves to increase first and then decrease. Both bell-shaped curves are observed when the system is close to the supercritical bifurcation point. That is, obvious coherence resonance behaviors in terms of τ c appear near the bifurcation point. The closer the system is configured to the supercritical bifurcation point, the larger the optimal autocorrelation time. Figure 12(b) shows variations in the SNR with respect to the noise intensity D with an autocorrelation time of the colored noise fixed at τ c = 0 . 4 . The three curves all exhibit the behaviors of coherence resonance. Similarly, as the autocorrelation time τ c is fixed and the system is configured to be closer to the supercritical bifurcation point, the maximum SNR increases and the optimal noise intensity decreases, which is consistent with the influence of white noise.
4. Conclusion

The stochastic characteristics of a Rijke-type standing-wave thermoacoustic system are studied experimentally. First, an experimental configuration for the Rijke-type thermoacoustic system is established. The turbulence-induced fluctuations in the combustor are modeled using OU-type colored noise. To introduce such low-pass colored noise in the experiment, the second-order Euler method is applied to solve the stochastic governing equation. The obtained random signal is then transmitted to waveform generators to create electrical signals before reaching the loudspeakers. Both supercritical and subcritical bifurcations are observed. The effects of colored noise on the system response are studied near the supercritical bifurcation point using the Rijke-type experimental system. The results show that (1) decreasing the autocorrelation time τ c or increasing the noise intensity D would increase the most probable amplitude of the acoustic oscillation r m and make the system oscillate more intensely; (2) The correlation function of the acoustic pressure decreases exponentially when the time lag increases and oscillates with a nearly constant amplitude for time lags larger than 35. In addition, increasing τ c or decreasing D would slow the decreasing trend of the envelope of C ( τ ) and enhance the correlation of the thermoacoustic response; (3) The correlation time of the acoustic pressure τ N I O increases linearly with respect to the autocorrelation time τ c but becomes nonlinearly when τ c is greater than a critical value. Decreasing the noise intensity D also increases the correlation time; (4) Resonance-like behaviors of the SNR are observed in the experiment with respect to the two main parameters of colored noise, which suggests the occurrence of coherence resonance in the Rijke-type thermoacoustic system. For a fixed heater power, a larger noise intensity D corresponds to a greater optimal autocorrelation time τ c in the coherence resonance, while a larger autocorrelation time τ c corresponds to a greater optimal noise intensity and smaller SNR peak. Lastly, when the thermoacoustic system is configured to be closer to the stability boundary, the correlation function C ( τ ) slowly decreases with the time lag, and the correlation time increases. Meanwhile, the SNR peak becomes larger, the optimal autocorrelation time τ c increases, and the optimal noise intensity decreases.

Author Contributions

Conceptualization, Li X.Y.; methodology, Wang Y.H.; software, Zhang H. and Wang Y.H.; validation, Zhang H.; formal analysis, Zhang H.; investigation, Zhang H. and Wang Y.H.; resources, Li X.Y.; data curation, Zhang. H; writing—original draft preparation, Zhang H.; writing—review and editing, Li X.Y.; visualization, Chen G. and Sun Y.Z.; supervision, Li. X.Y.; project administration, Li X.Y.; funding acquisition, Li X.Y. All authors have read and agreed to the published version of the manuscript.

Funding

This research was funded by the National Natural Science Foundation of China [Grant number 52006012]

Conflicts of Interest

The authors declare no conflict of interest

References

  1. S. Zare, A. Tavakolpour-Saleh, A. Aghahosseini, R. Mirshekari, Thermoacoustic stirling engines: A review, International Journal of Green Energy 20 (1) (2023) 89–111. [CrossRef]
  2. M. Ja’fari, A. J. Jaworski, On the nonlinear behaviour of oscillatory flow in a high pressure amplitude standing-wave thermoacoustic heat engine, International Journal of Heat and Mass Transfer 201 (2023) 123595. [CrossRef]
  3. G. Chen, L. Tang, B. R. Mace, Bistability and triggering in a thermoacoustic engine: A numerical study, International Journal of Heat and Mass Transfer 157 (2020) 119951. [CrossRef]
  4. B. Ma, J. Li, Z. Zhang, Y. Xi, D. Zhao, N. Wang, Experimental and theoretical studies on thermoacoustic limit cycle oscillation in a simplified solid rocket motor using flat flame burner, Acta Astronautica 189 (2021) 26–42. [CrossRef]
  5. T. Kanda, Y. Mishina, S. Hayasako, S. Muramatsu, K. Yamada, R. Kato, Experimental study on high-frequency combustion instability of liquid-propellant rocket engines using off-design combustion model, Acta Astronautica 202 (2023) 595–608. [CrossRef]
  6. T. Kanda, Y. Mishina, S. Hayasako, S. Muramatsu, K. Yamada, R. Kato, Experimental study on high-frequency combustion instability of liquid-propellant rocket engines using off-design combustion model, Acta Astronautica 202 (2023) 595–608. [CrossRef]
  7. F. Giuliani, P. Gajan, O. Diers, M. Ledoux, Influence of pulsed entries on a spray generated by an air-blast injection device: An experimental analysis on combustion instability processes in aeroengines, Proceedings of the Combustion Institute 29 (1) (2002) 91–98. [CrossRef]
  8. G. Zhang, X. Zhang, X. Wang, X. Sun, Modeling analysis of combustion instability in an annular combustor equipped with circumferentially segmented perforated liner, Journal of Sound and Vibration 549 (2023) 117573. [CrossRef]
  9. L. Hu, H. Zhou, Control of thermoacoustic oscillations and nox emissions by bias jets in the form of corner tangential slots, Combustion Science and Technology (2023) 1–22. [CrossRef]
  10. Y. Liu, P. Liu, Z. Wang, G. Xu, B. Jin, Numerical investigation of mode competition and cooperation on the combustion instability in a non-premixed combustor, Acta Astronautica 198 (2022) 271–285. [CrossRef]
  11. K. T. Kim, S. Hochgreb, Measurements of triggering and transient growth in a model lean-premixed gas turbine combustor, Combustion and Flame 159 (3) (2012) 1215–1227. [CrossRef]
  12. A. Chandh, S. Adhikari, D. Wu, R. McKinney, B. Emerson, Q. Zhang, D. Joshi, B. Sen, D. Davis, Experimental investigation of combustion dynamics in a high-pressure liquid-fueled swirl combustor, Journal of Engineering for Gas Turbines and Power 145 (6) (2023) 1–23. [CrossRef]
  13. A. I. Lemcherfi, R. Gejji, T. L. Fuller, W. E. Anderson, C. D. Slabaugh, Investigation of combustion instabilities in a full flow staged combustion model rocket combustor, in: AIAA Propulsion and Energy 2019 Forum, 2019, p. 3948. [CrossRef]
  14. X. Li, K. Pang, X. Li, The submerged nozzle damping characteristics in solid rocket motor, Aerospace 10 (2) (2023) 191. [CrossRef]
  15. C. F. Silva, Intrinsic thermoacoustic instabilities, Progress in Energy and Combustion Science 95 (2023) 101065. [CrossRef]
  16. D. Zhao, Transient growth of flow disturbances in triggering a Rijke tube combustion instability, Combustion and Flame 159 (6) (2012) 2126–2137. [CrossRef]
  17. X. Chen, S. Hemchandra, H. Fathy, J. O’Connor, Linear control of thermoacoustic oscillations with flame dynamics modeled by a level-set method, Combustion and Flame 237 (2022) 111686. [CrossRef]
  18. Y. Guan, W. He, M. Murugesan, Q. Li, P. Liu, L. K. Li, Control of self-excited thermoacoustic oscillations using transient forcing, hysteresis and mode switching, Combustion and Flame 202 (2019) 262–275. [CrossRef]
  19. B. Mohan, S. Mariappan, Nonlinear stability analysis of intrinsic thermoacoustic modes in a one-dimensional longitudinal combustor, Combustion and Flame 215 (2020) 309–323. [CrossRef]
  20. T. Poinsot, Prediction and control of combustion instabilities in real engines, Proceedings of the Combustion Institute 36 (1) (2017) 1–28. [CrossRef]
  21. X. Li, B. Xu, X. Li, K. Pang, X. Li, H. Zhang, Effects of multiplicative and additive colored noises on the stability of a simplified thermoacoustic combustor, Combustion and Flame 249 (2023) 112413. [CrossRef]
  22. N. Noiray, B. Schuermans, Deterministic quantities characterizing noise driven Hopf bifurcations in gas turbine combustors, International Journal of Non-Linear Mechanics 50 (2013) 152–163. [CrossRef]
  23. Y. Xi, X. Li, Y. Wang, B. Xu, N. Wang, D. Zhao, Experimental study of transition to instability in a rijke tube with axially distributed heat source, International Journal of Heat and Mass Transfer 183 (2022) 122157. [CrossRef]
  24. L. Kabiraj, N. Vishnoi, A. Saurabh, A review on noise-induced dynamics of thermoacoustic systems, Dynamics and Control of Energy Systems (2020) 265–281. [CrossRef]
  25. F. E. C. Culick, L. Paparizos, J. Sterling, V. Burnley, Combustion noise and combustion instabilities in propulsion systems, in: Advisory Group for Aerospace Research and Development Conference Proceedings 512, 1992, pp. 1–18.
  26. P. Clavin, J. Kim, F. Williams, Turbulence-induced noise effects on high-frequency combustion instabilities, Combustion Science and Technology 96 (1-3) (1994) 61–84. [CrossRef]
  27. T. C. Lieuwen, A. Banaszuk, Background noise effects on combustor stability, Journal of Propulsion and Power 21 (1) (2005) 25–31. [CrossRef]
  28. E. A. Gopalakrishnan, J. Tony, E. Sreelekha, R. I. Sujith, Stochastic bifurcations in a prototypical thermoacoustic system, Physical Review E 94 (2) (2016) 22203. [CrossRef]
  29. P. Subramanian, R. I. Sujith, P. Wahi, Subcritical bifurcation and bistability in thermoacoustic systems, Journal of Fluid Mechanics 715 (2013) 210–238. [CrossRef]
  30. R. S. Bhavi, I. Pavithran, A. Roy, R. Sujith, Abrupt transitions in turbulent thermoacoustic systems, Journal of Sound and Vibration 547 (2023) 117478. [CrossRef]
  31. T. C. Lieuwen, Statistical characteristics of pressure oscillations in a premixed combustor, Journal of Sound and Vibration 260 (1) (2003) 3–17. [CrossRef]
  32. M. P. Juniper, Triggering in the horizontal Rijke tube: non-normality, transient growth and bypass transition, Journal of Fluid Mechanics 667 (2011) 272–308. [CrossRef]
  33. V. Jegadeesan, R. I. Sujith, Experimental investigation of noise induced triggering in thermoacoustic systems, Proceedings of the Combustion Institute 34 (2) (2013) 3175–3183. [CrossRef]
  34. X. Li, D. Zhao, B. Shi, Coherence resonance and stochastic bifurcation behaviors of simplified standing-wave thermoacoustic systems, The Journal of the Acoustical Society of America 145 (2) (2019) 692–702. [CrossRef]
  35. V. Nair, G. Thampi, R. Sujith, Intermittency route to thermoacoustic instability in turbulent combustors, Journal of Fluid Mechanics 756 (2014) 470–487. [CrossRef]
  36. D. Z. Xinyan Li, Coherence Resonance in a Premixed Combustor Driven by a Turbulence-induced Colored Noise, 24th International Congress on Sound and Vibration, 2017.
  37. Y. Zhang, Y. Jin, P. Xu, S. Xiao, Stochastic bifurcations in a nonlinear tri-stable energy harvester under colored noise, Nonlinear Dynamics 99 (2018) 879–897. [CrossRef]
  38. R. Rajaram, T. Lieuwen, Acoustic radiation from turbulent premixed flames, Journal of Fluid Mechanics 637 (2009) 357–385. [CrossRef]
  39. I. Waugh, M. Geuß, M. Juniper, Triggering, bypass transition and the effect of noise on a linearly stable thermoacoustic system, Proceedings of the Combustion Institute 33 (2) (2011) 2945–2952. [CrossRef]
  40. G. Bonciolini, E. Boujo, N. Noiray, Output-only parameter identification of a colored-noise-driven van-der-pol oscillator: Thermoacoustic instabilities as an example, Physical Review E 95 (6) (2017) 062217. [CrossRef]
  41. X. Li, Y. Wang, N. Wang, D. Zhao, Stochastic properties of thermoacoustic oscillations in an annular gas turbine combustion chamber driven by colored noise, Journal of Sound and Vibration 480 (2020) 115423. [CrossRef]
  42. J. Ma, T. Xiao, Z. Hou, H. Xin, Coherence resonance induced by colored noise near hopf bifurcation, Chaos: An Interdisciplinary Journal of Nonlinear Science 18 (4) (2008) 043116. [CrossRef]
  43. H. Gang, T. Ditzinger, C. Ning, H. Haken, Stochastic resonance without external periodic force, Physical Review Letters 71 (6) (1993) 807. [CrossRef]
Figure 1. Schematic diagram of the experimental Rijke-type thermoacoustic system driven by colored noise.
Preprints 71907 g001
Figure 2. (a) Time trace of the measured limit cycle oscillations for acoustic pressure, where the heater length is L h = 35 mm and the heater is located at x h = L / 4 . (b) FFT of the thermoacoustic system response.
Preprints 71907 g002
Figure 3. Gaussian colored noise signal and its corresponding power spectrum density with D = 4 and τ c = 0 . 1 .
Preprints 71907 g003
Figure 4. Time series of the measured acoustic pressure (a) before and (b) after adding colored noise ξ O U to the Rijke-type thermoacoustic system.
Preprints 71907 g004
Figure 5. (a) Time series of the acoustic pressure p ( t ) and the corresponding amplitude r ( t ) . (b) stationary PDF of the noise-induced oscillation amplitude P ( r ) when the thermoacoustic system is configured in the linearly stable region.
Preprints 71907 g005
Figure 6. (a) Dependence of the most probable amplitude r m on the autocorrelation time τ c , as the noise intensity varies. (b) times series of the measured acoustic pressure at D = 7 and τ c = 0 . 4 and 1 . 8 .
Preprints 71907 g006
Figure 7. (a) Variations in the autocorrelation function of the acoustic pressure C ( τ ) and the corresponding envelop with respect to the time lag τ , and variations in the envelope of C ( τ ) with respect to the (b) heat power, (c) autocorrelation time of the colored noise τ c , and (d) noise intensity D.
Preprints 71907 g007
Figure 8. Correlation time of the noise-induced motion τ N I O as a function of τ c (a) at different noise intensities D with a fixed heater power at 245 W and (b) different heater powers with a fixed noise intensity of D = 4 .
Preprints 71907 g008
Figure 9. Power spectral density of the acoustic pressure.
Preprints 71907 g009
Figure 10. (a) Variations in the SNR in terms of the autocorrelation time τ c at different noise intensities, and (b) sound pressure signals with the maximum and smallest SNRs with D = 25 .
Preprints 71907 g010
Figure 11. Variations in the SNR in terms of the noise intensity D at different autocorrelation times τ c with P w = 241 W.
Preprints 71907 g011
Figure 12. (a) Variations in the thermoacoustic system response SNR in terms of the autocorrelation time τ c at different heating powers with D = 7 , and (b) variations in the thermoacoustic system response SNR in terms of the noise intensity D at different heating powers with τ c = 0 . 4 .
Preprints 71907 g012
Disclaimer/Publisher’s Note: The statements, opinions and data contained in all publications are solely those of the individual author(s) and contributor(s) and not of MDPI and/or the editor(s). MDPI and/or the editor(s) disclaim responsibility for any injury to people or property resulting from any ideas, methods, instructions or products referred to in the content.
Copyright: This open access article is published under a Creative Commons CC BY 4.0 license, which permit the free download, distribution, and reuse, provided that the author and preprint are cited in any reuse.
Prerpints.org logo

Preprints.org is a free preprint server supported by MDPI in Basel, Switzerland.

Subscribe

© 2024 MDPI (Basel, Switzerland) unless otherwise stated