
Submitted:
25 April 2023
Posted:
26 April 2023
You are already at the latest version
Preprints on COVID-19 and SARS-CoV-2
Abstract
In this study, we use descriptive statistics and data visualization techniques to analyze datasets and identify patterns and relationships between bikeshare and other transportation modes. We also use regression analysis to quantify the impact of various factors on bikeshare usage. Our results indicate that bikeshare trips during the pandemic were much longer compared to pre-pandemic times. Moreover, usage of bikeshare differed by user group, with casual users showing a greater increase in usage compared to subscribers. We plotted bivariate choropleth maps to visualize the spatial distribution of changes in bikeshare usage. Our findings suggest that an increase in bikeshare travel was associated with a reduction in travel by ride-hailing and public transit, especially in the northern part of the city, indicating a potential replacement of other modes of transportation. On the western and southern boundary of the city, bikeshare had a complementary effect with other modes. Overall, the data acquired for this study provides a valuable opportunity to understand the behavior of bikeshare users in Chicago, the intercorrelation of bikeshare with other transportation modes, and the impact of infrastructure on bikeshare usage. The findings of this study can inform the design and implementation of bikeshare systems in other cities and contribute to the development of a more sustainable transportation system.
Keywords:
Bikeshare
; COVID-19
; Bicycles
Introduction
During the COVID-19 pandemic, all modes of transportation experienced a significant drop in volumes due to stay-at-home orders. (Du and Rakha, 2020a, Du and Rakha, 2020b, Du et al., 2021). As people reduced their travels to only necessary trips, bikeshare emerged as a popular option due to its open-air and natural distancing features. This study aims to examine the variation in bikeshare usage during the pandemic, its interaction with other modes of transportation, and explore potential policies to promote bikeshare usage along with public transit.
To answer our research questions, which include analyzing the changes in bikeshare travel over the pandemic, identifying geographic variations in the changes, examining the interaction of bikeshare with other modes of transportation across locations, and exploring the possibility of encouraging bikeshare usage in connection with transit post-pandemic, we studied multiple modes of transportation, including bikeshare, ridehailing, and public transit, before and during the pandemic. We intentionally removed the effects of weather, which is a significant contributor to bike usage, to eliminate differences in impacts by weather on different travel modes.
Given the increase in bikeshare usage during the pandemic, the results of this study are especially relevant now more than ever. They can help policy makers to improve the design of bikeshare systems, promote the positive relationship between bikeshare and public transit, and facilitate the development of a more environmentally friendly and equitable transport system.
Background and Literature Review
Bikeshare is a convenient, relatively inexpensive, and eco-friendly mode of transportation that offers multiple advantages over other modes. Several previous studies have investigated features of bikeshare travel, users, weather impacts, interaction of bikeshare with other modes, and policy- or economics-related topics. In this section, we focus on the intercorrelation of bikeshare and other transportation modes.
Kong et al. (Kong et al., 2020) identified three types of bikeshare trips in terms of their interaction with public transit: modal substitution (MS), modal integration (MI), and modal complementation (MC). The majority of bikeshare trips fall into either MC or MS categories. MI trips typically occur during weekdays, while MC trips are more likely to happen when public transit is not available. Casual users tend to make MS trips more frequently than subscribers. Welch et al. (Welch et al., 2020) investigated the role of the built environment and other factors affecting travelers’ choices of travel modes. They found two important factors positively linked to bikeshare: lower cost and an environment buildup with higher job diversity and lower road density. Shaheen et al. (Shaheen et al., 2012) concluded that bikeshare can both increase and decrease the usage of public transit. They found that among the four cities where they collected survey data from, three cities had a lower percentage of travelers claiming to use public transit more due to bikeshare usage than the percentage of users saying they used less public transit travel: Montreal, Toronto, and Washington, D.C. The only exception of the four was the Twin Cities (Minneapolis and Saint Paul, Minnesota). Using the same survey data in another more detailed analysis, Martin and Shaheen found that users who have a positive or negative change in public transit usage were spatially located in different areas. In Washington, D.C., those who used public transit more lived on the urban periphery, whereas those living in the center of the city used public transit less. In Minneapolis, the intercorrelation of bikeshare differed with rails and buses: the shift toward rail extends to the urban core, while the modal shift for buses is more dispersed. The authors suggested that bikeshare may be more complementary to public transit in smaller cities and will become a substitution for public transit in larger cities (Martin and Shaheen, 2014).
Fishman et al. (Fishman et al., 2014) used survey data from five cities to study the car substitution of bikeshare. Their conclusion is that by replacing car travelling to bikeshare, Melbourne saved a total of 115,826 km of car travelling and London saved 632,841 km in 2012. However, the need to rebalance the bikes at different stations, more truck mileage was generated. The total mileages traveled by motor vehicle support services was 344,446 km more than the vehicle kilometers of travel avoided.
Jappinen et al. (Jäppinen et al., 2013) compared the travel time between using public transit alone between a given origin and destination by public transit at a given time of a day to using public transit jointly with bikeshare. They estimated the potential travel time savings that can be offered by bikeshare and found that on average, travel time would be 6 minutes shorter when combining public transit with bikeshare. The authors concluded that if a bikeshare system has a scale that is large enough, it is possible to complement a traditional public transit system with bikeshare services. Campbell and Brakewood estimated that bikeshare could compete with buses, resulting in a 2.42% decrease in bus trips per thousand docks along a bus route (Campbell and Brakewood, 2017). In contrast, Ma et al. concluded that there is a 2.8% increase in average daily Metrorail ridership for a 10% increase in annual bikeshare ridership (Ma et al., 2015). Fuller et al. studied bikeshare travel data during a transit strike in Philadelphia. They found that large-scale adoption of biking as a transportation mode is possible if there is no public transit available. Their study recommended enhancing the service on rebalancing bikes so that travelers will have more convenient access to bikeshare stations where needed (Fuller et al., 2019). Saberi et al. found that when public transportation is constrained, a large-scale adoption of cycling can occur, indicating a similarity in the pool of public transportation users and bike users (Saberi et al., 2018). Singleton and Clifton believed that although cycling and transit currently substitute for each other, in the long run, they could complement each other. (Singleton and Clifton, 2014).
Du et al. studied changes in different travel modes since the outbreak of COVID-19 (Du and Rakha, 2020a, Du and Rakha, 2020b, Du et al., 2021) and concluded that the traffic volumes changed before and during the COVID varied by modes. In the study by Hu et al., they found that the usage of bikeshare during the pandemic decreased more significantly in the center of the city compared to other areas (Hu et al., 2021). Teixeira and Lopes found that there was a 90% drop in subway travel during the pandemic, but only a 71% decrease in bikeshare trips in New York City. They concluded that bikeshare is more resilient and rebound more quickly than public transit systems (Teixeira and Lopes, 2020). Bucsky conducted a study in Hungary investigating the modal share of public transit, car usage, and bikeshare during the pandemic and concluded that bikeshare became more popular (Bucsky, 2020). Song et al. compared bikeshare travel during different stages of the pandemic in Singapore. They concluded that bikeshare systems may replace public transit during the pandemic. They also found that residential towns and the city center had a higher demand of bikeshare compared to other urban areas (Song et al., 2022b). Nikiforiadis et al. analyzed some survey data from Thessaloniki, Greece to study the acceptance of bikeshare as a commuting mode. Their conclusion showed that bikeshare is more likely to be adopted as a regular travel mode for travelers who were previously commuting with private cars as passengers (not as drivers) and existing bikeshare subscribers (Nikiforiadis et al., 2020). A study by Kim and Cho indicated that during the COVID-19 pandemic, bikeshare became less competitive with bus transit and more likely to complement the public transit system. They concluded that bikeshare increases the overall resilience of the public transit system by providing alternatives to short-term bus trips and long-term subway trips during emergencies (Kim and Cho, 2022). Jie et al. believed that bikeshare has different impacts on different types of trips. Shorter public transit trips may be more likely to be replaced by bikeshare. When the public transit system has reduced capacity, bikeshare may have the ability to absorb the additional travel demand (Song et al., 2022a).
Previous research on bikeshare has largely focused on pre-pandemic usage or changes in bikeshare patterns during the pandemic. However, our study aims to address this gap by identifying key features of bikeshare travel, examining its correlations with other modes, and assessing the needs of the bikeshare system post-pandemic. Although bikeshare has been recognized as a promising mode for reducing emissions in the transportation system, it has not been fully utilized due to the availability of other modes. The pandemic presents an opportunity to study bikeshare usage since travelers have been limiting their usage of other modes. By investigating their travel behavior during the pandemic, we can improve the design of bikeshare systems and encourage people to make better use of bikeshare to create a more sustainable transportation system.
Data Exploration and Analysis
According to previous research, bikeshare users' behavior differs depending on whether they are subscribers or casual users, as well as on weekdays versus weekends. Therefore, in our study, we will analyze the data by categorizing it into subscribers or casual users and weekday or weekend trips. The following datasets were collected for this study:
- Public transit ridership (bus by route and rail by station) (Chicago, 2022);
- Uber and Lyft trips;
- Bike lane types and locations (CDOT). Figure 1 shows the biking facilities. The biking system in Chicago has a total of 342 miles bike lanes. Amon them, there are 62 miles of neighborhood greenway and protected bike lanes, about 100 miles of buffered bike lanes, and 167 miles of shared bike lanes.
- Bikeshare data was obtained from DIVVY®. As of September 2021, Divvy operated 16,500 bicycles and over 800 stations. Data from 2019 were downloaded from the Chicago data portal, and the data from 2020 were obtained from the DIVVY website (DIVVY, 2022).
Table 1 through Table 3 present statistics on bikeshare, ride-hailing, and public transit ridership. Casual users were found to make significantly more bikeshare trips, with similar travel times in 2020 compared to 2019 on weekdays. On weekends, casual users traveled slightly less but increased their bikeshare travel time. Meanwhile, subscribers made fewer bikeshare trips overall, but experienced a significant increase in trip time. Both user groups had a large standard deviation for trip time, indicating greater variation in bike trips. Table 2 illustrated changes in ride-hailing behavior, with both weekdays and weekends observing a dramatic drop in trip frequency. However, trip lengths increased while trip times decreased in 2020, likely due to reduced traffic flow and network congestion during the pandemic. Table 3 shows the ridership of public transit. The use of public transit decreased significantly, especially for rail, while ridership decreased by 81% (weekdays) and 77% (weekends).
Figure 2 presents the mode share of trips in 2019 (top) and 2020 (bottom). Except for bikeshare, the usage of all modes remained consistent throughout 2019. However, bikeshare usage varied seasonally, with a low volume during the cold months, peaking during the summer, and then dropping again as the temperature decreased. In 2020, the pandemic brought a different pattern of bikeshare usage, with a significant decrease during the shelter-in-place order in March, followed by a slow recovery in May. During the summer, bikeshare usage reached its peak and remained high until November. This shift in bikeshare usage patterns during the pandemic highlights the need for a more detailed study of bikeshare usage during and after the pandemic. This study aims to explore the potential of bikeshare as a routine commuting mode and its compatibility with public transit. To eliminate the effects of weather on bikeshare usage, we removed days with inclement weather using criteria suggested by previous studies (Brandenburg et al., 2007, Gallop et al., 2011, Tin Tin et al., 2012, Lewin, 2011, Miranda-Moreno and Nosal, 2011), including a temperature above 70 Fahrenheit, wind speed below 7 mph, rain less than 0.1 inches/day, and no snow. We extracted a total of 66 good-weather days, with 28 days (20 weekdays and 8 weekends) in 2019 and 38 days (29 weekdays and 9 weekends) in 2020, using weather data obtained from the Global Historical Climatology Network (Network, 2022).
In this paper, we concentrate on the volume changes of different modes instead of the trip counts. Equation (1) is used for calculating the percentage of volume changes for all the other modes besides bikeshare from 2019 to 2020, :
where indicates modes, is the indicator of weekdays or weekends, and delegates the location (rail station, bus routes, or census tract for ridehailing) in which or occurred..
The for bikeshare was calculated (by casual users or subscribers) using the equation below for each station , where is either subscriber or casual user.
Figure 3 presents the histogram of for each mode. The ridership of rail travel was hit the hardest during the pandemic, with most stations experiencing a 50% to 100% decrease in ridership. The majority of bus routes also experienced a decline in ridership by 50% to 75%. The frequency of ridehailing trips also decreased, with a reduction in trips of over 50% in most cases. Although subscribers of bikeshare made fewer trips overall in 2020 than in 2019, half of the bike stations observed an increase in bikeshare trips by subscribers. On the other hand, casual users of bikeshare showed a significant increase in trips in 2020, with some stations reporting double or triple the number of trips compared to the previous year.
Spatial Correlation of Bikeshare versus Rail, Bus, and Ridehailing
In this section, we employ bivariate choropleth maps generated by ArcGIS Pro® to demonstrate the relationship between bikeshare and other modes of transportation. Bivariate color symbology displays the quantitative relationship between two variables: in this case, these two variables are: 1) the mean percentage change in the number of trips made by bikeshare stations; and 2) the of other modes from 2019 to 2020. is the mean of bike stations located within 0.25 miles, which is the reasonable walking distance recommended by the Federal Highway Administration (FHWA, 2013), of a specific location (rail station, a bus route, or a census tract), and the of mode at location of weekday or weekend (by casual users or subscribers) to other modes. The of other modes or of bikeshare is divided into three categories. The classification method used involves a combination of quantiles, which ensures equal observed frequency in each class, and manual classification, in which one of the cutoff values initially set by the quantile method is forced to zero to separate the positive and negative . Since the number of bikeshare stations around other modes varies depending on the location for each of the other modes, the cutoff values for the calculated of bikeshare differ. Error! Reference source not found. displays the ranges for each of the or selected in this study.
The color scheme is shown using three by three shades in Figure 4 through Figure 6, the darker blue color shows the surrounded bikeshare stations with larger and the darker red color shows the locations (a rail station, a bus route, or a census tract) with a larger . The combination of the two colors shows the relative changes of bikeshare with the other mode. Note that only bikeshare usage increased for some of the user and time categories. The volume of all other modes decreased during the pandemic. Therefore, the blue scheme indicates an increase or decrease in bikeshare trips. A darker blue color indicates an increase of bikeshare travel while a lighter color indicates a decrease of bikeshare travel. The red color scheme shows the degree of decreasing. When the color is darker, it means that the mode only decreased slightly. When the red color is lighter, it means that the mode decreased more remarkably. The numbers in the parentheses in the legend indicate the number of observations in that category. Figure 4 depicts the changes in bikeshare versus rail. The whole city can be divided into the following four areas. Along the shoreline of Lake Michigan (shown in the ovals), subscribers made significantly more trips around rail stations that either had significantly or moderately decreased rail ridership, especially during weekends. This indicates a possibility of bikeshare being used to replace rail transport in these areas. In the downtown area (shown in the rectangle), subscribers and casual users had similar trends: both had moderately changed bikeshare usage with significantly or moderately decreased rail ridership. This observation indicates that the stay-in-place order limited travel in the downtown area by rail but had a smaller impact on bikeshare. The western and southern areas of Chicago underwent minimal disturbance from the COVID-19 pandemic to rail travel (shown in the triangles). Meanwhile, the majority of the rail stations in these areas were surrounded by bikeshare stations that had either increased or stable usage. This observation suggests a possible complementary usage of the two modes. However, more survey data is needed to confirm this conjecture.
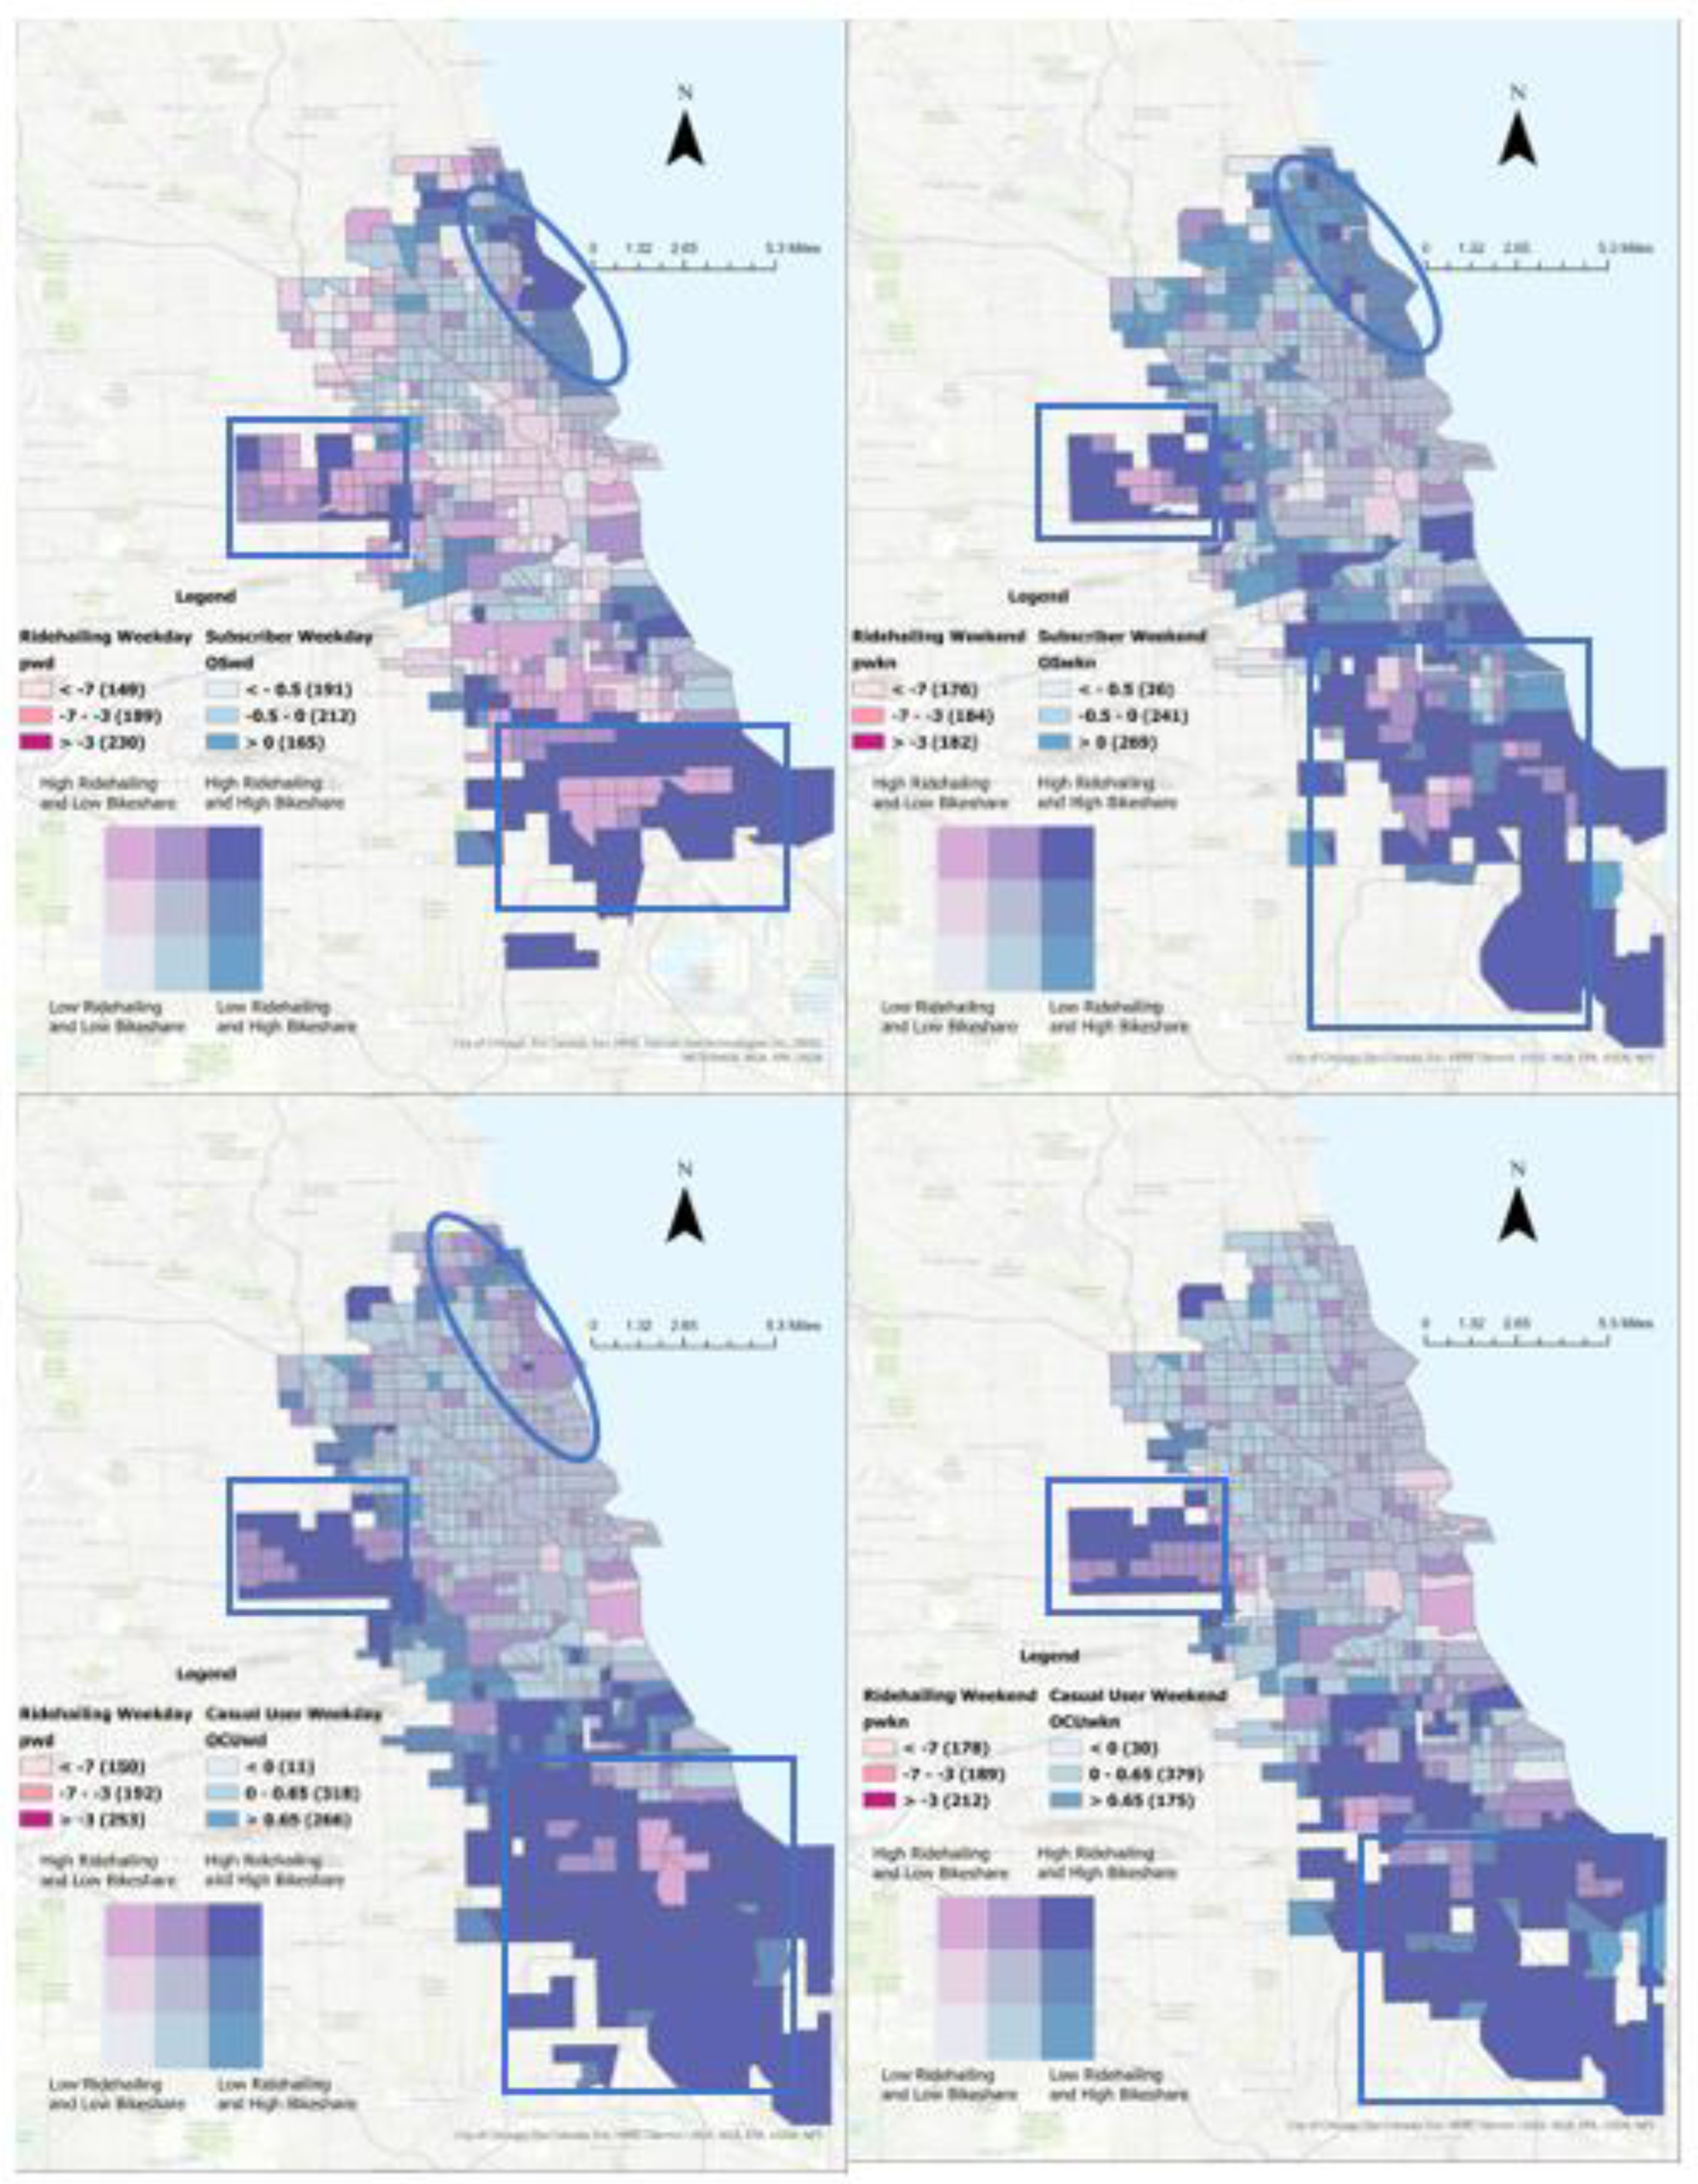
Figure 5 we observe the relationship between bus route ridership and bikeshare usage. As shown in the shallower colors for both color schemes within the rectangles, the ridership of buses decreased remarkably along with the decreased number of bikeshare trips in the center of the city, except for casual users’ travel behavior during weekdays. Overall, casual users made more bikeshare trips across the city, with varied reduction in bus route ridership during weekdays. During weekends, the increased bikeshare travel by casual users was more spatially distributed along bus routes in the southern part of the city. Similar trends can be observed for subscribers during weekdays, where both modes saw a larger area of decreased travel (left upper pane within the rectangle). Our analysis suggests a weak connection between the changes in bus route ridership and bikeshare travel. One possible explanation is the relatively long bus routes in Chicago, which are associated with more bike stations and hence compound varied trends at different locations of the bikeshare stations. Figure 6 shows the interaction between ridehailing and bikeshare travel aggregated by census tracts. The relationship of bikeshare with ridehailing ridership varies spatially. Along the lakeshore in the northern part of the city (shown in the ovals), subscribers increased their bikeshare travel. However, both ridehailing and bikeshare decreased in the downtown and middle part of the city for all user and time categories. On the western outskirts of the city, all user groups kept their ridehailing trips comparable to pre-pandemic years with minimum reduction of the ridehailing trips, while the bikeshare stations had varied changes of bikeshare trips. In the southern part of the city, most census tracts had mildly reduced ridehailing trips and varied changes in bikeshare travel during weekdays, while during weekends more census tracts had dramatically decreased bikeshare usage.
Overall, we observe clear spatial variations of relative changes in bikeshare with other modes. The different user groups and days of the week also contribute to these variations. Since our study focuses on the relationship between bikeshare travel and public transit trips, we will discuss the intercorrelation of bikeshare trips with travel by bus and rail in the next section.
Figure 5.
Relationship between Bus and bikeshare (left upper: subscribers weekday; left lower: casual users (CU) weekday; right upper: subscribers weekend; right lower: CU weekend).
Figure 5.
Relationship between Bus and bikeshare (left upper: subscribers weekday; left lower: casual users (CU) weekday; right upper: subscribers weekend; right lower: CU weekend).
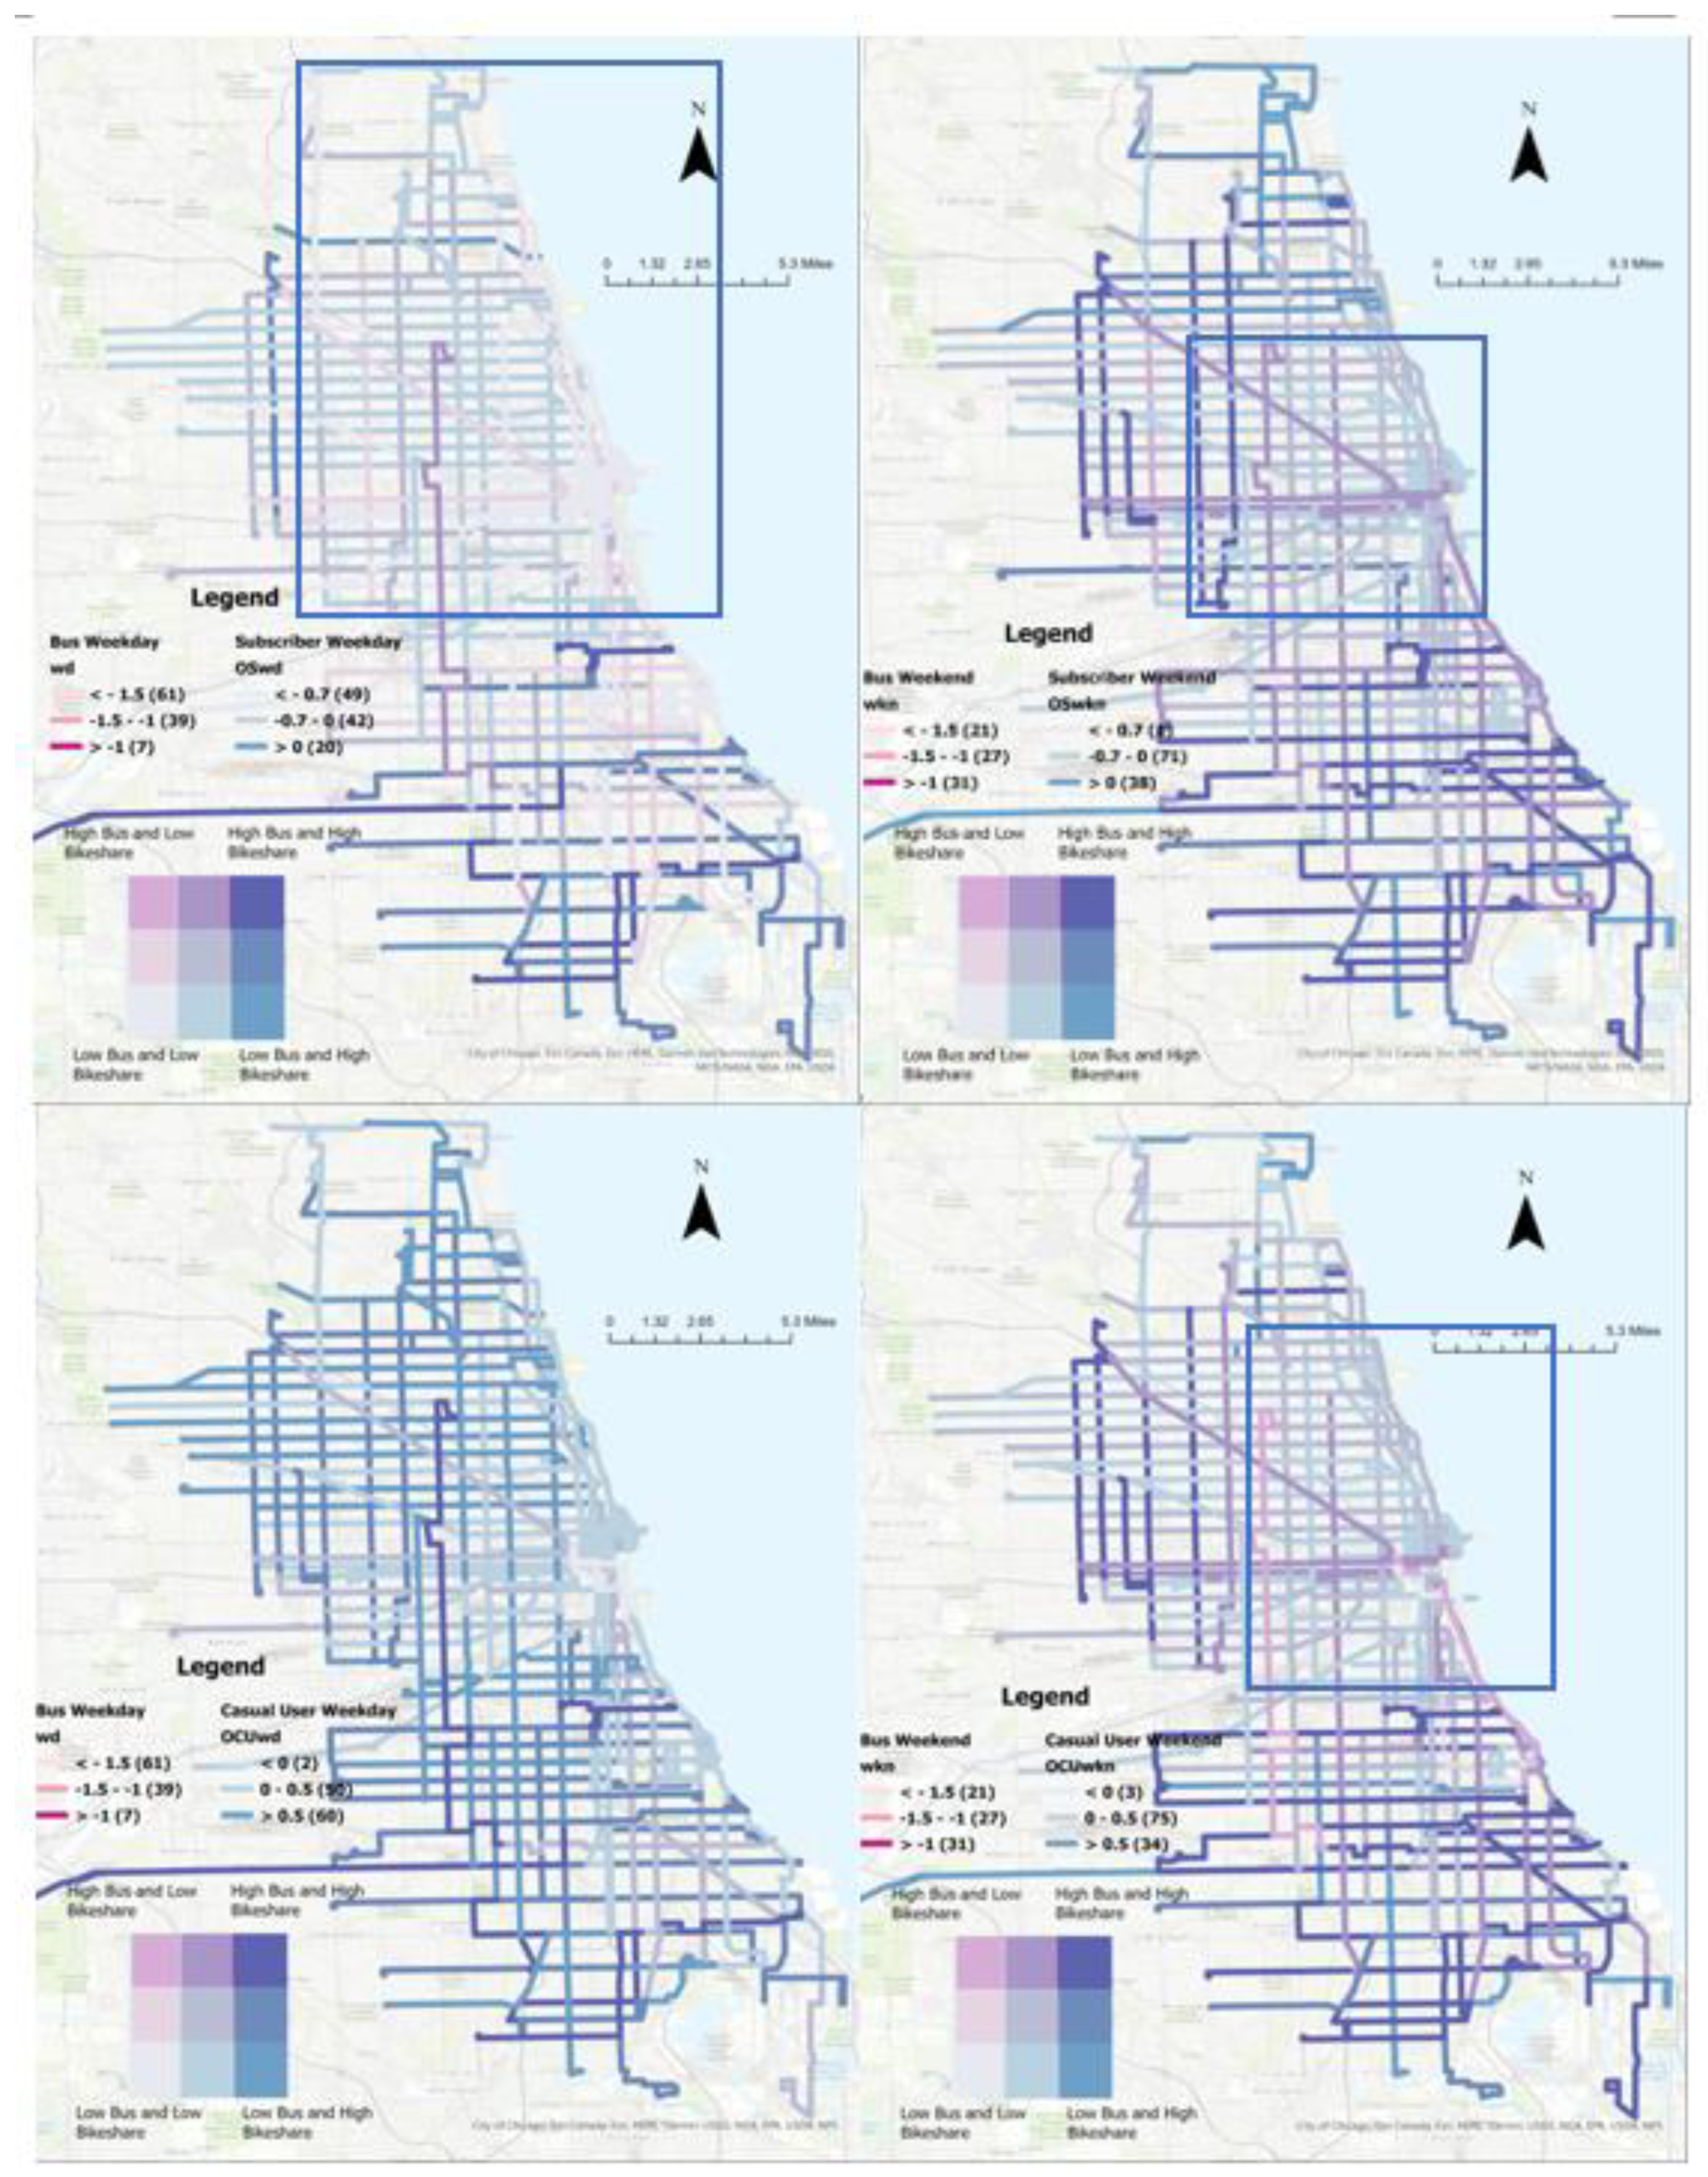
Figure 6.
Relationship between Ridehailing and bikeshare (left upper: subscribers weekday; left lower: casual users (CU) weekday; right upper: subscribers weekend; right lower: CU weekend).
Figure 6.
Relationship between Ridehailing and bikeshare (left upper: subscribers weekday; left lower: casual users (CU) weekday; right upper: subscribers weekend; right lower: CU weekend).
Regression Analysis
To quantify the relationship of distance traveled and public transit ridership with the number of bikeshare trips at each bike station, we fit a regression model for the percentage change in bikeshare usage at each bikeshare station, , from 2019 to 2020, using equation (3).
where , , are the distance of the bikeshare station to the closest rail station, bus route, and bike route, individually. and are the changes of rail and bus ridership from 2019 to 2020, respectively. , , and are three categorical variables.
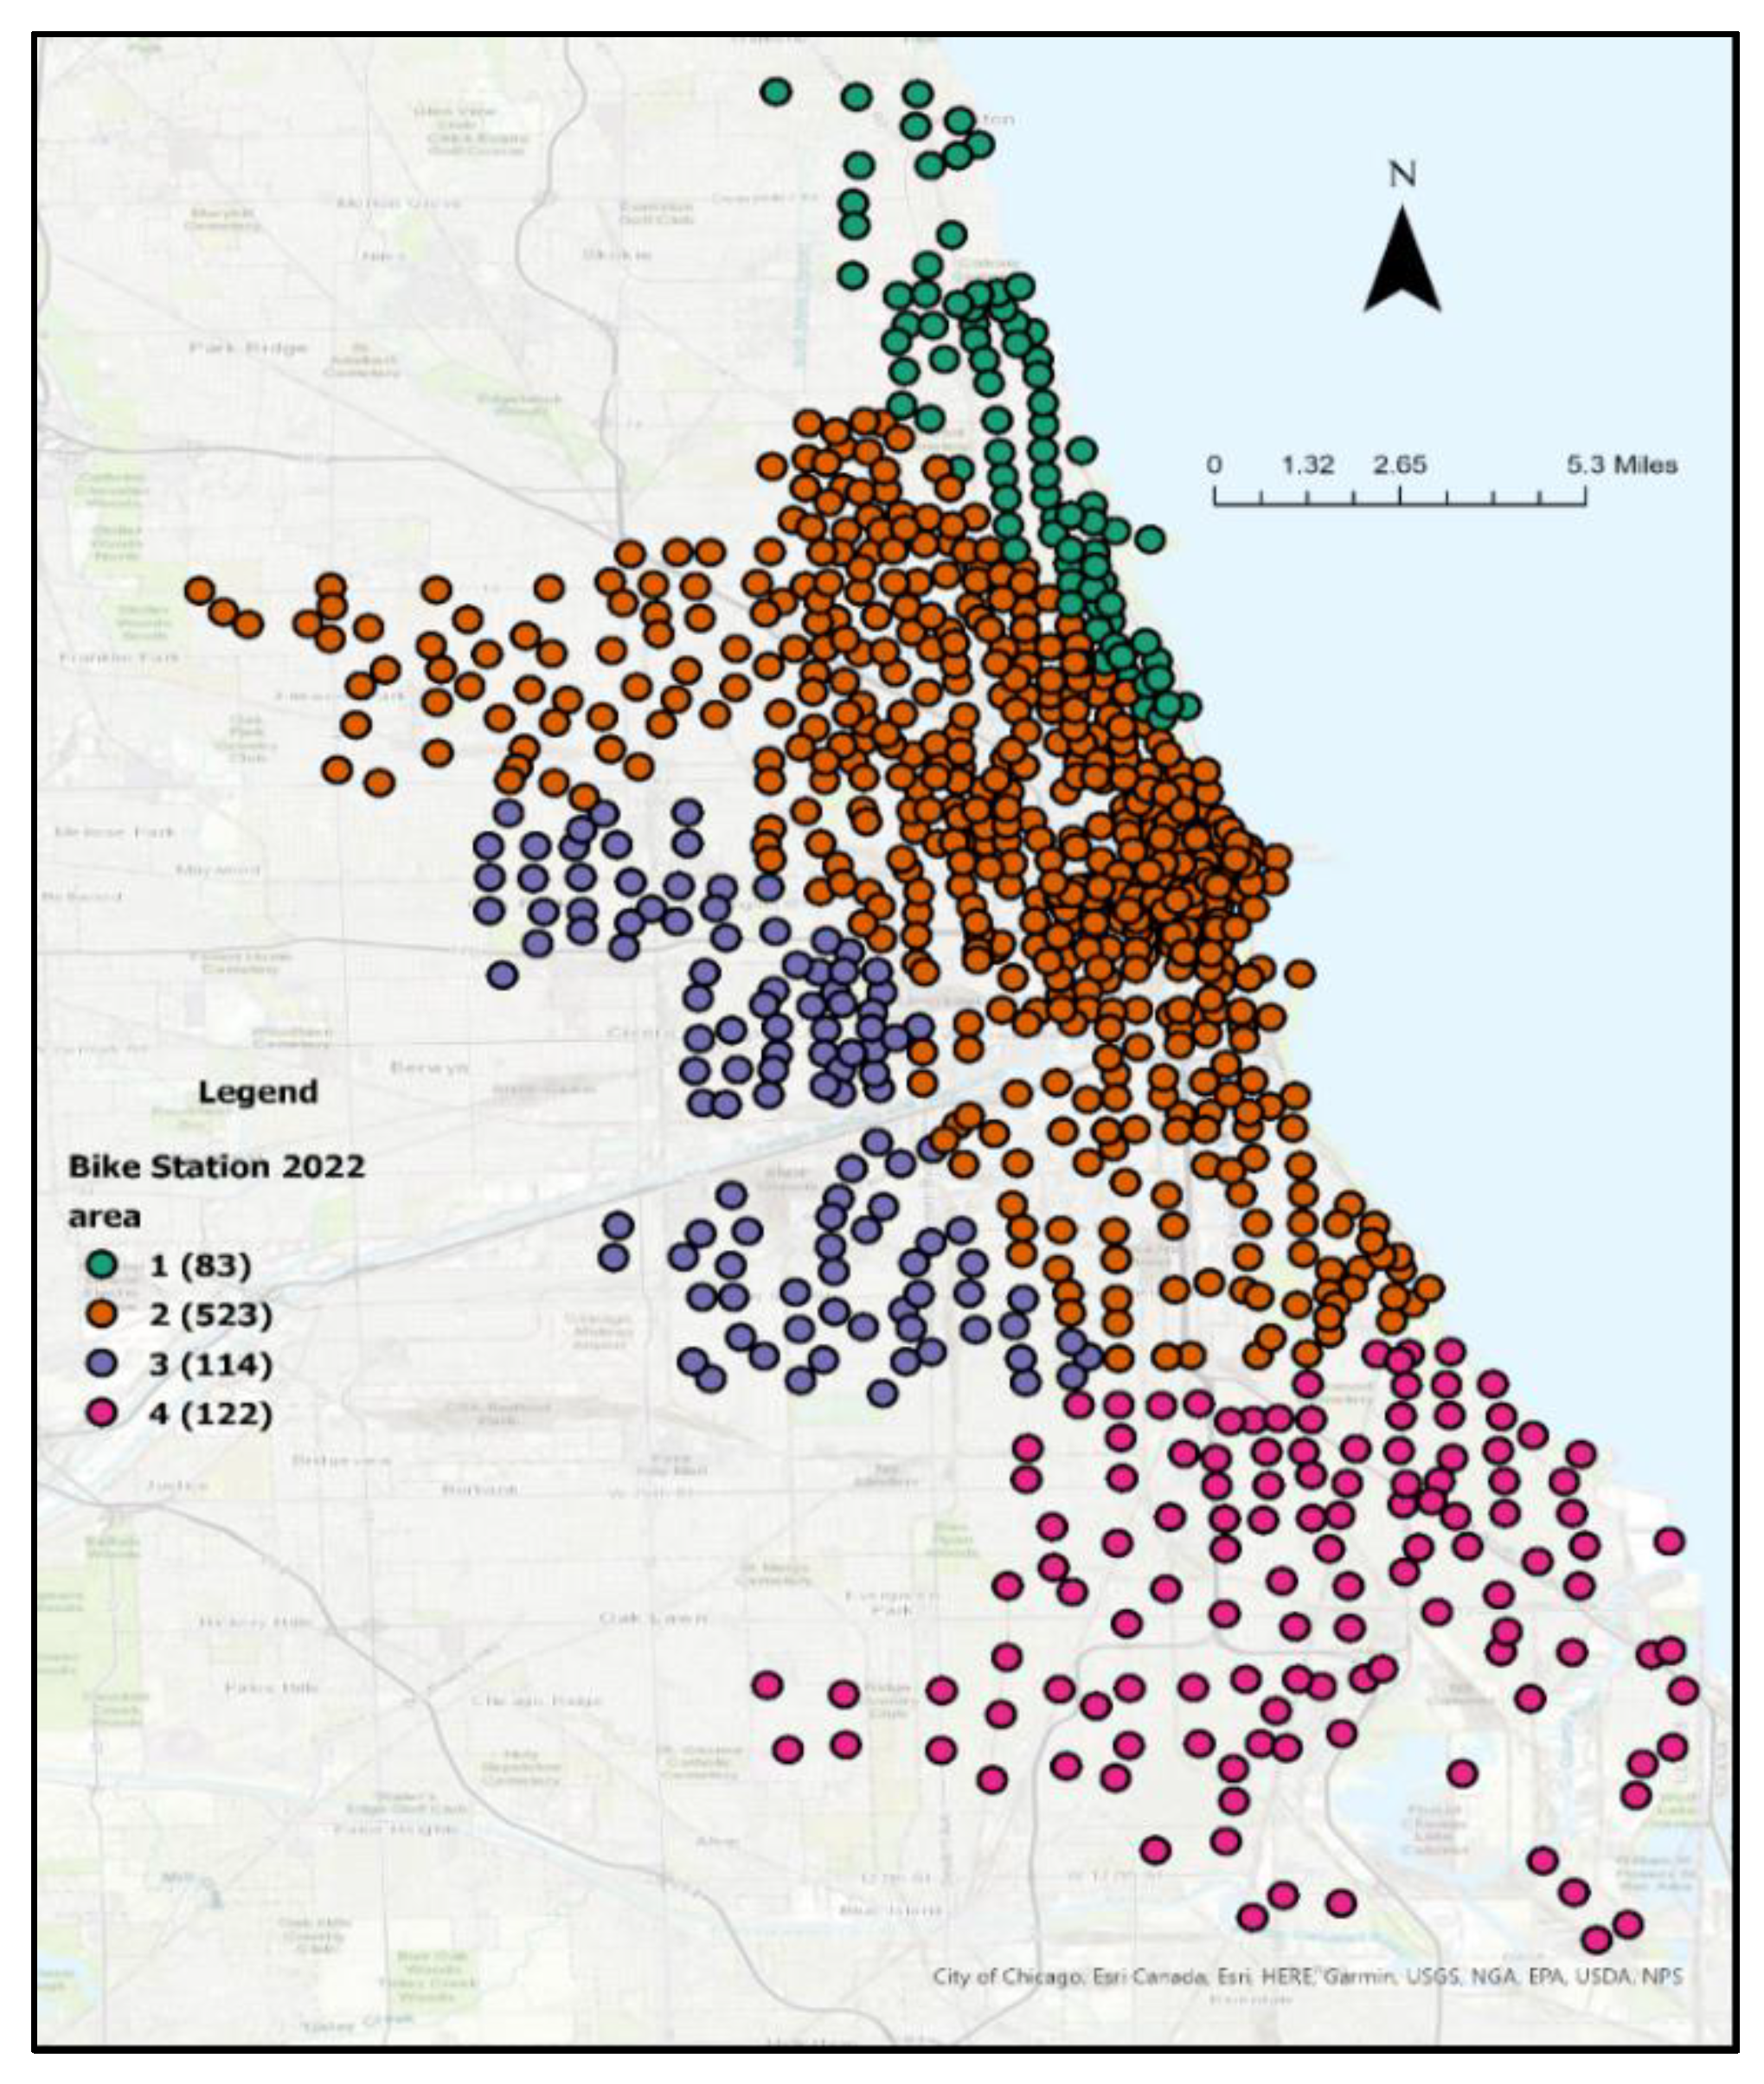
Based on our previous observations of the different trends of bikeshare stations, we allocated the stations into four areas: Area 1 (lakeshore), Area 2 (downtown and center of the city), Area 3 (western part of the city), and Area 4 (southern outskirts). Figure 11 illustrates the locations of the four areas, . We also filtered out bike stations that are more than 0.25 mile away from rail stations, bike routes, and bus routes to eliminate bike stations that are unwalkable from those facilities. The numbers in the parentheses in the legend are the number of observations. We also filter out stations that are more than 0.25 mile away from rail stations, bike routes, and bus routes to eliminate bike stations that are unwalkable from those facilities. Table 6 lists the results of the regression, showing that factors significantly associated with include distance to bus routes, distance to rail station, the change of ridership of buses and rails stations close by, and the three category factors. The changes of rail and bus ridership are both positively correlated to the change of bikeshare usage during the pandemic. The change of ridership on rail has a larger impact than that of buses. Compared to Area 1 (lakeshore), Area 2 and Area 3 have a smaller increase of bikeshare usage. Additionally, the bikeshare usage of subscribers during the pandemic is less significant than casual users’, and the change in bikeshare usage during the weekends is more positive than weekdays.
Figure 11.
Area of Bikeshare Stations.
Conclusions and Discussion
Bikeshare is not only a healthy and sustainable means of travel but a convenient choice without the concern of travelers in terms of storage and transport of bikes. Although promising, bikeshare is much less popular in north America than other European countries. Over the past years, many researchers have conducted studies to identify effective methods or policies to promote bikeshare usages (Fuller et al., 2019, Goodman et al., 2013, Scheepers et al., 2014, Jones, 2012, O’Fallon, 2010, Pucher et al., 2010).
During the pandemic, bikeshare emerged as a resilient and equitable mode of transportation for more travelers (Hu et al., 2021), making it increasingly feasible to continue using bikeshare as a routine travel mode post-pandemic. Thus, it is crucial to study bikeshare user behavior to identify any obstacles to using it as a routine commuting mode and propose effective policies to sustain its usage, promoting a healthier and more sustainable traffic system.
Two unique features of our study are (1) all the data analysis is based on data under good weather, eliminating biased impacts of weather on different travel modes.; and (2) the dependent variable we analyzed in this paper is the relative change of different modes, , instead of absolute volumes, to exclude bias due to varying demand and capacity of bikeshare stations.
Our conclusions are as follows. (1) bikeshare has robust potential to be used for longer trips, as seen in the significant increase in trip lengths of bikeshare subscribers on weekdays during the pandemic. (2) Subscribers have a stable travel demand for bikeshare during weekdays that is unrelated to the availability of close-by bus routes. The distances of bike stations to a bus route have minimal impact on the bikeshare travel of subscribers. (3) The spatial distribution of changes in bikeshare travel are heterogeneous with a significant increase in bikeshare travel observed in remote areas. This suggests that increasing the number of stations in remote areas and optimizing the rebalancing strategy to favor such areas could lead to a more connected bikeshare network. This conclusion is consistent with previous studies (Martin and Shaheen, 2014, Saberi et al., 2018, Hu et al., 2021, Scheepers et al., 2014). (4) Bikeshare usage does respond to effective policy subsidy and a better infrastructure design. Caggiani et al. and Hamidi et al. concluded that people living in deprived areas may need more outdoor activities than those living in wealthier areas (Caggiani et al., 2020, Hamidi et al., 2019). In our study, we also found that the bikeshare stations with increased or stable usage during the pandemic are in the southern part of the city, where the income level is relatively low. The ridership of public transit in this area has minimum change, indicating a possible complementary relation of bikeshare with public transit. Therefore, effective policy subsidies and infrastructure design can increase bikeshare usage, especially in deprived areas. (5) Unlike conclusions made by previous studies that only rail has a significant relationship with bikeshare (Campbell and Brakewood, 2017, Du and Rakha, 2022), in this study, we found that distances to both rail and bus stations are positively correlated with the change of bikeshare usage, suggesting the need for better coordination in planning rail and bikeshare stations. (6) There is little connection of bikeshare usage to biking facilities/routes.
Our study can help policymakers design a biker-friendly transportation system by identifying changes and intercorrelations of bikeshare travel with other non-personal-vehicle travel modes. However, future survey data that includes the opinions and thoughts of bikeshare users are necessary to better understand their behavior and improve the resilience of the system.
Acknowledgment
This research is sponsored by the Urban Mobility and Equity Center (UMEC).
References
- Brandenburg, Christiane, Matzarakis, A.,Arnberger, A., 2007. Weather and cycling—a first approach to the effects of weather conditions on cycling. Meteorological Applications, 14 (1), 61-67.
- Bucsky, P. , 2020. Modal share changes due to COVID-19: The case of Budapest. Transportation Research Interdisciplinary Perspectives, 8 100141.
- Caggiani, L. , Colovic, A.,Ottomanelli, M., 2020. An equality-based model for bike-sharing stations location in bicycle-public transport multimodal mobility. Transportation Research Part A: Policy and Practice, 140 251-265.
- Campbell, K. B. ,Brakewood, C., 2017. Sharing riders: How bikesharing impacts bus ridership in New York City. Transportation Research Part A: Policy and Practice, 100 264-282.
- Chicago, C. O. 2022. Transportation Data https://data.cityofchicago.org/Transportation. Accessed 2022.
- Divvy. 2022. DIVVY trip data https://divvy-tripdata.s3.amazonaws.com/index.html. Accessed.
- Du, J.,Rakha, H., 2020a. COVID-19 Impact on Ride-hailing: The Chicago Case Study. Transport Findings, October 2020.
- Du, J.,Rakha, H., 2020b. Preliminary Investigation of COVID-19 Impact on Transportation System Delay, Energy Consumption and Emission Levels. Transport Findings, July 2020.
- Du, J. ,Rakha, H., 2022. Changes in Bikeshare Travel Behavior during the COVID-19 Pandemic: The Chicago Case Study Proceeding of Transportation Research Board Annual Meeting 2022, Washington D.C.
- Du, J. , Rakha, H., Eldardiry, H.,Filali, F., 2021. COVID-19 Pandemic Impacts on Traffic System Delay, Fuel Consumption and Emissions. International Journal of Transportation Science and Technology, 10 (2), 184-196.
- Fhwa. 2013. Actions to Increase the Safety of Pedestrains Accessing Transit https://safety.fhwa.dot.gov/ped_bike/ped_transit/ped_transguide/ch4.cfm#:~:text=Most%20people%20are%20willing%20to,stop%20(see%20figure%20below). Accessed.
- Fishman, E. , Washington, S.,Haworth, N., 2014. Bike share’s impact on car use: Evidence from the United States, Great Britain, and Australia. Transportation Research Part D: Transport and Environment, 31 13-20.
- Fuller, D. , Luan, H., Buote, R.,Auchincloss, A. H., 2019. Impact of a public transit strike on public bicycle share use: An interrupted time series natural experiment study. Journal of Transport & Health, 13 137-142.
- Gallop, C. , Tse, C.,Zhao, J., 2011. A Seasonal Autoregressive Model Of Vancouver Bicycle Traffic Using Weather Variables. i-Manager's Journal on Civil Engineering, 1 (4), 9-18.
- Goodman, A. , Panter, J., Sharp, S. J.,Ogilvie, D., 2013. Effectiveness and equity impacts of town-wide cycling initiatives in England: A longitudinal, controlled natural experimental study. Social Science & Medicine, 97 228-237.
- Hamidi, Z. , Camporeale, R.,Caggiani, L., 2019. Inequalities in access to bike-and-ride opportunities: Findings for the city of Malmö. Transportation Research Part A: Policy and Practice, 130 673-688.
- Hu, S. , Xiong, C., Liu, Z.,Zhang, L., 2021. Examining spatiotemporal changing patterns of bike-sharing usage during COVID-19 pandemic. Journal of Transport Geography, 91 102997.
- Jäppinen, S. , Toivonen, T.,Salonen, M., 2013. Modelling the potential effect of shared bicycles on public transport travel times in Greater Helsinki: An open data approach. Applied Geography, 43 13-24.
- Jones, T. , 2012. Getting the British back on bicycles—The effects of urban traffic-free paths on everyday cycling. Transport Policy, 20 138-149.
- Kim, M. ,Cho, G.-H., 2022. The Changing Role of Bike-Share in the Public Transportation System in Response to Covid-19 Pandemic.
- Kong, H. , Jin, S. T.,Sui, D. Z., 2020. Deciphering the relationship between bikesharing and public transit: Modal substitution, integration, and complementation. Transportation Research Part D: Transport and Environment, 85 102392.
- Lewin, A. , 2011. Temporal and Weather Impacts on Bicycle Volumes. Proceeding of TRB 90th Annual Meeting Washington D.C.
- Ma, T. , Liu, C.,Erdoğan, S., 2015. Bicycle Sharing and Public Transit: Does Capital Bikeshare Affect Metrorail Ridership in Washington, D.C.? Transportation Research Record, 2534 (1), 1-9.
- Martin, E. W. ,Shaheen, S. A., 2014. Evaluating public transit modal shift dynamics in response to bikesharing: a tale of two U.S. cities. Journal of Transport Geography, 41 315-324.
- Miranda-Moreno, L. F. ,Nosal, T., 2011. Weather or Not to Cycle: Temporal Trends and Impact of Weather on Cycling in an Urban Environment. Transportation Research Record, 2247 (1), 42-52.
- Network, G. H. C. 2022. Historical Weather Data https://www.ncdc.noaa.gov/cdo-web/search Accessed 2022.
- Nikiforiadis, A. , Ayfantopoulou, G.,Stamelou, A., 2020. Assessing the Impact of COVID-19 on Bike-Sharing Usage: The Case of Thessaloniki, Greece. Sustainability, 12 (19), 8215.
- O’fallon, C. , 2010. Bike Now: Exploring Methods of Building Sustained Participation in Cycle Commuting in New Zealand. Road & Transport Research, 19 (2), 77-89.
- Pucher, J. , Dill, J.,Handy, S., 2010. Infrastructure, programs, and policies to increase bicycling: An international review. Preventive Medicine, 50 S106-S125.
- Saberi, M. , Ghamami, M., Gu, Y., Shojaei, M. H.,Fishman, E., 2018. Understanding the impacts of a public transit disruption on bicycle sharing mobility patterns: A case of Tube strike in London. Journal of Transport Geography, 66 154-166.
- Scheepers, C. E. , Wendel-Vos, G. C. W., Den Broeder, J. M., Van Kempen, E. E. M. M., Van Wesemael, P. J. V.,Schuit, A. J., 2014. Shifting from car to active transport: A systematic review of the effectiveness of interventions. Transportation Research Part A: Policy and Practice, 70 264-280.
- Shaheen, S. , Martin, E., Cohen, A.,Finson, R., 2012. Public Bikesharing in North America: Early Operator and User Undestanding. Mineta Transportation Institute.
- Singleton, P. A. ,Clifton, K. J., 2014. Exploring Synergy in Bicycle and Transit Use: Empirical Evidence at Two Scales. Transportation Research Record, 2417 (1), 92-102.
- Song, J. , Zhang, L., Qin, Z.,Ramli, M. A., 2022a. Spatiotemporal evolving patterns of bike-share mobility networks and their associations with land-use conditions before and after the COVID-19 outbreak. Physica A: Statistical Mechanics and its Applications, 592 126819.
- Song, J. , Zhang, L., Qin, Z.,Ramli, M. A., 2022b. Spatiotemporal evolving patterns of bike-share mobility networks and their associations with land-use conditions before and after the COVID-19 outbreak. Physica A, 592 126819-126819.
- Teixeira, J. F. ,Lopes, M., 2020. The link between bike sharing and subway use during the COVID-19 pandemic: The case-study of New York's Citi Bike. Transportation Research Interdisciplinary Perspectives, 6 100166.
- Tin Tin, S. , Woodward, A., Robinson, E.,Ameratunga, S., 2012. Temporal, seasonal and weather effects on cycle volume: an ecological study. Environmental Health, 11 (1), 12.
- Welch, T. F. , Gehrke, S. R.,Widita, A., 2020. Shared-use mobility competition: a trip-level analysis of taxi, bikeshare, and transit mode choice in Washington, DC. Transportmetrica A: Transport Science, 16 (1), 43-55.
Figure 1.
Bike facilities in Chicago.
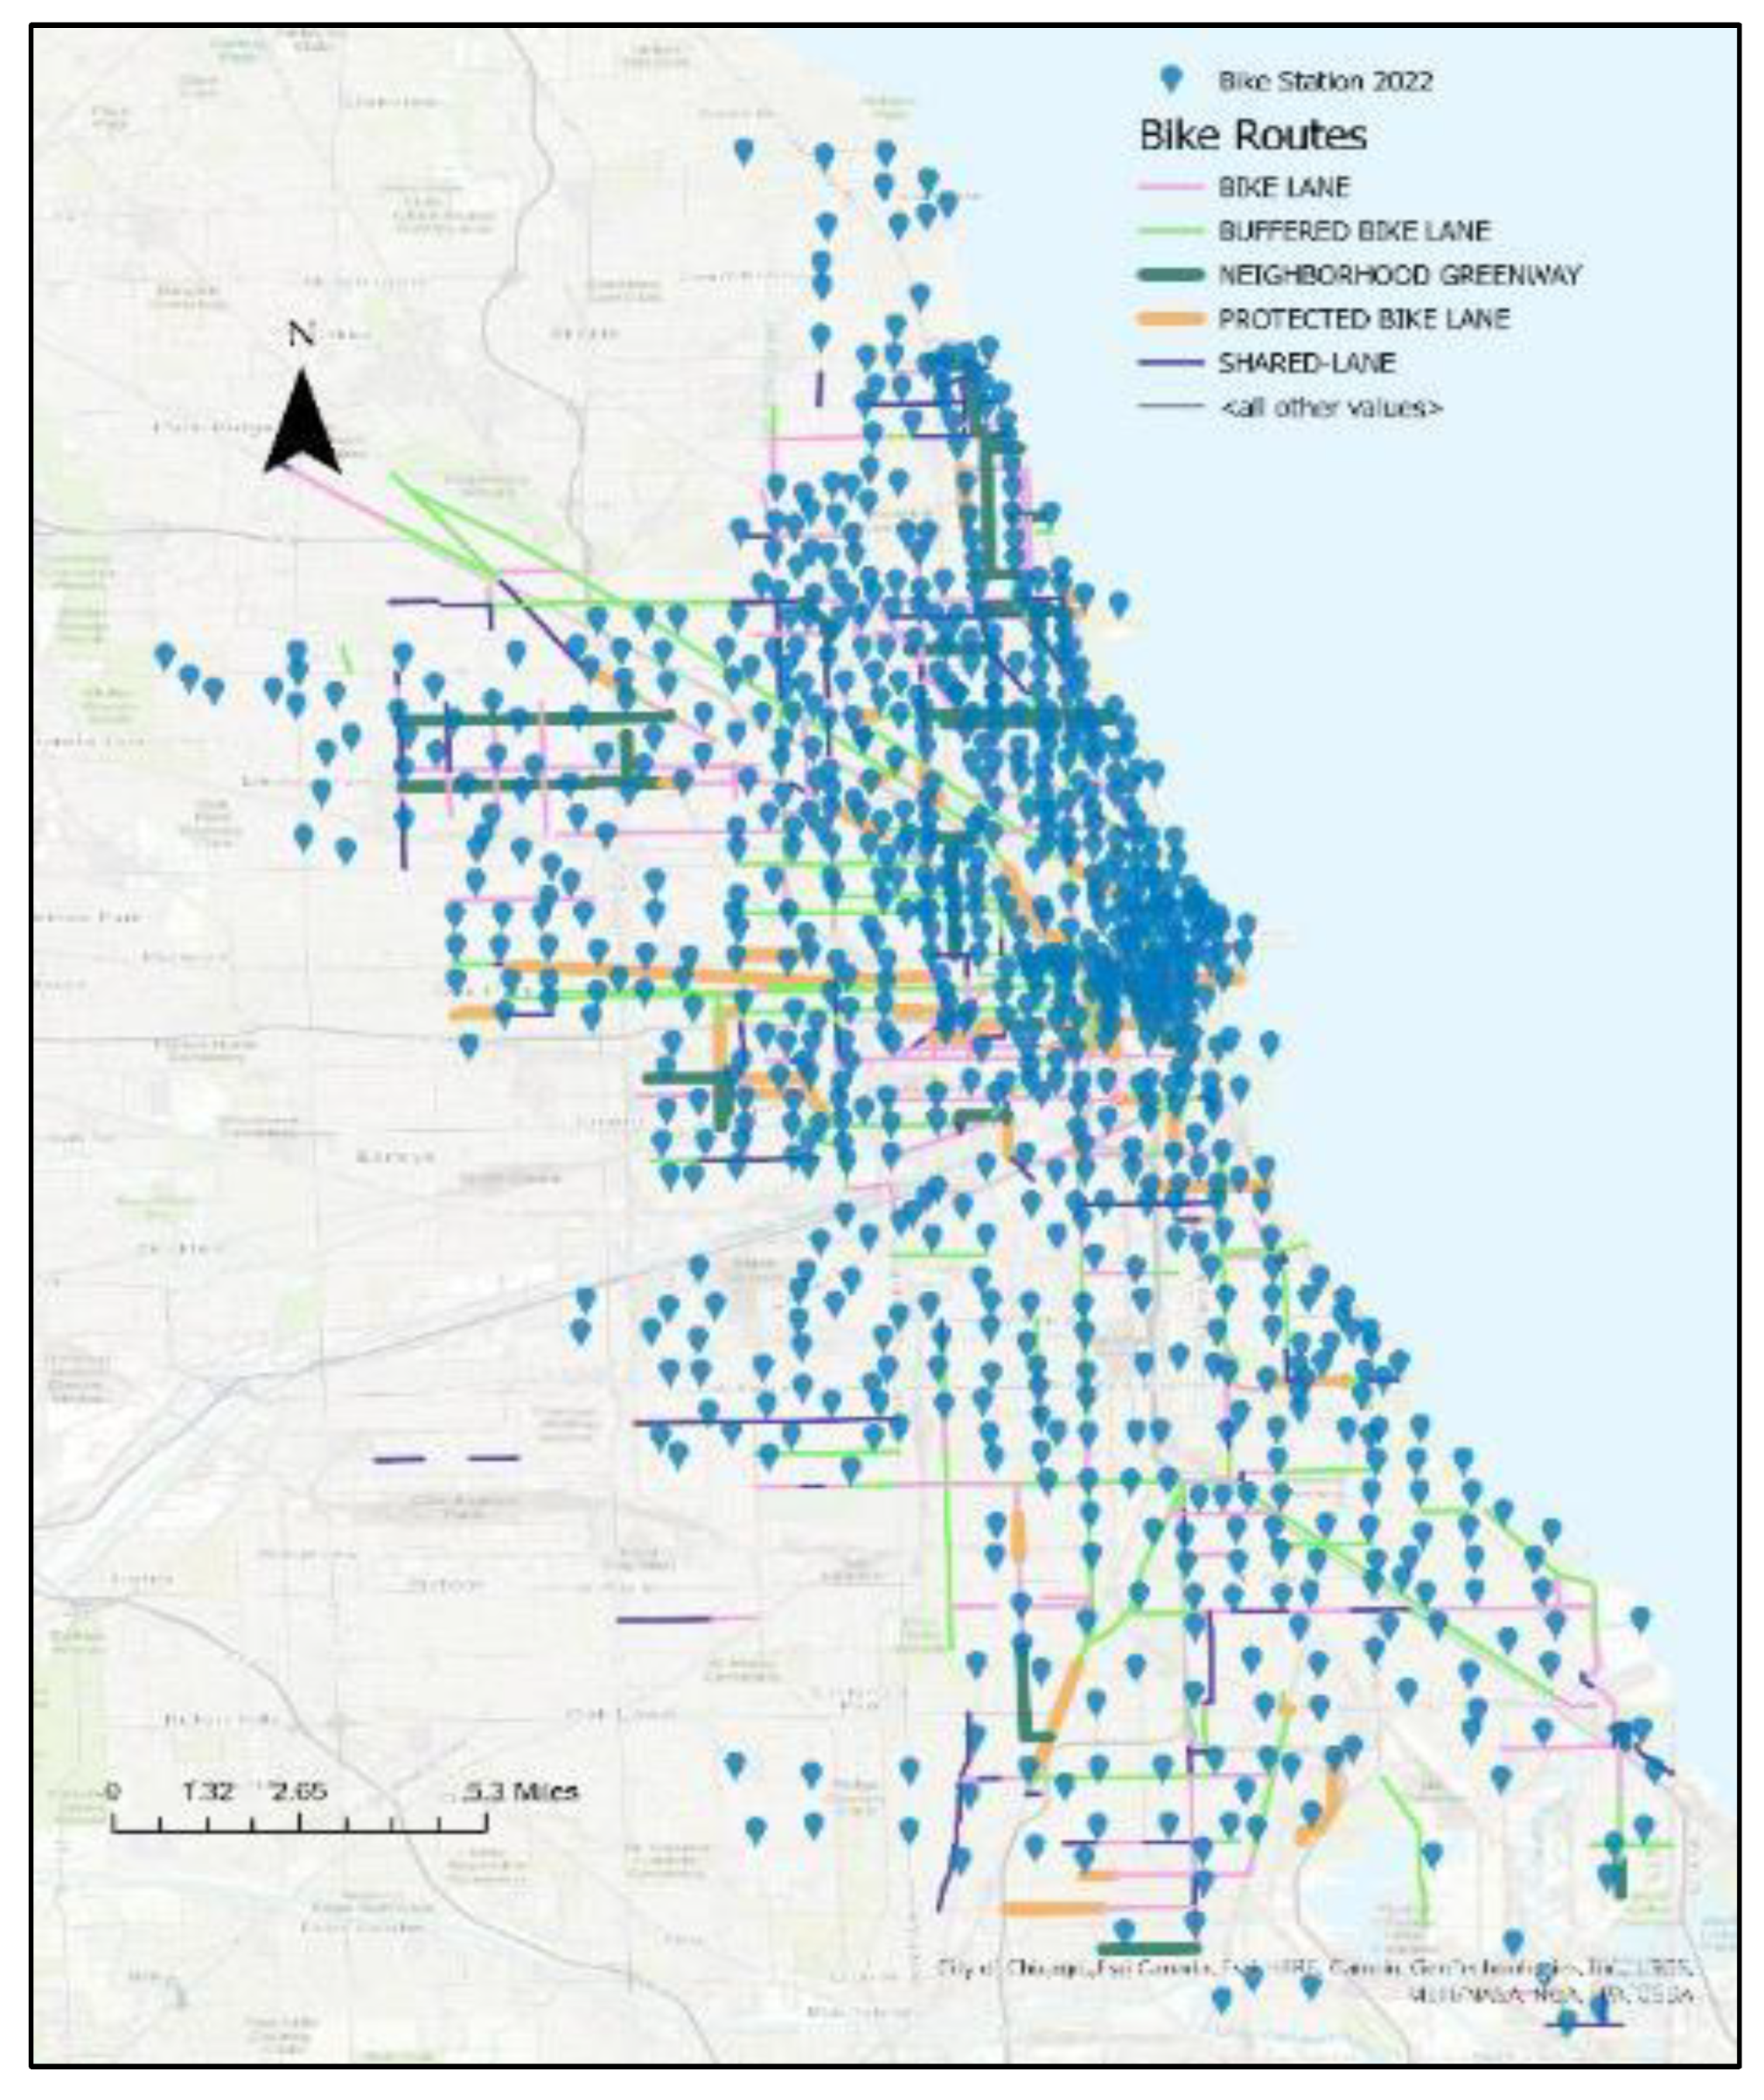
Figure 2.
Trips by mode in (a) 2019 and (b) 2020Changes in Bikeshare and Other Modes of Travel.
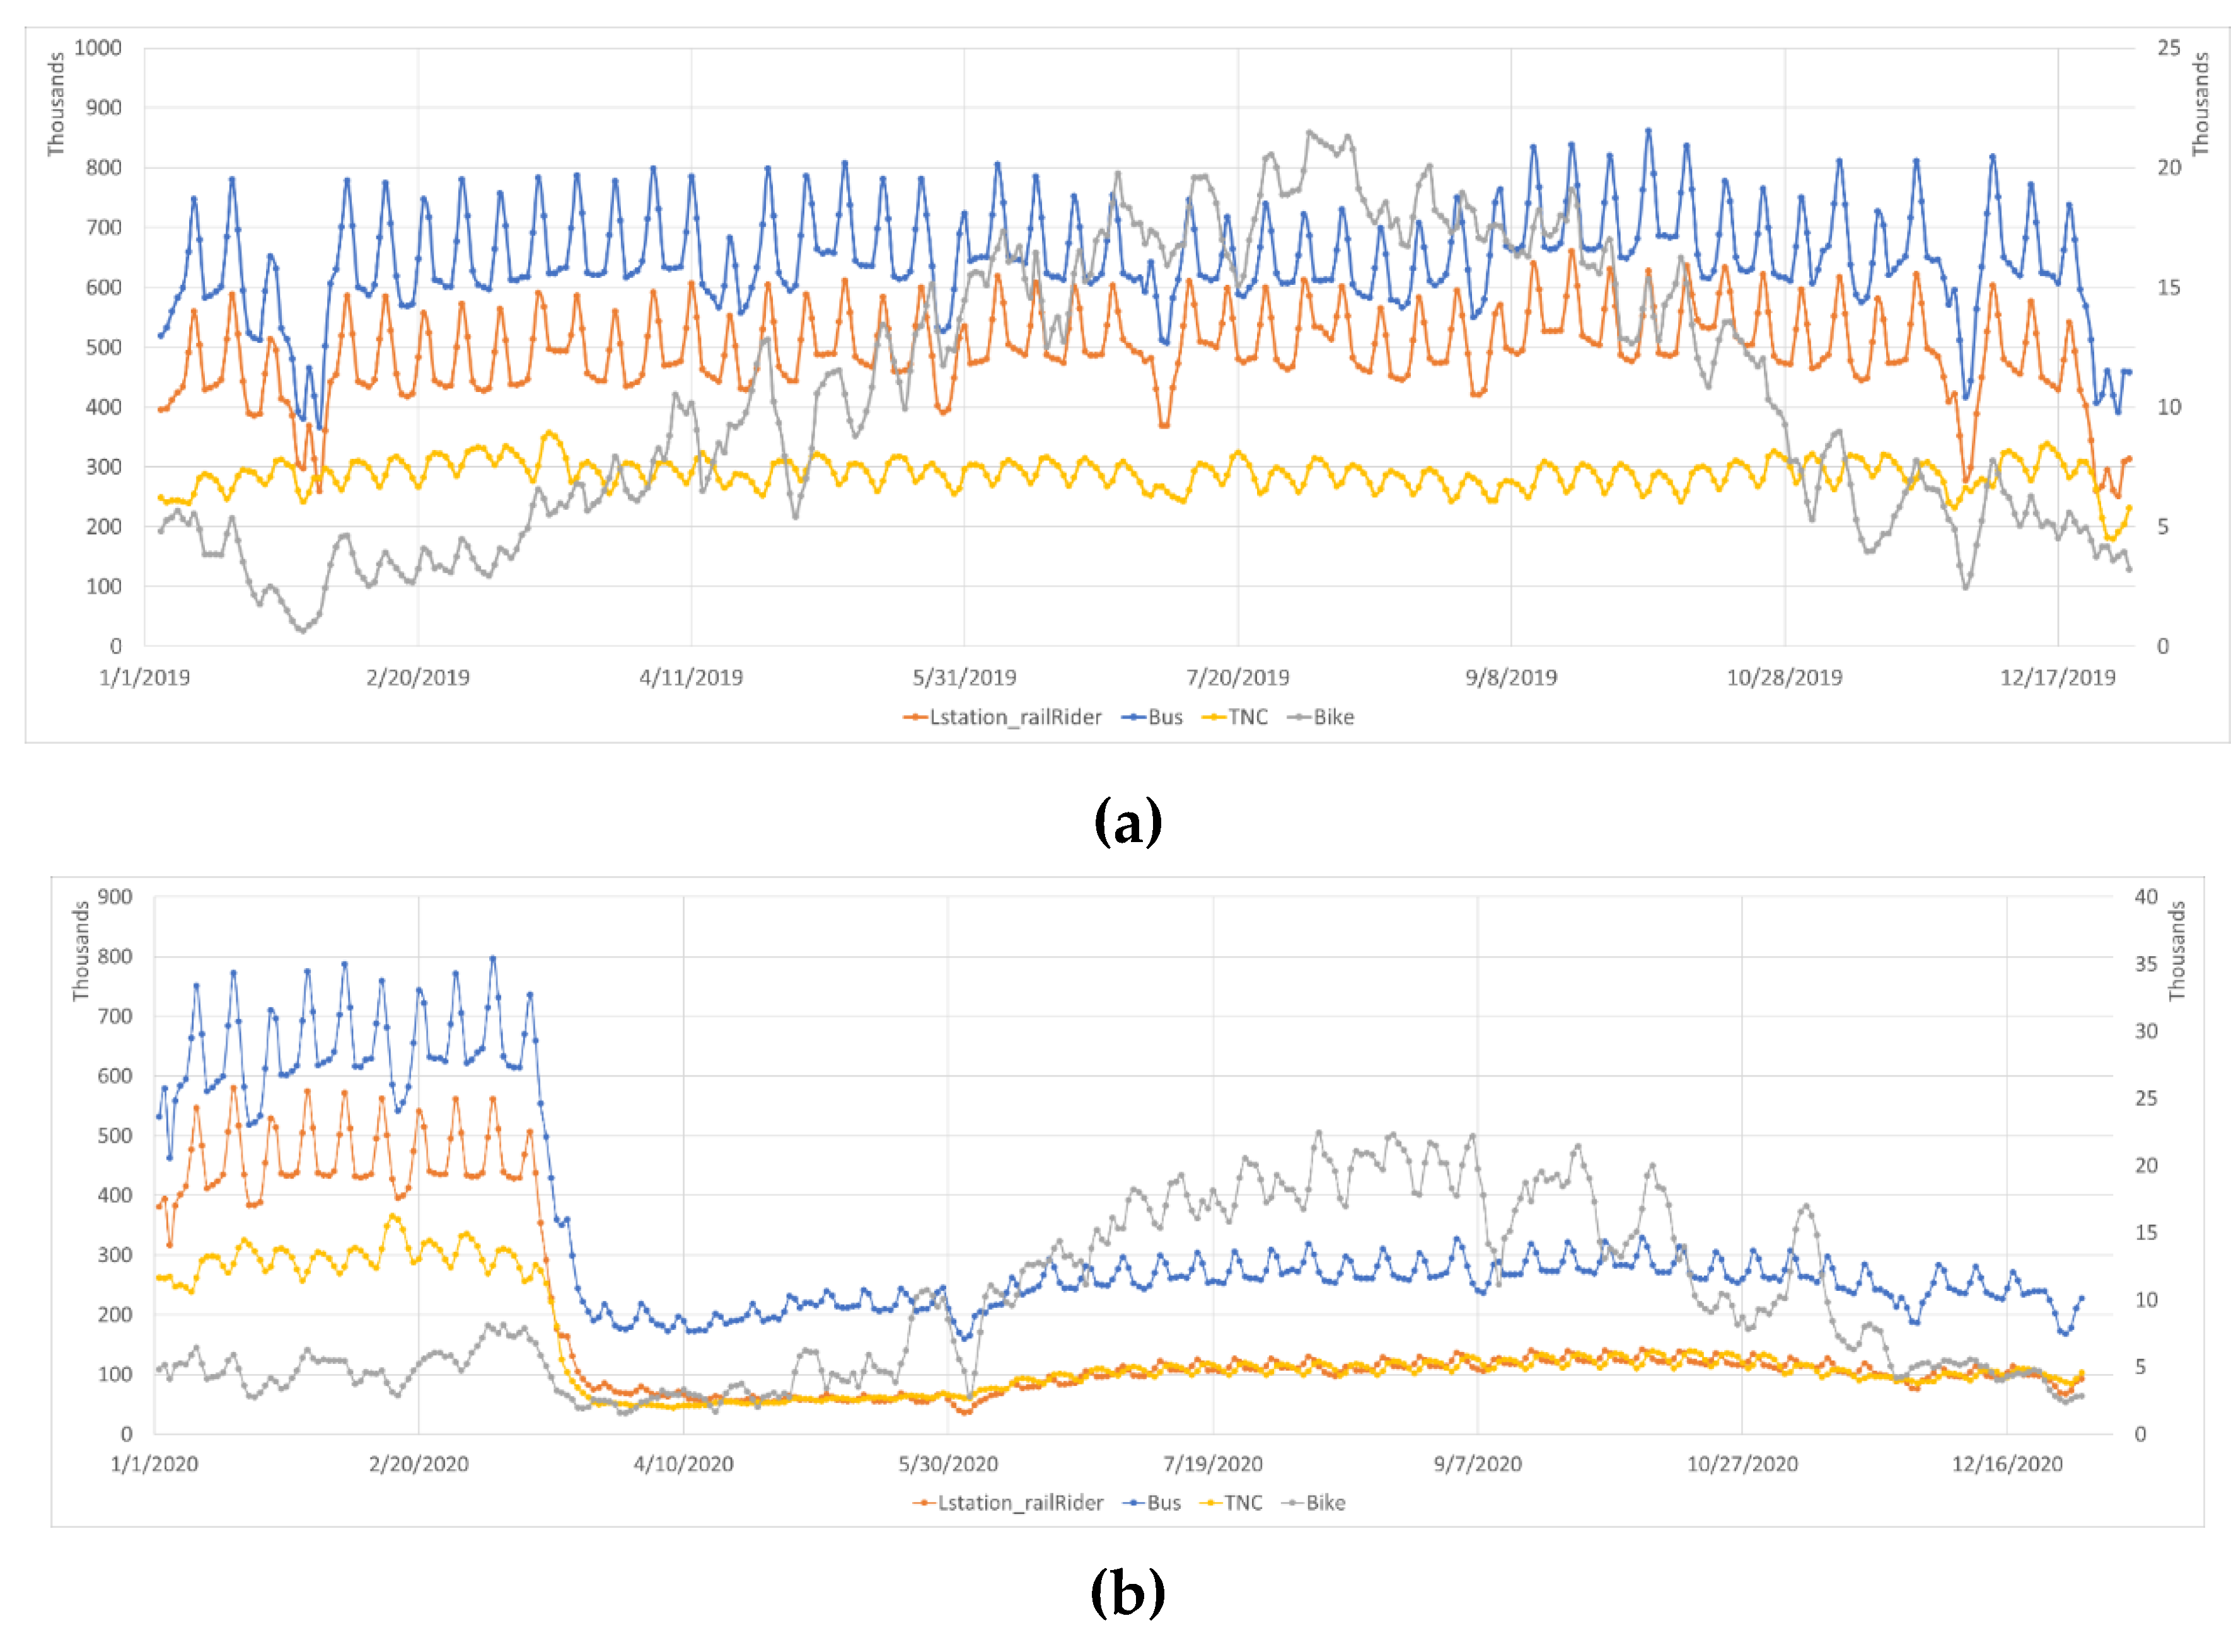
Figure 3.
Histogram of changes in trip volume by mode.
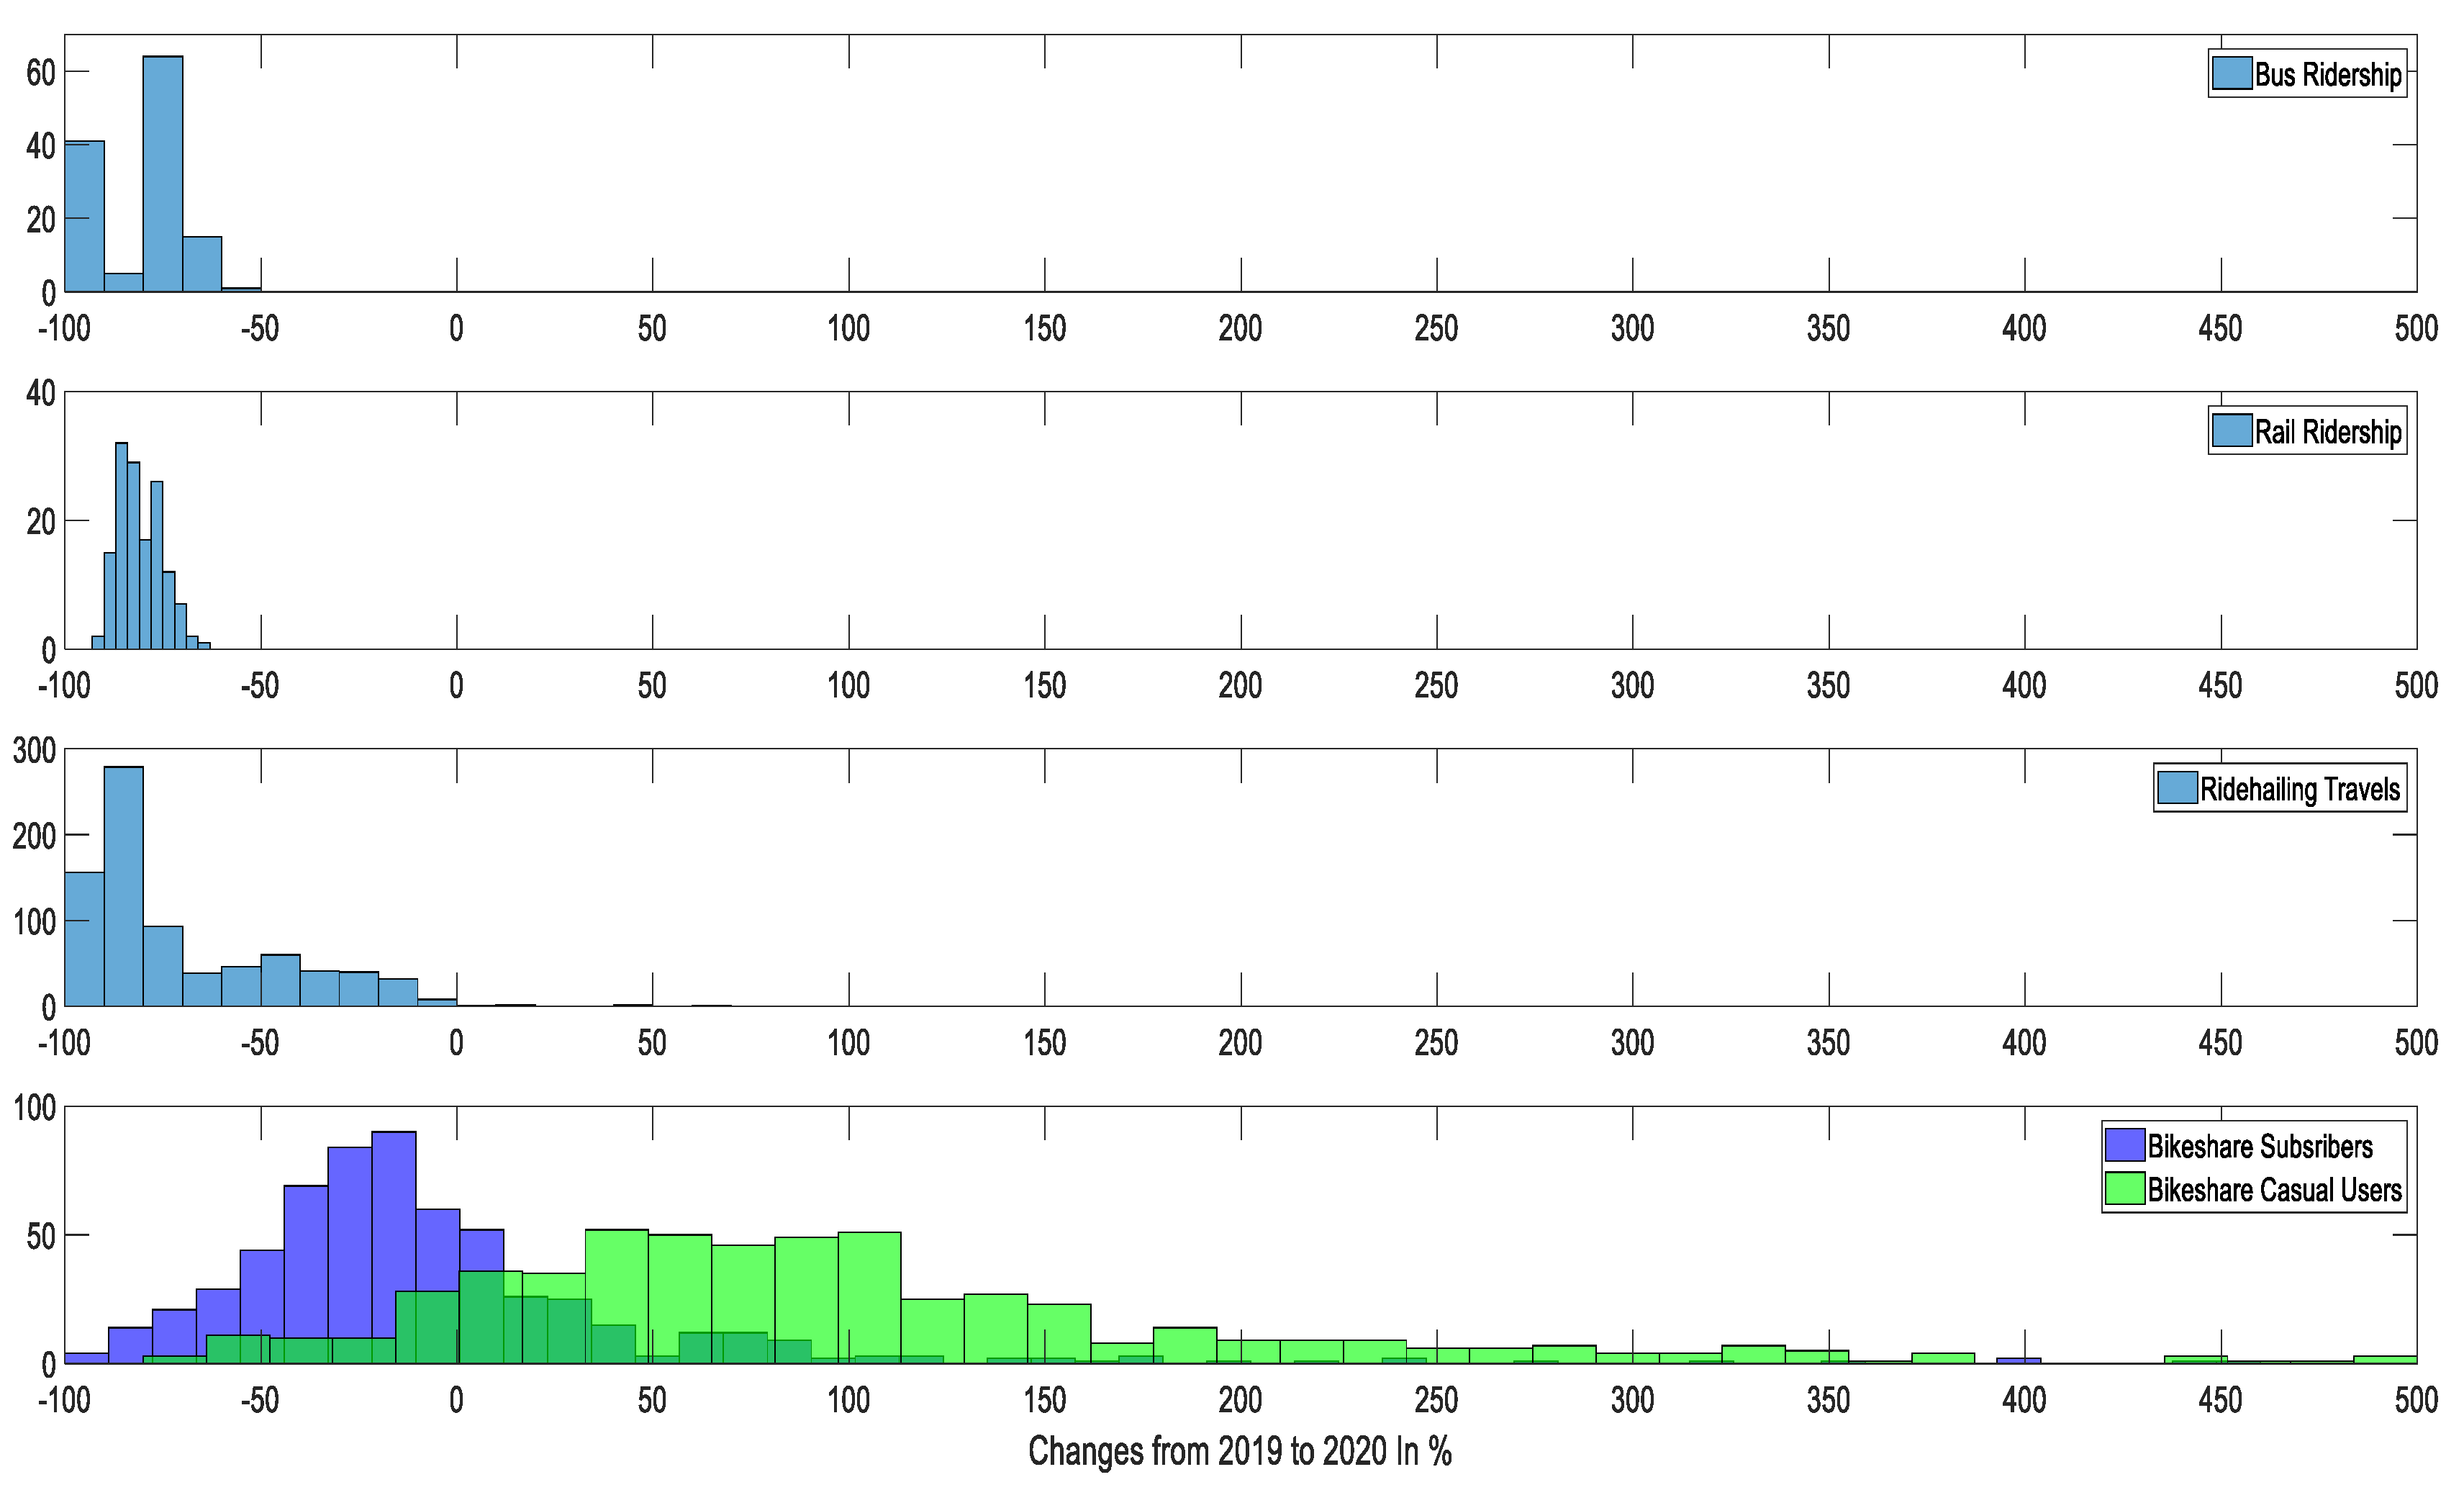
Figure 4.
Relationship between Rail and bikeshare (left upper: subscribers weekday; left lower: casual users (CU) weekday; right upper: subscribers weekend; right lower: CU weekend).
Figure 4.
Relationship between Rail and bikeshare (left upper: subscribers weekday; left lower: casual users (CU) weekday; right upper: subscribers weekend; right lower: CU weekend).
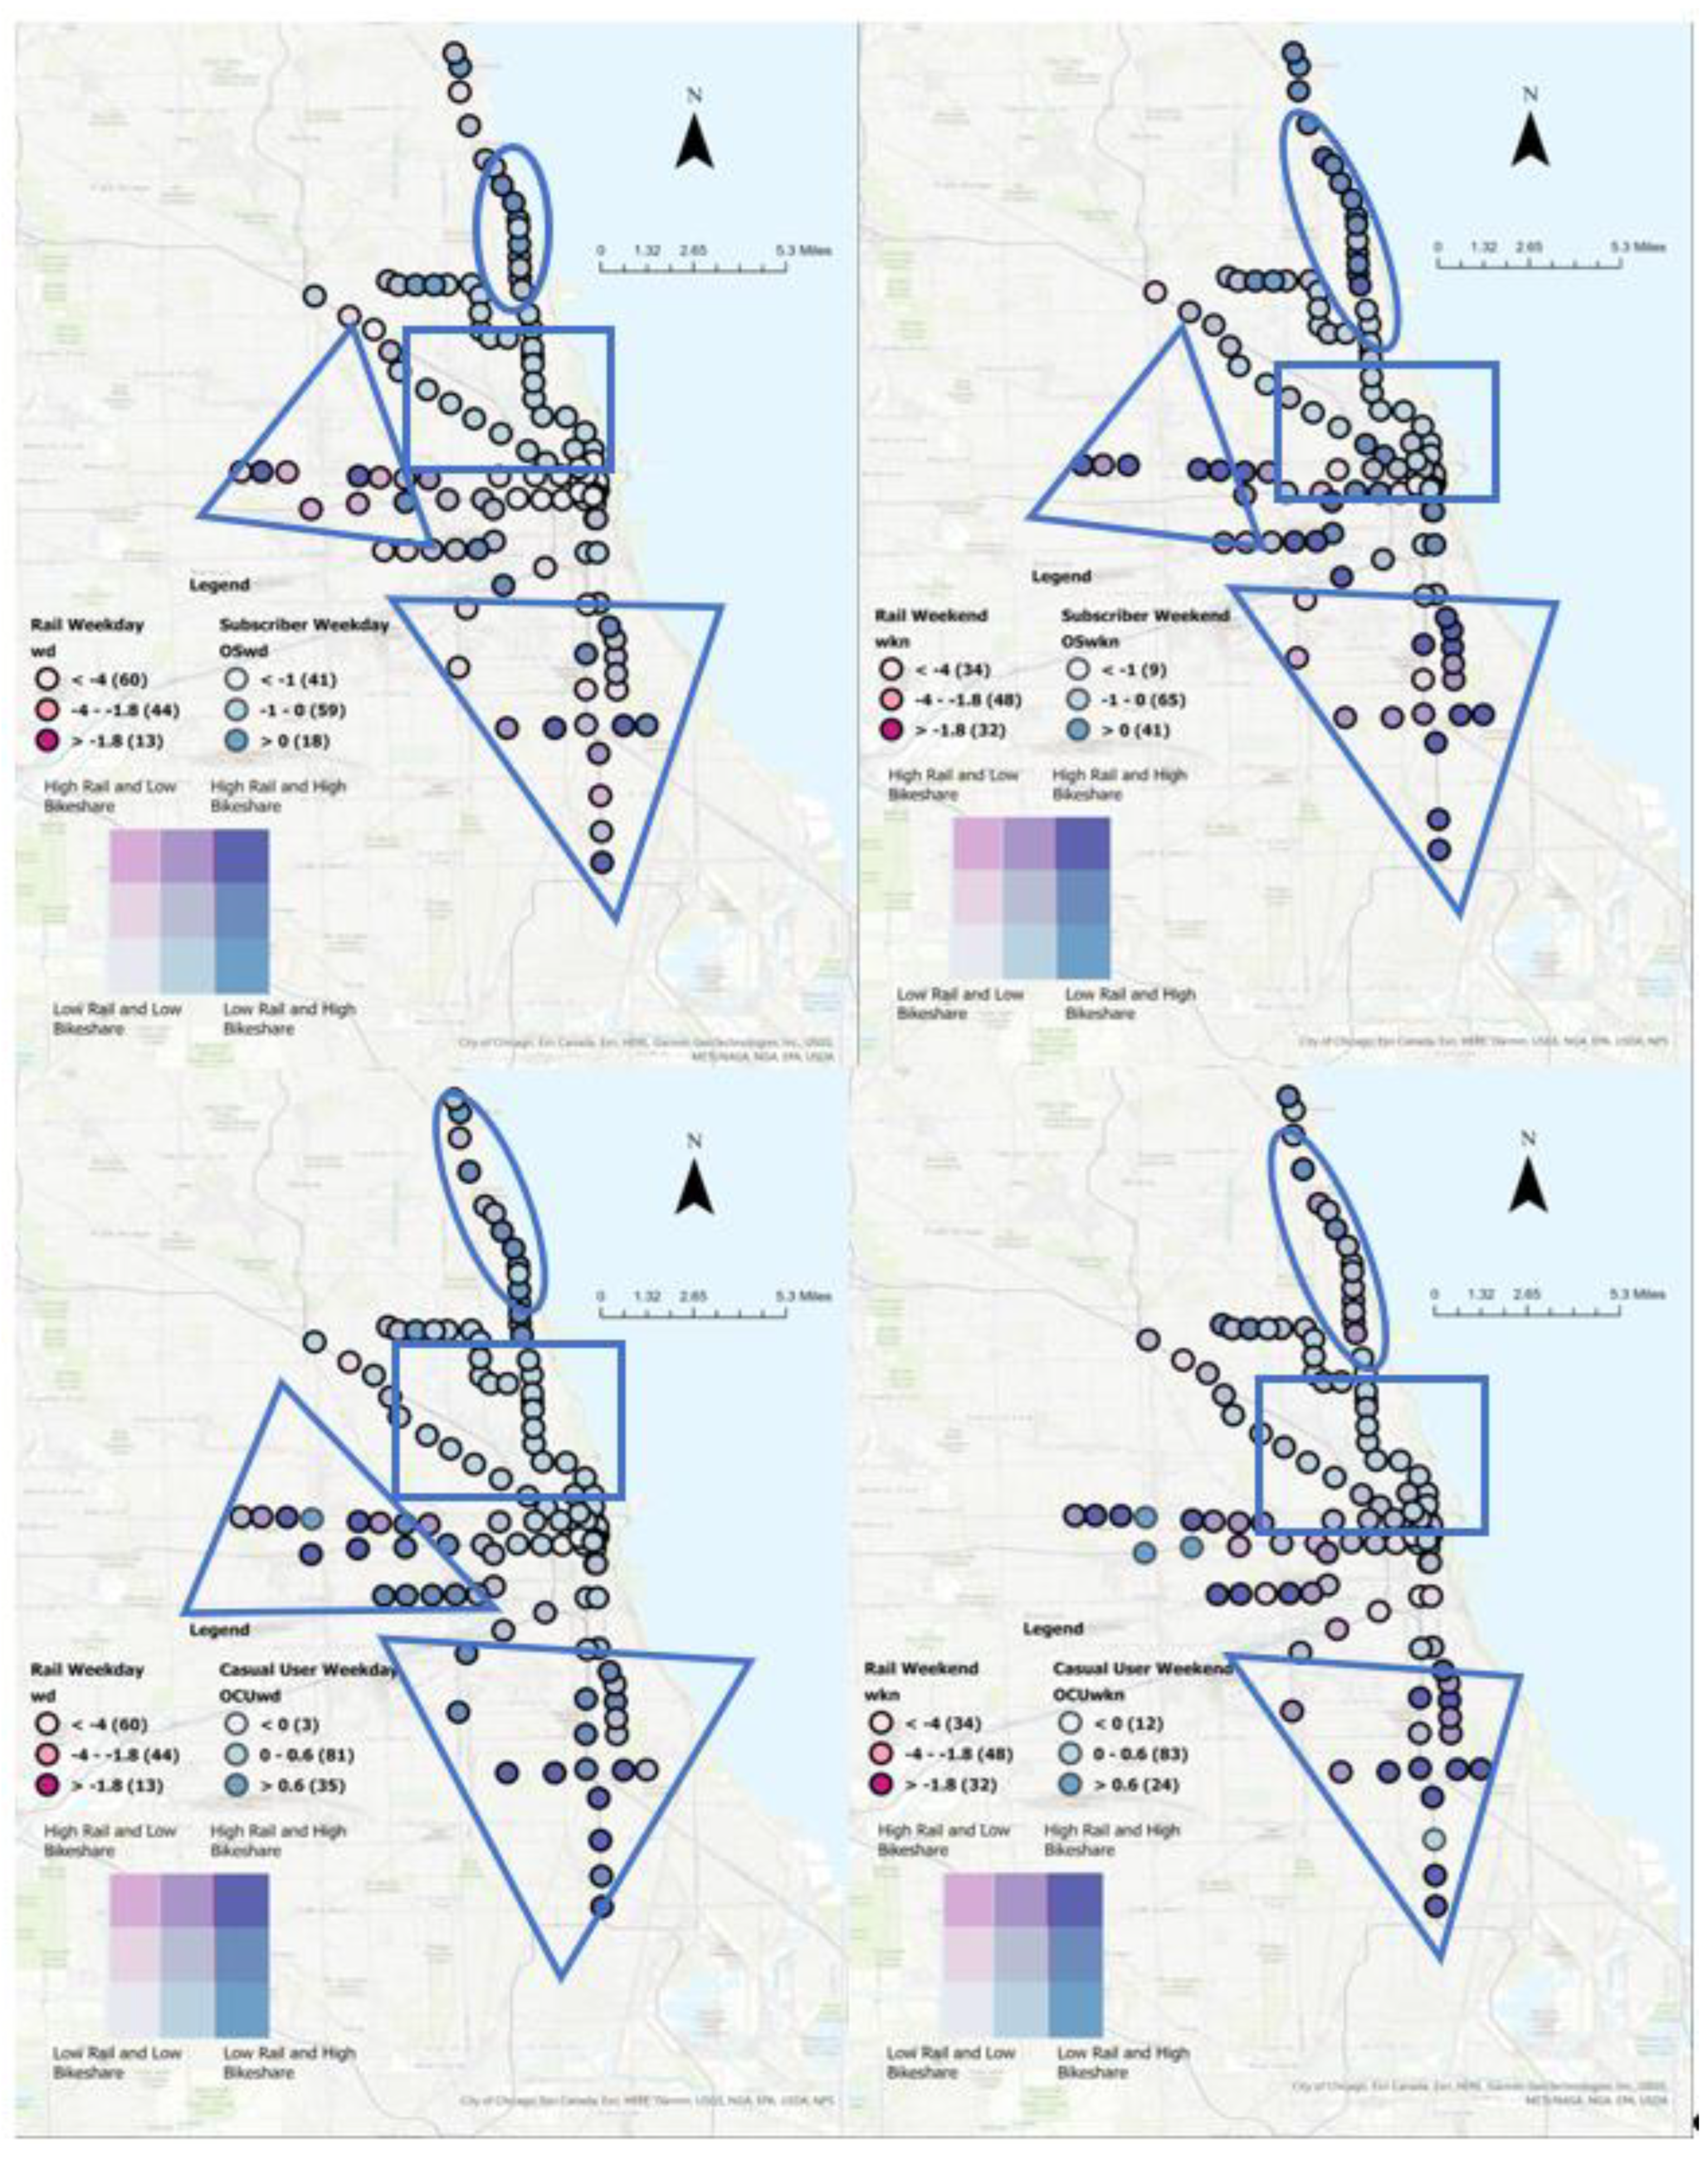
Figure 7.
Bikeshare trips by distance to bike facilities.
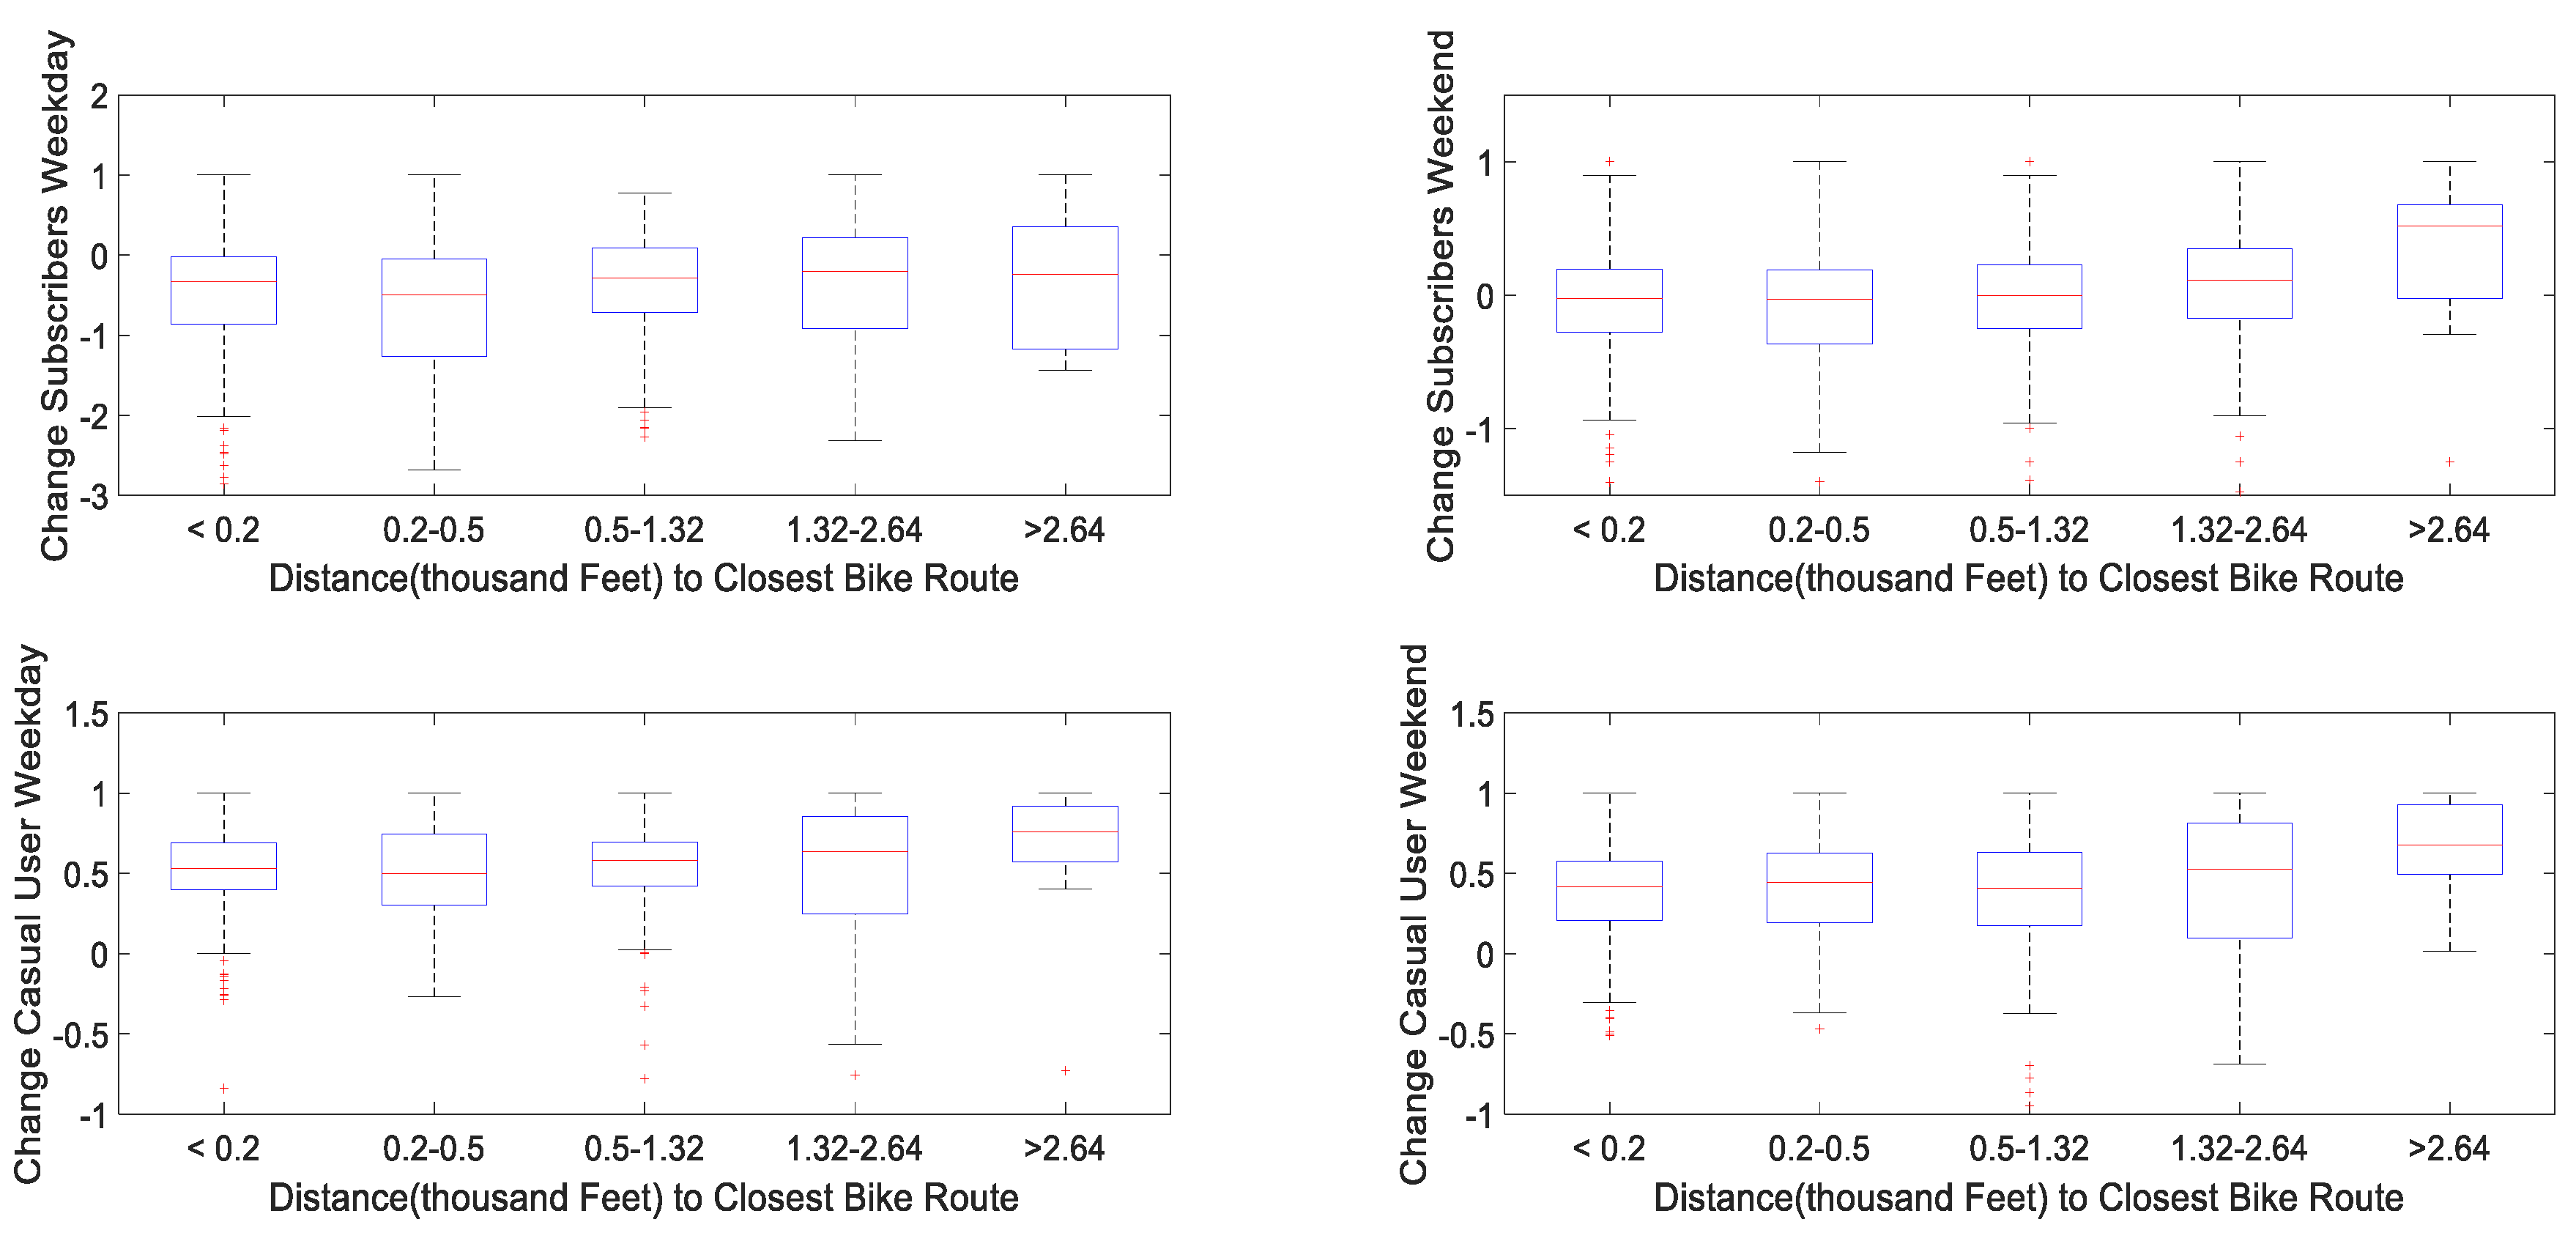
Figure 8.
Bikeshare trips by distance to bus routes.
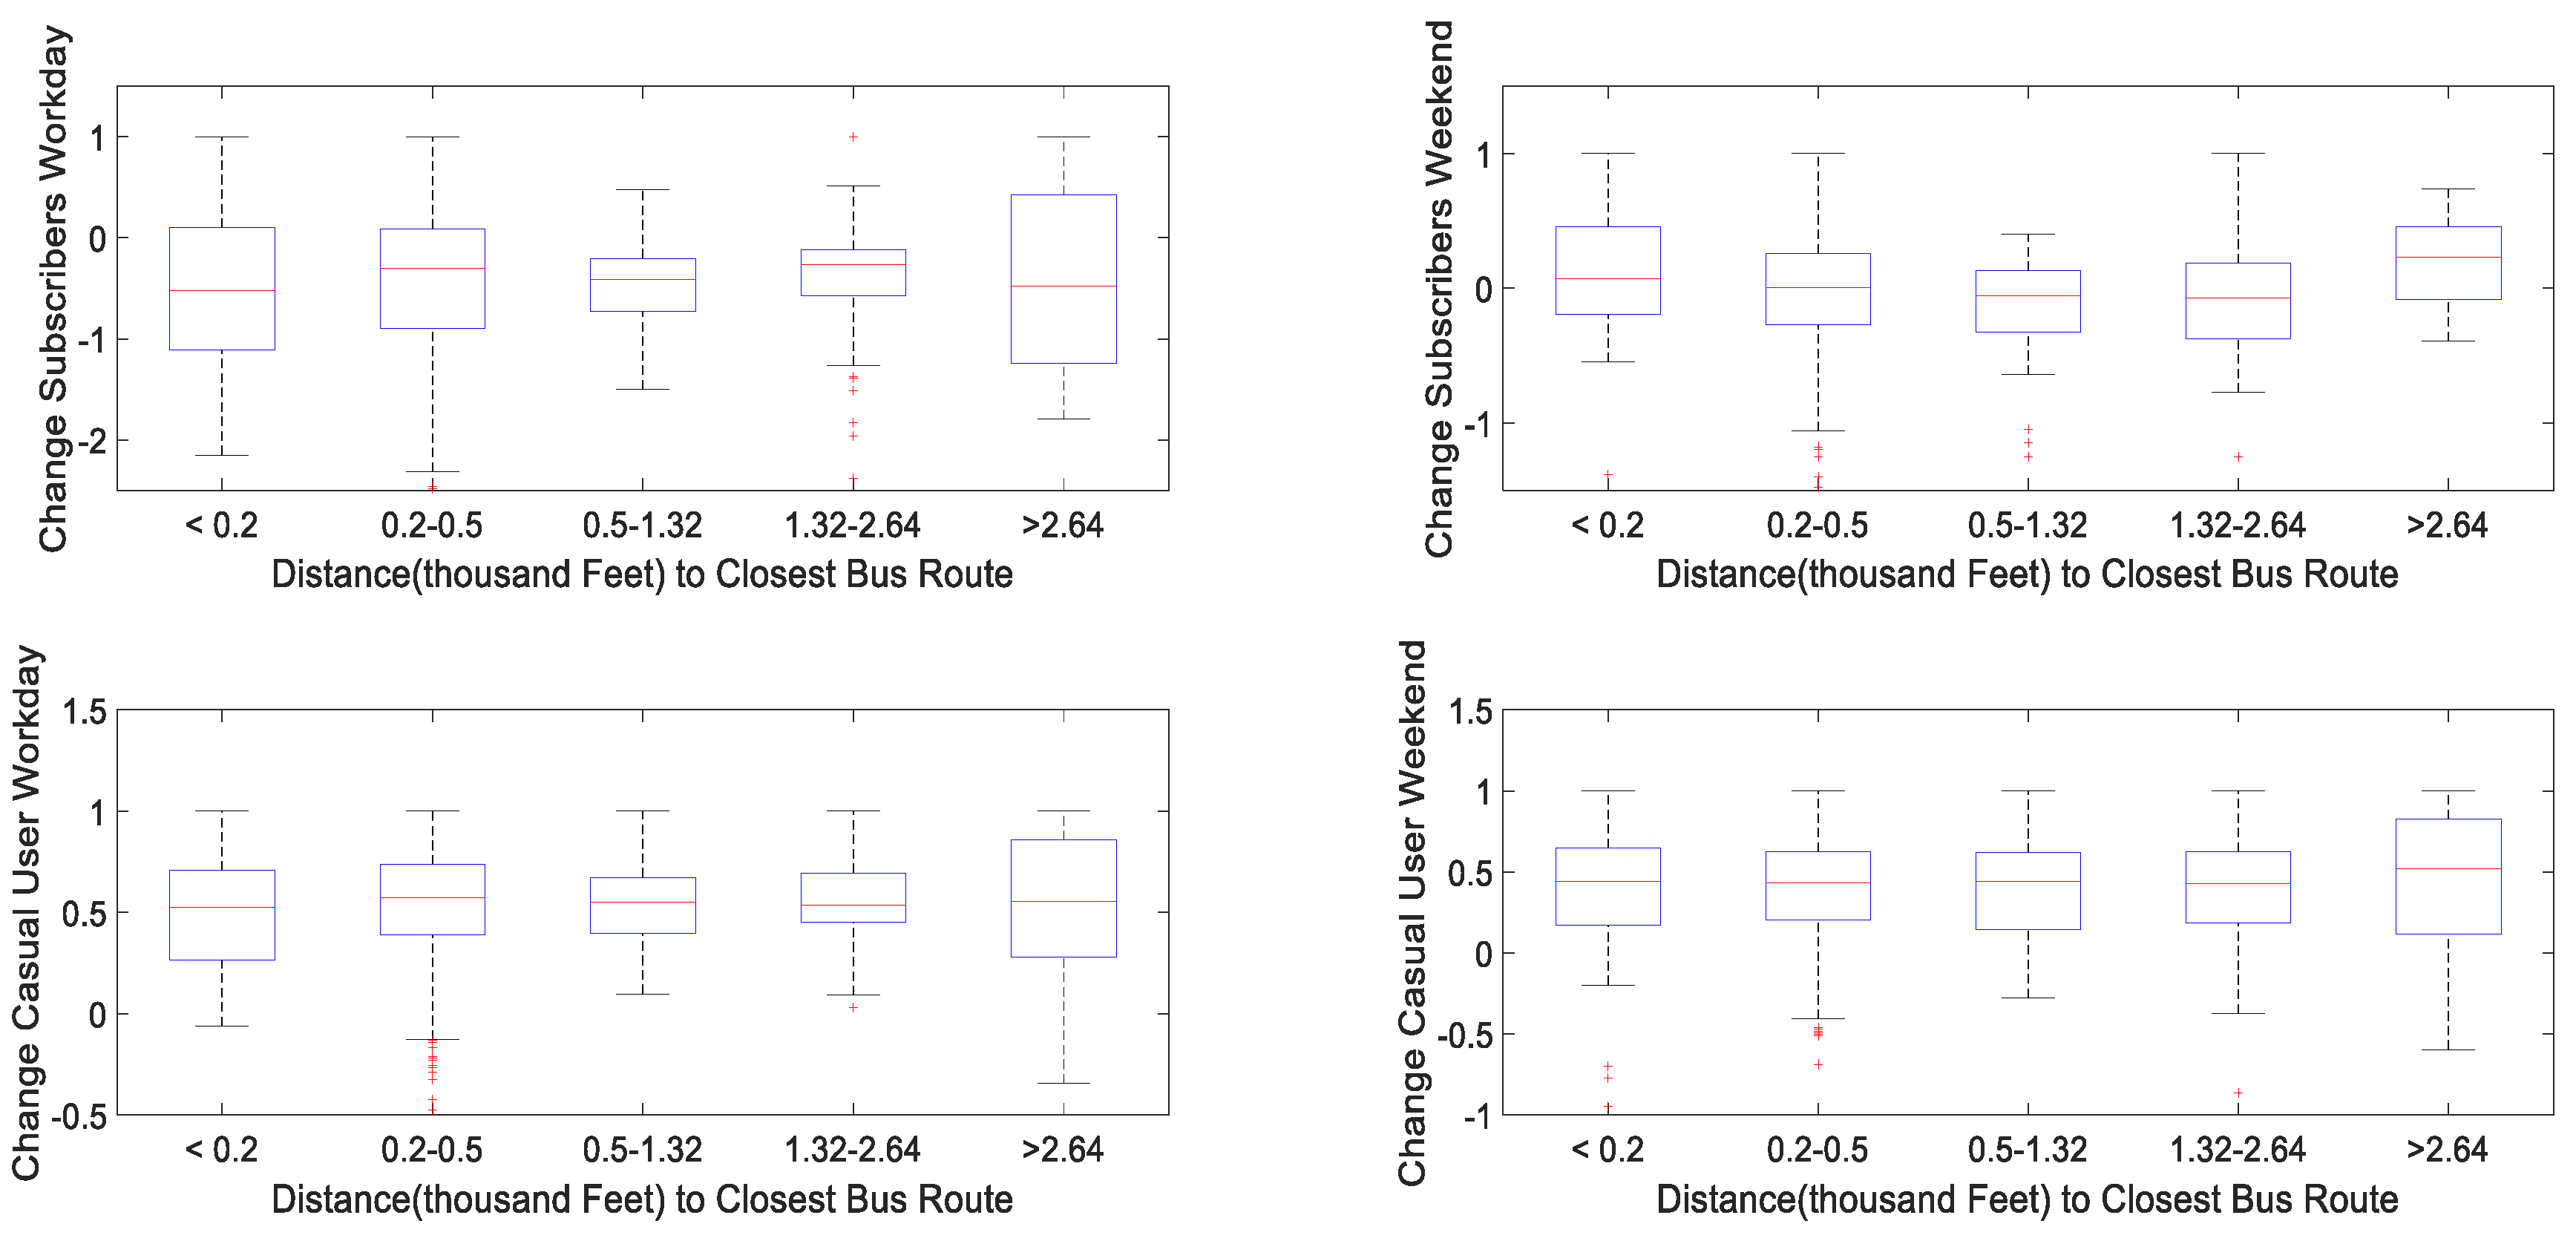
Figure 9.
Bikeshare trips by distance to rail stations.
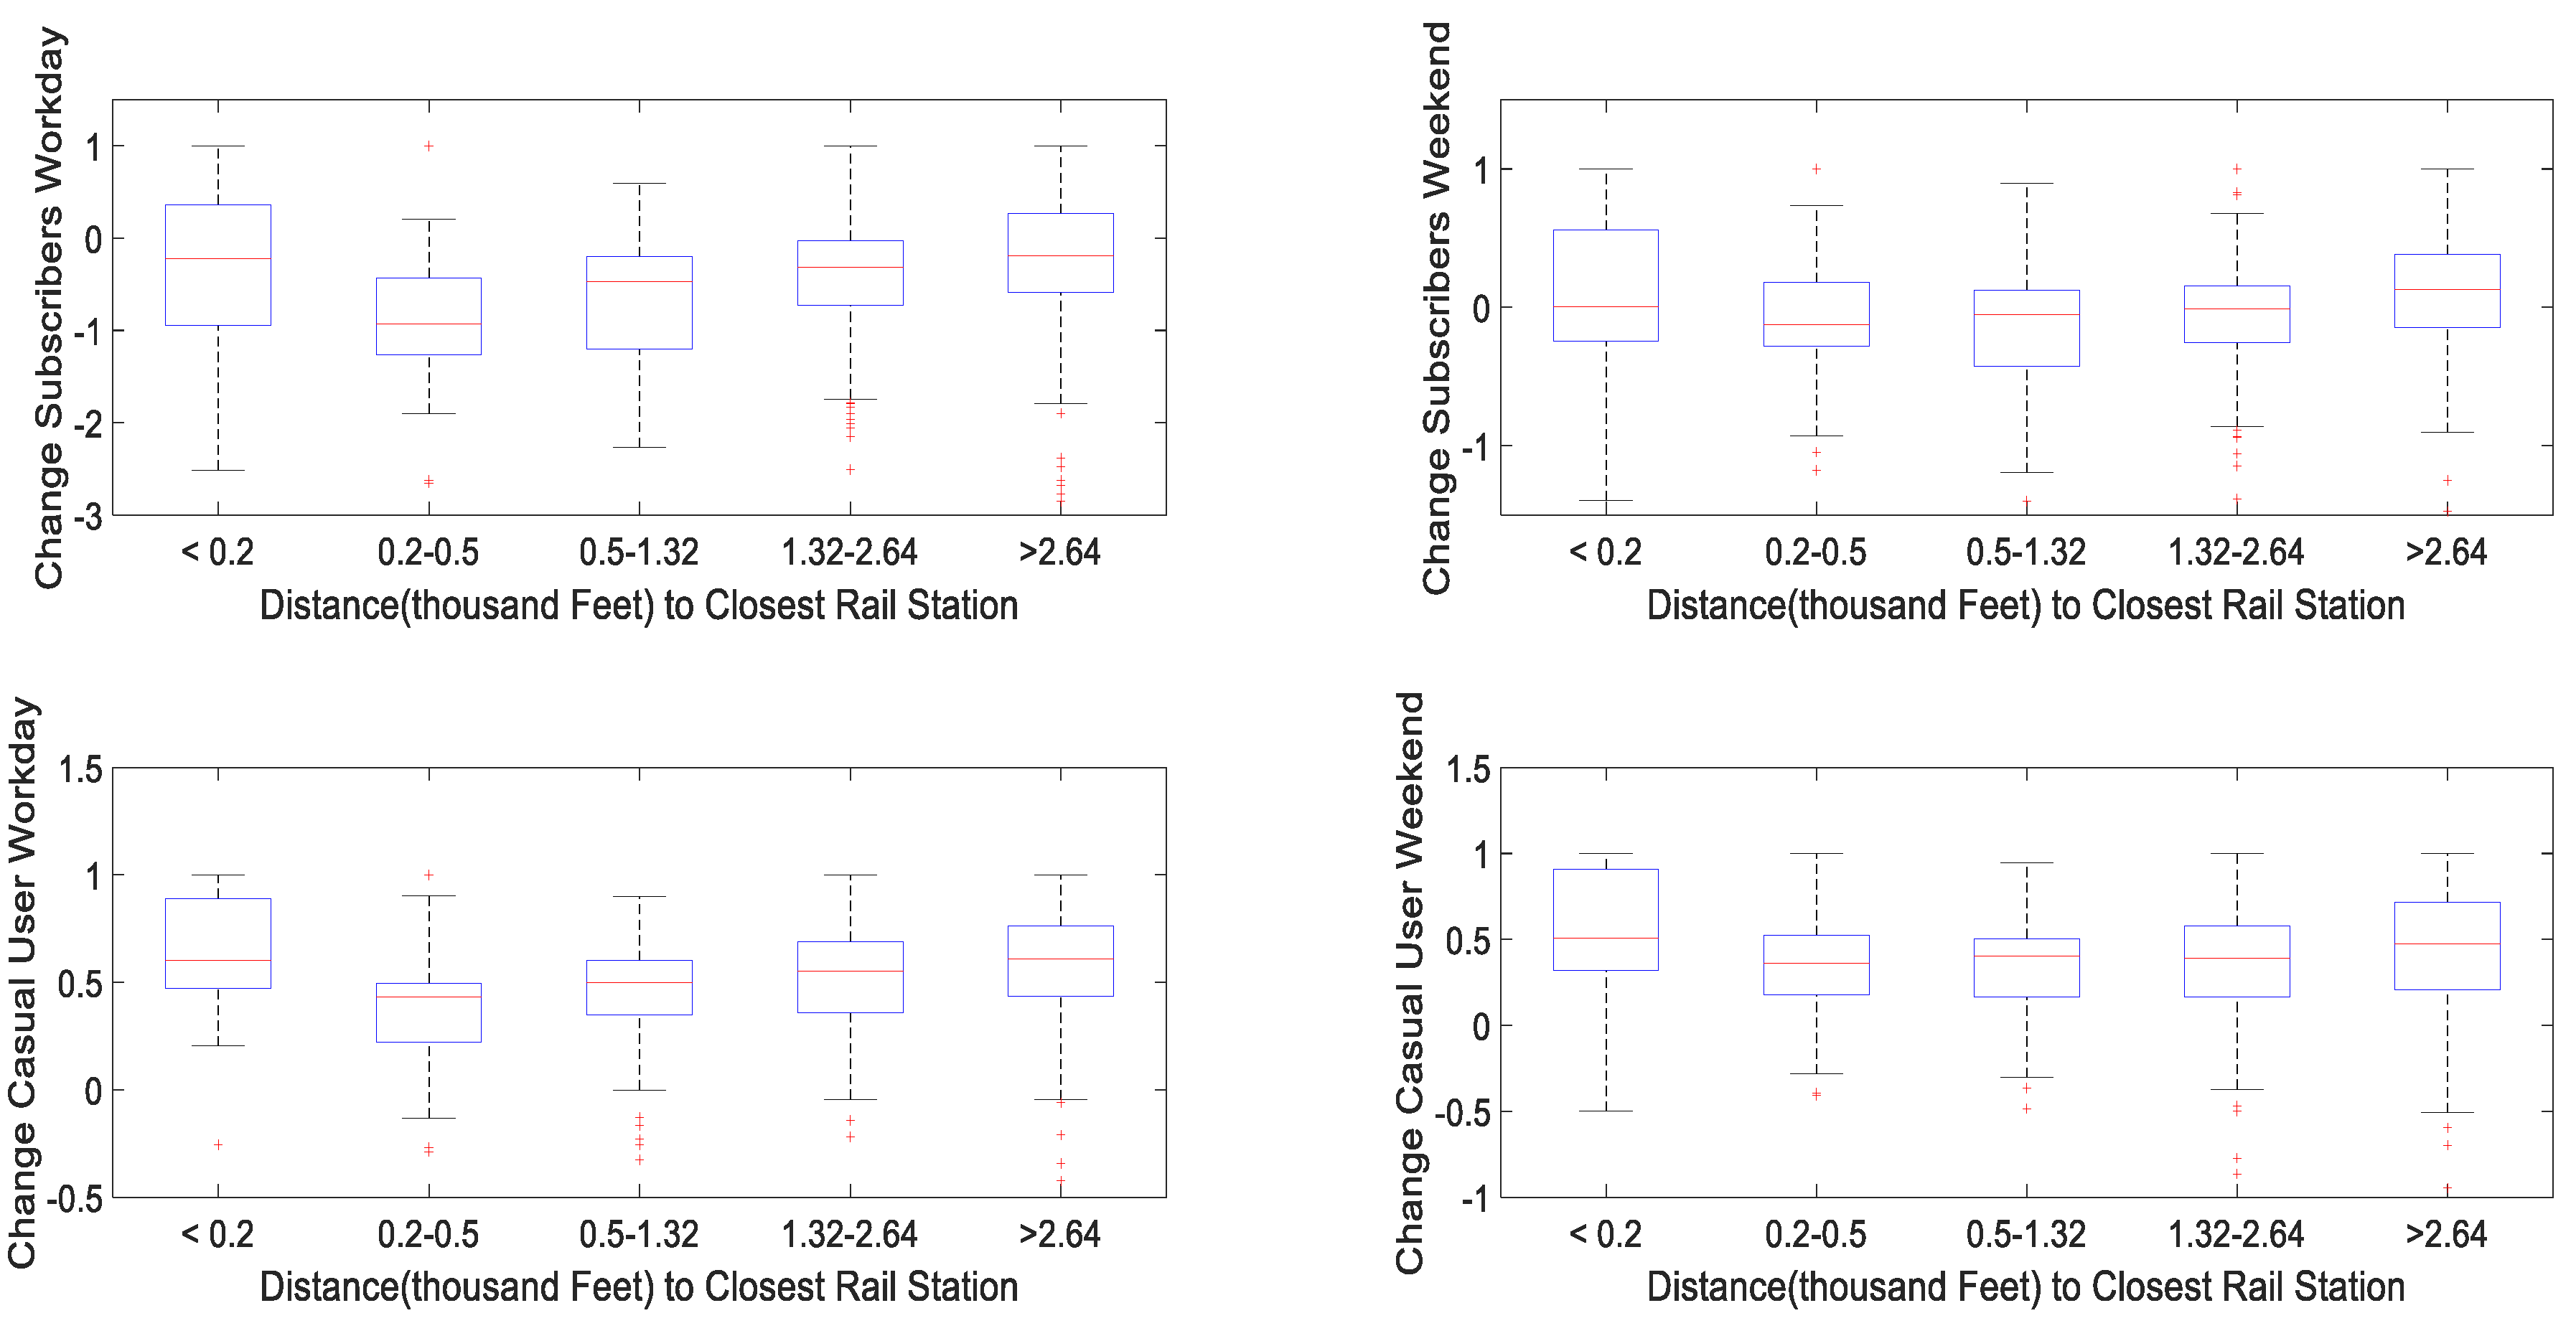
Figure 10.
Bikeshare trips by the closest bike route.
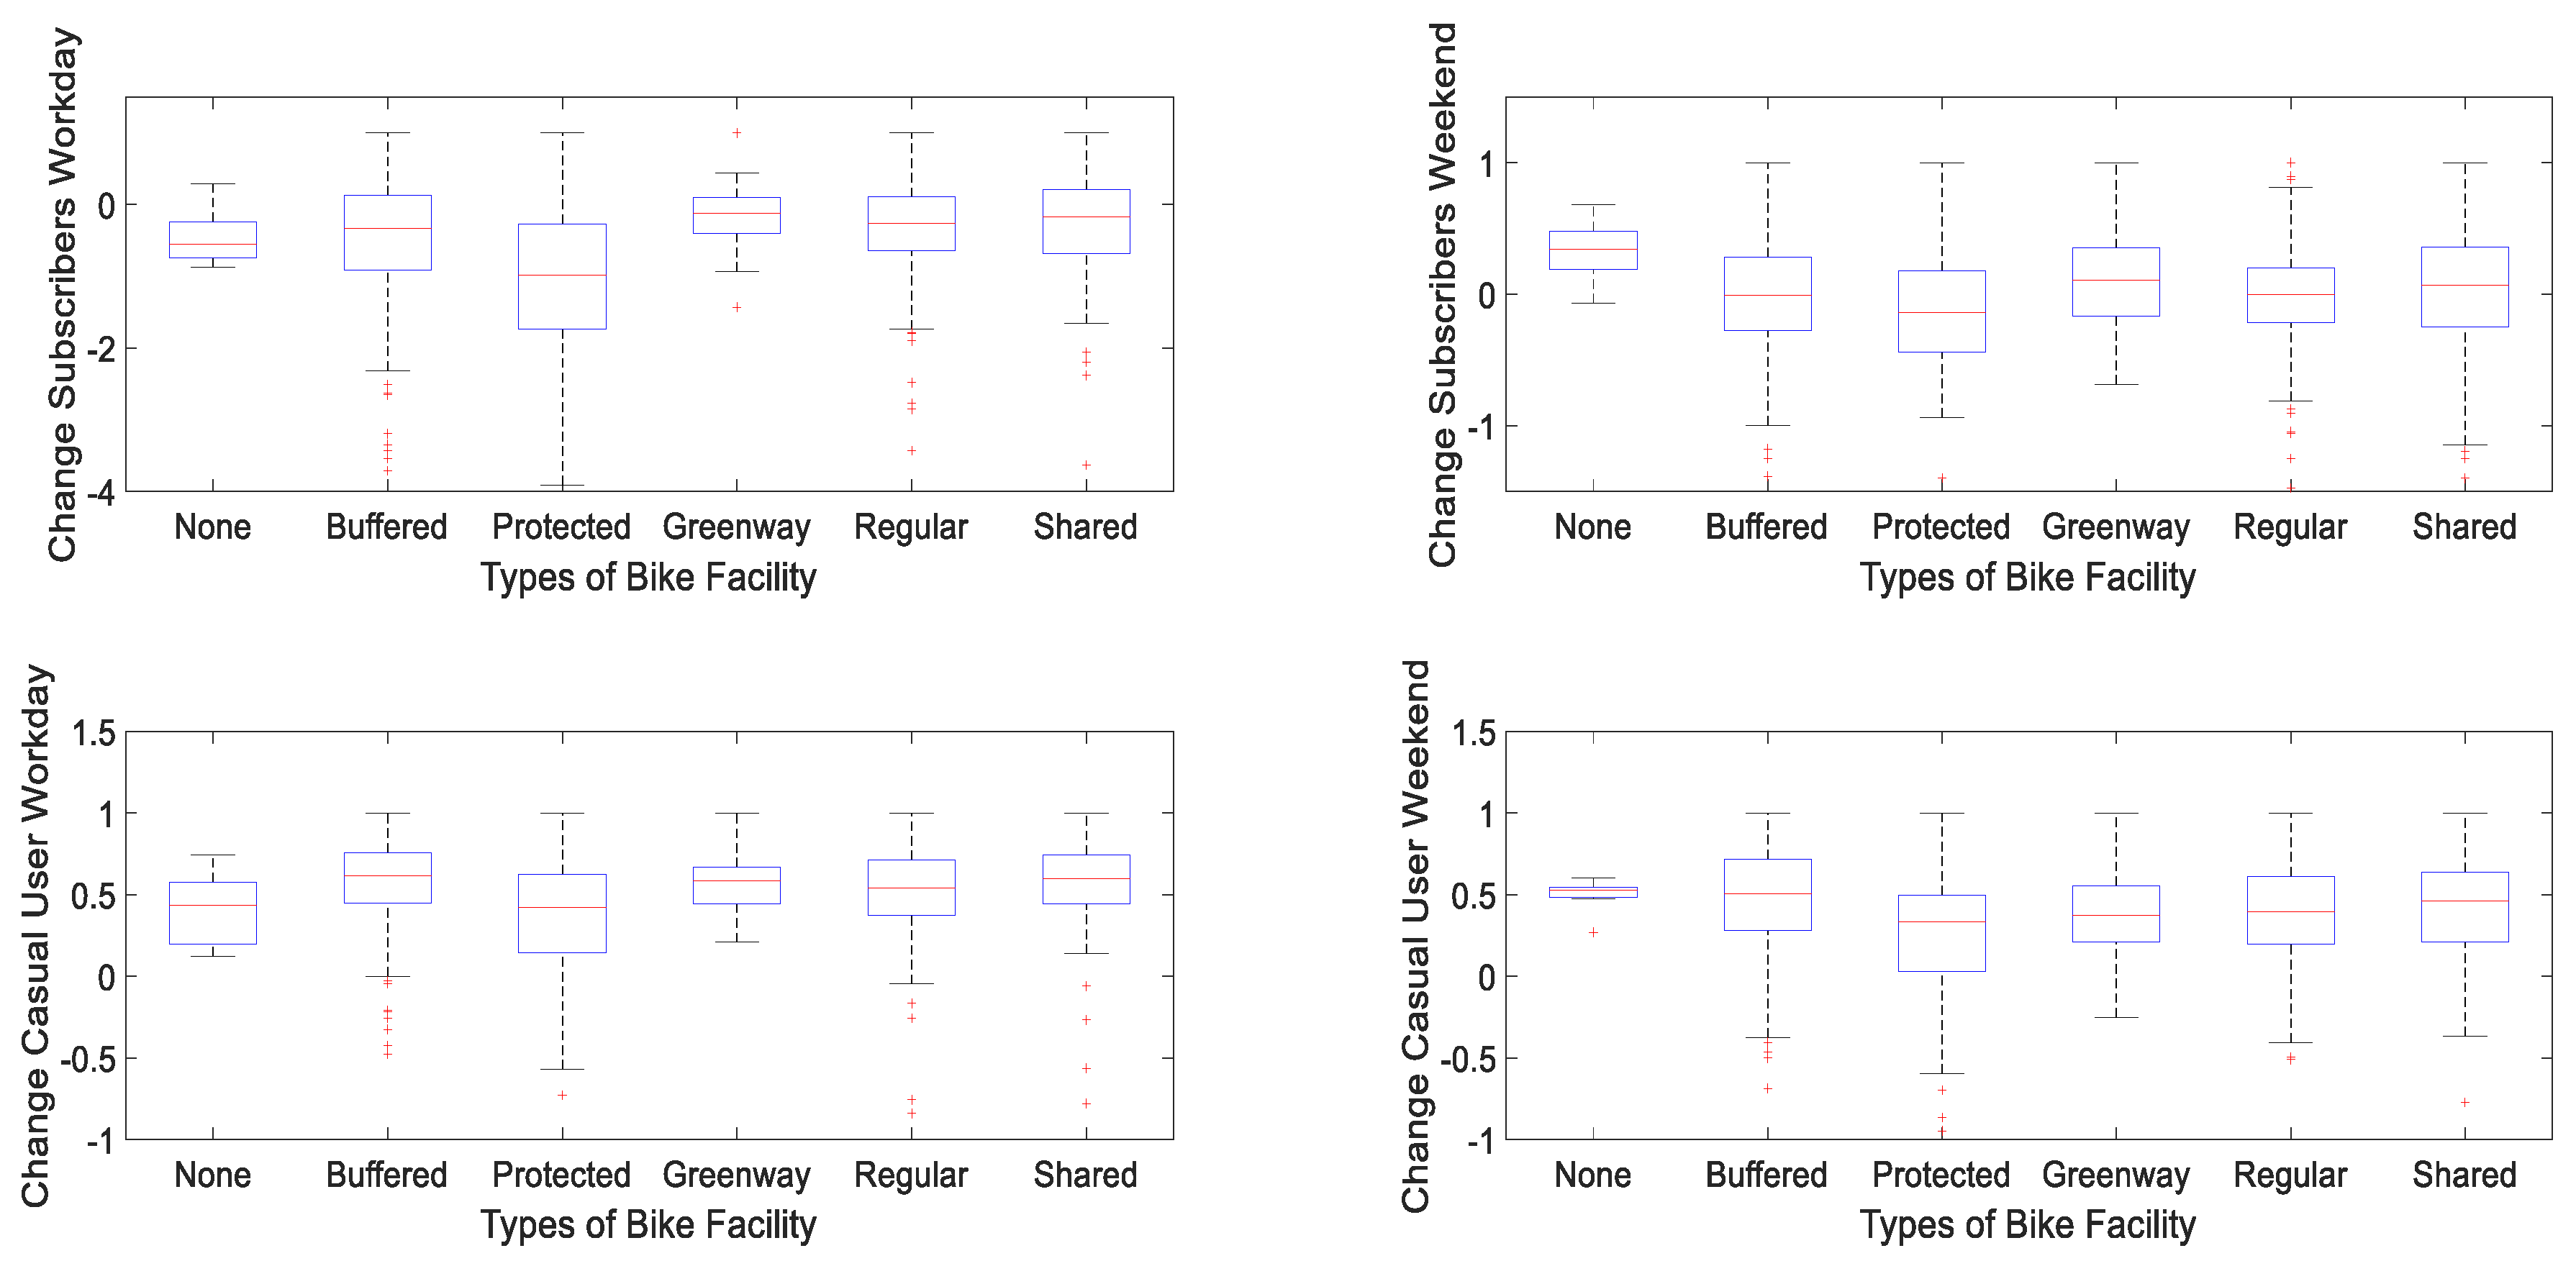

Table 1.
Bikeshare Travel by Year, User, and Time.
| USER | TIME | TRIPSPER DAY | TRIP TIME MEAN (S) | TRIP TIME MEDIAN (S) | STANDARD DEVIATION |
| SUBSCRIBER | 2019 Weekday | 15,008 | 812 | 636 | 952 |
| 2019 Weekend | 9,517 | 972 | 743 | 1,353 | |
| 2020 Weekday | 10,050 | 989 | 764 | 1,257 | |
| 2020 Weekend | 6,579 | 1,215 | 957 | 1,687 | |
| CASUAL | 2019 Weekday | 5,118 | 2,307 | 1,506 | 3,258 |
| 2019 Weekend | 10,184 | 2,595 | 1,714 | 3,260 | |
| 2020 Weekday | 7,912 | 2,376 | 1,366 | 4,007 | |
| 2020 Weekend | 9,063 | 2,958 | 1,716 | 4,519 |
Table 2.
Ridehailing Trips (Times in Seconds and Lengths in Miles).
| TIME | TRIPS /DAY | TIME MEAN | TIME MEDIAN | TIMESTD | LENGTH MEAN | LENGTH MEDIAN | LENGTH STD |
|---|---|---|---|---|---|---|---|
| 2019 Weekday | 283,945 | 1,132.81 | 914.00 | 808.36 | 5.91 | 3.60 | 6.54 |
| 2019 Weekend | 314,812 | 985.12 | 827.00 | 652.24 | 5.58 | 3.60 | 6.15 |
| 2020 Weekday | 104,953 | 993.09 | 838.00 | 654.23 | 6.55 | 4.30 | 7.10 |
| 2020 Weekend | 107,108 | 923.26 | 781.00 | 600.01 | 6.56 | 4.20 | 7.26 |
Table 3.
Public Transit Ridership (Per Day).
| TIME | CITY SUM(THOUSAND) | MEAN | MAX | MIN | MEDIAN | STD | |
| BUS(BY ROUTE) | 2019 Weekday | 758 | 6,017 | 23,396 | 4 | 4,281 | 4,281 |
| 2019 Weekend | 421 | 3,343 | 15,866 | 0 | 1,759 | 3,878 | |
| 2020 Weekday | 306 | 2,431 | 11,546 | 0 | 1,618 | 2,432 | |
| 2020 Weekend | 197 | 1,563 | 8,521 | 0 | 885 | 1,853 | |
| RAIL(BY STOP) | 2019 Weekday | 620 | 4,339 | 22,227 | 475 | 3,128 | 3,882 |
| 2019 Weekend | 326 | 2,281 | 11,396 | 256 | 1,470 | 2,289 | |
| 2020 Weekday | 121 | 843 | 3,660 | 123 | 658 | 642 | |
| 2020 Weekend | 74 | 519 | 2,307 | 75 | 366 | 431 |
Table 5.
Range and Cut-off Values of Delta by Modes.
| Class 1 | Class 2 | Class 3 | |
| Bikeshare Subscriber Around Rail | < -1 | -1 to 0 | > 0 |
| Bikeshare Casual User Around Rail | < 0 | 0 to 0.6 | > 0.6 |
| Rail | < -4 | -4 to -1.8 | > -1.8 |
| Bikeshare Subscriber Around Bus | < -0.7 | -0.7 to 0 | > 0 |
| Bikeshare Casual User Around Bus | < 0 | 0 to 0.5 | > 0.5 |
| Bus | < -1.5 | -1.5 to -1 | > -1 |
| Bikeshare Subscriber Around Ridehailing | < - 0.5 | -0.5 to 0 | > 0 |
| Bikeshare Casual User Around Ridehailing | < 0 | 0 to 0.65 | > 0.65 |
| Ridehailing | < -7 | -7 to -3 | > -3 |
Table 6.
Regression Results (*indicating statistically significant variables).
| Estimate | Std. Error | T-value | Pr(>|t|) | |
| (Intercept) | 2.188e+00 | 2.484e-01 | 8.809 | < 2.00E-16* |
| Distance to Bike Facility | -2.780e-05 | 4.130e-05 | -0.673 | 0.500933 |
| Distance to Bus Route | 9.137e-05 | 2.593e-05 | 3.524 | 0.000441* |
| Distance to Rail Station | 2.067e-04 | 7.600e-05 | 2.72 | 0.006623* |
| Delta Rail Ridership | 1.265e+00 | 2.981e-01 | 4.242 | 2.38E-05* |
| Delta Bus Ridership | 8.941e-01 | 1.847e-01 | 4.84 | 1.46E-06* |
| Factor (Area) 2 | -3.200e-01 | 6.652e-02 | -4.811 | 1.68E-06* |
| Factor (Area) 3 | -5.231e-01 | 1.123e-01 | -4.656 | 3.56E-06* |
| Factor (Area) 4 | -1.817e-01 | 1.767e-01 | -1.028 | 0.304071 |
| Factor (Weekday) 1 | -1.452e-01 | 4.849e-02 | -2.995 | 0.002797* |
| Factor (Subscriber) 1 | -8.873e-01 | 4.33E-02 | -20.508 | < 2.00E-16* |
Disclaimer/Publisher’s Note: The statements, opinions and data contained in all publications are solely those of the individual author(s) and contributor(s) and not of MDPI and/or the editor(s). MDPI and/or the editor(s) disclaim responsibility for any injury to people or property resulting from any ideas, methods, instructions or products referred to in the content. |
© 2023 by the authors. Licensee MDPI, Basel, Switzerland. This article is an open access article distributed under the terms and conditions of the Creative Commons Attribution (CC BY) license (http://creativecommons.org/licenses/by/4.0/).
Copyright: This open access article is published under a Creative Commons CC BY 4.0 license, which permit the free download, distribution, and reuse, provided that the author and preprint are cited in any reuse.


