1. Introduction
The incorporation of TiO
2-NPs on textile fibers provides them with antiviral properties, UV protection, and promotes surface hydrophobicity/hydrophilicity, that could act as flame retardants and provide self-cleaning properties [
1,
2,
3]. The antibacterial activity of TiO
2-NPs is attributed to the fact that they can produce reactive oxygen species (ROS) in the presence of UV irradiation. Also, TiO
2-NPs antibacterial activity has been observed in dark conditions, however the action mechanism is not yet fully understood [
4].
The synthesis of TiO
2-NPs by sonochemical irradiation at low temperatures has been reported as an efficient method to obtain nanocrystals of suitable size [
5]. In a similar sense, Prasad
et al. [
6] reported the synthesis of TiO
2-NPs by the sol-gel method assisted by ultrasound at low temperature. Additionally, the impregnation of several types of NPs on the surface of cotton fibers by ultrasonic irradiation has been reported previously, i.e., Ag nanoparticles [
7], ZnO nanoparticles [
8], CuO nanoparticles [
9] and TiO
2-NPs [
10,
11].
The immobilization of TiO
2-NPs on cotton, obtaining the anatase phase without requiring subsequent heating and using the ultrasound-assisted sol-gel method is possible. This method showed high resistance of the fabrics to leaching under several wash cycles, thus maintaining their self-cleaning properties and UV protection [
11,
12]. The incorporation of nanoparticles in textiles is of great importance for the development of personal protection equipment (PPE) to face pandemics such as COVID-19 in a more efficient way [
13]. In this sense, it is expected that the photocalytic activity can be improved by forming composites of Ag and titania nanoparticles deposited on cotton.
In this work, the in-situ immobilization of NPs of Ag and TiO2 on cotton fabric was obtained by the ultrasound-assisted and hydrothermal successive methods. Cotton fabrics with Ag-TiO2 incorporated were analyzed by ATR-FTIR, Raman, HREM and SEM-EDS to assess the appropriate formation and impregnation of the TiO2-NPs on the surface of the fibers. The photocatalytic activity of the NPs impregnated on cotton fabrics were evaluated using aqueous solutions of MB dye under solar and UV irradiation. The biocide activity of the Ag-titania/cotton fabric composite textiles on the growth inhibition of Staphylococcus aureus (S. aureus, Gram+) and Escherichia coli (E. coli, Gram-) was determined in liquid culture and LB-agar plates.
2. Materials and Methods
2.1. Materials
Commercial Indiolino fabrics (100% cotton, 175 g/m2) was used as model textile. All precursor reactive were provided by Sigma-Aldrich and used without further purification. Before the treatments, the fabrics were washed with a non-ionic detergent and dried for 24 h at 70°C. All impregnation procedures were carried out using 5 cm x 5 cm of cotton squares.
2.2. Synthesis and incorporation of Ag and TiO2 NPs on cotton fabrics
The preparation method was improved varying the synthesis parameters, as: loading of precursors (of Ag and Ti), treatment and synthesis temperature, reaction time and washed conditions. Before the precursor impregnation on cotton, the textile was functionalized to assure a good anchoring the NPs on cotton. The method described by Dong and Hinestroza [
14] was adapted and consists of treating the fabric with KOH solution (1M), at room temperature under constant stirring for 10 minutes. Then, the fabric was rinsed with distilled water and dried at 90 °C for 45 minutes. The preparation of the samples was carried out according to
Scheme 1.
2.2.1. Synthesis of TiO2 NPs on cotton fabrics
TiO
2 NPs on cotton fabrics were obtained by hydrothermal synthesis [
11], which is briefly follow descripted. The cotton samples were first dried at 70 °C for 4 h to remove adsorbed water and immediately dipped for 12 h into a 1 wt.% solution of titanium butoxide (BuOT) in a mixture of terbutanol and acetic acid (90/10 wt.%). Samples were then removed and dried at 60 °C for 2 h in an oven, to evaporate the solvent, and then transferred into a 200 mL Teflon-lined stainless-steel autoclave, half-full of water, which was then placed in an oven maintained at 110 °C for the hydrothermal treatment during 3 h. Finally, samples were dried at 50 °C for 2 h.
2.2.2. Synthesis of Ag NPs on cotton fabrics
As
Scheme 1 indicates, the first step is the generation of Ag NPs by immersion of a cotton fabric (5 cm x 5 cm) into 100 mL of AgNO
3 solution in water (0.02 M) for 30 min. Then, the fabric was dried at 90°C for 45 min. and immersed in a solution of NaBH
4 (0.01 M) for 30 min to reduce the adsorbed Ag
+, and copiously rinsed with water. After it was dried at 90 °C for 45 min.
2.2.3. Synthesis and incorporation of Ag and TiO2 NPs on cotton fabrics
Composites of Ag and titania were prepared by successive impregnation of AgNPs on cotton and subsequently impregnation of TiO
2 NPs by the methods before described (see
Scheme 1).
2.3. Photocatalytic tests
2.3.1. Methyl blue degradation tests using UV radiation
The photocatalytic properties of the cotton samples were analyzed based on the methylene blue (MB) degradation, which was previously impregnated on the surface of the cotton fabrics. The cotton samples were cut into 2.5 cm x 2.5 cm pieces and were impregnated with a MB solution (3 mL, 5 ppm). Then, the fabrics were exposed to UV light source (320 nm) with an intensity of 3.5 mW/cm
2. The maximum absorbance value (C
0) was determined by UV–vis DRS spectroscopy. Meanwhile, the UV–vis DRS absorption spectra (C) of the fabrics containing MB were obtained at 0, 15, 30, 60 and 120 min of UV-light exposure. The rate of dye decomposition was calculated and compared based on the C/C
0 values, where C
0 and C represent the initial MB concentration on the impregnated cotton pieces and the MB concentration at the time t, respectively [
15].
2.3.2. Methyl blue degradation tests using solar radiation
The photocatalytic properties of TiO
2-NPs functionalized on cotton fabrics were also assessed using solar irradiation for the methylene blue (MB) degradation. Briefly, the experimental procedure was as follows: 2.5 cm x 2.5 cm pieces of cotton samples were impregnated with a MB solution (3 mL, 5 ppm). After, the cotton samples were placed in a container that was kept exposed to sunlight. The average natural day light irradiation intensity was 4 mW/cm
2, in winter from 9 am to 3 pm in Mexico City. The initial concentration of MB (C
0) on the cotton surface and at 15, 30, 60 and 120 min exposed to sunlight were assessed by UV–vis DRS spectroscopy. The MB degradation was determined as the relation C/C
0, where C
0 and C represent the initial MB concentration on the impregnated cotton pieces and the MB concentration at the time t, respectively [
15].
2.4. Washing tests
The cotton pieces were subjected to several washing cycles to determine the leaching of the TiO
2-NPs. The washing cycles were carried out according to the textile standard FZ/T 73023-2006 as follows: the impregnated cotton fabrics were immersed in an ultrasound device (100 Hz) at 40 °C for 5 min. The washed cotton fabrics were removed and rinsed with distilled water. Afterwards, the cotton pieces and the washing water were analyzed by UV-vis and UV-vis DRS spectroscopy, respectively, to determine the amount of TiO
2-NPs leached [
12].
2.5. Characterization
Attenuated total reflectance infrared spectroscopy (ATR-FTIR) was carried out in Nicolet 6700 FT-IR spectrometer to corroborate the formation and successfully impregnation of TiO2-NPs on the cotton fabrics. Raman spectroscopy and DxR Raman microscope Thermo Scientific was used to corroborate the surface characteristics of the materials. The synthesis solutions and the water from the washing tests were analyzed by UV-vis spectroscopy at RT (Varian Cary 50) from 200 to 1100 nm to assess the impregnated titanium amount and the leached titanium amount, respectively. Scanning electron microscopy (SEM) coupled to energy dispersive spectroscopy (EDS) system was carried out using a Jeol JSM-5900 LV microscope to the morphological and elemental analysis. Surface area of cotton samples was determined using N2 adsorption-desorption isotherms at -196 °C on a Tristar Micrometrics apparatus; the samples were degassed 8 h in vacuum at 350 °C. Tensile strength of the samples chemically treated and without treatment were tested on a Digital traction force Gauge, LZKW. The MB degradation on the surface of the cotton pieces was analyzed by UV-vis DRS (Perkin Elmer Lambda 365).
Photoluminescence (PL) analysis was measured at room temperature using the Spectrofluorometer model JASCO FP-8550 (Japan) in conjunction with a ISF-134 integration sphere.
2.6. Biocide activity
In order to perform the biocide activity experiments, 0.5 cm x 0.5 cm squares were cut from the three samples, regular cotton fabric, Ag NPs and Ag-TiO2NPs composites. The samples were then inoculated by immersion in 106 CFU/ml E. coli or S. aureus cultures. A kanamicyn control was prepared by immersing the indolino cotton fabric in a 1 mg/ml kanamicyn solution, followed by inoculation with the desired bacteria culture. The inoculated fabrics were then deposited on top of a glass microscope slide (Fisher Brand) and covered with a second slide. This setup allowed for the exposition of the fabrics to varying periods of sunlight. The Group A was not exposed to sunlight (t = 0 min), the Group B was exposed to 20 minutes of sunlight on each side (t = 20 min), and the Group C was exposed to 60 minutes of sunlight on each side (t = 60 min). The sunlight and UV AB radiation were measured with an URCERI light meter and an UV AB detector. After exposition to sunlight, the fabrics were subdivided into two groups. The first group was deposited into a 96-well plate where each fabric was submerged in a well with 200 µl of LB medium. The well plate was then incubated at 37 °C with constant agitation at 250 rpm for 18 hours. Afterwards, the fabrics were removed from the wells and bacteria growth was determined by measuring optical density at 600 nm on a UV-Vis spectrometer. The second group of fabrics was incubated on LB agar plates and incubated at 37 °C. Pictures of the plates were taken at 20 and 40 hours of incubation to evaluate bacteria growth around the fabrics at different time intervals. All experiment conditions were performed by triplicates.
3. Results and discussion
The present research was realized by studying the photocatalytic and biocide properties of Ag-TiO2 composites on cotton fabrics. These composites were characterized by means of mechanical, structural, physicochemical and spectroscopical technics.
3.1. Tensile properties of fabrics before and after the preparation tests
The lattice thread diameter, the grammage and the tensile strength were evaluated for the bare cotton fabrics (Indiolino) and after the treatments when NPs were incorporated on Indiolino. In previous work [
11], Indiolino show: 0.4 m
2/g of surface area, 0.38 mm of lattice thread diameter, grammage of 175 g/m
2 and 9.90 N of tensile strength.
Indiolino was immersed successively in an ultrasound bath with KOH, AgNO3, NaBH4 and BuOT solutions at different conditions, with intermediary drying steps, and finally in hydrothermal process at 110 °C. After the preparation, similar mechanical properties were obtained and the tensile strength of the fabrics was about 5 % less resistant than the original one. These results indicated that in-situ preparation of NPs on Indiolino did not cause any significant damage to on the structure of cotton.
3.2. TEM, SEM-EDS and elemental mapping
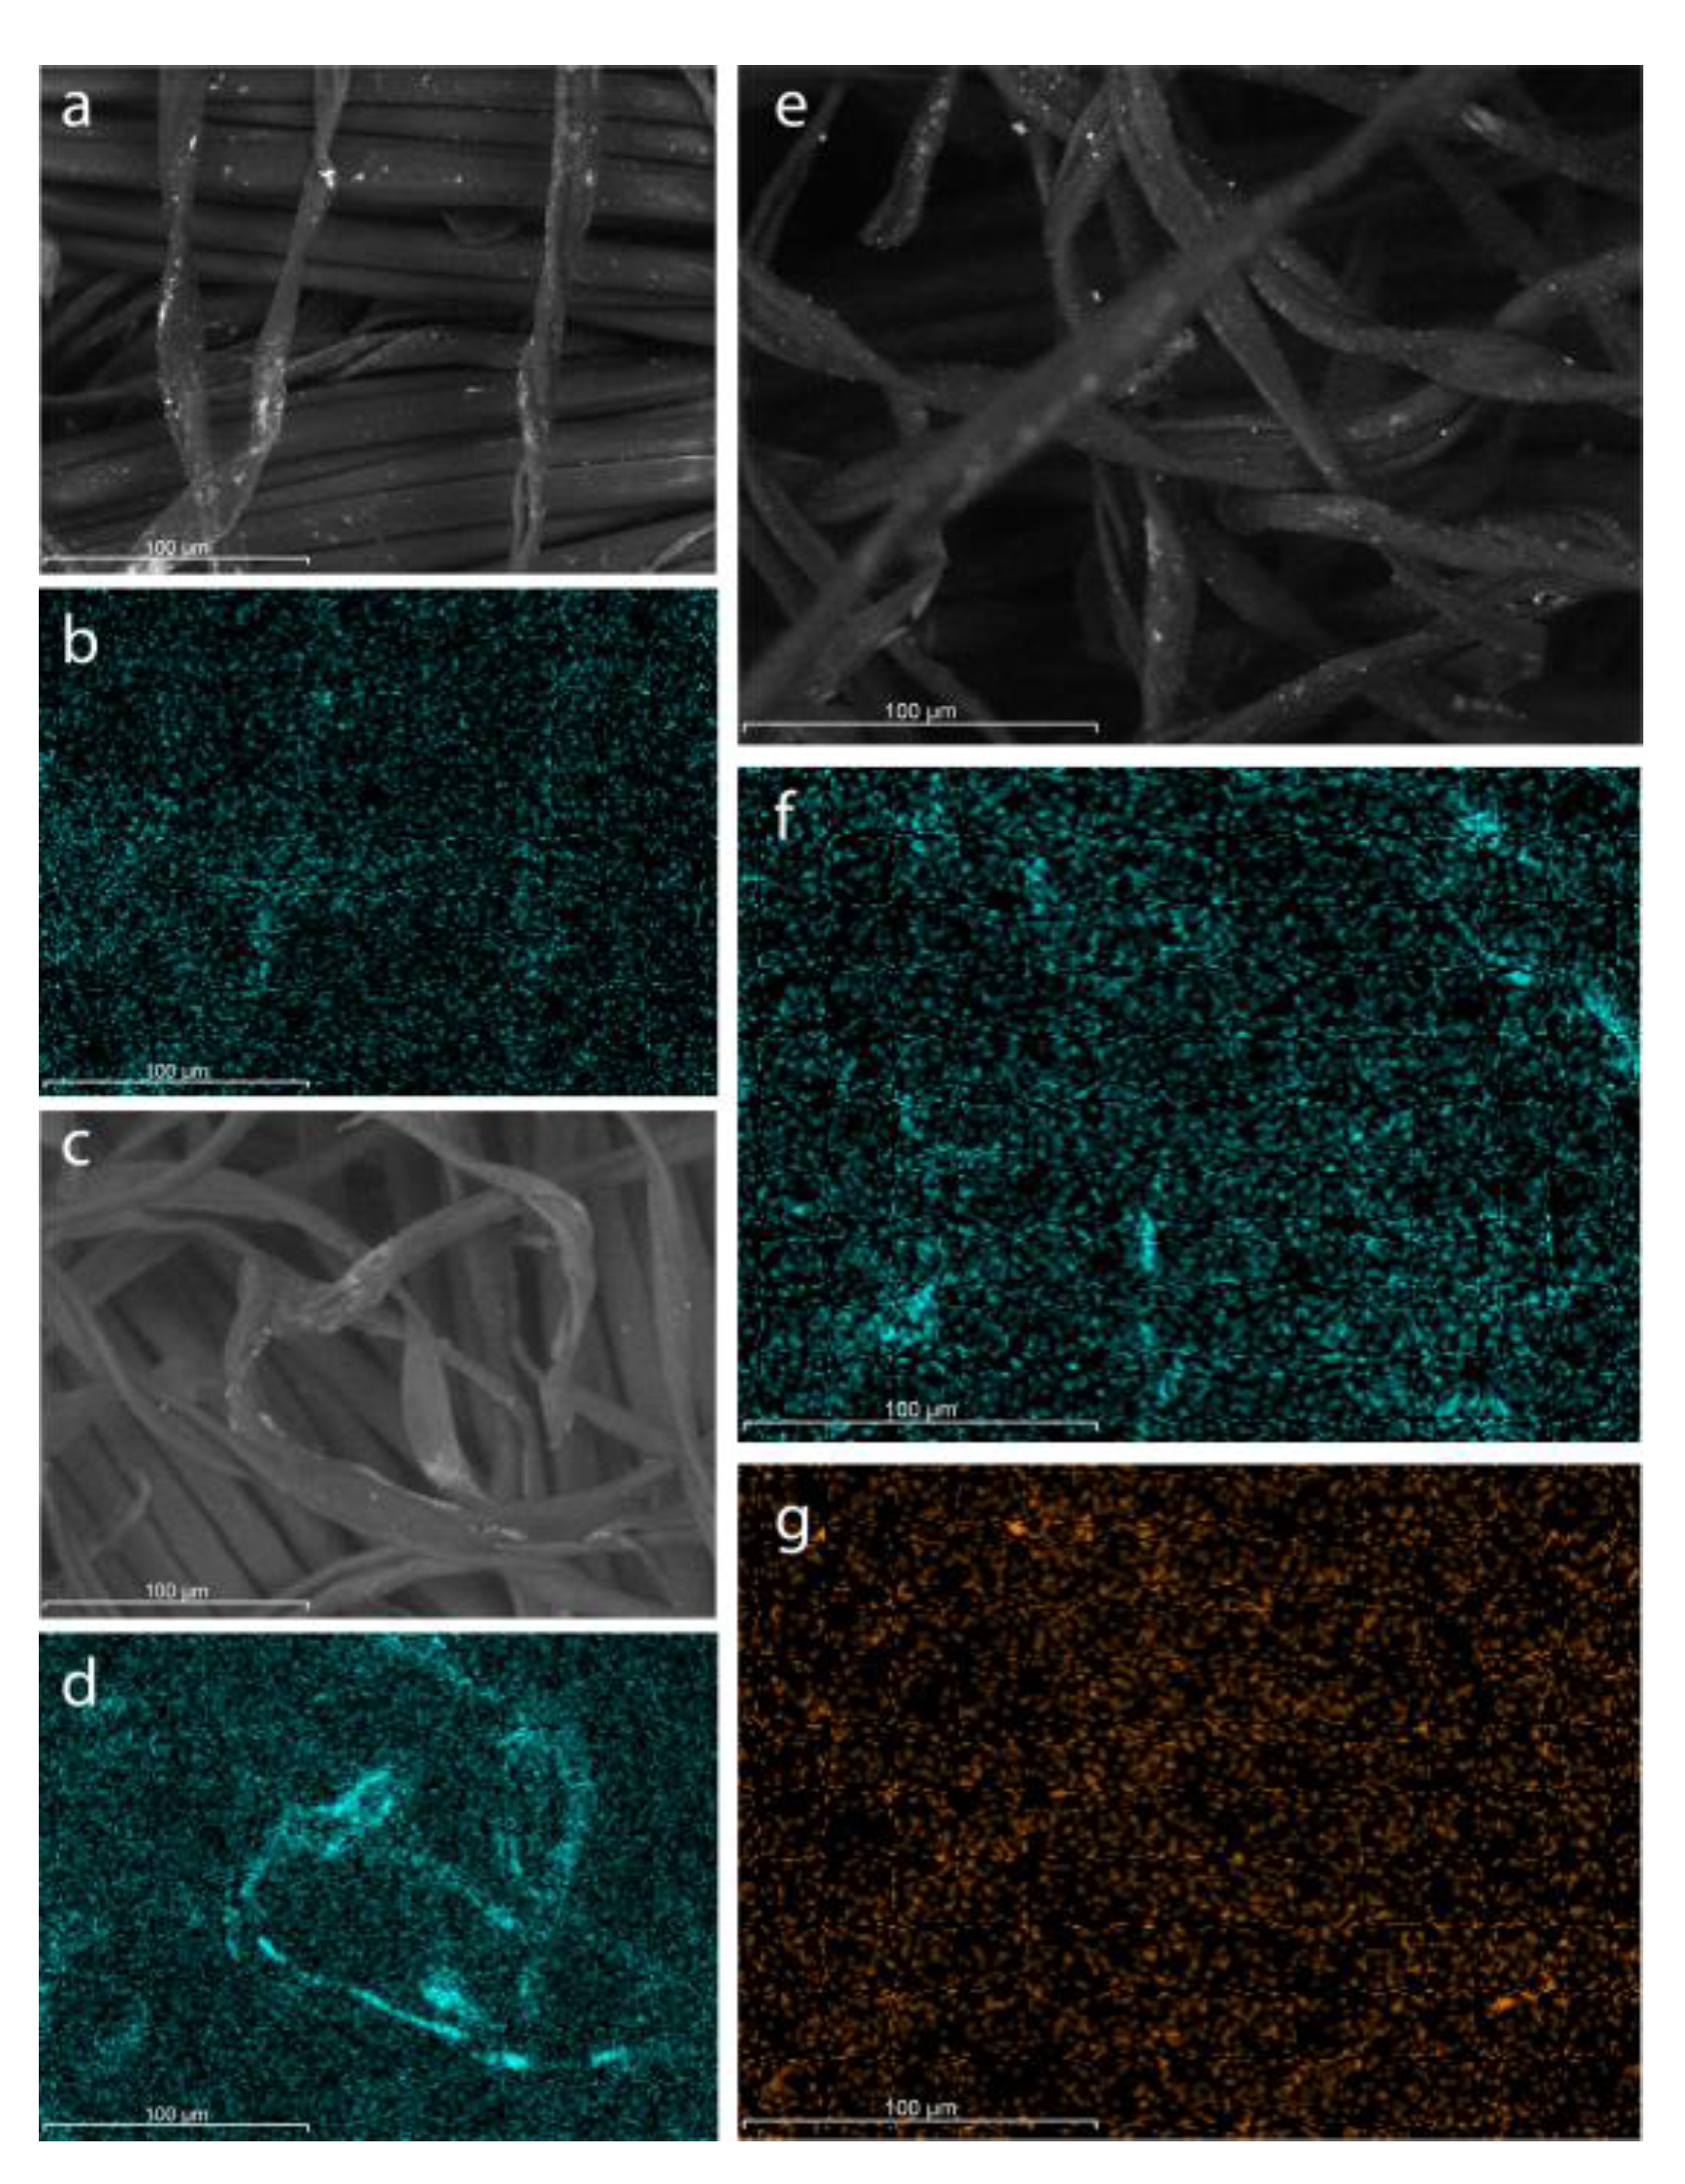
Figure 1 presents the SEM images and corresponding elemental mapping of Ag-NPs, Ti-NPs and AgTi-NPs. All SEM images show that the structures of the cotton microfibers remain intact, despite the different chemical and thermal treatments to which they were subjected for the incorporation of the NPs.
Figure 1a shows particles on the cotton fibers suggesting a correct synthesis of the metallic silver particles, as well as an adequate dispersion on the surface of the fabrics (
Figure 1b). This same behavior is also present for the Ti-NPs in
Figure 1c and 1d. According to the elemental analysis (EDS), the Ag and Ti loadings were 2.5 and 4.9 wt.% for the Ag-NPs and Ti-NPs samples, respectively. Values decreased in the AgTi-NPs nanocomposite, down to 0.9 wt.% for silver and 1.5 wt.% for Ti. This may be attributed to additional steps in the synthesis of the AgTi-NPs nanocomposite removing the clusters of weakly anchored NPs on the cotton fibers (
Figure 1e).
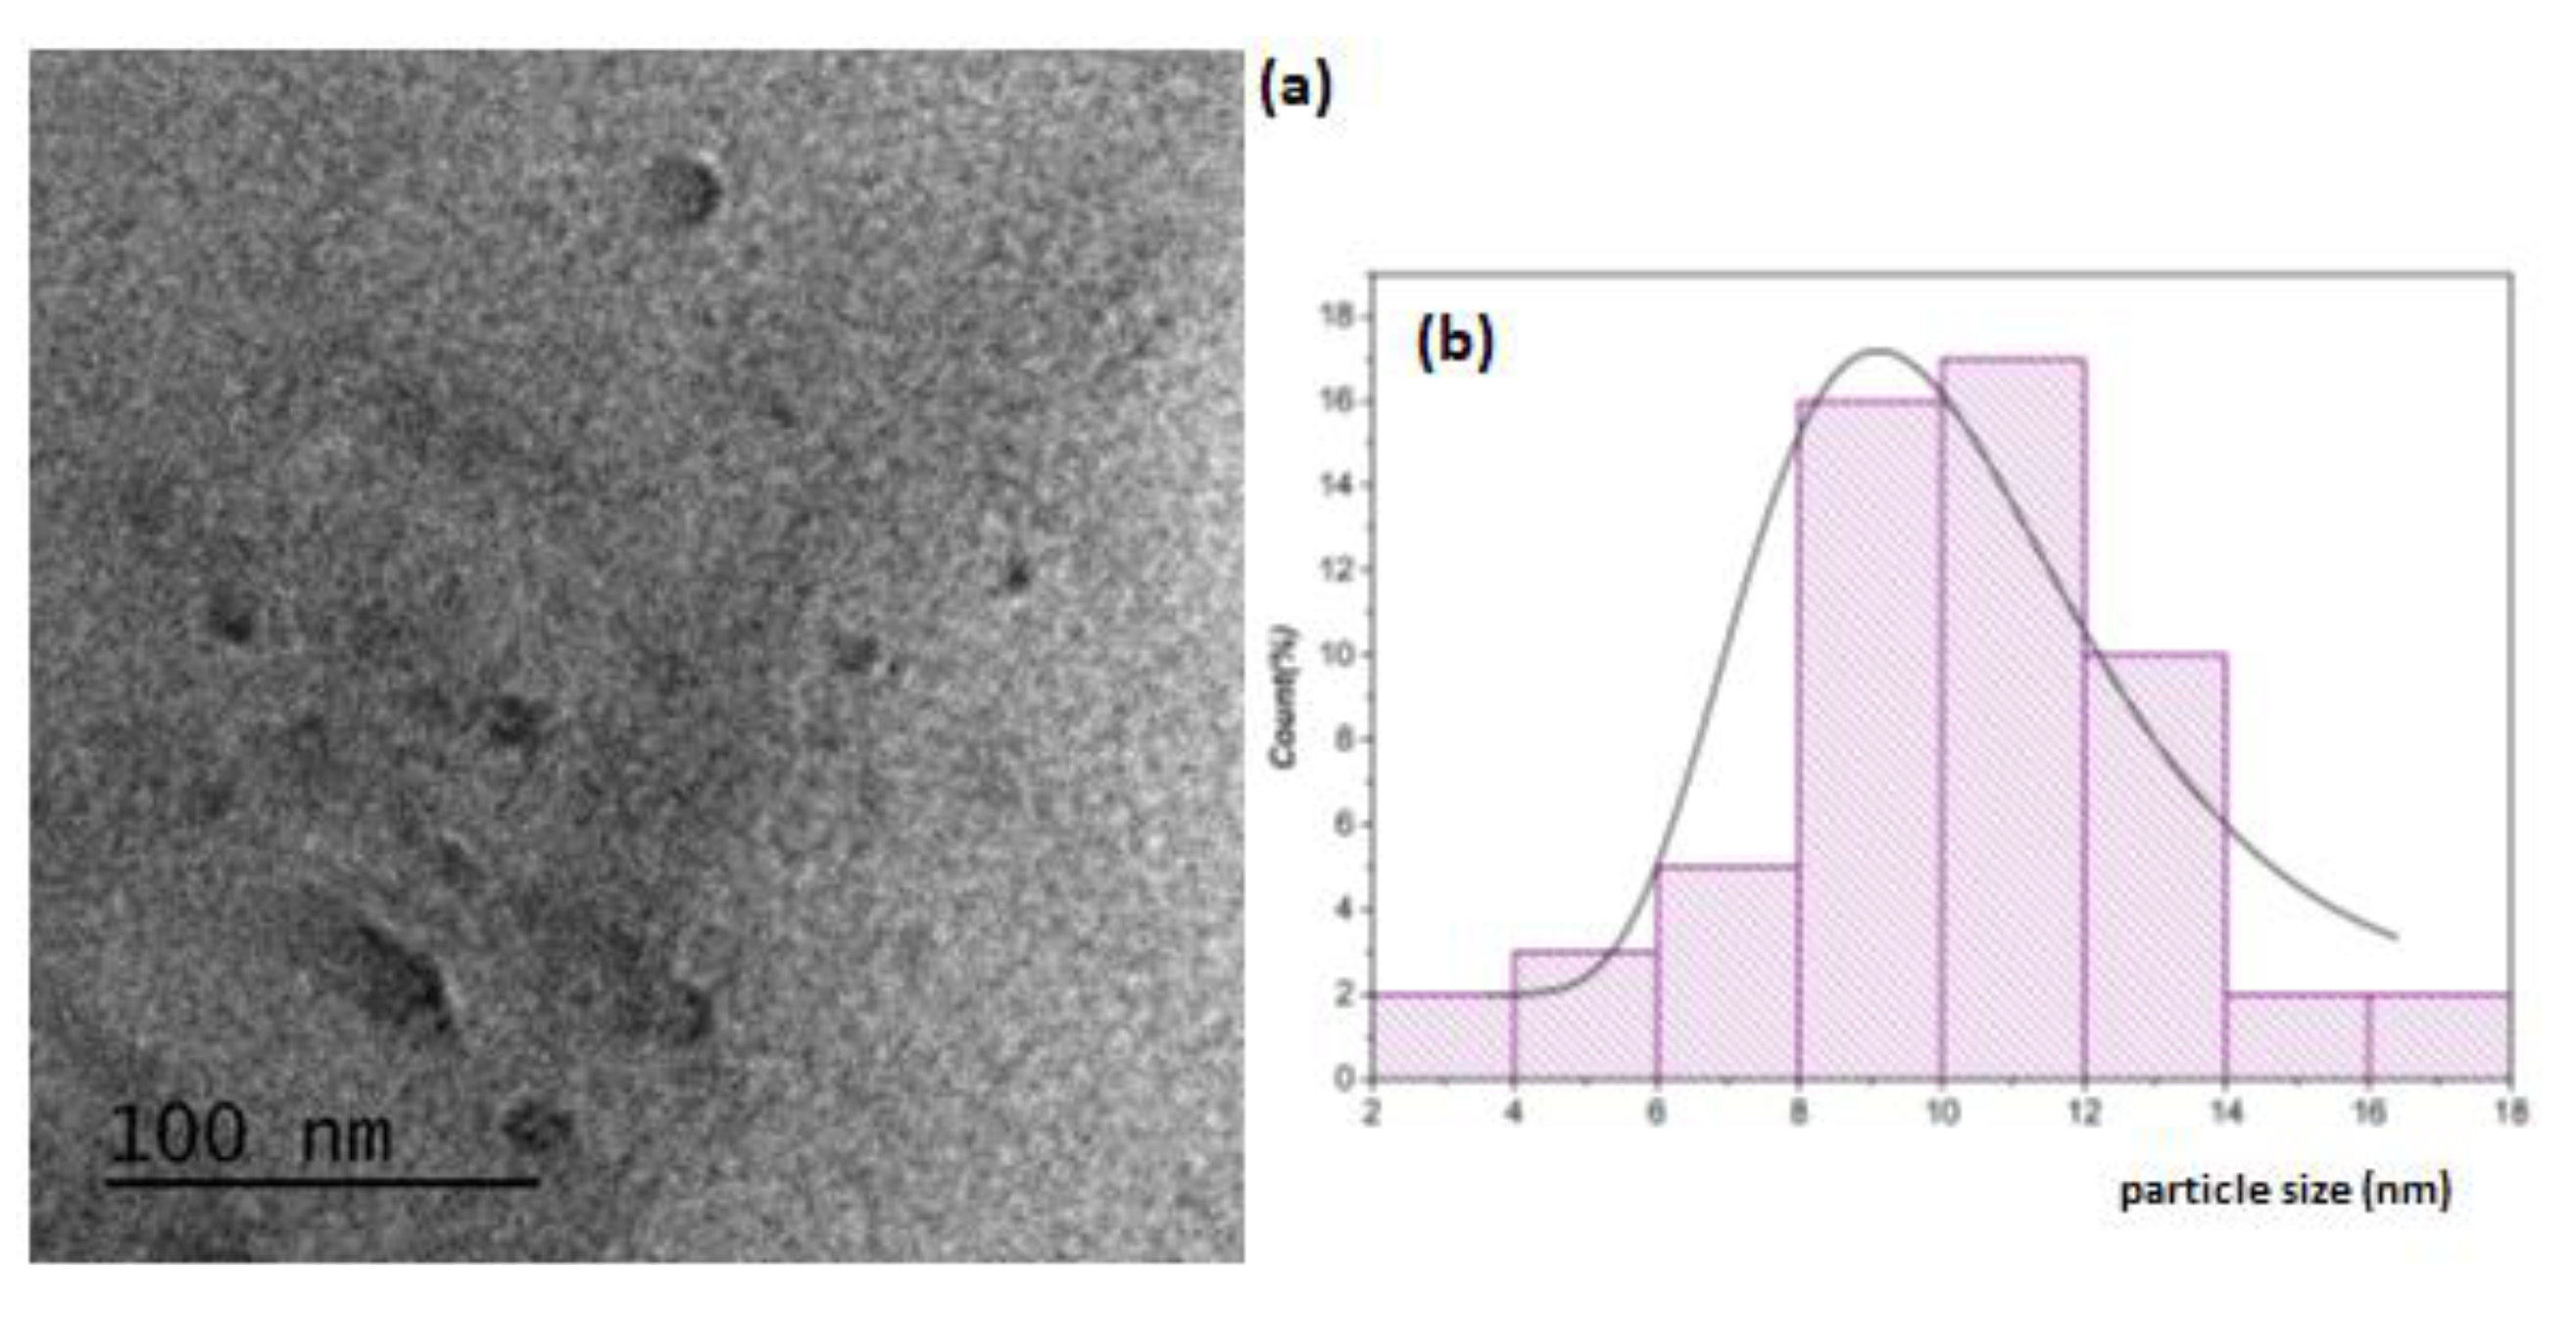
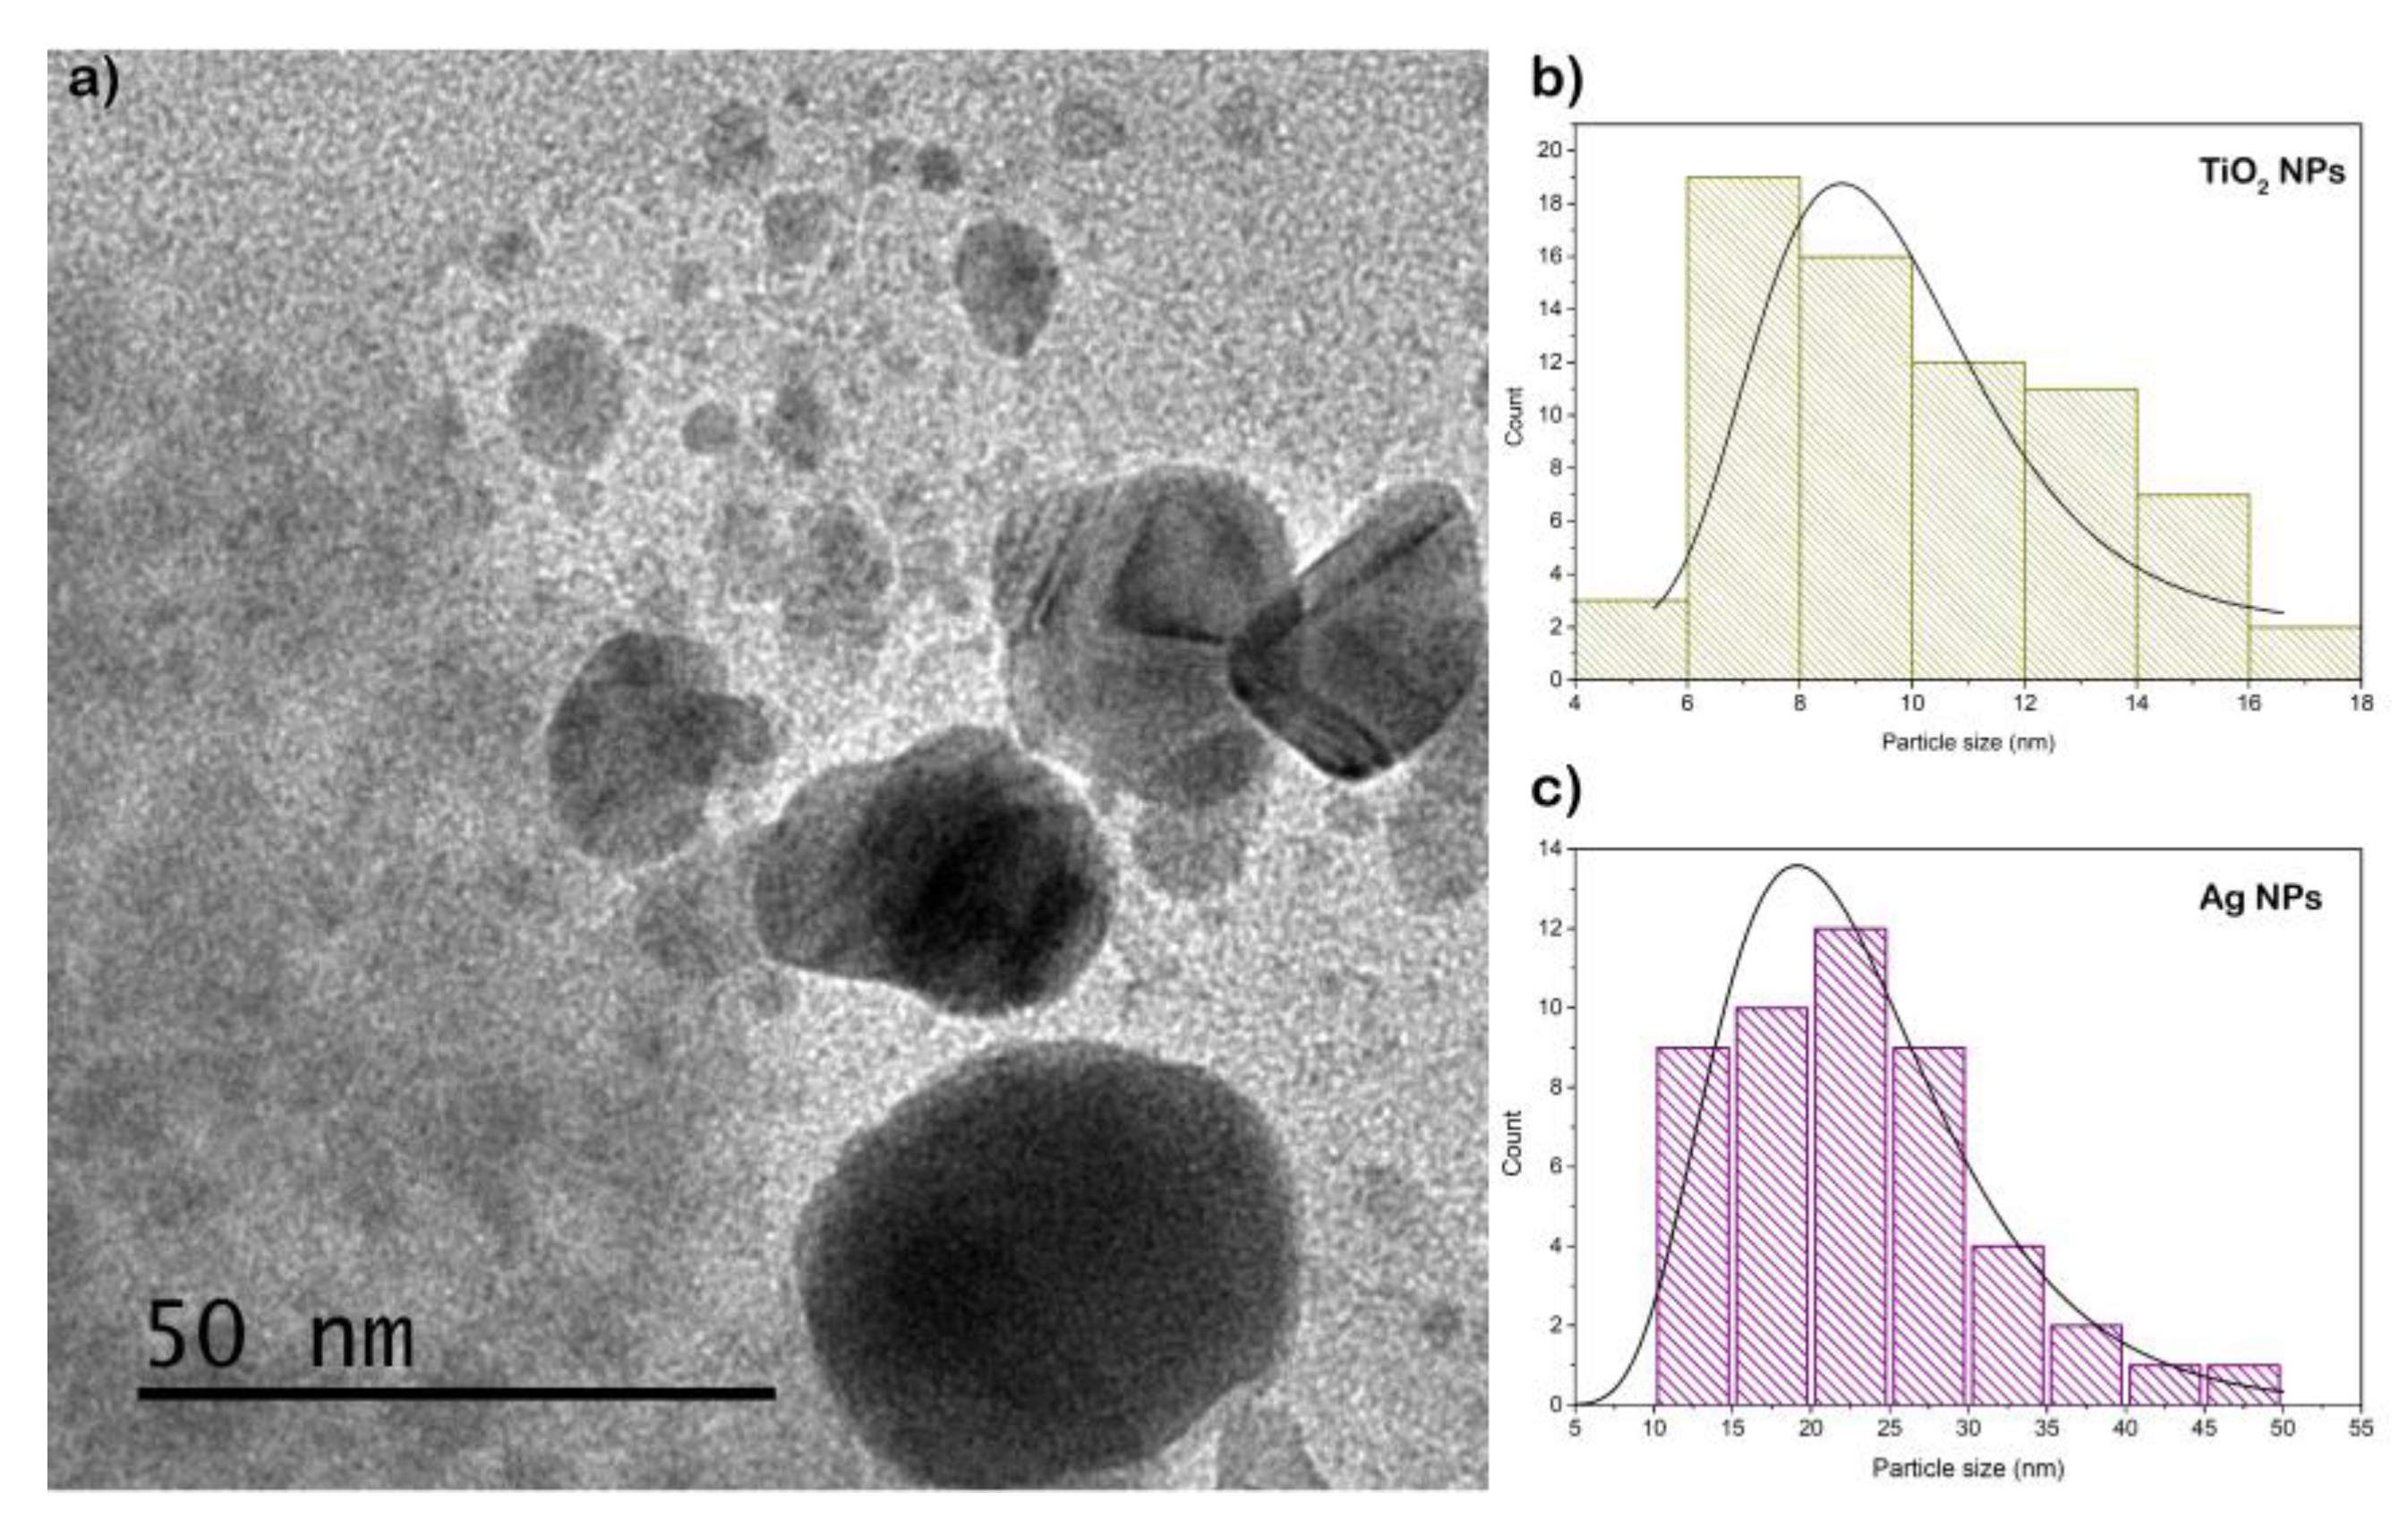
The morphology and size of the nanostructures were examined by transmission electron microscopy (TEM). Results are showed in
Figure 2 and
Figure 3 for Ti-NPs and AgTi-NPs samples, respectively. The darker and larger particles were assigned to Ag-NPs, while the smaller ones with a lighter shade correspond to Ti-NPs. In both samples an almost spherical morphology is observed. Also, in AgTi-NPs sample micrograph (
Figure 3 a), the Ti-NPs show agglomerations in some areas of the cotton fibers. The sizes of the Ag and TiO
2 nanoparticles were calculated using ImageJ software to construct the particle size distribution curves (lognormal distribution). Results are showed in
Figure 2b and
Figure 3b,c. The average size of Ag-NPs was 21.6 ± 1.4 nm; whereas for Ti-NPs were 10.3 ± 2.76 in sample without Ag, and 9.6 ±1.3 nm for Ag-TiO
2 composite. The interface formed between these nanoparticles suggests the presence of an energy level (attributed to the Ag-NPs) below the conduction band of the Ti NPs, resulting in a reduction of the value of the forbidden gap.
3.3. Attenuated total reflectance infrared spectroscopy (FTIR-ATR)
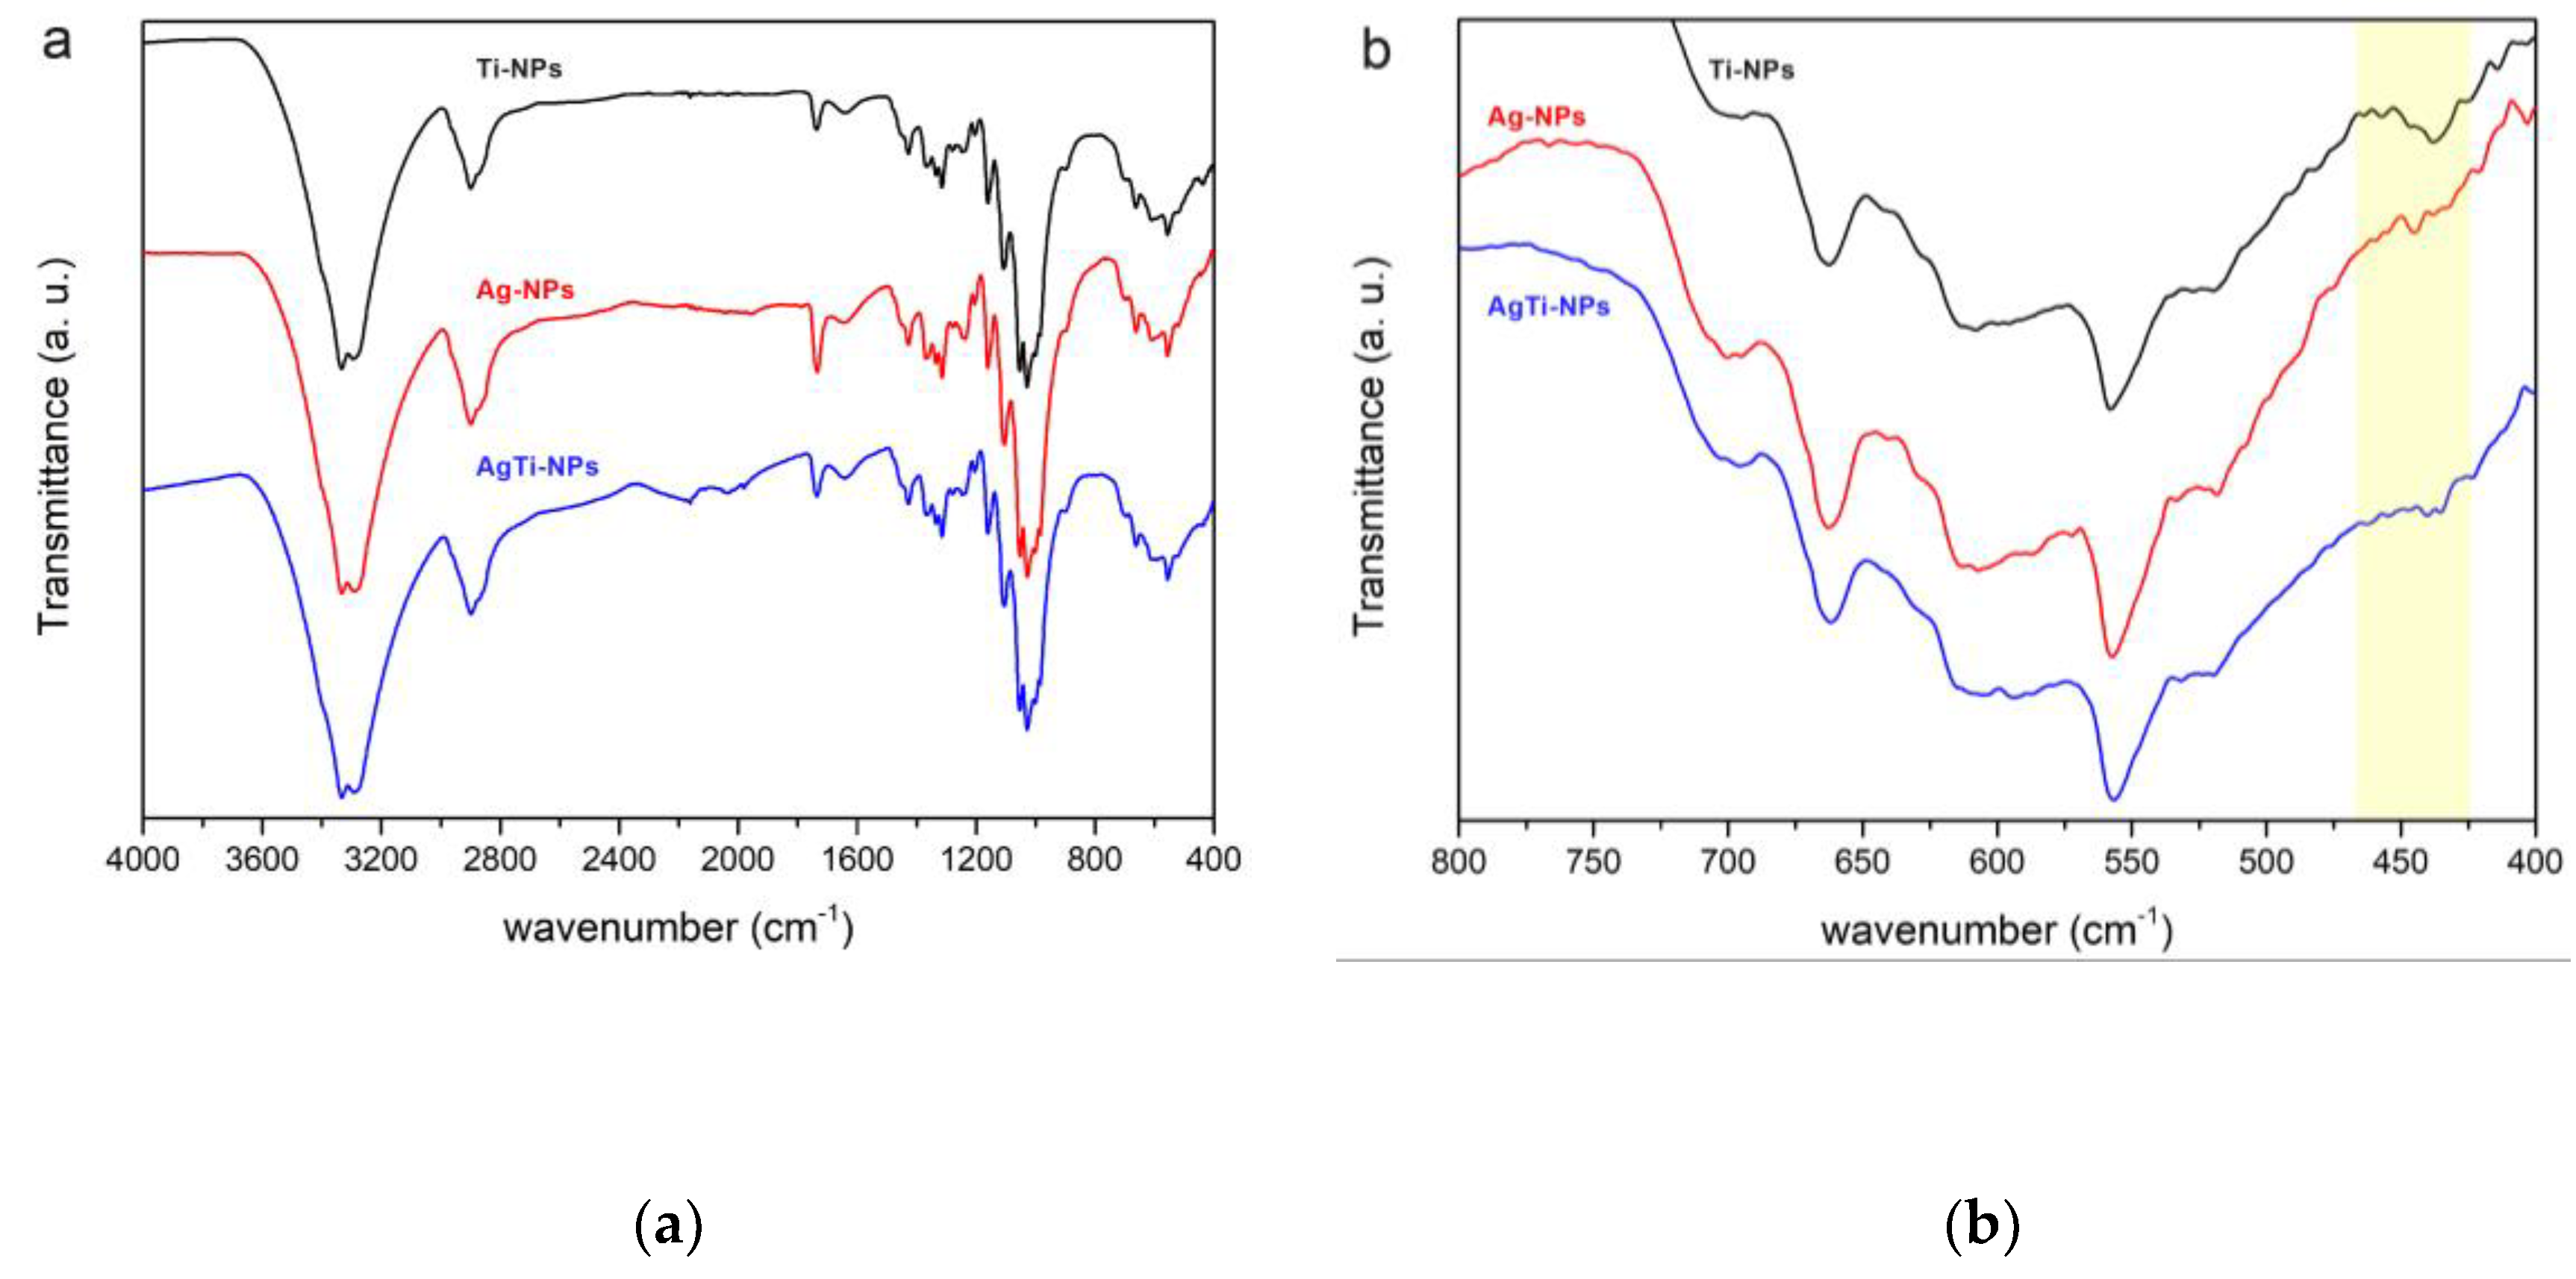
The cotton fabrics modified were analyzed by infrared spectroscopy (FT-IR ATR). In
Figure 4, the bands near 3333 and 1334 cm
-1 are assigned to hydroxyl groups [
16,
17]. While the bands at 2898, 1427, and 1314 cm
-1 are attributed to the different types of vibrations of the CH
2 bond. The bands in 1736 and 1369 cm
-1 correspond to the carbonyl and CH bonds. The bands between 1204 to 1000 cm
-1 region correspond to C-O bonds while the band at 900 cm
-1 corresponds to β-cellulose bonds.
Figure 4b shows the region between 800 and 400 cm
-1, where, according to Lu
et al. (2018), the vibrational bands at the Ti-O-Ti bonds are observed. Other bands identified in this region, at 694 cm
-1 [
18] correspond to CH
2 rocking in crystalline cellulose Iβ and the bands at 662 and 558 cm
-1 are attributed to C-OH bending [
19,
20].
Also, the Ti-NPs shows a band at 437 cm
-1 which is attributed to the anatase crystalline phase of TiO
2 [
21,
22]. This band is found to be less intense in the AgTi-NPs sample, which can be attributed to the fact that the previous monolayer of Ag-NPs on the surface of the fabric affects and limits the amount of TiO
2 particles that can be deposited on the surface of the support. According to SEM-EDS analysis, this effect is attributed with the decrease in Ti loading.
3.4. X-ray diffraction (XRD)
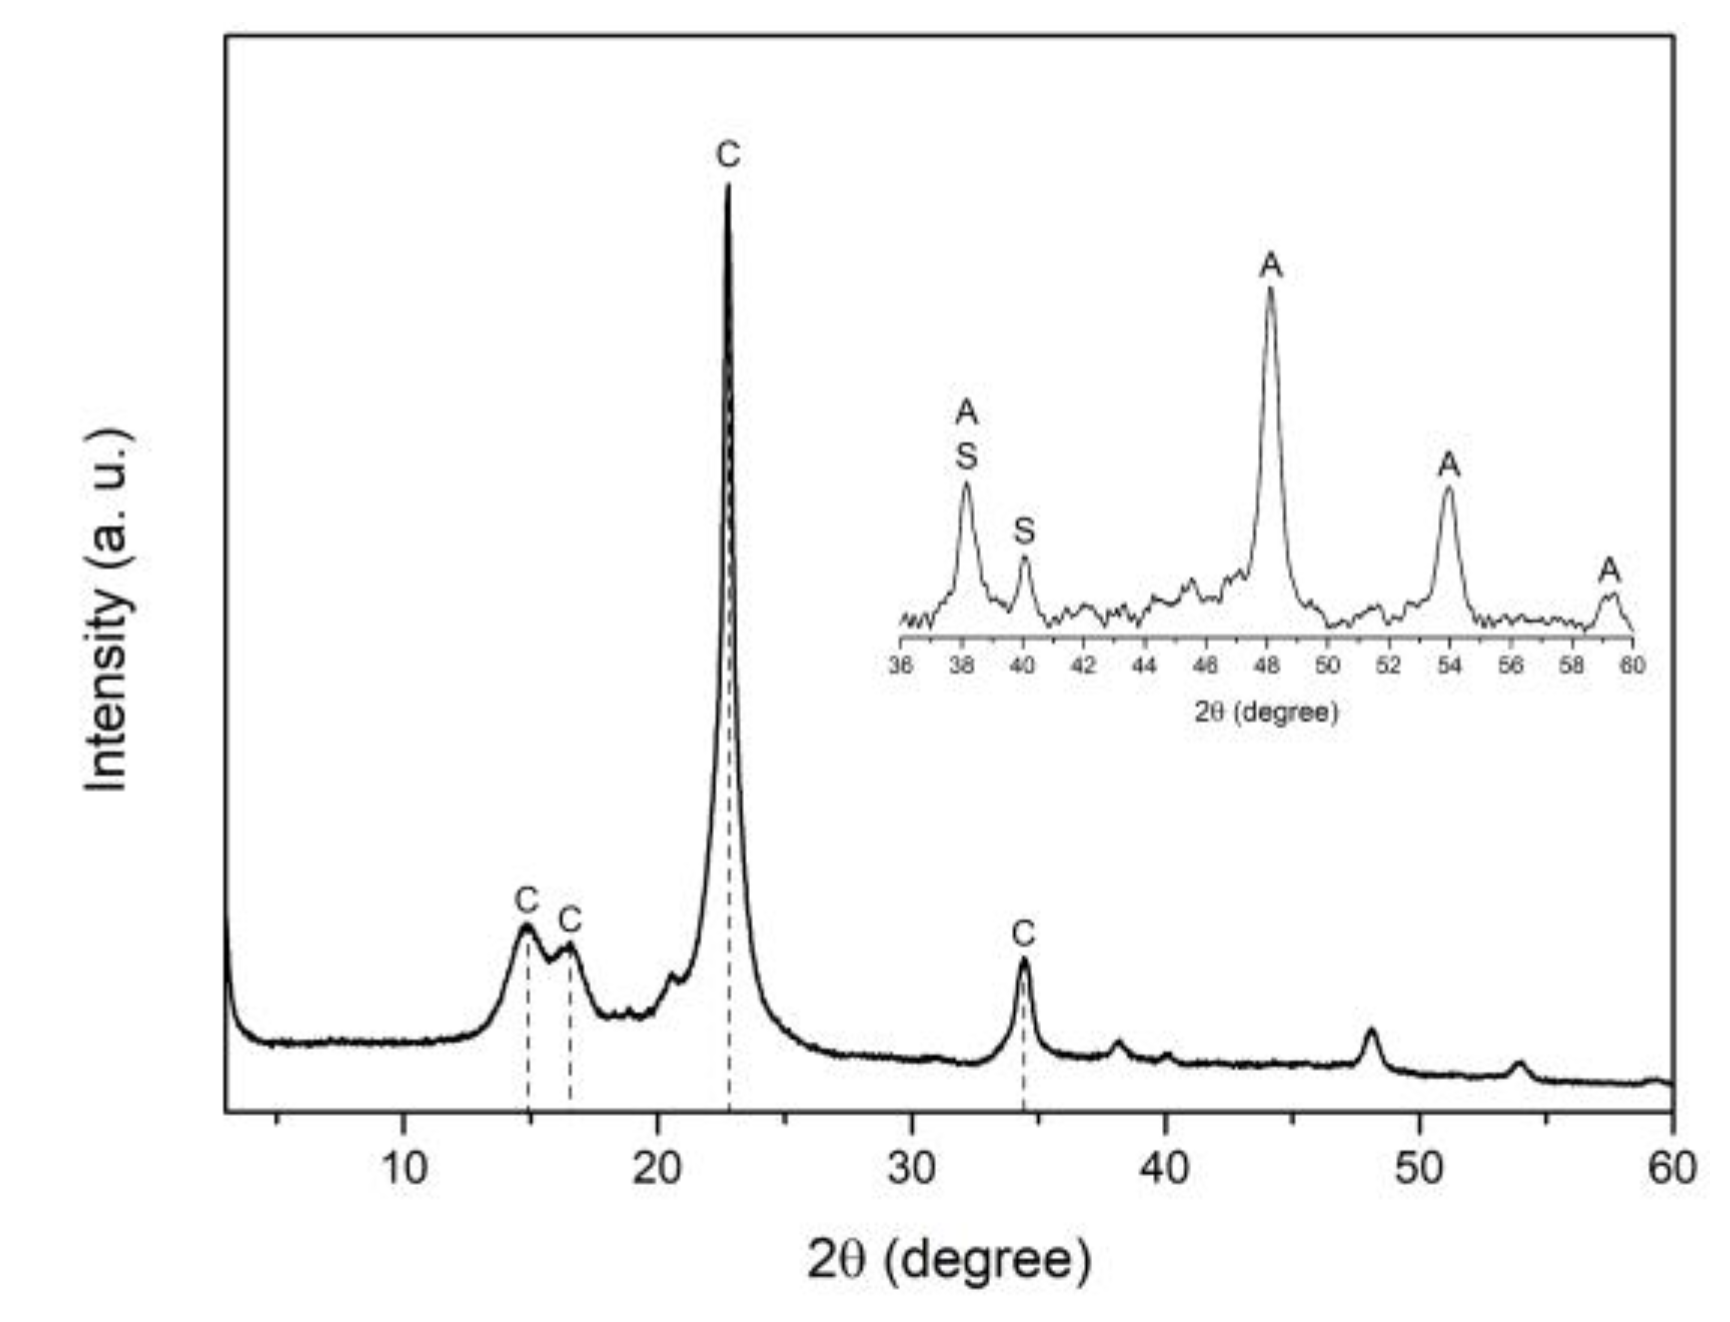
Figure 5 shows the XRD pattern of AgTi-NPs sample, where the main peaks at 15.14°, 16.25°, 22.75°, and 34.39° are attributed to the IB cellulose fibers that form a crystalline microstructure [
23].
The weak diffraction at 40.16° corresponds to metallic silver particles with hexagonal structure (ICD No. 064707) [
24], where the crystallite size was calculated using the Debey-Schere'r equation, giving a value of 34.2 nm. The interface formed between the Ag-NPs and TiO
2 on the surface of the cotton fibers modifies the characteristic diffraction pattern of TiO
2 [
25]. Only peaks at 48.15°, 53.96°, and 59.27° can be identified, corresponding to the anatase crystalline phase of TiO
2 (PDF 03-065-5714) with a calculated crystallite average size of 15 nm. The weak sharp peak at 38.2° can be considered as a contribution between the spherical Ag-NPs centered on the faces (ICDS No. 652871) [
26] and the anatase phase of TiO
2. For Ti-NPs and Ag-NPs samples, similar XRD patterns were obtained, where only anatase and silver phases were observed, respectively.
3.5. UV-Vis studies. Spectra of reaction solutions and diffuse reflection spectra (DRS) of fabrics
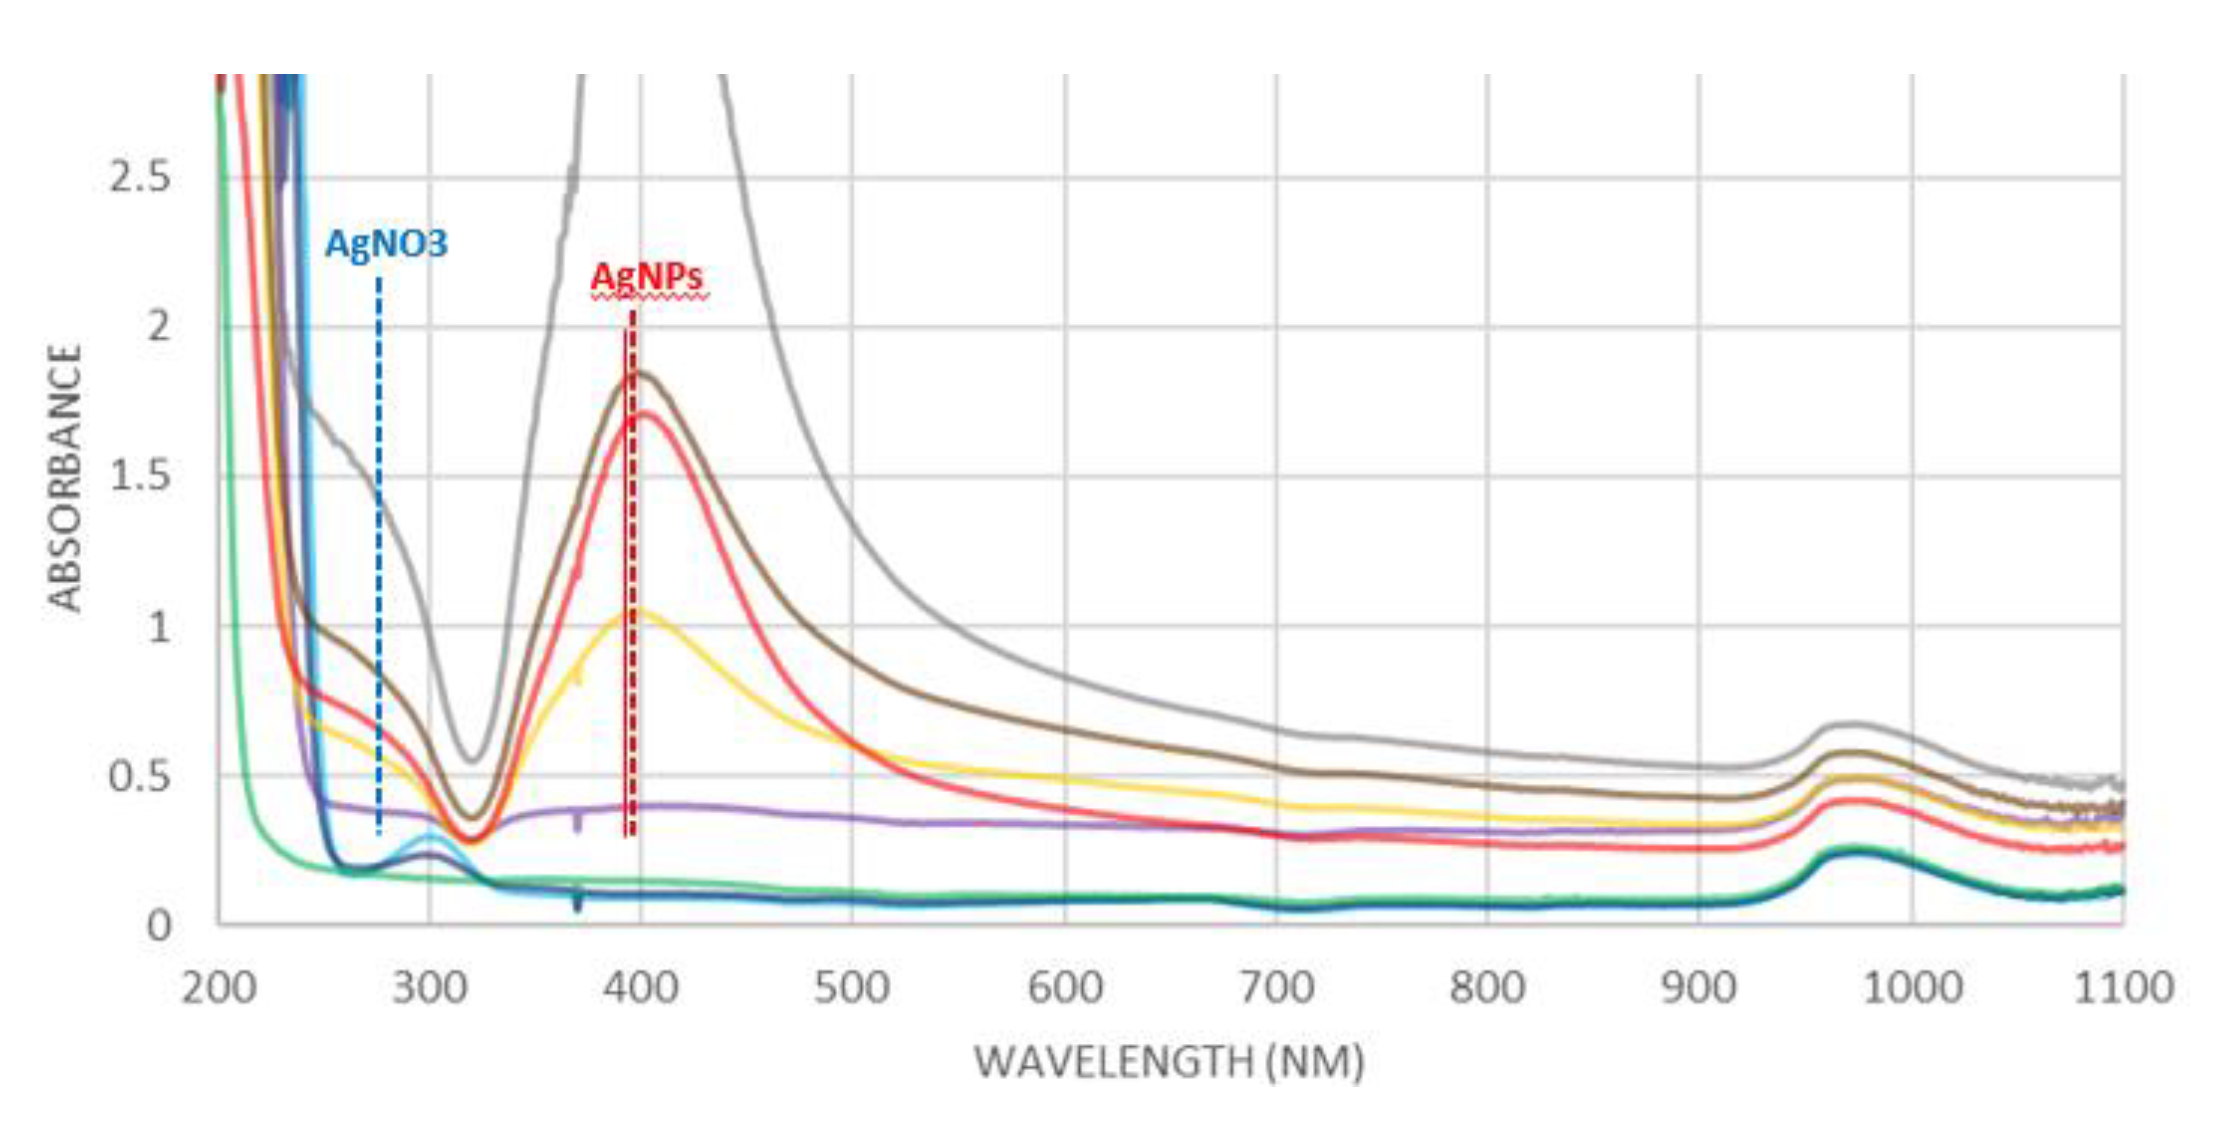
The process of reduction of Ag
+ to Ag
0 was followed by UV-Vis spectroscopy (
Figure 6). Before starting the reaction, the signals of the reactants were identified, where the UV band between 200 and 260 nm was assigned to the AgNO
3 solution, while NaBH
4 solution did not present any signal. By adding different amounts of NaBH
4 to the AgNO
3 solution, the formation of a band of about 400 nm was observed. This band is assigned to the surface plasmon resonance (SPR) effect of Ag-NPs [
27,
28], with a particle size between 20 and 30 nm [
29,
30], which confirms a correct approximation in the crystallite size calculation discussed in the XRD and TEM section.
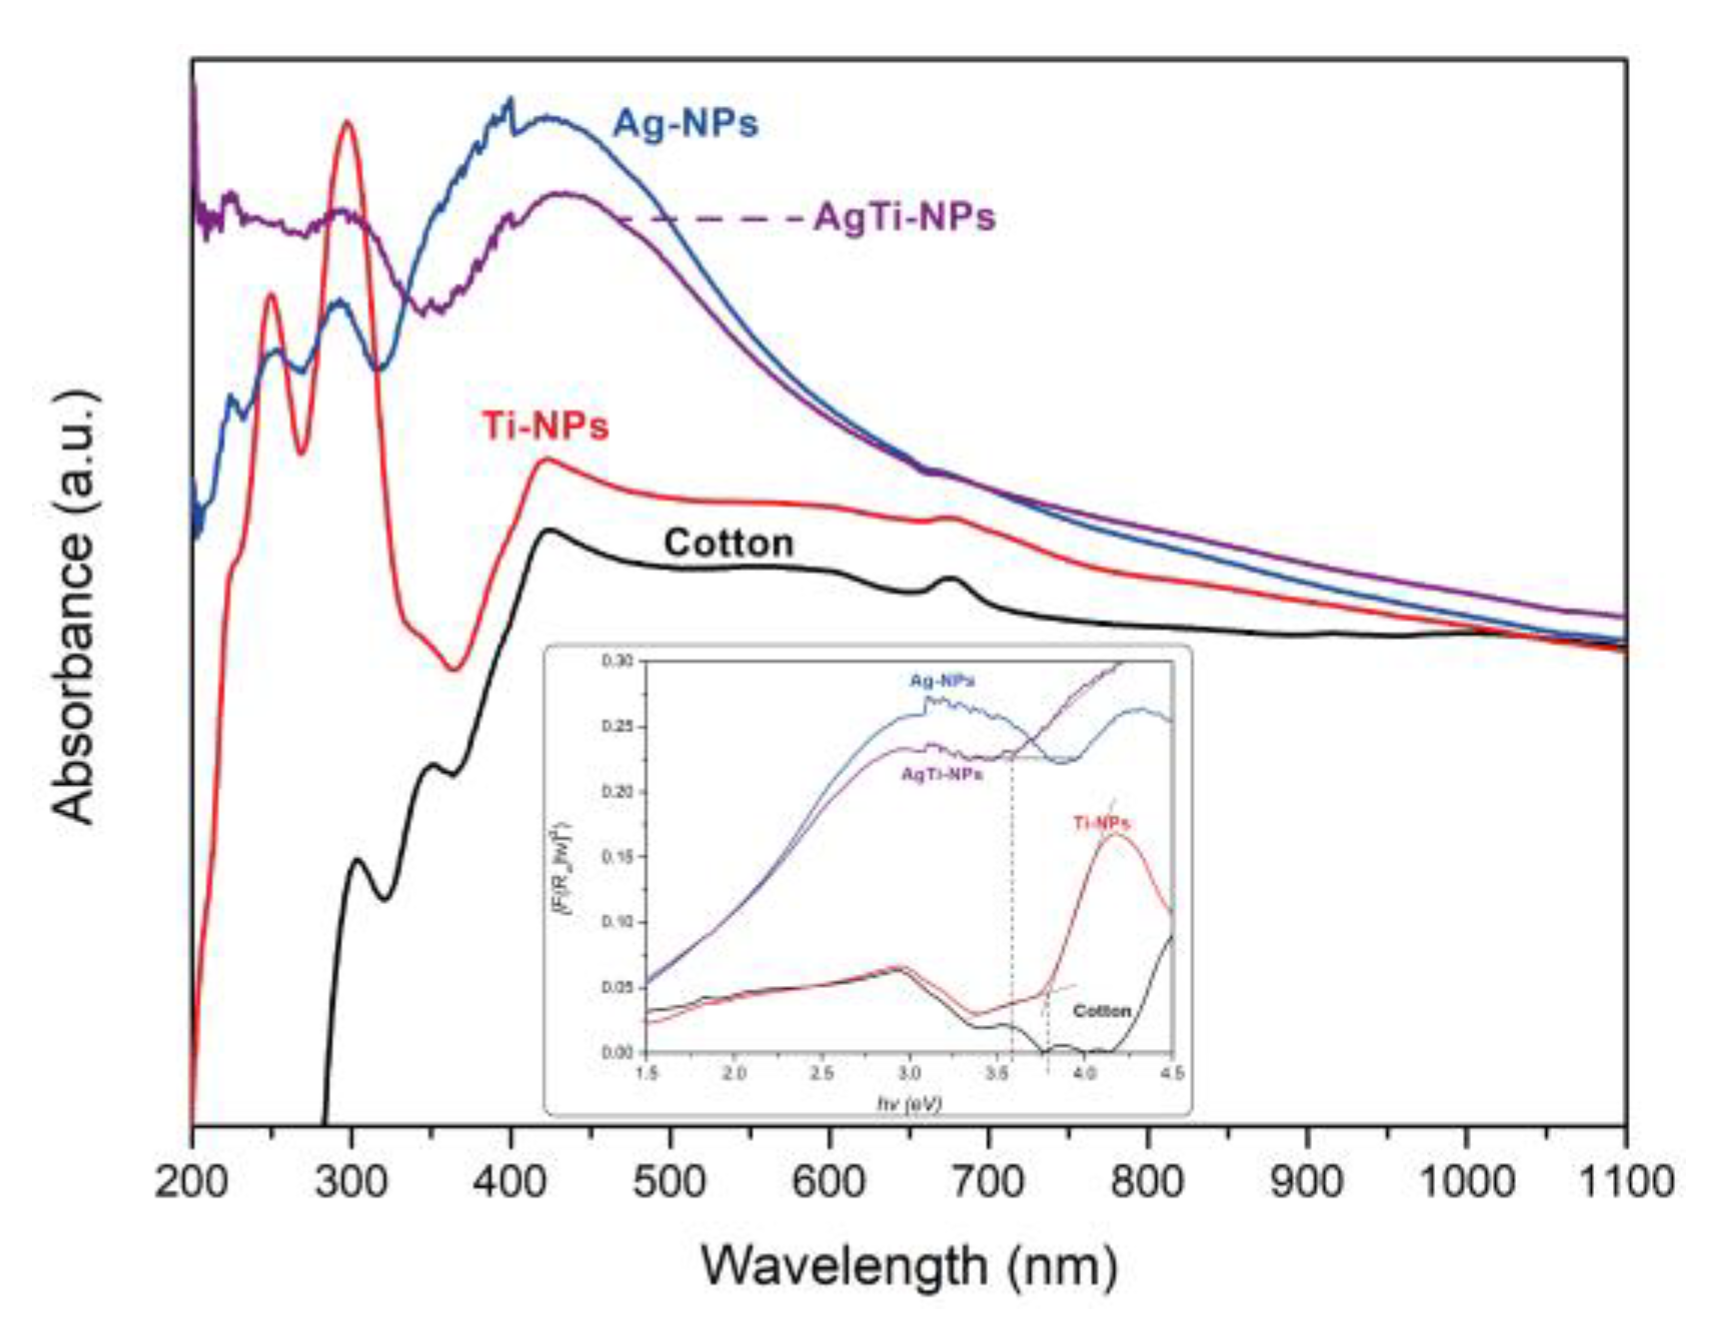
Figure 7 shows the UV-Vis spectra of the samples with different NPs, obtained by the diffuse reflectance spectroscopy (DRS). The band at 410 nm of the Ag-NPs sample confirms the correct synthesis of Ag-NPs on the surface of the cotton fibers, which is directly related to the color change of the fabric from white to brown-golden. On the other hand, Ti-NPs sample shows bands in the UV region (200-320 nm) attributed to the absorption profile of TiO
2. For AgTi-NPs nanocomposite, the characteristic absorption bands of each of its constituent materials are present. However, the TiO
2 band in the nanocomposite is diminished in intensity and slightly modified in its absorption edge as an effect of its presence and the interface that forms with the Ag-NPs.
The calculation of the band gap energy for the samples was performed using the Kulbelka-Munk (M-K) function against a Tauc plot (image inserted in
Figure 7). The bandgap for the Ti-NPs sample was 3.8 eV. This is a higher value than that found in anatase nanopowders (3.2 eV). As reported [
31,
32], the band gap values in semiconductors are dependent on the particle size, i.e., when the particle size decreases, the band gap value increases. This was observed experimentally by comparing the calculated bandgap of 3.2 eV for the 21 nm TiO
2 nanopowder (ID 329763580) with the 3.8 eV of the Ti-NPs sample with a particle size of 15 nm calculated by XRD. AgTi-NPs shows the bandgap value for TiO
2 of 3.55 eV. This is because Ag-NPs modify the absorption edge of TiO
2, due to the interface formed between these materials in the nanocomposite structure. On the other hand, the absorption edge in the visible spectrum region of Ag-NPs (bandgap of 2.1 eV) maintains the same behavior for both AgTi-NPs and Ag-NPs samples. However, the participation of the energy edge of Ag-NPs in the nanocomposite is to promote electrons excited by low energies (within the Vis spectrum) towards the conduction band of TiO
2. The intention is to minimize the recombination of the e
-/h+ pair in the photocatalyst and to enhance the photocatalytic activity.
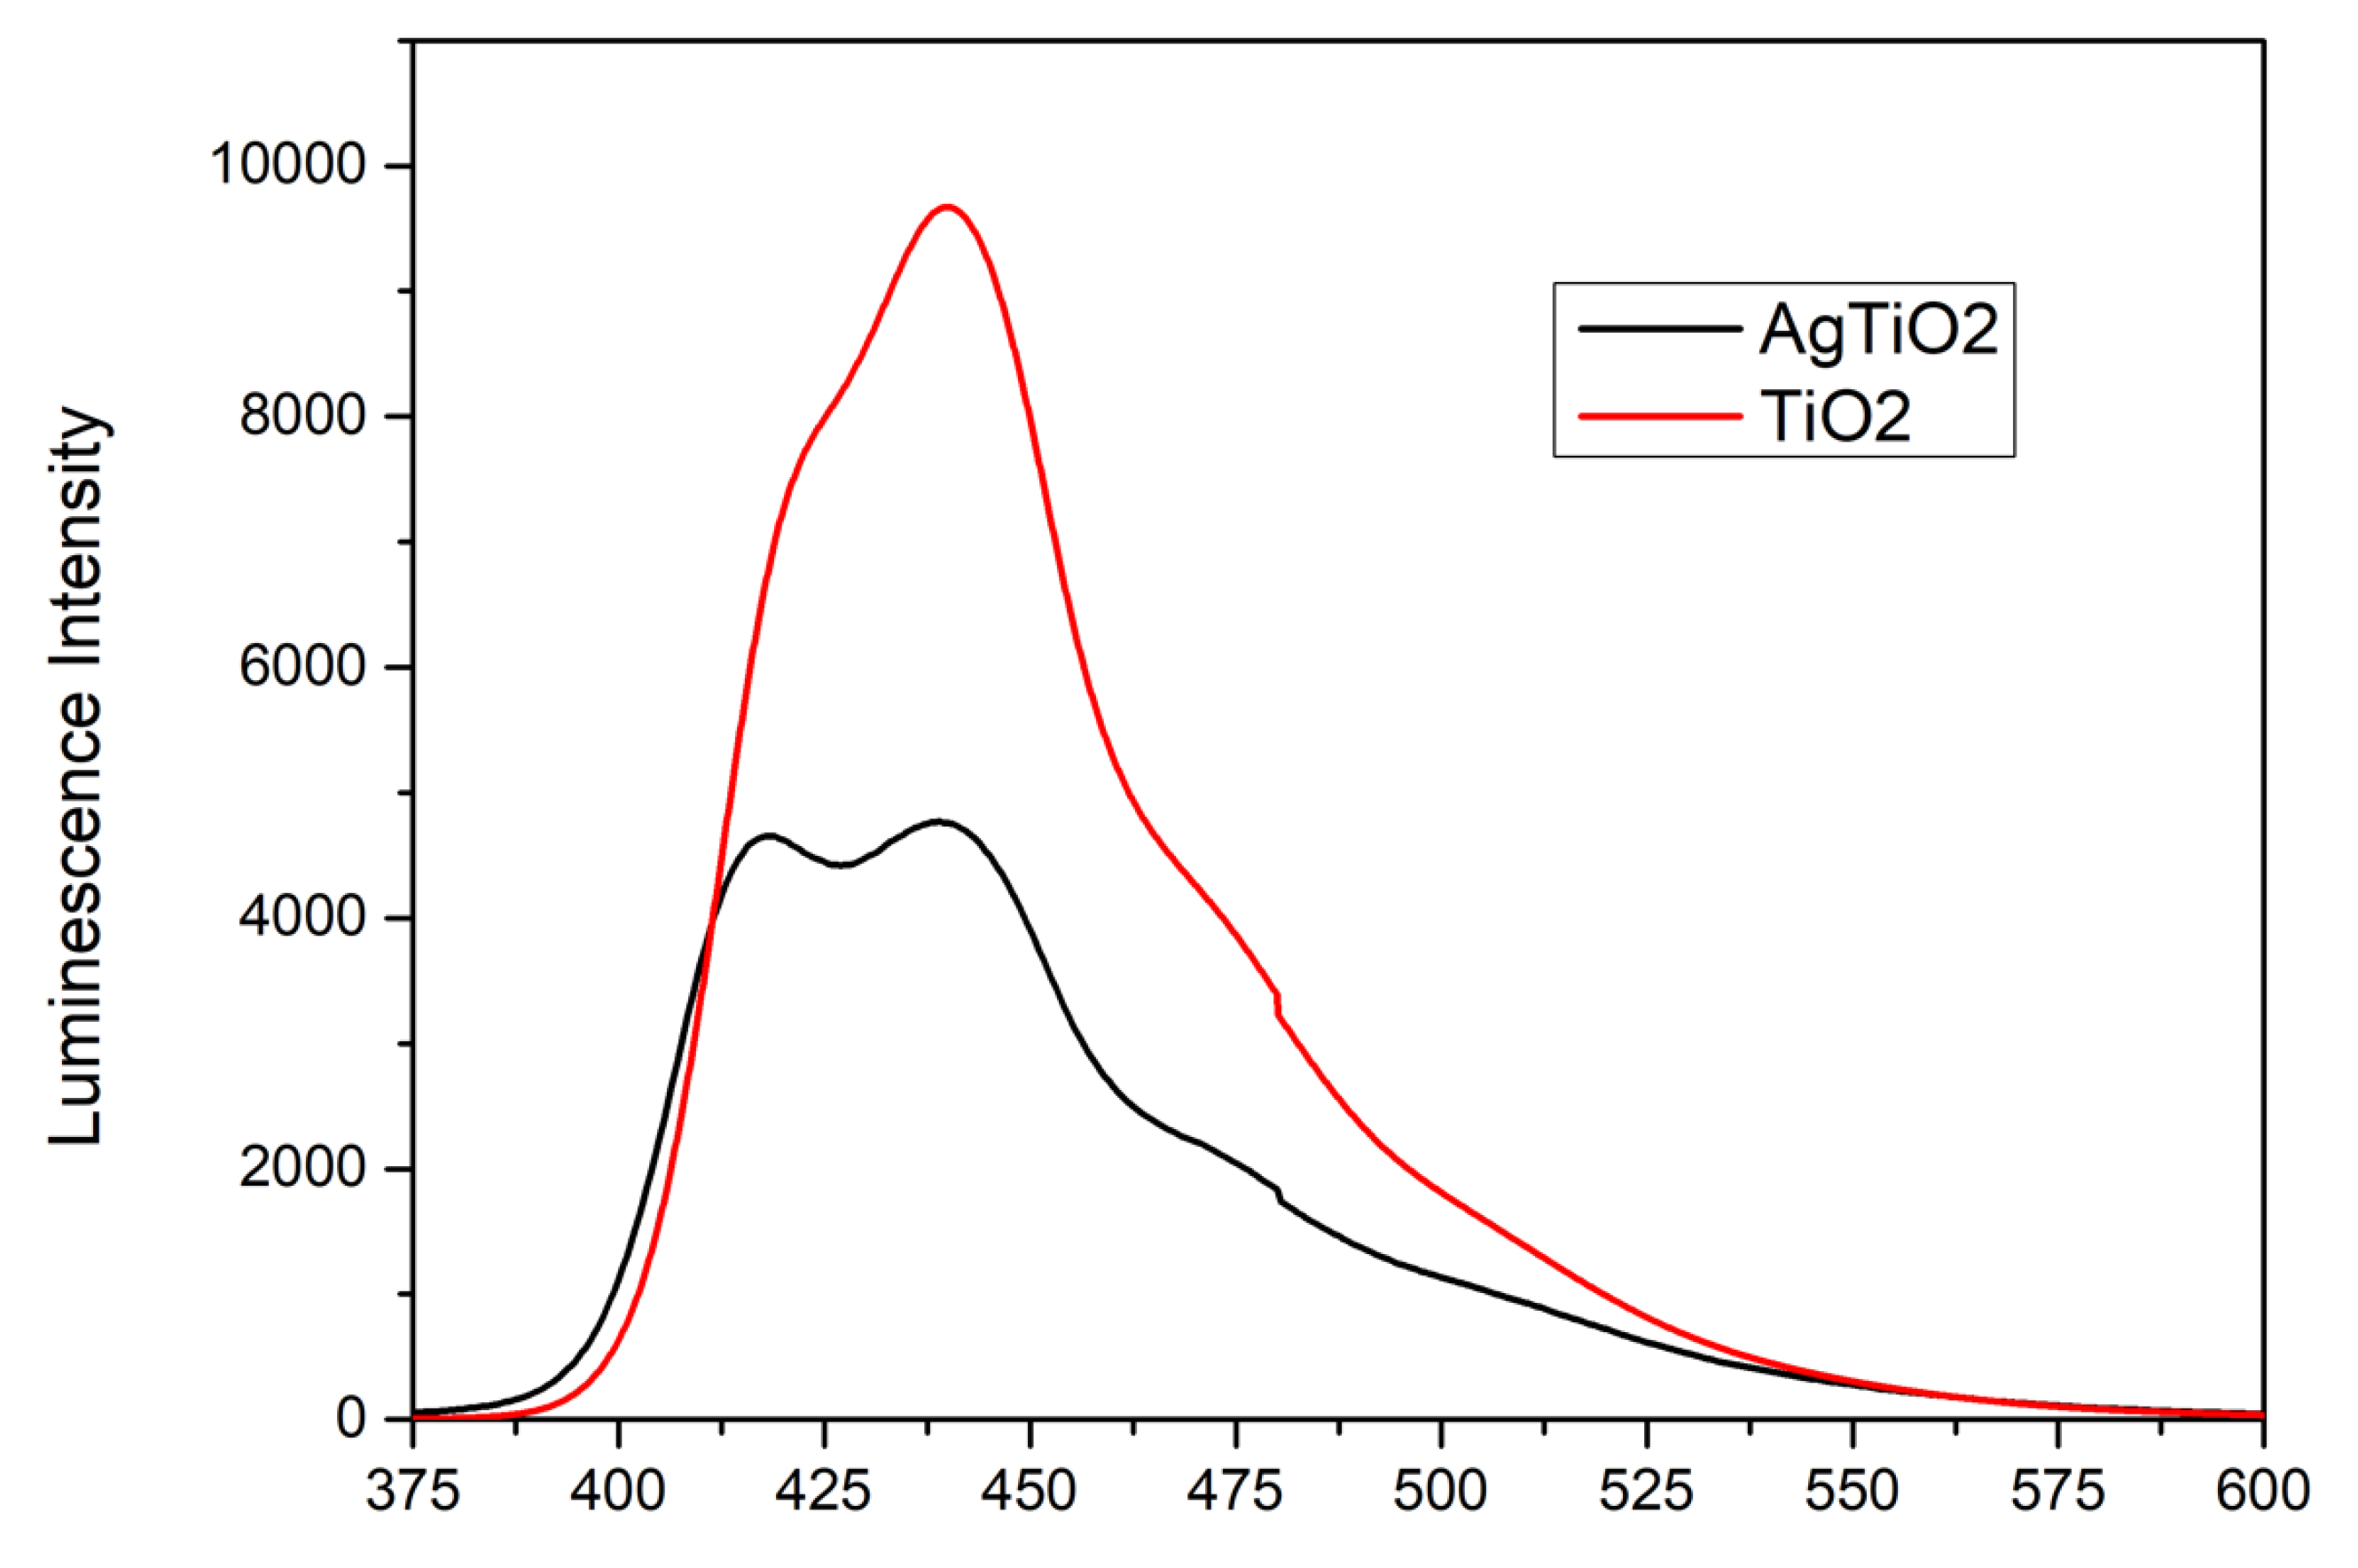
The NPs will absorb incident photons with sufficient energy equal to or higher than the band-gap energy. This will produce photoinduced charge carriers (h+/e-), and the recombination of photo-induced electrons and holes will release energy in the form of photoluminescence [
33]. To evaluate the recombination of the e
-/h+ pair in the samples, their photoluminescence (PL) was tested, and the results are showed in
Figure 8. Hence, a lower PL intensity indicates less charge recombination.
TiO2 particles showed a higher PL intensity near 440 nm, indicating that the recombination rate of photogenerated charges (e-/h+) is higher compared to AgTi-NPs. On the other hand, the additional band near 417 nm in the AgTi-NPs sample corresponds to silver nanoparticles. Thus, the nanocomposite allows the photogenerated charges to efficiently participate in the interfacial electron transfer reactions of photocatalysis.
3.6. Photocatalytic activity
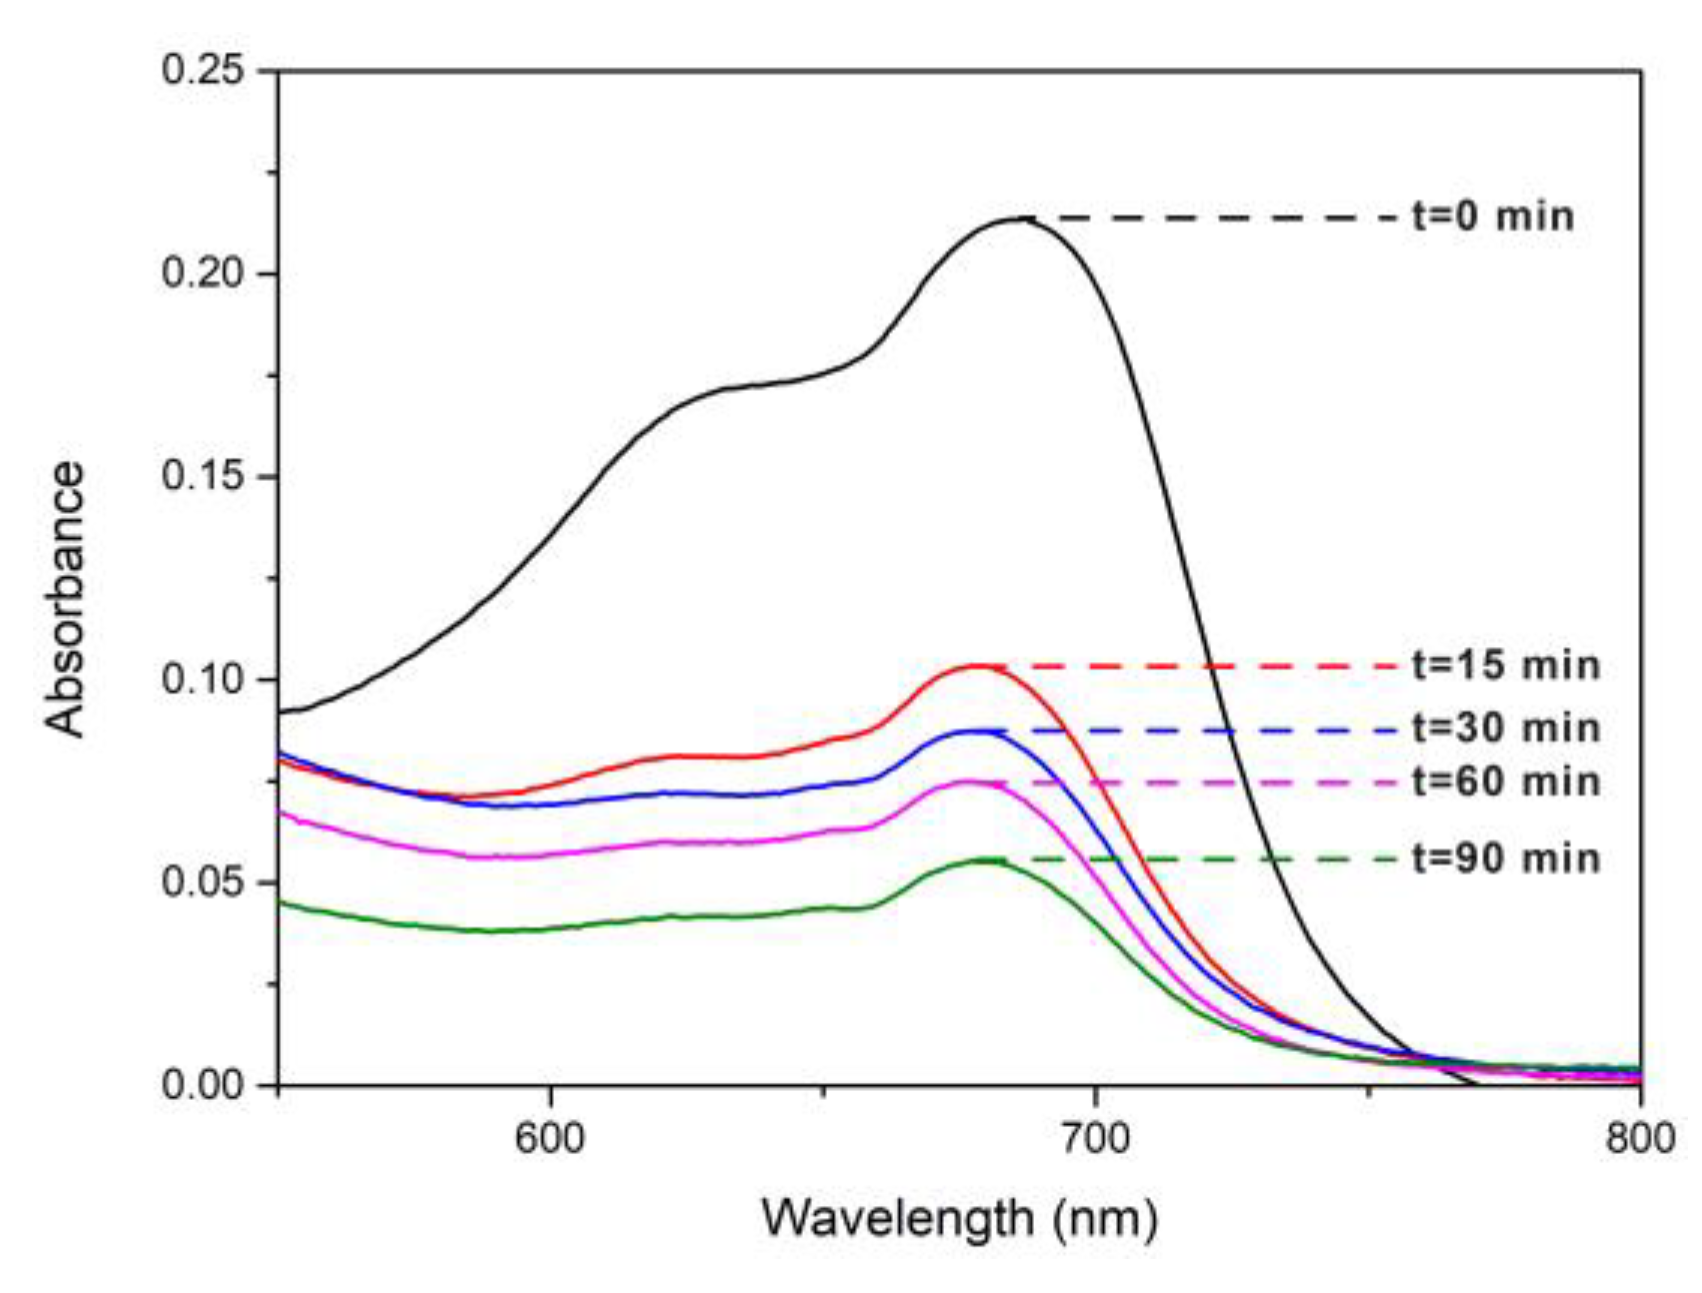
The photocatalytic activities of Ti-NPs, Ag-NPs and AgTi-NPs on fabrics were evaluated by the degradation of methylene blue (MB), using constant and continuous UV irradiation (Hg lamp) or sunlight, as described by Alvarez-Amparán
et.al. [
11]. In brief, squares of fabric of 2.5 X 2.5 cm previously impregnated with a solution of 5 ppm of MB. The photocatalytic reaction was followed by UV-Vis (DRS). Samples were taken at 0, 15, 30, 60, and 90 min. The degradation of MB was determined by the C/C
0 ratio, where C is the concentration at a given time and C
0 is the initial concentration of MB absorbed for each of the fabrics. MB shows a maximum absorption band in the visible region at 664 nm.
Figure 9 shows the change of the UV-Vis spectrum (DRS) of MB in function of reaction time for AgTi-NPs under UV irradiation. The degradation of MB obtained after 90 min was 75%. A higher value than that obtained for cotton fibers alone, where the degradation of MB was only 21 % at 90 min. Then, AgTi-NPs easily triples the MB degradation, showing that the nanocomposite possesses an important photocatalytic activity under UV irradiation.
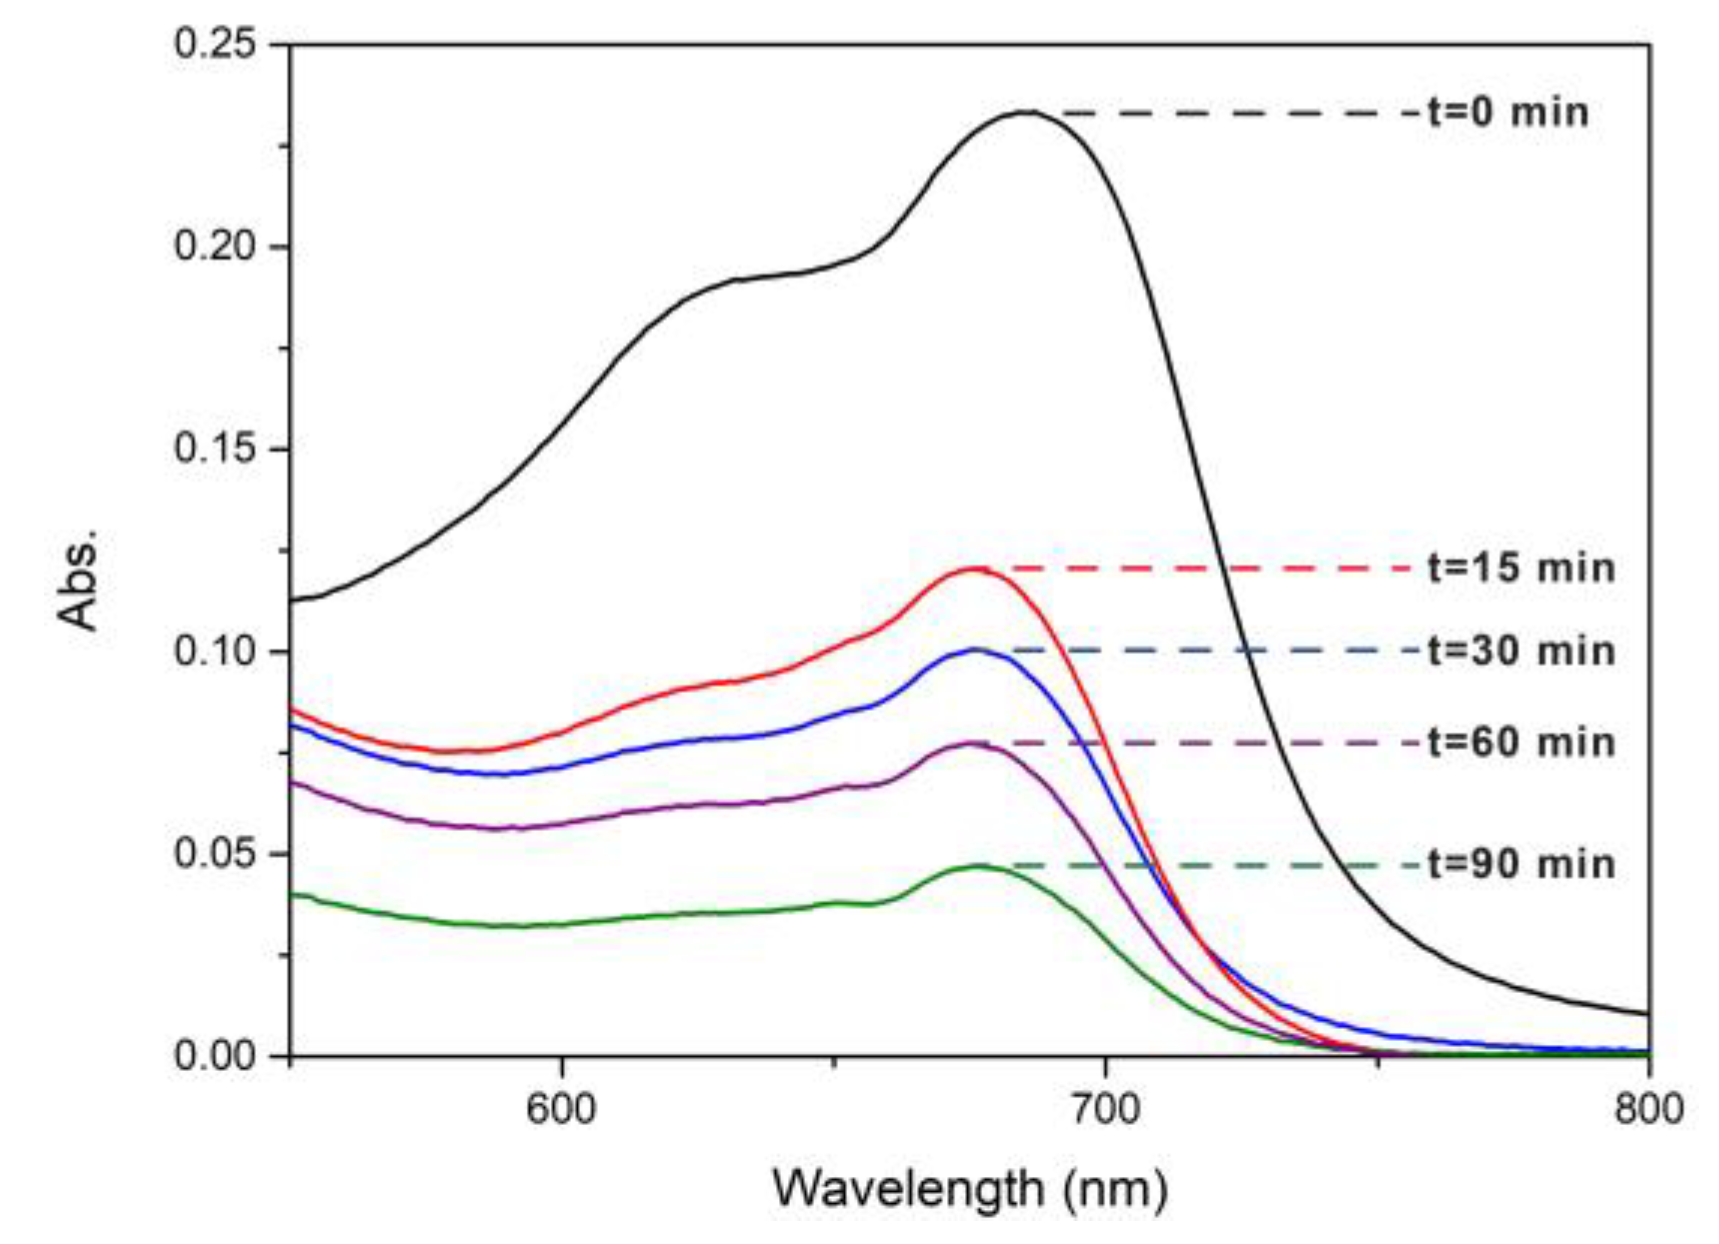
The degradation of MB in the AgTi NPs samples was also evaluated using solar irradiation (
Figure 10), where 80% degradation was achieved after 90 min. For the same reaction time, the degradation of MB in the cotton fibers was only 36%. This confirms an important photocatalytic activity of nanocomposite for MB degradation.
It is important to note that the power density available for each photocatalytic reaction was different. The power density was 10 mW/cm2 for UV radiation and 3 mW/cm2 for solar radiation, according to the climatic conditions of the experimental day in Mexico City. This means that the Ag-NPs in the nanocomposite promote low-energy excited electrons by absorbing photons from the visible spectrum towards the conduction band (BC) of TiO2. This allows the nanocomposite to compete and achieve MB degradation values very close to those obtained by UV irradiation, using only sunlight.
The kinetic data of MB degradation were fitted to a first-order pseudo-kinetic model. The Ag-NPs sample showed values in their kinetic coefficients of 0.0031 and 0.0048 min-1 under UV and solar irradiation, respectively. While for AgTi-NPs samples, the obtained kinetic coefficients were higher with a value of 0.0173 and 0.0193 min-1 for UV and solar irradiation, respectively. This gap between the kinetic coefficients indicates that Ag-NPs do not possess significant photocatalytic activity alone for MB degradation. This may be attributed to the high recombination of photogenerated electrons in Ag-NPs. On the other hand, the increase in the kinetic coefficient of Ag-NPs using solar versus UV irradiation is attributed to an additional amount of photogenerated electrons coming from the low energies of the visible spectrum. The photocatalytic activity of the Ti-NPs sample in the degradation of MB under solar irradiation was also evaluated, where the value of the kinetic coefficient was 0.0081 min-1. A value twice lower than that obtained with the AgTi-NPs sample under solar irradiation. This shows that the nanocomposite has a lower recombination of the e-/h+ pair compared to the individual materials of which it is composed. This allows a higher interfacial electron transfer (IFET) with the MB molecules for their photocatalytic degradation.
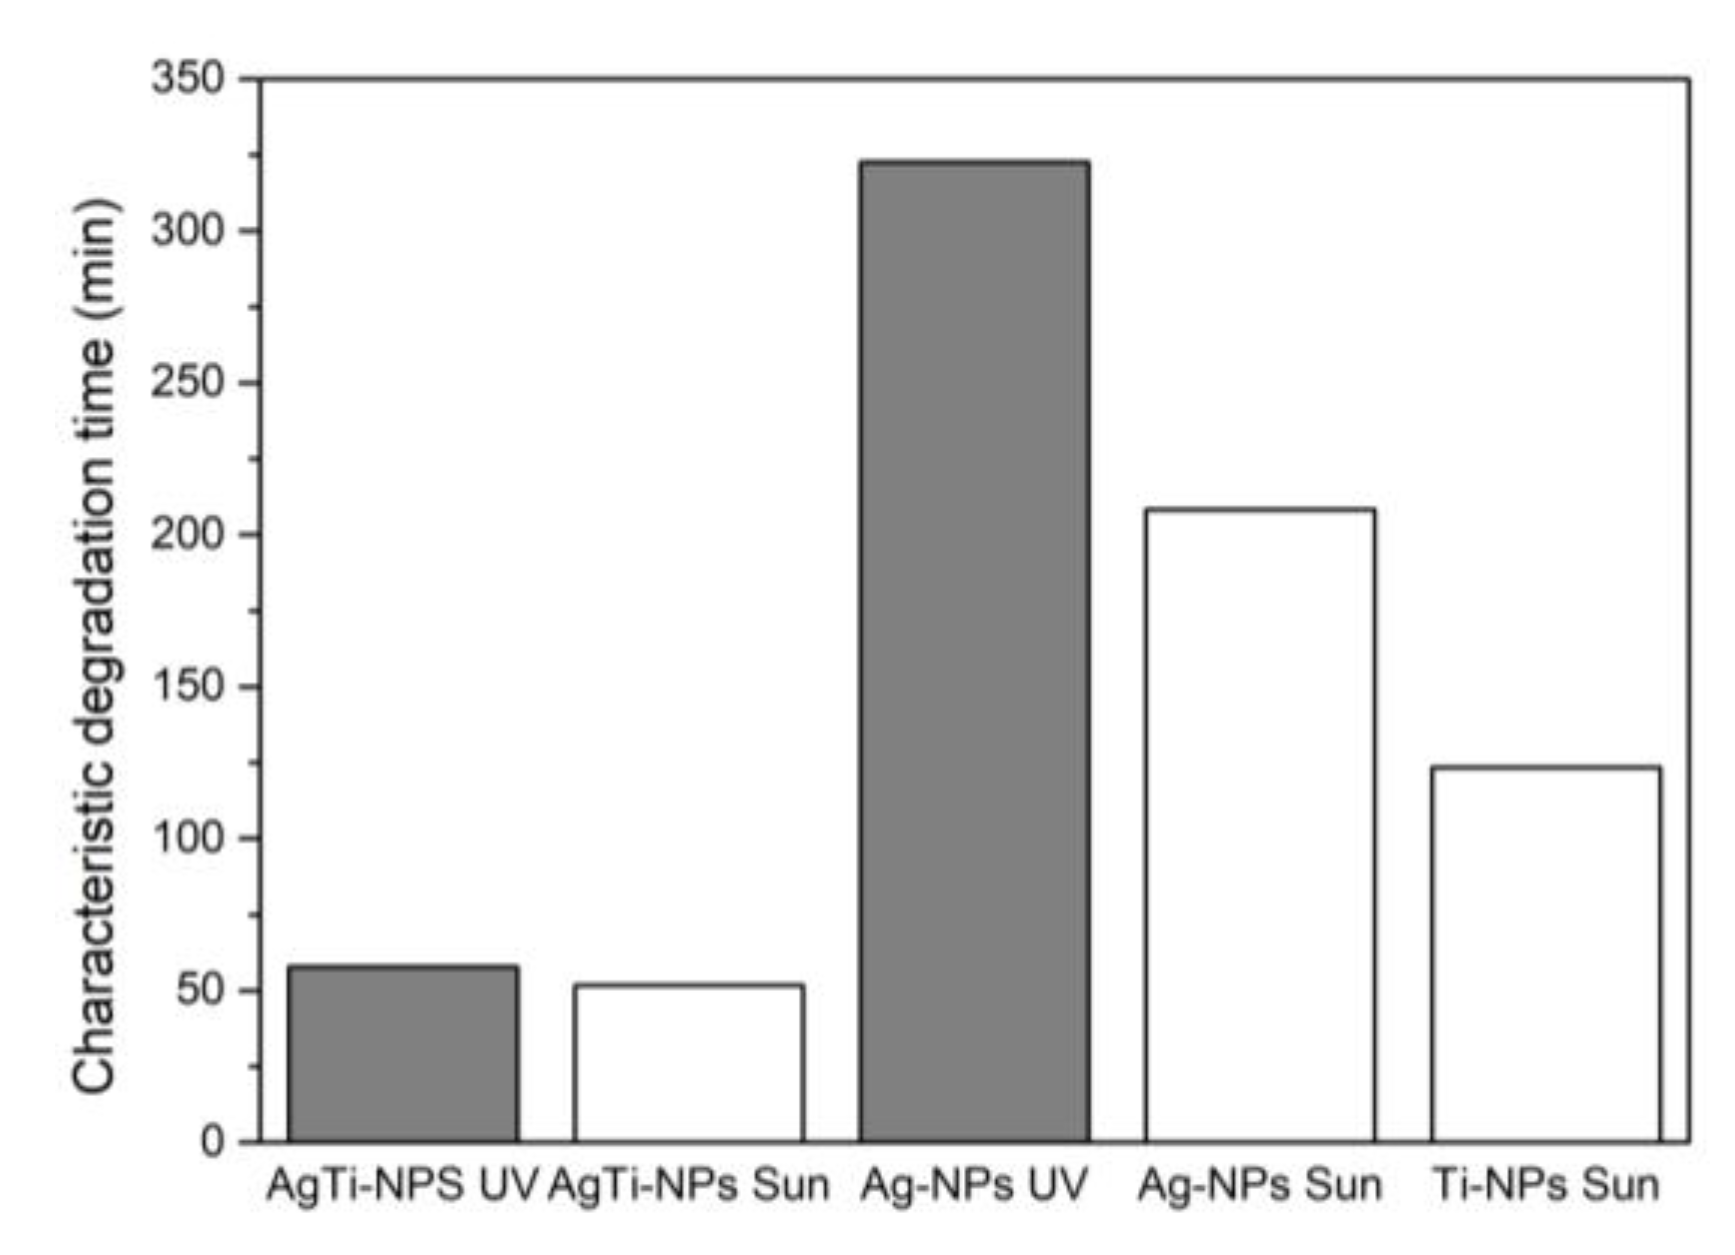
Figure 11 shows that for all the samples, the characteristic degradation time (τ) of MB was reached more quickly under solar irradiation than under UV irradiation.
3.7. Antibacterial properties of fabrics
The sunlight exposure assay was performed where the textiles were exposed to a radiation of 97 Klux and a UV AB radiation of 7525 µW/cm3 under the glass microscope slide.
Both Ag/cotton and Ag-TiO
2 composites showed good antibacterial activity against both
E. coli and
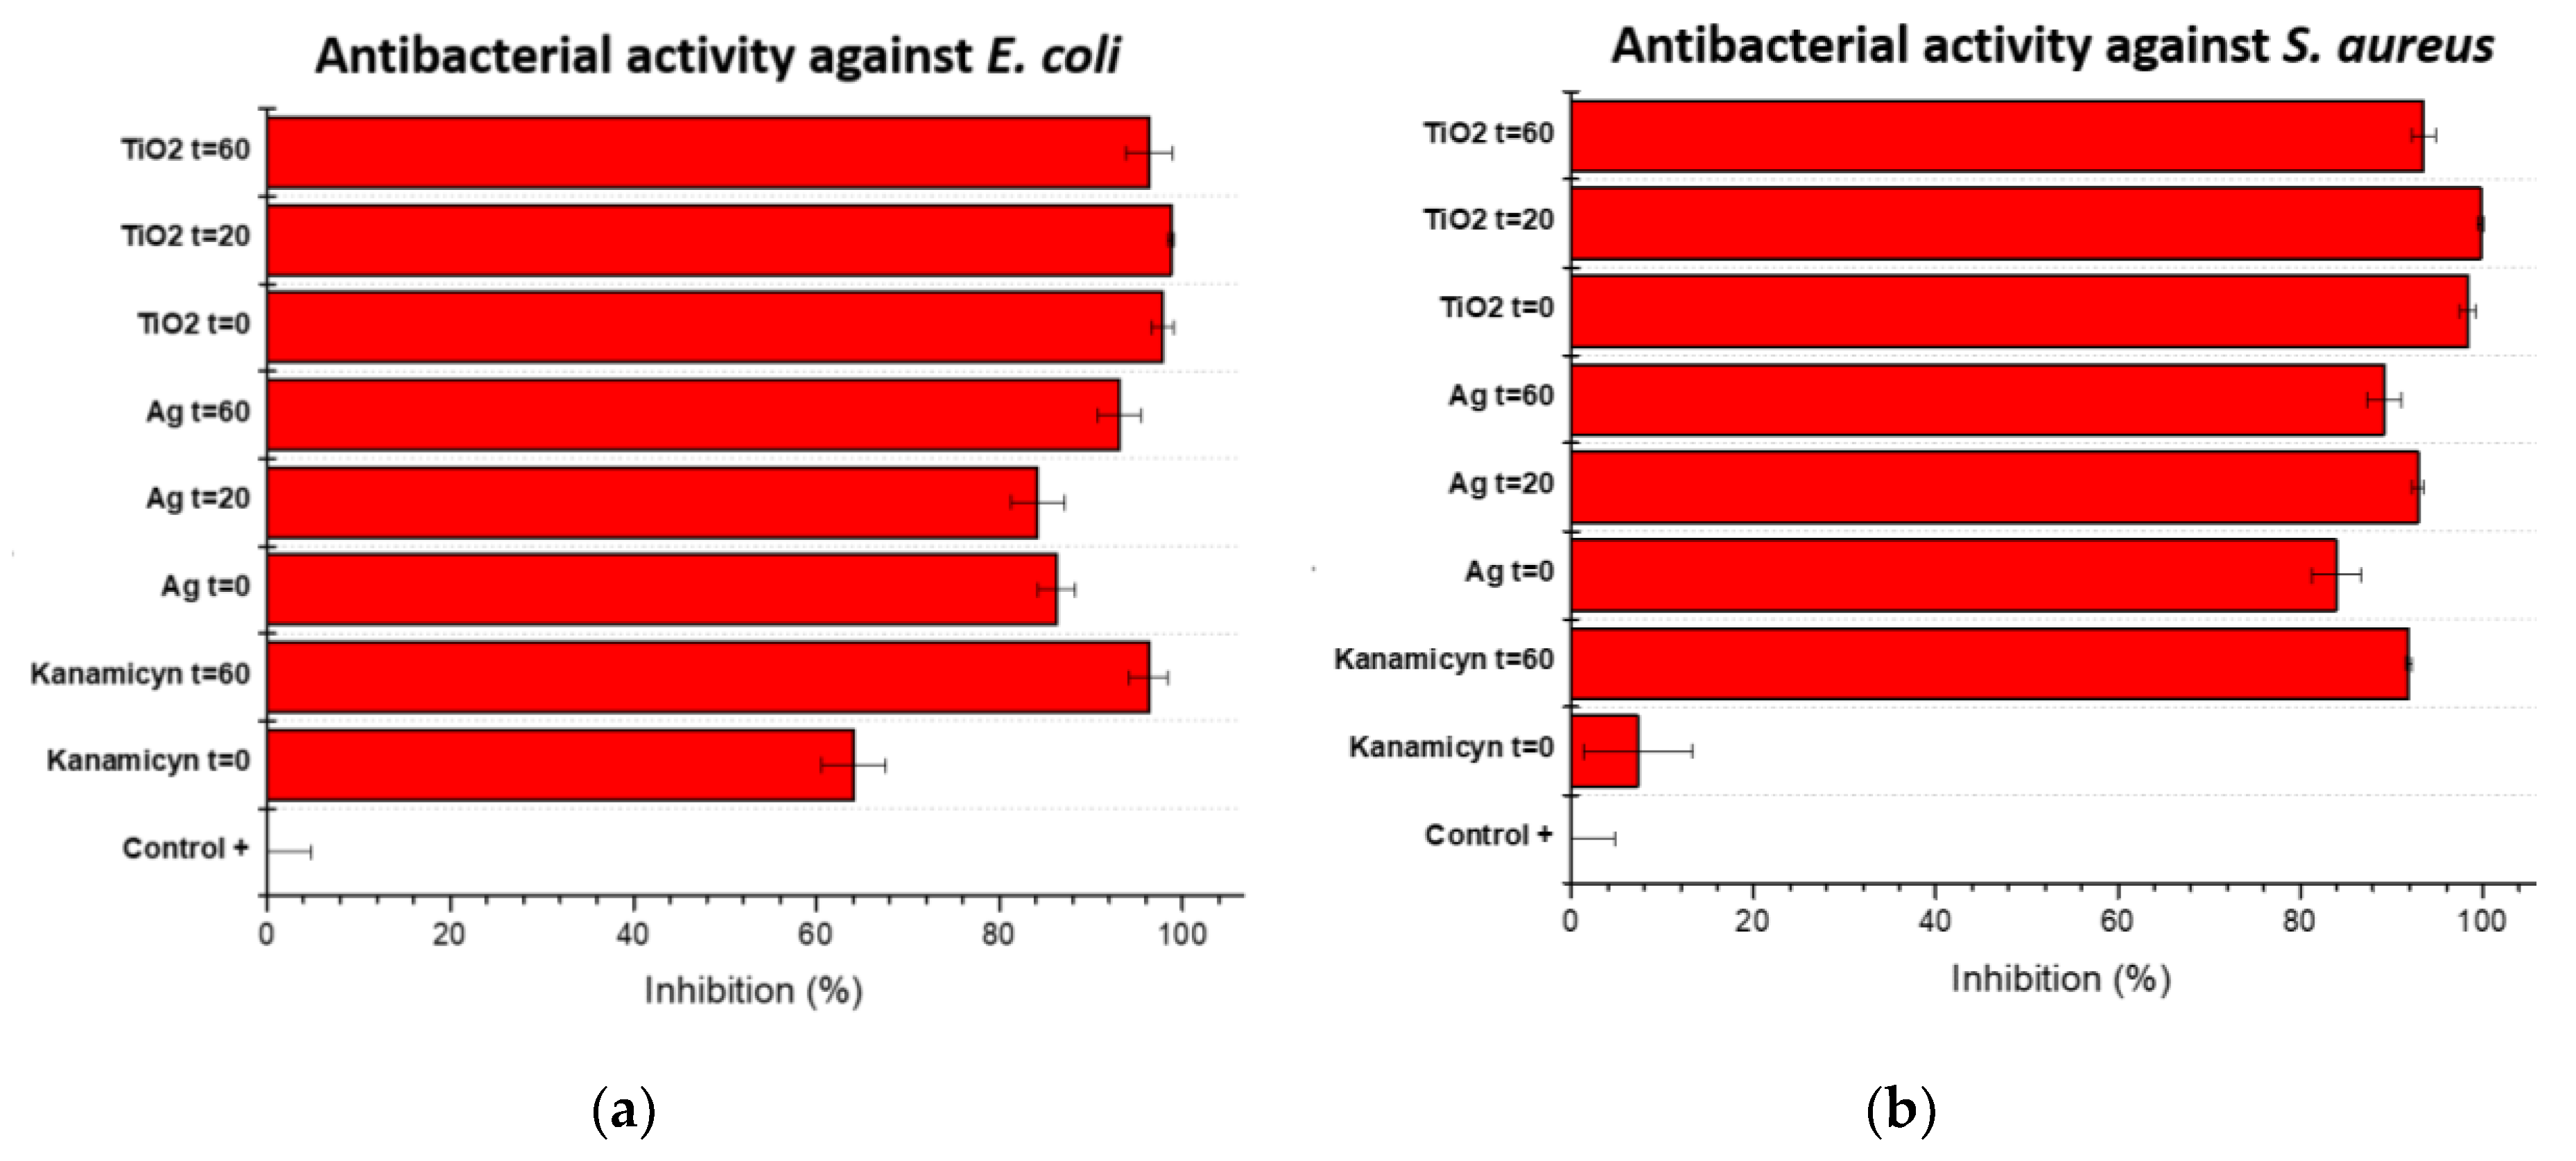
S. aureus with inhibition higher than 80%, and up to 95 %. Both types of cotton nanocomposites had better inhibition properties that kanamycin reference sample. In solution, both bacteria were susceptible to the treatments as can be seen in
Figure 12.
S. aureus (
Figure 12b) showed a slightly higher susceptibility to both composite treatments. However, the Ag-TiO
2/cotton composite presented overall better antibacterial activity against both strains of bacteria. Interestingly, kanamicyn showed better antibacterial activity after 60 minutes of sunlight exposure compared to the same antibiotic treatment without sunlight exposure. This effect might be caused by an increase in the interaction of the antibiotic with the bacteria during the period of sunlight exposure before submerging the fabric into sterile LB medium where the antibiotic-bacteria interaction could be reduced due to the liquid medium since it is possible the kanamicyn concentration is reduced considerably by the liquid medium.
On the other hand, Ag/cotton and Ag-TiO2/cotton composites retain a similar biocide effect at differing times of sunlight exposure. It is possible that, at this bacteria concentration and exposure time, the composites’ effect cannot be differentiated between the varying periods of sunlight irradiation.
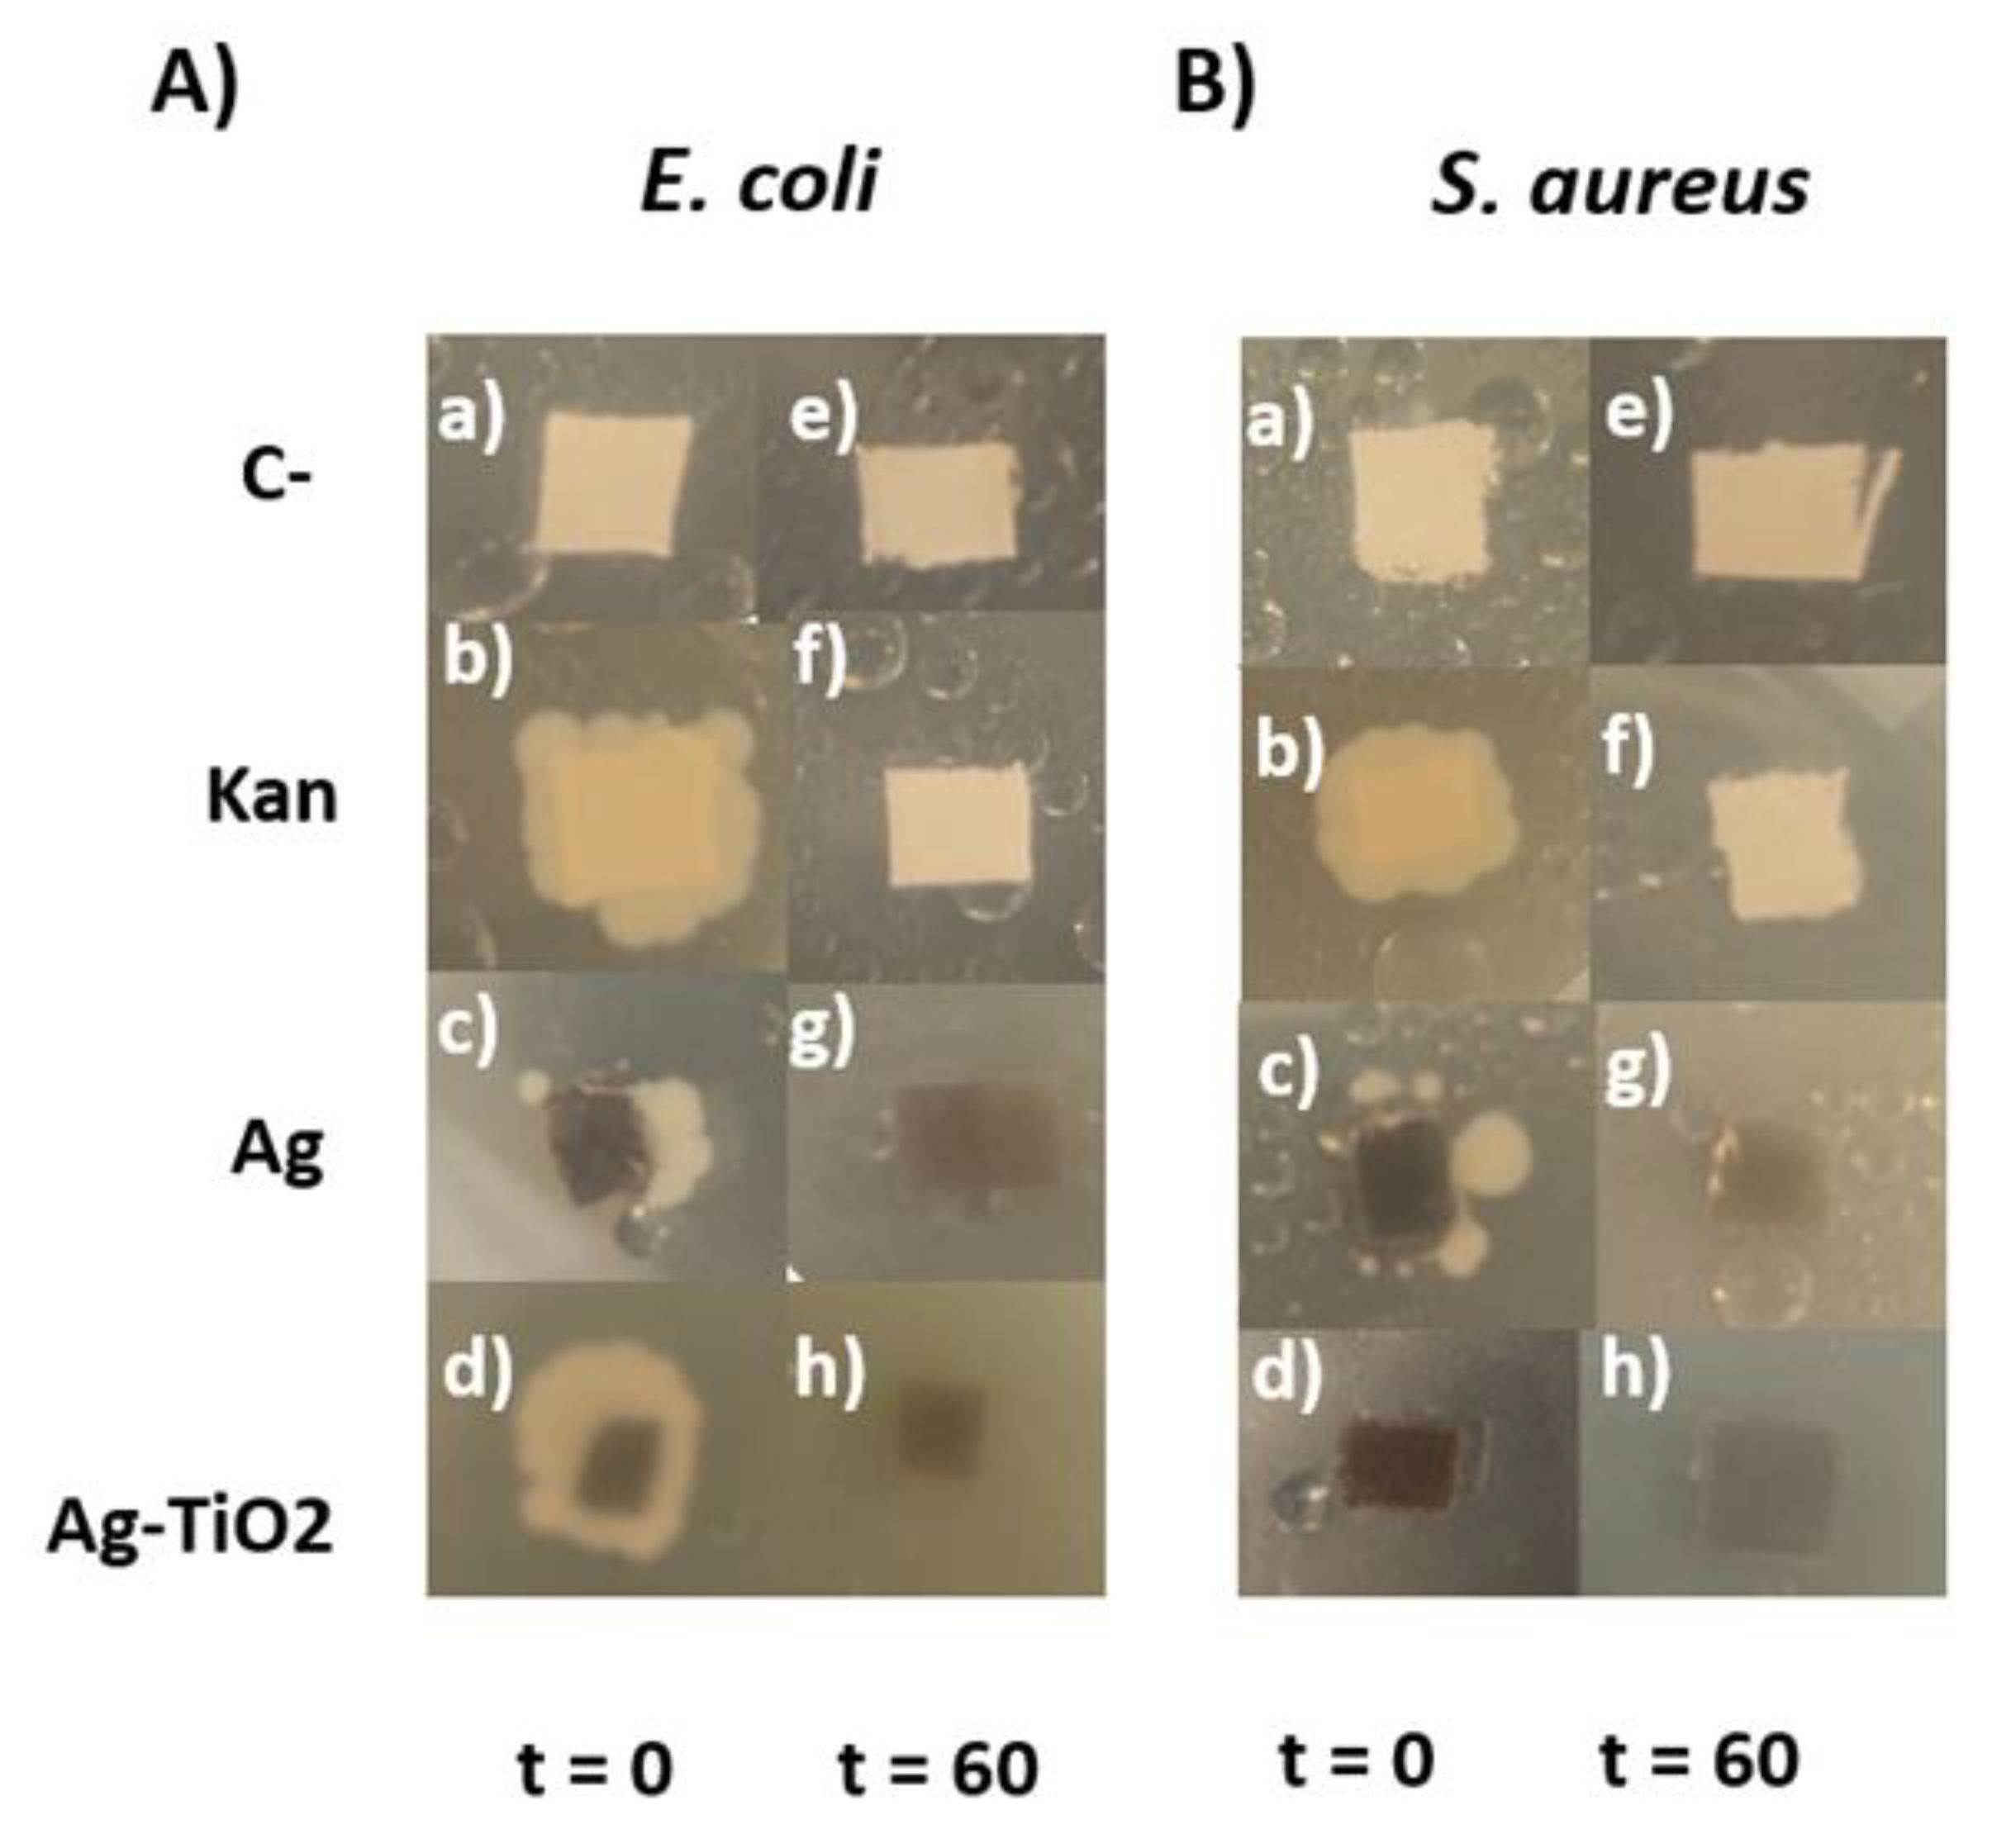
As previously reported, the antibacterial activity of fabrics impregnated with nanoparticles cannot be evaluated through the traditional Kirby-Bauer method because the lack of nanoparticle diffusion on LB agar does not allow for the formation of inhibition zones [
11]. Hence, a reverse assay was proposed where the fabrics with nanoparticles are directly inoculated with bacteria cultures and then deposited on LB agar plates to analyze bacteria growth. Using the previously described procedure, we qualitatively analyzed the antibacterial properties of the Ag/cotton and Ag-TiO
2/cotton composites. Generally, both bacteria are seen to be susceptible to the nanoparticle treatment with sunlight exposure. At t = 0/without sun radiation, the fabrics containing antibiotic and nanoparticles show bacteria growth. However,
S. aureus growth is inhibited in fabrics containing Ag-TiO
2. This phenomenon could be explained by the additive effect of the combination of Ag and TiO
2 nanoparticles. Additionally, Gram-positive bacteria like
S. aureus lack the characteristic outer membrane present in Gram-negative bacteria [
34]. The absence of this membrane makes Gram-positive bacteria more susceptible to many antibiotics and, possibly, to antibacterial nanoparticles.
At 20 hours of incubation time, the bacteria growth seen on LB agar plates behaves similarly to the growth seen on liquid culture. After 40 hours of incubation, the bacteria begin to grow more rapidly and the previously seen antibacterial effect diminishes as can be observed in
Figure 13 b to d in panels A and B. It could be possible that the surviving bacteria begin spreading on the agar and gain access to more nutrients while also moving away from the biocides present on the textiles. This results in a diminishing interaction between the bacteria and biocides, hence allowing for the bacteria to grow more rapidly. This hypothesis is supported by the results obtained through liquid cultures (
Figure 12), where E. coli exposed to biocides shows a growth percentage of 4% for kanamicyn, 14% for Ag/cotton composites and 3% for Ag-TiO
2/composites. Meanwhile, liquid cultures of
S. aureus show a growth percentage of 8% for kanamicyn, 10% for Ag/cotton composites and 6% for Ag-TiO
2/cotton composites.
4. Conclusions
In this work, we report an effective method to functionalize cotton fabrics in situ with TiO2 and Ag nanocomposites resulting in a good dispersion of nanoparticles on the fabric. A cooperative effect was found in the photoluminescence experiment showing a decreased signal in presence of Ag-TiO2 with respect to TiO2 alone. This is because Ag-NPs modify the absorption edge of TiO2, due to the interface formed between these materials in the nanocomposite structure.
The photocatalytic effect on the degradation of methylene blue was improved by the presence of both types of nanoparticles Ag and TiO2 in presence of UV as well as sunlight radiation. The rate of MB degradation in the Ag TiO2 composites was three times higher than in TiO2 alone showing a synergic effect between Ag and TiO2. This photocatalytic effect is in agreement with the decrease in the band gap and in the diminished signal of photoluminescence. In conclusion, the synergistic effect was observed for both types of irradiation, UV and visible light and the degradation rate of MB was higher for visible light than for the UV one
Thus, the functionalization of fabrics by Ag and TiO2 nanoparticles has a potential interest to improve the efficiency of photocatalysts under a wide range of wavelengths. Also, these results indicate the potential applications of functionalized fabrics prepared by ultrasound-assisted and hydrothermal successive methods.to deposit nanoparticles onto them, where these fabrics can be used as more efficient photocatalytic materials.
On the other hand, the fabrics impregnated with Ag and Ag-TiO2 nanoparticles also showed an excellent biocide effect against model Gram-negative and Gram-positive bacteria showing inhibition rates higher than 80%. Therefore, this technique could be optimal for the fabrication of personal protection equipment (PPE) due to the improved antibacterial properties of fabric composites obtained by this means.
Author Contributions
Conceptualization, L.C.-C. and S.F.M.; methodology, L.C.C., and R.D.C.N.; software, U.C.A; validation U.C.A.; formal analysis, U.C.A.; investigation, U.C.A., and K.R.A.; resources, L.C.C., S.F.M., and G.A.N.; data curation, L.C.C., and R.D.C.N.; writing—original draft preparation, L.C.C., R.D.C.-N., S.F.M., P.S.L., and G.A.N.; writing—review and editing, L.C.C., S.F.M., and P.S.L.; visualization, P.S.L.; supervision, L.C.C., S.F.M., and R.D.C.N.; funding acquisition, L.C.C., S.F.M., and G.A.N. All authors have read and agreed to the published version of the manuscript.
Funding
This research was funded by the DGAPA-UNAM research project, grant number IV 100121.
Acknowledgments
We thank Brandon Lopez-Flores (UABC) and Dr. Oscar Gonzalez-Davis (CNYN-UNAM) for their help in the antibacterial activity assays. The authors acknowledge the analysis and discussion of present results with Drs. Elena Smolentseva, Vitalii Petranovskii and Uriel Caudillo Flores.
Conflicts of Interest
The authors declare no conflict of interest.
References
- Hussain:, C.M. Handbook of nanomaterials for manufacturing applications, Elsevier, 2020.
- Yocupicio-Gaxiola, R.I.; Petranovskii, V.; Sánchez, P.; Antúnez-García, J.; Alonso-Núñez, G.; Galván, D.H.; Murrieta-Rico, F.N. Prospects for Further Development of Face Masks to Minimize Pandemics – Functionalization of Textile Materials with Biocide Inorganic Nanoparticles: A Review. IEEE Lat Am Trans 2021, 19, 1010–1023. [Google Scholar] [CrossRef]
- Senić, Ž.; Bauk, S.; Vitorović-Todorović, M.; Pajić, N.; Samolov, A.; Rajić, D. Application of TiO2 Nanoparticles for Obtaining Self Decontaminating Smart Textiles. Sci Tech Rev 2011, 61, 63–72. [Google Scholar]
- Ogunsona, E.O.; Muthuraj, R.; Ojogbo, E.; Valerio, O.; Mekonnena, T.H. Engineered nanomaterials for antimicrobial applications: A review. Appl Mater Today 2020, 18. [Google Scholar] [CrossRef]
- Guo, W.; Lin, Z.; Wang, X.G. Sonochemical synthesis of nanocrystalline TiO2 by hydrolysis of titanium alkoxides. Microelectron Eng 2003, 66, 95–101. [Google Scholar] [CrossRef]
- Prasad, K.; Pinjari, D.V.; Pandit, A.B.; Mhaske, S.T. Synthesis of titanium dioxide by ultrasound assisted sol–gel technique: Effect of amplitude (power density) variation. Ultrason Sonochem 2010, 17, 697–703. [Google Scholar] [CrossRef]
- Hadad, L.; Perkas, N.; Gofer, Y.; Calderon-Moreno, J.; Ghule, A.; Gedanken, A. Sonochemical deposition of silver nanoparticles on wool fibers. J Appl Polym Sci 2007, 104, 1732–1737. [Google Scholar] [CrossRef]
- Perelshtein, I.; Applerot, G.; Perkas, N.; Wehrschuetz-Sigl, E.; Hasmann, A.; Guebitz, G.; Gedanken, A. Antibacterial Properties of an In Situ Generated and Simultaneously Deposited Nanocrystalline ZnO on Fabrics. Appl Mater Inter 2009, 1, 361–366. [Google Scholar] [CrossRef]
- Perelshtein, I.; Applerot, G.; Perkas, N.; Wehrschuetz-Sigl, E.; Hasmann, A.; Guebitz, G.; Gedanken, A. CuO–cotton nanocomposite: Formation, morphology, and antibacterial activity. Surf Coat Technol 2009, 204, 54–57. [Google Scholar] [CrossRef]
- Perelshtein, I.; Applerot, G.; Perkas, N.; Grinblat, J.; Gedanken, A. A One-Step Process for the Antimicrobial Finishing of Textiles with Crystalline TiO2 Nanoparticles. Chem Eur J 2012, 18, 4575–4582. [Google Scholar] [CrossRef]
- Alvarez-Amparán, M.A.; Martínez-Cornejo, V.; Cedeño-Caero, L.; Hernandez-Hernandez, K.A.; Cadena-Nava, R.D.; Alonso-Núñez, G.; Fuentes Moyado, S. Characterization and photocatalytic activity of TiO2 nanoparticles on cotton fabrics, for antibacterial masks. Applied Nanoscience 2022. [Google Scholar] [CrossRef]
- Akhavan, F.; Montazerb, S.M. In situ sonosynthesis of nano TiO2 on cotton fabric. Ultrason Sonochem 2012, 21, 681–691. [Google Scholar] [CrossRef] [PubMed]
- Abulikemu, M.; Tabrizi, B.; Ghobadioo, S.; Mofarah, H.; Jabbour, G. Silver Nanoparticle-Decorated Personal Protective Equipment for Inhibiting Human Coronavirus Infectivity. ACS Appl. Nano Mater. 2021. [Google Scholar] [CrossRef]
- Dong, H.; Hinestroza, J.P. Metal Nanoparticles on Natural Cellulose Fibers: Electrostatic Assembly and In Situ Synthesis. ACS Applied Materials & Interfaces 2009, 1, 797–803. [Google Scholar]
- Pakdel, E.; Daoud, W.A. Self-cleaning cotton functionalized with TiO2/SiO2: Focus on the role of silica. J Colloid Interface 2013, 401, 1–7. [Google Scholar] [CrossRef] [PubMed]
- Chung, C.; Lee, M.; Choe, E. K. Characterization of cotton fabric scouring by FT-IR ATR spectroscopy. Carbohydrate Polymers 2004, 58, 417–420. [Google Scholar] [CrossRef]
- Abidi, N.; Cabrales, L.; Haigler, C.H. Changes in the cell wall and cellulose content of developing cotton fibers investigated by FTIR spectroscopy. Carbohydrate Polymers 2014, 100, 9–16. [Google Scholar] [CrossRef] [PubMed]
- Âkerholm, M.; Hinterstoisser, B.; Almén, L. Characterization of the crystalline structure of cellulose using static and dynamic FT-IR spectroscopy. Carbohydrate research 2004, 339, 569–578. [Google Scholar] [CrossRef]
- Md Salim, R.; Asik, J.; Sarjadi, M. S. Chemical functional groups of extractives, cellulose and lignin extracted from native Leucaena leucocephala bark. Wood Science and Technology 2021, 55, 295–313. [Google Scholar] [CrossRef]
- El-Sakhawy, M.; Kamel, S.; Salama, A.; Tohamy, H.A.S. Preparation and infrared study of cellulose based amphiphilic materials. Cellul. Chem. Technol 2018, 52, 193–200. [Google Scholar]
- Ivanova, T.; Harizanova, A.; Koutzarova, T.; Vertruyen, D.B. Characterization of nanostructured TiO2: Ag films: structural and optical properties. In Journal of Physics: Conference Series 2016, 764, 012019. [Google Scholar] [CrossRef]
- Andrés, E.S.; Toledano-Luque, M.; Prado, A.D.; Navacerrada, M.A.; Mártil, I.; González-Díaz, G.; Strub, E. Physical properties of high pressure reactively sputtered TiO2. Journal of Vacuum Science & Technology A: Vacuum, Surfaces, and Films 2005, 23, 1523–1530. [Google Scholar]
- French, A.D. Idealized powder diffraction patterns for cellulose polymorphs. Cellulose 2014, 21, 885–896. [Google Scholar] [CrossRef]
- Martínez Espinosa, J.C.; Carrera Cerritos, R.; Ramírez Morales, M.A.; Sánchez Guerrero, K.P.; Silva Contreras, R.A.; Macías, J.H. Characterization of silver nanoparticles obtained by a green route and their evaluation in the bacterium of Pseudomonas aeruginosa. Crystals 2020, 10, 395. [Google Scholar] [CrossRef]
- Lopes, F.C.S.; Maria da Graça, C.; Bargiela, P.; Ferreira, H.S.; Pires, C.A.D.M. Ag/TiO2 photocatalyst immobilized onto modified natural fibers for photodegradation of anthracene. Chemical Engineering Science 2020, 227, 115939. [Google Scholar] [CrossRef]
- Wang, G.; Shi, C.; Zhao, N.; Du, X. Synthesis and characterization of Ag nanoparticles assembled in ordered array pores of porous anodic alumina by chemical deposition. Materials Letters 2007, 61, 3795–3797. [Google Scholar] [CrossRef]
- Jensen, T.R.; Malinsky, M.D.; Haynes, C.L.; Van Duyne, R.P. Nanosphere lithography: tunable localized surface plasmon resonance spectra of silver nanoparticles. The Journal of Physical Chemistry B 2000, 104, 10549–10556. [Google Scholar] [CrossRef]
- Mock, J.J.; Barbic, M.; Smith, D.R.; Schultz, D.A.; Schultz, S. Shape effects in plasmon resonance of individual colloidal silver nanoparticles. The Journal of Chemical Physics 2002, 116, 6755–6759. [Google Scholar] [CrossRef]
- Agnihotri, S.; Mukherji, S.; Mukherji, S. Size-controlled silver nanoparticles synthesized over the range 5–100 nm using the same protocol and their antibacterial efficacy. Rsc Advances 2014, 4, 3974–3983. [Google Scholar] [CrossRef]
- Paramelle, D.; Sadovoy, A.; Gorelik, S.; Free, P.; Hobley, J.; Fernig, D.G. A rapid method to estimate the concentration of citrate capped silver nanoparticles from UV-visible light spectra. Analyst 2014, 139, 4855–4861. [Google Scholar] [CrossRef]
- Lin, H.; Huang, C.P.; Li, W.; Ni, C.; Shah, S.I.; Tseng, Y. H. Size dependency of nanocrystalline TiO2 on its optical property and photocatalytic reactivity exemplified by 2-chlorophenol. Applied Catalysis B: Environmental 2006, 68, 1–11. [Google Scholar] [CrossRef]
- Kumar, S.; Verma, N.K.; Singla, M. L. Size dependent reflective properties of TiO2 nanoparticles and reflectors made thereof. Digest Journal of Nanomaterials and Biostructures 2012, 7, 607–619. [Google Scholar]
- Su Pei, L.; Yee Seng, L.; Alagarsamy, P.; Hong Ngee, L.; Yun Hau, N.; Ramasamy, R.; Daniel, C.; Sheng, B.; Osama, K.A.; Nay Ming, H. Gold-silver@TiO2 nanocomposite-modified plasmonic photoanodes for higher efficiency dye-sensitized solar cells. Phys. Chem. Chem. Phys. 2017, 19, 1395–1407. [Google Scholar]
- Breijyeh, Z.; Jubeh, B.; Karaman, R. Resistance of Gram-Negative Bacteria to Current Antibacterial Agents and Approaches to Resolve It. Molecules 2020. [Google Scholar] [CrossRef] [PubMed]
Scheme 1.
Illustration of the different steps involved in the preparation of Ag-TiO2 NPs on cotton.
Scheme 1.
Illustration of the different steps involved in the preparation of Ag-TiO2 NPs on cotton.
Figure 1.
SEM-EDS micrograph and elemental mapping of fabrics. Ti-NPs (a, b), Ag-NPs (c, d) and AgTi-NPs (e-g).
Figure 1.
SEM-EDS micrograph and elemental mapping of fabrics. Ti-NPs (a, b), Ag-NPs (c, d) and AgTi-NPs (e-g).
Figure 2.
(a) TEM micrograph of Ti-NPs sample and (b) lognormal particle size distribution curves of Ti-NPs.
Figure 2.
(a) TEM micrograph of Ti-NPs sample and (b) lognormal particle size distribution curves of Ti-NPs.
Figure 3.
(a) TEM micrograph of AgTi-NPs sample and lognormal particle size distribution curves of: (b) Ti-NPs and (c) Ag-NPs.
Figure 3.
(a) TEM micrograph of AgTi-NPs sample and lognormal particle size distribution curves of: (b) Ti-NPs and (c) Ag-NPs.
Figure 4.
(a) FTIR-ATR spectra of the Ti-NPs, Ag-NPs and AgTi-NPs samples. (b) Closer view of (a) in the range of 800 to 400 cm-1.
Figure 4.
(a) FTIR-ATR spectra of the Ti-NPs, Ag-NPs and AgTi-NPs samples. (b) Closer view of (a) in the range of 800 to 400 cm-1.
Figure 5.
XRD pattern of AgTi-NPs sample. C=cellulose, S=silver and A=anatase.
Figure 5.
XRD pattern of AgTi-NPs sample. C=cellulose, S=silver and A=anatase.
Figure 6.
UV-Vis spectra the reduction reaction of AgNO3 with different amounts of NaBH4.
Figure 6.
UV-Vis spectra the reduction reaction of AgNO3 with different amounts of NaBH4.
Figure 7.
DRS spectra of Ti-NPs, Ag-NPs and AgTi-NPs samples. Embedded image of Tauc graph for calculating the band gap.
Figure 7.
DRS spectra of Ti-NPs, Ag-NPs and AgTi-NPs samples. Embedded image of Tauc graph for calculating the band gap.
Figure 8.
Photoluminescence spectrum of TiO2 and AgTi-NPs . Excitation wavelength 350 nm.
Figure 8.
Photoluminescence spectrum of TiO2 and AgTi-NPs . Excitation wavelength 350 nm.
Figure 9.
UV-Vis spectra of MB under UV irradiation for AgTi-NPs samples.
Figure 9.
UV-Vis spectra of MB under UV irradiation for AgTi-NPs samples.
Figure 10.
UV-Vis spectra of MB under solar irradiation for AgTi-NPs samples.
Figure 10.
UV-Vis spectra of MB under solar irradiation for AgTi-NPs samples.
Figure 11.
Characteristic degradation time (τ) of MB, under UV or solar (sun) irradiation.
Figure 11.
Characteristic degradation time (τ) of MB, under UV or solar (sun) irradiation.
Figure 12.
Antibacterial activity of cotton fabrics against Gram – (E. coli) and Gram + (S. aureus) bacteria in solution after 18 hours of incubation.
Figure 12.
Antibacterial activity of cotton fabrics against Gram – (E. coli) and Gram + (S. aureus) bacteria in solution after 18 hours of incubation.
Figure 13.
Fabrics inoculated with A) E. coli and B) S. aureus cultures on LB Agar plates after 40 hours of incubation. T shows the time of sunlight exposure in minutes.
Figure 13.
Fabrics inoculated with A) E. coli and B) S. aureus cultures on LB Agar plates after 40 hours of incubation. T shows the time of sunlight exposure in minutes.
|
Disclaimer/Publisher’s Note: The statements, opinions and data contained in all publications are solely those of the individual author(s) and contributor(s) and not of MDPI and/or the editor(s). MDPI and/or the editor(s) disclaim responsibility for any injury to people or property resulting from any ideas, methods, instructions or products referred to in the content. |
© 2023 by the authors. Licensee MDPI, Basel, Switzerland. This article is an open access article distributed under the terms and conditions of the Creative Commons Attribution (CC BY) license (http://creativecommons.org/licenses/by/4.0/).

