Preprint
Article

35-Day and Orbital RXTE/PCA X-Ray Lightcurves of Hercules X-1

Altmetrics

Downloads

90

Views

21

Comments

0

This version is not peer-reviewed

Submitted:

26 April 2023

Posted:

27 April 2023

You are already at the latest version

Alerts
Abstract
The archival Rossi X-ray Timing Explorer (RXTE) Proportional Counter Array (PCA) observations of HZ Her/Her X-1 are analyzed here. The time periods for Anomalous Low States are refined. The 35-day X-ray lightcurve of Her X-1 is produced using 35-day phases determined with RXTE All-Sky Monitor (ASM) and Swift Burst Altert Telescope (BAT) data, with adjustments based on the RXTE/PCA data. The result is the highest sensitivity 35-day lightcurve of Her X-1. The RXTE/PCA data were separated into 8 differents states of the 35-day cycle: Main High (MH) turn-on, MH, MH decline, Low State (LS) 1, Short High (SH) turn-on, SH, SH decline, and LS2. Orbital lightcurves were created for each state, and the different states are compared. Eclipse data was extracted for each state to determine the changes of eclipse shape with 35-day phase. A scattering corona model was fit to the eclipses for the different 35-day states: this shows that the corona is present at all 35-day phases with similar intensity. We carried out a search for previously-reported dips with no absorption, but did not find any.
Keywords: 
Subject: Physical Sciences  -   Astronomy and Astrophysics

1. Introduction

Hercules X-1 (Her X-1) is a well-known and studied binary system (e.g [1,2,3]) composed of a neutron star Her X-1 –pulsating at 1.24 s– in a 1.7-day nearly circular orbit around its optical companion, a main sequence star HZ Her of spectral type A/F. The binary has accurately measured orbital ephemeris [4]. The companion varies between late A type (for the back side facing away from the neutron star) and early B type (for the front X-ray illuminated side of companion). The approximate masses of neutron star and companion are ≃ 1.6 M and ≃ 2.3 M , respectively [5,6]. The main uncertainty is caused by the uncertainty in the orbital inclination, which is ∼85o. It is located at a distance of ∼ 6.1 kpc from Earth [5], with coordinates of RA = 16 57 49.8110126616 and dec = +35 20 32.486555472, or galactic coordinates of 58.1o longitude and 37.5o latitude. Her X-1 is a persistent X-ray pulsar discovered by the Uhuru satellite in 1972 along with Centaurus X-3. Since that date, both pulsars have remained among the most studied X-ray sources and continue to give new information about X-ray binary astrophysics. The system Her X-1/HZ Her is a strong emitter in X-rays, optical, and ultraviolet (e.g [7,8]), which enables studies of the binary in detail.
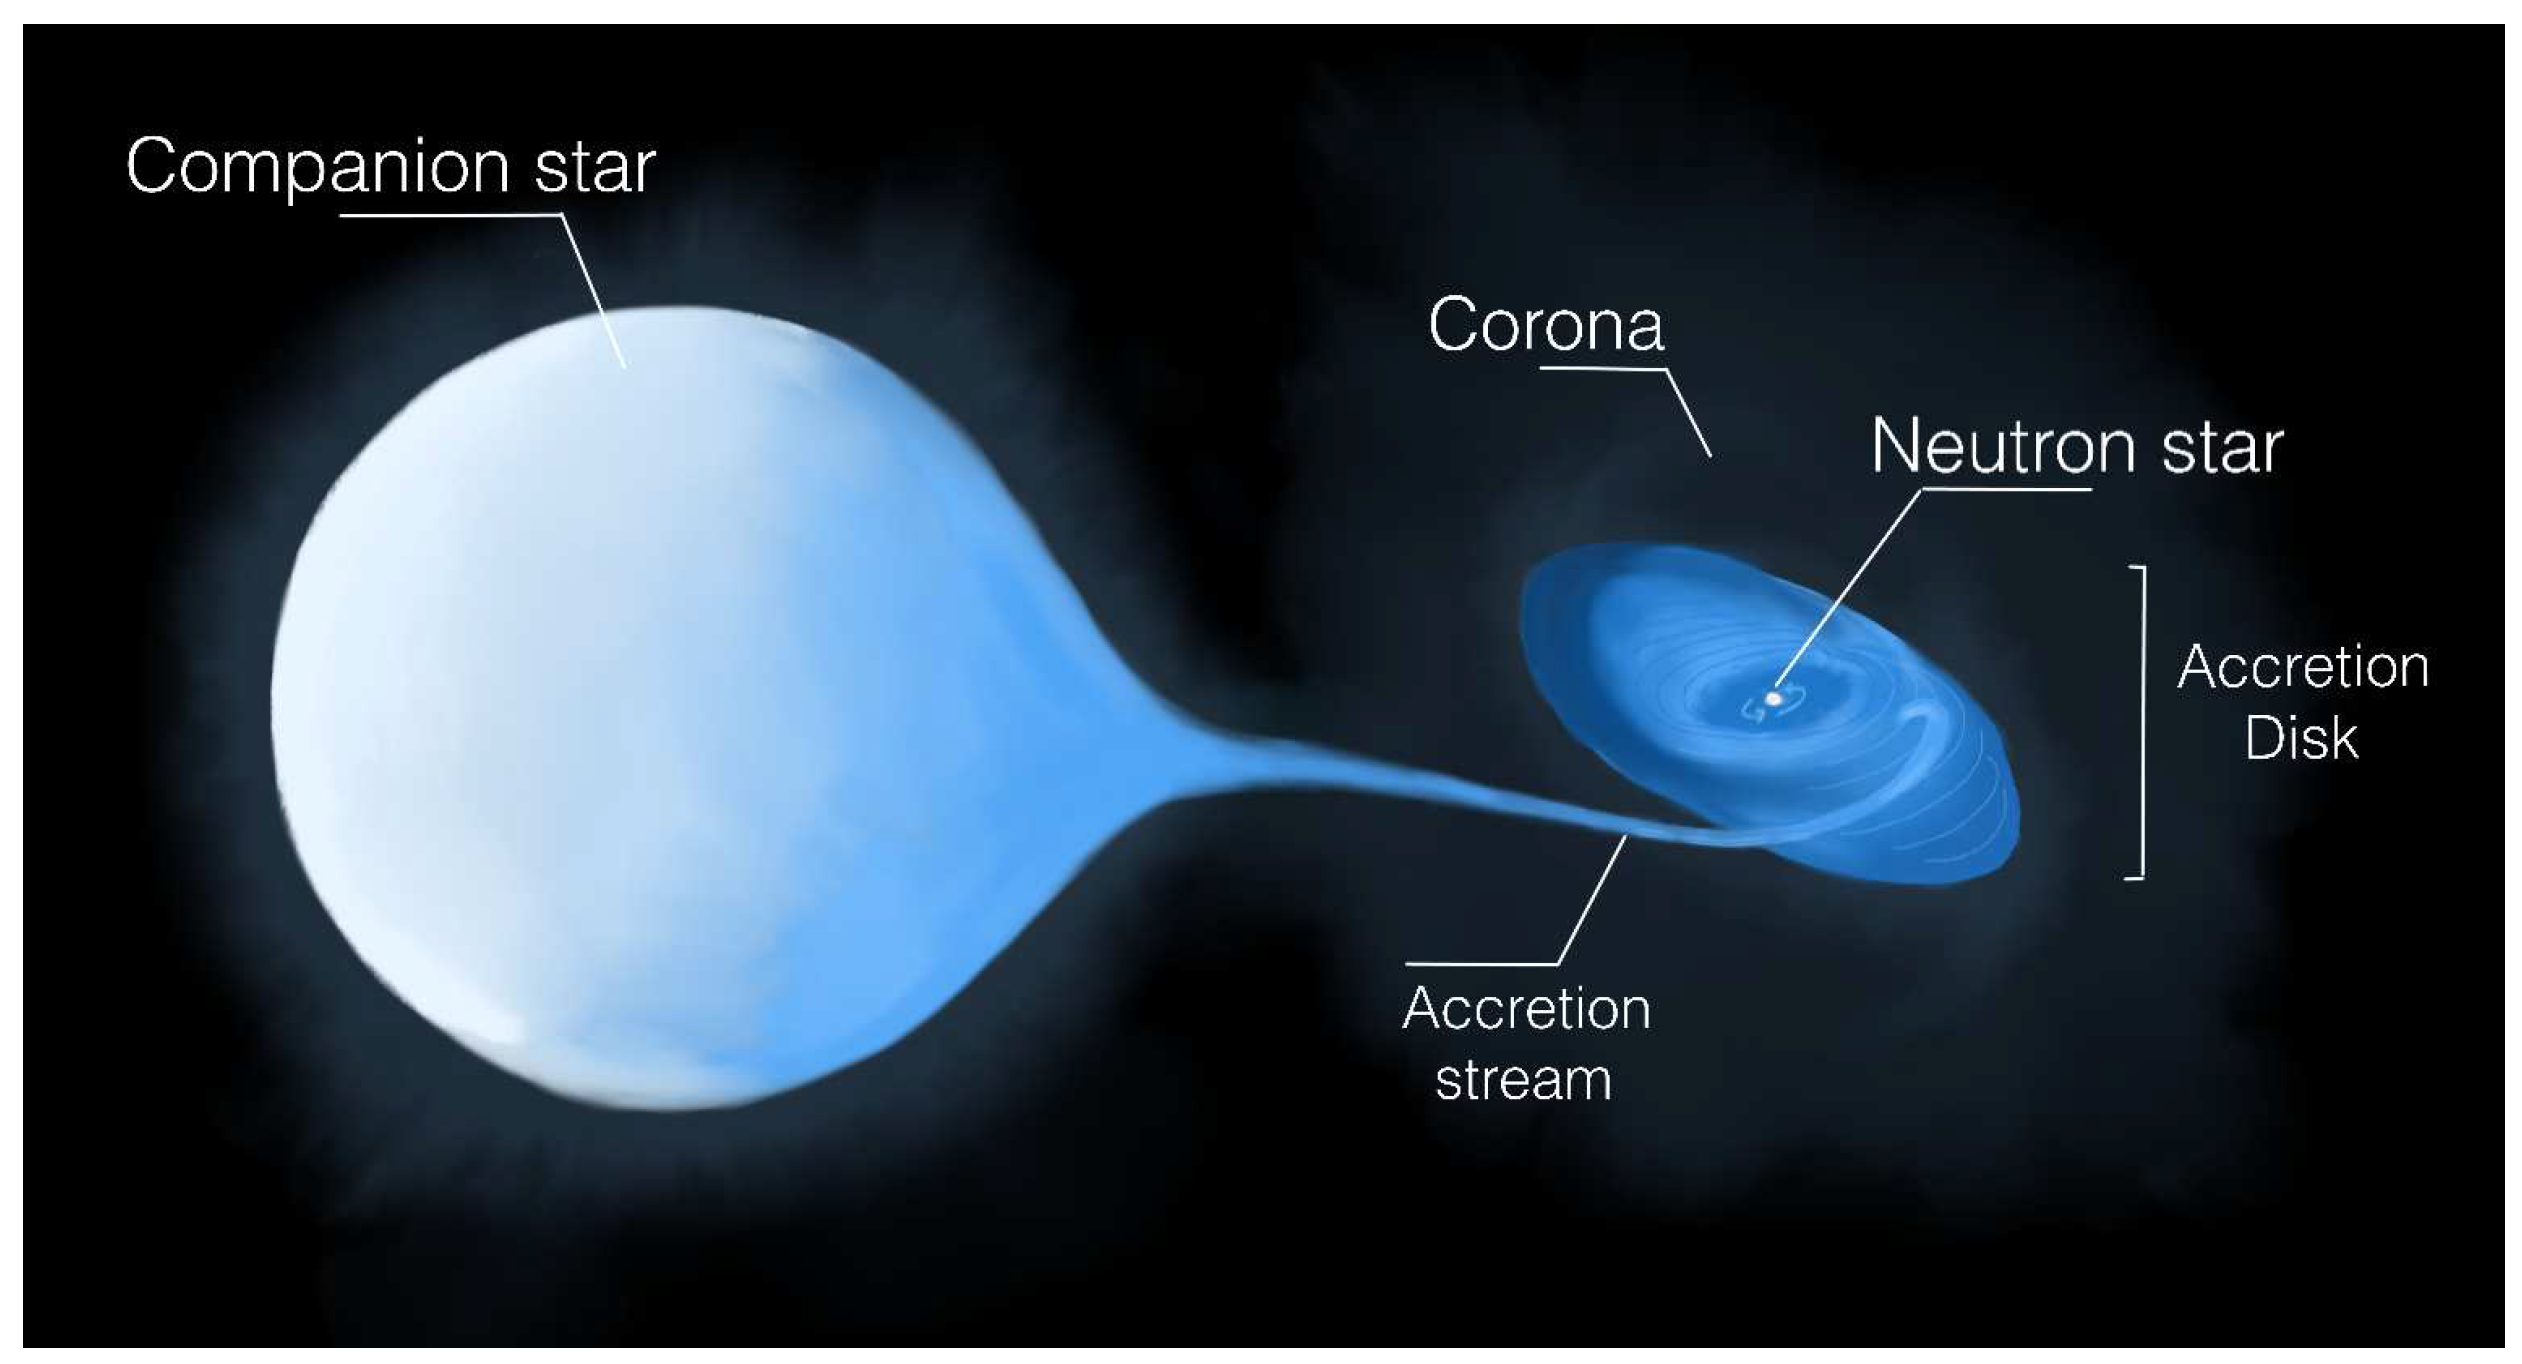
The 35-day cycle is one of the most prominent features of Her X-1 ([9] and references therein). Its length can vary from 33 to 37 days [10]. The cycle is produced by changes in the obscuration of the neutron star by the accretion disk [11,12]. The binary system is conceptually illustrated here in Figure 1, with observer inclination at 85 and with a twisted and tilted accretion disk fed by an accretion stream from the Roche-lobe filling companion, HZ Her. The neutron star is directly visible in MH state, and seen partly obscured in SH.
The 35-day cycle has 8 states: Main High (MH) turn-on, MH, MH decline, Low State (LS) 1, Short High (SH) turn-on, SH, SH decline, and LS 2. The MH state (including the 3 subdivisions) lasts 10-12 days, the SH state lasts 5-7 days, and MH and SH are separated by LS lasting 8-10 days [13]. In addition, Her X-1 has Anomalous low states (ALS) every ∼ 5 years (e.g. [14]), where the High states fail to appear and instead exhibits extended periods of low X-ray flux. The ALS were discovered by [15], and later shown [9] to be indistinguishable from the regular LS based on X-ray softness ratio (SR). The ALS is likely produced by a change in the geometry of the accretion disk that prevents a direct line of sight to Her X-1 [16].
An X-ray binary system which has a low mass (≲ 3 M ) or late-type companion star (spectral type A or later) is known as low-mass X-ray binary (LMXB). It consists of a neutron star or a black hole accreting material from its companion via Roche-lobe overflow1, forming an accretion disk around the compact object through conservation of angular momentum. The material spirals into the deep gravitational well, with potential of order 0.1 mc 2 , and thus is heated to keV temperatures, causing the emission of X-rays. LMXBs are usually found in the bulge, disk and globular clusters of the Galaxy, whereas HMXBs (high-mass X-ray binaries with young massive stars as companions) are usually found close to star-forming regions in the spiral arms of the Galactic plane. LMXBs are older than HMXBs. Her X-1 has a companion which is ∼600 Myr old [5] and is considered to be a LMXB.
The accretion stream from HZ Her enters orbit around Her X-1 and forms an accretion disk (e.g. [17,18]). Accretion onto Her X-1 from the inner edge of the disk proceeds through an accretion column, in which the hard X-rays (> 1 keV) are created [19,20], and modulated by neutron star rotation and obscuration of the accretion disk. A weaker flux of X-rays is present during low state and eclipses, which are scattered from extended matter in the system (e.g [11,12]). However, there are other different X-ray flux modulations that consist of sharp and non-periodic absorption events, called lightcurve dips. These numerous dips occur throughout the orbital phase and the High states of the 35-day cycle, lasting from a couple of seconds to several hours in different intensities [21].
Dips were studied by [22], where their spectra exhibited X-ray absorption by cool material and Thompson scattering by ionized gas. According to [23,24] dips can also be caused by partially ionized matter or cool bobs of material immersed in hot ionized gas. [13] analyzed the pre-eclipse dips using RXTE/ASM data, confirming the marching phenomenon where dips progress to earlier orbital phase as 35-day phase increases. [17] modeled the stream-accretion disk impact and concluded that the dips properties can be explained by this model when the impact site of the accretion stream on the accretion disk obscures the X-ray source. Dips and orbital phase lightcurves were studied by [1] using RXTE/ASM, Swift Burst Alert Telescope (BAT) [25] and Monitor of All-sky X-ray Image (MAXI) [26] data. The absorption dips exhibit a drop in the SR simultaneous with a drop in the count rate. [27] reported a new phenomenon for dips during MH state using LAXPC instrument on board of the AstroSat Observatory [28]: several dips showed constant SR as count rate decreased instead of the usual behaviour for absorption dips. These dips could be caused by highly ionized matter blocking the X-rays (and so the spectrum doesn’t change as count rate decreases), or by partial coverage of very dense matter.
Ionized gas in Her X-1 was demonstrated by [2]. [29] presented a model for the large-scale electron scattering corona by analysis of RXTE/PCA eclipse lightcurves in MH state. The corona was approximated by a spherically symmetric electron density distribution, since a more detailed corona would not be justified due to the large errors in mid-eclipse lightcurve. Their model allows for three possible scenarios: the expected temperature from heating by Compton scattering is similar to that required to keep the corona in hydrostatic equilibrium; the entire corona is a fast outflow; or the corona could be hybrid, with an inner hydrostatic region and an outer-low region with low outflow velocity. Moreover, they detected a bump in the eclipse lightcurve at orbital phase 0.945 (eclipse ingress) that may be caused by the impact of the accretion stream with the disk [29].
In this work we analyse the entire RXTE/PCA database of observations of Her X-1 to obtain high sensitivity 35-day and orbital lightcurves. Section 2 describes the data and analysis; and section 3 presents the lightcurves. In section 4 we discuss the new results and conclude in section 5.

2. Data and Analysis

2.1. Rossi X-ray Timing Explorer (RXTE) Observations

The Rossi X-ray Timing Explorer (RXTE) was launched on December 30, 1995. Designed for a lifetime of 2 years, it operated for 16 years (from December 1995 to January 2012) providing information about the extreme environments around white dwarfs, neutron stars, black holes and other X-ray emitting objects. The observatory’s instruments measured X-ray variations on timescales from microseconds to months and years, covering a spectral range from 2 to 250 keV. The spacecraft carried three instruments: the Proportional Counter Array (PCA) [30] developed by NASA’s Goddard Space Flight Center to cover low energy ranges (from 2-60 keV) with geometric area of 6500 cm 2 and time resolution of 1 microsec; the High Energy X-ray Timing Experiment (HEXTE) [31] built by the University of California for the energy range 15-250 keV with a geometric area of 2 × 800 cm 2 ; and the All-Sky Monitor (ASM) [32] developed by the Massachusetts Institute of Technology (MIT) with range 2-10 keV and 30 mCrab sensitivity.
Here we analyze the RXTE/PCA data. The data were downloaded from the NASA’s High Energy Astrophysics Science Archive Research Center (HEASARC) web site (https:// heasarc.gsfc.nasa.gov), which is the primary archive for NASA’s missions studying electromagnetic radiation from extremely energetic cosmic phenomena ranging from black holes to the Big Bang.

2.2. Analysis

The downloaded data contains 23 folders, one per observing proposal. The standard products for bands b (2-4 keV), c (4-9 keV), and d (9-20 keV) were used in the current analysis. Using the standard lightcurve files, we calculate time (in Modified Julian Day), orbital phase, 35-day phase, softness ratio and its error. The files contain the raw time in Spacecraft Clock Seconds (SCCS) or Mission Elapsed Time (MET); and the barytime (Barycentric Dynamical Time, TDB). The time units in seconds were changed to Modified Julian Date in Terrestrial Time using the conversion:
M J D B = T D B 24 * 3600 + M J D B r e f ( T T )
where TDB is the barytime, and M J D B r e f ( T T ) is the reference time of the instrument: M J D B r e f ( T T ) = M J D B r e f , i n t + M J D B r e f , f r a c = 49353.000696574076 s.
For the calculation of the orbital ephemeris, we use:
P o r b ( t ) = P o r b ( 0 ) + ( M J D T π / 2 ( 0 ) ) * P ˙ o r b ( 0 )
where we use the constants from Table 3 of [4]: T π / 2 ( 0 ) = 46359.871940, P o r b ( 0 ) = 1.70016759, and P ˙ o r b ( 0 ) = 1.70016759. The average orbital period over time T π / 2 ( 0 ) to time t is:
P a v ( t ) = P o r b ( 0 ) + P o r b ( t ) 2
because the orbital period is increasing linearly with time. The time T from the reference time is T = t T π / 2 ( 0 ) . The orbital phase, ϕ o r b , with phase reference 0 defined as mid-eclipse of the neutron star by the companion star, is given by the fractional part of T P a v ( t ) . and the number of orbital cycles,n, is given by the integer part of T P a v ( t ) . The softness ratio, SR, here for band b over band d, is given by:
S R = b d
with b and d the count rates in bands b and d, respectively.

2.3. 35-Day Phase Determination

35-day phase, ϕ 35 , was calculated as:
ϕ 35 = t t n 35 P n 35 = t t n 35 t n + 1 35 t n 35
where t is time of the data, t n is the start time and P n 35 is the length of 35-day cycle number n. We used the values of t n and P n 35 from [10] as initial values for calculation of 35-day phase. For each value of n, we selected the nearest value of t to t n 35 , with t n 35 < t .
We used Tables 1 and 2 from [10] for the calculation of the 35-day phase and cycle definition, because ASM and BAT time peaks have been well-determined and cover a wide range of time. The table was divided into two parts: an interval of MJD 50146.553 to 53403.780 for the ASM table, and an interval of MJD 53437.822 to 58691.994 for the BAT table. The first part contained 94 cycles of ASM data and the latter contained 152 cycles of BAT data giving a total of 246 cycles2
The original cycle numbering of the ASM table was kept, but the numbering of the BAT table was changed to be consecutive with the ASM numbering (cycle 0 was renumbered 97, etc., the same as in Table 4 of [10]). A few modifications to the original values of t n and P n 35 were made, within the uncertainties of the ASM and BAT peak times, as described in Section 3.1 below. Table 1 shows all the changes made, ranging from 1 to 3.4 days.

3. Results

3.1. 35-Day Phase Lightcurves

The data were first filtered to remove the Anomalous Low States (ALS) 1 and 2. To remove ALS1 and ALS2, we initially used the intervals measured by [33] (their Table 1). Then we carried out a new examination of the ASM, BAT and PCA lightcurves, which led us to redefine the ALS periods: ALS1 goes from MJD 51230 to 51755, and ALS2 goes from MJD 52980 to 53100.
The initial plots of count rate vs. ASM/BAT-determined 35-day phase served as a reference to find misplaced data caused by incorrectly calculated 35-day phase. This can happen because of the uncertainties of 35-day phase determination from ASM and BAT, which is caused by the low signal-to-noise of the ASM and BAT data and incomplete sampling of the 35-day cycles. The errors in phase were found as data which did not fit the characteristic shape of the 35-day lightcurve. E.g., we found isolated points at high count rate between 35-day phases 0.18 and 0.24, and between 35-day phases 0.6 and 0.645: these were caused by the repeated cycles 3 and 4 in the ASM-BAT table, which were then removed. Another the group of points between 0.63 ϕ 35 0.64 at low count rate ( 5.88 Band b 9.15 ) indicated an adjustment to the 35-day cycle lengths for cycles 97 and 98. The mean adjustment of 1.7 d is consistent with the estimated ASM/BAT measurement error of ∼2 days, estimated by comparing 35-day cycle lengths from BAT with those from ASM (Fig. 8 of [10]).
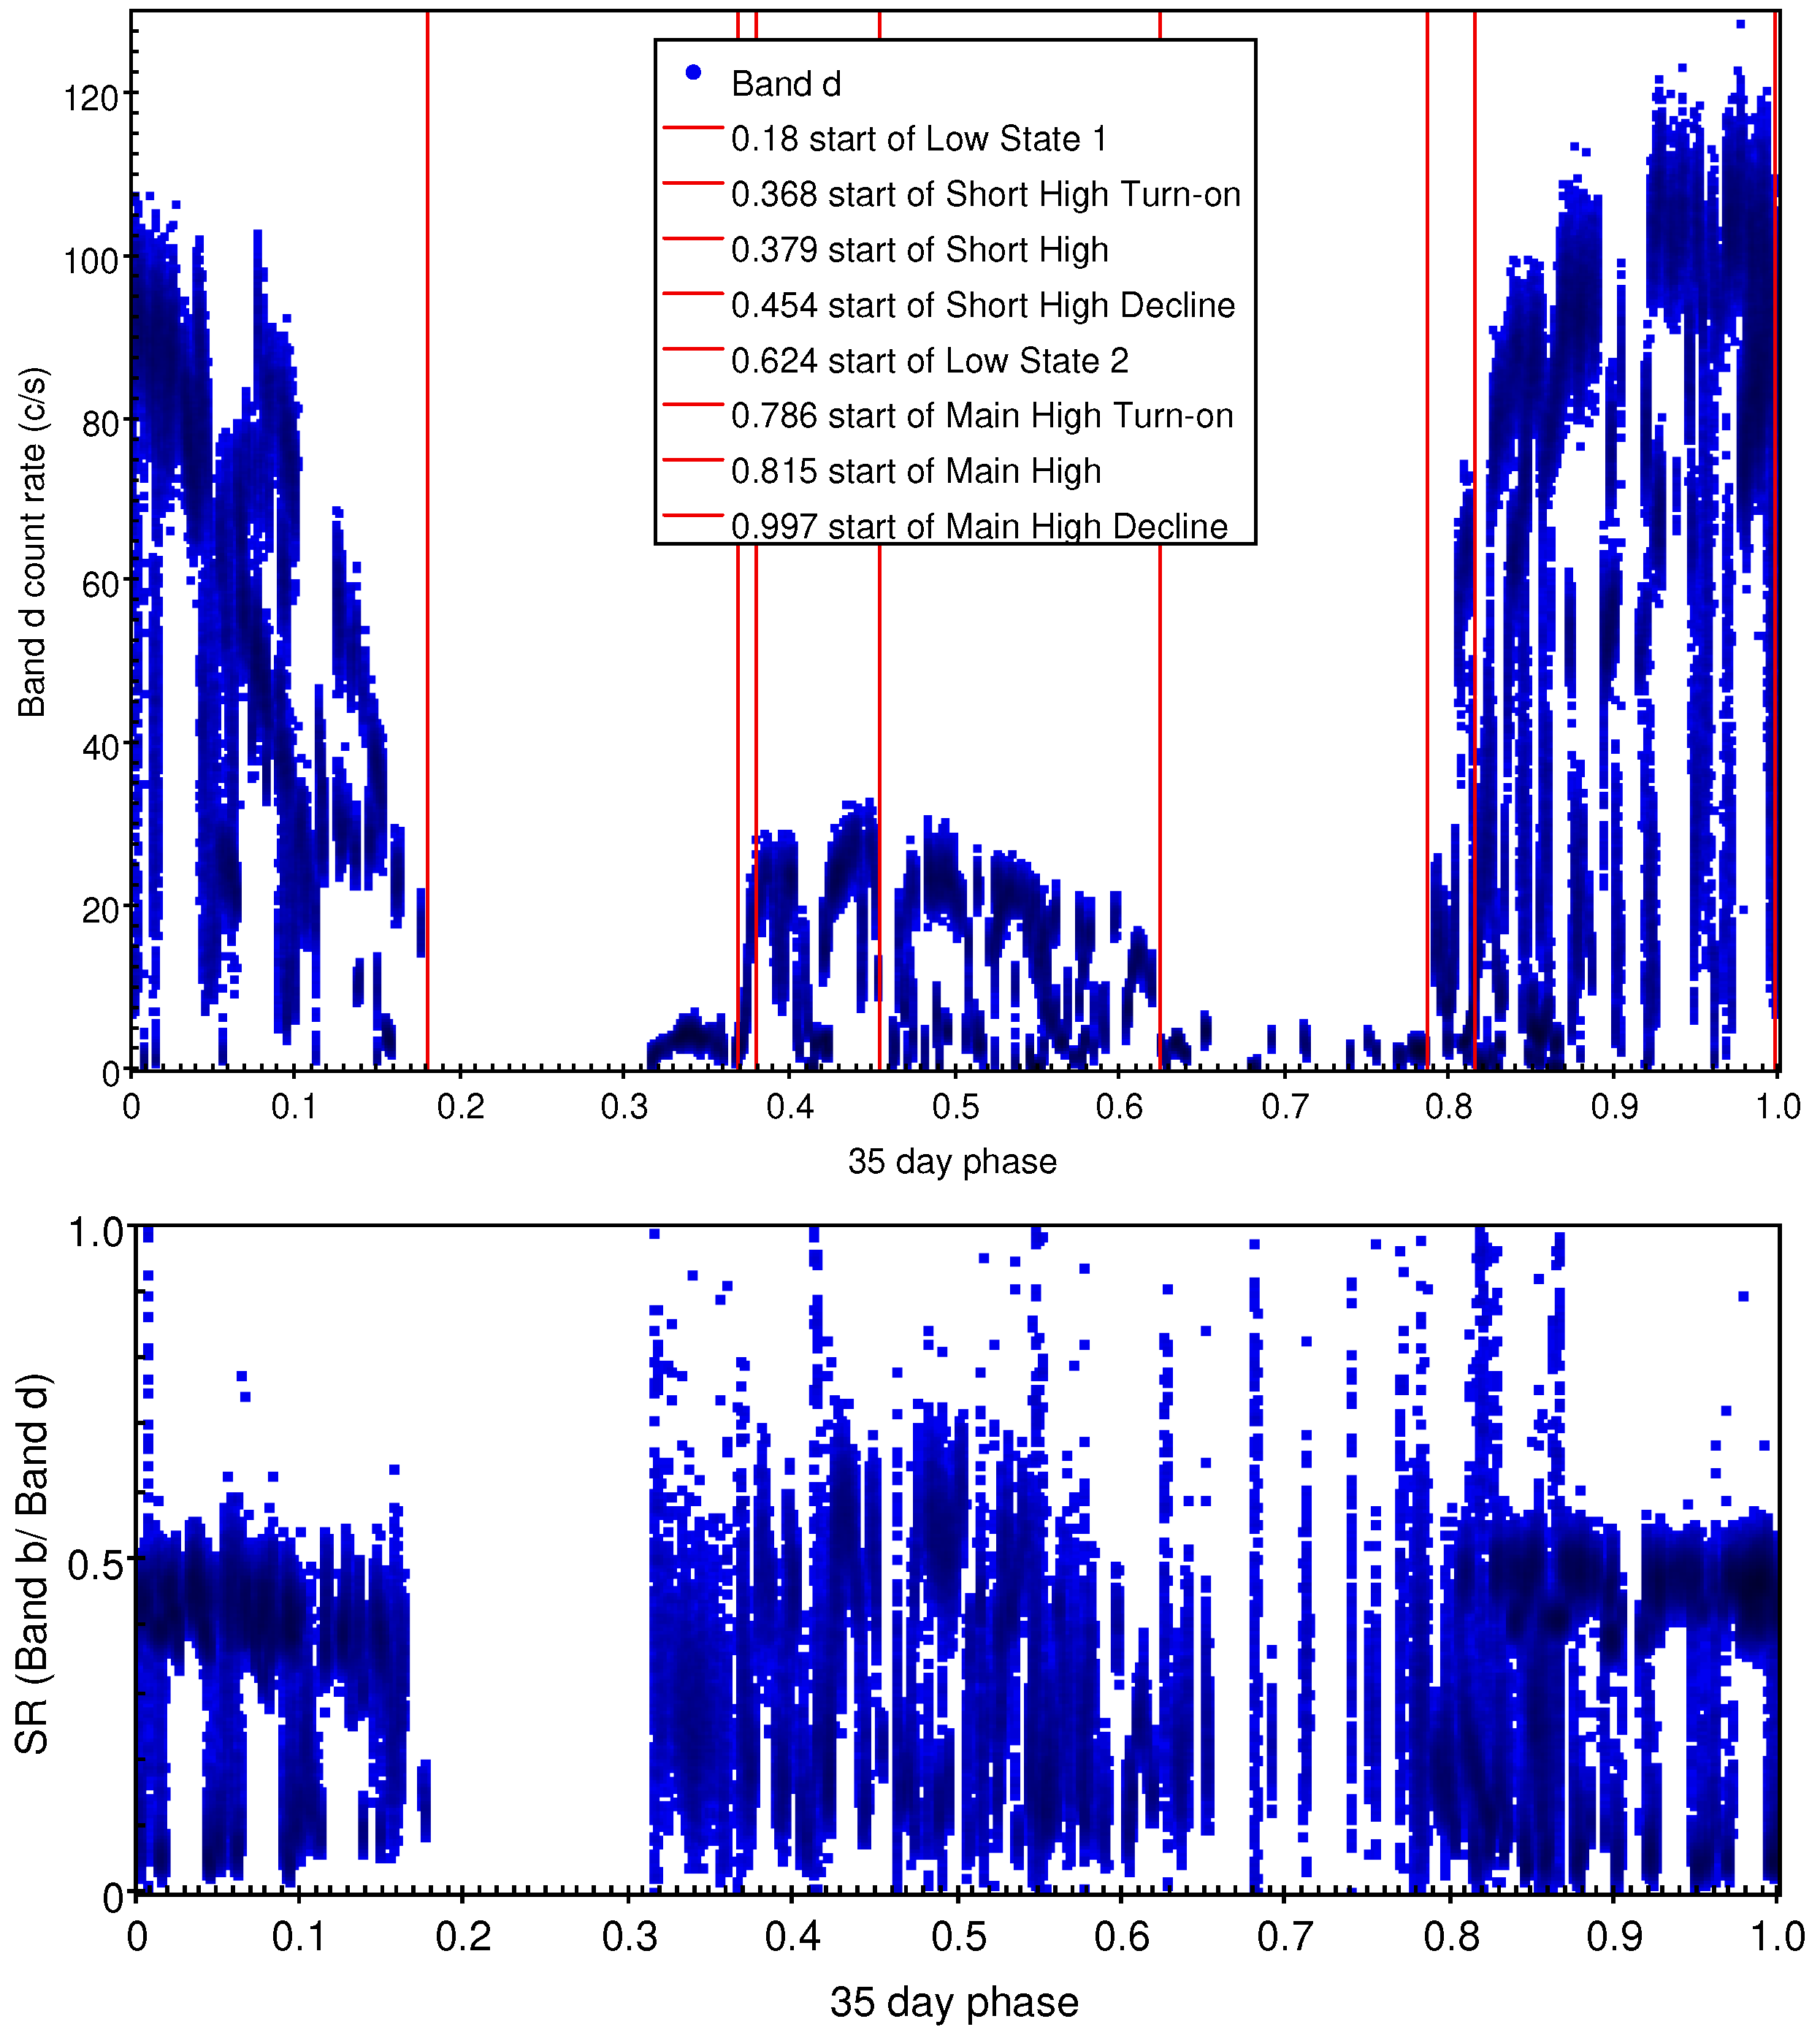
After the adjustments of Table 1, the 35-day lightcurve showed no outlying data. We initially used the 35-day phases for the eight states of the 35-day cycle summarized by [34] (their Table 2). However, with the higher sensitivity of the RXTE/PCA data compared to the ASM or BAT data, we were able to better determine the 35-day phase boundaries of the states. The adjusted 35-day phase boundaries of the states are shown in Table 2. Figure 2 (top panel) shows these phase boundaries as vertical lines. The 35-day lightcurve for the PCA data show a fast turn-on and a slow decline for MH and for SH states. All eight states are better defined by the PCA 35-day lightcurve here compared to the BAT or ASM 35-day lightcurves [10] because of the higher sensitivity of the PCA data and the updated 35-day cycle timing here.

3.1.1. Orbital phase lightcurves

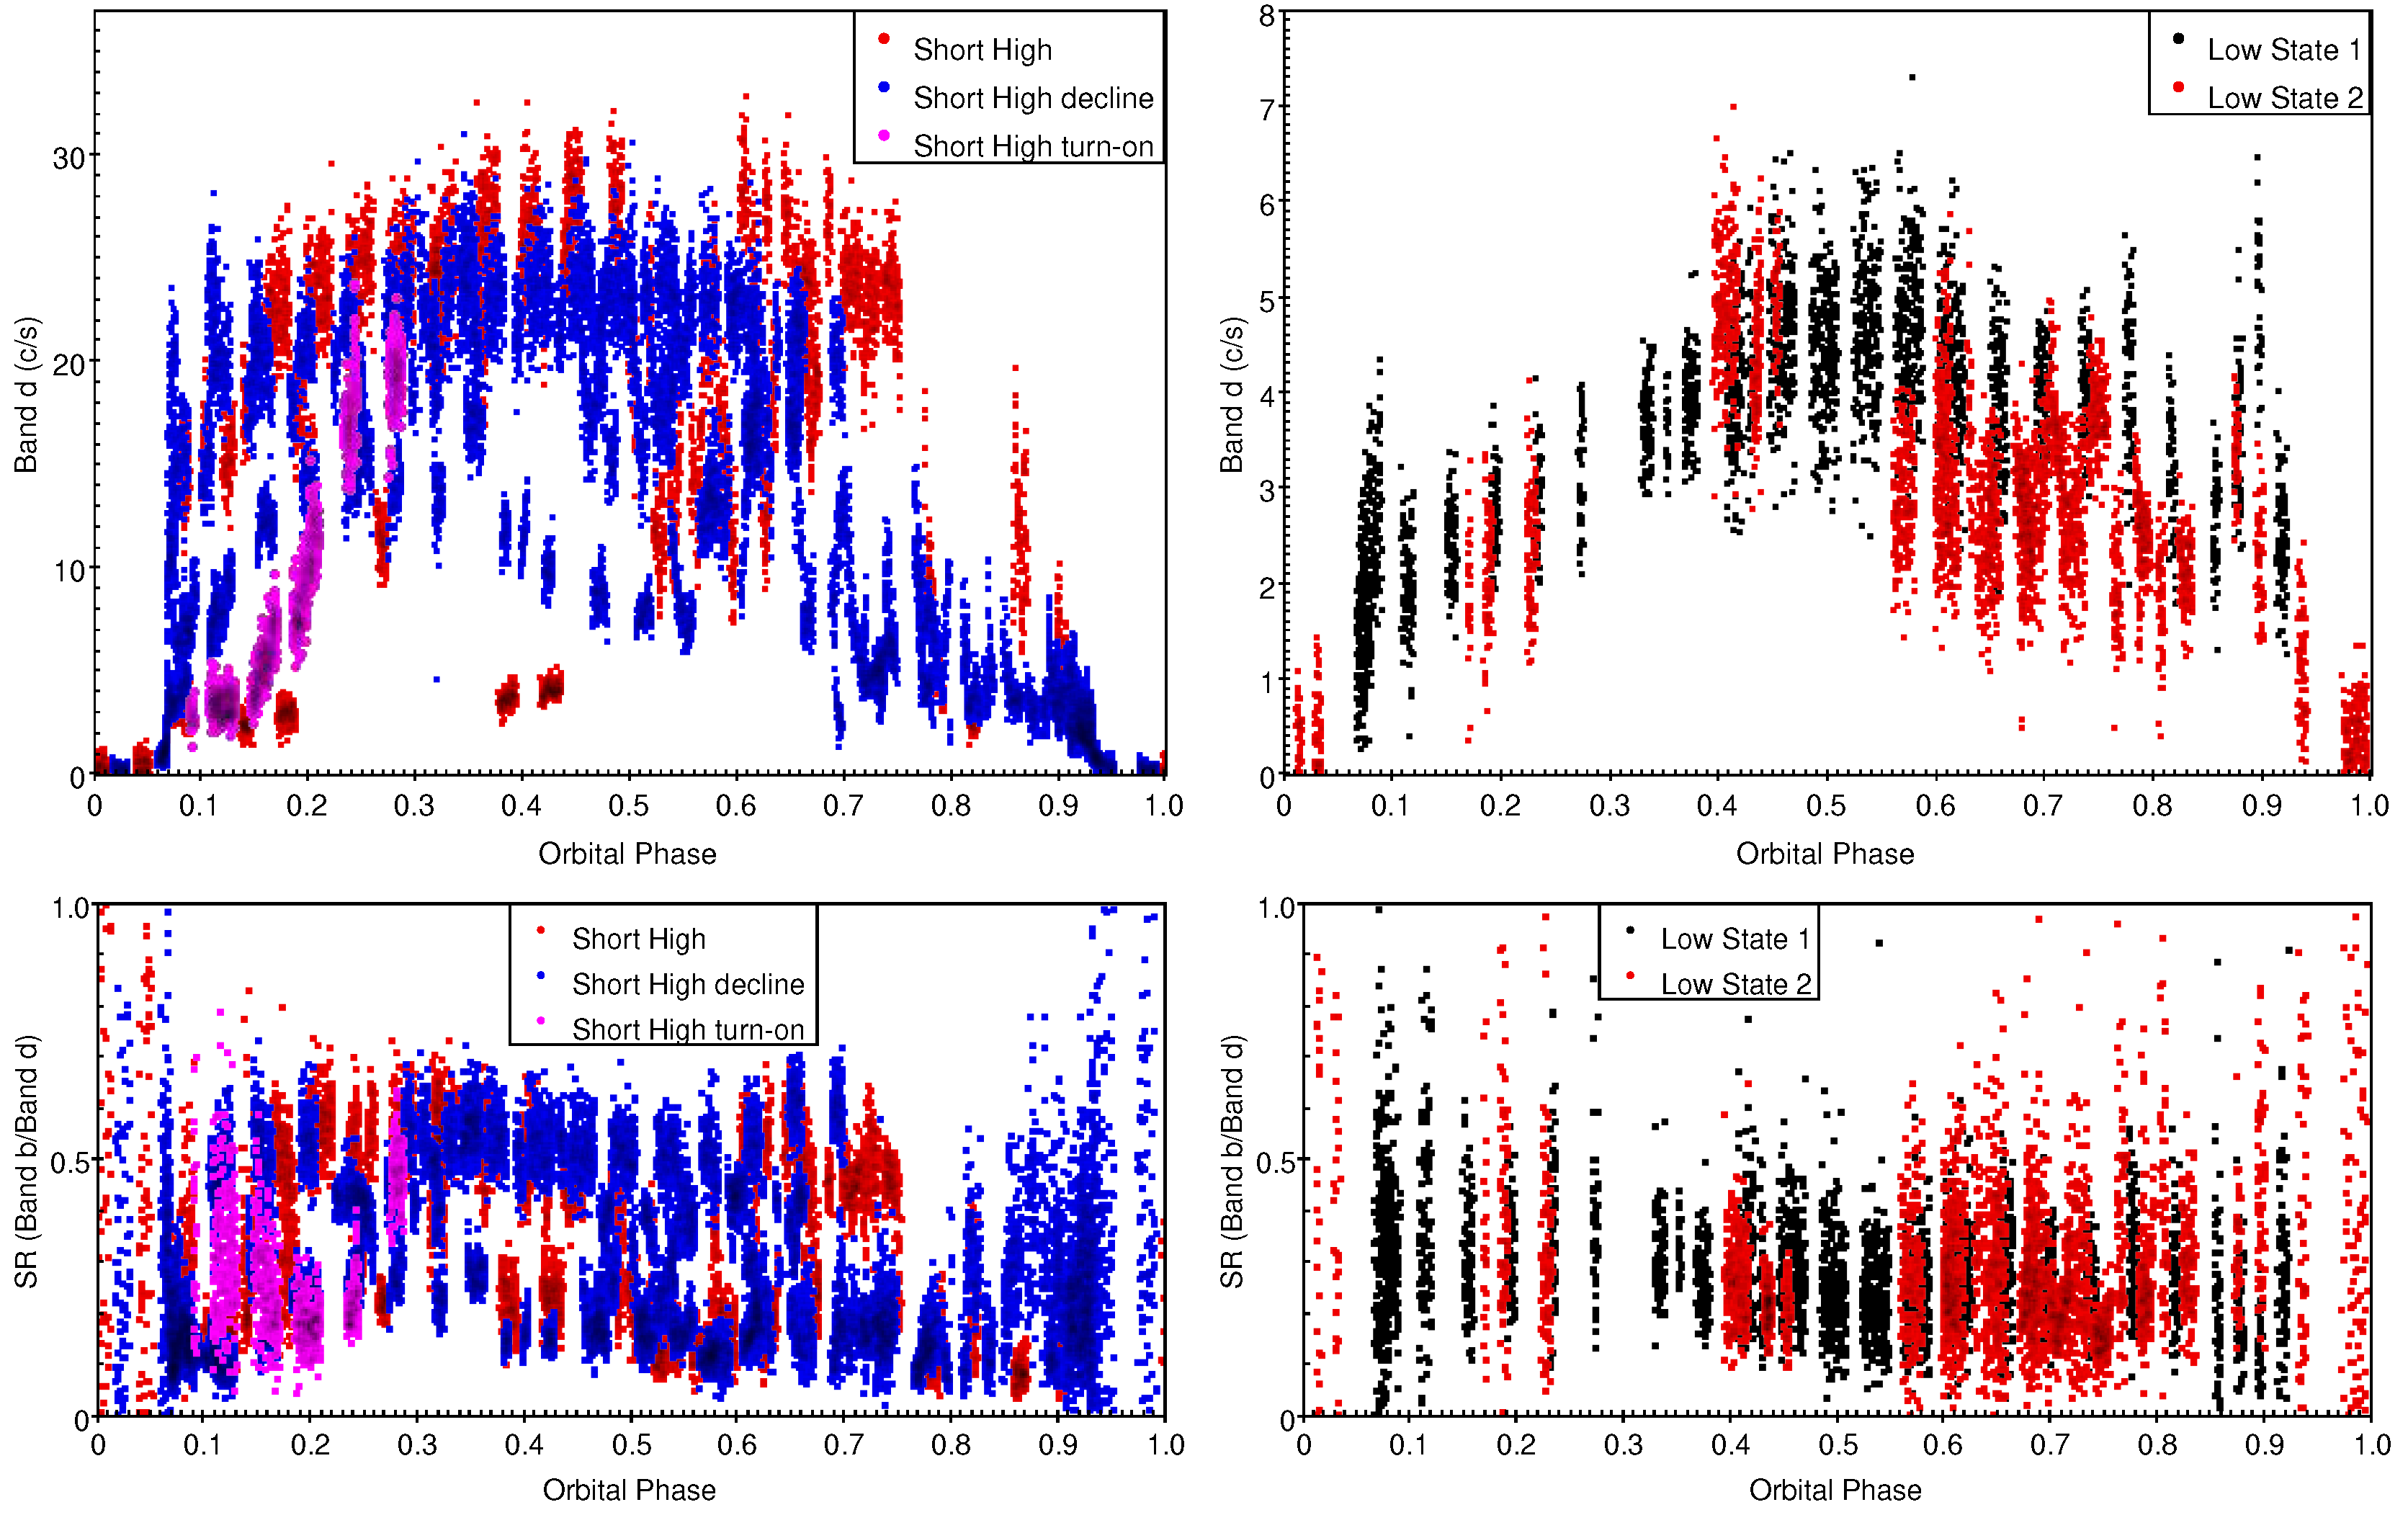
Orbital lightcurves generated for Band d and SR (Band b/ Band d) are shown in Figure 3, for MH and MH turn-on (left panel) and for MH decline (right panel). Band d and SR lightcurves are shown in Figure 4 for SH, SH decline and SH turn-on (left panel), and for LS1 and LS2 (right panel).

3.1.2. Eclipse Lightcurves

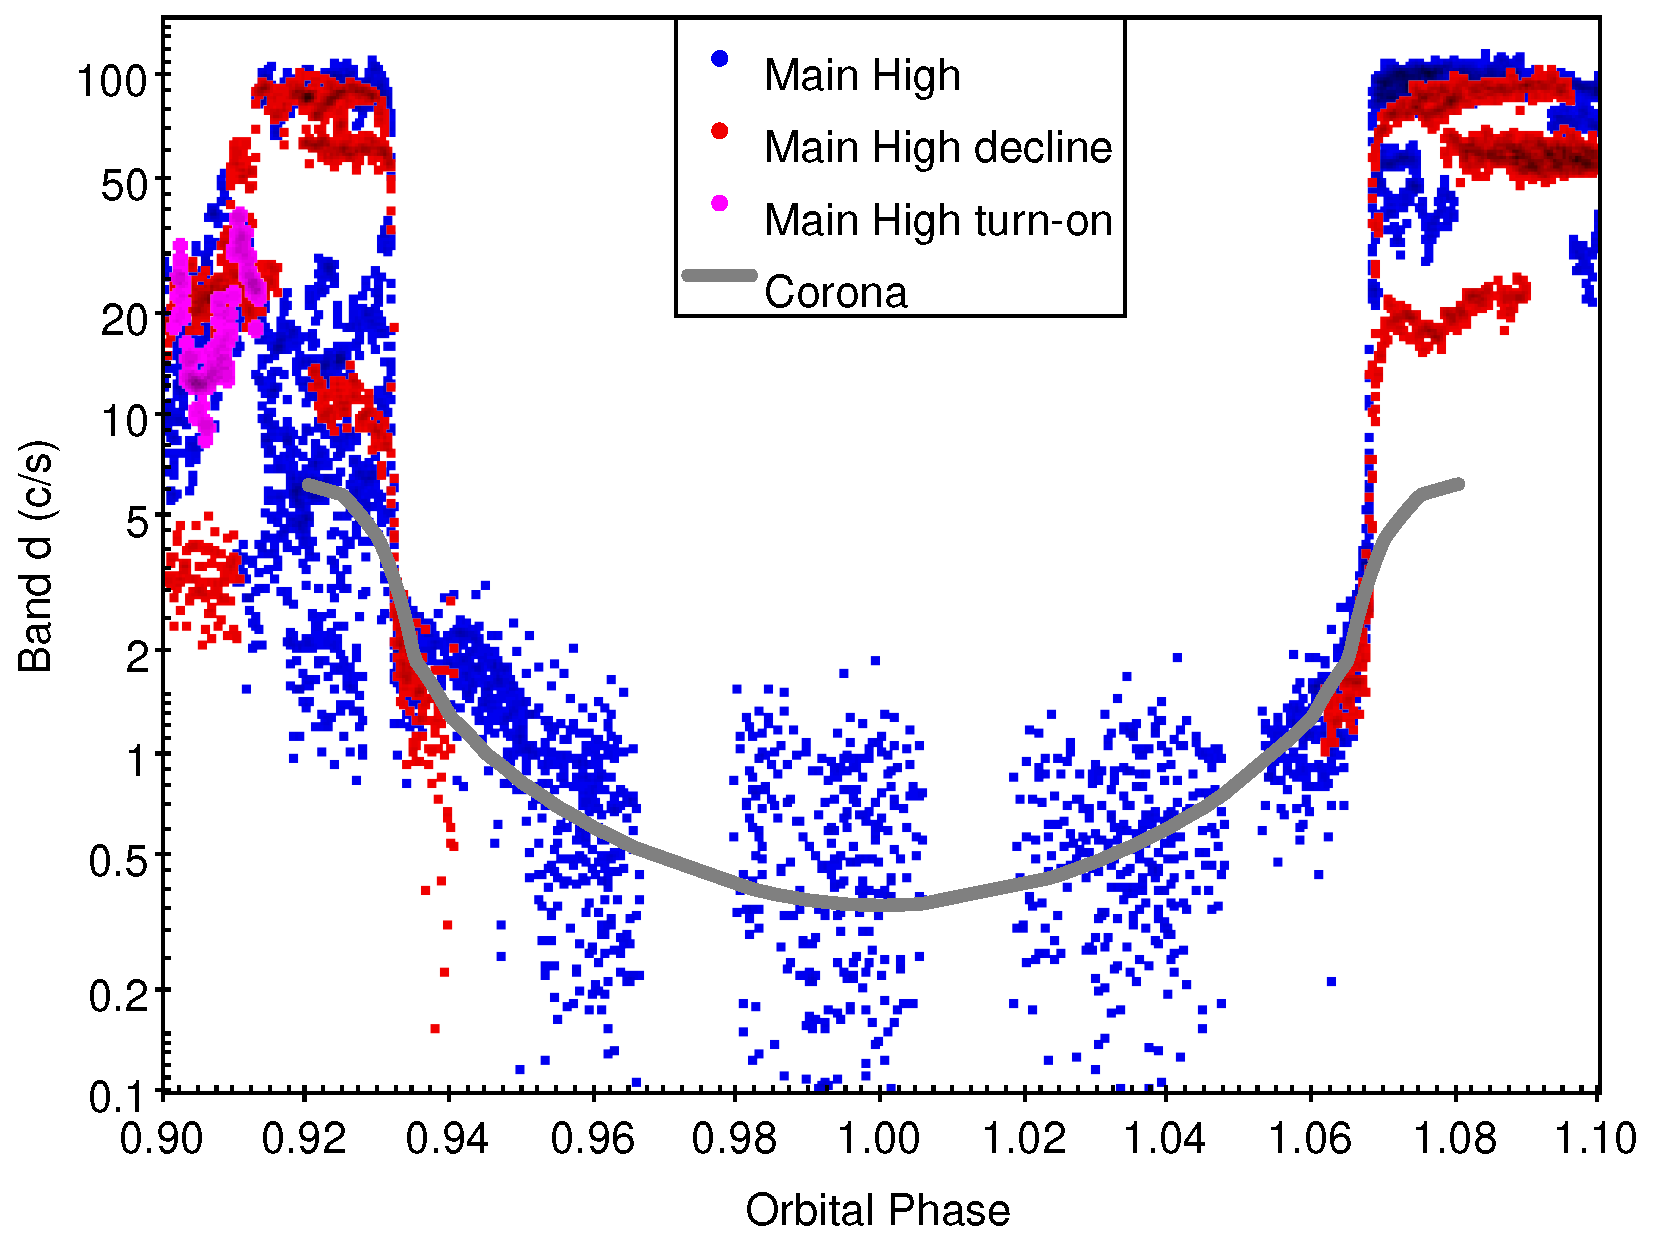
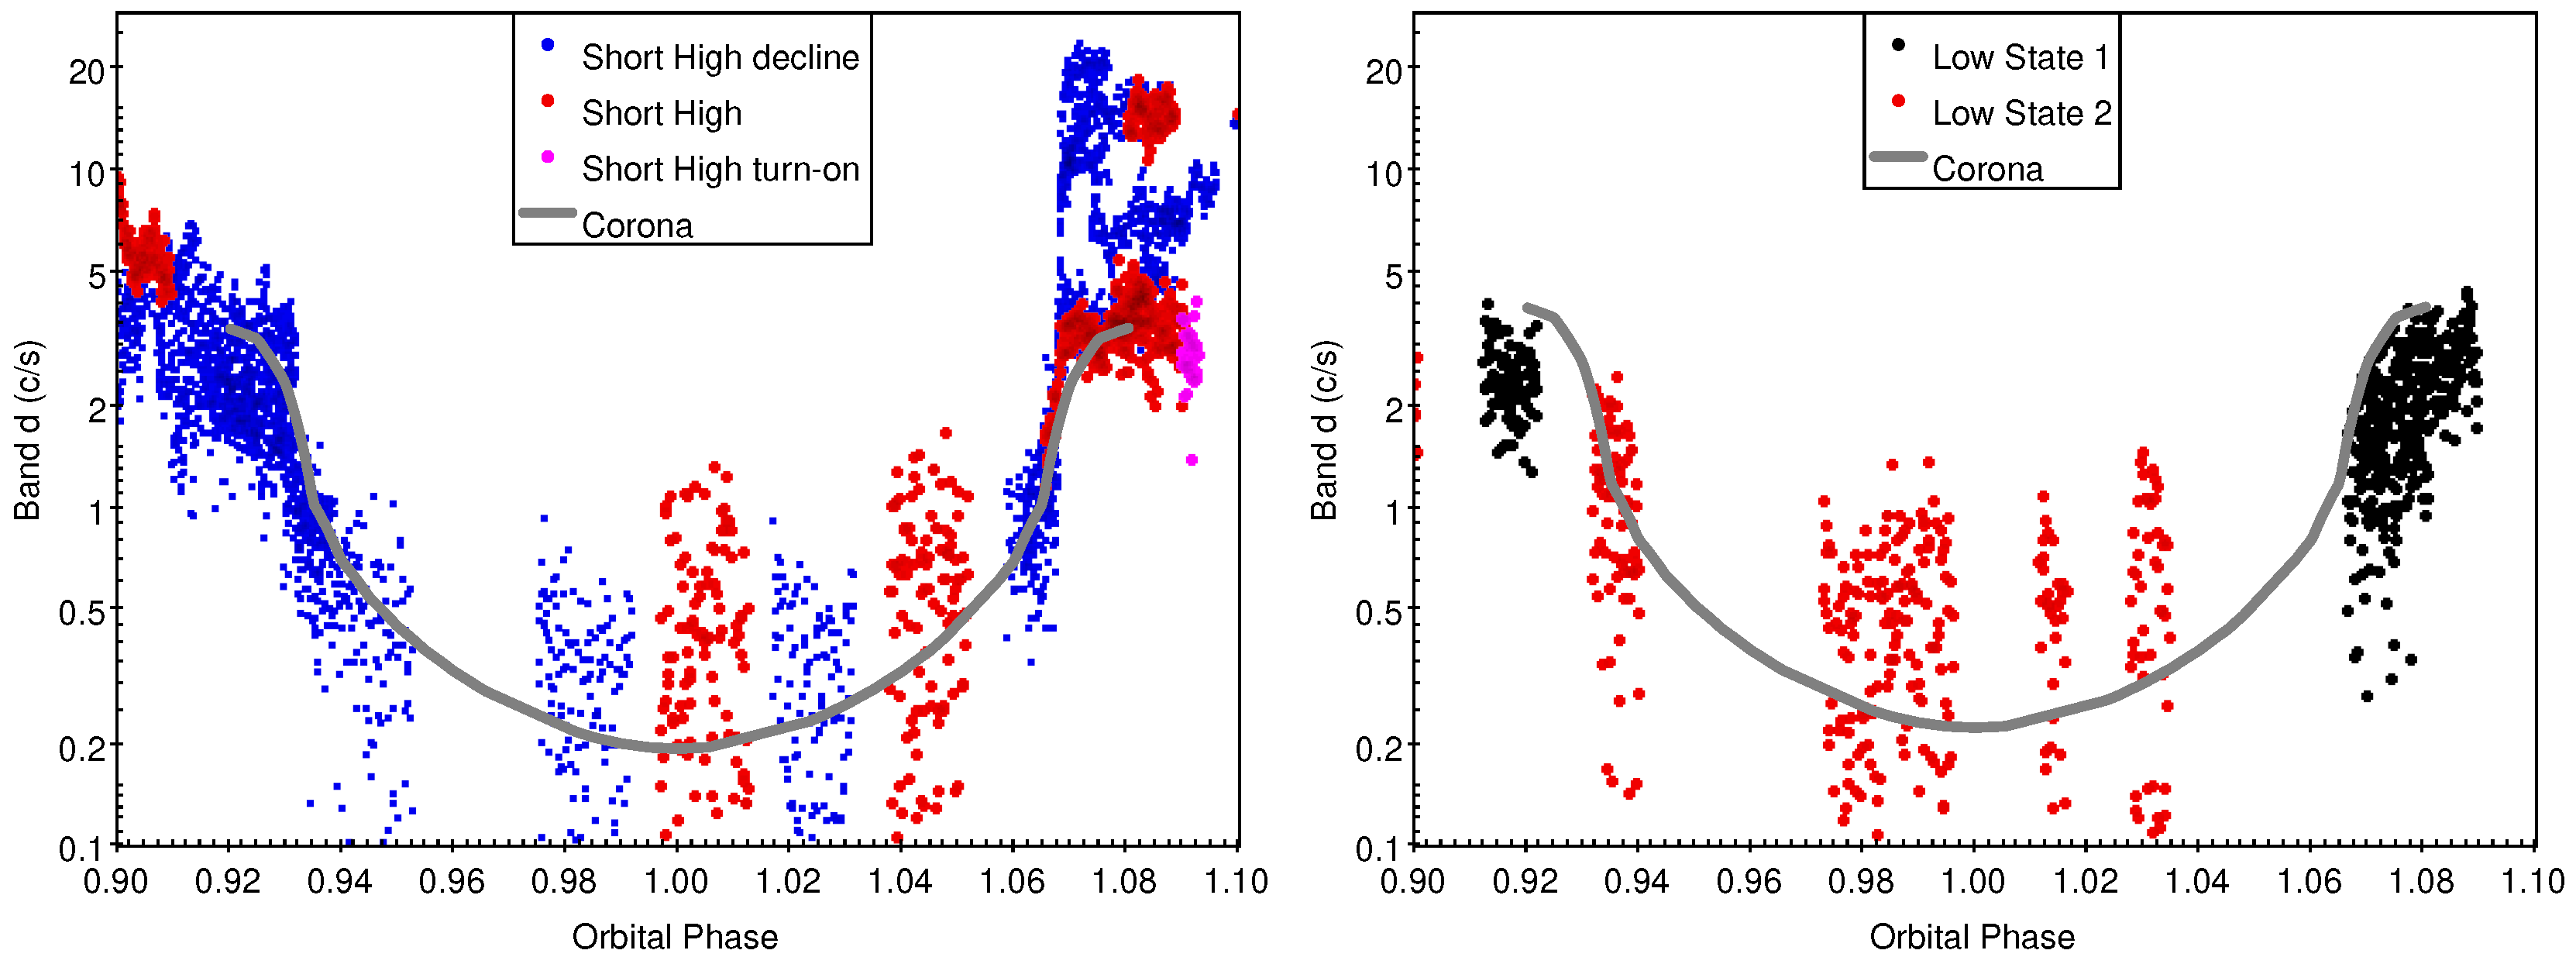
Eclipses during MH are well defined and occur over orbital phases 0 to 0.07 for egress and 0.93 to 1.0 for ingress (e.g. Fig. 1 of [5]). To clearly see the eclipse lightcurves, some data on either side of eclipse is included, i.e. the orbital phases plotted are expanded to 0 to 0.1 and 0.9 to 1.0. 1 was added to the 0.0 to 0.1 orbital phase data to make the phase continuous over eclipse (0.9 to 1.1). Because of the large dynamic range of count rates, the resulting lightcurves are plotted on log scale: Figure 5 shows the eclipse lightcurves in Band d for MH, MH decline and MH turn-on. Figure 6 shows the eclipse lightcurves in Band d for SH, SH decline and SH turn-on (left panel) and for LS1 and LS2 (right panel).

4. Discussion

4.1. 35-Day Phase Lightcurves

The unbinned 35-day lightcurves are shown in the upper panel of Figure 2. The lower panel shows the SR, which indicates absorption by a value ≲0.3 and no absorption by a value ≳0.3. The relation between SR and absorption by dips was demonstrated by [21,23] and absorption by companion eclipse by [35]. The time resolution of the ASM and BAT lightcurves [10] was low enough that most dips are not resolved so that dip and non-dip data are mixed. However the PCA standard products time resolution of 16 s is enough to resolve and separate dip data from non-dip data [21].
The PCA 35-day lightcurve shows numerous dips, consistent with the finding by [9] that for ∼50% of the time Her X-1 shows absorption. After removal of absorbed data with SR < 0.3 , the 35-day lightcurve retains a factor ∼2 variation at any given 35-day phase. This was previously known from the long record of 35-day cycle strengths from ASM and BAT (e.g. Fig.1 of [33] for ASM or Fig.2 of [10] for BAT). The PCA 35-day lightcurve presented here will be a valuable input for models of the 35-day cycle which use the shape to constrain the shape of the accretion disk, similar to the work of [7,11].

4.2. Orbital Lightcurves

A recent study of orbital X-ray lightcurves of Her X-1 was done by [1] using RXTE/ASM, MAXI and Swift/BAT data. They considered the six 35-day states of MH turn-on, MH, MH decline, LS 1, SH combined (SH turn-on, SH and SH decline) and LS 2, then subdivided MH into four pieces (MH-a, MH-b, MH-c and MH-d) for study of the main dip progression with 35-day phase. With the low sensitivity of ASM, MAXI and BAT data and the long-term observations, the orbital lightcurves were created using binned data. The PCA data analysed here has much higher sensitivity (factor of ≳10 smaller errors). This allowed creation of PCA lightcurves for the eight 35-day states using unbinned data, which reveals the dips and the variability of Her X-1 at each orbital phase.
The MAXI, BAT and ASM lightcurves from [1] (their Fig.1 and Fig. A1) are significantly different between their six states, but agree well with our PCA lightcurves (Figure 3 and Figure 4) for those same states. In particular, for MH the lightcurve is nearly flat-topped except near eclipse egress and for dips after orbital phase ∼0.75. The better time resolution and sensitivity of the PCA data show that MH has a rapid rise at egress and that the bump at orbital phase 0.9 is caused by a mixture of un-absorbed data with absorbed data. For MH turn-on, the BAT/MAXI/ASM lightcurves show two maxima at orbital phases 0.3 and 0.8, however the PCA data shows only a single maximum at orbital phase 0.8. This is likely caused by the incomplete coverage of different 35-day cycles by the PCA, so it missed catching MH turn-ons near orbital phase 0.3. MH decline for the BAT/MAXI/ASM lightcurves has a dip at orbital phase 0.4 which is seen in the PCA MH decline lightcurve (Figure 3).
For SH, the PCA lightcurve has a smooth maximum near orbital phase 0.4 similar to that seen in the BAT/MAXI/ASM lightcurves. For the BAT/MAXI/ASM SH lightcurves, late orbital phases (≳0.5) are quite weak. The PCA SH lightcurves show that this is caused by the much higher occurence rate of dips after orbital phase 0.5 ((c) of Figure 4). The LS 1 and 2 lightcurves show clear modulation in the PCA data not seen in the BAT/MAXI/ASM SH data, because of the lower sensitivity and larger background uncertainties for the latter. Overall, given the limitations of the data (low sensitivity for BAT/MAXI/ASM, and incomplete coverage for PCA) the lightcurves agree very well and exhibit features which are consistent between the different sets of data.

4.3. Eclipse Lightcurves

A main new result is that eclipse lightcurves (Figure 5 and Figure 6) have now been produced for other states than MH, including MH decline, SH, SH decline and the Low States 1 and 2. The evidence for a bowl-shaped eclipse, previously known for MH only, is now demonstrated for these other states. The evidence is clear for MH and SH states, and less clear for the Low States, because of incomplete observations. Future observations of eclipses with other instruments, such as those on the AstroSat satellite, could confirm the bowl-shaped eclipses for the Low States.
Ref. [29] analyzed binned data for MH eclipses using a corona model. The bowl-shaped eclipse is evidence for an extended electron scattering corona in the binary system: it has to be larger than the companion star HZ Her, in order to yield residual X-ray flux at mid-eclipse. The unbinned eclipse data presented here in Figure 5 shows that the lower pre-ingress flux than post-egress flux for MH is caused by more numerous dips in the pre-ingress period than in the post-egress period, rather than a different flux emitted by the neutron star.
The corona model from [29] was fit to the new eclipse lightcurves here for states with enough data: MH, MH decline, SH, SH decline, and the combined data from Low States 1 and 2. The phase interval from post-stellar ingress (0.932) to pre-stellar-egress (1.068) was fit using χ 2 minimization with normalization C as the single fit parameter. The corona model lightcurves (without companion ingress and egress models) are shown in Figure 5 and Figure 6. Table 3 shows the results of the fits, with C, χ 2 and χ 2 / d o f values, where d o f means degrees of freedom.
Ref. [29] (their Figure 4) shows an excess at orbital phase 0.94 above the coronal model best fit for MH eclipse. We verify the excess here for MH: the fit of the coronal model to data not including the excess region (orbital phase 0.935 to 0.96) is a significant improvement over the fit to data including the excess region (see comparison of `MH’ and `MH no excess’ fits in Table 3, decrease in χ 2 of 940 for a decrease of 531 in d o f ). For the other states, the data are too sparse to determine if there is an excess at similar or other orbital phase during eclipse. The proposed explanation of the excess is scattered X-rays from the accretion stream. The changing geometry of the accretion stream and its impact site on the accretion disk surface, described by the model of [17], implies that the excess should change its orbital phase with 35-day cycle phase. More complete observation of eclipses for different 35-day phases are required in order to test this.
Table 3 shows that the normalization of the corona, C, is similar for MH (no excess) and MH decline but significantly lower for SH and SH decline. Interestingly the normalization for LS is slightly larger than for SH. Some change in normalization of intensity from the corona is expected because the changing orientation of the accretion disk implies changing visibility of the inner regions of the corona. More complete observations of the eclipses would enable testing the shape of the corona by applying a model for the partial eclipse of the corona by the rotating accretion disk shape (Figure 1).

4.4. Absorption Dips and No-Absorption Dips

As noted above, absorption dips are identified by a drop in SR simultaneous with a drop in count rate, whereas no-absorption dips will have no change in SR when count rate drops. To identify both types of dips, SR vs. count rate was examined for each state. Eclipses (orbital phases 0.0 to 0.07 and 0.93 to 1.0) were filtered out of the data prior to the search.
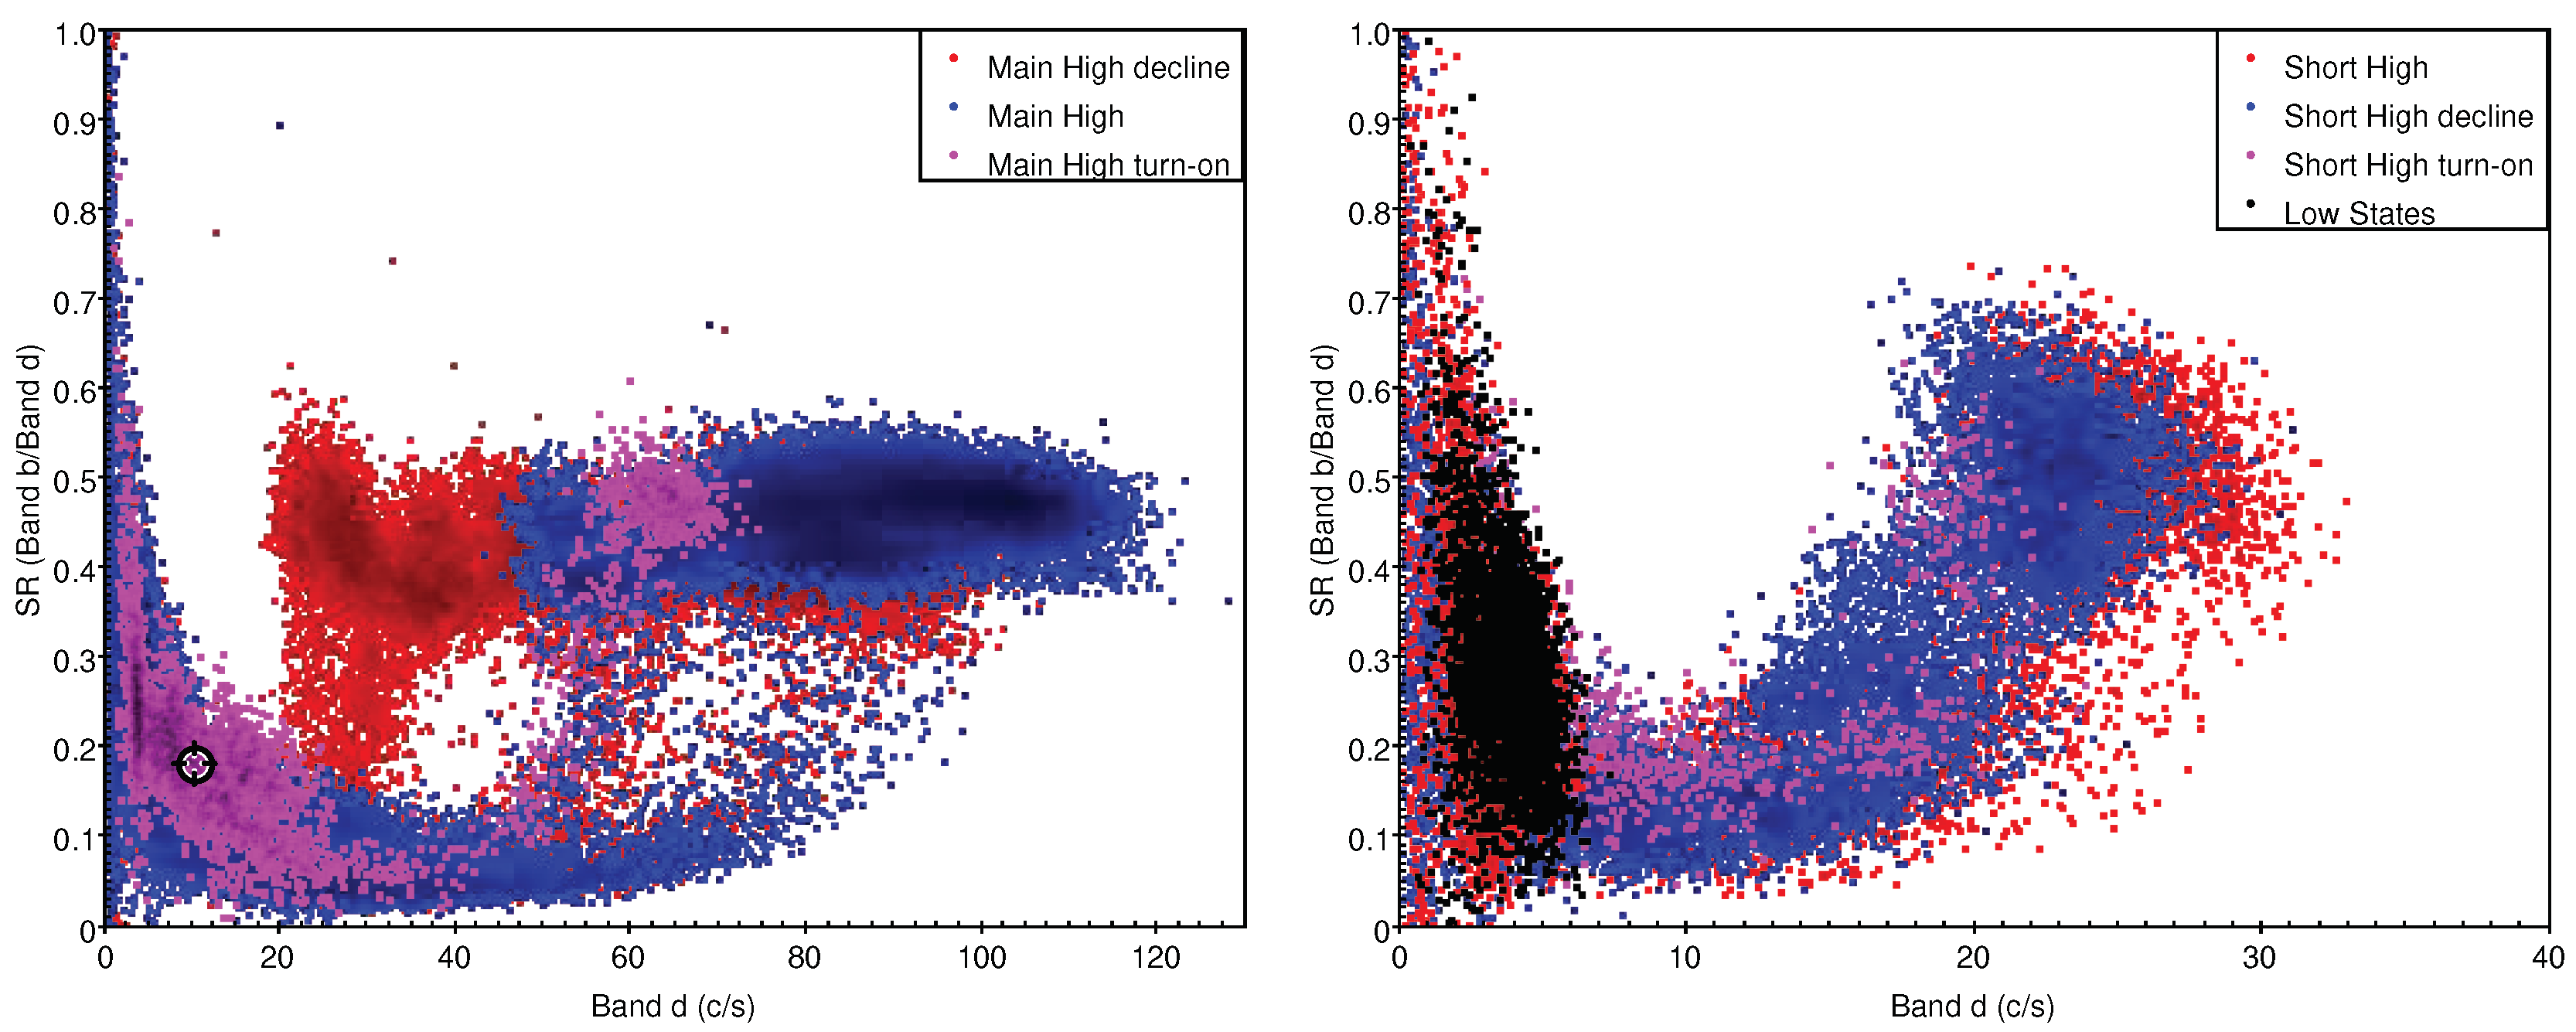
Figure 7 (left panel) shows the resulting SR vs. band d count rate for the MH turn-on, MH and MH decline (with the MH turn-on points overplotted on the MH points, overplotted on the MH decline points, in order to see the three sets better; the MH decline points cover the entire region under the MH points). Absorption dips are seen by the sharp decrease in SR for the points below the main cluster of non-absorbed data which lies between SR of 0.4 and 0.5. Although there are small decreases in count rate without decreases in SR (without absorption) within the main cluster of points, there are no deep drops in count rate without a drop in SR. I.e., we don’t find any no-absorption dips in the MH states.
The right panel of Figure 7 shows SR vs. band d count rate for the LS (combined), SH turn-on, SH decline and SH (with the LS points plotted on top, then SH turn-on, then SH decline, and SH underneath). Absorption dips in the three SH states are identified by the drop in SR below 0.3 accompanying a drop in band d count rate. For the SH states the proportion of data which shows absorption is ∼70%, in contrast to the MH states with a proportion of data with absorption of ∼30%., in agreement with [36]. The errors in SR for LS points (and all other points with count rate ≲6) are large enough that absorption (or its absence) cannot be identified.
The previous report of no-absorption dips by [27] used 5-9 and 9-20 keV bands from Large Area X-ray Proportional Counter (LAXPC) on Astrosat. To compare more closely to that analysis we analysed SR vs count rate with SR given by PCA Bands c (4-9 keV) and d (9-20 keV). Using S R = B a n d c / B a n d d yields absorption dips following a nearly linear decrease of SR with count rate, in agreement with [27] (their Fig.7) instead of the curved trajectory of points for S R = b a n d B / B a n d d as seen in Figure 7 here. However, we did not find any no-absorption dips in the PCA data.
In summary, we did not find any no-absorption dips in our thorough search. We checked two different definitions of SR, and searched all three MH states and all three SH states in the entire RXTE/PCA archive of observations of Her X-1. The AstroSat collaboration has updated the LAXPC data processing software including a new background model (see https://www.tifr.res.in/astrosat_laxpc/LaxpcSoft.html). Thus it is possible that the detection of no-absorption dips by [27] was caused by erros in background subtraction using the older data analysis package.

5. Conclusions

We report an analysis of the entire archive of Standard 2 data on Her X-1 collected by the RXTE/PCA instrument to generate lightcurves for 35-day phase, orbital phase and eclipses. The start times and lengths of the 35-day cycles observed by PCA were updated from initial values derived from RXTE/ASM and Swift/BAT observations [10] to be consistent with the PCA data. Using the higher sensitivity 35-day lightcurve from PCA, the boundaries of the eight states of the 35-day cycle (i.e. MH turn-on, MH, MH decline, LS 1, SH turn-on, SH, SH decline and LS 2) were refined, and the boundaries of the ALS were adjusted to be more accurate. For MH a rapid turn-on is seen followed by a slower rise to peak and an even slower decline. SH follows the same pattern but with a peak at 25 % of the MH peak. Absorption dips are present throughout the MH and SH states, and more prevalent during SH. The orbital lightcurves for the different 35-day states show a progression of changes with 35-day phase similar to those demonstrated in ASM and BAT data [1,13], but with clear indentification of the importance of dips on the lightcurves, using SR. The data coverage of the LS states is incomplete and will require observations with newer X-ray instruments.
Eclipse lightcurves of Her X-1 were generated for the different 35-day states, and show that the bowl-shape during eclipse is present for all states. The PCA data show that the extended scattering corona, found during MH [29], is present for the entire 35-day cycle. The scattered intensity from the corona changes only moderately (∼30%, Table 3) with 35-day phase, which is consistent with a corona larger than the accretion disk, which is partially blocked by the disk as the disk rotates with 35-day phase.
A search for dips using the 2-5, 5-9 and 9-20 keV PCA data (bands b, c and d) was carried out. The standard absorption dips were found. However we did not find any no-absorption dips similar to those reported by [27] in any of the MH or SH states in the entire PCA archive of Her X-1 data. Because the sensitivity of RXTE/PCA is similar to that of AstroSat/LAXPC, any no-absorption dips observed should have been detected. In future work the LAXPC data can be reanalysed with the updated LAXPC analysis software and updated background model. If the no-absorption dips are verified in LAXPC data, then these must be a rare phenomenon not detected by the PCA instrument.

Author Contributions

Conceptualization, D.L.; methodology, D.L.; software, S.G.E.; analysis D.L. and S.G.E.; writing D.L. and S.G.E. All authors have read and agreed to the published version of the manuscript.

Funding

This research was funded by the Natural Sciences and Engineering Research Council of Canada and Mitacs Globalink. The APC was funded by the Natural Sciences and Engineering Research Council of Canada.

Data Availability Statement

The publicly archived dataset analyzed during the study is available at https://heasarc.gsfc.nasa.gov/docs/xte/xtegof.html.

Conflicts of Interest

The authors declare no conflict of interest. The funders had no role in the design of the study; in the collection, analyses, or interpretation of data; in the writing of the manuscript; or in the decision to publish the results.

Abbreviations

The following abbreviations are used in this manuscript:
MDPI Multidisciplinary Digital Publishing Institute

References

  1. Wang, Y.; Leahy, D. The Evolution of the Orbital Lightcurve of Hercules X-1 with 35 Day Phase. ApJ 2022, 927, 143. [Google Scholar] [CrossRef]
  2. Ji, L.; Schulz, N.; Nowak, M.; Marshall, H. L.; Kallman, T. The Photoionized Accretion Disk in Her X-1. ApJ 2009, 700, 977–988. [Google Scholar] [CrossRef]
  3. Klochkov, D.; Staubert, R.; Postnov, K.; Shakura, N.; Santangelo, A. Continuous monitoring of pulse period variations in Hercules X-1 using Swift/BAT. A&A 2009, 506, 1261–1267. [Google Scholar]
  4. Staubert, R.; Klochkov, D.; Wilms, J. Updating the orbital ephemeris of Hercules X-1; rate of decay and eccentricity of the orbit. A&A 2009, 500, 883–889. [Google Scholar]
  5. Leahy, D. A.; Abdallah, M. H. HZ Her: Stellar Radius from X-Ray Eclipse Observations, Evolutionary State, and a New Distance. ApJ 2014, 793, 79. [Google Scholar] [CrossRef]
  6. Reynolds, A. P.; Quaintrell, H.; Still, M. D.; Roche, P.; Chakrabarty, D.; Levine, S. E. A new mass estimate for Hercules X-1. MNRAS 1997, 288, 43–52. [Google Scholar] [CrossRef]
  7. Leahy, D. A.; Postma, J.; Chen, Y. AstroSat UVIT Observations of Her X-1. ApJ 2020, 889, 131. [Google Scholar] [CrossRef]
  8. Leahy, D. A. Modelling the extreme ultraviolet emission during the low state of Hercules X-1. MNRAS 2003, 342, 446–452. [Google Scholar] [CrossRef]
  9. Leahy, D. A.; Igna, C. The Light Curve of Hercules X-1 as Observed by the Rossi X-Ray Timing Explorer. ApJ 2011, 736, 74. [Google Scholar] [CrossRef]
  10. Leahy, D.; Wang, Y. Swift/BAT and RXTE/ASM Observations of the 35 day X-Ray Cycle of Hercules X-1. ApJ 2020, 902, 146. [Google Scholar] [CrossRef]
  11. Leahy, D. A. Modelling RXTE/ASM observations of the 35-d cycle in Her X-1. MNRAS 2002, 334, 847–854. [Google Scholar] [CrossRef]
  12. Scott, D. M.; Leahy, D. A.; Wilson, R. B. The 35 Day Evolution of the Hercules X-1 Pulse Profile: Evidence for a Resolved Inner Disk Occultation of the Neutron Star. ApJ 2000, 539, 392–412. [Google Scholar] [CrossRef]
  13. Scott, D. M.; Leahy, D. A. Rossi X-Ray Timing Explorer All-Sky Monitor Observations of the 35 Day Cycle of Hercules X-1. ApJ 1999, 510, 974–985. [Google Scholar] [CrossRef]
  14. Vrtilek, S. D.; Quaintrell, H.; Boroson, B.; Still, M.; Fiedler, H.; O’Brien, K.; McCray, R. Multiwavelength Studies of Hercules X-1 during Short High and Anomalous Low States: On-again, Off-again. ApJ 2001, 549, 522–536. [Google Scholar] [CrossRef]
  15. Parmar, A. N.; Pietsch, W.; McKechnie, S.; White, N. E.; Truemper, J.; Voges, W.; Barr, P. An extended X-ray low state from Hercules X-1. Nature 1985, 313, 119–121. [Google Scholar] [CrossRef]
  16. Leahy, D. A.; Dupuis, J. Extreme Ultraviolet Explorer Observations of Hercules X-1 over a 35 Day Cycle. ApJ 2010, 715, 897–901. [Google Scholar] [CrossRef]
  17. Igna, C. D.; Leahy, D. A. Light-curve dip production through accretion stream-accretion disc impact in the HZ Her/Her X-1 binary star system. MNRAS 2012, 425, 8–20. [Google Scholar] [CrossRef]
  18. Lubow, S. H.; Shu, F. H. Gas dynamics of semidetached binaries. ApJ 1975, 198, 383–405. [Google Scholar] [CrossRef]
  19. Becker, P. A.; Wolff, M. T. Thermal and Bulk Comptonization in Accretion-powered X-Ray Pulsars. ApJ 2007, 654, 435–457. [Google Scholar] [CrossRef]
  20. Leahy, D. A. An accretion column model for the accreting pulsar Her X-1. MNRAS 2004, 348, 932–936. [Google Scholar] [CrossRef]
  21. Igna, C. D.; Leahy, D. A. Hercules X-1’s light-curve dips as seen by the RXTE/PCA: a study of the entire 1996 February-2005 August light curve. MNRAS 2011, 418, 2283–2291. [Google Scholar] [CrossRef]
  22. Crosa, L.; Boynton, P. E. Periodic mass transfer in HER X-1/ HZ Her. ApJ 1980, 235, 999–1015. [Google Scholar] [CrossRef]
  23. Leahy, D. A.; Yoshida, A.; Matsuoka, M. Spectral Evolution during Pre-Eclipse Dips in Hercules X-1. ApJ 1994, 434, 341. [Google Scholar] [CrossRef]
  24. Ushimaru, N.; Tawara, Y.; Koyama, K.; Hayakawa, S.; Kii, T.; Nagase, F.; Ohashi, T.; Makishima, K. Energy spectra and pulse profiles of Hercules X-1 at pre-eclipse dips. PASJ 1989, 41, 441–452. [Google Scholar]
  25. Krimm, H. A.; Holland, S. T.; Corbet, R. H. D.; Pearlman, A. B.; Romano, P.; Kennea, J. A.; Bloom, J. S.; Barthelmy, S. D.; Baumgartner, W. H.; Cummings, J. R.; Gehrels, N.; et al. The Swift/BAT Hard X-Ray Transient Monitor. ApJS 2013, 209, 14. [Google Scholar] [CrossRef]
  26. Matsuoka, M.; Kawasaki, K.; Ueno, S.; Tomida, H.; Kohama, M.; Suzuki, M.; Adachi, Y.; Ishikawa, M.; Mihara, T.; Sugizaki, M.; et al. The MAXI Mission on the ISS: Science and Instruments for Monitoring All-Sky X-Ray Images. PASJ 2009, 61, 999. [Google Scholar] [CrossRef]
  27. Leahy, D. A.; Chen, Y. Results from AstroSat LAXPC observations of Hercules X-1 (Her X-1). A&A 2021, 42, 44. [Google Scholar]
  28. Singh, K. P.; Tandon, S. N.; Agrawal, P. C.; Antia, H. M.; Manchanda, R. K.; Yadav, J. S.; Seetha, S.; Ramadevi, M. C.; Rao, A. R.; Bhattacharya, D.; et al. ASTROSAT mission. In Space Telescopes and Instrumentation 2014: Ultraviolet to Gamma Ray, Proceedings of the SPIE 9144, 2014.
  29. Leahy, D. A. Hercules X-1: Using Eclipse to Measure the X-Ray Corona. ApJ 2015, 800, 32. [Google Scholar] [CrossRef]
  30. Jahoda, K.; Swank, J. H.; Giles, A. B.; Stark, M. J.; Strohmayer, T.; Zhang, W.; Morgan, E. H. In-orbit performance and calibration of the Rossi X-ray Timing Explorer (RXTE) Proportional Counter Array (PCA). In EUV, X-Ray, and Gamma-Ray Instrumentation for Astronomy VII, Proceedings of the SPIE 2808, October 1996; pp. 59–70.
  31. Gruber, D. E.; Blanco, P. R.; Heindl, W. A. , Pelling, M. R., Rothschild, R. E., Hink, P. L. The high energy X-ray timing experiment on XTE. A&AS 1996, 120, 641–644. [Google Scholar]
  32. Remillard, R. A.; Levine, A. M. The RXTE All Sky Monitor: First Year of Performance. In Proceedings of All-Sky X-Ray Observations in the Next Decade, Riken, Tokio, Japan, 1997; p 29.
  33. Leahy, D. A.; Igna, C. D. RXTE-based 35 Day Cycle Turn-on Times for Hercules X-1. ApJ 2010, 713, 318–324. [Google Scholar] [CrossRef]
  34. Leahy, D.; Wang, Y. The 35-Day Cycle of Hercules X-1 in Multiple Energy Bands from MAXI and Swift/BAT Monitoring. Universe 2021, 7, 160. [Google Scholar] [CrossRef]
  35. Leahy, D. A.; Yoshida, A. Analysis of an eclipse INGRESS during a high state of Hercules X-1. MNRAS 1995, 276, 607–613. [Google Scholar] [CrossRef]
  36. Leahy, D. A.; Igna, C. The Light Curve of Hercules X-1 as Observed by the Rossi X-Ray Timing Explorer. ApJ 2011, 736, 74. [Google Scholar] [CrossRef]
1
The Roche-lobe is a teardrop-shaped volume that defines the region in which a star’s material is gravitationally bound to it. Roche-lobe overflow occurs when the star fills its Roche-lobe, so the material from the companion outside the Roche lobe either escapes from the system, orbits both stars, or falls onto the compact star.
2
In the original ASM/BAT table, a total of 248 cycles were included because of the repetition of BAT cycles 3 and 4.
Figure 1. Conceptual diagram (artificial colors) of the binary system HZ Her/Her X-1 (companion star/neutron star) with it characteristic tilted and twisted accretion disk. The companion star is heated by the X-rays from the neutron star to 17 , 000 K for the heated side; the temperature is 8100 K for the unheated side. This causes the spectral type to vary with orbital phase.
Preprints 71976 g001
Figure 2. 35-day cycle RXTE/PCA lightcurve of Her X-1 for Band d (9-20 keV, top) and softness ratio SR (Band b/ Band d). The dashed lines delimit the intervals for each state. These include all observations of Her X-1 by RXTE/PCA. The points with SR 0.3 are those that show cold matter absorption.
Preprints 71976 g002
Figure 3. Orbital phase Band d lightcurves for (a) MH turn-on and MH; and (b) MH decline. SR vs. orbital phase for: (c) MH turn-on and MH; and (d) MH decline.
Preprints 71976 g003aPreprints 71976 g003b
Figure 4. Orbital phase Band d lightcurves for (a) SH turn-on, SH and SH decline; and (b) LS 1 and 2. SR vs. orbital phase for: (c) SH turn-on, SH and SH decline; and (d) LS 1 and 2.
Preprints 71976 g004
Figure 5. 9-20 keV (Band d) eclipse lightcurves for MH, MH decline and MH turn-on. The grey line is the coronal scattering model from [29].
Preprints 71976 g005
Figure 6. 9-20 keV (Band d) eclipse lightcurves for SH decline, SH and SH turn-on (left panel) and for LS 1 and LS 2 (right panel). The grey line in each panel is the coronal scattering model from [29].
Preprints 71976 g006
Figure 7. SR vs. count rate plots for the different 35-day states. Left panel: for MH turn-on, MH and MH decline. Right panel: for SH turn-on, SH, SH decline and Low States (1 and 2 combined). Dips in the MH states correspond to the points below the main cluster of points between count rates of 20 to 120 c/s. Dips in the SH states correspond to the points below the main cluster of points between count rates of 20 to 120 c/s.
Preprints 71976 g007
Table 1. Modified 35-day cycle peak times.
Cycle New cycle no. New peak time Days added
ASM 59 59 52107.6 1
ASM 81 81 52879.2 1.2
ASM 82 82 52916.5 1.2
BAT 1 97 53477.0 2
BAT 2 98 53509.6 3.4
BAT 3 99 53544.8 1.4
BAT 4 100 53581.9 1.9
Table 2. Definition of state intervals in 35-day phase for PCA data.
State Start phase End phase Duration
MH Turn-on 0.786 0.815 0.029
MH 0.815 0.997 0.182
MH decline 0.997 0.180 0.183
LS1 0.180 0.368 0.188
SH Turn-on 0.368 0.379 0.011
SH 0.379 0.454 0.075
SH decline 0.454 0.624 0.170
LS2 0.624 0.786 0.162
Table 3. Fits of coronal model to 35-day states ( a ) .
State C χ 2 d o f χ 2 / d o f
MH 1.273 1630 1531 1.065
MH no excess ( b ) 1.048 690 1000 0.690
MHdec 0.953 66 94 0.702
SH 0.712 174 278 0.626
SHdec 0.599 437 634 0.689
LS1+2 0.751 204 3770 0.550
(a): MH turn-on and SH turn-on did not have enough data to fit; LS 1 and LS 2 data were combined into LS1+2; the orbital phases of eclipse that were fit are 0.0935 to 1.065. (b): for this fit the region with the excess between phases 0.935 and 0.960 was omitted.
Disclaimer/Publisher’s Note: The statements, opinions and data contained in all publications are solely those of the individual author(s) and contributor(s) and not of MDPI and/or the editor(s). MDPI and/or the editor(s) disclaim responsibility for any injury to people or property resulting from any ideas, methods, instructions or products referred to in the content.
Copyright: This open access article is published under a Creative Commons CC BY 4.0 license, which permit the free download, distribution, and reuse, provided that the author and preprint are cited in any reuse.
Prerpints.org logo

Preprints.org is a free preprint server supported by MDPI in Basel, Switzerland.

Subscribe

© 2024 MDPI (Basel, Switzerland) unless otherwise stated