Introduction
Currently, the observed increase in the incidence of obesity is caused by global development and progress in all areas of civilization, in particular economic, industrial, infrastructure, social and cultural. The prevalence of obesity in the last twenty years has reached the level of global pandemic and made it one of the main issues and directions of the activities of all world public health organizations and is treated as a civilization disease, with a huge socioeconomic and psychosocial importance [
1]. Many years of research on obesity revealed its etiological and pathogenetic connection with many common diseases, such as: cardiovascular disease, including atherosclerosis, hypertension, insulin-dependent diabetes, dyslipidemia, obstructive sleep apnea, bone and joint disease, depression, some types of cancer, reproductive system and other [
2,
3].
Understanding the relationship between obesity, and other frequent metabolic co-mobidities, led to the definition of a new disease entity – metabolic syndrome. Currently applicable criteria for recognizing metabolic syndrome adopted by the International Diabetes Federation (IDF) and American Heart Association/National Heart, Lung and Blood Institute (AHA // NHLBI) in 2009 include: abnormal waist circumference (depending on the population); triglyceride concentration (> 150mg/dl or the use of hypolipular treatment; HDL cholesterol fraction (<40 mg/dl (m), <50 mg/dl (K) or hypolipemic treatment used); arterial pressure (≥130/85 mm Hg or hypotensive treatment used); fasting glycemia (≥100 mg/dl or hypoglycaemic treatment used). To recognize metabolic syndrome, 3 out of the 5 criteria [
4] should be determined.
Analysis of the issues of pathological obesity and metabolic syndrome in terms of co-morbidity leads to the conclusion that they are a significant factor promoting the development of cardiovascular diseases, increasing the risk of the occurrence of myocardial infarction 2.5 - times, causing 1.5-times increase in total mortality and 2-times increase in the frequency of all cardiovascular incidents, including brain stroke [
5]. The proven fact is that the spread of this syndrome in the world population is increasing and reaches levels that allow to treat it as a problem of public health and civilization disease [
6]. The metabolic syndrome occurs in a world population with a frequency of about 20 to even 40%, depending on the analyzed region and/or ethnic group and the age of patients. The spread of MS has a tendency to grow in time and gives disturbing prognoses regarding the frequency of its occurrence in the future, is more common in women than in men, and its frequency increases significantly with age [
7].
Lipid balance disorders are one of the main diseases coexisting with obesity and metabolic syndrome. Patients with abdominal obesity are more exposed to atherogenic dyslipidemia, which is associated with an increased risk of cardiovascular diseases with atherosclerotic disease and increased risk of morbidity and mortality due to cardiovascular disease [
8,
9]. Research and treatment focus on improving in lipid profiles in the pursuit of a potential reduction of diseases related to the cardiovascular system. To diagnose dyslipidemia in the metabolic syndrome, it is required to find disorders of triglycerides and lipoproteins concentrations in patient plasma: TG ≥ 150 mg/dl and/or HDL <40 mg/dl (m), <50 mg/dl (k). However, in the course of obesity and metabolic syndrome, deviations in the concentration and functions of other lipids are also observed, such as an increase in the concentration of very low lipoproteins of VLDL and chylomikrone, as well as LDL.
The pathomechanism of the development of atherogenic dyslipidemia in the metabolic syndrome is closely associated with insulin resistance and excess of free fatty acids in the bloodstream. The accumulation of free fatty acids is the result of, among others, intensified in the course of insulin resistance, lipolysis and their lowered uptake at the level of adipocytes. The excess of free fatty acids results in their accumulation in the liver, reestrification to triglycerides and the intensified synthesis of TG -rich lipoprotein molecules with very low density VLDL [
10]. At the same time, the influx of lipids supplied with food is higher in the case of insulin resistance than in healthy subjects, which results in postprandial hyperlipidemia phenomenon. Exogenous lipids enter the bloodstream in the form of chylomikrone molecules, produced in enterocytes. Postable hyperlipidemia is also closely related to changes in the course of insulin resistance, because chylomikrons and VLDL are used in the same metabolic pathways [
11].
The third factor increasing triglyceridemia is the hepatic lipogenesis de novo, which does not inhibit in case of insulin resistance and results in TG [
12] increases. Hypertriglyceridemia associated with high concentration of high VLDL-1 stimulates adverse, biochemical changes in HDL and LDL lipoproteins. The process of replacing cholesterol esters with HDL and LDL for triglycerides from VLDL takes place through the cholesteryl ester transfer protein (CETP). As a result, the amount of cholesterol esters increases in VLDL, and the number of triglycerides increases in HDL and LDL. Furthermore, in the liver through the hepatic lipase, "small and dense" HDL and LDL [
13] are created from these overloaded TG lipoprotein. Structurally abnormal HDL loses the possibility of cholesterol return transport from tissues (including blood vessels) to the liver, and also has a high plasma clearance, which is why it is quickly removed from the bloodstream and its concentration decreases. The small and dense LDL (SDLDL), on the other hand, has less affinity for receptors on hepatocytes than the normal LDL, which causes its longer maintenance in plasma [
10].
Material and Methods
The aim of the study was to assess the effectiveness of LSG in the treatment of obesity, weight loss basing on BMI, %TWL, %EWL, %EBMI examined after 1, 3, 6 and 12 months of observation and assessment of LSG effectiveness in the treatment of dyslipidemia based on a change in total cholesterol, LDL, HDL, NI-HDL and triglycerides concentrations.
Demographic, biometric and clinical data regarding patients from the study group were obtained prospectively on the day of surgery and as part of outpatient postoperative visits, which patients attended 1 month, 3 months, 6 months and 1 year after LSG. During these visits, blood samples were also taken in order to analyse laboratory and biochemical parameters.
Study group included 196 patients after laparoscopic sleeve gastrectomy in our Department in 2016-2020 with complete data gathered during 12-month postoperative observation. One hundred and seven men (54.6%) and 89 women (45.4%) were included in the study. The average age of patients in the study group was 44.9 years, the youngest patient was 21 years old, and the oldest 66 years old. The median BMI value on the day of the operation was 47.7 kg/m2.
Statistical analysis: Collected data was analyzed using STATA 13.0 software. Measurable variables observed in the study group for individual parameters subjected to statistical analysis are presented as average with standard deviations (SD) or as a median with interquartile intervals, in regard to a case. Statistical comparisons of measurable variables were conducted using repetitive measurements with a Wilcoxon test with multiple comparison of post-hoc variables. Pearson’s coefficient was used to evaluate the correlation of variables. Analyzed variables were considered statistically significant at the level of significance p ≤ 0.05.
Results
The weight reduction rate as a result of LSG, analyzed on the basis of changes in bariatric parameters in the intervals of postoperative observation is presented in Table 1 (Table 1). The results of body weight reduction analysis observed after laparoscopic sleeve gastectomy. At the end of the 1-year follow-up, the median BMI in the study group was 33.4 kg/m
2.
| |
Before the surgery |
1 month |
3 months |
6 months |
12 months |
| |
Mean +/- |
p |
Mean +/- |
P |
Mean +/- |
p |
Mean +/- |
p |
| Body mass [kg] (SD) |
145.7 (120.6-170.7) |
129.3 (106.7-152.0) |
0.0000 |
117.4 (96.3-138.5) |
0.0000 |
106.5 (85.7-127.4) |
0.0000 |
101.4 (80.8-122.0) |
0.0000 |
| BMI [kg/m2] (SD) |
48.3 (41.5-55.1) |
42.9 (36.6-49.3) |
0.0000 |
39 (32.9-45.1) |
0.0000 |
35.4 (29.3-41.4) |
0.0000 |
33.7 (27.6-39.7) |
0.0000 |
| %EBL (SD) |
|
24.3 (17.7-30.9) |
0.0000 |
(42.2 (31.4-52.9) |
0.0000 |
58.4 (43.7-73.2) |
0.0000 |
66.0 (48.5-83.5) |
0.0000 |
| %EWL (SD) |
|
21.6 (16.1-27.1) |
0.0000 |
37.5 (28.7-46.3) |
0.0000 |
51.9 (39.7-64.2) |
0.0000 |
58.7 (44.1-73.3) |
0.0000 |
| %TWL (SD) |
|
11.2 (8.7-13.7) |
0.0000 |
19.5 (15.8-23.1) |
0.0000 |
27.0 (21.8-32.2) |
0.0000 |
30.5 (24.2-36.8) |
0.0000 |
The dynamics of weight loss in the group was similar in the observation intervals between 0 and 1 month, 1 and 3 months and 3 and 6 months, while in the interval between 6 and 12 months it slightly deccelerated. Throughout the postoperative observation, a positive trend was maintained in body weight reduction, which was expressed in negative trend of mean BMI values and positive trends in an increase in percentage values %TWL, %EWL and %EBL. Operated patients within 1 year after the procedure lost an average of about 1/3 of their total, initial body weight, which accounted for about 66% of their excess BMI resulting from obesity.
Furthermore, the plasma lipidogram was analyzed. For this purpose, repetitive determinations were conducted of total cholesterol (TC), triglycerides (TG), high density lipoprotein (HDL-C), low density lipoprotein (LDL-C) and the level of all lipoproteins associated with AP-B (so-called HDL = TC-HDL-C) during the follow-up visits of patients in the 1st, 3rd, 6th and 12th month after laparoscopic sleeve surgery.
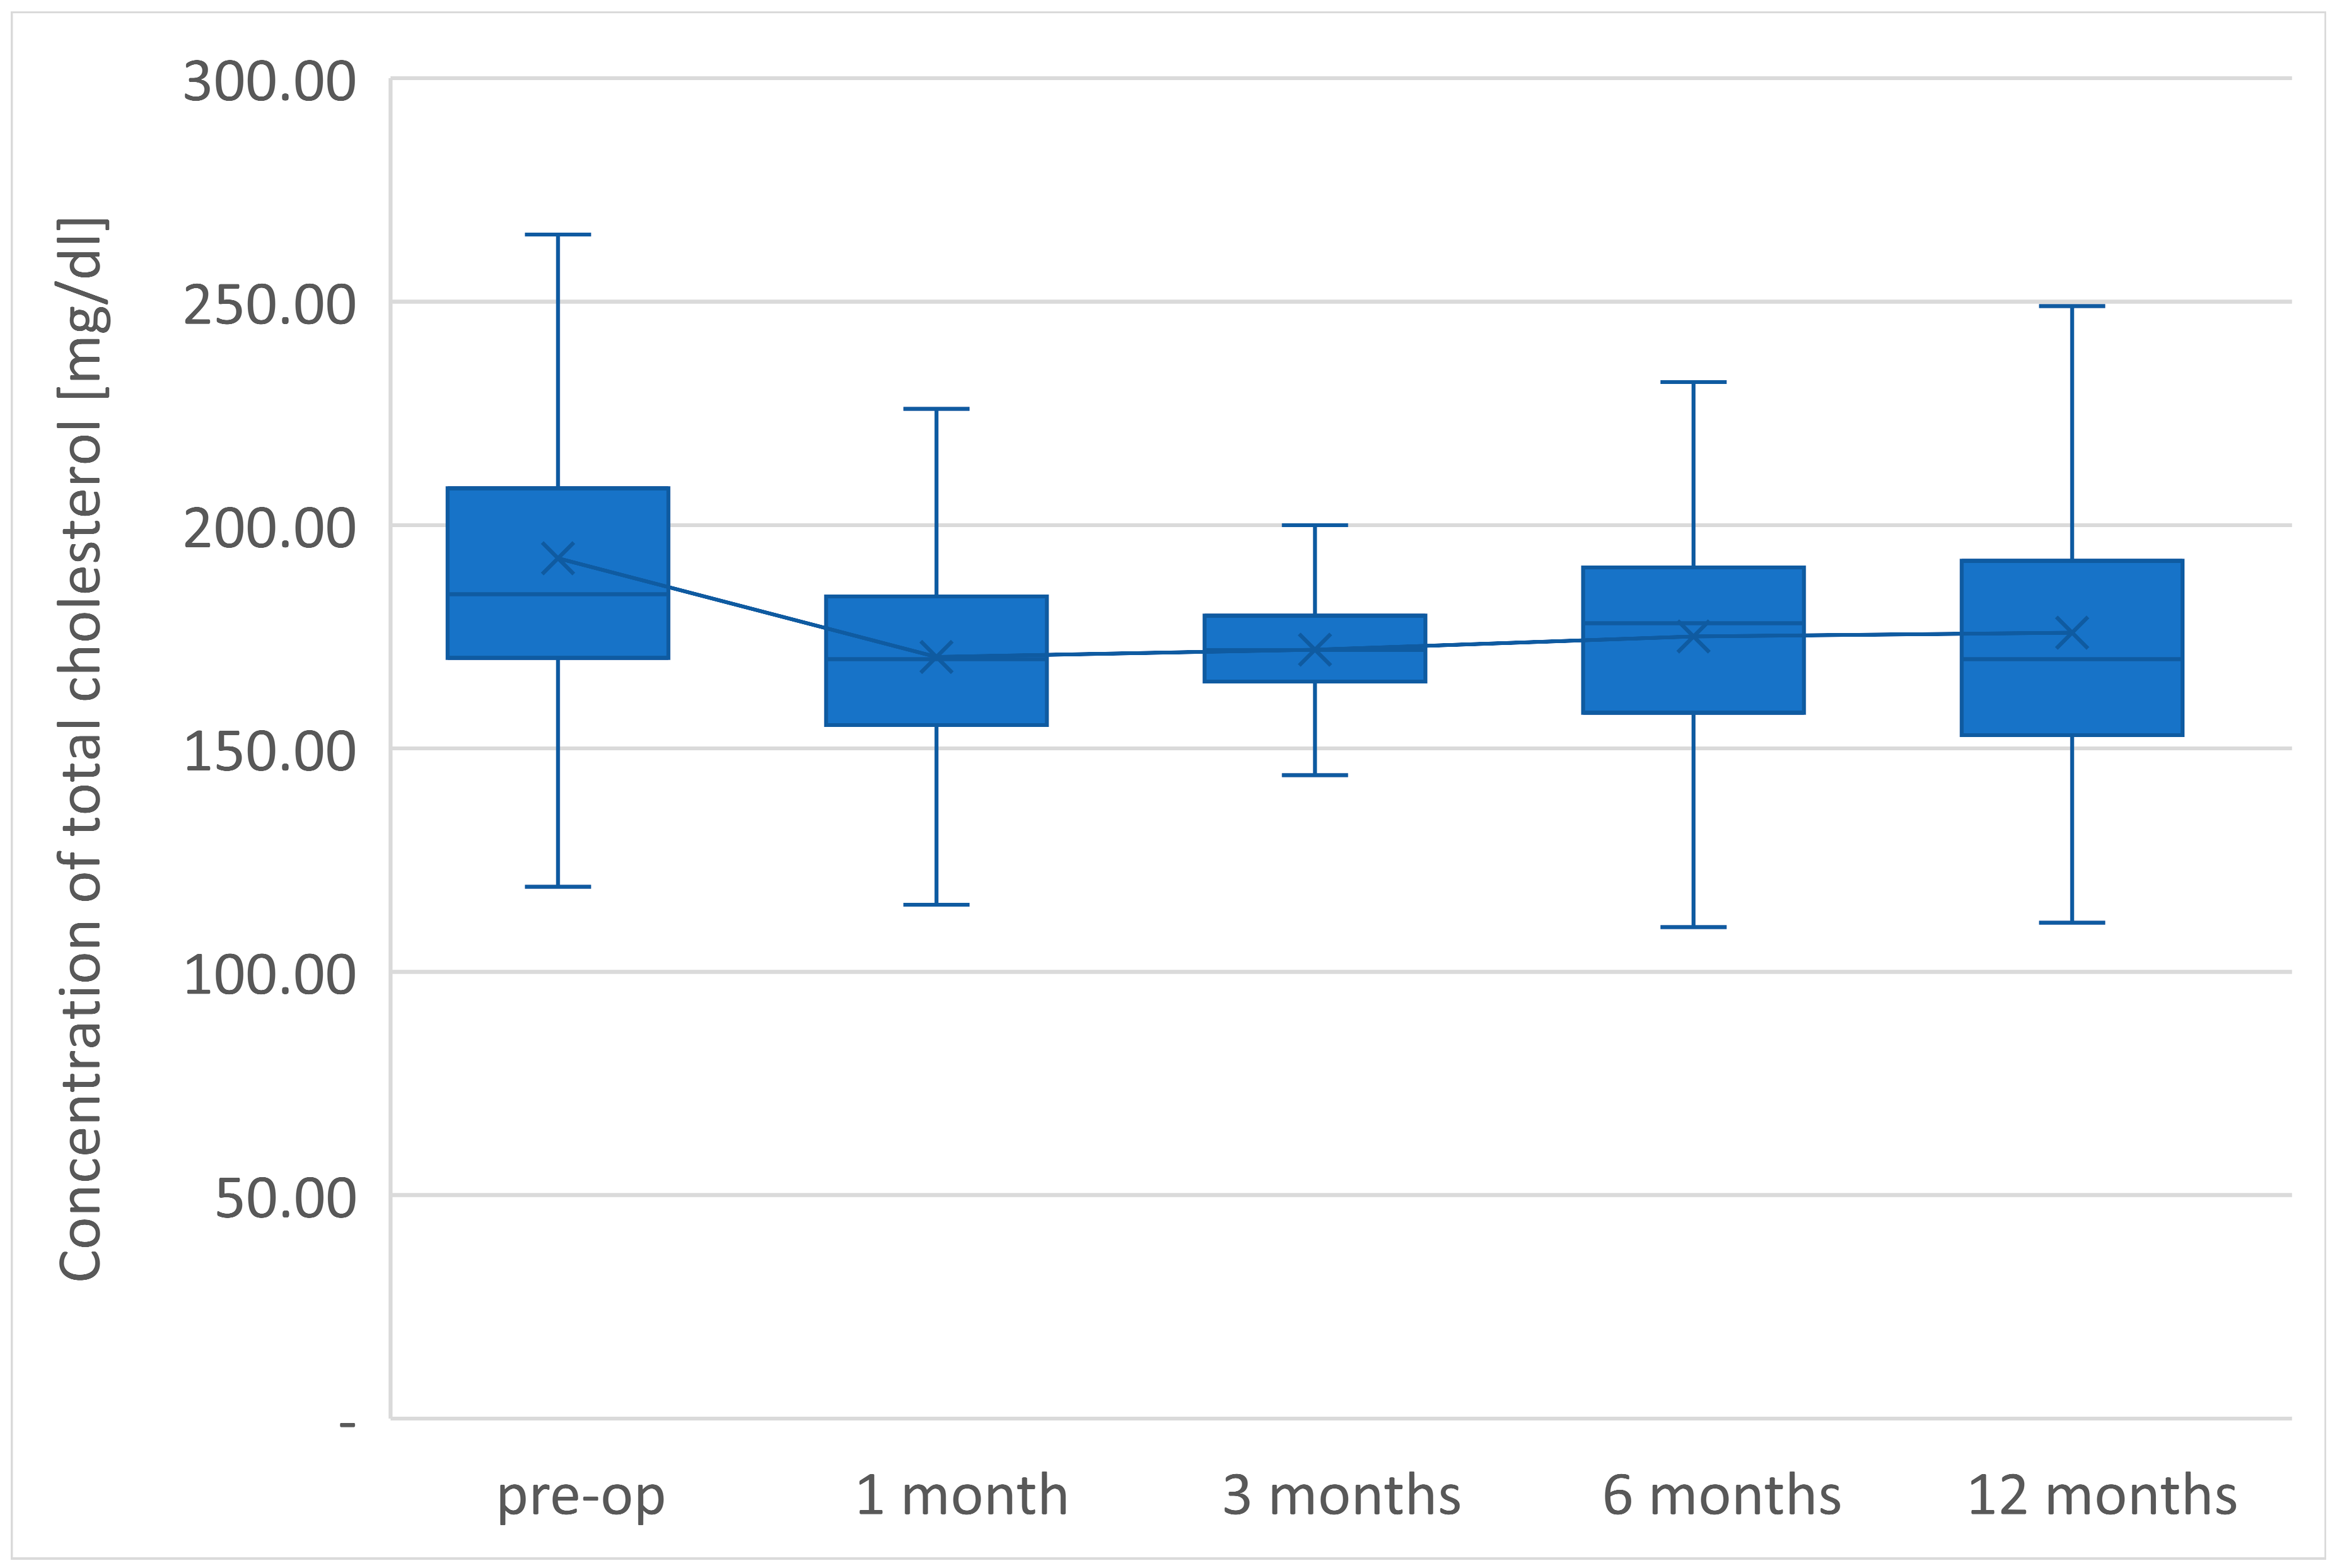
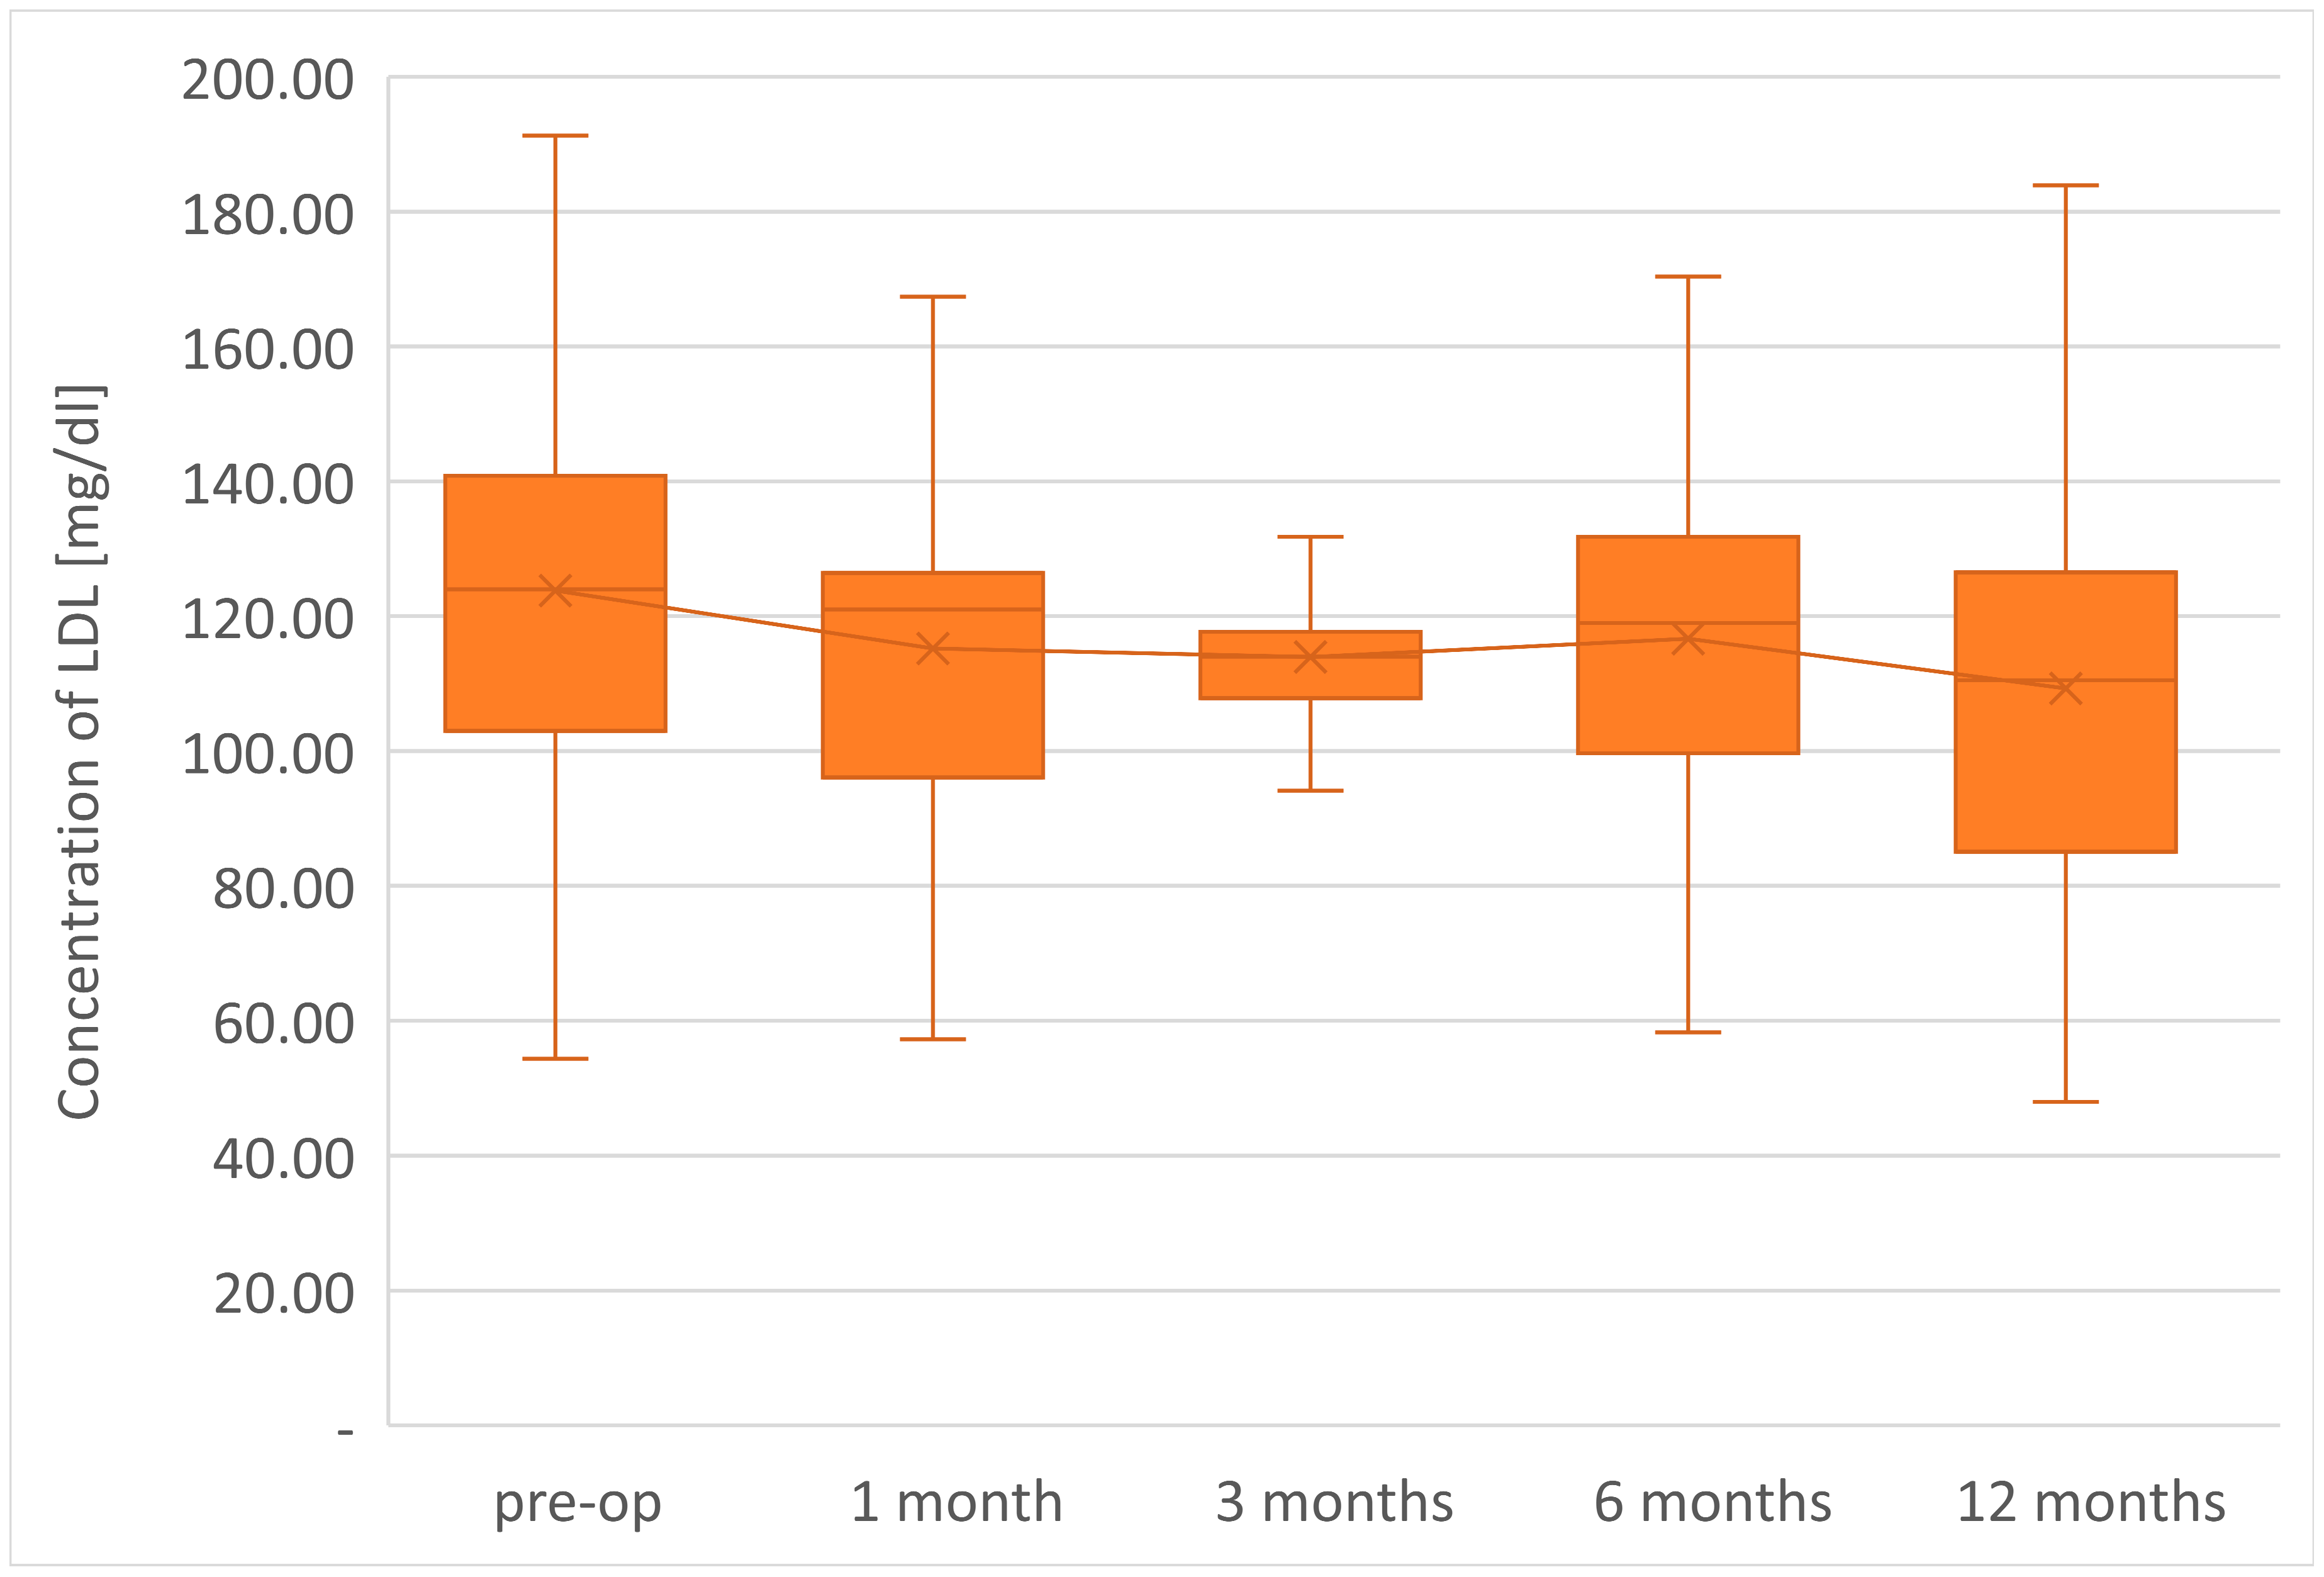
The final determinations of plasma lipid profile of patients undergoing LSG surgery after 1 year from the procedure showed the average TC concentration in a group of 175.9 mg/dl, so it decreased by 16.6 mg/dl in relation to preoperative value. The level of LDL-C fraction finally reached an average of 109.3 mg/dl, i.e. it was 14.5 mg/dl lower than preoperative.
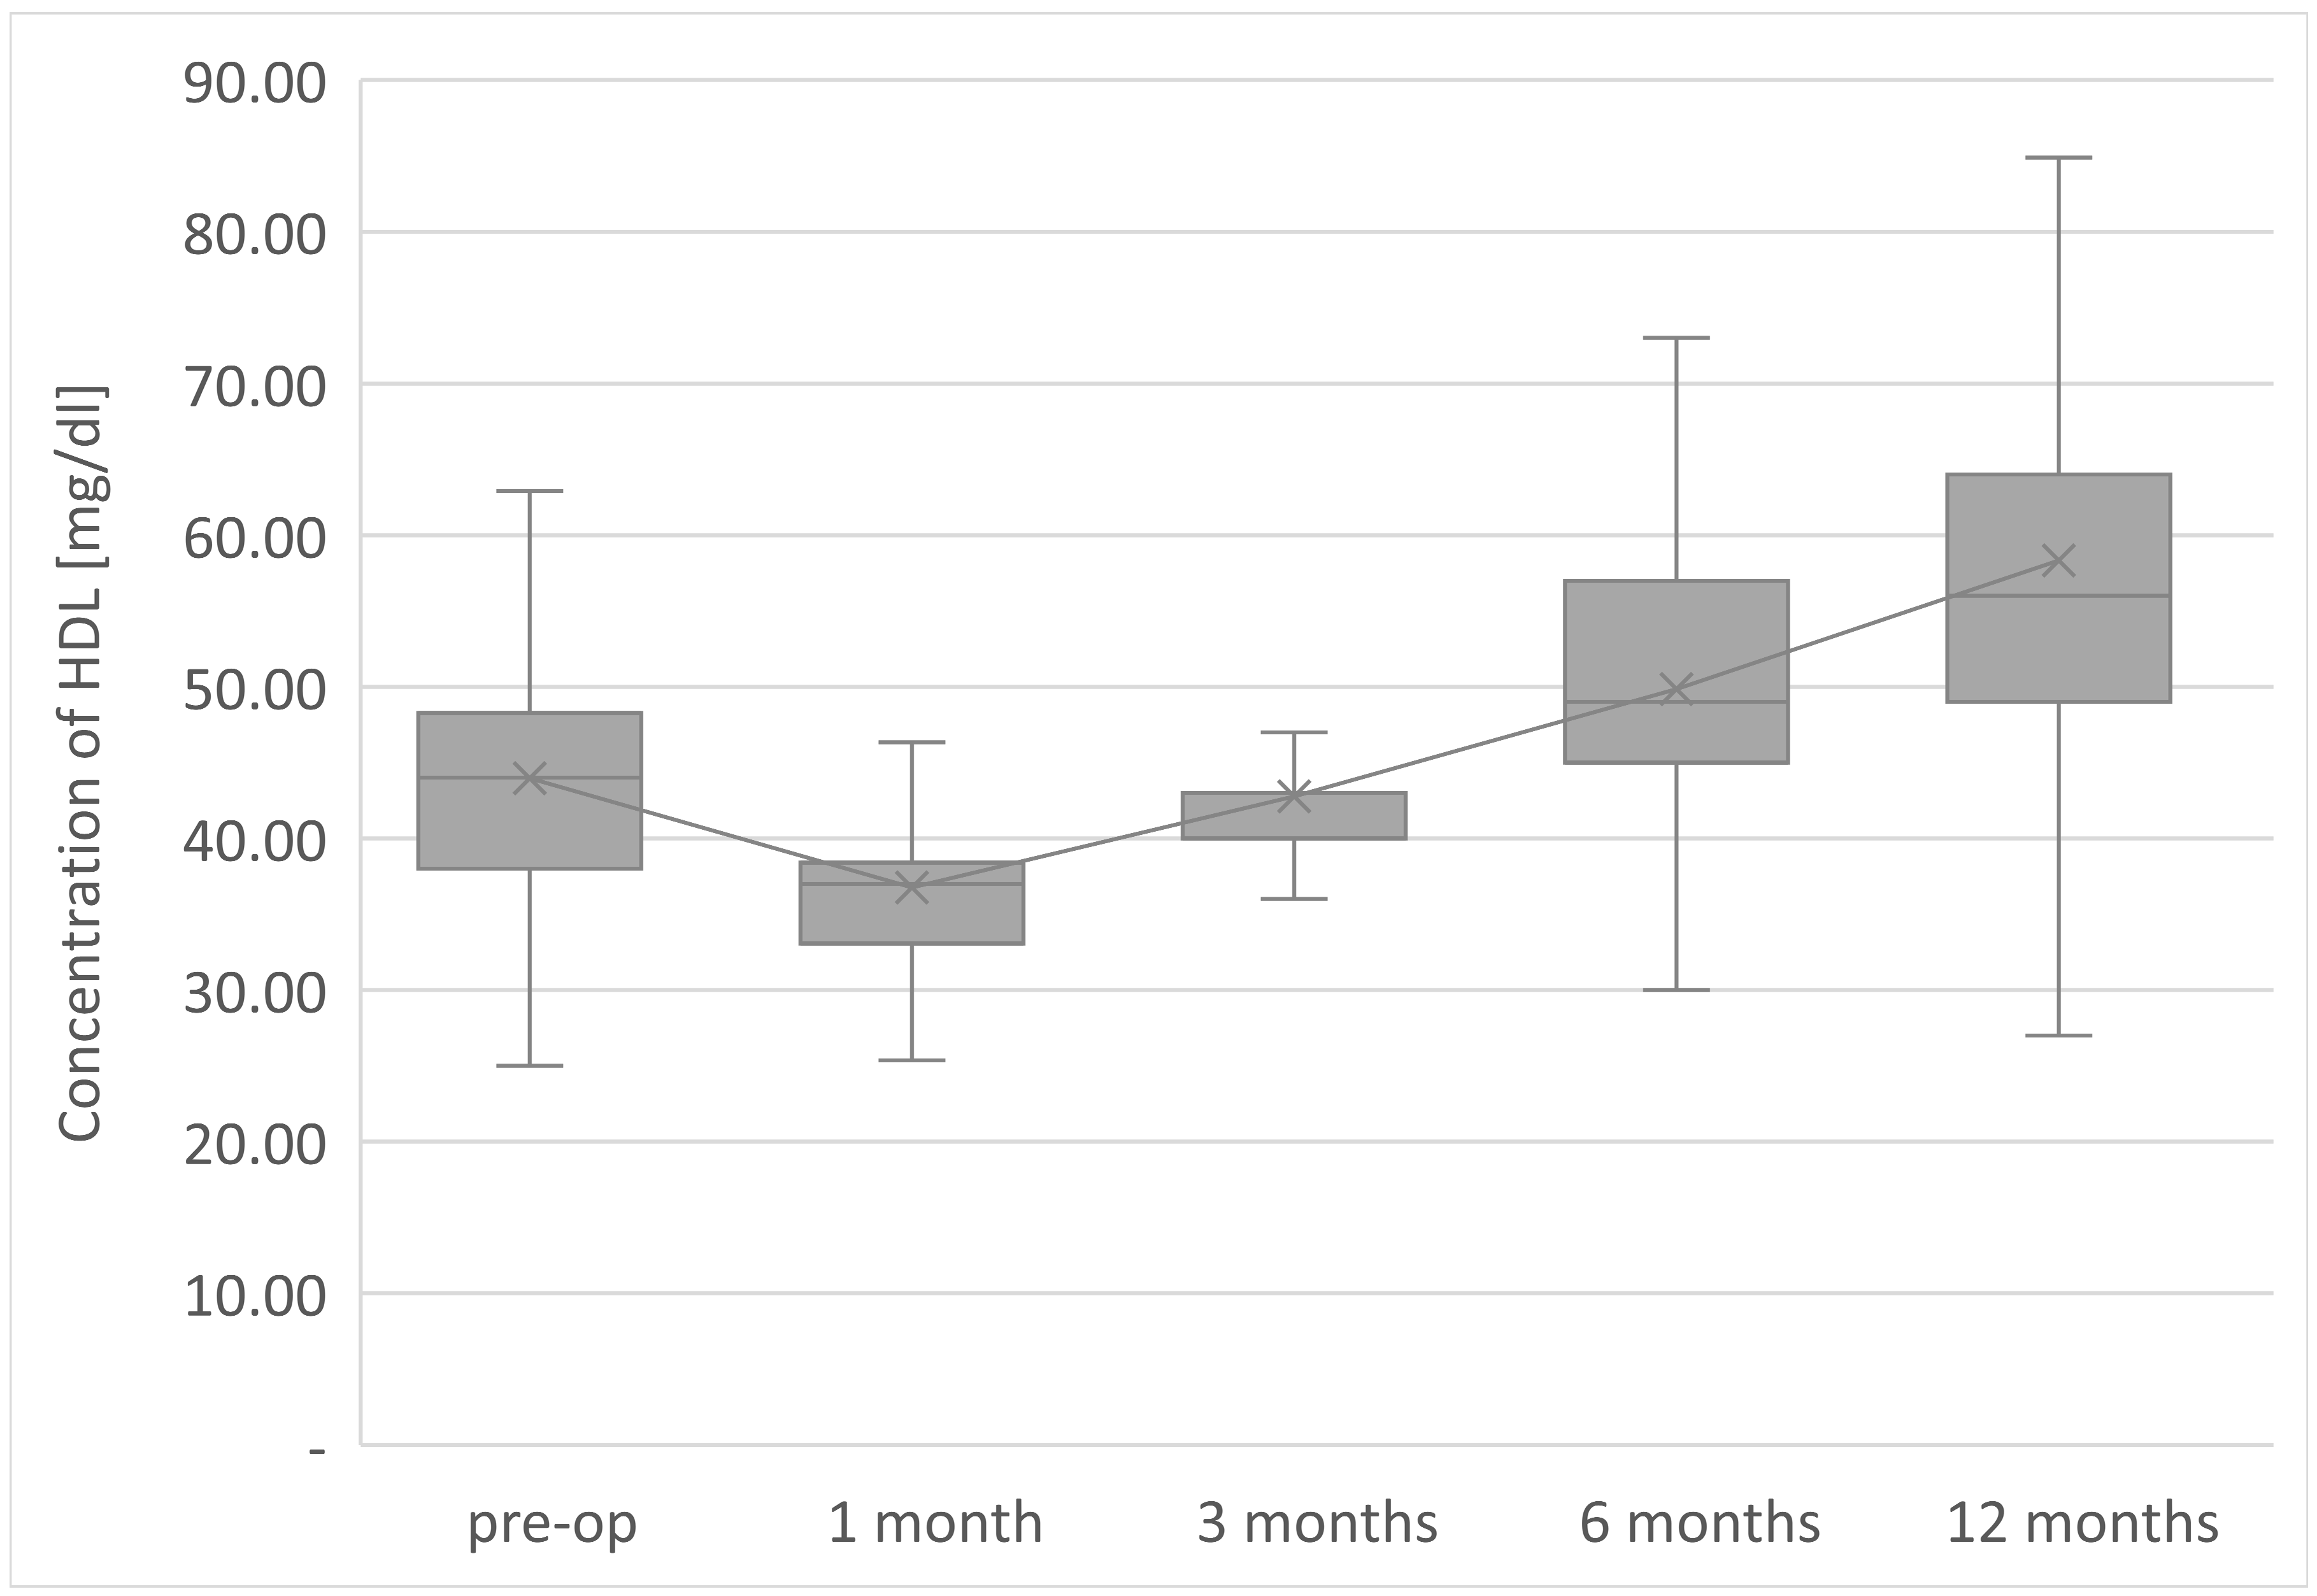
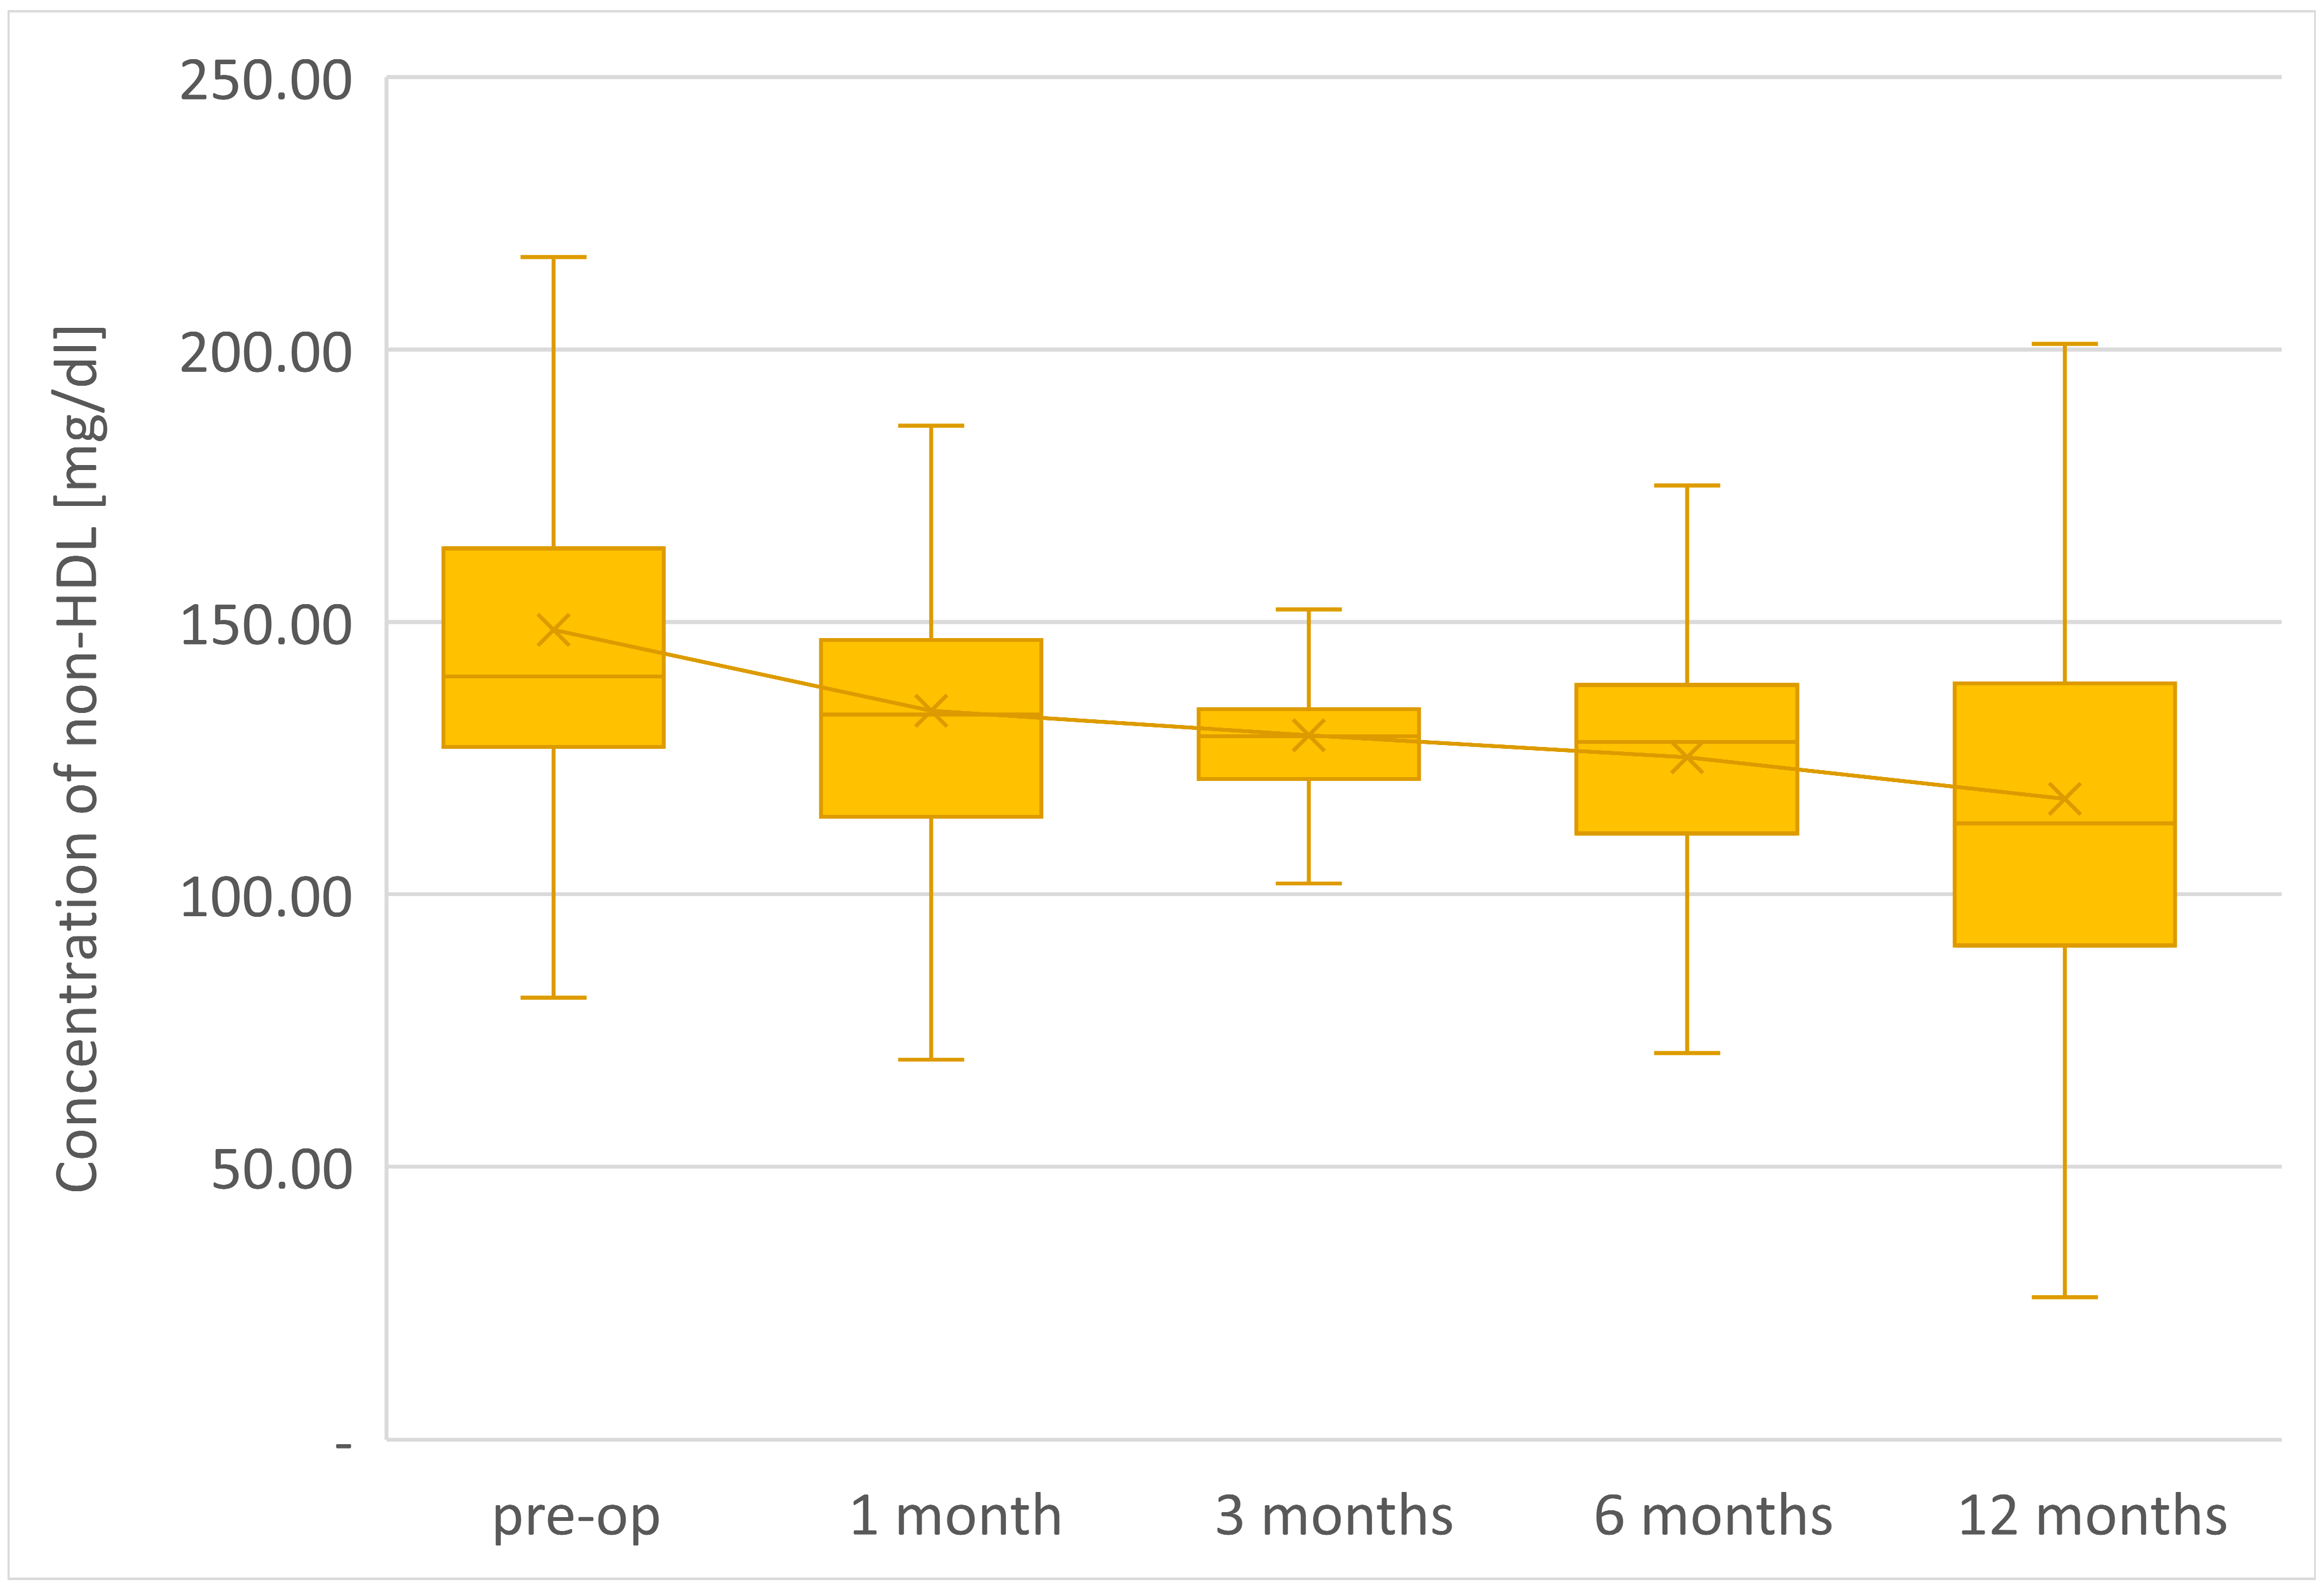
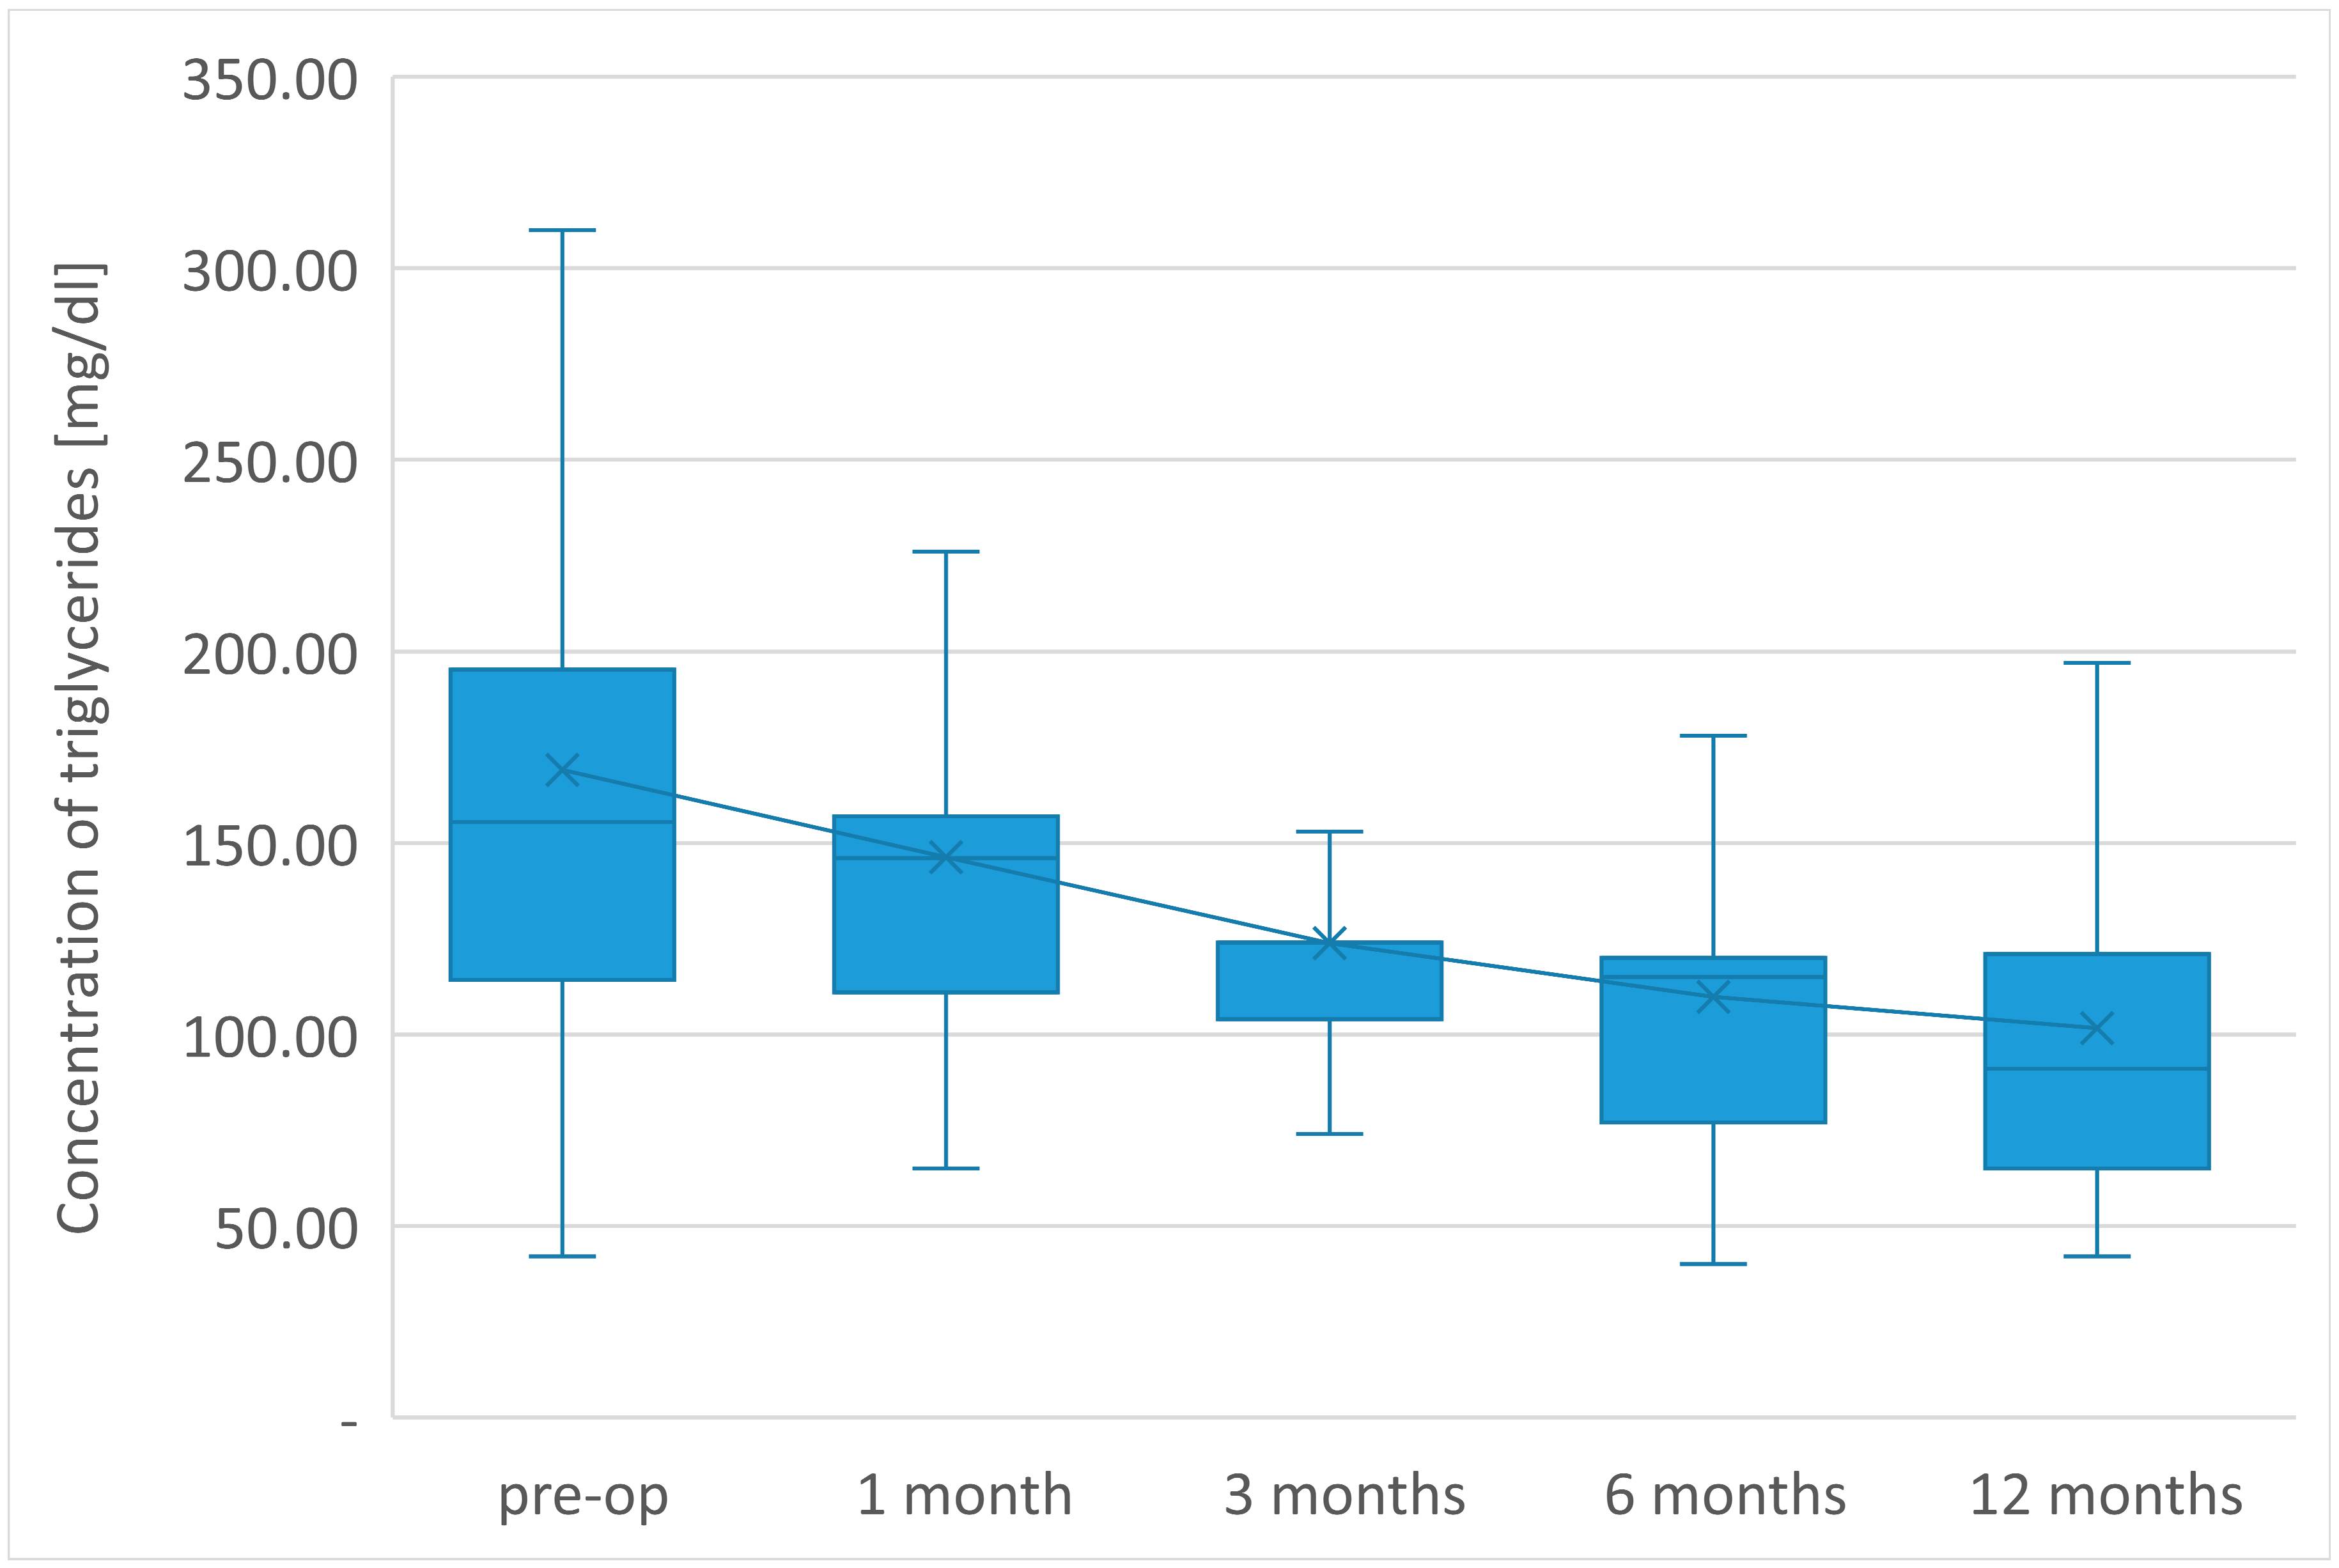
The average TG concentration in plasma significantly decreased from 148.6 mg/dl to 117.5 mg/dl. However, the average concentration of high density lipoprotein fraction increased to 58.3 mg/dl, and at the end of the observation it was 14.3 mg/dl higher than before LSG. The level of non-HDL lipoproteins in the plasma of examined patients at the end of the observation was 117.5 mg/dl and it was lower than the initial value by 31.1 mg/dl. All changes observed in this group of patients in the lipid balance parameters after 12 months were statistically significant (p <0.05). The aforementioned changes in the lipid profile of patients after LSG are presented in Table 2 and
Chart 1.
| |
Before the surgery |
1 month |
3 months |
6 months |
12 months |
| |
Mean +/- |
p |
Mean +/- |
P |
Mean +/- |
p |
Mean +/- |
p |
| TC [mg/dl] (SD) |
192.5 (154.7-230.4) |
170.5 (134.3-206.7) |
0.0000 |
172.1 (143.4-200.9) |
0.0000 |
175.0 (144.6-205.5) |
0.0000 |
175.9 (141.9-209.9) |
0.0000 |
| LDL [mg/dl] (SD) |
123.8 (92.6-155.0) |
115.2 (82.9-147.5) |
0.0000 |
114.0 (88.1-139.8) |
0.0000 |
116.7 (87.5-145.9) |
0.0032 |
109.3 (76.3-142.2) |
0.0000 |
| HDL[mg/dl] (SD) |
44.0 (35.3-52.7) |
36.8 (29.9-43.6) |
0.0000 |
43.0 (35.5-50.4) |
0.0486 |
49.9 (39.2-60.5) |
0.0000 |
58.3 (42.8-73.8) |
0.0000 |
| Nie-HDL [mg/dl] (SD) |
148,6 (110,8-186,3) |
133,7 (97,2-170,2) |
0,0000 |
129,2 (101,0-157.4) |
0,0000 |
125,2 (94,1-156,3) |
0,0000 |
117,5 (82,2-152,9) |
0,0000 |
| TG [mg/dl] (SD) |
169.1 (74.2-264.0) |
146.3 (95.5-197.1) |
0.0013 |
123.8 (83.8-163.9) |
0.0000 |
109.9 (66.0- 153.7) |
0.0000 |
101.7 (54.2-149.2) |
0.0000 |
Chart 1.
Changes of concentration of total cholesterol after LSG in 12-months follow-up.
Chart 1.
Changes of concentration of total cholesterol after LSG in 12-months follow-up.
Chart 2.
Changes of concentration of LDL after LSG in 12-months follow-up.
Chart 2.
Changes of concentration of LDL after LSG in 12-months follow-up.
Chart 3.
Changes of concentration of HDL after LSG in 12-months follow-up.
Chart 3.
Changes of concentration of HDL after LSG in 12-months follow-up.
Chart 4.
Changes of concentration of non-HDL after LSG in 12-months follow-up.
Chart 4.
Changes of concentration of non-HDL after LSG in 12-months follow-up.
Chart 5.
Changes of concentration of triglycerides after LSG in 12-months follow-up.
Chart 5.
Changes of concentration of triglycerides after LSG in 12-months follow-up.
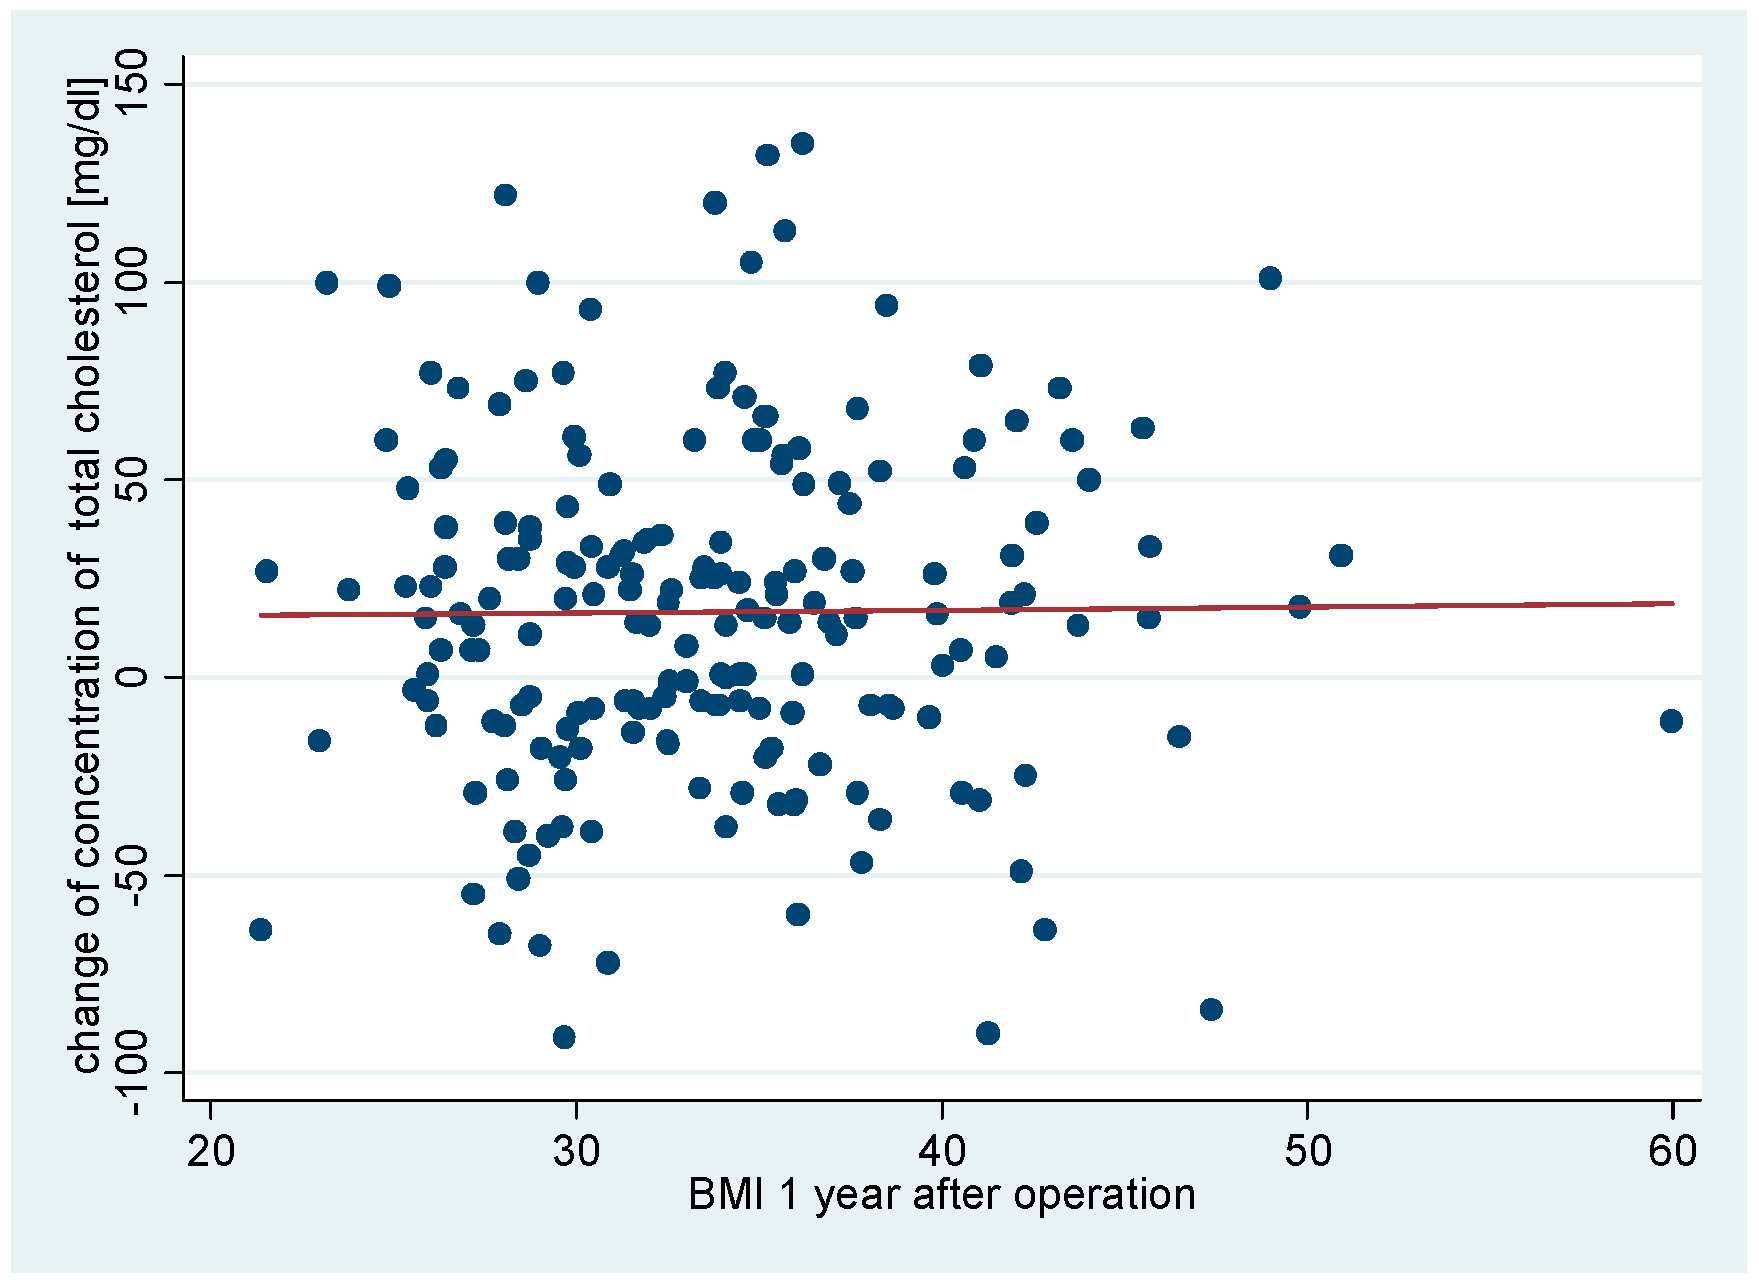
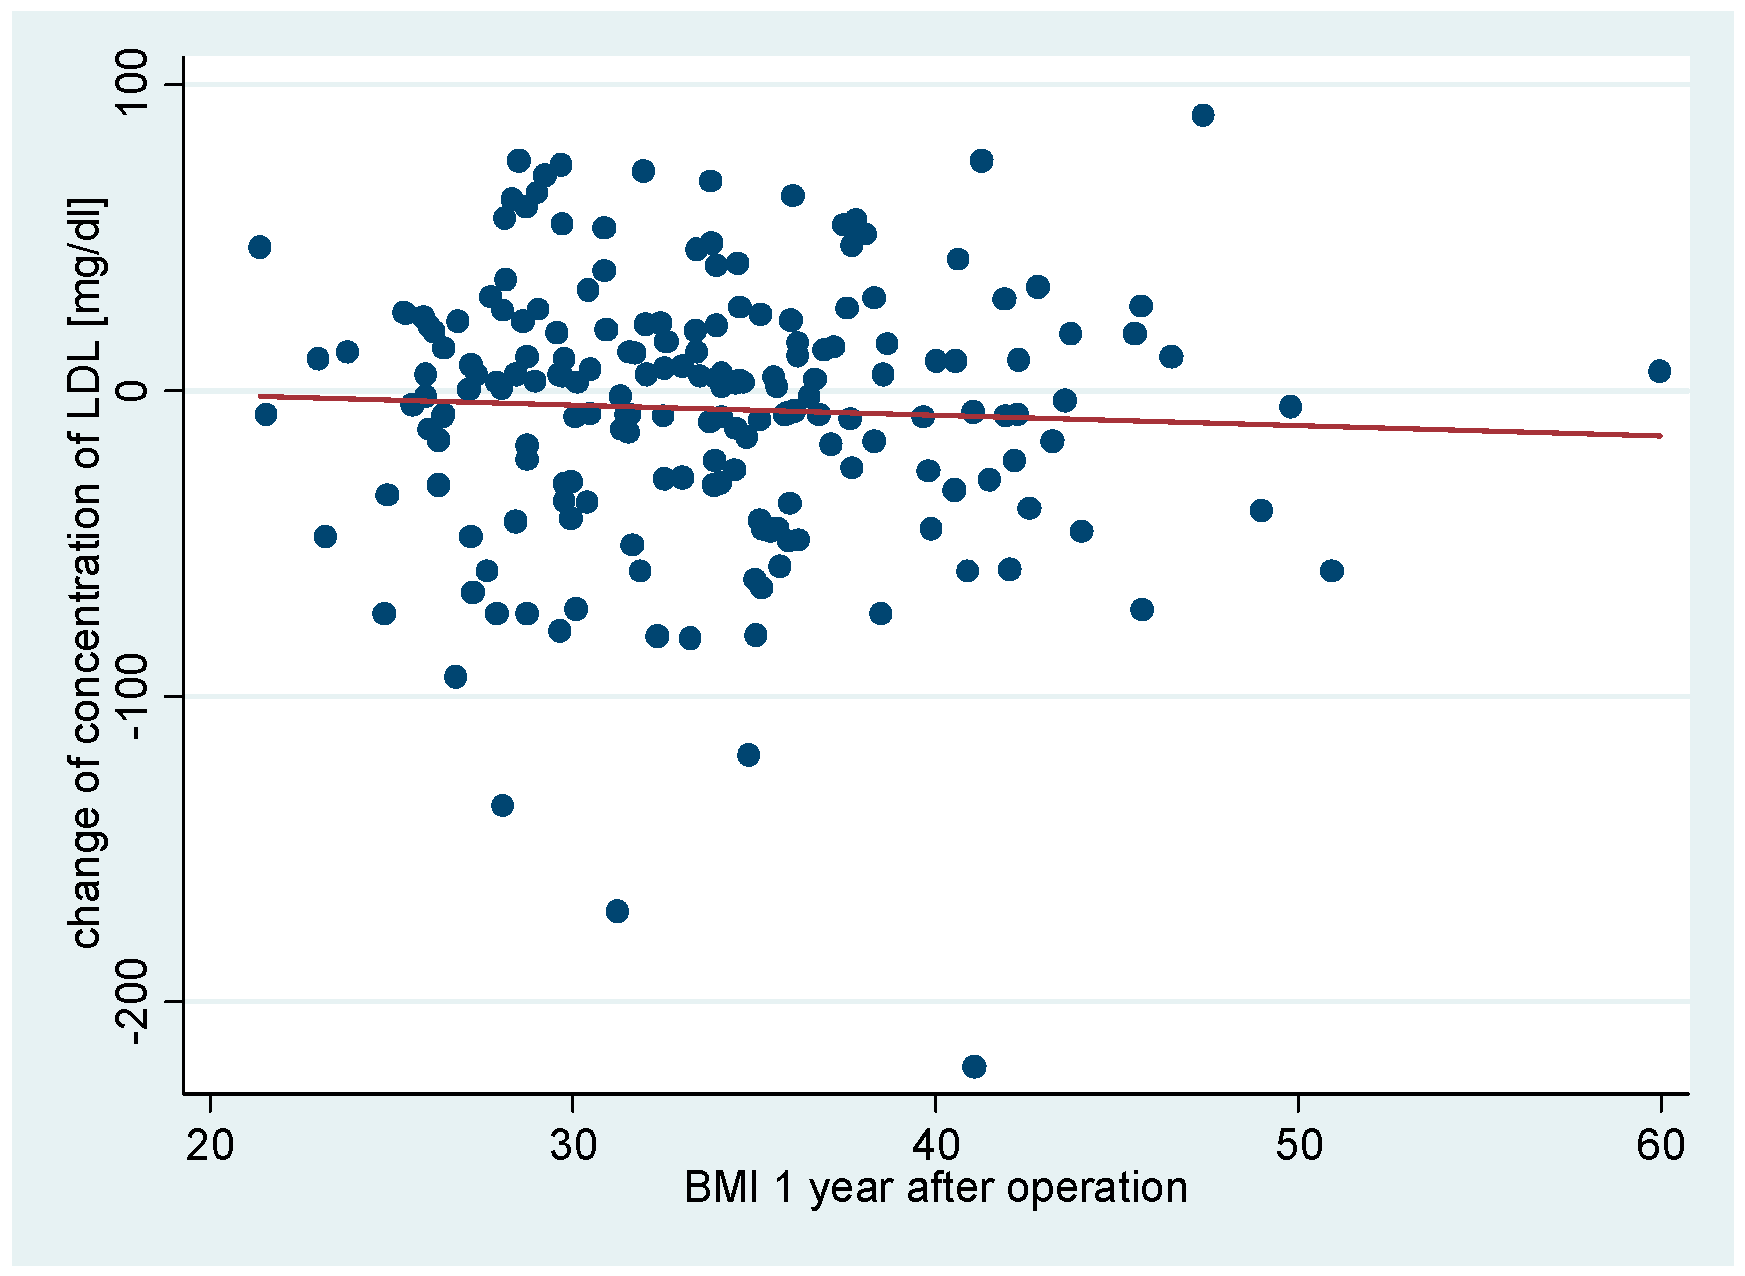
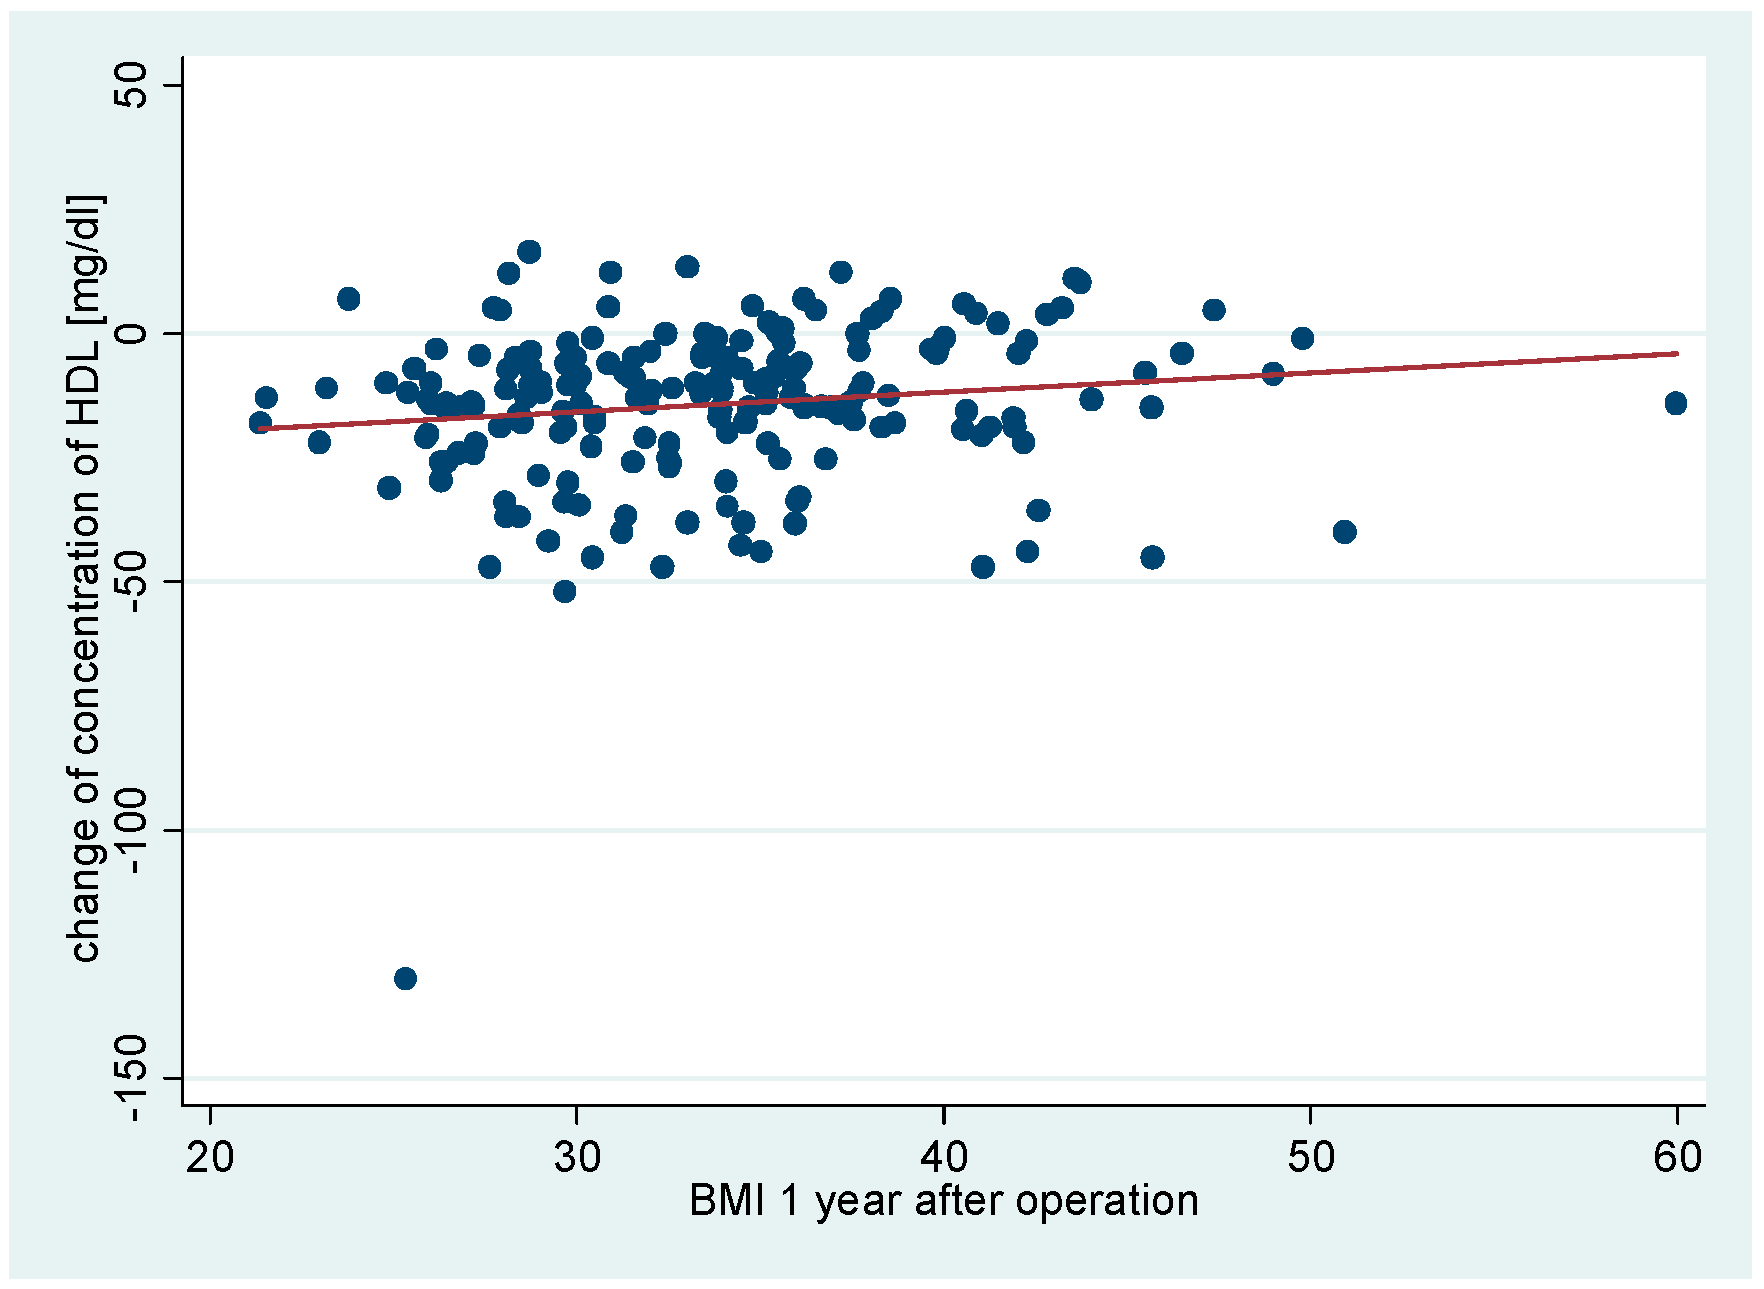
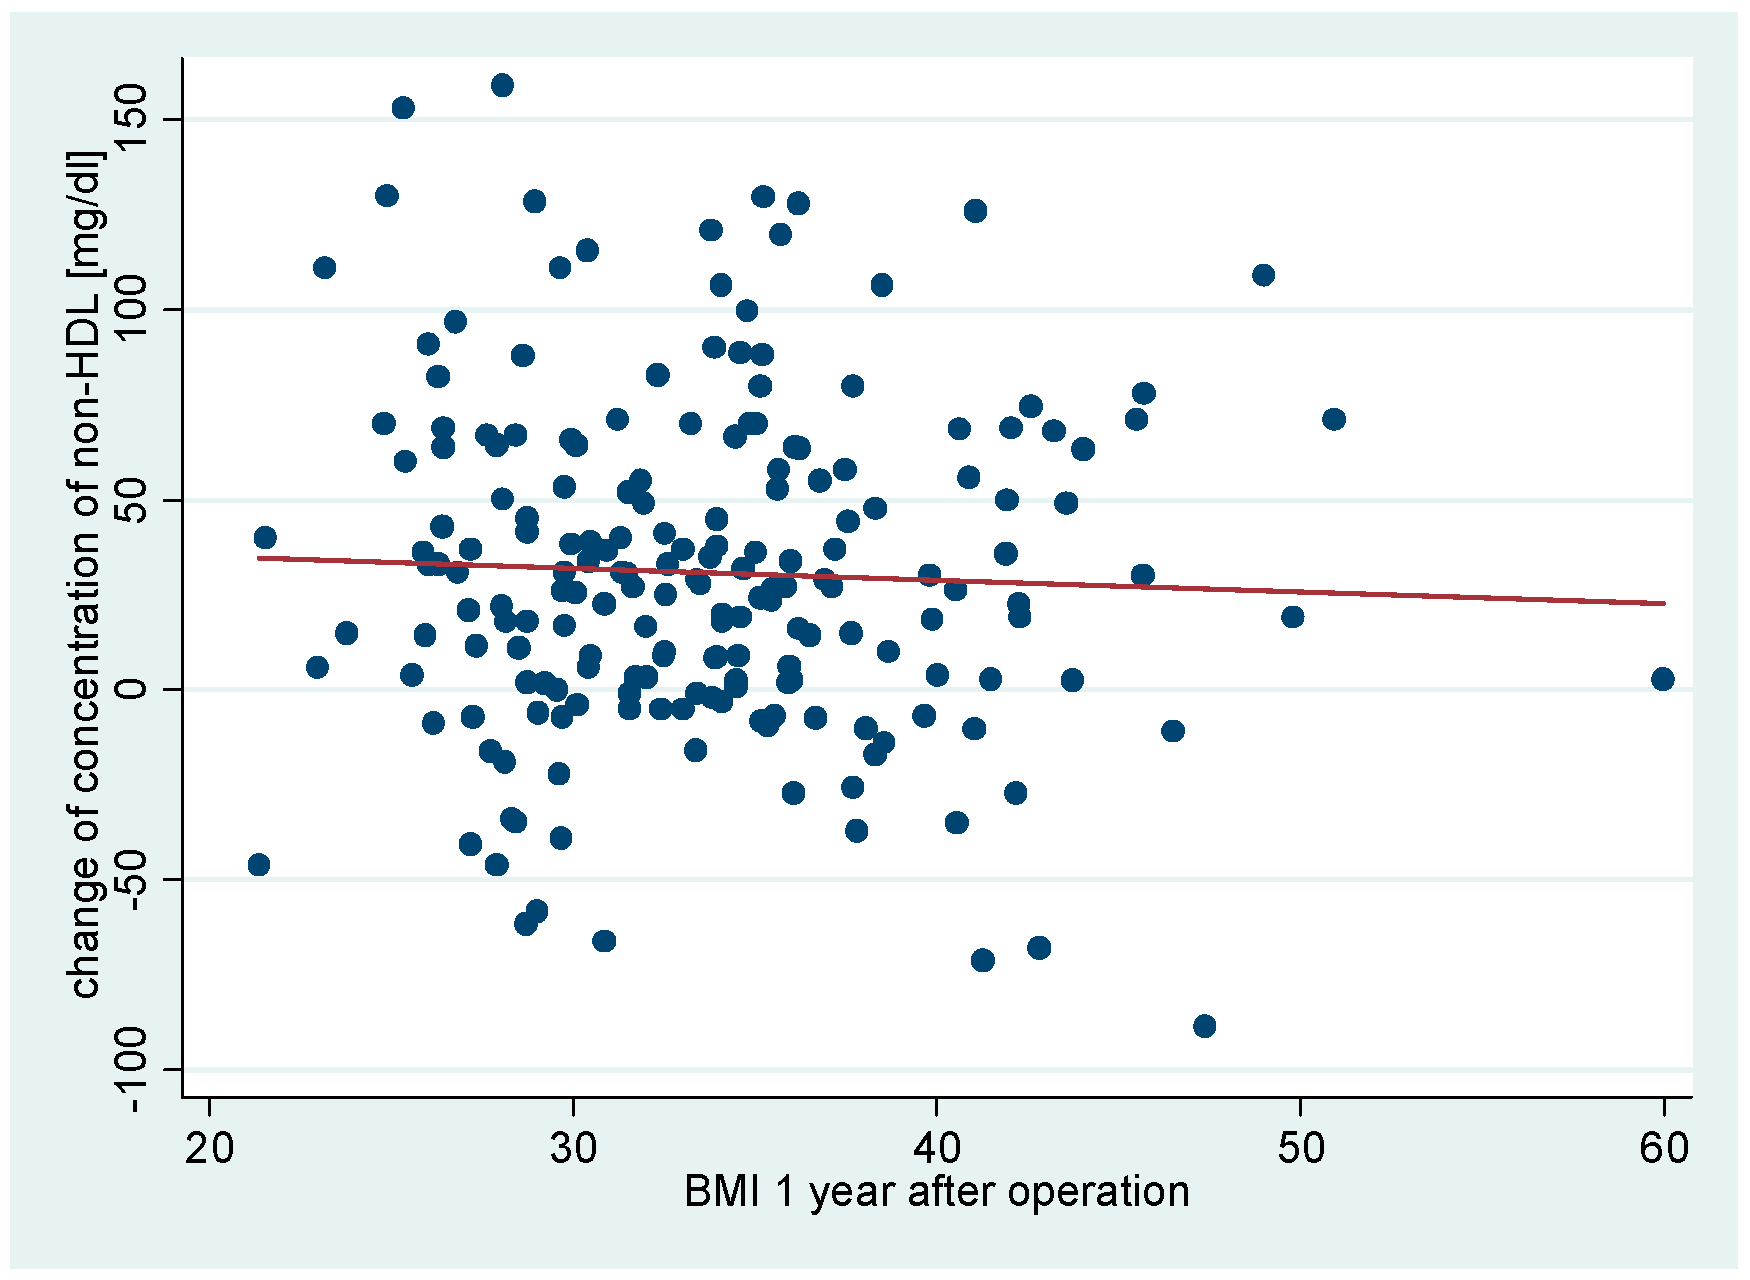
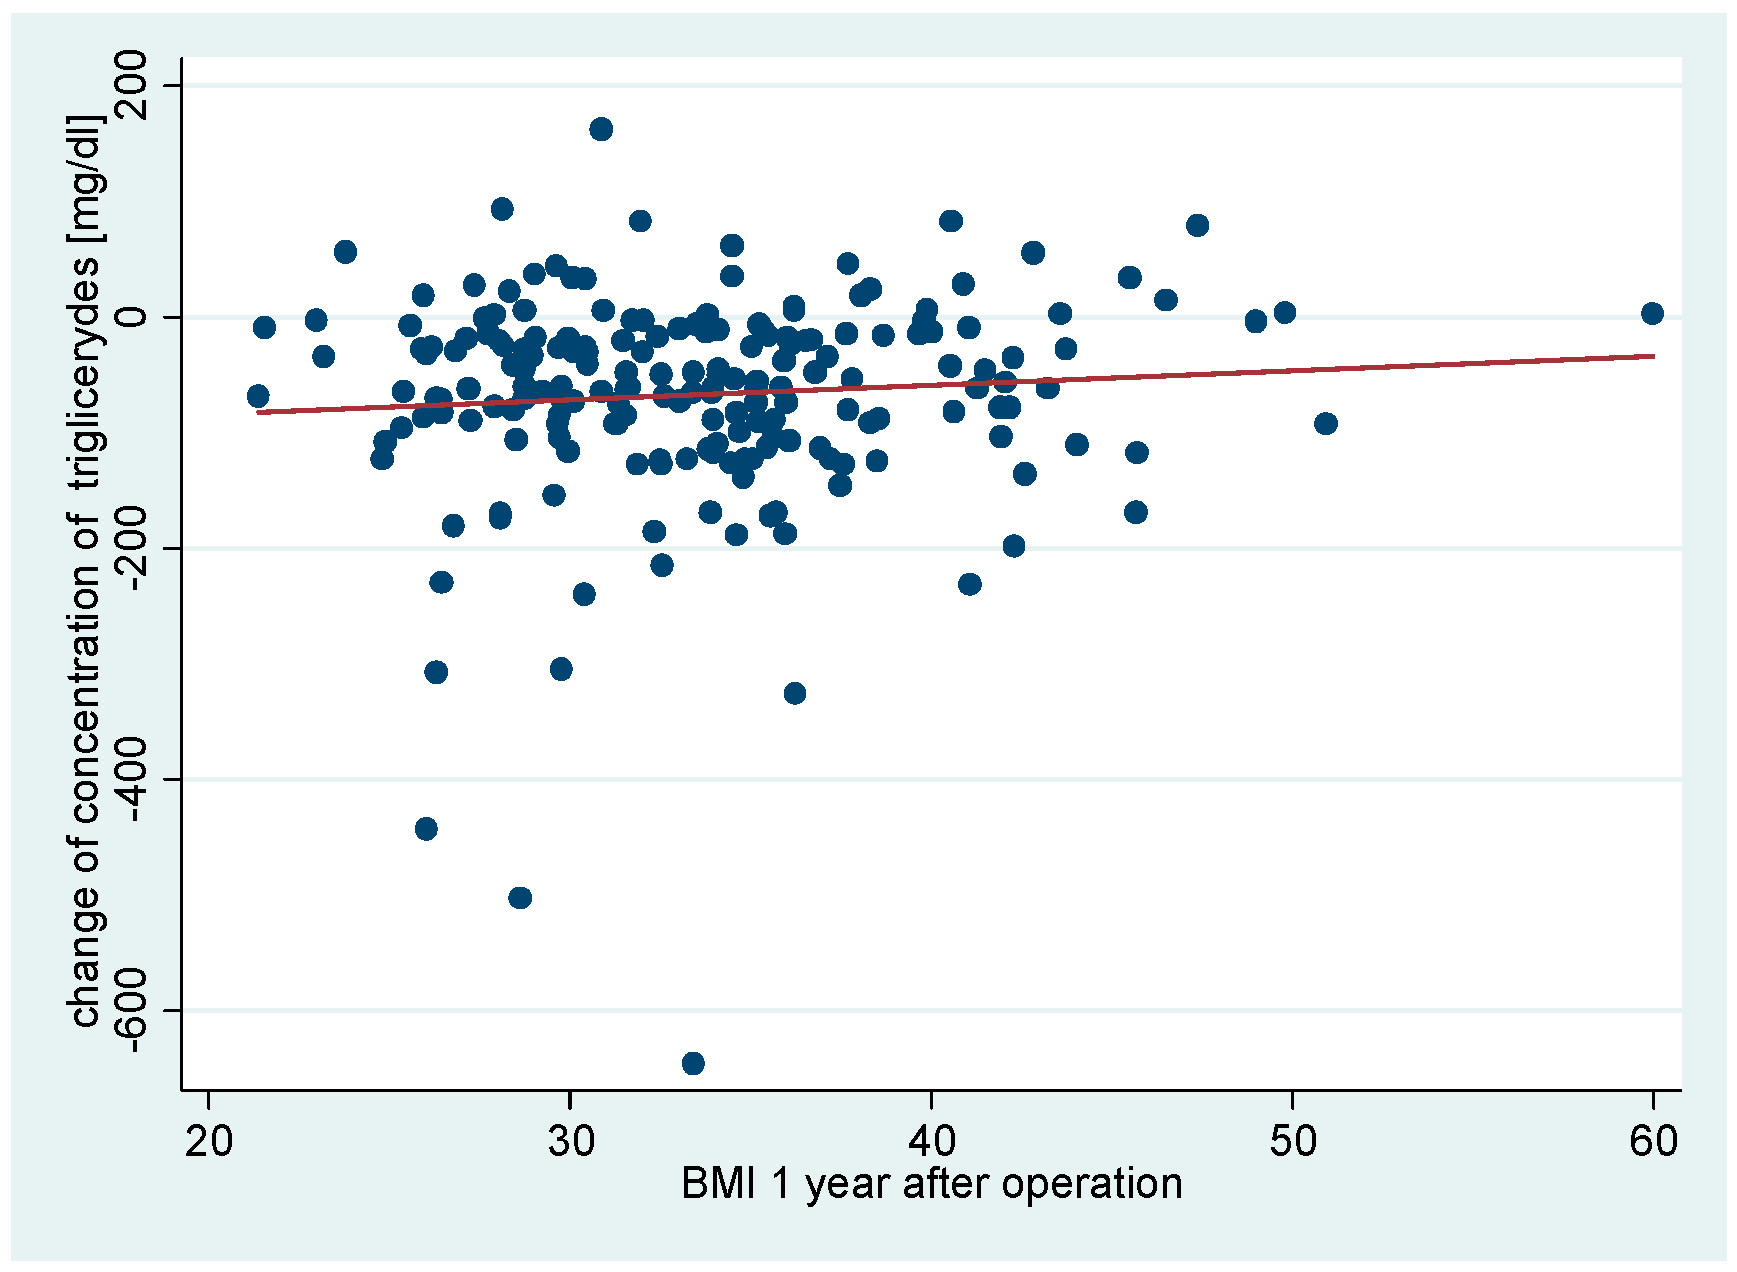
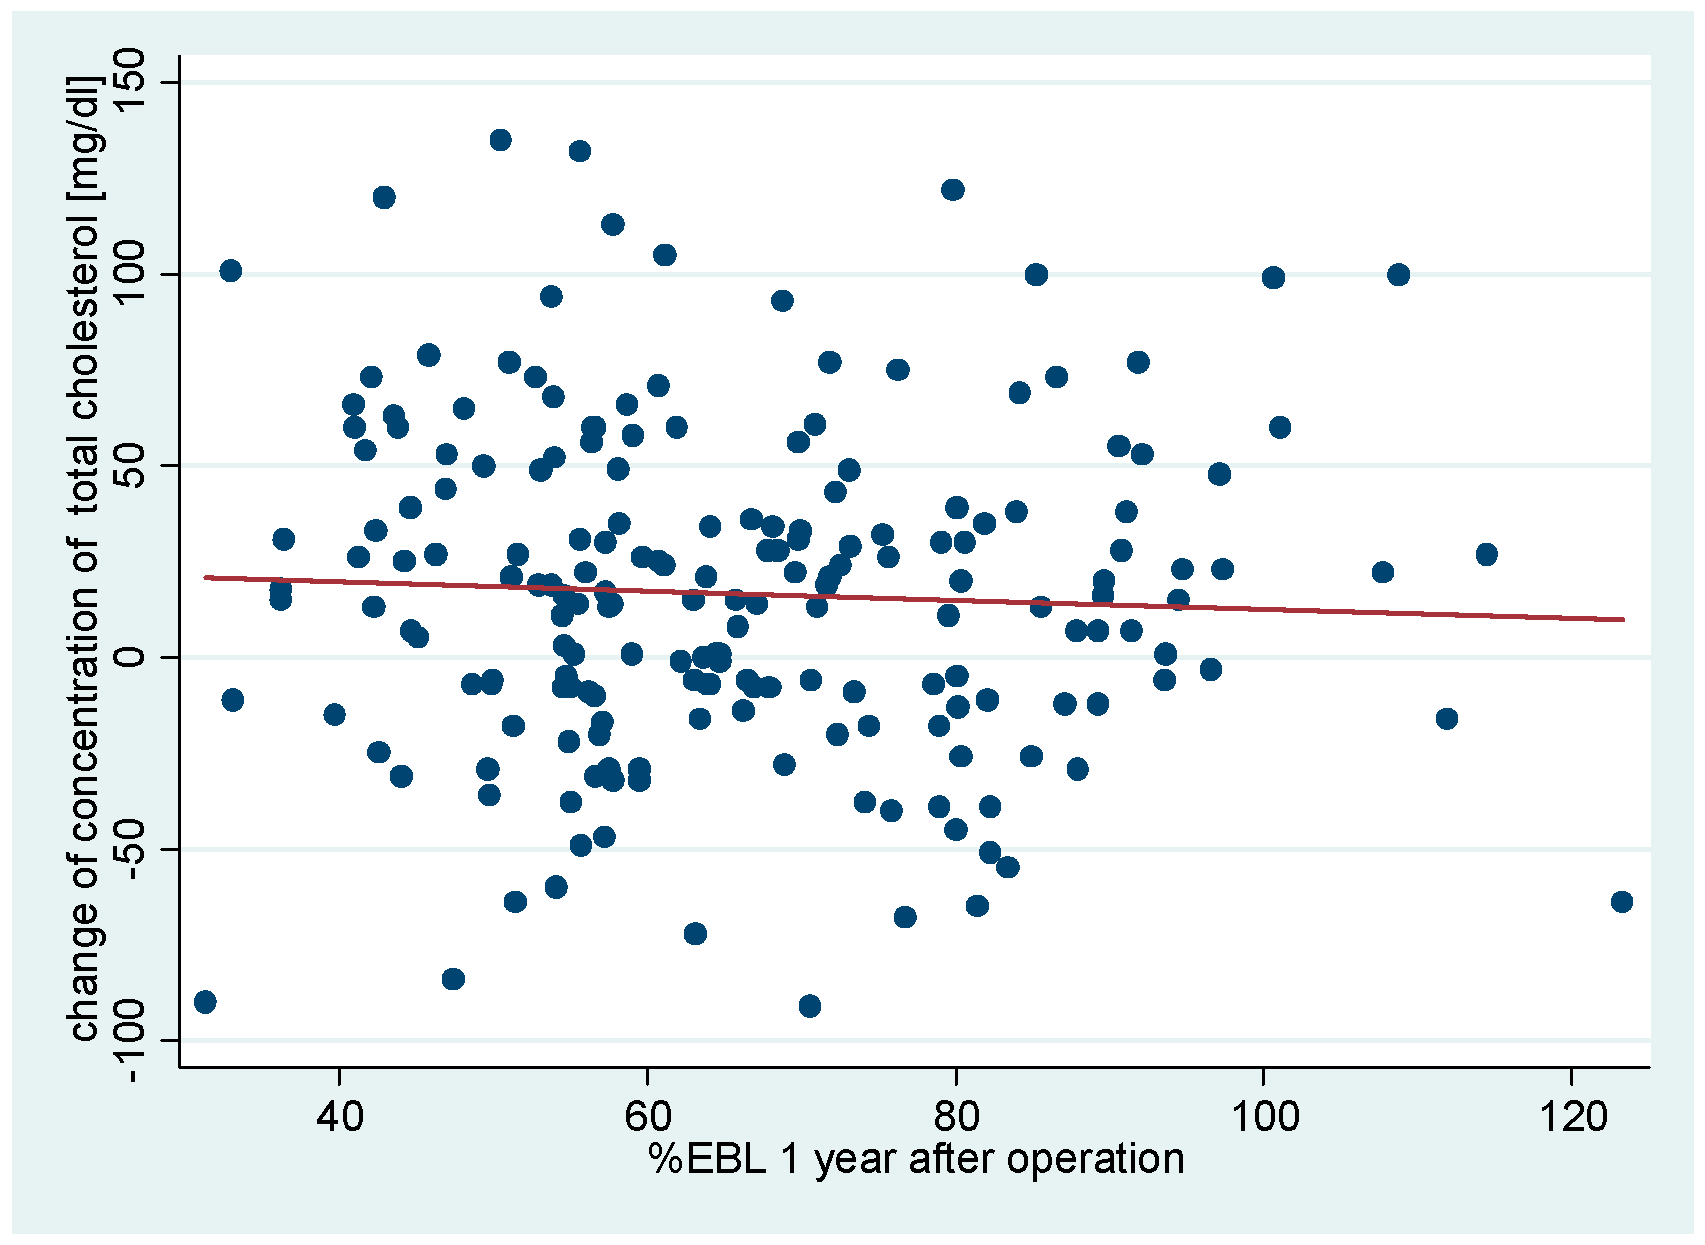
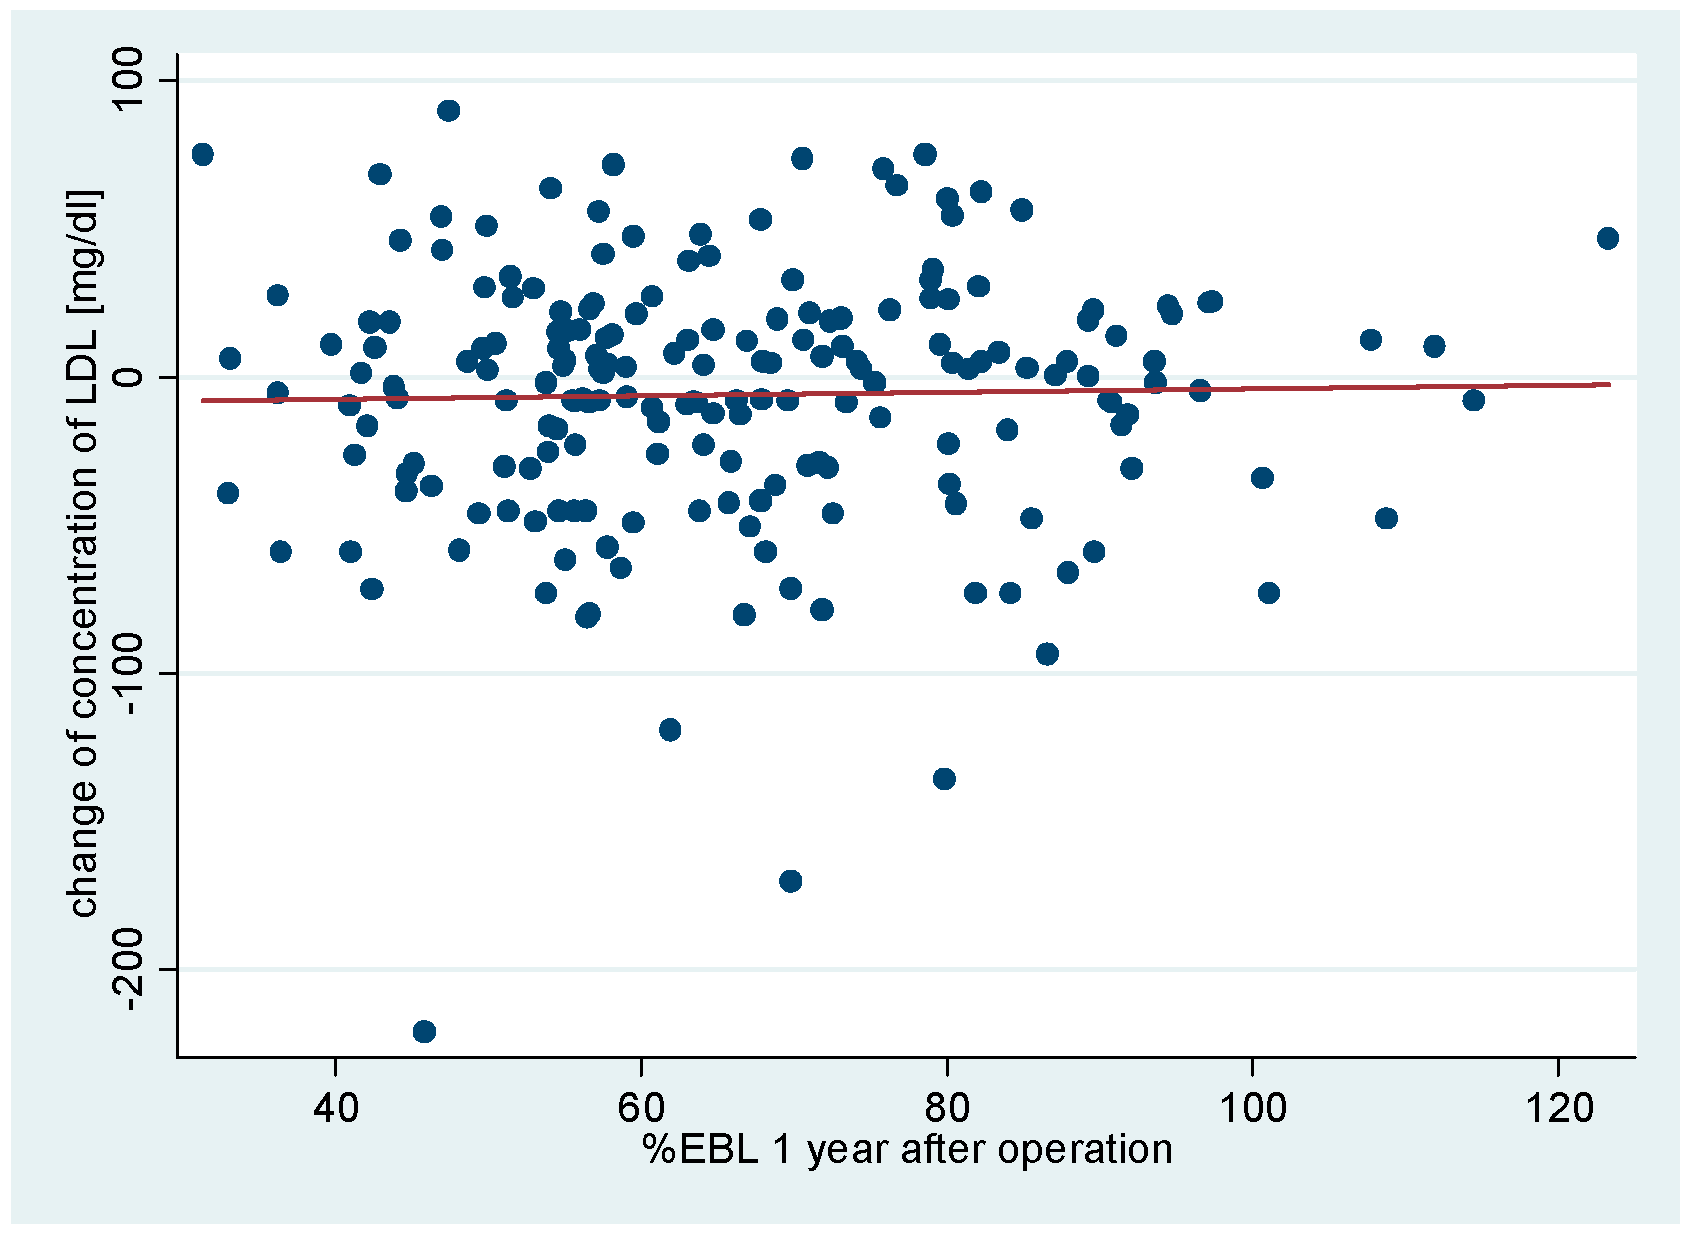
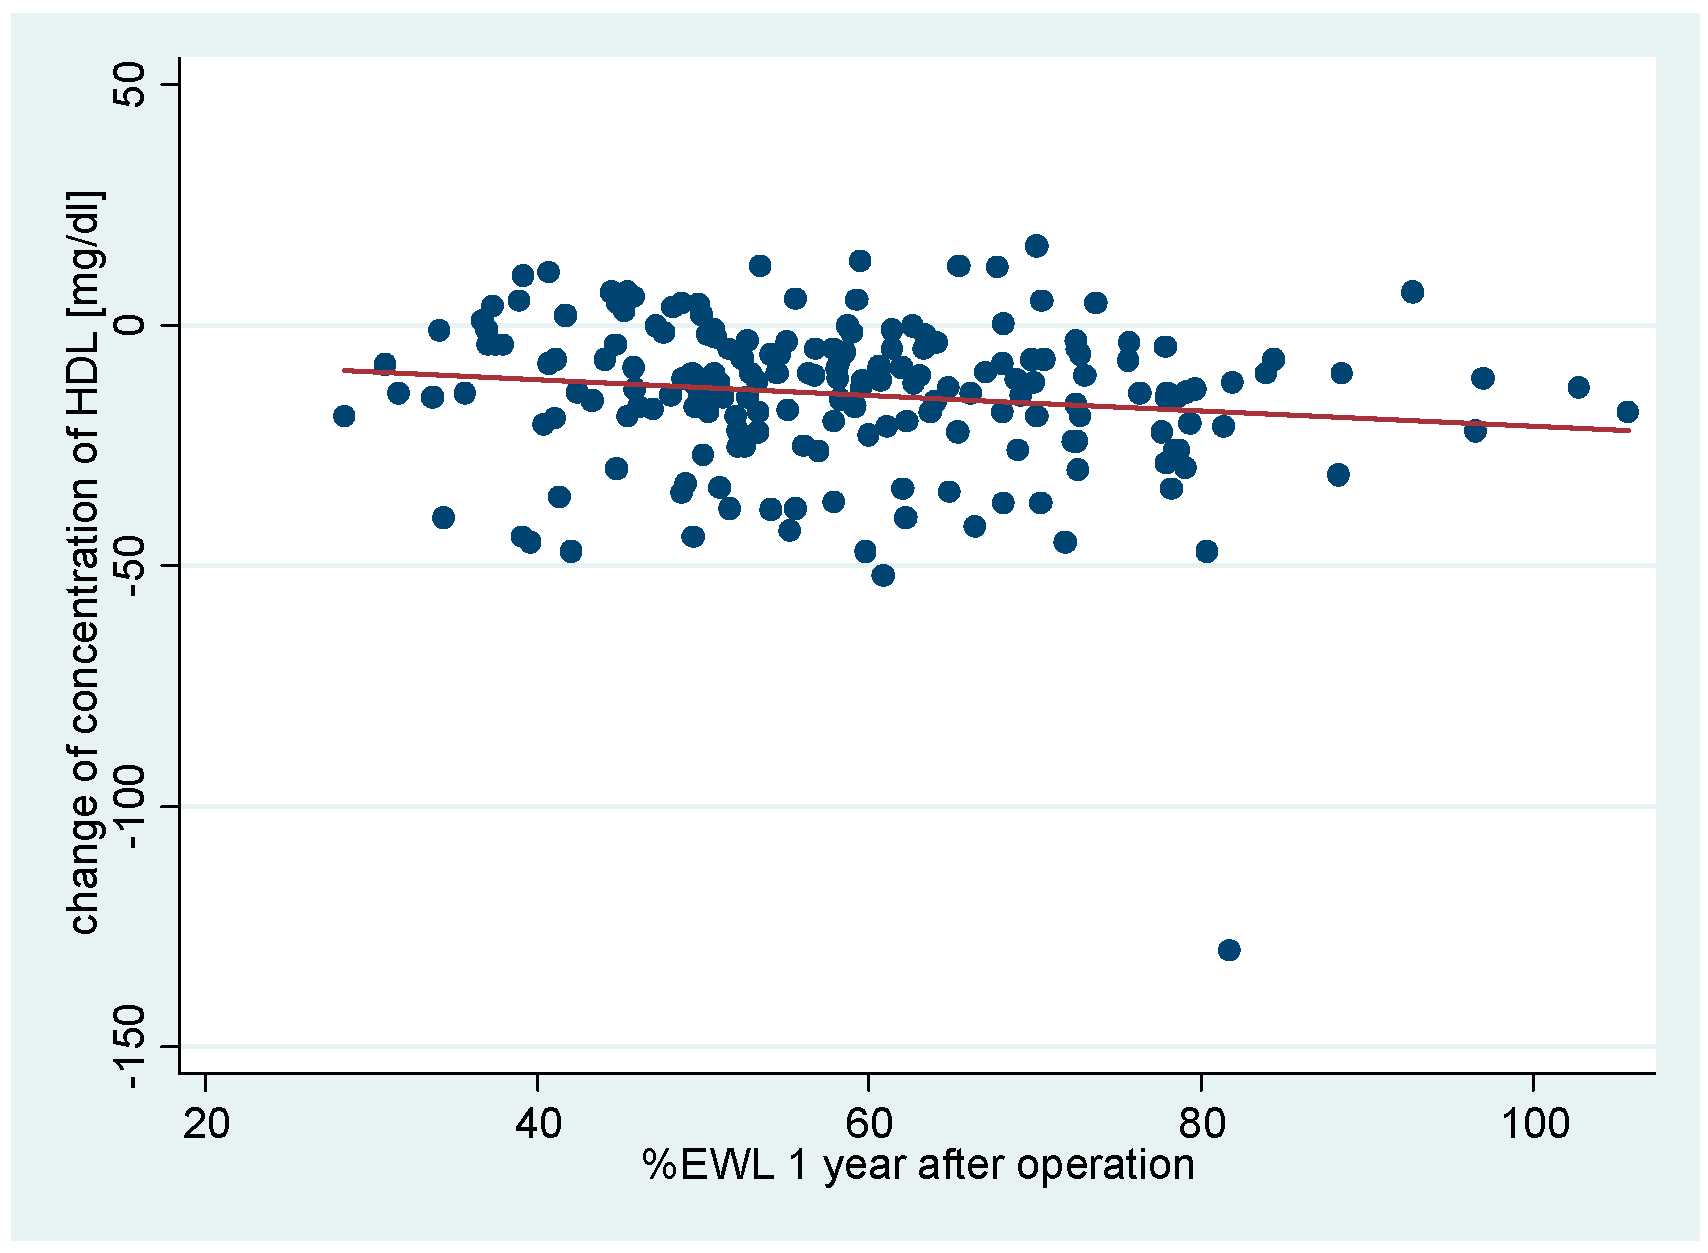
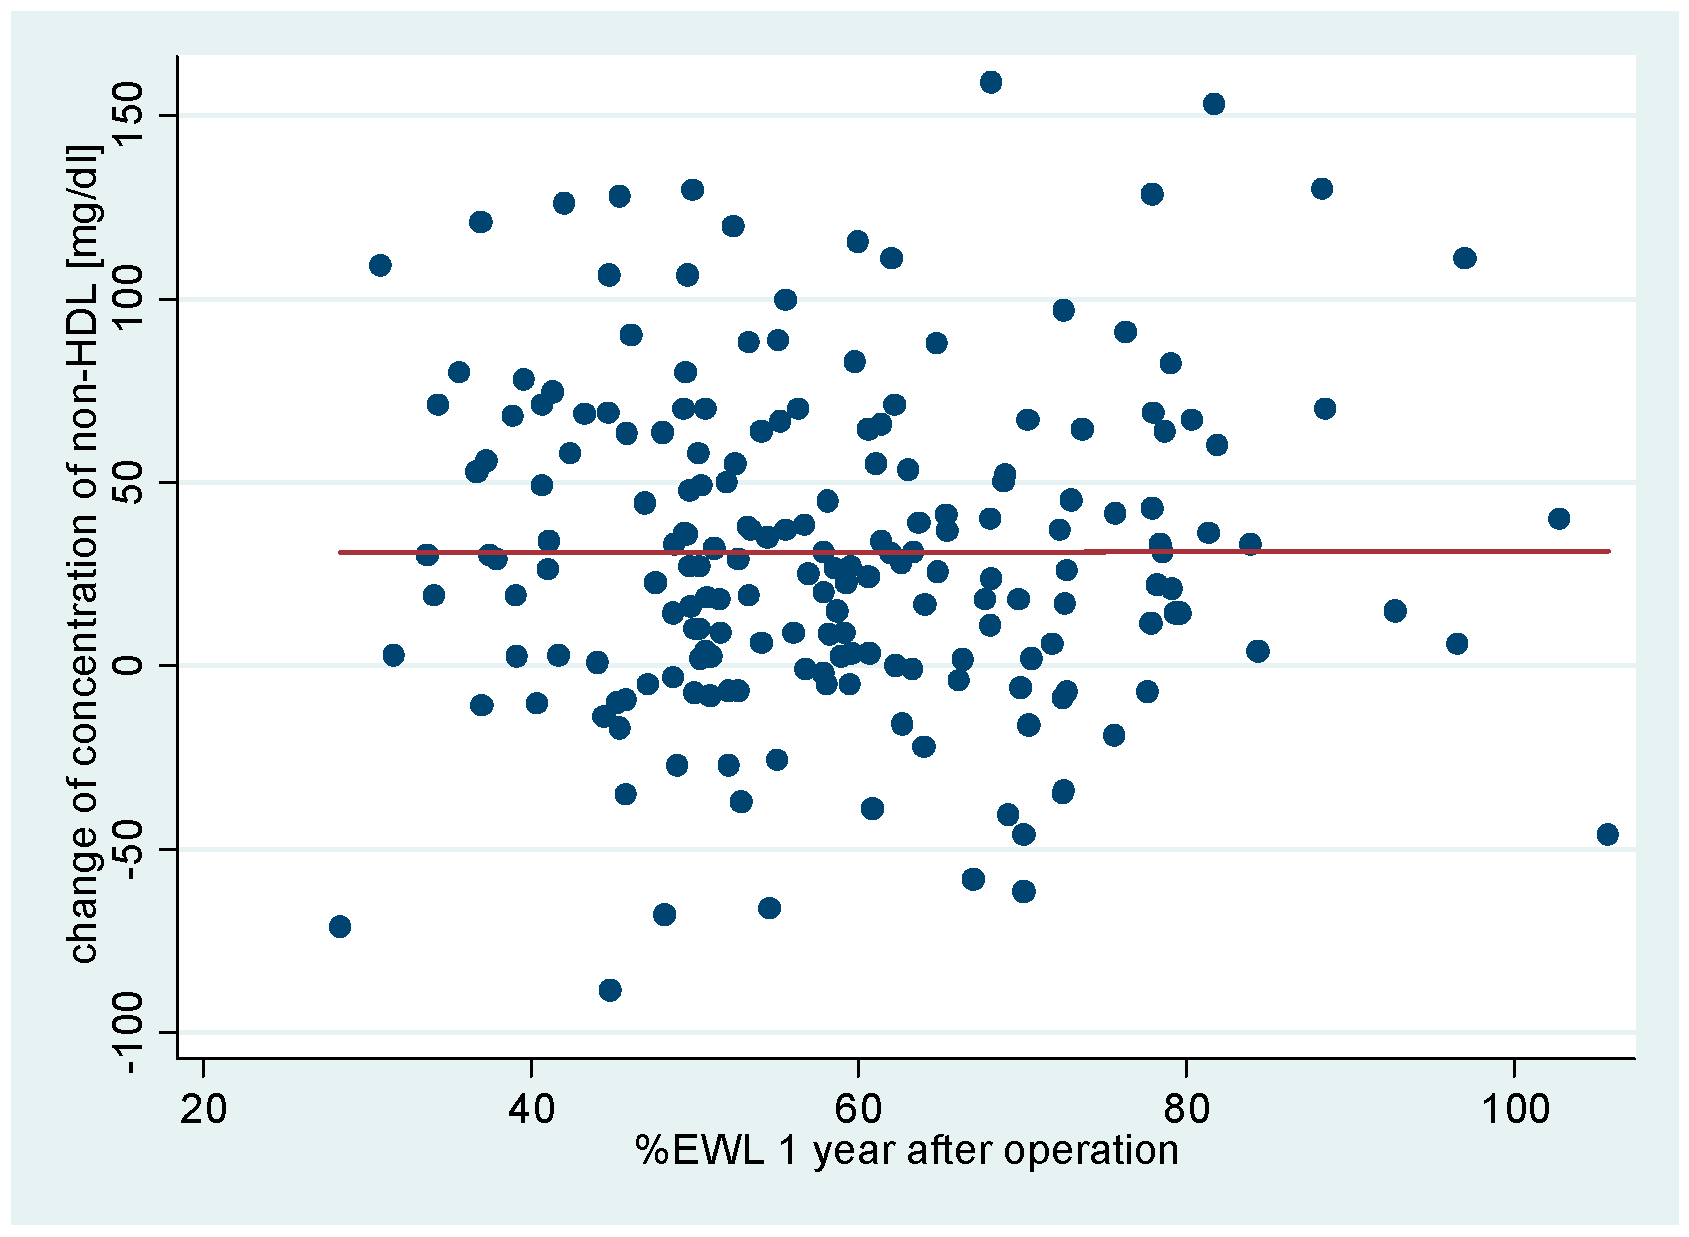
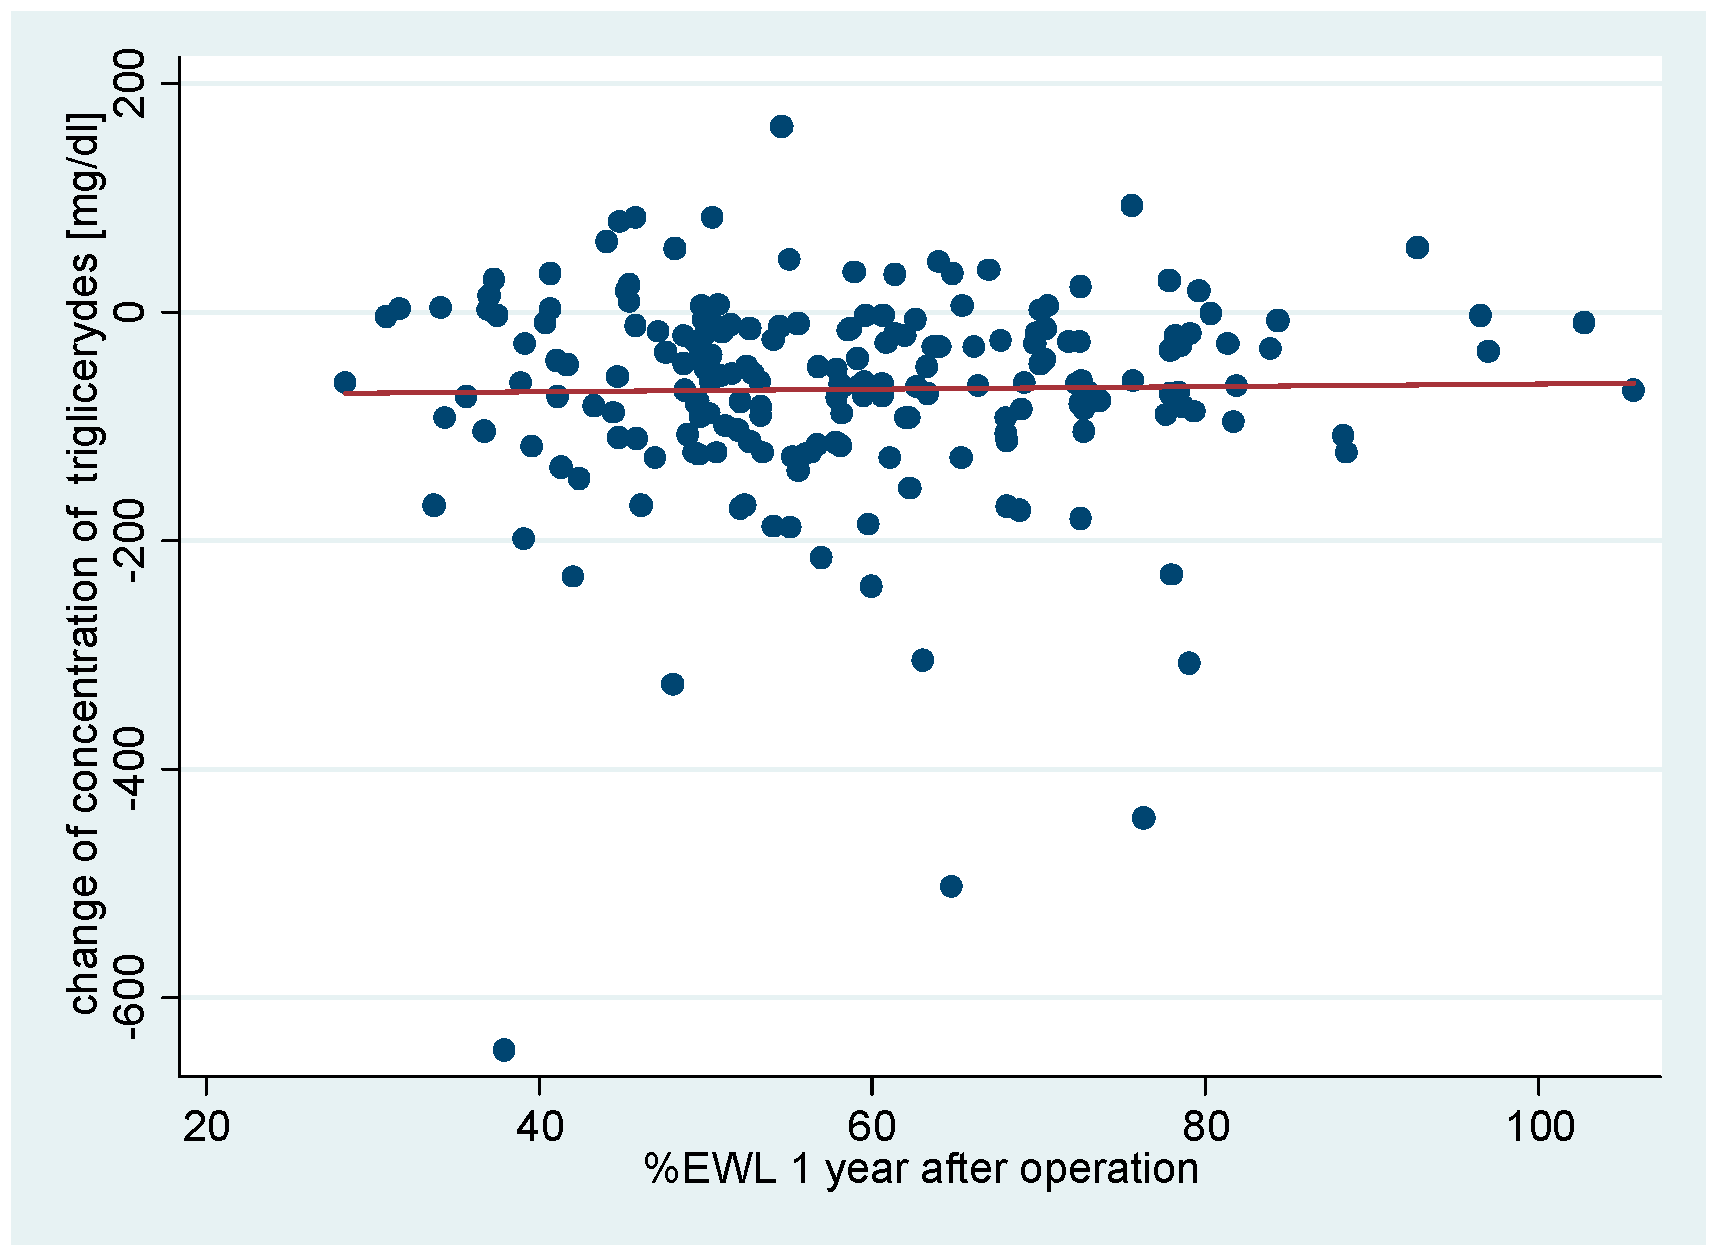
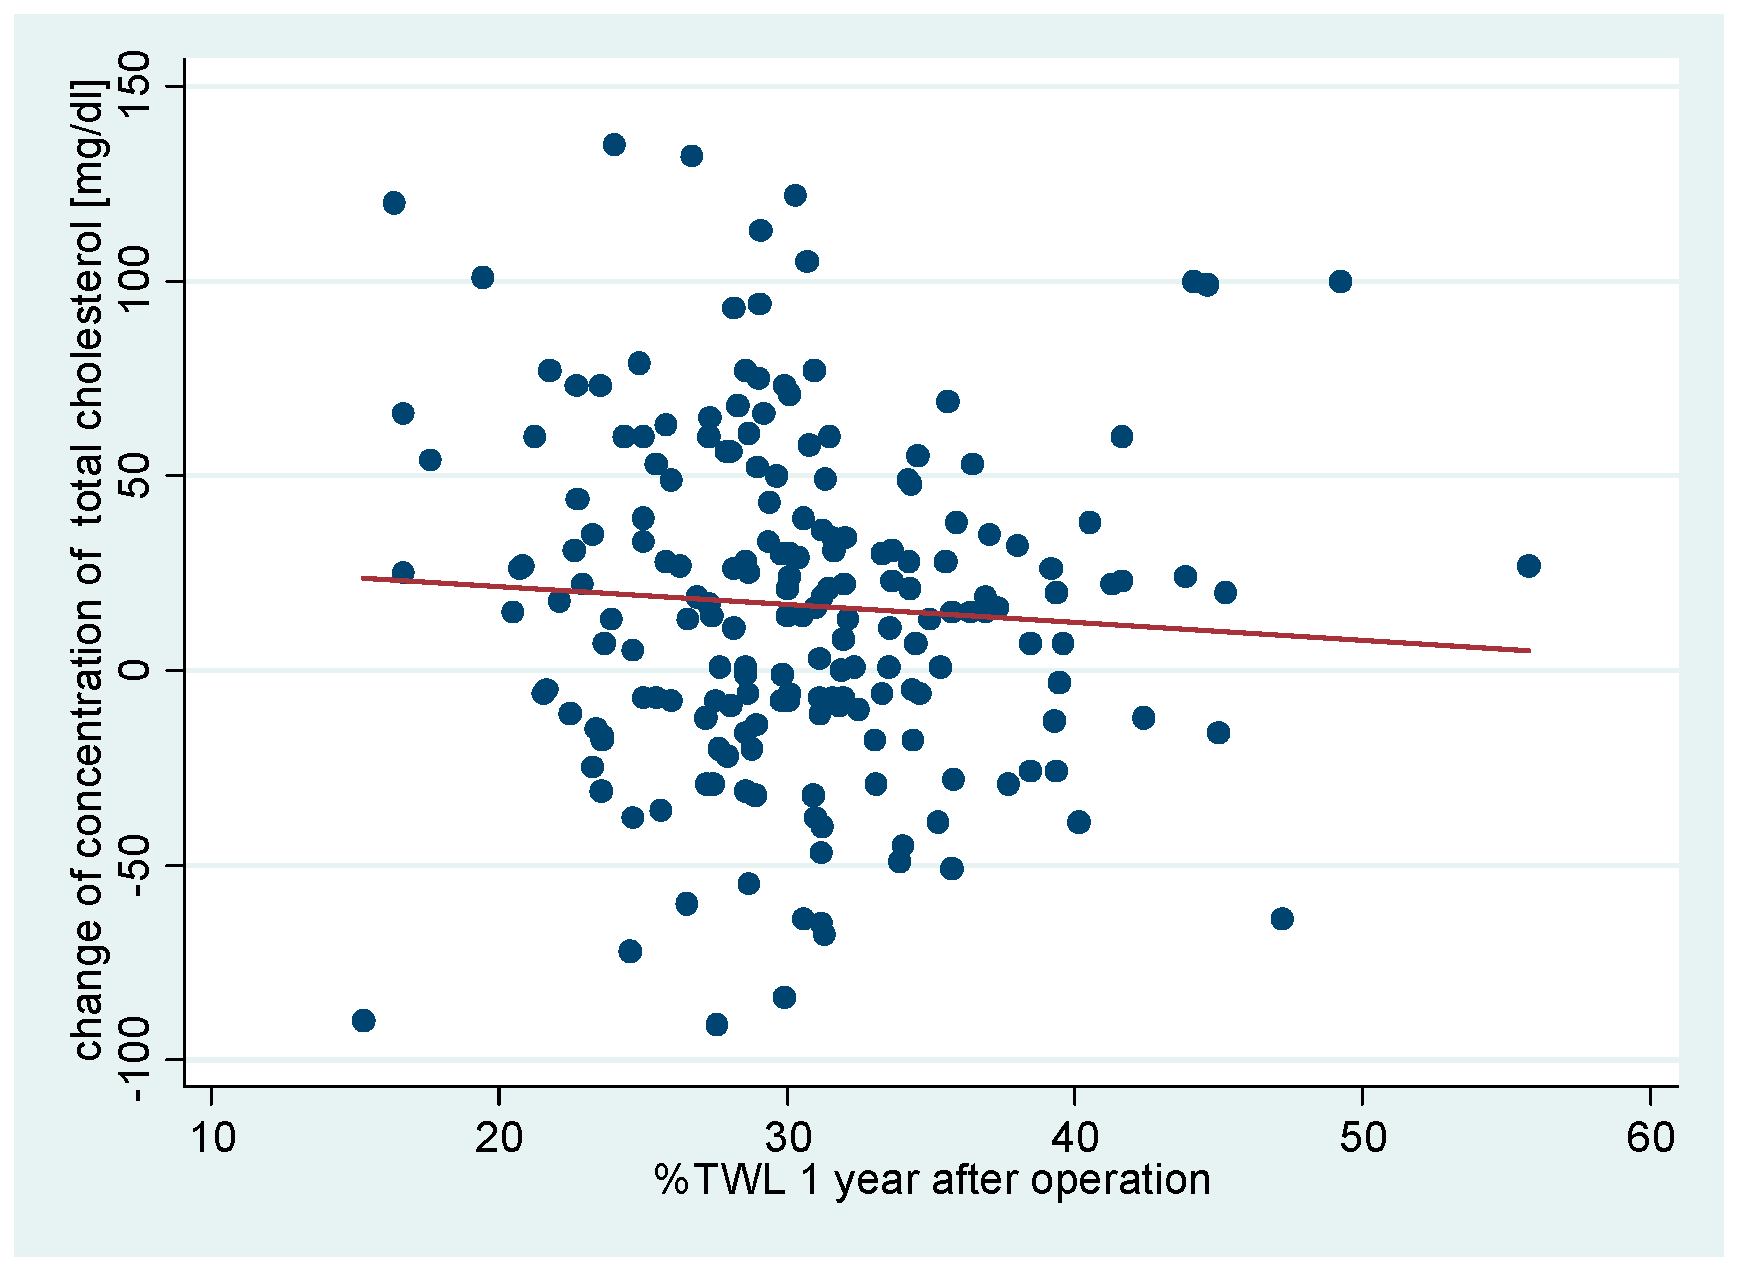
The correlation between changes in concentrations of total cholesterol and LDL, HDL, NI-HDL and triglycerides with bariatric results obtained after 12 months after the surgery BMI, %EWL, %EBL, %EBL, %TWL was examined (Table 3,
Chart 6,
Chart 7,
Chart 8,
Chart 9,
Chart 10,
Chart 11,
Chart 12,
Chart 13,
Chart 14,
Chart 15,
Chart 16,
Chart 17,
Chart 18,
Chart 19,
Chart 20,
Chart 21,
Chart 22,
Chart 23,
Chart 24 and
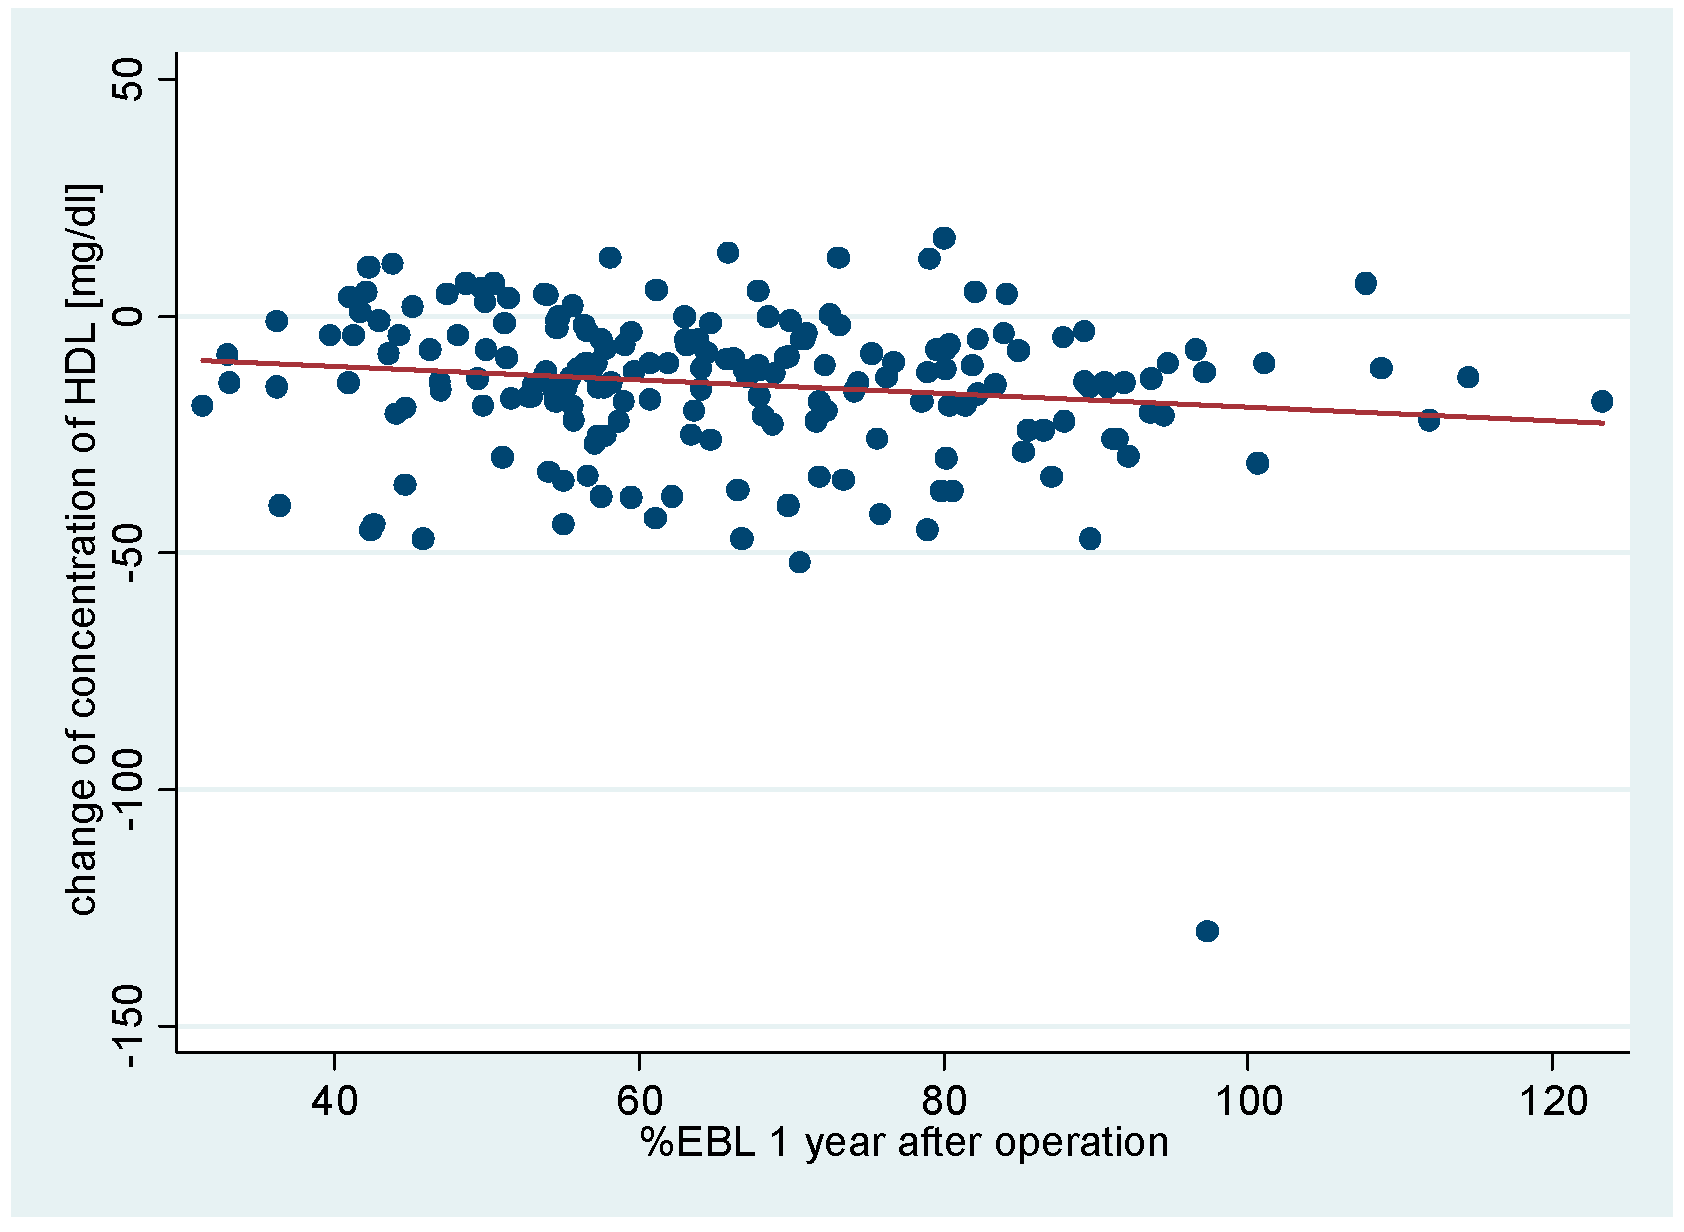
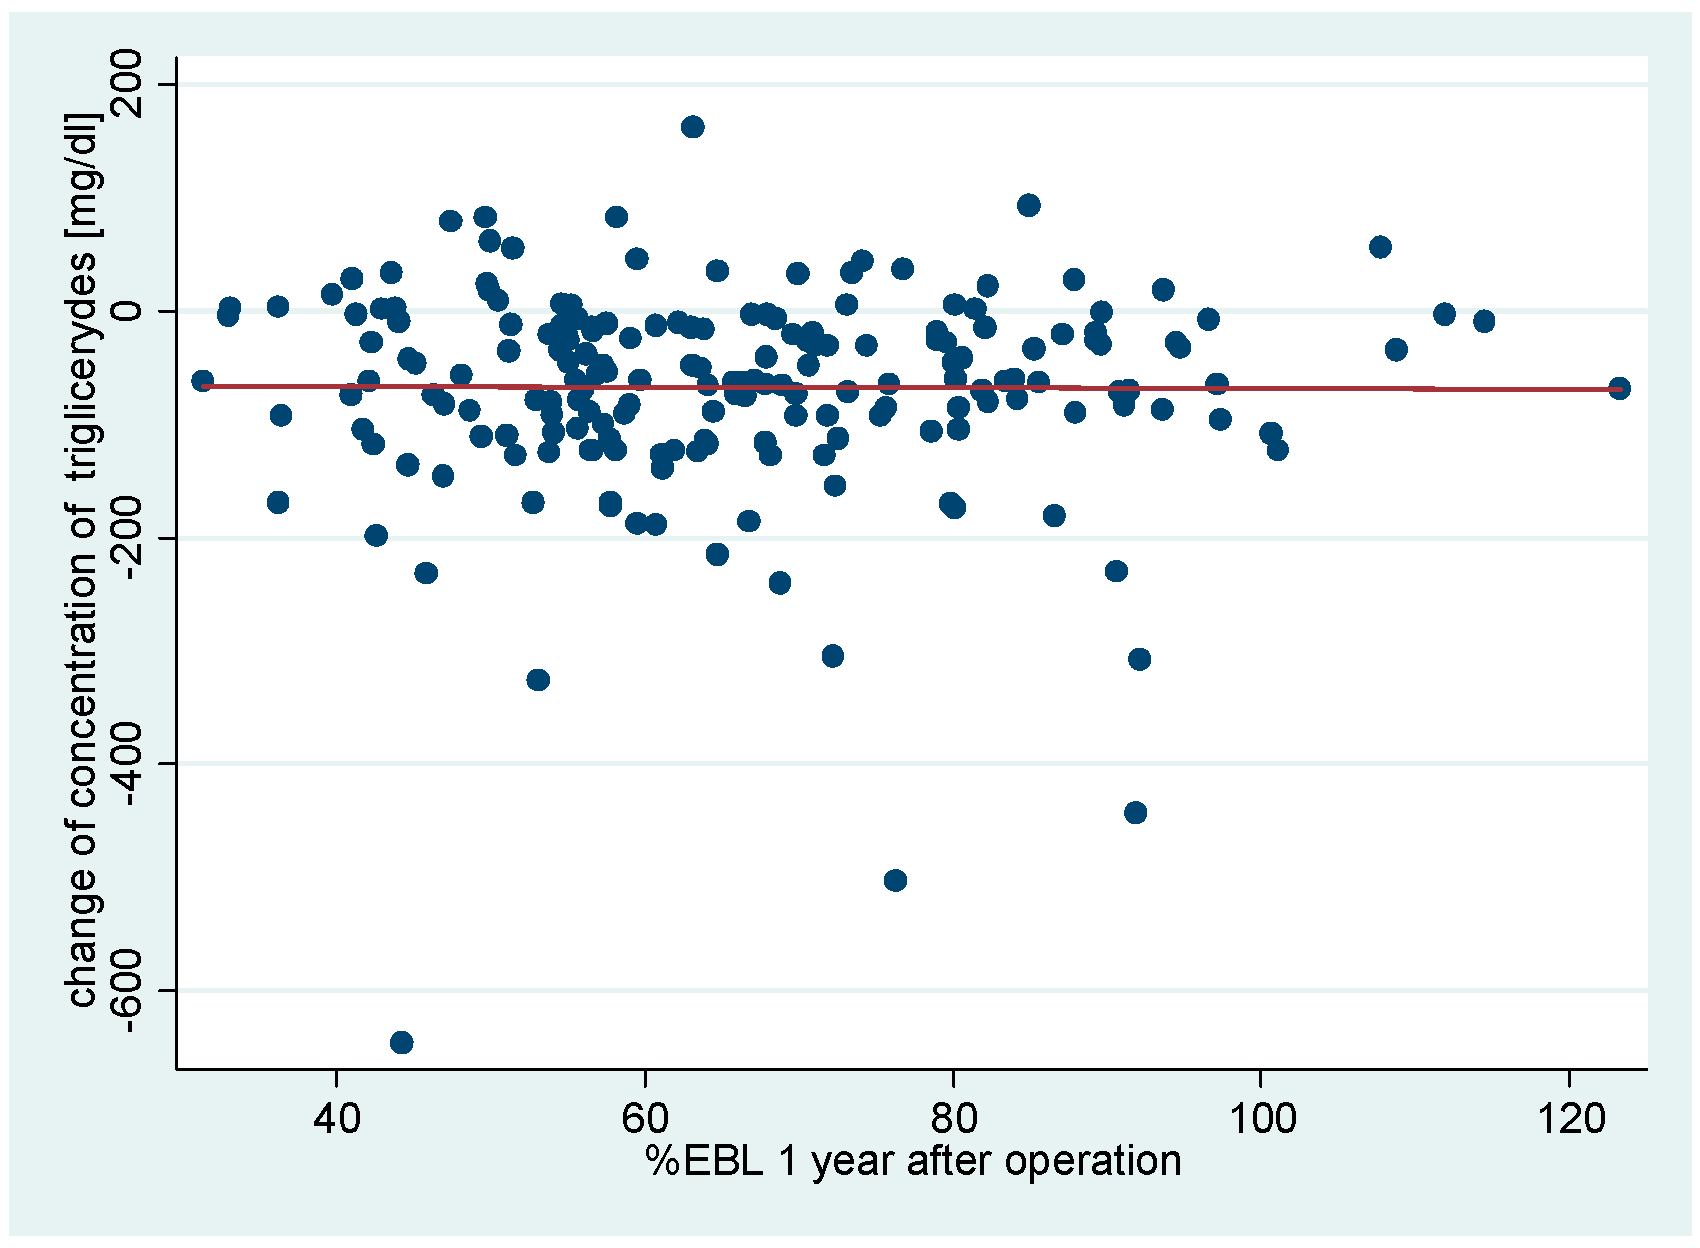
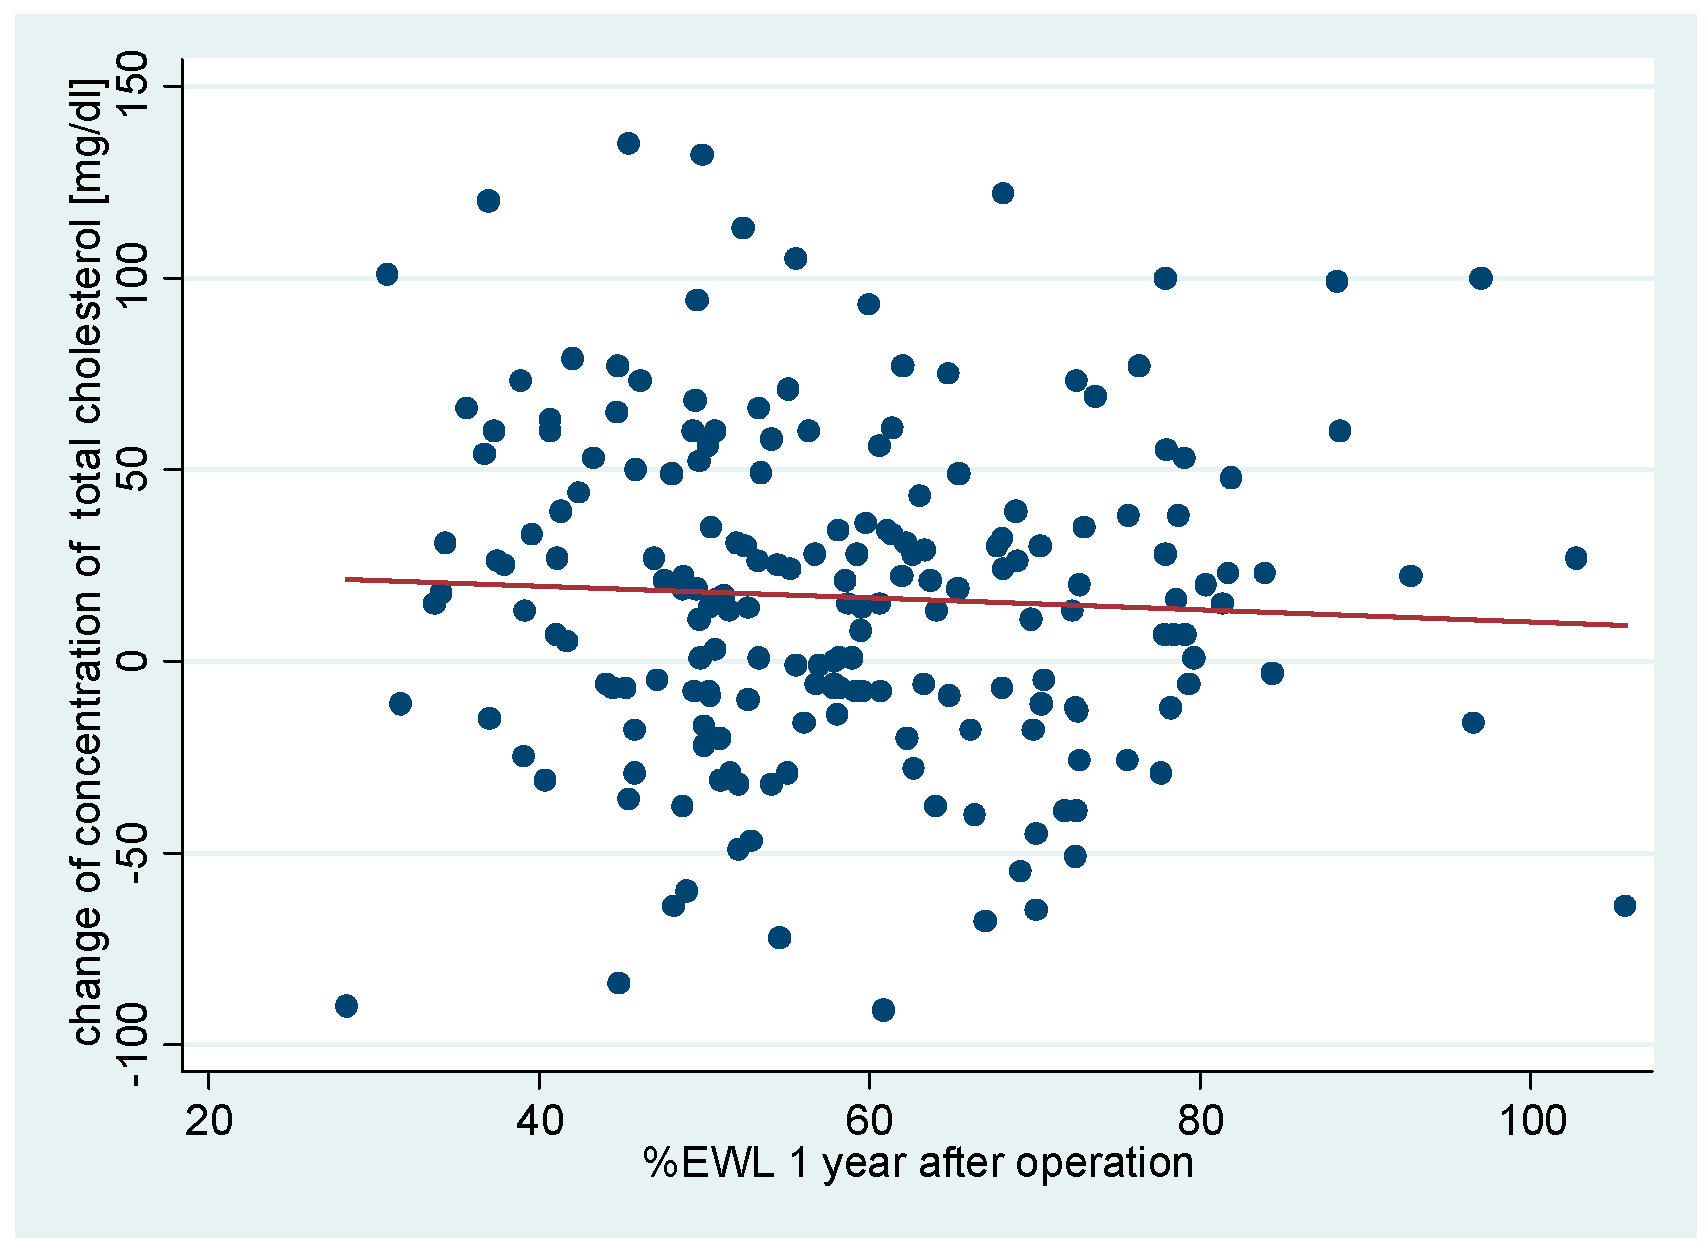
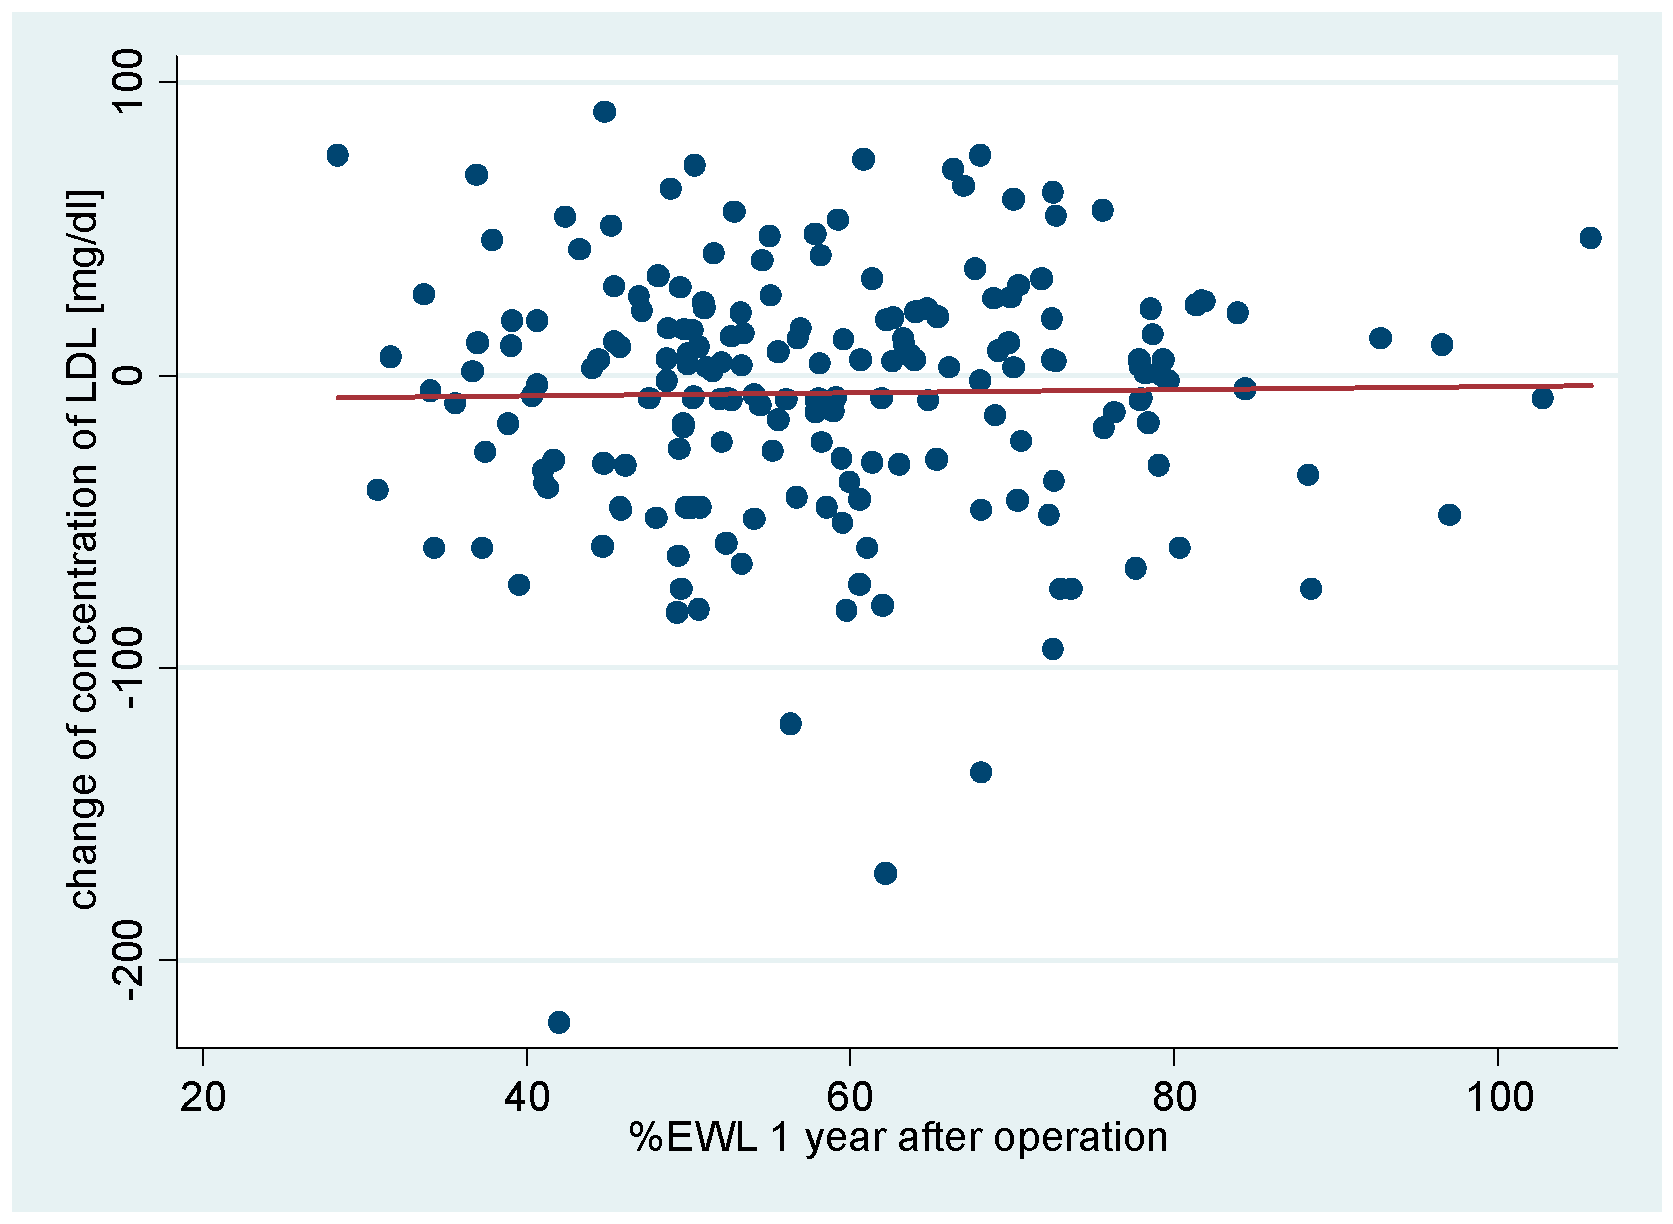
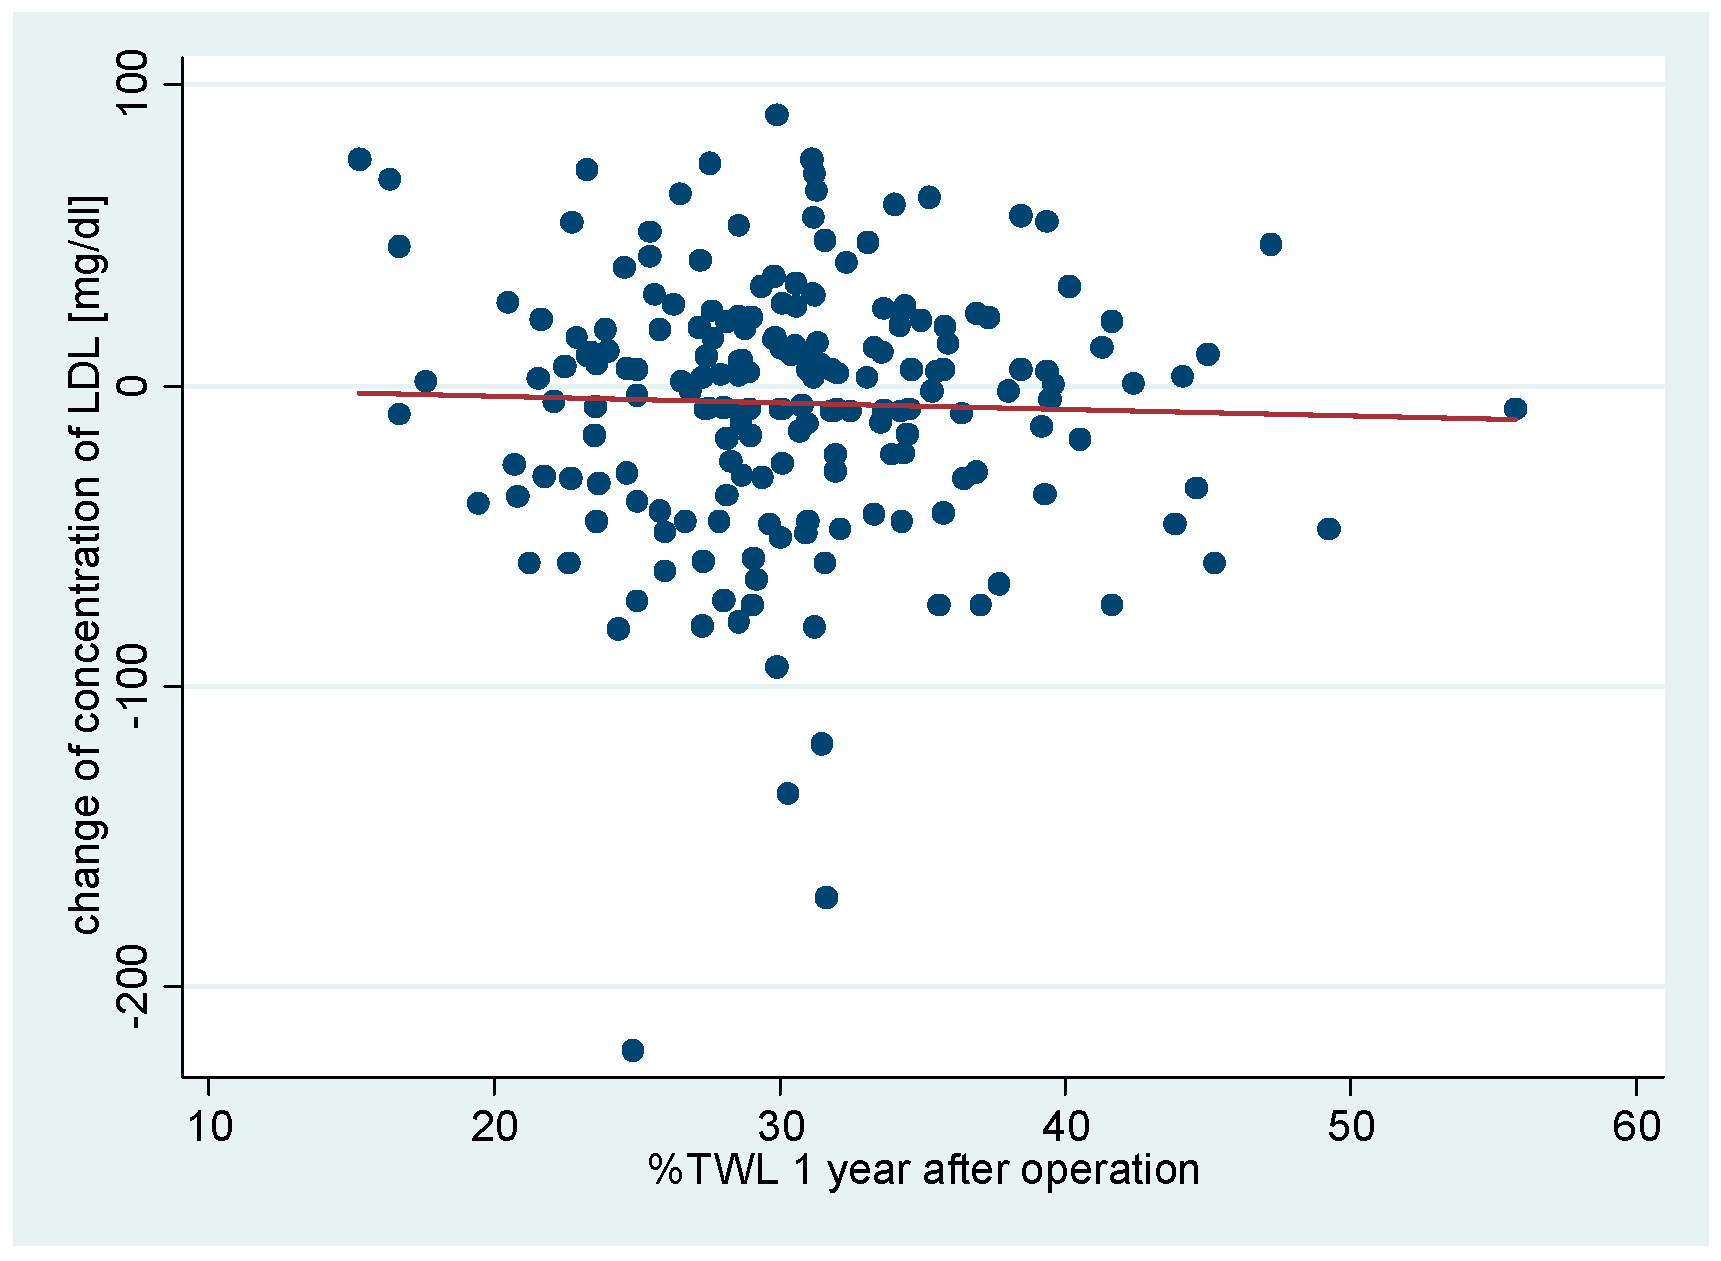
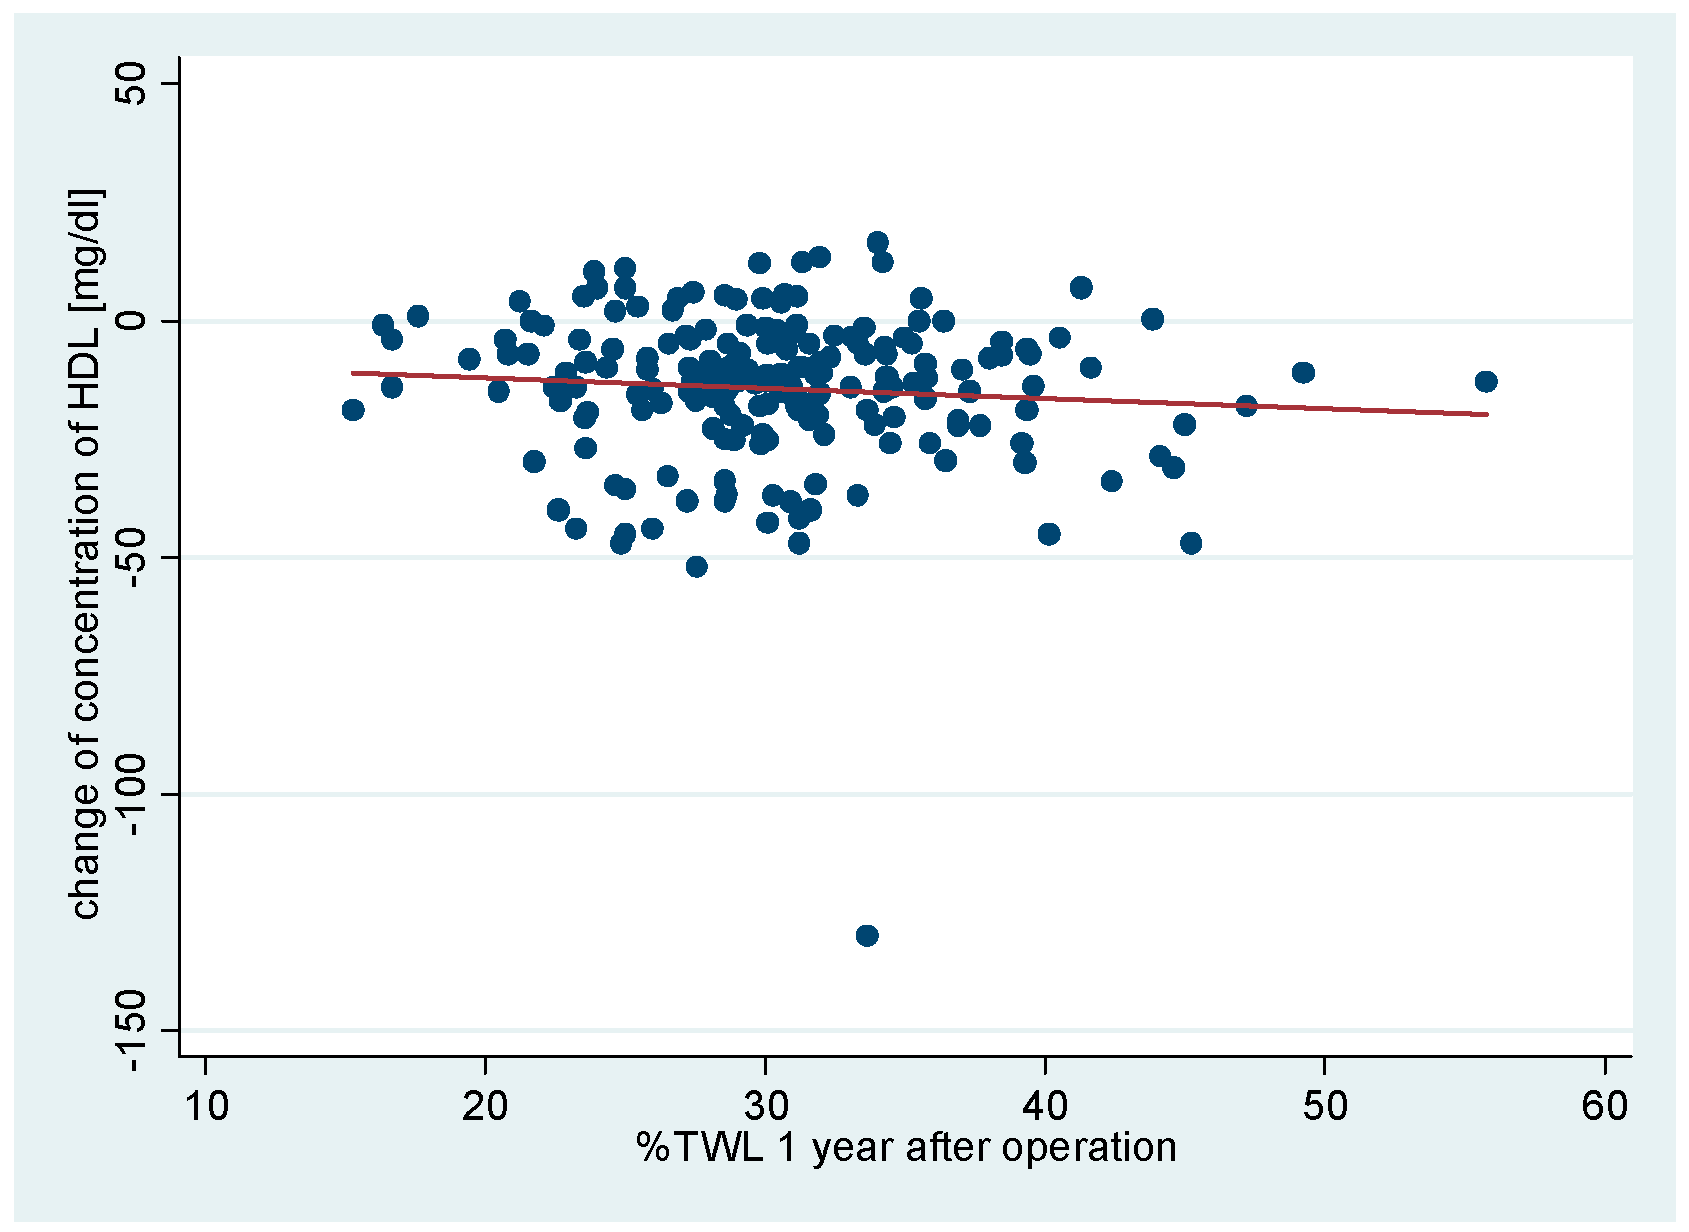
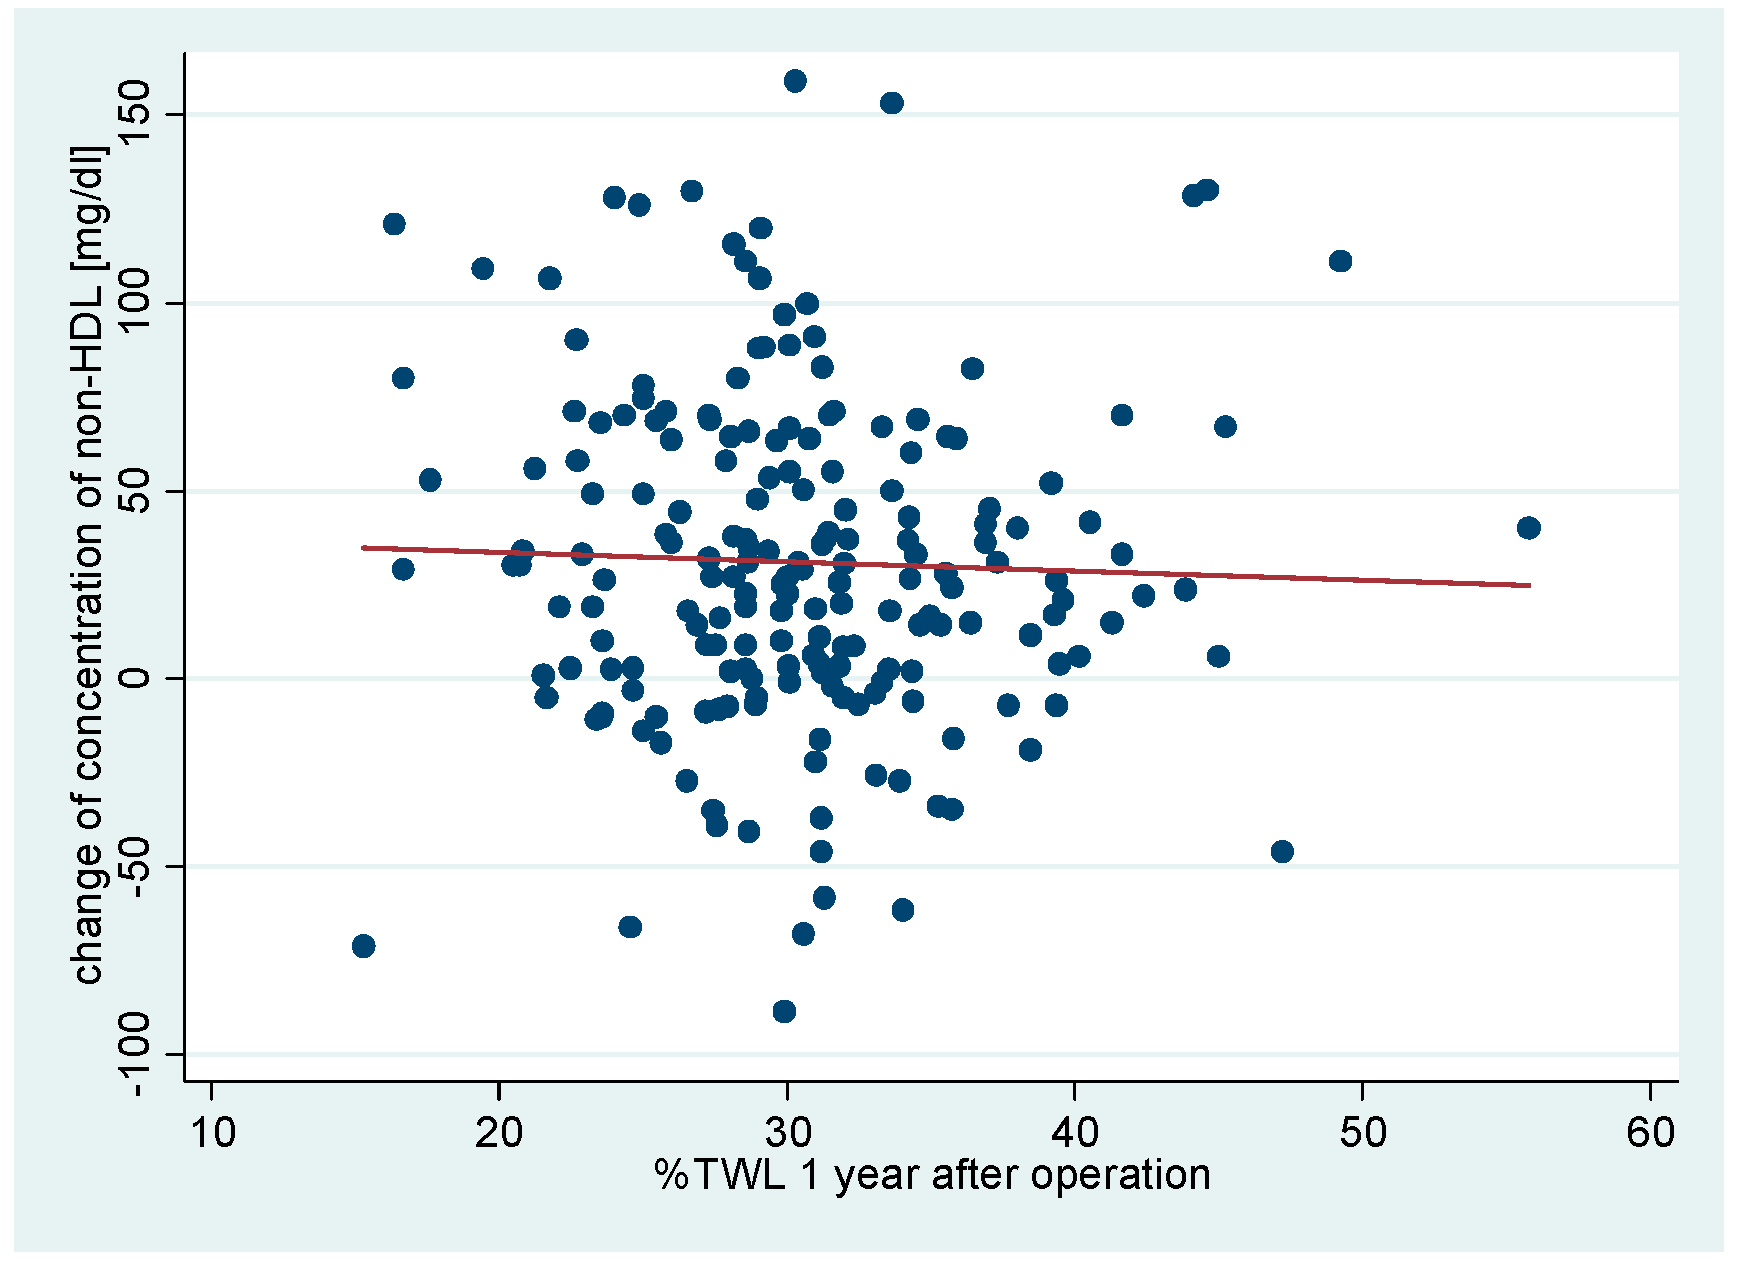
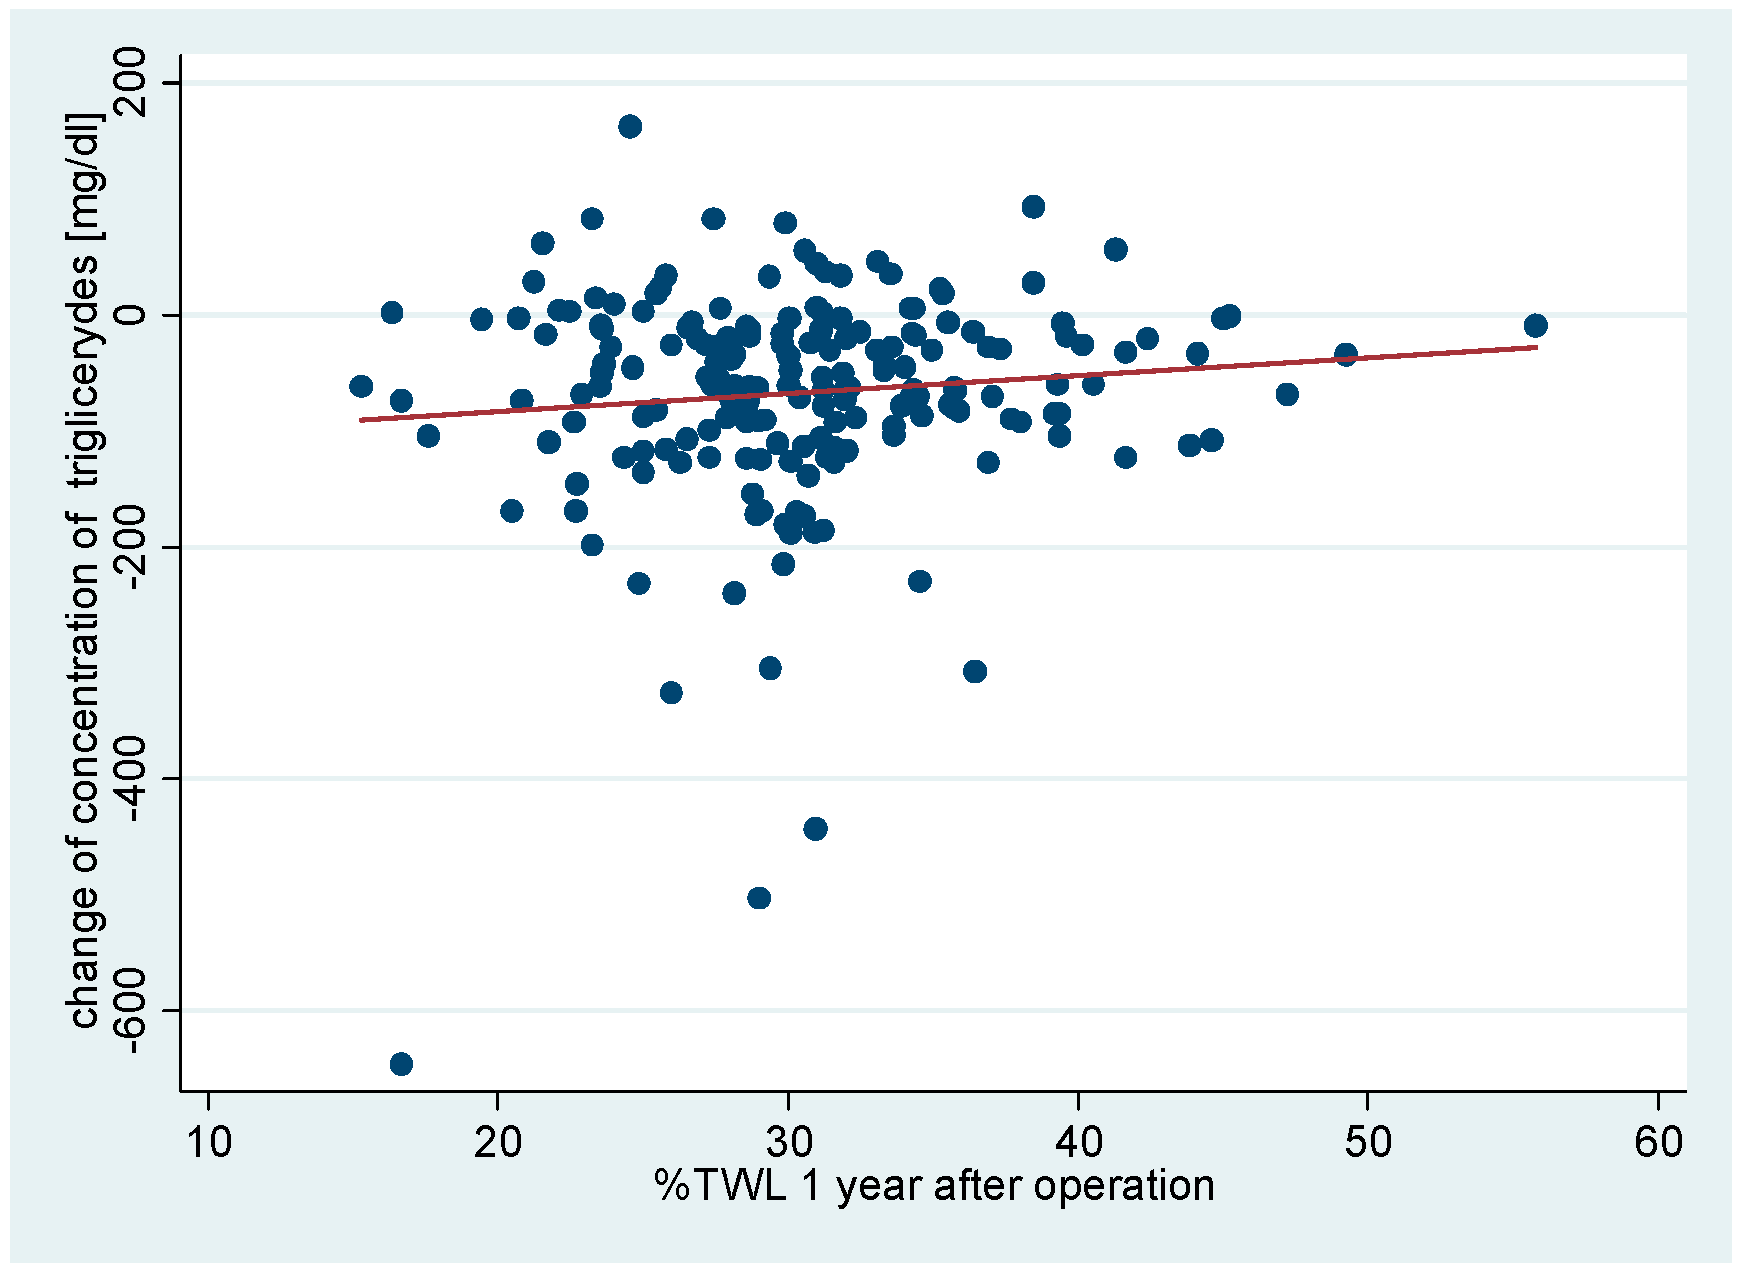
Chart 25). No correlation was observed between bariatric results and change in total cholesterol, low density lipoproteines LDL, non-HDL, or triglycerides. Correlation between BMI and %EWL and %EBL 12 months after surgery and a change in high density lipoprotein concentration were demonstrated. p <0.05 was recognized as the level of statistical significance.
| |
∆TC |
∆LDL |
∆HDL |
∆non-HDL |
∆TG |
| BMI |
R2=0.0001
p=0.8793 |
R2=0.0022
p=0.5171 |
R2=0.218
p=0.0389 |
R2=0.019
p=0.5482 |
R2=0.0069
p=0.2485 |
| %EBL |
R2=0.0024
p=0.4987 |
R2=0.0006
p=0.7329 |
R2=0.0245
p=0.0284 |
R2=0.0001
p=0.8919 |
R2=0.0000
p=0.9414 |
| %EWL |
R2=0.0028
p=0.4622 |
R2=0.0003
p=0.8081 |
R2=0.0213
p=0.0413 |
R2=0.0000
p=0.9798 |
R2=0.0003
p=0.8132 |
| %TWL |
R2=0.0045
p=0.3496 |
R2=0.0010
p=0.6661 |
R2=0.0073
p=0.2352 |
R2=0.0012
p=0.6340 |
R2=0.0112
p=0.1405 |
Chart 6.
Correlation between changes of concentration of total cholesterol with BMI 1 year after LSG.
Chart 6.
Correlation between changes of concentration of total cholesterol with BMI 1 year after LSG.
Chart 7.
Correlation between changes of concentration of LDL with BMI 1 year after LSG.
Chart 7.
Correlation between changes of concentration of LDL with BMI 1 year after LSG.
Chart 8.
Correlation between changes of concentration of HDL with BMI 1 year after LSG.
Chart 8.
Correlation between changes of concentration of HDL with BMI 1 year after LSG.
Chart 9.
Correlation between changes of concentration of non-HDL with BMI 1 year after LSG.
Chart 9.
Correlation between changes of concentration of non-HDL with BMI 1 year after LSG.
Chart 10.
Correlation between changes of concentration of triglycerides with BMI 1 year after LSG.
Chart 10.
Correlation between changes of concentration of triglycerides with BMI 1 year after LSG.
Chart 11.
Correlation between changes of concentration of total cholesterol with %EBL 1 year after LSG.
Chart 11.
Correlation between changes of concentration of total cholesterol with %EBL 1 year after LSG.
Chart 12.
Correlation between changes of concentration of LDL with %EBL 1 year after LSG.
Chart 12.
Correlation between changes of concentration of LDL with %EBL 1 year after LSG.
Chart 13.
Correlation between changes of concentration of HDL with %EBL 1 year after LSG.
Chart 13.
Correlation between changes of concentration of HDL with %EBL 1 year after LSG.
Chart 14.
Correlation between changes of concentration of non-HDL with %EBL 1 year after LSG.
Chart 14.
Correlation between changes of concentration of non-HDL with %EBL 1 year after LSG.
Chart 15.
Correlation between changes of concentration of triglycerides with %EBL 1 year after LSG.
Chart 15.
Correlation between changes of concentration of triglycerides with %EBL 1 year after LSG.
Chart 16.
Correlation between changes of concentration of total cholesterol with %EWL 1 year after LSG.
Chart 16.
Correlation between changes of concentration of total cholesterol with %EWL 1 year after LSG.
Chart 17.
Correlation between changes of concentration of LDL with %EWL 1 year after LSG.
Chart 17.
Correlation between changes of concentration of LDL with %EWL 1 year after LSG.
Chart 18.
Correlation between changes of concentration of HDL with %EWL 1 year after LSG.
Chart 18.
Correlation between changes of concentration of HDL with %EWL 1 year after LSG.
Chart 19.
Correlation between changes of concentration of non-HDL with %EWL 1 year after LSG.
Chart 19.
Correlation between changes of concentration of non-HDL with %EWL 1 year after LSG.
Chart 20.
Correlation between changes of concentration of triglycerides with %EWL 1 year after LSG.
Chart 20.
Correlation between changes of concentration of triglycerides with %EWL 1 year after LSG.
Chart 21.
Correlation between changes of concentration of total cholesterol with %TWL 1 year after LSG.
Chart 21.
Correlation between changes of concentration of total cholesterol with %TWL 1 year after LSG.
Chart 22.
Correlation between changes of concentration of LDL with %TWL 1 year after LSG.
Chart 22.
Correlation between changes of concentration of LDL with %TWL 1 year after LSG.
Chart 23.
Correlation between changes of concentration of HDL with %TWL 1 year after LSG.
Chart 23.
Correlation between changes of concentration of HDL with %TWL 1 year after LSG.
Chart 24.
Correlation between changes of concentration of non-HDL with %TWL 1 year after LSG.
Chart 24.
Correlation between changes of concentration of non-HDL with %TWL 1 year after LSG.
Chart 25.
Correlation between changes of concentration of triglycerides with %TWL 1 year after LSG.
Chart 25.
Correlation between changes of concentration of triglycerides with %TWL 1 year after LSG.
Discussion
Obesity is undoubtedly one of the largest problems of modern health care. According to The World Obesity Federation, 1 billion population will live with obesity in 2030 [
14]. The scale of the problem forces to look for effective methods of preventing and treating obesity and coexisting diseases to reduce the morbidity and mortality associated with obesity.
Presented results of the 1-year observation of patients after sleeve gastrectomy confirm the effectiveness of surgery in the treatment of obesity and weight reduction. Considering the confirmed close relationship of body mass and obesity with comorbidity and mortality, statistically significant decrease in body weight and BMI after surgery lead to conclusion on indisputable health benefits after laparoscopic sleeve gastrectomy [
14,
15]. Available review and research publications analyzing the subject of postoperative weight loss, BMI, %TWL, %EWL, %EBL after LSG were in line with the results obtained in our study [
16,
17]. Sleeve gastectomy is considered an effective and safe method of treating obesity [
18,
19].
The parameter of the assessment of changes in patient’s lipid profile after the surgery was observed in the control points of the TC, TG, HDL, LDL and NI-HDL lipid fractions. Analysis of changes in the above lipidogram parameters among patients undergoing laparoscopic sleeve gastrectomy after 1, 3, 6 and 12 months of postoperative control showed different, non-linear variations of the average concentrations of individual fractions in the group, however, the final effect of the procedure obtained after 1 year of observation was a reduction in the average atherogenic levels of lipids, i.e. TC, TG, LDL-C and NI-HDL, which was accompanied by a simultaneous increase in the level of antiatherosclerotic HDL-C lipoprotein.
Such clinically beneficial characteristics of changes in the lipid profile occurring after bariatric procedures is also described by many other authors studying the issue [
20,
21,
22]. Regading the average concentration of HDL-C lipid fractions and triglycerides in the plasma of analyzed patients obtained at the end of the observation tand the criteria for diagnosing metabolic syndrome, it should be noticed that the decrease of TG level below the threshold value of 150 mg/dl was obtained, however, the concentration of HDL-C incrased above the desired 50 mg/dl, so this procedure proved to be effective in the treatment of dyslipidemia defined by the criteria of the metabolic syndrome.
In the assessment of cardiovascular risk, researchers and clinical practice take into account the treatment of atherogenic dyslipidemia, based mainly on reduction of low-density fraction of LDL cholesterol. Scientific research confirms that the reduction of LDL fraction correlates most closely with reducing cardiovascular risk [
23]. Scientific data is available indicating the role of non-HDL as an alternative therapeutic determinant in the assessment of CVD risk, as covering all fractions containing apoB with stronger correlation with CDV risk tham LDL concentration in patients with high TG concentration in patients who were not fasting at time of examination. Non-HDL may be considered an alternative therapeutic goal in the treatment of dyslipidemia and prevention of cardiovascular diseases, but it is not widely used [
24]. In connection with the above, a beneficial effect of bariatric operations may be observed in CVD risk reduction based on changes in the lipid profile in the form of a decrease in LDL.
Atherogenic properties of lipoproteins rich in TG is widely proved [
25]. Some authors indicate the significant importance of hypertriglyceridemia and low HDL levels on the increase in cardiovascular risk. Although genetic evidence indicated triglycerides (TG) in plasma as an independent risk factor of CVD, no consensus has been achieved as to the targeting of the elevated level of these lipoproteins to prevent CVD [
25].
Conclusions
Laparoscopic sleeve gastrectomy is an effective method of morbid obesity treatment, and its effects are permanent. It is safe and low risk of complications is observed regardig this method.
Sleeve gastrectomy improves lipid profile independently of weight loss, reducing the concentration of total cholesterol, LDL, non-HDL, triglycerides and increasing HDL concentration. Therapeutic effect is observed in lipid fractions, the concentrations of which are taken into account in diagnostics of MS.
The correlation of bariatric effects with a change in high density lipoproteins was proved. No such correlations were observed in other lipid fractions.
Author Contributions
Conceptualization, P.P., P.W. and H.R.H.; validation, P.P., J.R.Ł. H.R.H.; resources, P.P., P.W., A.Ł., ; data curation, P.P., P.W., A.Ł., J.C., H.R.H.; writing—original draft preparation, P.P. and P.W.; writing—review and editing, P.P., H.R.H.; supervision, H.R.H. All authors have read and agreed to the published version of the manuscript.
Funding
This research received no external funding.
Institutional Review Board Statement
The study was conducted according to the guidelines of the Declaration of Helsinki, and approved by Ethics Committee of Medical University of Białystok
Informed Consent Statement
Informed consent was obtained from all subjects involved in the study
Conflicts of Interest
The authors declare no conflict of interest.
References
- Hady RH, Zbucki RL, Luba ME et al.: Obesity as social disease and the influence of environmental factors on BMI in own material. Adv Clin Exp Med 2010; 19: 369-378.
- Pantalone KM, Hobbs TM, Chagin KM, Kong SX, Wells BJ, Kattan MW, Bouchard J, Sakurada B, Milinovich A, Weng W, Bauman J, Misra-Hebert AD, Zimmerman RS, Burguera B. Prevalence and recognition of obesity and its associated comorbidities: cross-sectional analysis of electronic health record data from a large US integrated health system. BMJ Open. 2017 Nov 16;7(11):e017583. doi: 10.1136/bmjopen-2017-017583. PMID: 29150468; PMCID: PMC5702021. [CrossRef] [PubMed]
- Diemieszczyk I, Głuszyńska P, Wojciak PA, Ładny JR, Razak Hady H. METABOLIC SYNDROME. ETIOLOGY AND PATHOGENESIS. Wiad Lek. 2021;74(10 pt 1):2510-2515. PMID: 34897013. [PubMed]
- Alberti KG, Eckel RH, Grundy SM et al. Harmonizing the metabolic syndrome. A joint interim statement of the IDF Task Force on Epidemiology and Prevention; NHLBI; AHA; World Heart Federation; International Atherosclerosis Society; and International Association for the Study of Obesity. Circulation 2009; 120:1640–1645.
- Hu G, Qiao Q, Tuomilehto J, et al. Prevalence of the metabolic syndrome and its relation to all-cause and cardiovascular mor-tality in non-diabetic European men and women. Arch Intern Med 2004; 164: 1066-76.
- Kassi E, Pervanidou P, Kaltsas G, Chrousos G. Metabolic syndrome: definitions and controversies. BMC Med. 2011 May 5;9:48. doi: 10.1186/1741-7015-9-48. PMID: 21542944; PMCID: PMC3115896. [CrossRef] [PubMed]
- Kalinowski P, Mianowana M. Zespół Metaboliczny cz. II: Epidemiologia zespołu metabolicznego w Polsce i na świecie. J Educ Health Sport, 6(4):466-480.
- Grundy SM. Atherogenic dyslipidemia: lipoprotein abnormalities and implications for therapy. Am J Cardiol. 1995 Feb 23;75(6):45B-52B. doi: 10.1016/0002-9149(95)80011-g. PMID: 7863974. [CrossRef] [PubMed]
- Rader DJ. Effect of insulin resistance, dyslipidemia, and intra-abdominal adiposity on the development of cardiovascular disease and diabetes mellitus. Am J Med. 2007 Mar;120(3 Suppl 1):S12-8. doi: 10.1016/j.amjmed.2007.01.003. PMID: 17320517. [CrossRef] [PubMed]
- Manjunath CN, Rawal JR, Irani PM, Madhu K. Atherogenic dyslipidemia. Indian J Endocrinol Metab. 2013 Nov;17(6):969-76. doi: 10.4103/2230-8210.122600. PMID: 24381869; PMCID: PMC3872713. [CrossRef] [PubMed]
- Lewis GF, Carpentier A, Adeli K, Giacca A. Disordered fat storage and mobilization in the pathogenesis of insulin resistance and type 2 diabetes. Endocr Rev. 2002 Apr;23(2):201-29. doi: 10.1210/edrv.23.2.0461. PMID: 11943743. [CrossRef] [PubMed]
- Wang Y, Viscarra J, Kim SJ, Sul HS. Transcriptional regulation of hepatic lipogenesis. Nat Rev Mol Cell Biol. 2015 Nov;16(11):678-89. doi: 10.1038/nrm4074. Erratum in: Nat Rev Mol Cell Biol. 2016 Jan;17(1):64. PMID: 26490400; PMCID: PMC4884795. [CrossRef] [PubMed]
- P., Barter. The realities of dyslipidaemia in metabolic syndrome and diabetes. Br. J. Diabetes Vasc. Dis. . 2005; 5(Suppl.1):7–11.
- Lobstein T. Brinsden H. Neveux M. World Obesity Atlas 2022. World Obesity. 2022 March.
- Wojciak PA, Pawłuszewicz P, Diemieszczyk I, Komorowska-Wojtunik E, Czerniawski M, Krętowski A, Błachnio-Zabielska A, Dadan J, Ładny JR, Hady HR. Laparoscopic sleeve gastrectomy: a study of efficiency in treatment of metabolic syndrome components, comorbidities and influence on certain biochemical markers. Wideochir Inne Tech Maloinwazyjne. 2020 Mar;15(1):136-147. doi: 10.5114/wiitm.2019.84718. Epub 2019 Apr 25. PMID: 32117497; PMCID: PMC7020700. [CrossRef] [PubMed]
- O’Brien PE, Hindle A, Brennan L, Skinner S, Burton P, Smith A, Crosthwaite G, Brown W. Long-Term Outcomes After Bariatric Surgery: a Systematic Review and Meta-analysis of Weight Loss at 10 or More Years for All Bariatric Procedures and a Single-Centre Review of 20-Year Outcomes After Adjustable Gastric Banding. Obes Surg. 2019 Jan;29(1):3-14. doi: 10.1007/s11695-018-3525-0. PMID: 30293134; PMCID: PMC6320354. [CrossRef] [PubMed]
- Nielsen HJ, Nedrebø BG, Fosså A, Andersen JR, Assmus J, Dagsland VH, Dankel SN, Gudbrandsen OA, Fernø J, Hjellestad I, Hjermstad MJ, Kolotkin RL, Thorsen HL, Mellgren G, Flølo TN. Seven-year trajectories of body weight, quality of life and comorbidities following Roux-en-Y gastric bypass and sleeve gastrectomy. Int J Obes (Lond). 2022 Apr;46(4):739-749. doi: 10.1038/s41366-021-01028-5. Epub 2022 Jan 1. PMID: 34974544; PMCID: PMC8960397. [CrossRef] [PubMed]
- Głuszyńska P, Diemieszczyk I, Szczerbiński Ł, Krętowski A, Major P, Razak Hady H. Risk Factors for Early and Late Complications after Laparoscopic Sleeve Gastrectomy in One-Year Observation. J Clin Med. 2022 Jan 15;11(2):436. doi: 10.3390/jcm11020436. PMID: 35054132; PMCID: PMC8779692. [CrossRef] [PubMed]
- Woźniewska P, Diemieszczyk I, Hady HR. Complications associated with laparoscopic sleeve gastrectomy - a review. Prz Gastroenterol. 2021;16(1):5-9. doi: 10.5114/pg.2021.104733. Epub 2021 Mar 26. PMID: 33986881; PMCID: PMC8112272. [CrossRef] [PubMed]
- Abellán Garay L, Navarro García MI, González-Costea Martínez R, Torregrosa Pérez NM, Vázquez Rojas JL. Medium/long term evaluation of lipid profile after bariatric surgery (gastric bypass versus sleeve gastrectomy). Endocrinol Diabetes Nutr (Engl Ed). 2021 Jun-Jul;68(6):372-380. doi: 10.1016/j.endien.2021.10.007. Epub 2021 Oct 26. PMID: 34742470. [CrossRef] [PubMed]
- Al Khalifa K, Al Ansari A, Alsayed AR, Violato C. The impact of sleeve gastrectomy on hyperlipidemia: a systematic review. J Obes. 2013;2013:643530. doi: 10.1155/2013/643530. Epub 2013 Oct 27. PMID: 24286009; PMCID: PMC3826329. [CrossRef] [PubMed]
- Sharma C, Platat C, Gariballa S, Muhairi SJA, Aidaros AA, Mannaerts GHH, Al Afari HS, Yasin J, Y Al-Dirbashi O, Alkaabi J. Metabolomic Profiling of Lipids and Fatty Acids: 3 Years Postoperative Laparoscopic Sleeve Gastrectomy. Biology (Basel). 2021 Apr 5;10(4):298. doi: 10.3390/biology10040298. PMID: 33916397; PMCID: PMC8067044. [CrossRef] [PubMed]
- Baigent C, Blackwell L, Emberson J, et al. Cholesterol Treatment Trialists’ (CTT) Collaboration. E cacy and safety of more intensive lowering of LDL cholesterol: a meta-analysis of data from 170,000 participants in 26 randomised trials. Lancet. 2010; 376(9753): 1670–1681, doi: 10.1016/S014 0-6736(10) 61350-5, indexed in Pubmed: 21067804. [CrossRef]
- Boekholdt SM, Arsenault BJ, Mora S, et al. Association of LDL cho-lesterol, non-HDL cholesterol, and apolipoprotein B levels with risk of cardiovascular events among patients treated with statins: a me-ta-analysis. JAMA. 2012; 307(12): 1302–1309, doi: 10.1001/jama.2012.366, indexed in Pubmed: 22453571. [CrossRef]
- Henry N Ginsberg, Chris J Packard, M John Chapman, Jan Borén, Carlos A Aguilar-Salinas, Maurizio Averna, Brian A Ference, Daniel Gaudet, Robert A Hegele, Sander Kersten, Gary F Lewis, Alice H Lichtenstein, Philippe Moulin, Børge G Nordestgaard, Alan T Remaley, Bart Staels, Erik S G Stroes, Marja-Riitta Taskinen, Lale S Tokgözoğlu, Anne Tybjaerg-Hansen, Jane K Stock, Alberico L Catapano, Triglyceride-rich lipoproteins and their remnants: metabolic insights, role in atherosclerotic cardiovascular disease, and emerging therapeutic strategies—a consensus statement from the European Atherosclerosis Society, European Heart Journal, Volume 42, Issue 47, 14 December 2021, Pages 4791–4806, https://doi.org/10.1093/eurheartj/ehab551. [CrossRef]
|
Disclaimer/Publisher’s Note: The statements, opinions and data contained in all publications are solely those of the individual author(s) and contributor(s) and not of MDPI and/or the editor(s). MDPI and/or the editor(s) disclaim responsibility for any injury to people or property resulting from any ideas, methods, instructions or products referred to in the content. |
© 2023 by the authors. Licensee MDPI, Basel, Switzerland. This article is an open access article distributed under the terms and conditions of the Creative Commons Attribution (CC BY) license (http://creativecommons.org/licenses/by/4.0/).
