1. Introduction
Viruses can be defined as selfish mobile genetic elements consisting of a nucleic acid and a protective protein shell. They are mostly not categorized as living organisms as they are not capable of replicating on their own and need the cell machinery of their hosts. Viruses are often able to infect more than one species, as this is advantageous in terms of spreading and preserving the genetic information in the gene pool over time. 1,2 Despite their structure that is low in complexity and dependence on their hosts, they are fast and highly adaptable and can successfully diversify through random and frequently occurring mutations and recombination. 3 The recent Corona Virus Disease 2019 (COVID-19) pandemic has again illustrated how fast and devastating the outcome of a zoonotic virus can be which jumped across the species barrier. 4 Unfortunately, such crossings of the species barriers happen quite frequently and are a natural phenomenon. Modern life style changes, globalization and the destruction of natural environments promote the occurrence of such events, because they lead to a more intense contact between humans and different carriers of potentially infectious viruses. 5 Accordingly, the emergence of highly contagious viruses is a constant threat and scientists warn constantly that even worse scenarios are likely in the future. Continuous research aiming for the development of rapid, fast, economic, adaptable, specific, sensitive, and simple diagnostic assays, together with antiviral drugs and vaccines are key components for preparation and prevention of future outbreaks and for limiting the subsequent damages.
The current gold standard, enabling high specificity and sensitivity for diagnosing viral infections, are Polymerase Chain Reaction (PCR) based methods including RT-PCR (reverse transcription PCR), by which the virus species or strains are identified according to characteristic nucleic acid sequences. 6,7 Despite these important advantages and their widespread application, there are some drawbacks that should not be overlooked. Until now, PCR assays are still expensive and require specialized laboratory settings with trained personnel and infrastructure. Especially in case of a pandemic, it is crucial to consider that a global surveillance strategy, which is applicable with minimal resources, is needed. Lateral flow tests are simple and fast detection methods. Unfortunately, the sensitivity of such tests is usually considerably lower compared to PCR-based methods. 8 This highlights the need for the development of low cost and simple technologies with potential to be applied in a decentralized way.
Spectroscopic methods appear as a promising option, since they are fast, applicable on site and give access to a wealth of information on the sample of interest. Raman spectroscopy is highly specific in terms of probing the molecular structure. It is generally considered as valuable tool for identifying substances according to their characteristic spectrum, which is sometimes referred to as spectroscopic fingerprint. This concept can also be applied for complex biological molecules or even whole cells and bacteria. 9,10 Raman spectroscopy is however limited by its low sensitivity, which makes virus detection quite challenging. As viruses are typically small (25 – 400 nm, 11) in comparison to the excitation wavelength, large quantities are required to obtain pure spectra. Usually, the virus particles are embedded in a sample matrix with numerous other (Raman-active) components as they were raised in a cell culture or stem from a patient specimen, i.e., a body fluid. The other components (for example proteins, nucleic acid, inorganic salts, buffer compounds) will also contribute to the collected Raman spectra and can hamper an identification based on specific bands, if no purification steps are applied. Such sample preparation can also be a challenging and costly task and accompanied by a large amount of partly manual laboratory work. The application of advanced techniques like ultracentrifugation 12, ultrafiltration 13 or affinity chromatography 14 can be time consuming, require great expertise and/or expensive devices and last but not least a lab with an appropriate biosafety standard. Therefore, often other detection schemes are applied in combination with Raman spectroscopy, which do not require purified virus samples. Instead of detecting the virus particles themselves, the presence of specific antibodies, nucleic acids 15 or a change of the overall composition of a certain body fluid 16,17 can be used as leverage points. The combination of those strategies with statistics-based analysis methods such as chemometrics then enables sample classification, if the data base is large enough. Quite a few approaches are based on surface enhanced Raman spectroscopy (SERS), which employs metallic nanoparticles or nanostructures for improving the technique’s sensitivity through plasmonic enhancement. 18−20 As the physical phenomenon is, by definition, highly surface sensitive, unspecific absorption must be avoided. The metallic substrates or particles can be functionalized with specific molecules (i.e. antibodies or proteins) and serve as specific capture elements and/or their structure can also function as a size-selective enrichment tool. 21 These sophisticated approaches, however, also come with complex issues of reproducibility and thermal stability and are thus not yet suitable for routine use and mass production.
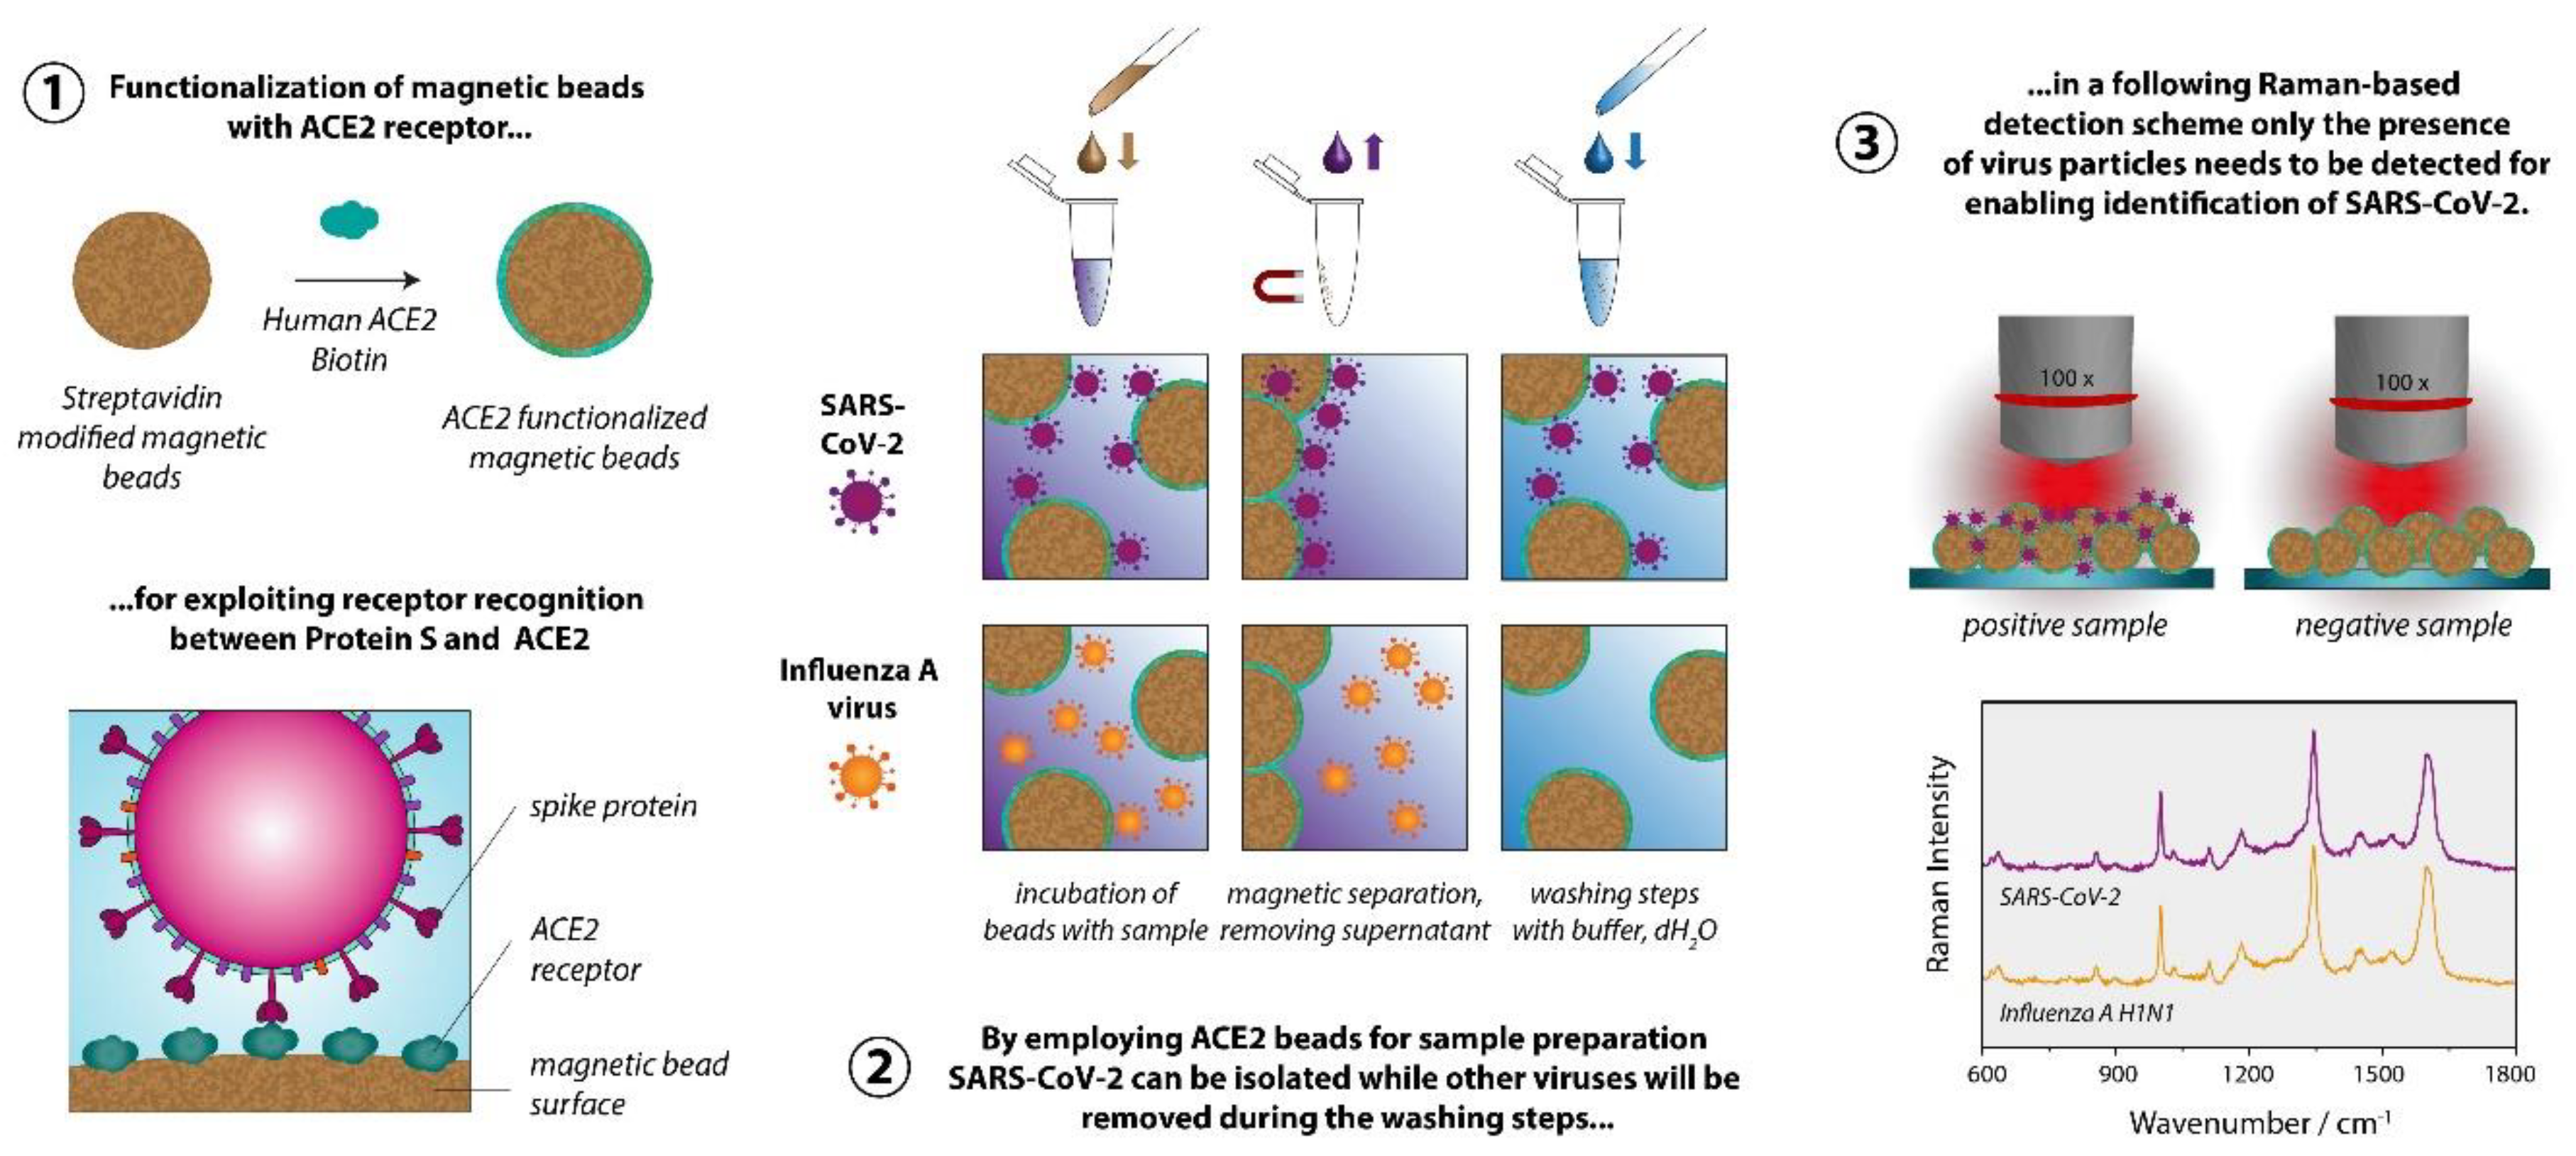
We aimed at developing a strategy that allows detecting viruses using conventional Raman spectroscopy, i.e., without the requirement for plasmonically active SERS substrates. 18−20 The summary of the proposed sample preparation scheme is displayed in Figure 1. For significantly reducing the difficulty of the task to identify a virus only based on its Raman signature, we implemented a specific capture probe in the sample preparation process, so that ultimately only the presence of the virus particles needs to be verified via the Raman spectrum. For the sample preparation we established a magnetic bead-based assay, leading simultaneously to both highly specific virus binding and surface-to-volume optimization in comparison to flat surfaces. The magnetic beads further allow a convenient, easy handling, imply minimal technical requirements, and ensure that larger quantities of the virus are potentially present and thus detected, in the focal plane. The functionalization of the magnetic beads with the capture probes is achieved by exploiting the biotin streptavidin interaction, which is a well-established, simple, and easily reproducible procedure. Furthermore, the sample preparation method is also fully compatible with a PCR detection protocol that serves as a validation methodology.
The Raman measurements are performed directly on the magnetic bead substrate after the sample preparation procedure. Accordingly, the spectra are dominated by the polymer matrix of the magnetic beads and the spectra of the different sample types are very similar. For demonstrating the feasibility of our approach, we chose the novel coronavirus SARS-CoV-2 as a target and the Influenza A virus as a non-match control. For enabling differentiation based on the very subtle differences in the spectra we calculated 1D correlation coefficients, such as the Pearson coefficient22,23 and the normalized cross correlation (NCC) coefficient23,24. We systematically included a negative control sample in the experiments and used the respective spectra as a reference for calculating the correlation coefficients for SARS-CoV-2 and Influenza A virus. The correlation coefficients are a measure for similarity/dissimilarity and by calculating the values relative to the negative control we can distinguish between SARS-CoV-2 and Influenza A virus using Raman spectroscopy.
2. Methods
2.1. Virus cultures
Influenza A virus (H1N1), propagated in MDCKs, cultured in EMEM (Eagle’s Minimum Essential Medium, ATCC, Wesel, Germany), supplemented with 10% fetal calve serum (FCS). SARS-CoV-2, Vero-76 cells, cultured in EMEM with HEPES, and 5 mM l-glutamine.
2.2. Preparation of ACE2 beads
For preparing ACE2 beads we used 50 µl (c = 10 mg/ml) of streptavidin functionalized dynabeads (M-280 Streptavidin, ThermoFisher Scientific, Waltham, USA) per sample. Typically, we prepared enough beads for three samples in one batch and used 150 µl of magnetic beads accordingly. Throughout the entire protocol 1.5 ml LoBind protein tubes by Eppendorf (Hamburg, Germany) were used. All buffers were sterilized by using a syringe filter (KH54.1, Carl Roth, Karlsruhe, Germany) with a pore size of 0.22 µm. The following instructions are referring to the preparation of three samples in one batch: Prior to adding the biotinylated ligand, the beads were washed twice with 500 µl 1x Phosphate Buffered Saline (1x PBS, pH 7.3, 137 mM NaCl, 2.7 mM KCl, 4.3 Na2HPO4, 1.4 mM KH2PO4). The beads were resuspended in 150 µl 1x PBS and 13.5 µg biotinylated ACE2 (=4.5 µg per sample) was added. Biotinylated Human ACE2 (AC2-H82E6) was purchased from Acro Biosystems, Newark, USA. The total volume was then adjusted to 200 µl by adding more 1x PBS. The sample was incubated for 30 min at room temperature under end-over rotation (12 rpm) to ensure proper mixing. Subsequently the beads were washed twice with 500 µl 1x PBS and twice with 500 µl 0.05 M PIPES (1,4-Piperazinediethanesulfonic acid) + 0.1 M NaCl, pH 6.5. The beads were finally resuspended in 155 µl of PIPES buffer and 50 µl per sample were pipetted into new vials.
2.3. Virus isolation
200 µl of virus culture or in case of the negative control just the cell medium was added per vial. The samples were incubated for 60 min at room temperature using end over rotation (12 – 15 rpm). The beads were then washed twice using 500 µl of PIPES buffer and finally resuspended in 55 µl of the same buffer. The sample was then split into two equal parts of 25 µl each. One vial was used for the PCR detection scheme, the other one was inactivated by adding 4 % of paraformaldehyd (PFA) to the bead solution for 30 minutes at 37 °C and then further processed for the Raman detection scheme as described in the next paragraph.
2.4. Raman measurements
Prior to the Raman measurements the magnetic beads were quickly washed twice with 100 µl of dH2O and then resuspended in 50 µl dH2O. Three 1 µl droplets per sample were applied to a Raman compatible substrate. We used silicon chips with an aluminum layer. The detailed fabrication process of them can be found in 41. The dried droplets were investigated using a KAISER Raman microscope with a 100x LWD objective with NA = 0.75. The excitation wavelength was 808 nm with a power at the sample adjusted to 2.5 mW and an acquisition time per spectrum of 60 s.
2.5. Data processing
RAMANMETRIX (version 0.3.5) 42 was used for data preprocessing. Raman spectra were despiked and wavenumber calibrated using 4-Acetamidophenol as reference substance. Interpolation onto the linear wavenumber axis with a step size of 1 cm−1 was done in the range between 200 - 3105 cm−1. A second order SNIP baseline correction with smoothing and 40 iterations as well as vector normalization was caried out. The correlation coefficients were calculated with Wolfram Mathematica (version 12.3) using the wavenumber range 201 – 1749 cm−1. The Kolmogorov-Smirnov-Test was performed using GNU R 4.0.3 using the ks.test function provided by the stats packages with the null hypothesis CDFSARS-CoV-2 > CDFInfluenza (function parameter: alternative=”less”). 43
2.6. Cell culture and viral propagation
The viral propagation of SARS-CoV-2 was performed with the human lung cancer cell line Vero-E6, a gift from the Charité Berlin. Cells were cultured in EMEM with HEPES and 5 mM L-glutamine at 5 % CO2 in 37ºC. For the infection, we used a viral isolate from a respiratory specimen of a COVID-19 patient (SARS-CoV-2/hu/Germany/Jenavi005587/2020, ethics approval of the Jena University Hospital, no. 2018-1263). The isolation and propagation of Influenza A virus (IAV) was performed on Madin-Darby canine kidney cells (MDCK) cultured in EMEM and 10 % FCS at 5 % CO2 in 37 °C. The patient isolate IAV/H1N1/vi013320 was achieved by using a standard protocol containing plaque assay purification as described previously. 44
2.7. Virus lysis and qRT-PCR
After performing the virus isolation with the magnetic beads, to the vial containing the sample for the qPCR analysis, RLT lysis buffer (Qiagen, Hilden, Germany) was added. The viral (v)RNA of SARS-CoV-2 lysates was extracted by using the QIAcube RNeasy Viral Mini Kit (Qiagen, Hilden, Germany) according to the manufacture’s guidelines. The detection of the SARS-CoV-2 specific RNA was performed using the RIDAgene Kit (r-biopharm, Darmstadt, Germany) with the Rotor-Gene Q (Qiagen, Hilden, Germany). This kit detects the E-gene of SARS-CoV-2 and allows the quantification of the number of copies by a given positive control. For the extraction of the vRNA of IAV we used the EZ1 Virus Mini Kit v2.0 (Qiagen, Hilden, Germany). The detection of the Influenza A specific M2 gene via qRT-PCR was carried out with the LightMix Modular Influenza A (InfA M2) Kit from TIB Molbiol (Berlin, Germany) with the LightCycler 480 (Roche, Mannheim, Germany).
3. Results & Discussion
As depicted in
Figure 1, our proposed Raman-based detection strategy to identify virus particles rests on a highly specific sample preparation scheme. To selectively enrich the beads’ surface with virus particles of the virus type to be detected, a specific recognition element is required. Instead of employing an antibody, we decided to exploit the ACE2 receptor, that SARS-CoV-2 uses for attaching itself to the hosts’ cells.
25,26 Like all coronaviruses SARS-CoV-2 uses its spike glycoprotein (S protein) for binding to the cellular receptors.
27 The particularly specific binding between the viral S protein and the host receptor is also responsible for the efficient transmission of SARS-CoV-2 among humans.
28 However, this is only the first step of the viral entry into the cells. The trimeric S protein has a clove like structure, with a S1 (head) and a S2 (stem) subunit. While the S1 unit contains the receptor binding motif, the S2 unit is responsible for the fusion with the host cell membrane, after which the nucleic acid is inserted into the cells. For this process, proteases like furin or transmembrane serine protease 2 (TMPRSS2) are required for cleaving the S protein at distinct sites.
29 Employing the receptor instead of an antibody as recognition element is advantageous from our perspective as viruses are constantly subject to mutation and therefore alter their protein structure. Accordingly, certain mutations and/or recombination will cause an antibody-based assay to fail, because the target element is poorly or no longer recognized. By using the very same element as a capture probe that the virus needs to infect the cells, such an issue will most likely not occur even when the virus mutates and recombines.
30
As mentioned before, we aspire to detect the virus particles with conventional Raman spectroscopy. Due to the small size of the virus and potentially low concentrations, we need to enrich them before conducting the actual measurements. To that end we employed magnetic beads - micrometer-sized polymer particles with magnetic nanoparticles embedded in them. They are commercially available with various surface modifications enabling different strategies for functionalization. We chose streptavidin modified magnetic beads as their further decoration with capture elements is very easy and well reproducible. The immobilization of capture probes on such surfaces exploits the very strong interaction between the protein avidin or streptavidin (an avidin protein produced by bacteria of the genus Streptomyces) and the vitamin biotin. With a dissociation constant of K = 10−15 M this biological interaction is the strongest known non-covalent interaction. 31 Further advantages are the relatively high robustness in terms of pH, temperature and solvents. 32 Many biomolecules can be purchased with biotin modification or alternatively coupling kits are available which also allow non-experts to perform a biotinylation. Respectively, applying the proposed sample preparation concept comes with very few obstacles. In our study we used a prefabricated biotinylated ACE2 receptor.
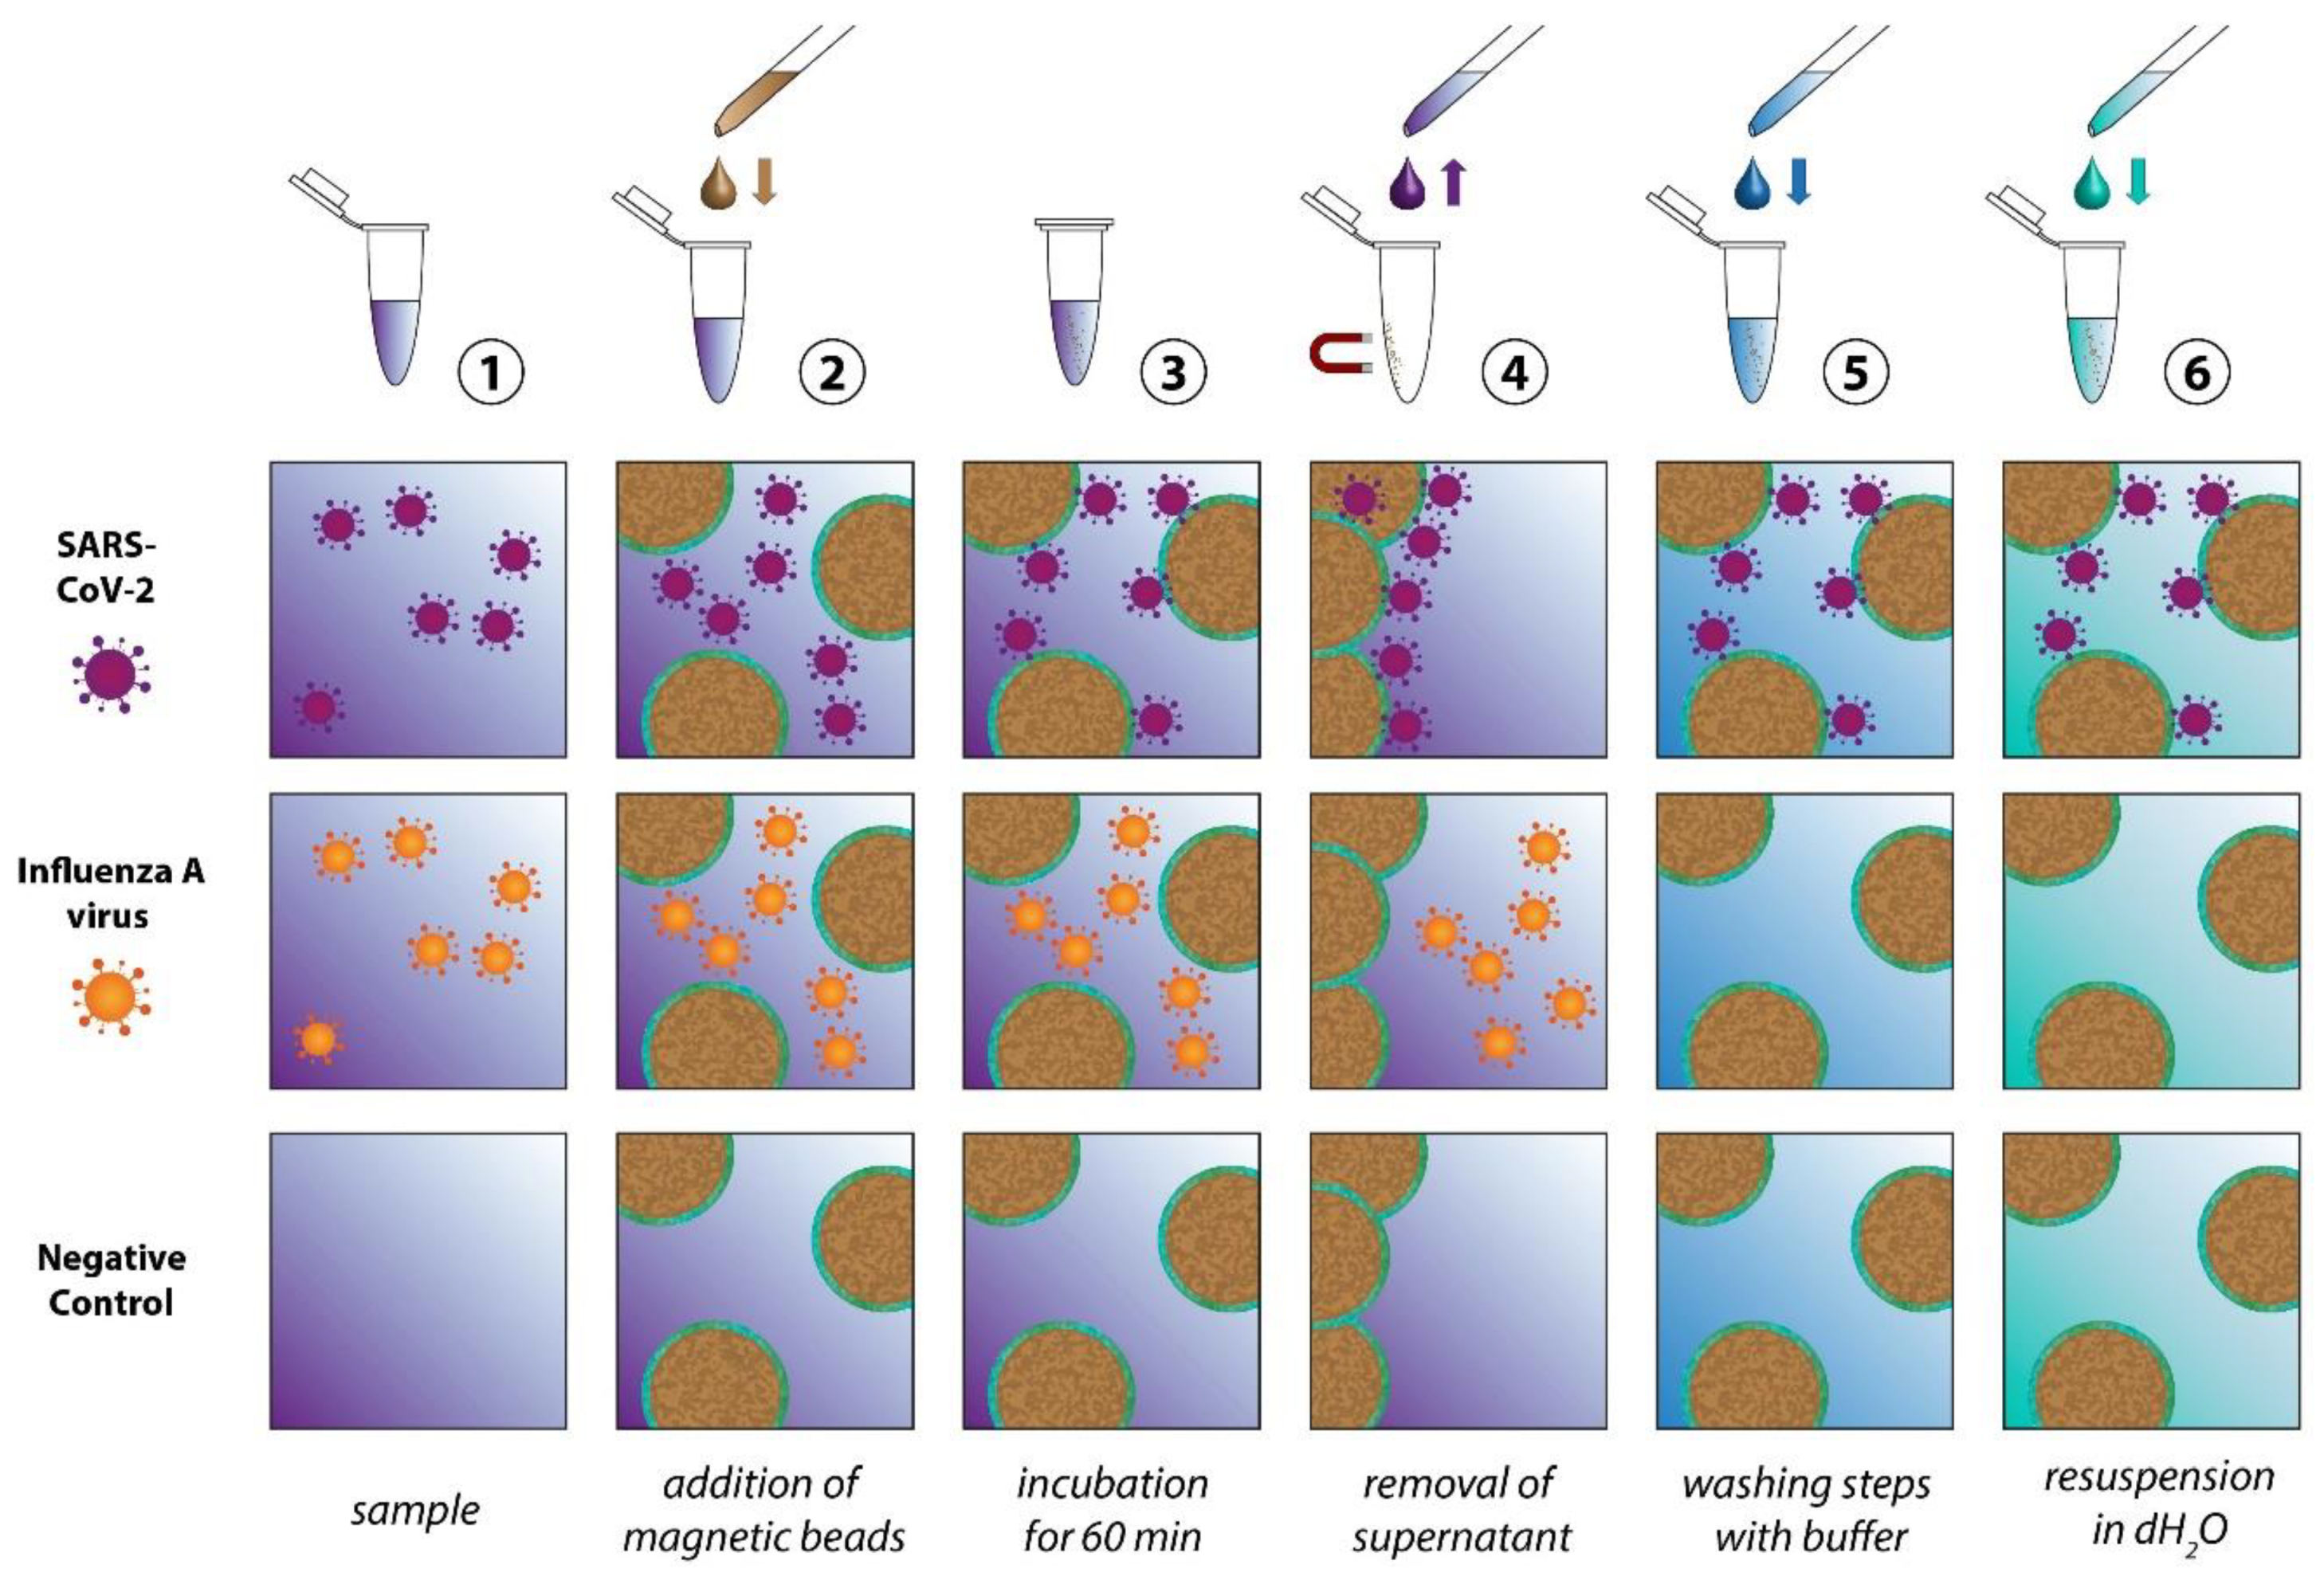
The scheme in
Figure 2 depicts the individual steps of the sample preparation procedure. In the first step the ACE2-functionalized particles are added to the sample, which might contain SARS-CoV-2, another virus (for example Influenza A virus), other microorganisms or no pathogens at all. During the incubation time the SARS-CoV-2 particles will attach themselves to the bead surface due to the spike protein receptor with reported binding constant ranging from 0.11 nM
33 to 14.7 nM.
34 In order to achieve selective enrichment of SARS-CoV-2, washing steps are implemented, where the solid phase (the magnetic particles) is separated from the liquid phase (the supernatant). During these washing steps all viruses that are not immobilized on the bead surface will be removed. The same happens to all other components of the samples that are in the liquid phase. Through repetition of the washing steps not only a selection of the virus species of interest is achieved, but also the complexity of the sample is significantly reduced. In the final step, all three sample types essentially consist of the washing buffer, the magnetic beads and, in the case of the SARS-CoV-2 sample, the virus particles. To enable the Raman detection on a dried sample, a further washing step with dH
2O is implemented to remove the buffer salts. For this study inactivated SARS-CoV-2 viruses were used. Further information is provided in
Section 1 (and associated
Figure S1) of the Supporting Information.
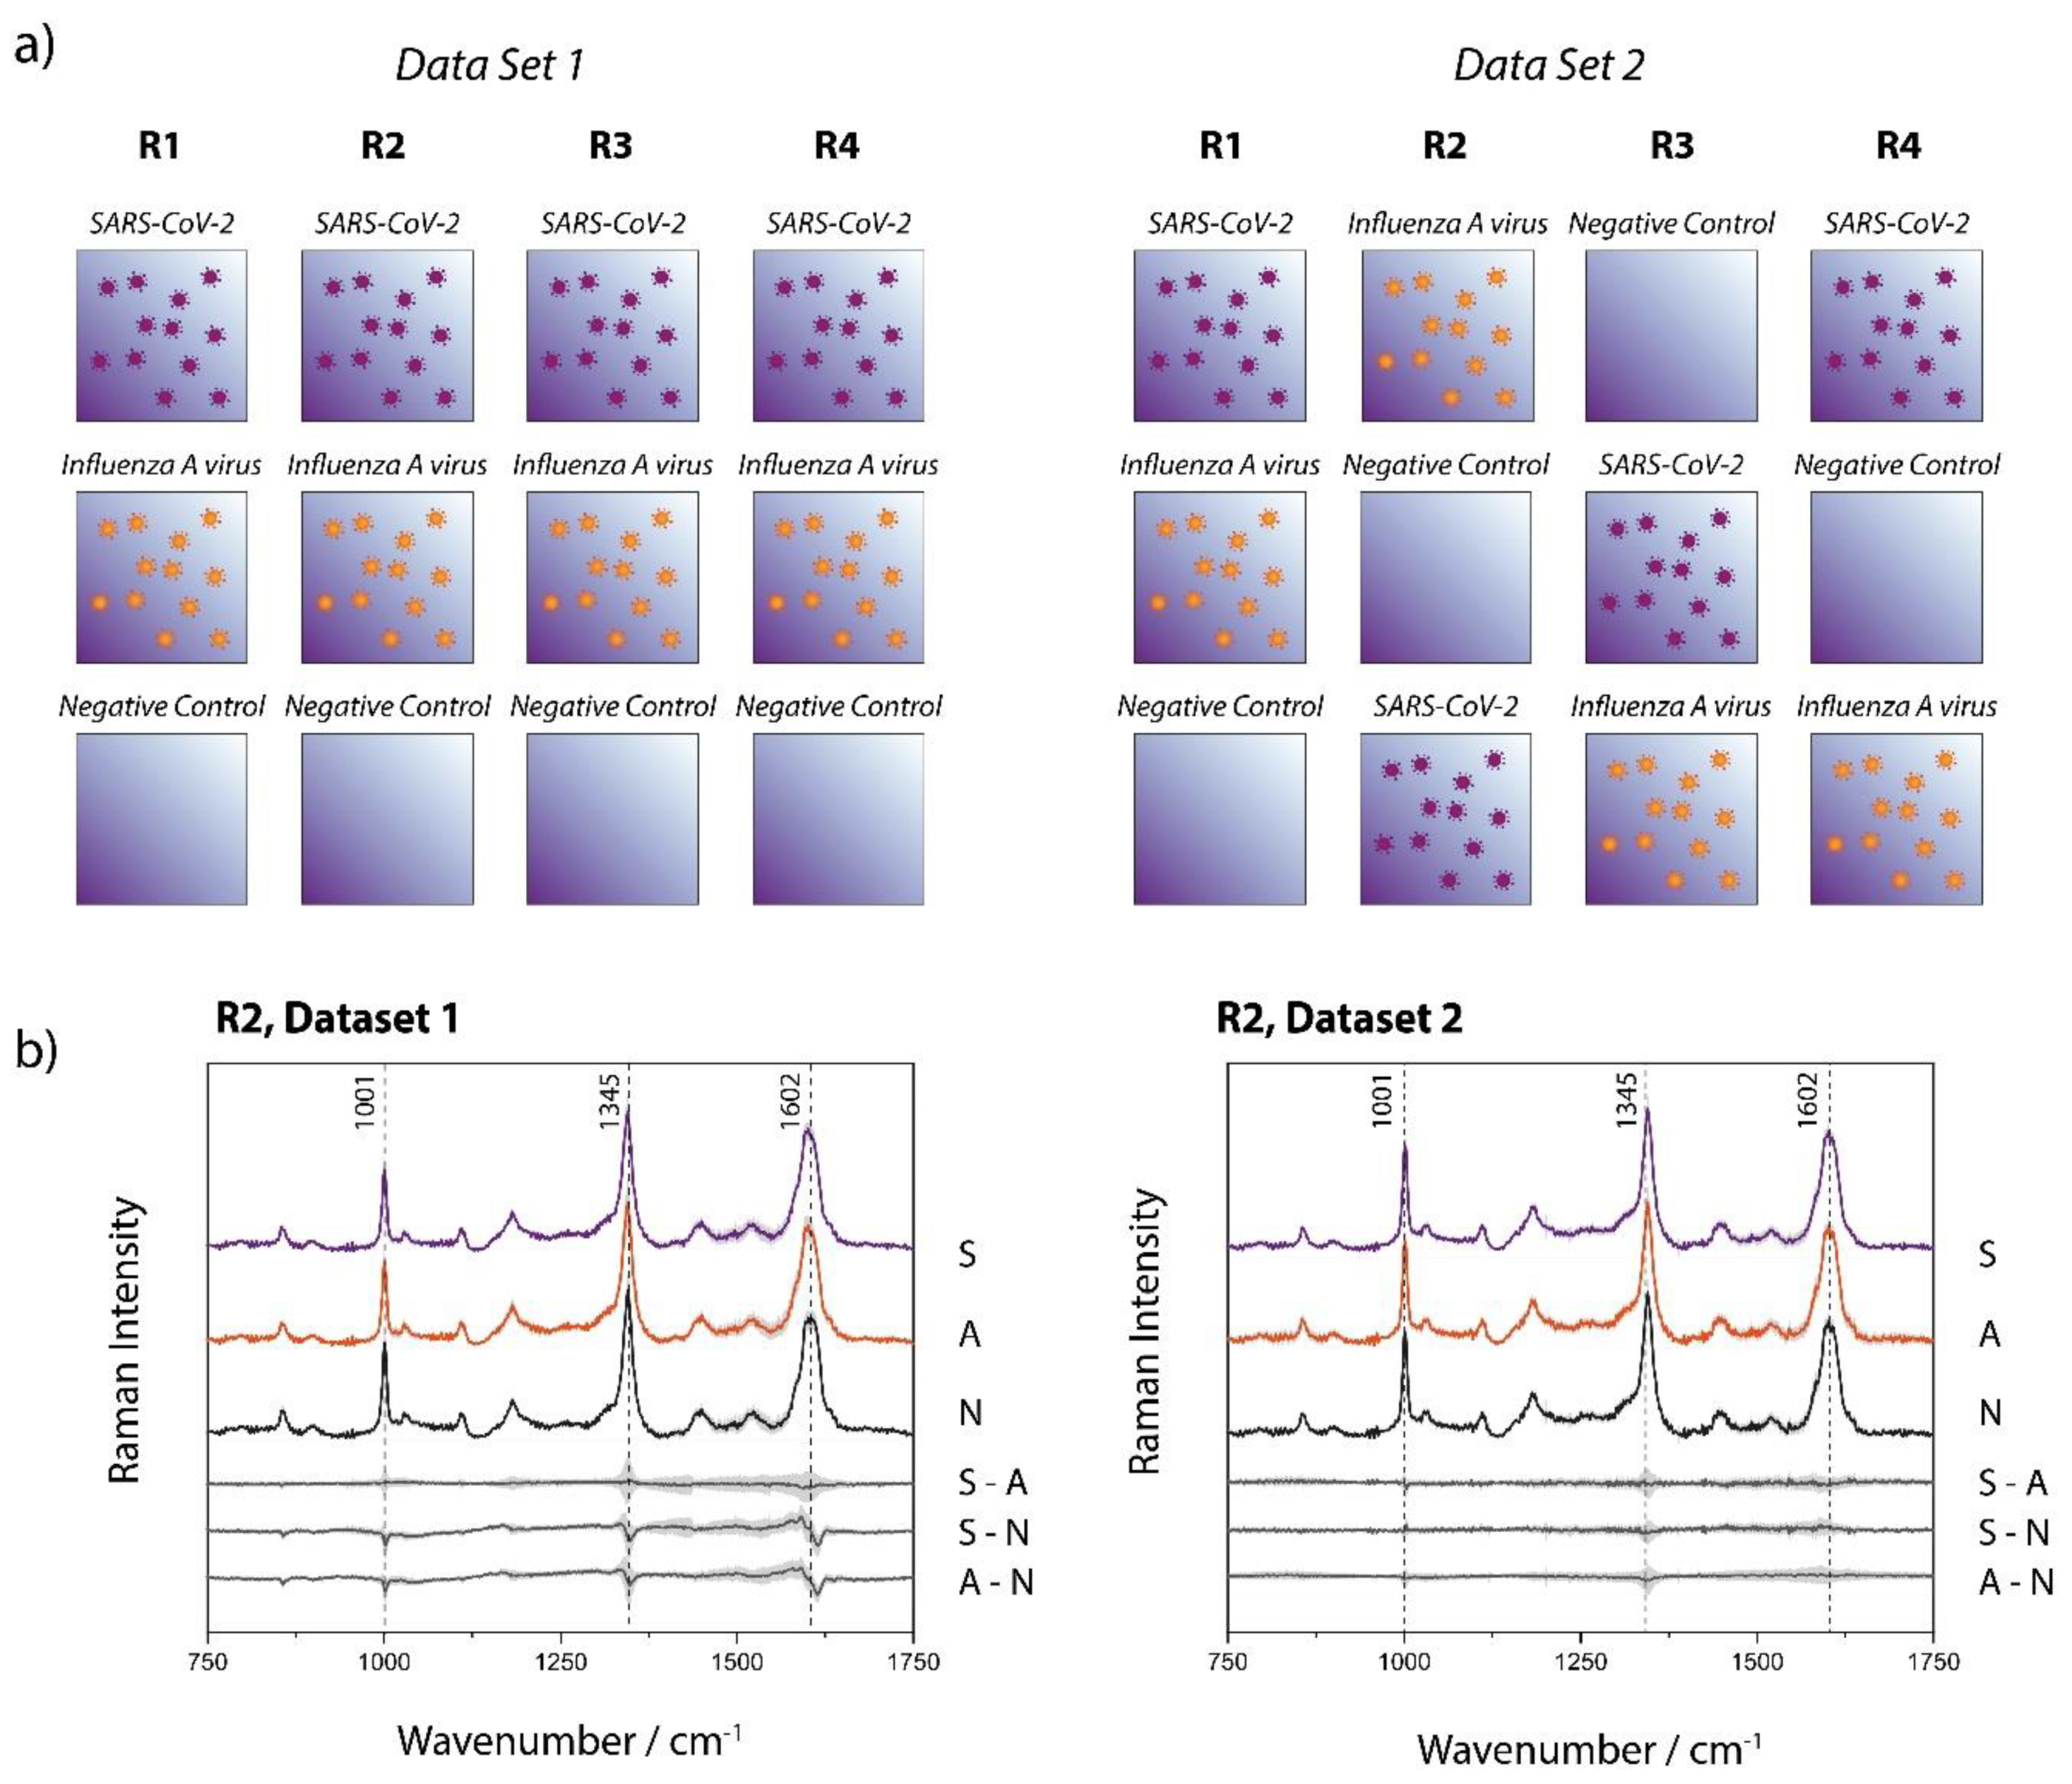
Figure 3a shows the Raman-based identification scheme, for which two data sets have been investigated, each consisting of four replicates per sample type (SARS-CoV-2, Influenza A virus, negative control). The replicates were processed and measured on independent days. It is noteworthy, that the two data sets have been investigated several months apart to ensure the reproducibility of the study under different environmental conditions (ex. season change creating variating humidity index, slight lab temperature variation, new batches of magnetic beads, etc.). Two significant differences have been introduced voluntarily: 1) For data set 1 the ACE2 functionalized beads were prepared in one batch while for data set 2 a fresh batch of ACE2 beads has been prepared for each replicate. 2) As shown in
Figure 3a, the order in which the samples were measured within an experimental day has been varied for data set 2 with the objective of ruling out the potential impact of any minor optic changes that can occur in the course of an experimental day.
During the Raman measurements we also observed that the SARS-CoV-2 samples often looked microscopically different from the other sample types. As shown in the microscopic images of Figure S4, the magnetic beads form large agglomerates for the SARS-CoV-2 samples, while for the other sample types, this effect is much less pronounced, if at all occurring. This formation of large clusters can be ascribed to the multiple binding sites that are present both on the spherical virus particles and on the ACE2 decorated magnetic beads. In principle, this effect alone has great potential for detecting the presence of SARS-CoV-2 by a simple assay. However, we found that the extent of this cluster formation with the current workflow can differ significantly and therefore is no reliable criterion for identifying SARS-CoV-2 by itself. The Raman measurements were conducted with an incident irradiation of 808 nm, which remains significantly under the typical size of a single bead (2.8 μm in diameter). The agglomeration of the beads (domain typically composed of a few tens to several hundreds of beads) does not appear to create additional scattering that could modify the background of the spectra (vide infra). However, to ensure the absence of interferences in the data due to this phenomenon, a minimum of 43 spectra (up to 55 in some cases) were acquired at different locations on the sample and where the morphology of the bead arrangement differed.
Figure 3b displays, as representative example, the mean Raman spectra of one subset of each data set (all mean and standard deviation spectra are shown in Figure S2 of the Supporting Information), where each set of data consists of 49 to 138 single spectra measured with an acquisition time of 60 s. The spectra of the different sample types (SARS-CoV-2, Influenza A virus, negative control) are virtually undistinguishable. The subtracted spectra in Figure 3b (and Figure S2) expose even more clearly the absence of significant differences in the average spectra of the investigated sample types. Variations observed at ~ 1001, 1345 and 1602 cm−1, are all approximately within standard deviation, making any deeper analysis of spectral differences based on those data highly arbitrary. The Raman signal, for all sample types, is mainly dominated by the magnetic-bead substrate (see Figure S3 of the supporting information where a reference spectrum acquired from the non-functionalized streptavidin magnetic beads can be found, along with a spectrum of the ACE2). The beads themselves consist of a polystyrene-divinylbenzene (PS-DVB) matrix 35 with magnetite 36 and maghemite as magnetic material and are functionalized with streptavidin and the ACE2, which are both proteins. We originally hypothesized that differentiating between SARS-CoV-2 and Influenza samples would be enabled by an enhanced protein signature in the Raman spectra of the beads incubated with the SARS-CoV-2 particles. However, the qRT-PCR results (Table S1) indicate that, to some minor extent, Influenza A viruses also unspecifically adsorb onto the surface of the ACE2 functionalized beads. It is noteworthy that the differences of SARS-CoV-2 and Influenza A virus with the negative control are not more pronounced, illustrating that the protein contribution to the signal must be minor, if at all detectable. This is likely due to the small amount of virus attached to the beads in combination with the low sensitivity of the Raman signal. Increasing the acquisition time or the power at the sample for signal optimization (or noise reduction) unfortunately leads to observable damages, most likely due to the absorption of the 808 nm wavelength by the beads (data not shown). Our attempts to use 532 nm and even 785 nm incident wavelength (to have access to a higher signal-to-noise ratio) have failed due to the strong fluorescence background arising from the magnetic beads.
Correlation coefficients enable quantifying similarities/dissimilarities between data sets. The Pearson coefficient, for example, is a measure for linear correlation. It can attain values between -1 and +1. A correlation coefficient of exactly +1 or -1 represents a perfectly linear (or inverse linear) relationship between the compared groups, while 0 indicates the absence of any linear dependency.
37,38 We calculated the Pearson coefficient according to
Equation E1 (Supporting Information) between each individual spectrum of the series of SARS-CoV-2 and Influenza A virus and the average spectrum of the series of spectra of the negative control. The outcome of this calculation for every replicate and data set is displayed in
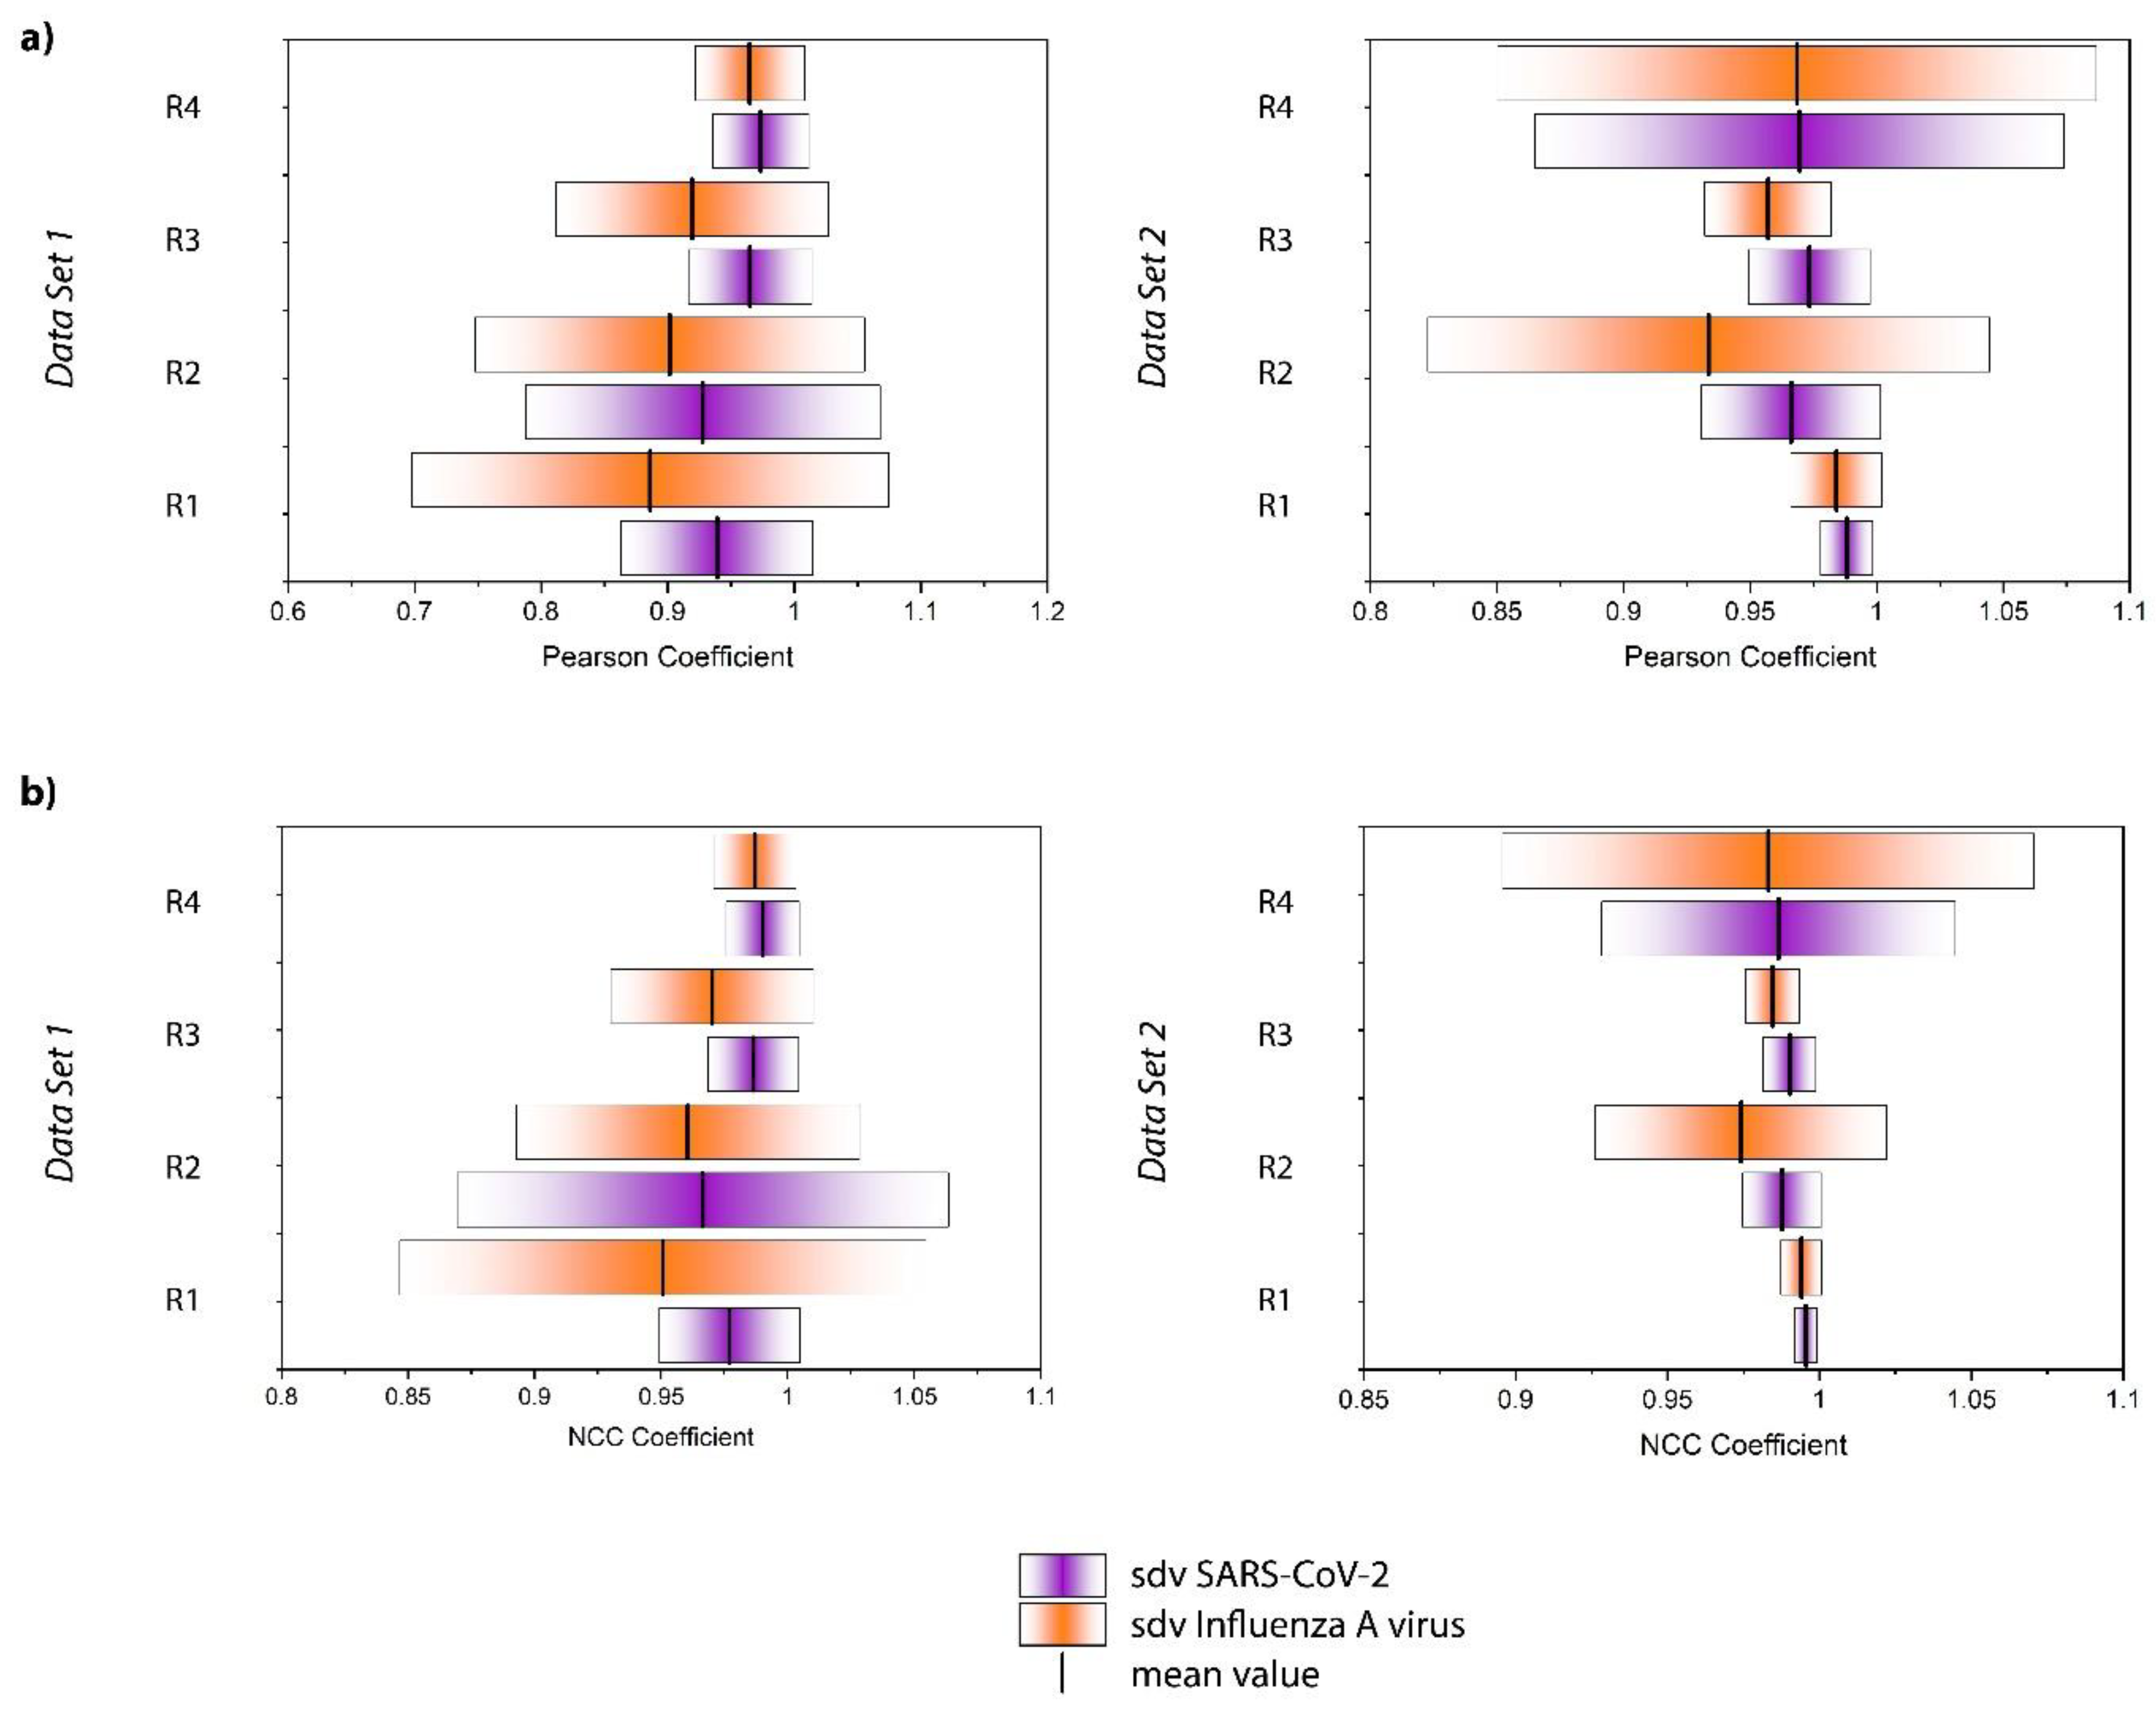
Figure S5. As expected, the values for both the Influenza A virus and SARS-CoV-2 samples are very close to 1 expressing the high spectral similarity. However, a trend appears when evaluating the average of the Influenza A virus and SARS-CoV-2 samples as displayed in
Figure 4a, for each replicate and data set. Although there is significant replicate-to-replicate variability, when taking every replicate individually, the SARS-CoV-2 samples are always associated with a mean value closer to +1 and tend to have a smaller standard deviation.
Moreover, we calculated the normalized cross correlation coefficient according to Equation E2 (Supporting Information). This correlation coefficient is often used in image analysis, for example to enable pattern recognition. In contrast to the Pearson Coefficient, also referred to as zero mean normalized cross correlation coefficient, no zero-mean centering (subtracting the average intensity) is carried out. Therefore, it has been found to be more sensitive in pattern recognition applications23 The results for the single spectra are displayed in Figure S6 and the average values and standard deviations are summarized in Figure 4b. The results are similar to the Pearson coefficient. All values are close to +1 and the SARS-CoV-2 samples result in mean values systematically larger than those of Influenza A virus. Overall, Figure 4 reveals that the NCC coefficient seems to be slightly more sensitive than the Pearson coefficient for detecting the subtle differences in the spectra in agreement with the findings of Martin and Crowley, maybe because the NCC coefficient is more stable with regard to noise effects.23 Again, the standard deviation of the SARS-CoV-2 samples tends to be smaller than that of the Influenza A virus samples. The larger standard deviation associated with the Influenza A virus sample is likely attributed to the above-mentioned unspecific binding observed by PCR analysis. Indeed, one expects the dispersion of these particles on the surface to be much less homogeneous than that of the well-defined immobilization of the SARS-CoV-2 viruses. Accordingly, by analyzing different regions of the sample, we have probably been investigating areas which contain larger or smaller quantities of those residues, resulting in a standard deviation that is markedly higher. Furthermore, it is noteworthy that the correlation coefficients for the SARS-CoV-2 samples are always closer to +1 indicating a greater similarity to the negative control. That seems counterintuitive, as one expects the Influenza A virus samples to resemble the negative control more closely, because in contrast to the SARS-CoV-2 samples these virus particles do not bind to the ACE2 receptor on the magnetic beads. However, this result should not be overinterpreted as the spectra are virtually identical and no distinct features can be assigned to a specific sample type. Rather than interpreting the correlation coefficients in the classical way, we conclude that the differentiation is much more likely to be due to a different signal to noise ratio and/or may be related to the less homogenous microstructure of the sample.
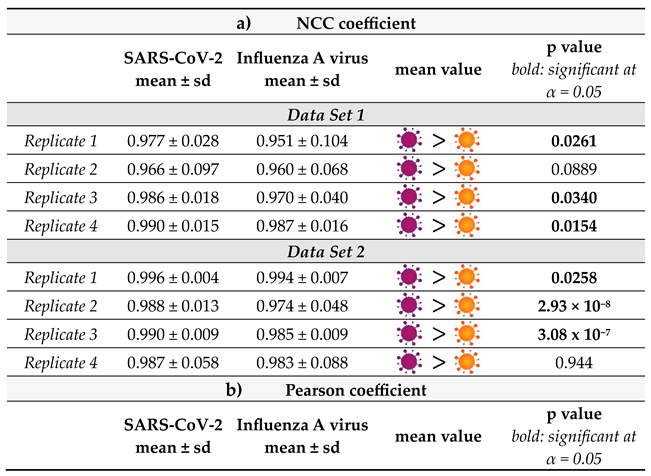
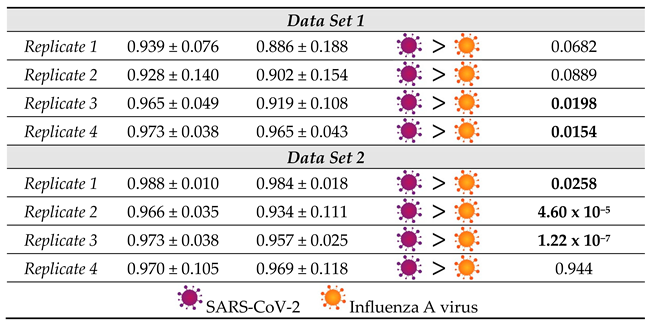
It is important to consider that the distribution of the correlation coefficient values for each type of sample is quite large. Nevertheless, the relative values associated with the SARS-CoV-2 and Influenza A virus samples are consistent from replicate to replicate. To further verify the validity of our hypothesis that the series are indeed statistically distinctive, a Kolmogorov-Smirnov test (KS-Test) was carried out (
Table 1). The KS-Test is a non-parametric statistical test to compute the likelihood of two samples were being drawn from the same probability distribution.
39 The test statistic is based on comparing the cumulative distribution functions (CDFs) of the two samples and computing the maximum distance between the two.
40 If this distance is large, the likelihood of the two samples being drawn from the same population is low and vice versa. Since this test statistic is sensitive to both differences in location and shape of the distribution functions, it is a powerful statistical measure to quantify the distance between samples. Furthermore, as a non-parametric test, the KS-test does not assume a specific distribution function, i.e., normality is not required as e.g., in case of Student’s t-test. Using the one-sided variant of the KS-test with null hypothesis CDF
SARS-CoV-2 > CDF
Influenza A virus shows that the correlation values for the SARS-CoV-2 samples are larger than those for Influenza on a statistically significant level (α=0.05) for the majority of the samples, thereby strongly supporting the hypothesis that higher values for the correlation coefficients coincide with detection of SARS-CoV-2. In general, NCC and Pearson Correlation performed similarly, and the significance of the result at α=0.05 only changed for replicate 1 of the first data set. In the replicate 2 of the first dataset, as well as in the replicates 1 and 4 of the second dataset, KS-test p-values for NCC and Pearson correlation are even numerically equal.
4. Conclusions
We have demonstrated how a simple magnetic bead-based sample preparation scheme can enable differentiating SARS-CoV-2 and Influenza A virus using conventional Raman spectroscopy. In contrast to several already existing approaches, our method does not need a plasmonically active SERS substrate, thereby making it easier to apply and less prone to reproducibility issues. By exploiting the specific interaction of the ACE2 receptor and the spike protein of SARS-CoV-2 we were able to selectively enrich the virus and subsequently acquire Raman spectra of the bead bound virus. As a non-match control, we included Influenza A virus H1N1 in our study. Since spectral differences between SARS-CoV-2 positive and negative samples were subtle, 1D correlation analysis was used for achieving a successful differentiation. We calculated both the Pearson and NCC coefficient for quantifying the differences between samples and found that both coefficients perform very similar with the NCC coefficient being slightly more sensitive. The presented approach represents a first step towards virus identification using conventional Raman spectroscopy.
Author Contributions
Conceptualization: SP, MRL, KW, RE, BL, SDE, JP; data curation: FH, NKV, TM, OR, TB; formal analysis: SP, MRL, FH, NKV, JH, OR, TB; funding acquisition: KW, JP, BL, SDE; investigation: SP, MRL, FH, NKV; methodology: SP, MRL, FH, NKV, RE, SDE, JP; project administration: KW, SDE, JP; resources: SDE, JP; software: JH, SDE, JP; supervision: KW, RE, BL, SDE, JP; validation: SP, MRL, FH, OR, SDE, JP; visualization: SP, MRL, FH, TM; writing—original draft preparation: SP, MRL; writing—review and editing: SP, MRL, FH, TM, JH, OR, TB, RE, BL, SDE, JP. All authors have read and agreed to the published version of the manuscript.
Funding
This work is supported by the BMBF, funding program Photonics Research Germany (FKZ: 13N15708, 13N15466) and is integrated into the Leibniz Center for Photonics in Infection Research (LPI). The LPI initiated by Leibniz-IPHT, Leibniz-HKI, UKJ and FSU Jena is part of the BMBF national roadmap for research infrastructures. In addition, this work is supported by the BMBF (project „SARS-CoV-2Dx“, FKZ: 13N15745). Furthermore, we would like to acknowledge funding of the research project "Intelligente Substrate: Schaltbare Grenzflächen auf Basis multiresponsiver Hybridmaterialien" (P2018-01-004) by the Carl Zeiss Foundation within their program "Durchbrüche".
Acknowledgments
The authors are grateful to Kathrin Schulze for the excellent technical assistance with the virus culture.
Conflicts of Interest
The authors declare no conflict of interest.
TOC entry
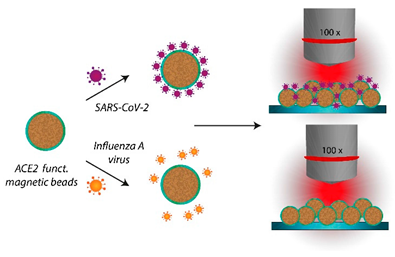
We introduce a simple magnetic bead-based sample preparation scheme enabling the differentiation between SARS-CoV-2 and Influenza A virus using Raman spectroscopy.
References
- Kalvatchev, N.; Sirakov, I. Respiratory viruses crossing the species barrier and emergence of new human coronavirus infectious disease. Biotechnology & Biotechnological Equipment 2021, 35, 37–42. [Google Scholar]
- Menachery, V. D.; Graham, R. L.; Baric, R. S. Jumping species—a mechanism for coronavirus persistence and survival. Current opinion in virology 2017, 23, 1–7. [Google Scholar] [CrossRef]
- Sanjuán, R.; Domingo-Calap, P. Mechanisms of viral mutation. Cellular and molecular life sciences 2016, 73, 4433–4448. [Google Scholar] [CrossRef] [PubMed]
- Dhama, K.; Patel, S. K.; Sharun, K.; Pathak, M.; Tiwari, R.; Yatoo, M. I.; Malik, Y. S.; Sah, R.; Rabaan, A. A.; Panwar, P. K. SARS-CoV-2 jumping the species barrier: zoonotic lessons from SARS, MERS and recent advances to combat this pandemic virus. Travel medicine and infectious disease 2020, 101830. [Google Scholar] [CrossRef] [PubMed]
- Weiss, R. A.; McMichael, A. J. Social and environmental risk factors in the emergence of infectious diseases. Nature medicine 2004, 10, S70–S76. [Google Scholar] [CrossRef] [PubMed]
- Jiang, C.; Li, X.; Ge, C.; Ding, Y.; Zhang, T.; Cao, S.; Meng, L.; Lu, S. Molecular detection of SARS-CoV-2 being challenged by virus variation and asymptomatic infection. J Pharm Anal 2021, 11, 257–264. [Google Scholar] [CrossRef] [PubMed]
- Cassedy, A.; Parle-McDermott, A.; O’Kennedy, R. Virus Detection: A Review of the Current and Emerging Molecular and Immunological Methods. Frontiers in Molecular Biosciences 2021, 8. [Google Scholar] [CrossRef]
- Machado, B. A. S.; Hodel, K. V. S.; Barbosa-Júnior, V. G.; Soares, M. B. P.; Badaró, R. The Main Molecular and Serological Methods for Diagnosing COVID-19: An Overview Based on the Literature. Viruses 2020, 13. [Google Scholar] [CrossRef]
- Pahlow, S.; Meisel, S.; Cialla-May, D.; Weber, K.; Rösch, P.; Popp, J. Isolation and identification of bacteria by means of Raman spectroscopy. Advanced drug delivery reviews 2015, 89, 105–120. [Google Scholar] [CrossRef]
- Lorenz, B.; Wichmann, C.; Stöckel, S.; Rösch, P.; Popp, J. Cultivation-free Raman spectroscopic investigations of bacteria. Trends in microbiology 2017, 25, 413–424. [Google Scholar] [CrossRef]
- Hogan Jr, C.; Kettleson, E.; Lee, M. H.; Ramaswami, B.; Angenent, L.; Biswas, P. Sampling methodologies and dosage assessment techniques for submicrometre and ultrafine virus aerosol particles. Journal of applied microbiology 2005, 99, 1422–1434. [Google Scholar] [CrossRef]
- Antony, A. C.; Louis, V.; Dilip, D.; Cherian, K. A. Purification of recombinant Cucumber mosaic virus (banana isolate) coat protein by sucrose density gradient ultra-centrifugation. Journal of Tropical Agriculture 2021, 58. [Google Scholar]
- Lu, R.; Zhang, C.; Piatkovsky, M.; Ulbricht, M.; Herzberg, M.; Nguyen, T. H. Improvement of virus removal using ultrafiltration membranes modified with grafted zwitterionic polymer hydrogels. Water research 2017, 116, 86–94. [Google Scholar] [CrossRef]
- Fischer, L. M.; Wolff, M. W.; Reichl, U. Purification of cell culture-derived influenza A virus via continuous anion exchange chromatography on monoliths. Vaccine 2018, 36, 3153–3160. [Google Scholar] [CrossRef] [PubMed]
- Du, Y.; Lv, G.; Li, H.; Tong, D.; Lv, X.; Zhang, Z.; Zheng, X.; Wu, G. Quantitative analysis of hepatitis B virus DNA based on raman spectroscopy combined with multivariate statistical methods. Laser Physics Letters 2020, 17, 025001. [Google Scholar] [CrossRef]
- Tong, D.; Chen, C.; Zhang, J.; Lv, G.; Zheng, X.; Zhang, Z.; Lv, X. Application of Raman spectroscopy in the detection of hepatitis B virus infection. Photodiagnosis and photodynamic therapy 2019, 28, 248–252. [Google Scholar] [CrossRef] [PubMed]
- Carlomagno, C.; Bertazioli, D.; Gualerzi, A.; Picciolini, S.; Banfi, P. I.; Lax, A.; Messina, E.; Navarro, J.; Bianchi, L.; Caronni, A.; Marenco, F.; Monteleone, S.; Arienti, C.; Bedoni, M. COVID-19 salivary Raman fingerprint: innovative approach for the detection of current and past SARS-CoV-2 infections. Scientific Reports 2021, 11, 4943. [Google Scholar] [CrossRef] [PubMed]
- Saviñon-Flores, F.; Méndez, E.; López-Castaños, M.; Carabarin-Lima, A.; López-Castaños, K. A.; González-Fuentes, M. A.; Méndez-Albores, A. A Review on SERS-Based Detection of Human Virus Infections: Influenza and Coronavirus. Biosensors 2021, 11, 66. [Google Scholar] [CrossRef] [PubMed]
- Fan, C.; Hu, Z.; Riley, L. K.; Purdy, G. A.; Mustapha, A.; Lin, M. Detecting Food-and Waterborne Viruses by Surface-Enhanced Raman Spectroscopy. Journal of food science 2010, 75, M302–M307. [Google Scholar] [CrossRef]
- Sitjar, J.; Der-Liao, J.; Lee, H.; Tsai, H.-P.; Wang, J.-R.; Liu, P.-Y. Challenges of SERS technology as a non-nucleic acid or-antigen detection method for SARS-CoV-2 virus and its variants. Biosensors and Bioelectronics 2021, 113153. [Google Scholar] [CrossRef]
- Yeh, Y.-T.; Gulino, K.; Zhang, Y.; Sabestien, A.; Chou, T.-W.; Zhou, B.; Lin, Z.; Albert, I.; Lu, H.; Swaminathan, V.; Ghedin, E.; Terrones, M. A rapid and label-free platform for virus capture and identification from clinical samples. Proceedings of the National Academy of Sciences 2020, 117, 895–901. [Google Scholar] [CrossRef] [PubMed]
- Skvortsova, Y.; Wang, G.; Geng, M. L. Statistical two-dimensional correlation coefficient mapping of simulated tissue phantom data: Boundary determination in tissue classification for cancer diagnosis. J. Mol. Struct. 2006, 799, 239–246. [Google Scholar] [CrossRef]
- Martin, J.; Crowley, J. In Proceedings of the Intelligent Autonomous System; IOS Press: Karlsruhe, 1995.
- Hisham, M. B.; Yaakob, S. N.; Raof, R. A. A.; Nazren, A. B. A.; Wafi, N. M. In 2015 IEEE Student Conference on Research and Development (SCOReD), 2015, pp 100-104.
- Shang, J.; Ye, G.; Shi, K.; Wan, Y.; Luo, C.; Aihara, H.; Geng, Q.; Auerbach, A.; Li, F. Structural basis of receptor recognition by SARS-CoV-2. Nature 2020, 581, 221–224. [Google Scholar] [CrossRef] [PubMed]
- Shang, J.; Wan, Y.; Luo, C.; Ye, G.; Geng, Q.; Auerbach, A.; Li, F. Cell entry mechanisms of SARS-CoV-2. Proceedings of the National Academy of Sciences 2020, 117, 11727–11734. [Google Scholar] [CrossRef] [PubMed]
- Li, F.; Li, W.; Farzan, M.; Harrison, S. C. Structure of SARS coronavirus spike receptor-binding domain complexed with receptor. Science 2005, 309, 1864–1868. [Google Scholar] [CrossRef] [PubMed]
- Walls, A. C.; Park, Y.-J.; Tortorici, M. A.; Wall, A.; McGuire, A. T.; Veesler, D. Structure, function, and antigenicity of the SARS-CoV-2 spike glycoprotein. Cell 2020, 181, 281–292. e286. [Google Scholar] [CrossRef] [PubMed]
- Bestle, D.; Heindl, M. R.; Limburg, H.; Van Lam van, T.; Pilgram, O.; Moulton, H.; Stein, D. A.; Hardes, K.; Eickmann, M.; Dolnik, O.; Rohde, C.; Klenk, H.-D.; Garten, W.; Steinmetzer, T.; Böttcher-Friebertshäuser, E. TMPRSS2 and furin are both essential for proteolytic activation of SARS-CoV-2 in human airway cells. Life Science Alliance 2020, 3, e202000786. [Google Scholar] [CrossRef]
- Ramanathan, M.; Ferguson, I. D.; Miao, W.; Khavari, P. A. SARS-CoV-2 B. 1.1. 7 and B. 1.351 Spike variants bind human ACE2 with increased affinity. The Lancet Infectious Diseases 2021. [Google Scholar] [CrossRef]
- Green, N. M. AVIDIN. 3. THE NATURE OF THE BIOTIN-BINDING SITE. Biochem J 1963, 89, 599–609. [Google Scholar] [CrossRef]
- Wei, R. D.; Wright, L. D. HEAT STABILITY OF AVIDIN AND AVIDIN-BIOTIN COMPLEX AND INFLUENCE OF IONIC STRENGTH ON AFFINITY OF AVIDIN FOR BIOTIN. Proc Soc Exp Biol Med 1964, 117, 341–344. [Google Scholar] [CrossRef]
- Ou, J.; Zhou, Z.; Zhang, J.; Lan, W.; Zhao, S.; Wu, J.; Seto, D.; Zhang, G.; Zhang, Q. RBD mutations from circulating SARS-CoV-2 strains enhance the structural stability and human ACE2 affinity of the spike protein. BioRxiv 2020. [Google Scholar]
- Wrapp, D.; Wang, N.; Corbett, K. S.; Goldsmith, J. A.; Hsieh, C.-L.; Abiona, O.; Graham, B. S.; McLellan, J. S. Cryo-EM structure of the 2019-nCoV spike in the prefusion conformation. Science 2020, 367, 1260–1263. [Google Scholar] [CrossRef]
- Mani, T.; Blarer, P.; Storck, F. R.; Pittroff, M.; Wernicke, T.; Burkhardt-Holm, P. Repeated detection of polystyrene microbeads in the lower Rhine River. Environmental Pollution 2019, 245, 634–641. [Google Scholar] [CrossRef]
- Ugelstad, J.; Stenstad, P.; Kilaas, L.; Prestvik, W.; Herje, R.; Berge, A.; Hornes, E. Monodisperse magnetic polymer particles. Blood purification 1993, 11, 349–369. [Google Scholar] [CrossRef]
- Otto, M. Chemometrics: Statistics and Computer Application in Analytical Chemistry; Wiley, 2016.
- Brereton, R. G. Chemometrics: Data Driven Extraction for Science; Wiley, 2018.
- Conover, W. J. Practical nonparametric statistics. Wiley, New York 1999, 428-432.
- Marsaglia, G.; Tsang, W. W.; Wang, J. Evaluating Kolmogorov's distribution. Journal of statistical software 2003, 8, 1–4. [Google Scholar] [CrossRef]
- Pahlow, S.; Kloß, S.; Blättel, V.; Kirsch, K.; Hübner, U.; Cialla, D.; Rösch, P.; Weber, K.; Popp, J. Isolation and enrichment of pathogens with a surface-modified aluminium chip for Raman spectroscopic applications. ChemPhysChem 2013, 14, 3600–3605. [Google Scholar] [CrossRef] [PubMed]
- Storozhuk, D.; Ryabchykov, O.; Popp, J.; Bocklitz, T. RAMANMETRIX: a delightful way to analyze Raman spectra. arXiv 2022. [Google Scholar]
- R Development Core Team. R Foundation for Statistical Computing: Vienna, Austria, 2011.
- Deinhardt-Emmer, S.; Böttcher, S.; Häring, C.; Giebeler, L.; Henke, A.; Zell, R.; Jungwirth, J.; Jordan, P. M.; Werz, O.; Hornung, F.; Brandt, C.; Marquet, M.; Mosig, A. S.; Pletz, M. W.; Schacke, M.; Rödel, J.; Heller, R.; Nietzsche, S.; Löffler, B.; Ehrhardt, C. SARS-CoV-2 causes severe epithelial inflammation and barrier dysfunction. J Virol 2021, 95. [Google Scholar] [CrossRef]
|
Disclaimer/Publisher’s Note: The statements, opinions and data contained in all publications are solely those of the individual author(s) and contributor(s) and not of MDPI and/or the editor(s). MDPI and/or the editor(s) disclaim responsibility for any injury to people or property resulting from any ideas, methods, instructions or products referred to in the content. |
© 2023 by the authors. Licensee MDPI, Basel, Switzerland. This article is an open access article distributed under the terms and conditions of the Creative Commons Attribution (CC BY) license (https://creativecommons.org/licenses/by/4.0/).
