2. Materials and Methods
Materials and Methods
Development of drought tolerant breeding lines
A drought tolerant breeding program was initiated at the College of Agriculture of the University of Sargodha in 2014. Crossings were made between H. argophyllus accessions; i.e., ARG-1802, ARG-1805, ARG-1806 along with H. annuus lines CMS-10 and CMS-24. The two elite lines were planted at 20 days intervals synchronize flowering between the species. The F1 seed was harvested in 2015 and sown in the field in August, 2015 to obtain F2 seed. The F2 populations were planted in February, 2016.
Plants of this segregating population were selected for small leaf area, high cuticular waxes, single heading, good pollen fertility and seed set. Selected plant material was self-pollinated to produce F3 seed. The F3 populations were re-sown in August 2016 and plant progenies were compared for seed setting, pollen fertility and oil contents. Plant progenies with better pollen fertility and single heading were self-pollinated. Plants offspring with better oil contents were selected and F4 plant pd were evaluated during February 2017. These selections were evaluated in the field for single heading type, leaf cuticular waxes, leaf hairiness, leaf area, oil content (%) and days to maturity. Lines with smaller leaf area, higher cuticular waxes, smaller seed size and high oil content were selected and seed was harvested to evaluate the F5 plant progenies. The breeding lines were self-pollinated to develop F6 plant progenies that we used in this study.
Evaluation of drought tolerant plant selections under contrasting water treatments in polythene bags
Thirteen F
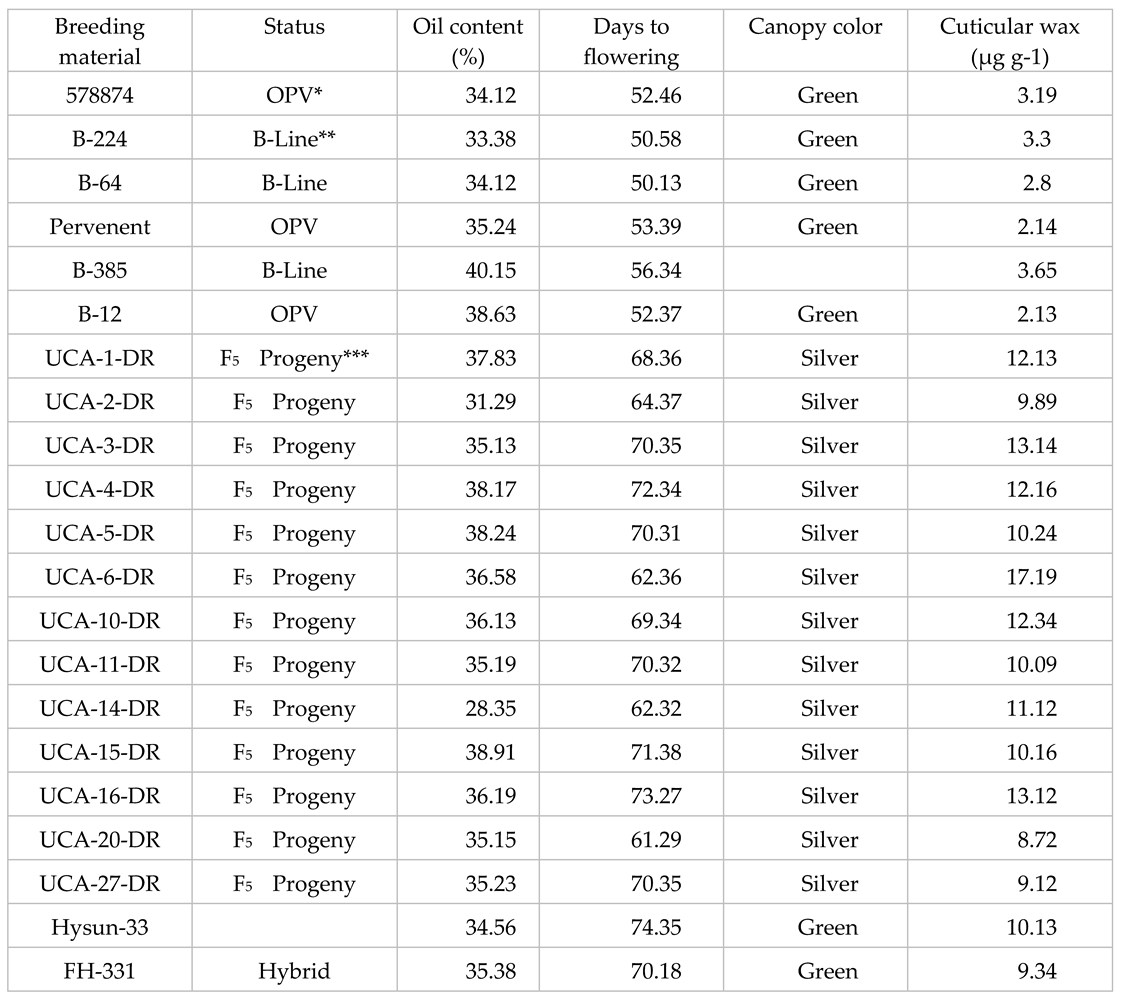
6 drought tolerant breeding lines were compared against randomly selected sunflower elite germplasm lines along with two hybrids (Hysun-33, FH-331) as checks (
Table 1). Polythene bags were filled with equal amount of sand and loam soil. Farm yard manure (5%) was added to improve the texture and water holding capacity of the soil. Each bag was filled with 10 kg of soil and brought to a field capacity at 18%. At planting, 2 g of urea was applied to raise the fertility level of the soil. The soil moisture content in the control treatment was kept at field capacity by regularly irrigating each polythene bag. Four contrasting water regimes were obtained by differential irrigating the polythene bags. The control treatment (T0) received a total 14.5 L of water in 8 split irrigations. Irrigation treatments were 75% (T1), 50% (T2), and 25% (T3) of the control. All treatments were otherwise treated the same with a constant air temperature of 25º C ± 2º, relative humidity set at 40%, day length at 14 h and a photosynthetic active radiation of 850 µmol m
-2 s
-1. Two seed were sown in each bag which was thinned to single seedling. Temperature and soil moisture contents were regularly monitored throughout growing phase. The plants were evaluated for the following traits:
Leaf area: Leaf area was determined using a CID Bio-Science CI-202 portable leaf area meter. Leaf areas of three leaves from each plant were used to determine the average leaf area plant-1. There were five plants within each replication.
Root length (cm): Polythene bags were gently dissected and roots were washed with constant gentle water pressure to avoid breakage of roots. The roots were dried to remove any surface moisture and the primary root length was measured.
Shoot length (cm): it was determined from base to the tip of the meristematic tissues.
Fresh root and shoot biomass: the above ground shoot biomass and root biomass of five plants with in each replication were recorded.
Root shoot ratio: root biomass was divided by shoot biomass to estimate the root shoot ratio
Drought resistance index (DRI) was calculated using the following formula:
where LAS is the leaf area under stress, LANS is the leaf area under non-stress, LAGS is the average leaf area of all genotypes under stress, and LAGNS is average leaf area of all genotypes under non-stress.
Combining ability test
Promising F5 lines were self-pollinated to raise F6 and F7 progenies. Few plants within each F7 progeny (D5, D22, D26, D27) and susceptible lines (B.224 and 577874) were manually emasculated and pollinated with male lines (R.365, R.SIN.82) to test their combining ability for seed yield plant-1, oil contents, head diameter) under semi-arid conditions. All progenies along were sown at two locations (Faisalabad, Sargodha) during spring 2020. Plant progenies were sown with plant-to-plant distance of 22 cm, and row to row distance of 75 cm on ridges. Each progeny was sown in three rows, while length of each row was 3m. All plant material was sown in randomized complete block design with three replications. Field was added with 100 kg ha-1 of diammonium phosphate, while pre-emergence herbicide S-metolachlor (dual gold, Syngenta) was sprayed (1 L ha-1) to get rid of weeds. Soils had field capacity of 18%, and single irrigation of canal water was done to gain uniform seed germination, while both trials were raised on rain fall which was 160 mm and 170 mm at Faisalabad and Sargodha respectively. Most of the rainfall fell, however, during the vegetative phase.
Seed yield plant-1 (g) was determined by harvesting floral heads of 5 plants within each row after maturity. Floral heads were threshed and dried to constant moisture content and mass of each floral head was determined on digital balance. Head diameter was measured with a scale. Means of 5 plants were computed for oil content as determined through soxhlet apparatus. About 10 g of seed sample was crushed gently and put in thimble. Oil contents were determined using n-hexane as solvent.
Statistical analysis
A completely randomized block design with two factors (irrigation treatments and breeding lines) was used. Its data were further examined using the analysis of variance. Heritability was estimated using the approach outlined by Acquaah [
14] where broad sense heritability wass defined as H = V
G/V
P. Combining ability analysis follows what Kempthrone [
15] described for assessing breeding values.
3. Results
The was significant (
P ≤ 0.05) variation due to breeding lines, water treatments and the interaction lines × water treatments (
Table 2). The magnitude of the sum of squares for the interaction lines × treatments was, however, lower than that of breeding lines, thus indicating that breeding lines in all traits except leaf area (LA) did not change significantly across water treatments (
Table 2). LA showed very high lines × treatments, which suggests that breeding lines changed their relative ranking across contrasting water regimes (
Table 2). Heritability estimates for shoot length (SL) and root to shoot ratio (R/S) were moderately high showing that breeding lines may be selected in single treatment for these traits. Root length (RL), shoot weight (SW) and root weight (RW) had low heritability estimates, thereby indicating that selection may be carried out in targeted environment for the improvement of these traits.
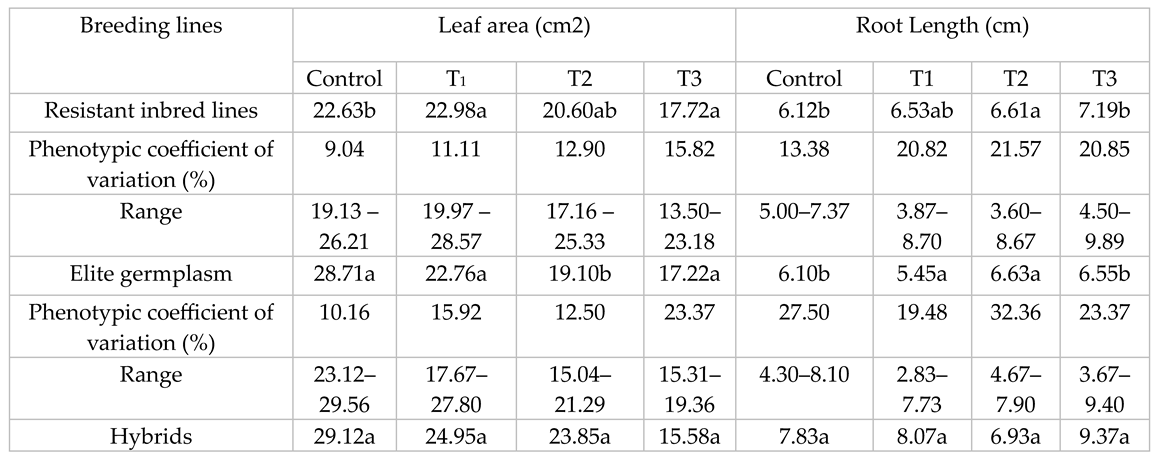
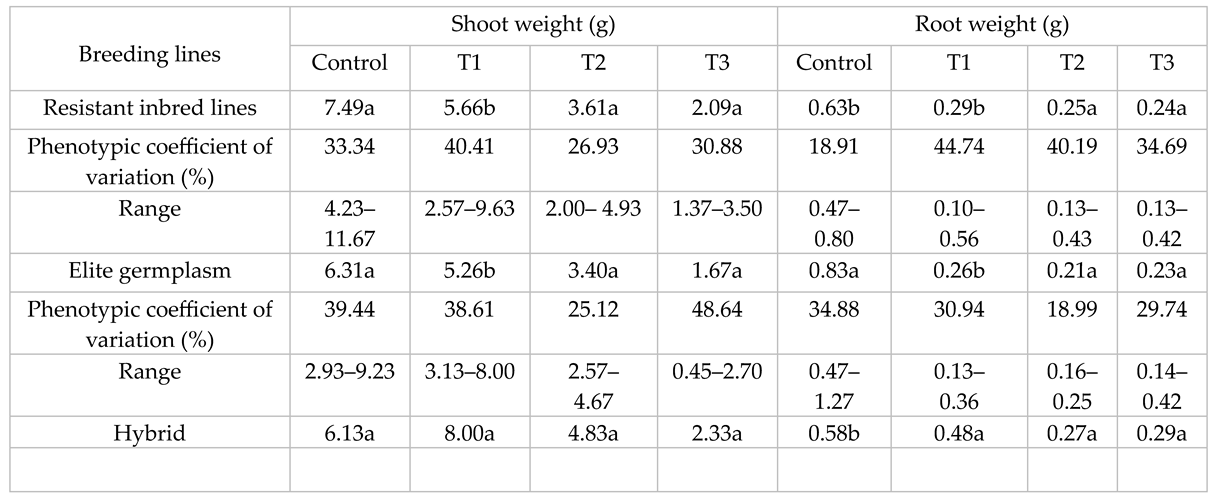
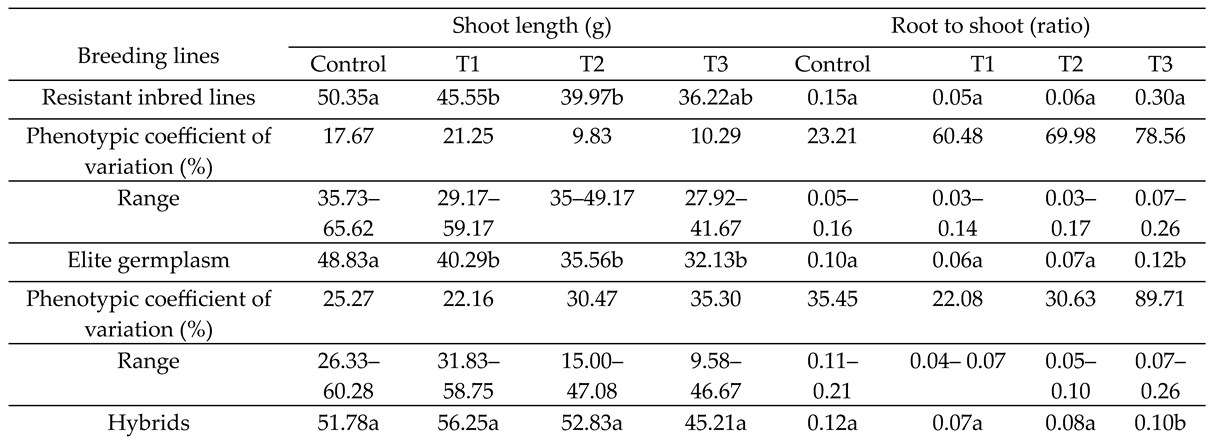
Mean values, ranges and phenotypic coefficient of variation (PCV %) of all traits are given in
Table 3,
Table 4 and
Table 5. Drought tolerant breeding lines (DRL) showed the lowest LA under control conditions. Such results may be due to selection for lower leaf area in the segregating populations. However, leaf area of DRL was maintained and showed lower decrease than non-selected sunflower elite germplasm (SEG) and hybrids in T2 and T3 treatments. DRL experienced a decrease of 0%, 11% and 22% reduction in LA while SEG showed a decrease of 21%, 33% and 40%, under three water stress treatments. Hybrids showed a relative decrease of 18% and 47% for LA. Differences in PCV% was lower in DRL which may be due to the sharing of common parentage and selection for similar traits among DRLs. The differences within PCV% increased with stress treatments for both types of germplasm (
Table 3).
Hybrids had the highest LA under controlled treatments, while RL tended to increase with stress treatments. An increase in RL suggests it is a responsive trait. An increase in the root elongation had been noted as a mechanism for water exploration into lower soil profiles (
Table 3). PCV % increased with drought treatments in DRL while it decreased for the SEG (
Table 4).
SEG showed greater PCV than DRL in control and T3 treatment (
Table 3). RW of SEG was the highest under control treatment while hybrids showed the highest SW in all treatments. DRL was significantly higher than SEG for SW in all treatments. SEG showed higher PCV % under control treatment while DRL showed higher phenotypic variability under water stress treatments as indicated by its PCV %. SL was the highest for hybrids under all treatments and control (
Table 5).
DRL showed higher values than SEG under stress treatments. PCV % was high for SEG while it tends to decrease with stress treatments (
Table 5). R/S of DRL was higher than SEG and commercial hybrids. DRL also showed higher PCV % than SEG (
Table 5).
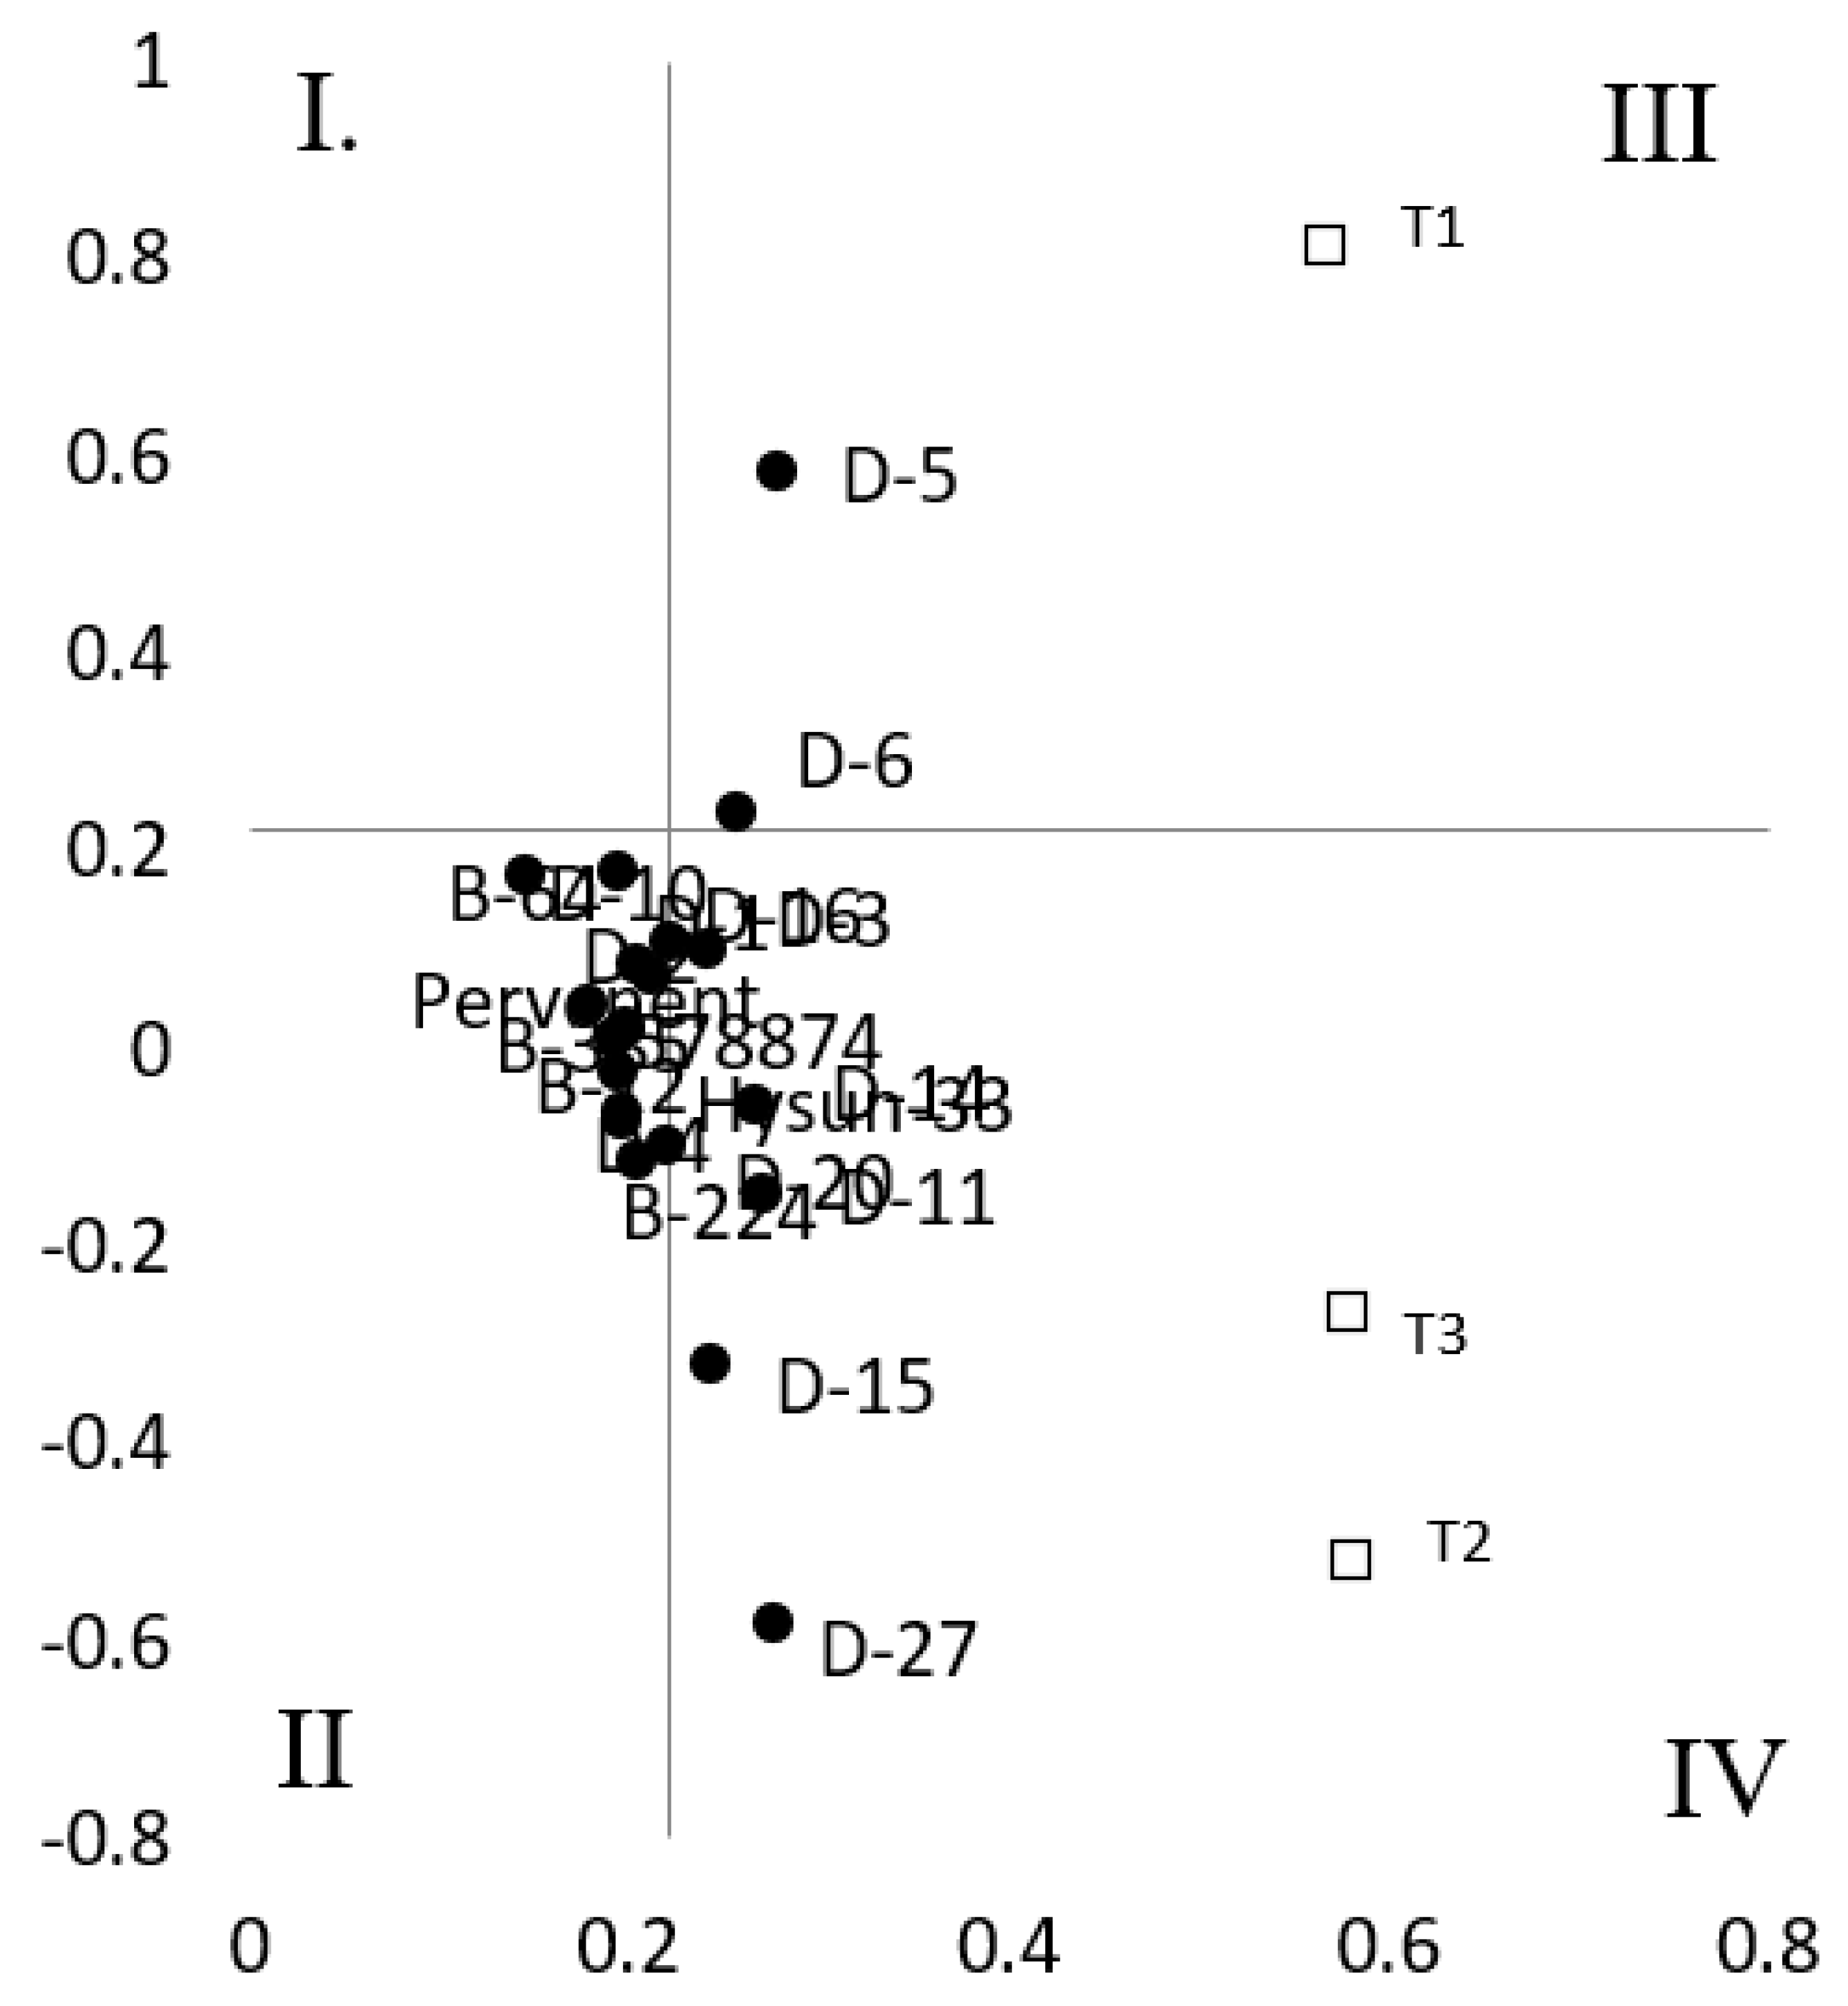
Biplot analysis of genotype characterization for drought resistance is shown in
Figure 1. Breeding lines having a drought resistance index (DRI) equal or above 1 were regarded as tolerant. The biplot includes the breeding lines in quadrants III and IV showing superior performance under T1, T2 and T3 treatments (Fig 1). A genotype such as D5 was tolerant under mild (T1) water stress treatment. D3, D6, D10, D11 and D14 were tolerant in all treatments, while genotypes such as D15 and D27 had shown drought tolerance under high (T2) and medium (T3) stress treatments (Fig. 1).
Correlations between LA and RL was indicated in T1 and T2 (Fig 2). There was a positive correlation between LA and RL. Breeding lines were grouped on the basis of four quadrants in scatter plots (Fig. 2). Quadrant III was marked by the higher LA and RL of genotypes (Fig.2).
Accession B-12 and hybrid Hysun-33 had the highest LA and RL under control treatments. Moreover, B-224, D-27 and Hysun-33 were highest under T1 treatments, D-11 and D-27 were highest under T2 treatments and D-2 and D-5 under T3 treatment (Fig 2).
The relationship between SW and R/S may be explained by the breeding lines under T0, T2 and T3. There was a negative relationship shown for both traits, indicating that R/S increased at the expense of SW and breeding lines partitioned higher biomass to roots under stress treatment (Fig. 3). HD
B-224 showed the highest SW and R/S under T0 and T1. D-44 and Hysun-33 also had the highest SW and R/S under T1. D-15 and D-27 had higher SW and R/S under T2. The breeding line D-5 shows promise but it was present in quadrant II with higher SW but lower RSR (Fig 3).
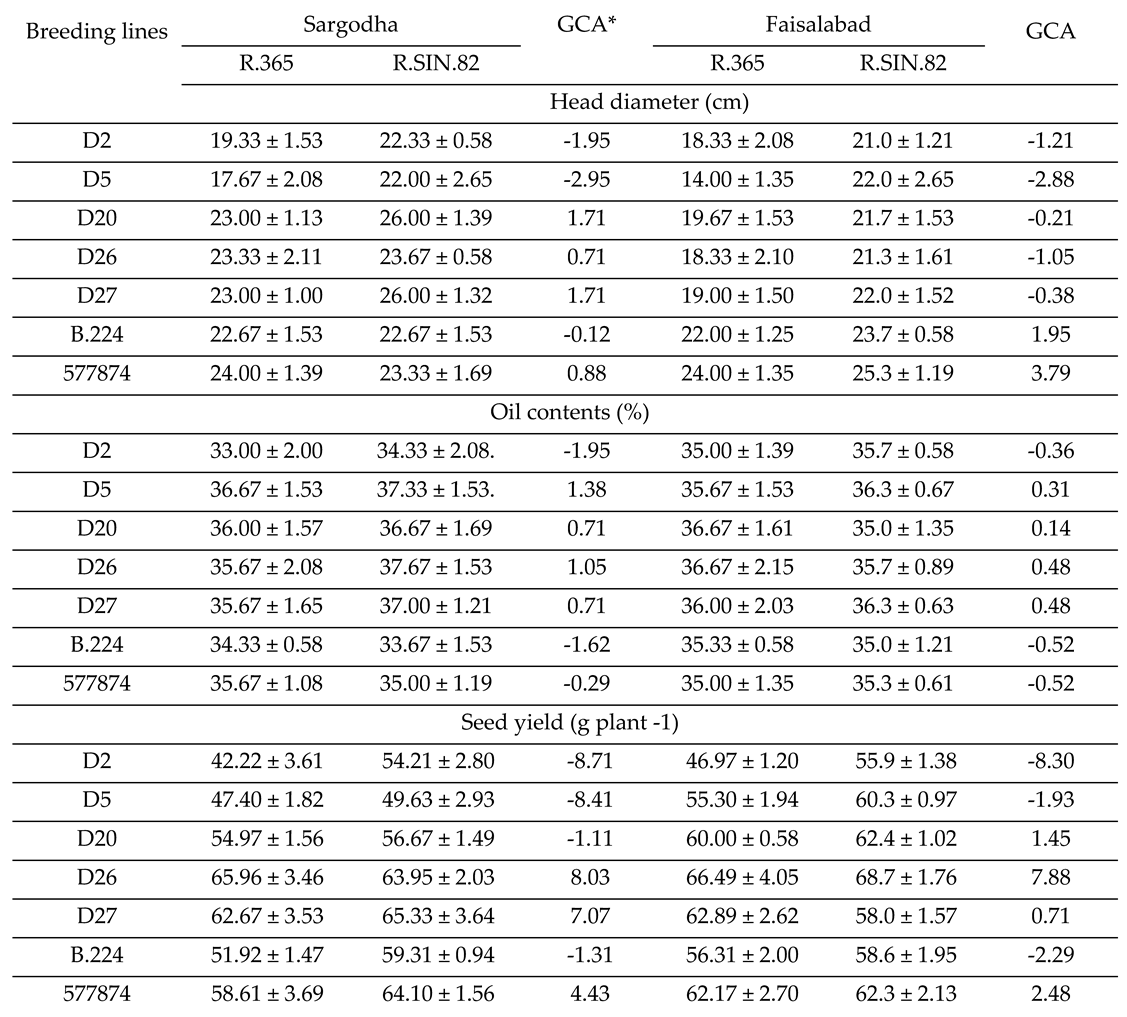
Field trials were conducted to determine the potential of promising drought tolerant breeding lines for hybrid breeding (
Table 6). Selected drought tolerant lines (D2, D5, D20, D26, D27) and susceptible lines (B.224 and 577874) were mated with two males (R.365 and R.SIN.82) and analyzed for yield and components (Fig 6). Breeding line D.26 and D.26 showed the highest head diameter (HD) when mated with R.SIN.82 at Sargodha location (
Table 6). Susceptible accession 578874 and B.224 showed higher HD at Faisalabad location when mated with R.SIN.82. D.20, D.26 and D.27 were positive general combiner for HD at Sargodha and B.224 and 577874 were best combiner for HD at Faisalabad (
Table 6).
D5, D20, D26 and D27 were positive combiner for oil contents at both locations. D.26 showed the highest mean value for oil contents at Sargodha, D5 and D27 had the highest value at Faisalabad when mated with R.SIN.82 (
Table 6). D.26 and D.27 were the best general combiners for Seed yield plant
-1 (SYP) at Sargodha and Faisalabad (
Table 6). D.26 showed the highest SYP when mated with R.365 at Faisalabad and same line showed the highest SYP at Sargodha when mated with R.SIN.82 (
Table 6).
Table 1.
List of the breeding material and their main features.
Table 1.
List of the breeding material and their main features.
Figure 1.
Biplot analysis of drought resistance index of breeding lines and hybrids due to three levels of water stress (T1= mild stress, T2= medium stress, T3= high stress).
Figure 1.
Biplot analysis of drought resistance index of breeding lines and hybrids due to three levels of water stress (T1= mild stress, T2= medium stress, T3= high stress).
Table 2.
Mean sum of squares and heritability estimates of leaf area (LA cm2), root length (RL cm), shoot length (SL cm), shoot weight (SW g), root weight (RW g) and root shoot ratio (R/S).
Table 2.
Mean sum of squares and heritability estimates of leaf area (LA cm2), root length (RL cm), shoot length (SL cm), shoot weight (SW g), root weight (RW g) and root shoot ratio (R/S).
Table 3.
Mean values, ranges, variation within drought tolerant inbred lines compared with elite sunflower germplasm and hybrids under control, low (T1), medium (T2) and high (T3) water stress.
Table 3.
Mean values, ranges, variation within drought tolerant inbred lines compared with elite sunflower germplasm and hybrids under control, low (T1), medium (T2) and high (T3) water stress.
Means followed by the same letter in the same column indicates that the average trait value for lines, elite germplasm and hybrids are non-significantly different (P > 0.05)
Table 4.
Mean values, ranges, variation within drought tolerant inbred lines compared with elite sunflower germplasm and hybrids under control, low (T1), medium (T2) and high (T3) water stress.
Table 4.
Mean values, ranges, variation within drought tolerant inbred lines compared with elite sunflower germplasm and hybrids under control, low (T1), medium (T2) and high (T3) water stress.
Means followed by the same letter in the same column indicates that the average trait value for lines, elite germplasm and hybrids are non-significantly different (P > 0.05)
Table 5.
Mean values, ranges, variation within drought tolerant inbred lines compared with elite sunflower germplasm and hybrids under control, low (T1), medium (T2) and high (T3) water stress.
Table 5.
Mean values, ranges, variation within drought tolerant inbred lines compared with elite sunflower germplasm and hybrids under control, low (T1), medium (T2) and high (T3) water stress.
Means followed by the same letter in the same column indicates that the average trait value for lines, elite germplasm and hybrids are non-significantly different (P > 0.05)
Table 6.
Mean (± standard error) of half sib progenies and general combining ability (GCA) in various traits at two locations.
Table 6.
Mean (± standard error) of half sib progenies and general combining ability (GCA) in various traits at two locations.
4. Discussion
Drought stress treatments showed negative impacts on the morphological traits such as shoot length, leaf area and shoot weight. Nine major traits (including leaf area, leaf number, collar diameter, plant height, leaf water contents, transpiration or osmotic potential) are known to be affected as result of drought response of sunflower [
12]. Putative genes related to these traits were identified through micro array 32423 probe sets [
12]. The sensitivity of these traits to the water stress may be used to distinguish between resistant and susceptible genotypes. Leaf area could be used to differentiate sunflower genotypes under water stress. Leaf area in control treatment may not be used as an index of its resistance to water stress [
1]. Smaller leaf area may be an adaptive mechanism against water stress reducing the evapotranspiration losses. Drought resistant germplasm may be selected for lower leaf area, intense hairiness and cuticular waxes to protect against transpiration losses and exposure to high temperatures [
10,
13]. Leaf area of drought tolerant germplasm was stable under stress treatments; whereas elite germplasm showed significant decline in leaf area, which was an indication of their water stress sensitivity [
8].
The contrasting impact of water stress treatments over magnitude of genetic variation in both types of germplasm was also noted. Drought tolerant breeding lines showed higher magnitude of PCV under stress than the control. Genetic variances due to drought tolerant inbred lines increased under water stress. Functional diversity for drought tolerance was helpful to keep the variability among the germplasm [
5]. Hence, crop diversity conservation has a significant role in enhancing environmental sustainability [
16]. On the other hand, low functional diversity leads to the absence of phenotypic plasticity resulting in the reduction of overall genetic variance in elite germplasm [
17].
A positive relationship between root length and leaf area was indicative of leaf area expansion due to root elongation. Hence, it may be feasible to obtain water from soil profile more efficiently in drought tolerant lines [
10]. Based upon our results, drought resistant lines “D-27” and “D-11” were promising with the highest leaf area and root length. Traits such as shoot weight and root shoot ratio showed a negative correlation indicating that higher root shoot ratios occurred at the expense of reduction of shoot weight [
2]. Breeding lines such as D-2, D-5 and D-27 showed better performance under water stress treatments in our experimental trial.
Combining ability testing was undertaken with two male lines to determine the suitability of developed hybrids based on their performance under semi-arid conditions. Breeding lines with positive GCA had a high frequency of positive alleles for target traits and may show potential for their further use in a hybrid breeding program [5, 18). D.26 and D.27 were promising lines due to their positive GCA values at both locations for oil content and SYP.
Transcriptomic analysis of the sunflower accessions and hybrids was compared to identify genes and transcript involved in drought tolerance mechanisms [16, 19) or to understand the molecular mechanism involved in physiological processes such as leaf senescence [
20]. Hence, these developed tolerant resistant lines may also be an interesting research germplasm for transcriptomic and metabolic analyses to understand the molecular mechanisms and genes involved in the expression of drought tolerance of introgressed bred germplasm.
