Preprint
Article

Application of the DMD Approach to High Reynolds Number Flow Over an Idealized Ground Vehicle

Altmetrics

Downloads

129

Views

33

Comments

0

A peer-reviewed article of this preprint also exists.

Submitted:

27 April 2023

Posted:

28 April 2023

You are already at the latest version

Alerts
Abstract
This paper attempts to develop a Dynamic Mode Decomposition (DMD) based Reduced Order Model (ROMs) which can quickly but accurately predict the forces and moments experienced by a road vehicle such that they be used by an on-board controller to determine the vehicle's trajectory. DMD can linearize a large dataset of high-dimensional measurements by decomposing them into low-dimensional coherent structures and associated time-dynamics. This ROM then also can be applied to predict the future state of the fluid flow. Existing literature on DMD is limited to low Reynolds number applications. This paper presents DMD analyses of the flow around an idealized road vehicle, called the Ahmed body, at a Reynolds number of 2.7E6. The high dimensional dataset used in this paper was collected from a computational fluid dynamics (CFD) simulation performed using Menter's shear stress transport (SST) turbulence model within the context of Improved Delayed Detached Eddy Simulations (IDDES). The DMD algorithm, as available in literature, was found to suffer nonphysical dampening of the medium-to-high frequency modes. Enhancements to the existing algorithm were explored, and a modified DMD approach is presented in this paper which includes: (a) a requirement of higher sampling rate to obtain higher resolution of data, and (b) a custom filtration process to remove spurious modes. The modified DMD algorithm thus developed was applied to the high Reynolds number, separation dominated flow past the idealized ground vehicle. The effectiveness of the modified algorithm was tested by comparing future predictions of force and moment coefficients as predicted by the DMD-based ROM to the reference CFD simulation data, and found to offer significant improvement.
Keywords: 
Subject: Engineering  -   Mechanical Engineering
DISTRIBUTION A. Approved for public release; distribution unlimited. OPSEC#7440

1. Introduction

The reduction of the aerodynamic drag force remains a core objective of vehicle aerodynamic development, and is motivated by the desire to reduce fuel consumption [1,2]. Researchers have attempted to achieve aerodynamic drag reduction through different types of passive flow control devices such as the front bypass ducts [3], rear bypass ducts [4], and various deflector designs [5,6,7]. One of the major limitations of passive flow control devices is that, once installed, they can be difficult to remove or modify. Thus researchers have turned to active flow control devices to achieve flexibility in optimization [8]. Examples of active flow control include a variety of synthetic jet and suction systems [8,9,10,11,12]; interested readers are refereed to the review articles by [13,14] for further details.
Recent technological advances in the automotive industry have shifted the focus of transportation research from human-operated-and-controlled fossil-fuel-based vehicles to electrified (EV) connected and automated vehicles (CAVs). As a results there is a growing interest on the prediction of aerodynamic characteristics in adaptive driving conditions. An example is platooning, where drag reduction is desired via vehicle-to-vehicle interaction of aerodynamics where one or more trailing cars follow a lead car in close proximity. Active control systems are believed to make platooning feasible for all vehicles as autonomous vehicles allow for closer proximity due to reduced reaction times [15,16,17]. Before a control signal can be applied to the moving vehicle, predictions of the future state of aerodynamic forces and moments are required. A Reduced Order Model (ROM) can be used to make future state predictions of the aerodynamic flow field [1]. For adaptive systems, the future state predictions can then be coupled with a control input to obtain the desired performance characteristics [18].
Previous studies on the adaptation of aero-devices largely relied upon time-averaged wind tunnel experiments or Reynolds-Averaged Navier-Stokes (RANS) based numerical methods. Fluid flows around road and race vehicles are highly turbulent and consist of many dynamic coherent structures that are characterized by a wide range of length and time scales. The evolution and convection of these structures gives rise to macroscopic spatio-temporal patterns [1,19,20,21]. Hybrid turbulence modeling simulation approaches such as Improved Delayed Detached Eddy Simulation (IDDES) have shown greater success at elucidating these finer vortical structures in the flow field. The challenge with such Scale-Resolved Simulation (SRS) approaches comes from the grid resolution requirements for the high Reynolds number flow field that they try to resolve. It is seen that the spatio-temporal domain must be resolved to the so-called Taylor scales [21,22,23]. Such SRS approaches are resource-prohibitive, since the onboard controller on a moving vehicle would likely not have the processing power and time needed to solve a transient flow field while attempting to implement real-time control of the vehicle’s trajectory. Thus, there is a need for a Reduced Order Model (ROM) that can provide fast, accurate, and reliable flow predictions utilizing feasible computational resources; decompose the fluid flow into its constituent parts can be very helpful in this regard. Researchers in this field have largely resorted to methods of modal decomposition to analyze the flow field [1,24,25].
Proper Orthogonal Decomposition (POD) has been a popular method for the modal decomposition of fluid flows [26,27,28,29]. However, the POD modes are arranged by energy and not by dynamical importance, contain a mix of frequencies, and have unclear truncation criteria [30]. In recent times researchers have used Dynamic Mode Decomposition (DMD) which is a data-driven linearization algorithm that can decompose a set of data into its constituent modes and extract the associated oscillation frequencies of each mode [31]. These constituent modes and their associated oscillation frequencies can then be used to make future state predictions of the system [32,33]. DMD has shown success when applied to a variety of fluid dynamic problems including water jets [33], backward-facing step [34], circular cylinder wakes [35,36,37], Poiseuille flow, supersonic jet [38], open cavity flows [39], boundary layer flows [36], airfoil, and hydrofoil flows [40,41]. DMD has been seen to be adaptable and many variants exist. Interested readers are directed to Kutz’s book [24] and Schmid’s review paper [25] for further details.
All of the studies cited above applied DMD to relatively simple flow fields at low Reynolds numbers. A Ground Vehicle (GV) has an associated flow field that is much more complex and at orders of magnitude higher Reynolds number which implies a larger spread of length and time scales within the flow field [20,21]. Fewer studies have applied DMD to such separation-dominated flows, high Reynolds number flows. [1] performed DMD on a DrivAer geometry at a Reynolds number of 4.8 × 10 6 ; note that the DrivAer model, developed by [42], is a simplified rendering of a highly complex vehicle geometry. Ahani’s work was primarily focused on comparing the obtained mode shapes from DMD to those obtained from POD. Another study with the DrivAer geometry by [43], performed a low-pass filtering with a cutoff frequency of 10 Hz before the data was processed by the DMD algorithm, and thus, filtered out all the complexities associated with a high Reynolds number flow.
As mentioned earlier, the development of a ROM capable of producing reliable future state predictions will be very useful for the on-road adaptation of the CAVS. However, we needed an engine for this ROM development. Based on the currently available mathematical tools for fluid flow characterization, we anticipated that DMD is a strong candidate. Thus, the objective of this study is to analyze the effectiveness of the DMD methodology in reconstructing the flow field round a moving GV at a high Reynolds number using data generated from an IDDES based CFD simulation. [30] states that the weaknesses of DMD include the requirement to obtain time-resolved data with high resolution, and the metrics to identify dominant modes. In order to obtain such a “reliable” DMD for the high Reynolds number fluid flows, certain parameters pertaining to the DMD requirements must be determined: (a) length of one data sampling window, (b) data sampling frequency, and (c) number of data samles for converged ensemble averaging. Additionally, we need to know whether it is necessary to go through the Singular Value Decomposition (SVD) step, as seen in the existing DMD algorithm, and if so, the truncation criteria for the SVD need to be defined. Also, it is important to know whether the inverse transformation, i.e the reconstruction of the flow field from the DMD modes suffers from the artifacts of spurious high-frequency modes or other noise. As well, we to know how much flow energy is conserved when the flow field is reconstructed, and the minimum energy that must be retained when performing a low-dimensional transformation of the system.
In this paper, we attempted to address these questions by applying DMD to a high Reynolds number, separated flow past an idealized road vehicle, the Ahmed body geometry [44] for which extensive experimental and CFD data are available for correlation and validation. We chose to proceed with the 35 ° slant angle Ahmed body model variant as the flow over this model shows all the salient features of the flow over a Sport Utility Vehicle (SUV)-type of vehicle that is the subject of the next phase of our work [45].
The work flow of this study involves first perming DMD on a canonical 2D cylinder flow at a low Reynolds number to verify the accuracy of the DMD output. Next, we performed the CFD simulation of the GV and validated the CFD results against published experimental data [44,46]. We then performed a DMD analysis using the data collected from the CFD simulation. Modifications to both the CFD data generation strategy along with the creation of a filtering process for removing spurious modes obtained from the model decomposition. The subsequent sections further explain the methodology that was used and the results that were obtained. The methodology developed in this paper can be applied to generic vehicle shapes, like the DrivAer, and subsequently to more complex real-life road vehicles to develop ROMs which can predict on-road characteristics of the vehicle subject to changes in vehicle operating conditions, such as the CAVs in a platoon.
This paper forms a part of the lead author Adit Misar’s doctoral dissertation work [47].

2. DMD Equations

The first step in the DMD process involves storing the data in a vector form, X i N = { x i 1 , x i 2 , . . . , x i N } , where the subscript i represents the i th element of the grid where the snapshots of the flow field were taken, and N is the total number of time snapshots collected. Thus, each time snapshot x n , is a vector containing data from all m grid elements at time instant n. If we expand the vectors for the grid elements, we can build the complete dataset in matrix form as shown in Equation (1)
X = x 1 1 x i N x m 1 x m N
In DMD approach, the collected data set from a dynamical system is represented as a coupled system of ordinary differential equations, as given in Equation (2), which itself contains non-linear relations in spatial and temporal domains.
d x / d t = f ( x , t )
The idea is to represent data from the non-linear, complex system as a locally linear regression such that x k + 1 = A x k , where A is then chosen to minimize x k + 1 A x k 2 over k = 1 , 2 , 3 , . . . , N 1 . Since we have collected the data from the system, x k + 1 and x k are known, but the function relating them is unknown.
x k + 1 = F ( x k )
The DMD approach then constructs a locally linear approximation of the dynamical system:
d x d t = A x
This ordinary differential equation (ODE) form of the dynamical system is advantageous as, with initial conditions, we have a well known solution
x ( t ) = k = 1 N ϕ k exp ( ω k t ) b k = Φ exp ( Ω t ) b
where b k is the amplitude of each mode, ϕ k are the DMD modes (mode shapes involving the eigenvectors of A), and ω k are the continuous-time eigenvalues of A. The matrix that results as a product of terms, exp ( Ω t ) b , is also referred to as the “time-dynamics” of the system as it contains the information associated with the frequency, amplitude, and growth rates for all of the modes. Now, when the dimensions of X are large, A becomes impossibly large to mathematically work with. The DMD process circumvents this through its eigen-decomposition of A by considering a rank–reduced representation, A ˜ , which has the same non-zero eigenvalues as A, and is obtained by performing SVD of X using the collected data.
X U Σ V *
In Equation (6), X is a rectangular data matrix of size m × n , U is a complex unitary matrix of size m × n that contains the left singular vectors which are the POD modes, Σ is a rectangular diagonal matrix of size m × n having positive real number as its diagonal elements and V * is a complex unitary matrix of size n × n and * represents a complex conjugate transform. The diagonal elements σ i of Σ i j are the singular values of X. Next, the matrix A may be obtained by using the pseudo-inverse of X, shown in Equation (7)
A = X V Σ 1 U *
In practice, since A can be computationally prohibitive to calculate, A ˜ is computed by way of a unitary transform of A as shown in Equation (8)
A ˜ = U * A U = U * X V Σ 1
With A ˜ we can now create a low dimensional subspace of A
x ˜ k + 1 = A ˜ x ˜ k
an can compute the eigendecomposition of A ˜
A ˜ W = W Λ
where columns of W are the eigenvectors of A ˜ and the diagonal elements, λ k , of Λ are the DMD eigenvalues. Now we can use the eigendecomposition of A ˜ to reconstruct the high dimensional DMD modes. The eigenvalues of A, ω k , are expressed in terms of the diagonal elements λ k of Λ which are scaled logarithmically according to the relation ω k = l n ( λ k ) / Δ t . The eigenvectors of A are given by Equation (11)
Φ = X V Σ 1 W
The mode amplitudes may be calculated as
b = Φ x 1
where denotes the adjoint operator, ϕ k , ω k and b k may now be used in Equation (5) to obtain system state predictions. The interested reader is again directed to the original articles and review papers for a more detailed description of the DMD process [25,48,49]. Lastly, Equation (5) can be rewritten as Equation (13) [50]
x i = j = 1 N 1 b i j Φ N o r m , j ( x , y )
Kou and Zhang [50] then used this representation to extract a new parameter I j which denotes the influence of a mode on the entire sampling window as opposed to only at the initial condition. I j is defined as
I j = | b j ( t ) | i = 1 N | b i j | d t
The parameter I j was proposed as an improved method of mode selection. This concept was further modified by Ahani and Uddin [1] and the integral term was replaced with a Root Mean Squared (RMS) term. This new RMS method was used for mode selection.

3. Methodology

We investigated three cases in this study. Case 1 (C1 here in after) involves a low Reynolds number flow past a 2D circular cylinder which is a simplified and relatively well known case, and was used for initial validation of the DMD process. The second and third cases (C2 and C3, respectively) used the Ahmed body geometry in a high Reynolds number flow. C2 and C3 differ in regards to the extents of the computational domain and the associated boundary conditions. C2 used Ahmed’s (1984) [44] wind tunnel dimensions as the computational domain. However, wind tunnel setup of Ahmed results in a blockage ratio of 4 % and necessitates blockage ratio corrections. Since, most vehicles are run in an open-air (OA) configuration we considered it is important to switch our Virtual Wind Tunnel (VWT) setup to an OA configuration to be a better resemble real world driving environment. For C3, based upon the authors prior experience, the extents of the computational domain were significantly increased [51].

3.1. Solver Settings

All CFD simulations were carried out using a commercial finite volume code STAR-CCM+ version 2020.2. For C1, a laminar, incompressible solver was used. The time step size, Δ t , was set to 0.3 × t * , where t * represents one Large Eddy Turn Over Time (LETOT). A LETOT is defined as the amount of time required for the freestream flow to pass over the characteristic length of the geometry a single time, i.e. t * = ( t × U ) / L , where U is the freestream velocity and L is the characteristic length scale.
As flow case C2 and C3 represent turbulent flows, incompressible Improved Delayed Detached Eddy (IDDES) solver was used [52,53]. The IDDES approach represents extensions of the original Detached Eddy Simulation (DES) approach proposed by Spalart and coworkers [54,55]. DES is a hybrid approach that combines, for computational efficiency, Large Eddy Simulation (LES) in the regions far away from the wall and Reynolds Averaged Navier Stokes (RANS) in the boundary layer region. The switching between LES and RANS is done by computing a local turbulent length scales, l T , and a local grid size, l L E S . However, existing literature reports that LES may incorrectly be applied inside the boundary layer when l T and l L E S drop below a critical value. This can then cause a phenomenon called Grid Induced Separation (GIS), which is a prediction of nonphysical separation due to the local grid size. In the Delayed DES (DDES) approach, GIS is prevented by introducing a delay in the switching function based on the wall normal distance and local eddy viscosity [56]. IDDES, proposed by [52], is the next extension of the DES which combines DDES and and wall modeled LES (WMLE) [57]. In WMLES, RANS is limited to a much thinner near-wall region where the wall distance y is very small compared to the boundary layer thickness, but y + y u τ / ν is significantly large; note that u τ τ w / ρ where τ w , ρ , and ν represent the wall-shear stress, fluid density and viscosity, respectively. IDDES was reported to resolve the issue of mismatch between the modelled log layer and the resolved log layer and broadens the application area by providing well-balanced simulation approach for high Reynolds number turbulent flows.
The RANS region in the our IDDES is solved using Menter’s Shear Stress Transport (SST) k - ω turbulence model [58,59]. For brevity, mathematical equations related to the RANS, IDDES and SST models are omitted from this paper as there are plentiful of resources for these. Interested readers are referred to the original articles by Menter and his coworkers [58,59,60] for the development of the k - ω model, and to automotive external aerodynamics article by [61] for all relevant equations.
In C1 and C2, a two-layer wall treatment was used to ensure accurate boundary layer activities. The time step size of Δ t = 1 × 10 4 × t * was found to be sufficient for this setup [22,62]; this time-step is same order of magnitude as that within the study of decomposition of flow by DMD relative to POD by [1] where they used a DrivAer geometry, a flow with a Reynolds number of 4.8 E 6 , and a time step size of Δ t = 5.2 × 10 4 × t * . To minimize the effects of domain decomposition in CFD predictions, all simulations were run on UNC Charlotte High Performance Computing (HPC) clusters using 144 processors across 3 nodes having 48 processors each [63].

3.2. Geometry, Domain, and Boundary Conditions

For case C1, the circular cylinder with a diameter D = 0.01 m was placed in the simulation domain. The longitudinal extents of the computational domain were 5 D upstream and 20 D downstream of the object respectively. The cross-stream extents were 5 D on both sides. The upstream edge was specified as a velocity inlet having a streamwise velocity set to . 15 m/s, the down-stream edge was specified as a zero gauge pressure outlet, and the top and bottom edges were specified as zero-gradient boundaries. This setup is found in the user guide of Star-CCM+ version 2020.2 and references the work of Daily et al. [64]. This flow corresponded to a Reynolds number of 75. The C1 case had 15 inner iterations and was run for 120 LETOTs, and the last 80 LETOTs of data were used for analyses.
For case C2, the Ahmed body geometry was placed in a VWT of 8 L × 5 H × 5 W in the stream-wise, vertical and lateral extents, respectively; here L, W and H represents the length, width, and height of the Ahmed body. These dimensions are similar to the physical wind tunnel used in Ahmed’s original experiment. The vehicle body was placed at a distance of 2 L from the upstream boundary. Boundary conditions were applied to the computational domain to match the wind tunnel setup of [44] and [46]. These included a velocity inlet of 40 m/s applied to the upstream face with turbulence intensity of 0.25 % and a turbulence length scale of 10 mm, a 0 Pa gauge pressure applied as an outlet condition to the downstream face, and all other boundaries were specified as no-slip walls. This configuration results in a blockage ratio of 4 % .
For case C3, the domain extents were significantly increased to 31 L × 35 H × 31 W in the stream-wise, vertical and lateral extents, respectively, with the Ahmed body placed at a distance of 10 L from the upstream boundary. The side wall boundaries were changed to a velocity inlet and a pressure outlet to prepare for crosswind simulations which will be the subject of a subsequent study. This setup for the side-wall boundary conditions is different from the one used by [65] in their study the turbulence modeling effects on the aerodynamic characterizations of a stock racecar subject to yaw where in which a zero gradient boundary condition was used for the side walls. However, later studies by [51] shows that zero-gradient boundary condition poses nonphysical pressure reflections unless the virtual tunnel in infinitely wide. Additionally, to imitate a moving-ground simulation, the floor of the tunnel was given a tangential velocity equal to the free-stream velocity, the ceiling of the VWT was set as a zero-gradient boundary. This setup was taken from the authors’ experience of performing CFD of crosswind simulations [51]. Both C2 and C3 had a Reynolds number of 2.86 × 10 6 which is several orders of magnitude larger than the 2D cylinder case.
For Cases C2 and C3, each time step was run for 10 inner iterations to ensure that residuals had reduced by at least 3 orders of magnitude. Last 30 LETOTs of data were used for analyses. C2 simulation was run for 160 LETOTs. It was found that the initial transients subsided after 30 LETOTs. Thus, C3 was run for 130 LETOTs. In both C2 and C3, the last 80 LETOTs were used for averaging and data collection. The last 80 LETOTs correspond to about 2 s of physical time and thus provided the opportunity to capture a lowest possible frequency of 0.5 Hz.

3.3. Discretization Scheme

The flow case C1 was discretized using polyhedral cells. It has a near wall cell size of 0.05 D near the cylinder surface and grows to 0.1 D elsewhere in the domain. It has 5 prism layers on the cylinder boundary resulting in a total cell count of 20,000.
For cases C2 and C3, the simulation domain was discretized using unstructured hexahedral cells. To properly resolve the flow around the GV, five refinement volumes were used around the geometry. The finest mesh was set to a size the order of the expected Taylor length scale, λ [19,22,46]. Further, to properly resolve the boundary layer flows on all the surfaces, a prism layer mesher was used to ensure that the wall y + values are less than unity. In the final mesh, more than 99% surfaces had a y + value less than unity. For C2, the mesh consisted of 15.24 million cells. For C3, meshing parameters are kept the same as Case C2 resulting in a mesh of 21.94 million cells.

3.4. DMD Workflow

The step-by-step process required to perform a classical DMD is available in detail in [24], however, a brief summary of these steps is provided below:
  • Step 1: Collect multiple time snapshots of the system of interest,
  • Step 2: Create a low-dimensional subspace using the SVD or Truncated SVD (TSVD) methods,
  • Step 3: Obtain an eigendecomposition of the low-dimensional subspace,
  • Step 4: Using the eigendecomposed low-dimensional subspace, assemble the mode shapes and their associated oscillation frequencies, called the ’Time Dynamics’ or TD for short,
  • Step 5: Use the mode shapes and TD to assemble the DMD output equations,
  • Step 6: Use the DMD solution to predict (or reconstruct) the flow field.

3.5. Data Collection Strategy

Storing the entire 3D flow field data associated with all of the time-averaging window time steps would impractically require more than 3 petabytes of data. Therefore, since we are more focused on the GV aerodynamic force and moment predictions, we collected the static pressure field on the Ahmed body surface. Additionally, to capture the flow field around the GV, we chose eight 8 reference planes around the Ahmed body. For some of these planes, experimental data are available and may be used for future validation steps, such as the wake planes at x / L = 1.077 , 1.192 , 1.479 [20,46]. The other chosen planes are anticipated to involve flow patterns in critical flow-regimes when crosswind and vehicle interaction simulations are later performed, such as the planes at y / W = 0.5 (or Y = 0 center-plane), 0.88 , and 1.27 and Z = 0.5   × Ground Clearance, 0.5 × H , 1.15 × H , and 1.3 × H . Over each reference plane, seven scalar quantities were collected: the pressure coefficient, three components of velocity, turbulent kinetic energy (TKE) or k, vorticity, and the Q-criterion [66]. Thus, instead of storing the entire 3D flow field, we stored only the data from the Ahmed body surfaces and these eight reference planes. By using this strategy we extract about 3.4 TB of data per GV simulation since STAR-CCM+ exports this data in ASCII format with redundancies in the spatial locations. By converting the data to binary format and removing the redundancies, resulting in about 400 GB of binary data per case, which is deemed to be a feasible approach. This study is limited to the analyses of vehicle surface static pressure data. The CFD simulation time-step size implied that the data is sampled at a rate of 4 kHz, and thus, the Nyquist criterion implies that flow structures having frequency of up to 2 kHz can be captured by the DMD reconstruction.

4. Results

4.1. CFD Validation

CFD predictions of the drag coefficient ( C D ) were validated against the wind tunnel measurements of [44] and was also comapred to the IDDES CFD simulation of [22] as can be seen in Figure 1, which also contains predictions using the OA configuration. Clearly, our CFD prediction of drag matches very well with the experimental result when the vehicle is placed in a VWT. A 6% reduction in C D was observed for the OA configuration which has a blockage ratio of < 0.25 % ; existing literature suggests that up to 12 % drop in C D prediction can be expected [67,68].

4.2. Application of DMD to a Canonical Flow Case
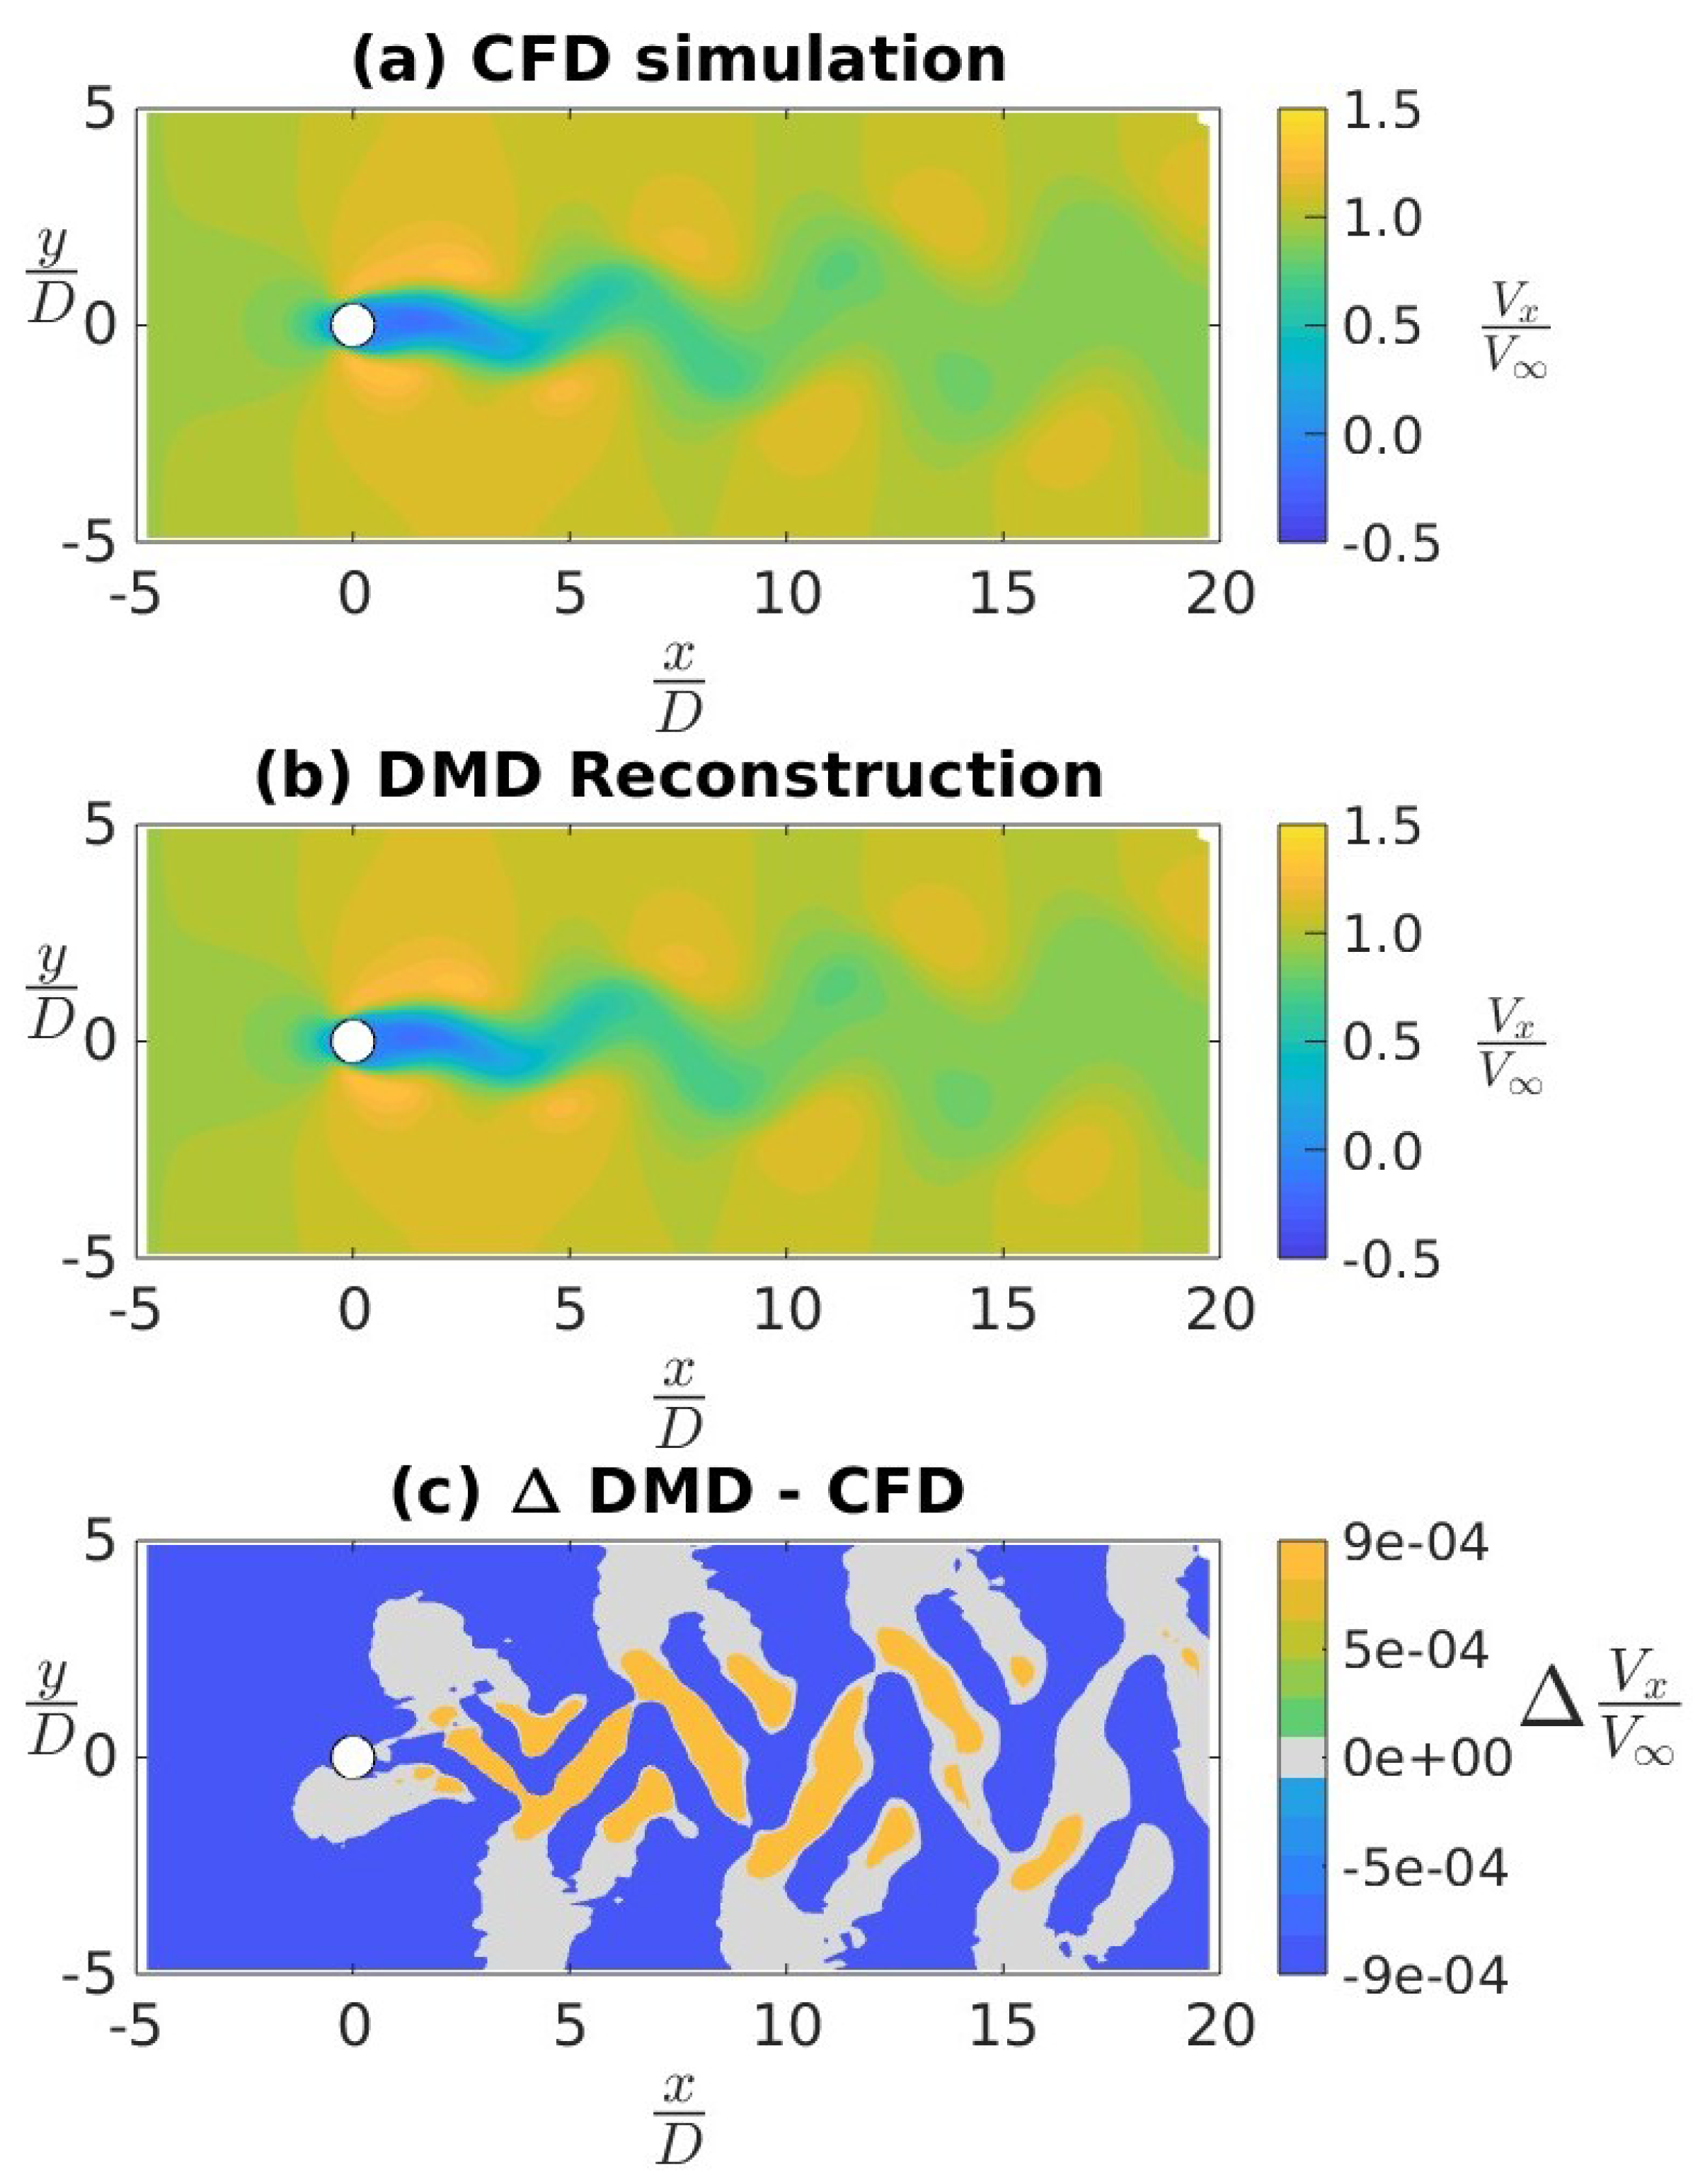
As a first learning exercise, we performed the DMD of a canonical flow past a 2D circular cylinder at a Reynolds number of 75, similar to a number of DMD esearch found in the literature [35,36,37]. Figure 2 shows scalars of stream-wise velocity normalized by the freestream velocity at the instant t * = 120 . The very last time instance was chosen for validation as a test case because the DMD predictions from Equation (5), which is in exponential form, are known and expected to diverge with large values of time. We compared the flow field as obtained from the DMD reconstruction to the CFD simulation. From Figure 2a,b, we can see that the DMD reconstruction was qualitatively similar to the CFD prediction. This was an encouraging sign for the ability of DMD to reconstruct the flow field. Further, in Figure 2c, we plotted the difference in the normalized streamwise velocity prediction between the DMD reconstruction and CFD simulation at the time t * = 120 . We saw that the difference between DMD and CFD at this time instance is very small, with the order of magnitude of the differences being 10 4 . Thus, we inferred that the DMD reconstruction is well correlated to the CFD prediction.
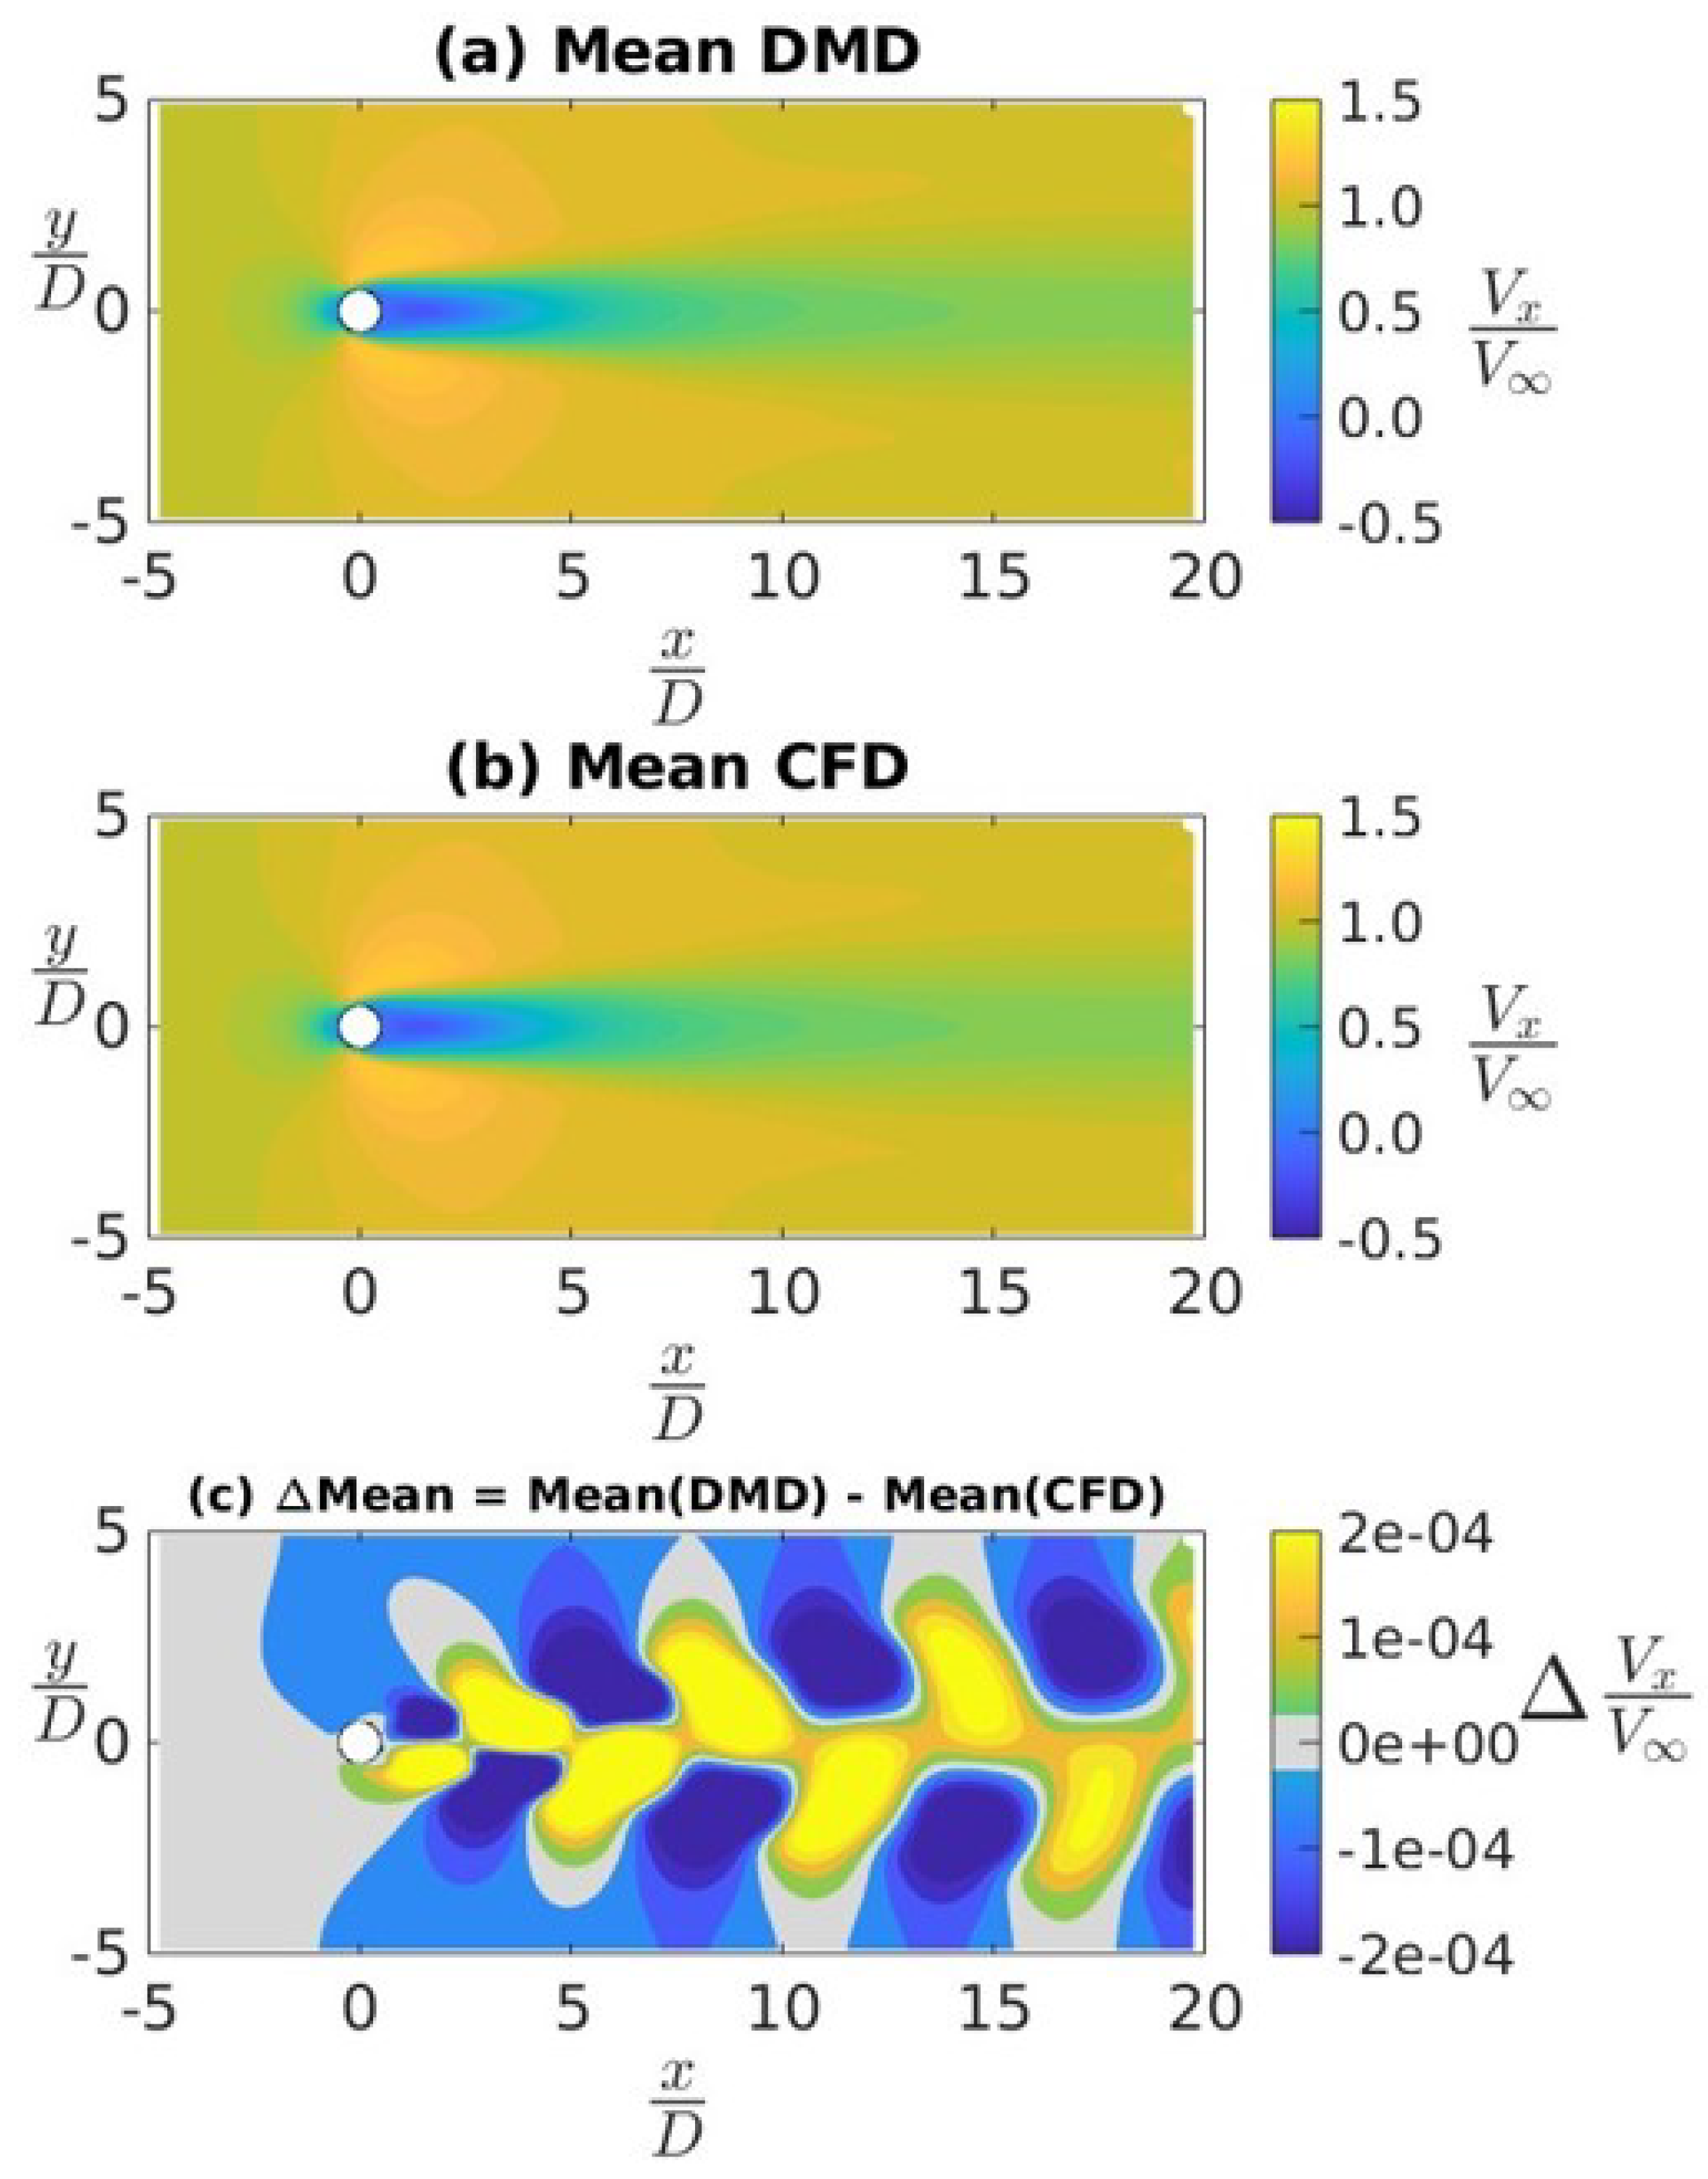
We note that it is pointless to compare two instantaneous turbulent flows. Thus, similar to the Reynolds decomposition approach used in turbulent flows, we will be looking at the mean and fluctuating components of the flow field separately. As an example, using the above 2D cylinder case, in Figure 3, we can see a comparison of CFD and DMD results of the normalized mean stream-wise velocity. For both CFD and DMD results, the flow field statistics are taken from the last 30 LETOTs of the simulation data. Similar to the analysis of Figure 2, in Figure 3a,b, we saw that the mean of the DMD reconstructed flow-field is qualitatively similar to one obtained from the CFD simulation. Furthermore, in Figure 3c, we can also see that the difference in the mean of the normalized streamwise velocity prediction between DMD reconstruction and CFD simulation is very small, O ( 10 4 ) .
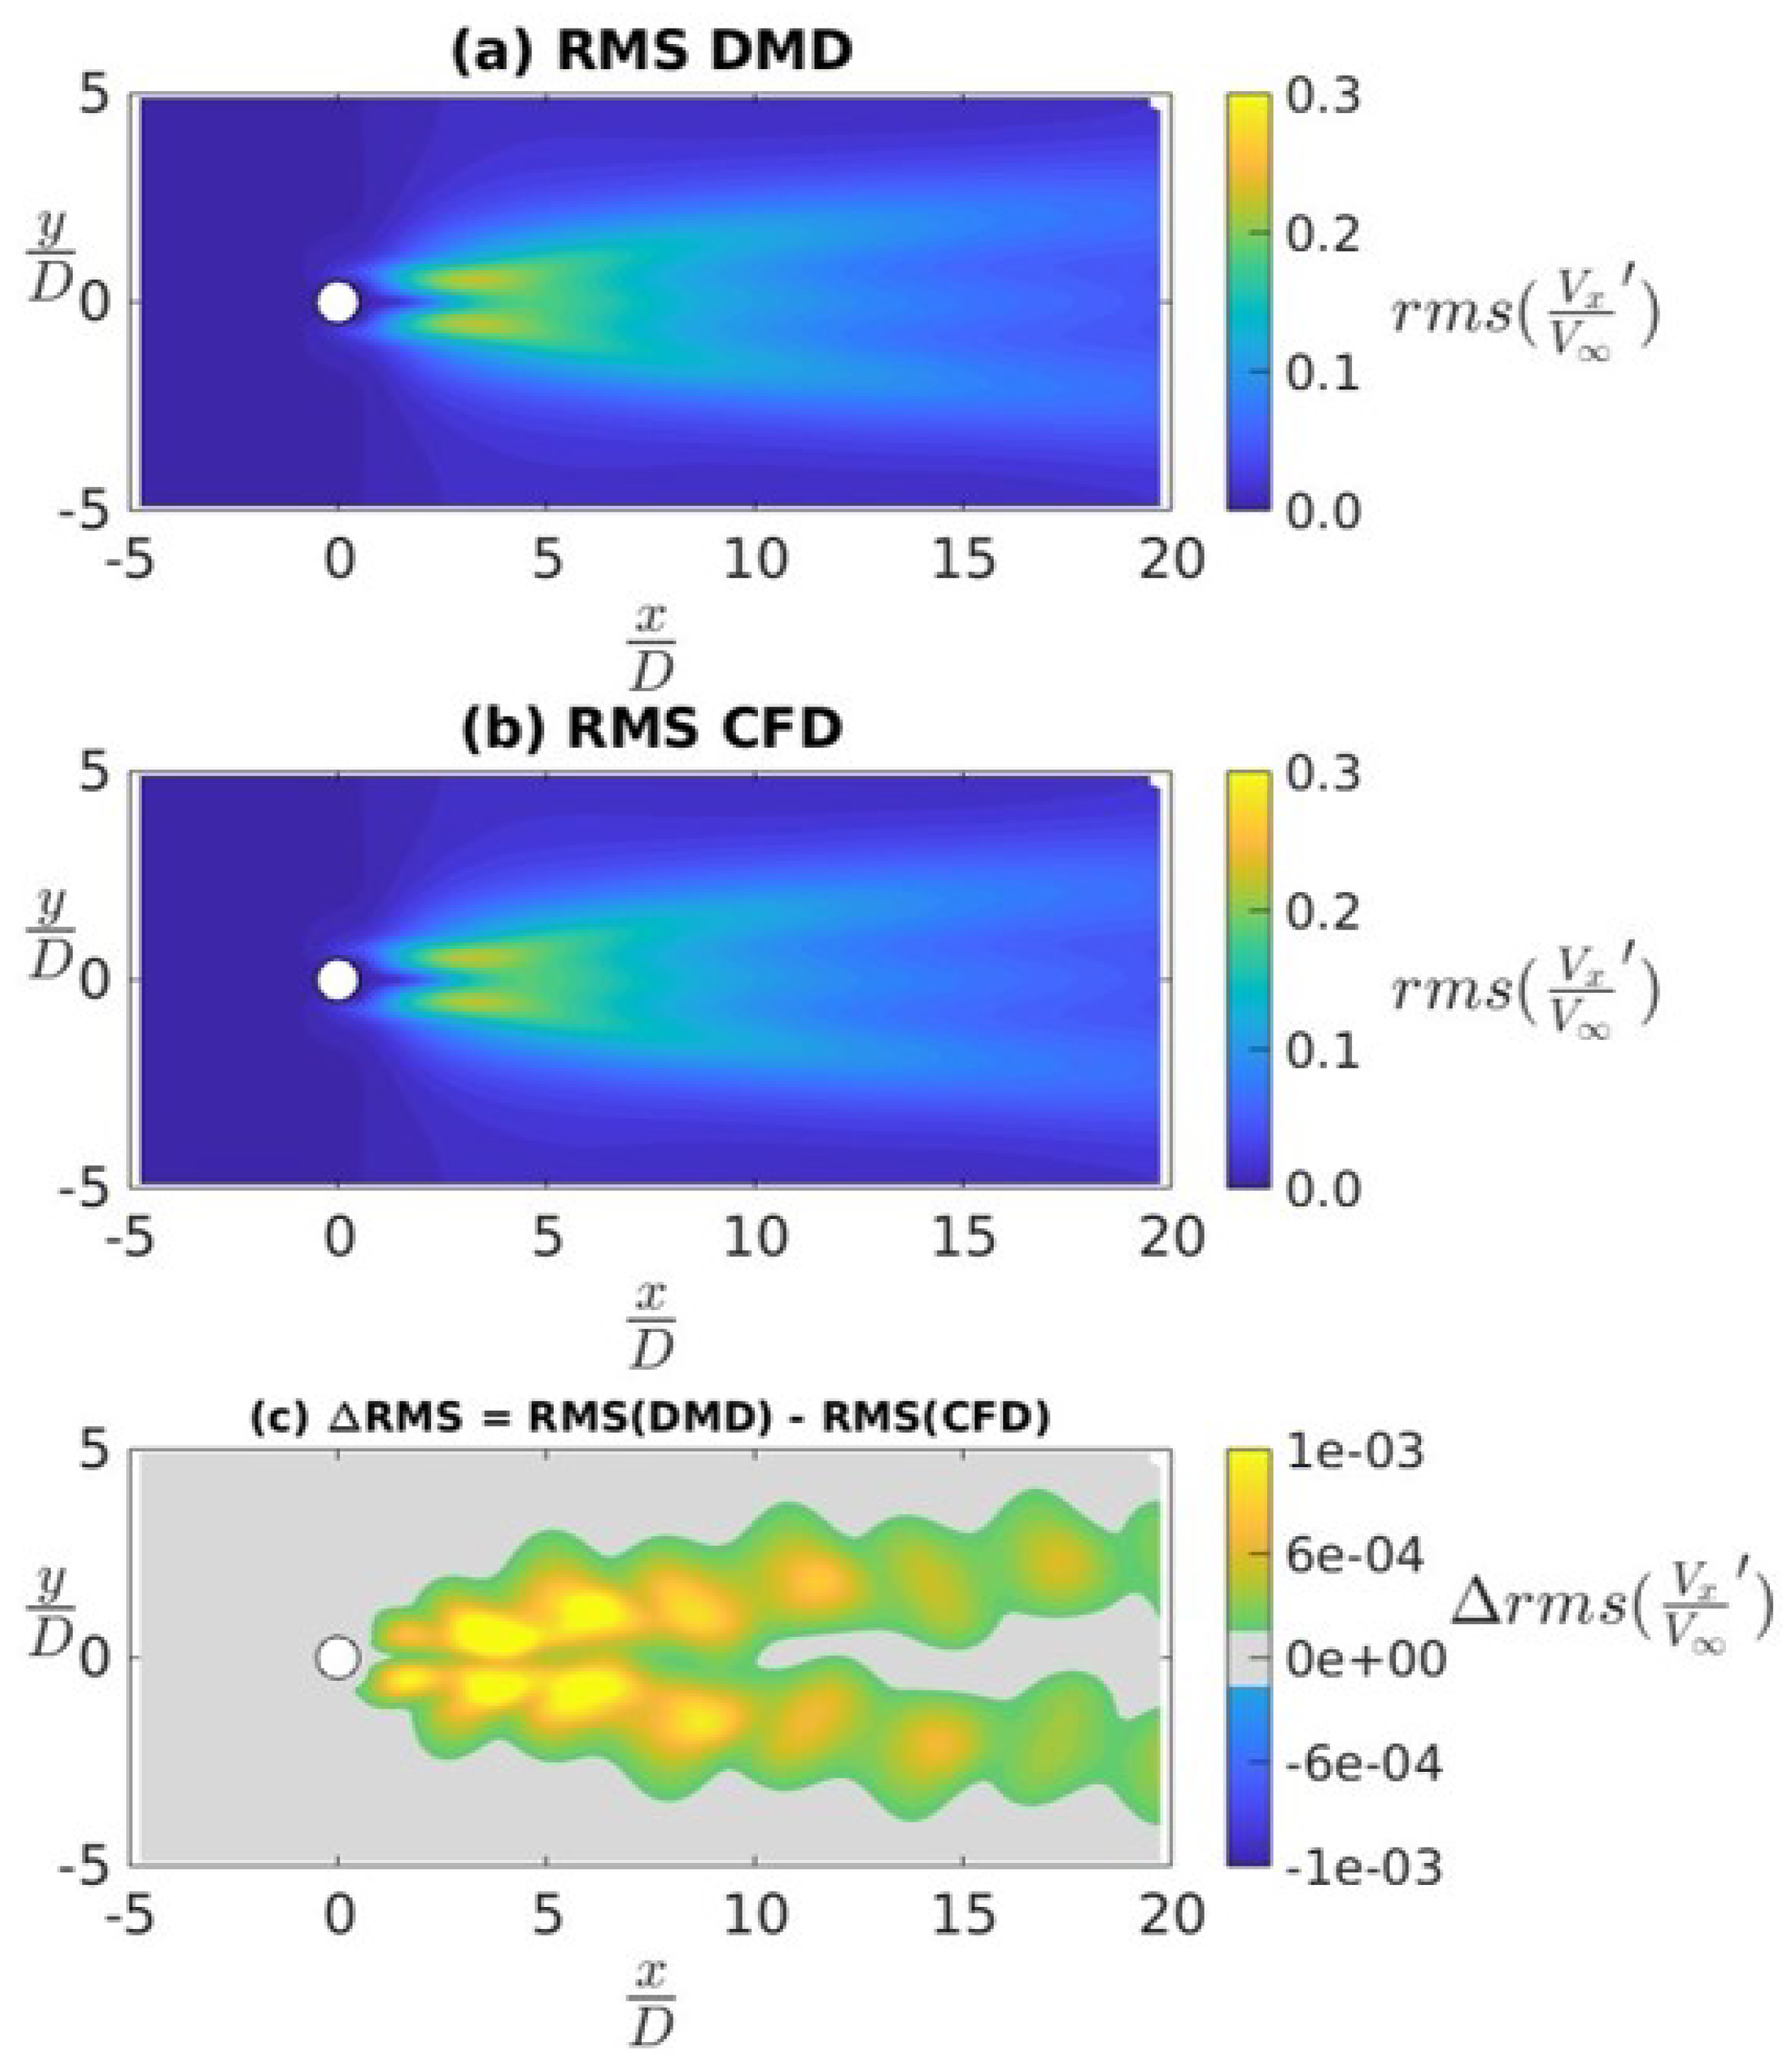
In Figure 4, we see a comparison between the RMS of fluctuating components of the normalized stream-wise velocity field as obtained from CFD and DMD. Similar to the previous results, in Figure 4a–c, we see a very negligible difference between the RMS values from the CFD simulations and DMD reconstruction of the flow fields. In Figure 4c we see that the difference is O ( 10 3 ) , which is one order larger than the difference seen for the mean component. This indicates that the DMD modes associated with the higher frequencies may have more error relative to the modes associated with the lower frequencies. This frequency-based bias in the error of the DMD was explored further using the force and moment time-series data from the Ahmed body CFD simulations.
Figure 3. Mean streamwise velocity for flow past a 2D cylinder: (a) CFD prediction, (b) DMD re-construction and (c) the difference between (b) and (a).
Preprints 72070 g003

4.3. Ahmed Body Simulations

The Ahmed body simulation of cases C2 and C3 were run with a time step of Δ t = 0.000 t * which corresponds to a physical time-step of 2.5 × 10 4 s implying a sampling frequency of 4 KHz when data was collected from every time step. As an initial exploration of the question, “How much data is required to perform an effective DMD?”, we took about 25 % of the collected data for DMD analysis. The analysis is presented below. To address one of the other fundamental questions pertaining to DMD—“What is the necessary sampling frequency for DMD of high Reynolds’s number flows?”—the sampling frequency was increased to 10 kHz for the subsequent sections.

4.3.1. Data Sampled at 4 kHz

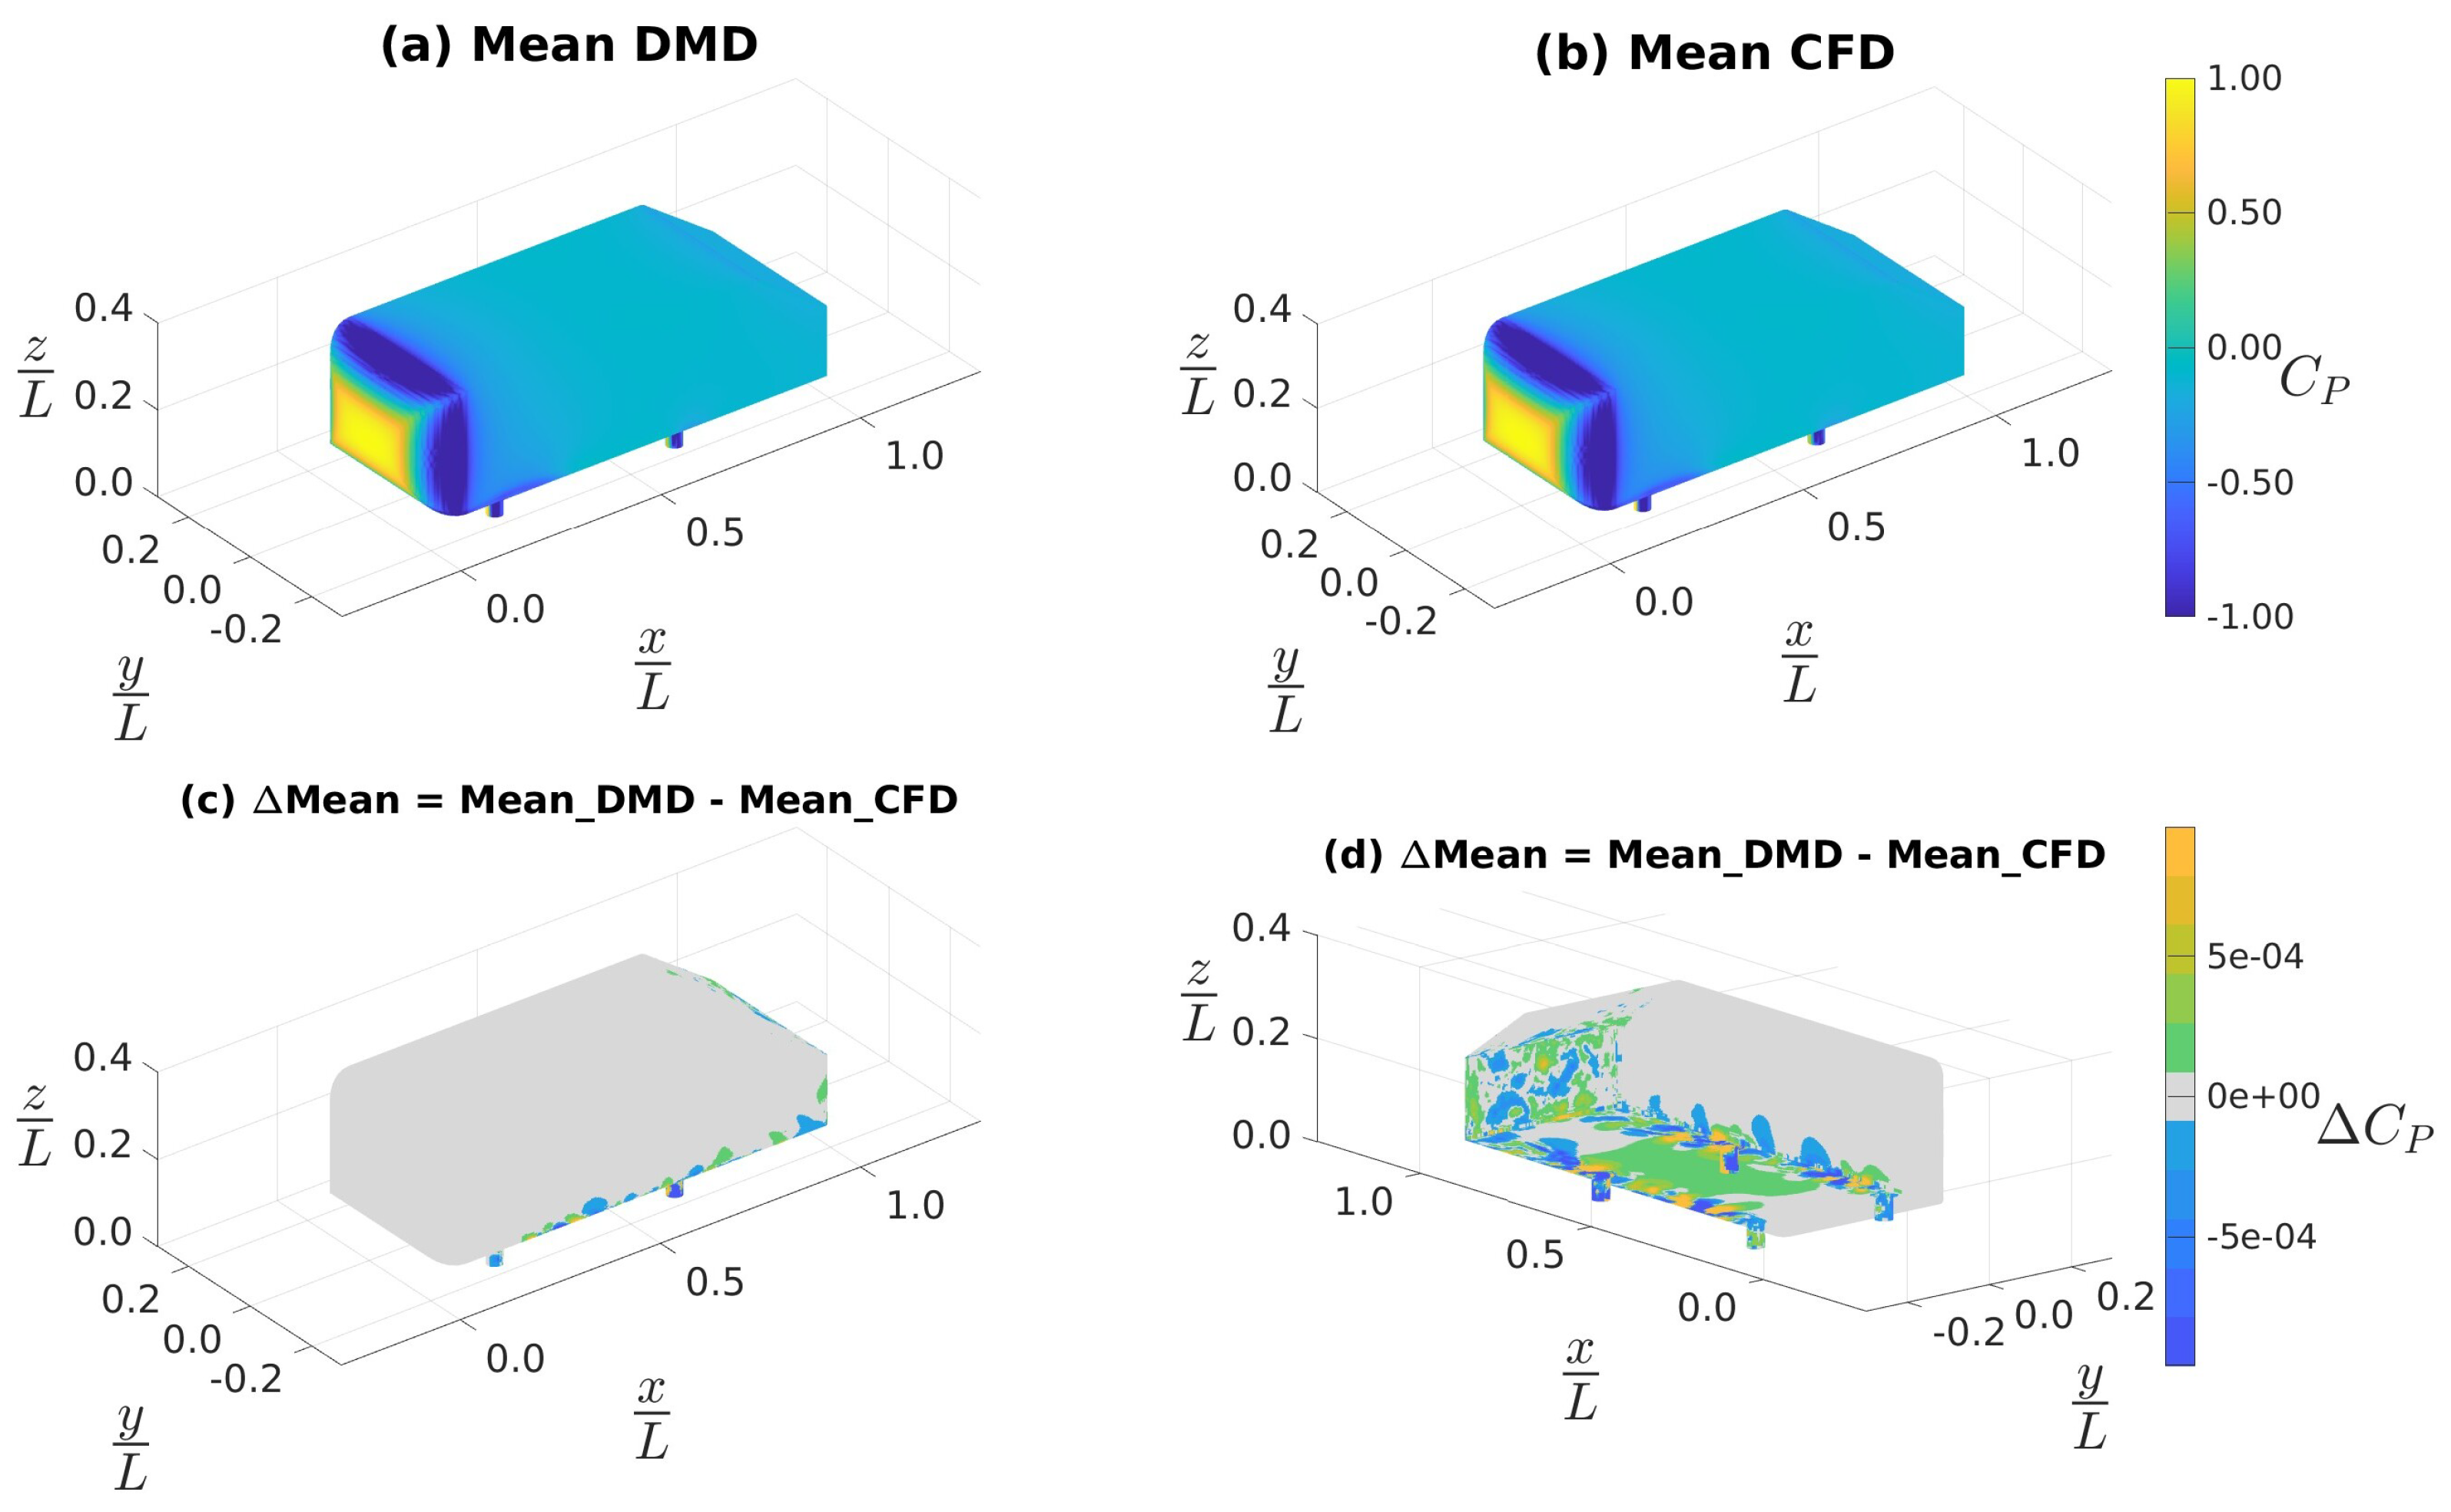
Figure 5a–d show the distribution of mean pressure coefficient C P p / ( 0.5 ρ ( U ) 2 on the surface of the Ahmed body; here p, and U represent pressure and reference free-stream velocity respectively. Note that all sub-figures, unless stated otherwise, are an iso-metric bottom-right view of the GV. The spatial extents of the coordinate system are non-dimensionalized by the length of the Ahmed body, L. Similar to Figure 3, we see that the distribution of mean C p on the GV surface is qualitatively the same in both DMD and CFD. Figure 5c,d show the discrepancy in mean C p prediction by the DMD relative to the CFD results; in Figure 5d we changed the camera viewing angle to a bottom-right orientation to accommodate visualization of the hidden portions of Figure 5c. In both Figure 5c,d, we noted that the discrepancies were O ( 10 3 ) . In Figure 5c we observed that the errors are mostly towards the rear of the GV and around the edges of the front face. From Figure 5d we observed that the discrepancies are most pronounced on the rear slant, rear fascia, and around the two downstream stilts which are regions with recirculation and where smaller vortical structures can exist, see [20,45]. We will revisit this when analyzing Figure 6.
Figure 4. RMS of the streamwise velocity fluctuations for flow past a 2D cylinder: (a) CFD prediction, (b) DMD reconstruction and (c) the difference between (b) and (a).
Preprints 72070 g004
Figure 6a,b show the RMS of surface C p fluctuations from DMD reconstruction and CFD calculations, respectively. We see a notable discrepancy in the region immediately downstream of the stilts. Figure 6c,d show the discrepancies between the DMD predicted and CFD simulated values of RMS surface C p ; note that in Figure 6d we changed the camera angle to a top-left orientation to accommodate visualization of the hidden portions of Figure 6c. In both Figure 6c,d, we noted that the discrepancies were O ( 10 2 ) which is an order of magnitude worse compared to the mean-flow DMD predictions in Figure 5. Also, in Figure 6d, we observed that the DMD result discrepancy (relative to the CFD results) was due to an underprediction of the fluctuating components along the stilts, rear edges, rear slant and rear face. These were the same regions observed in Figure 5d.
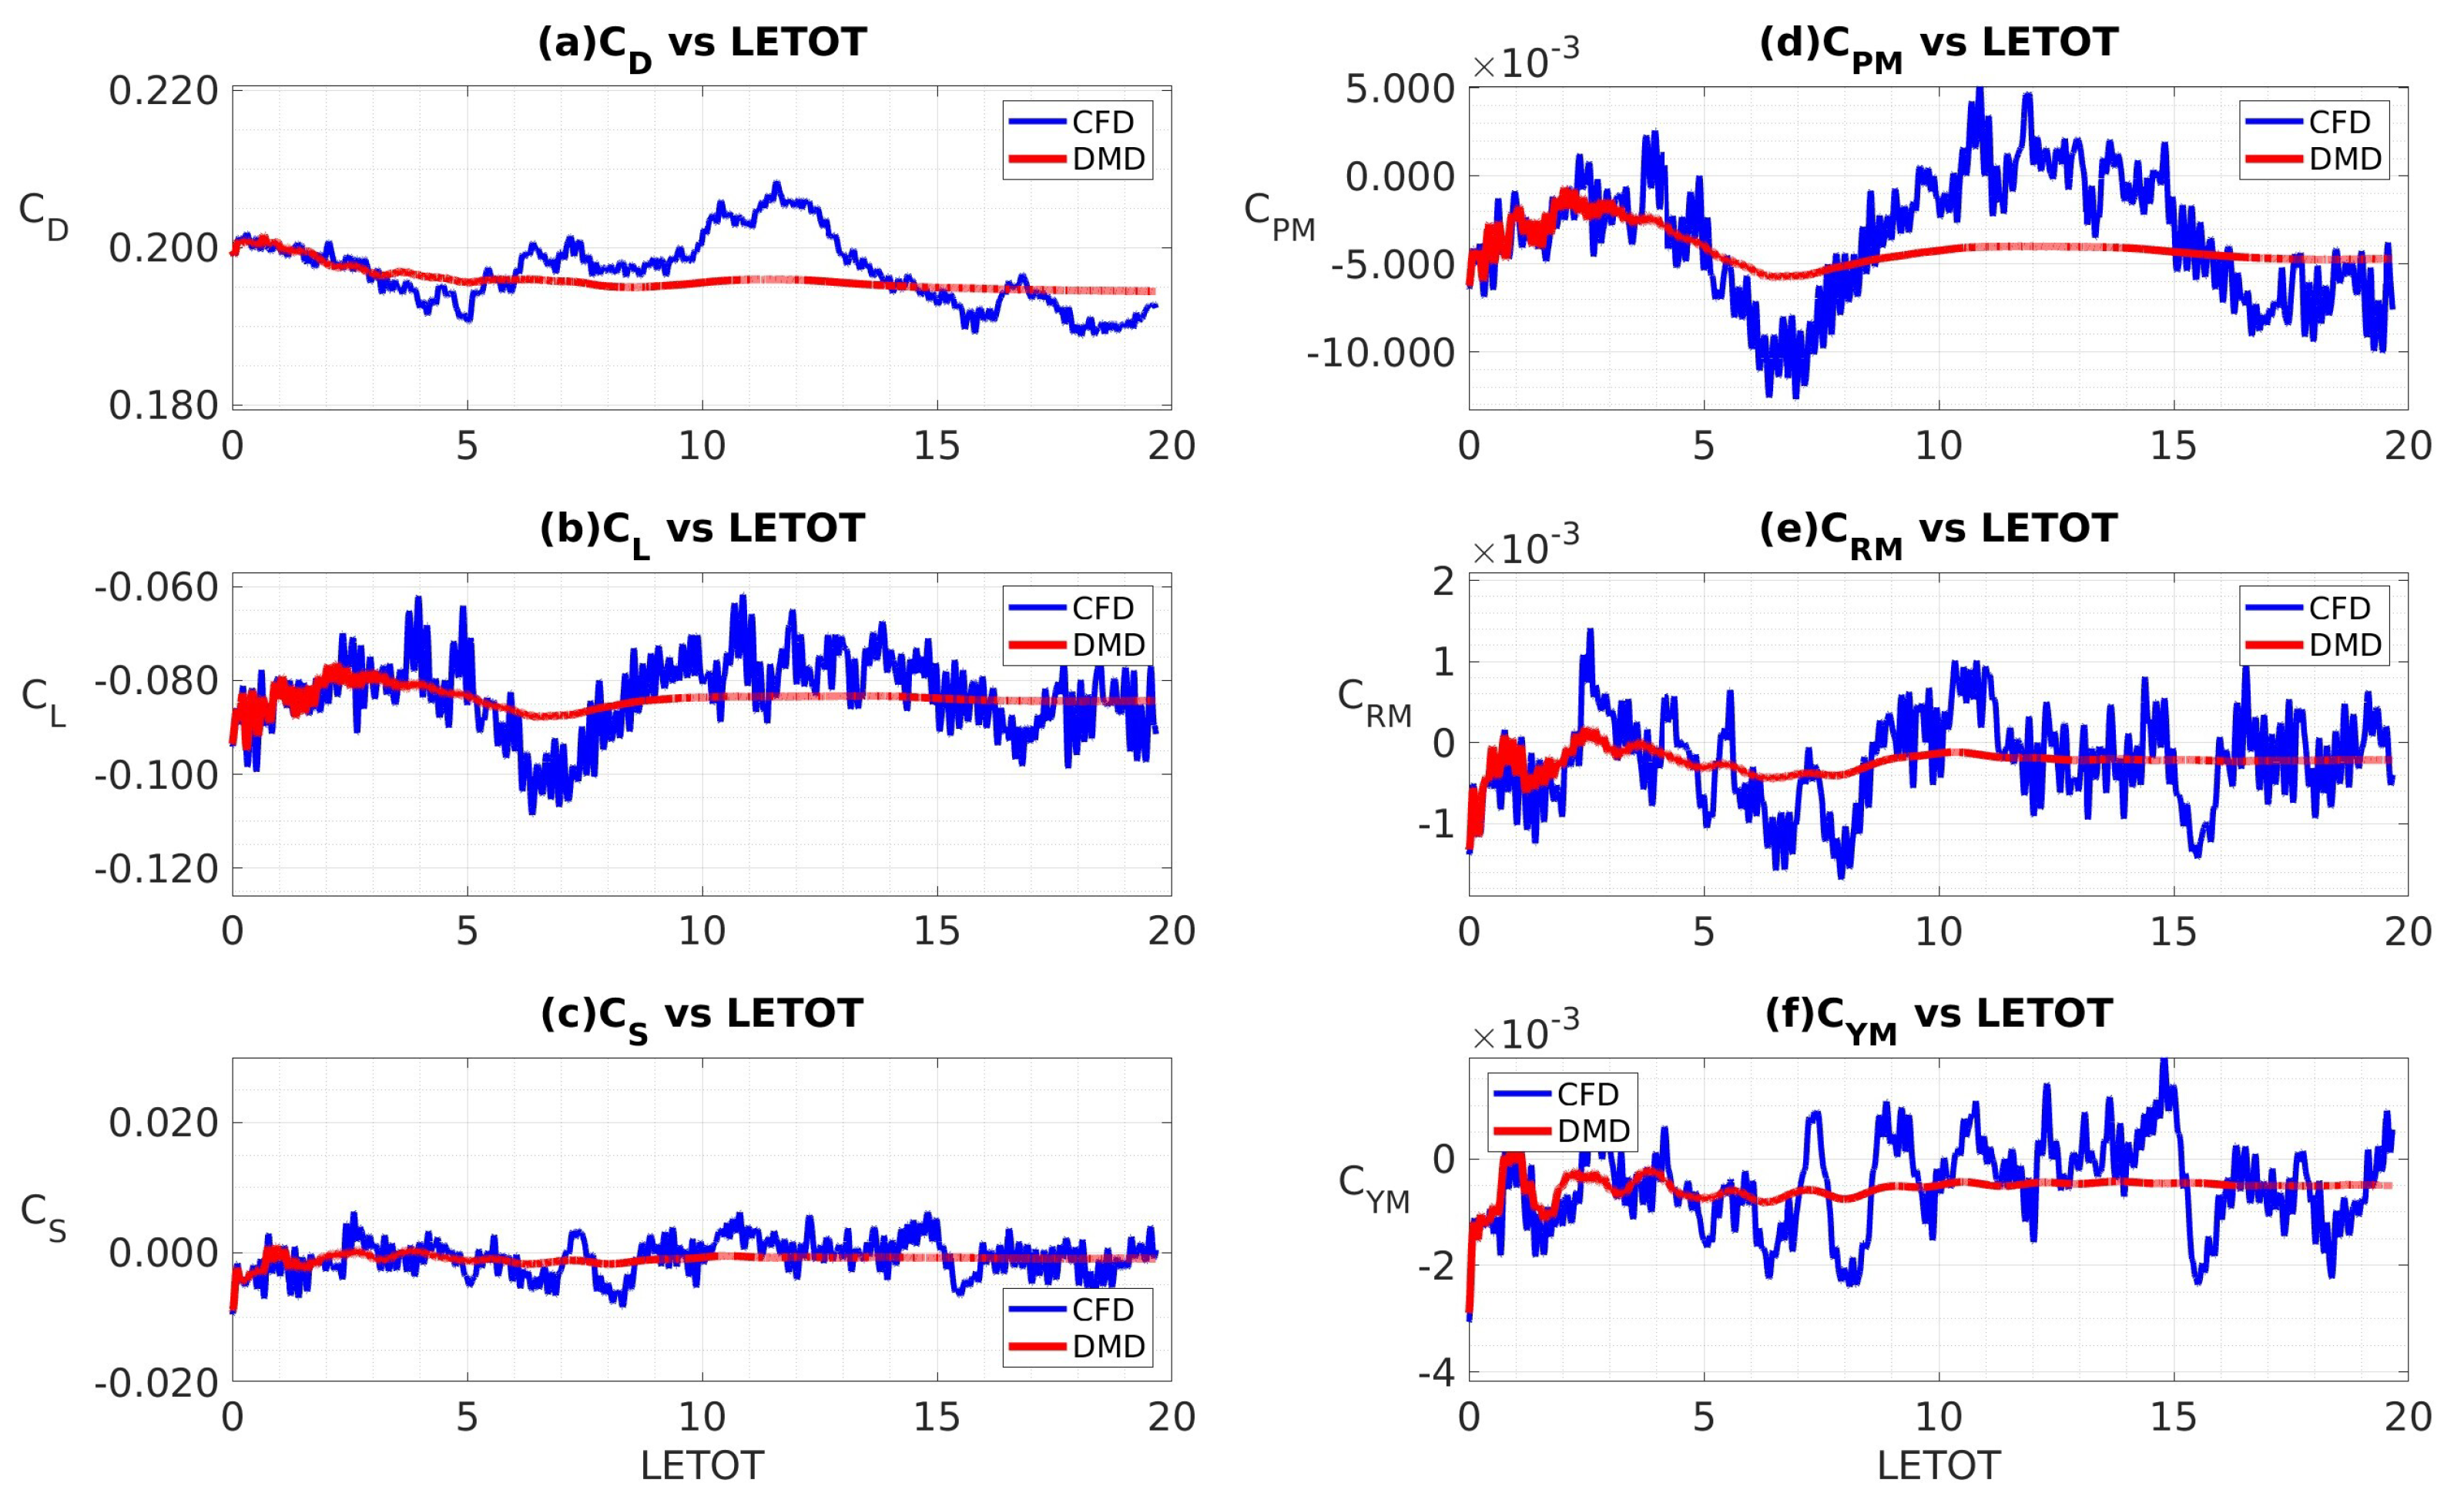
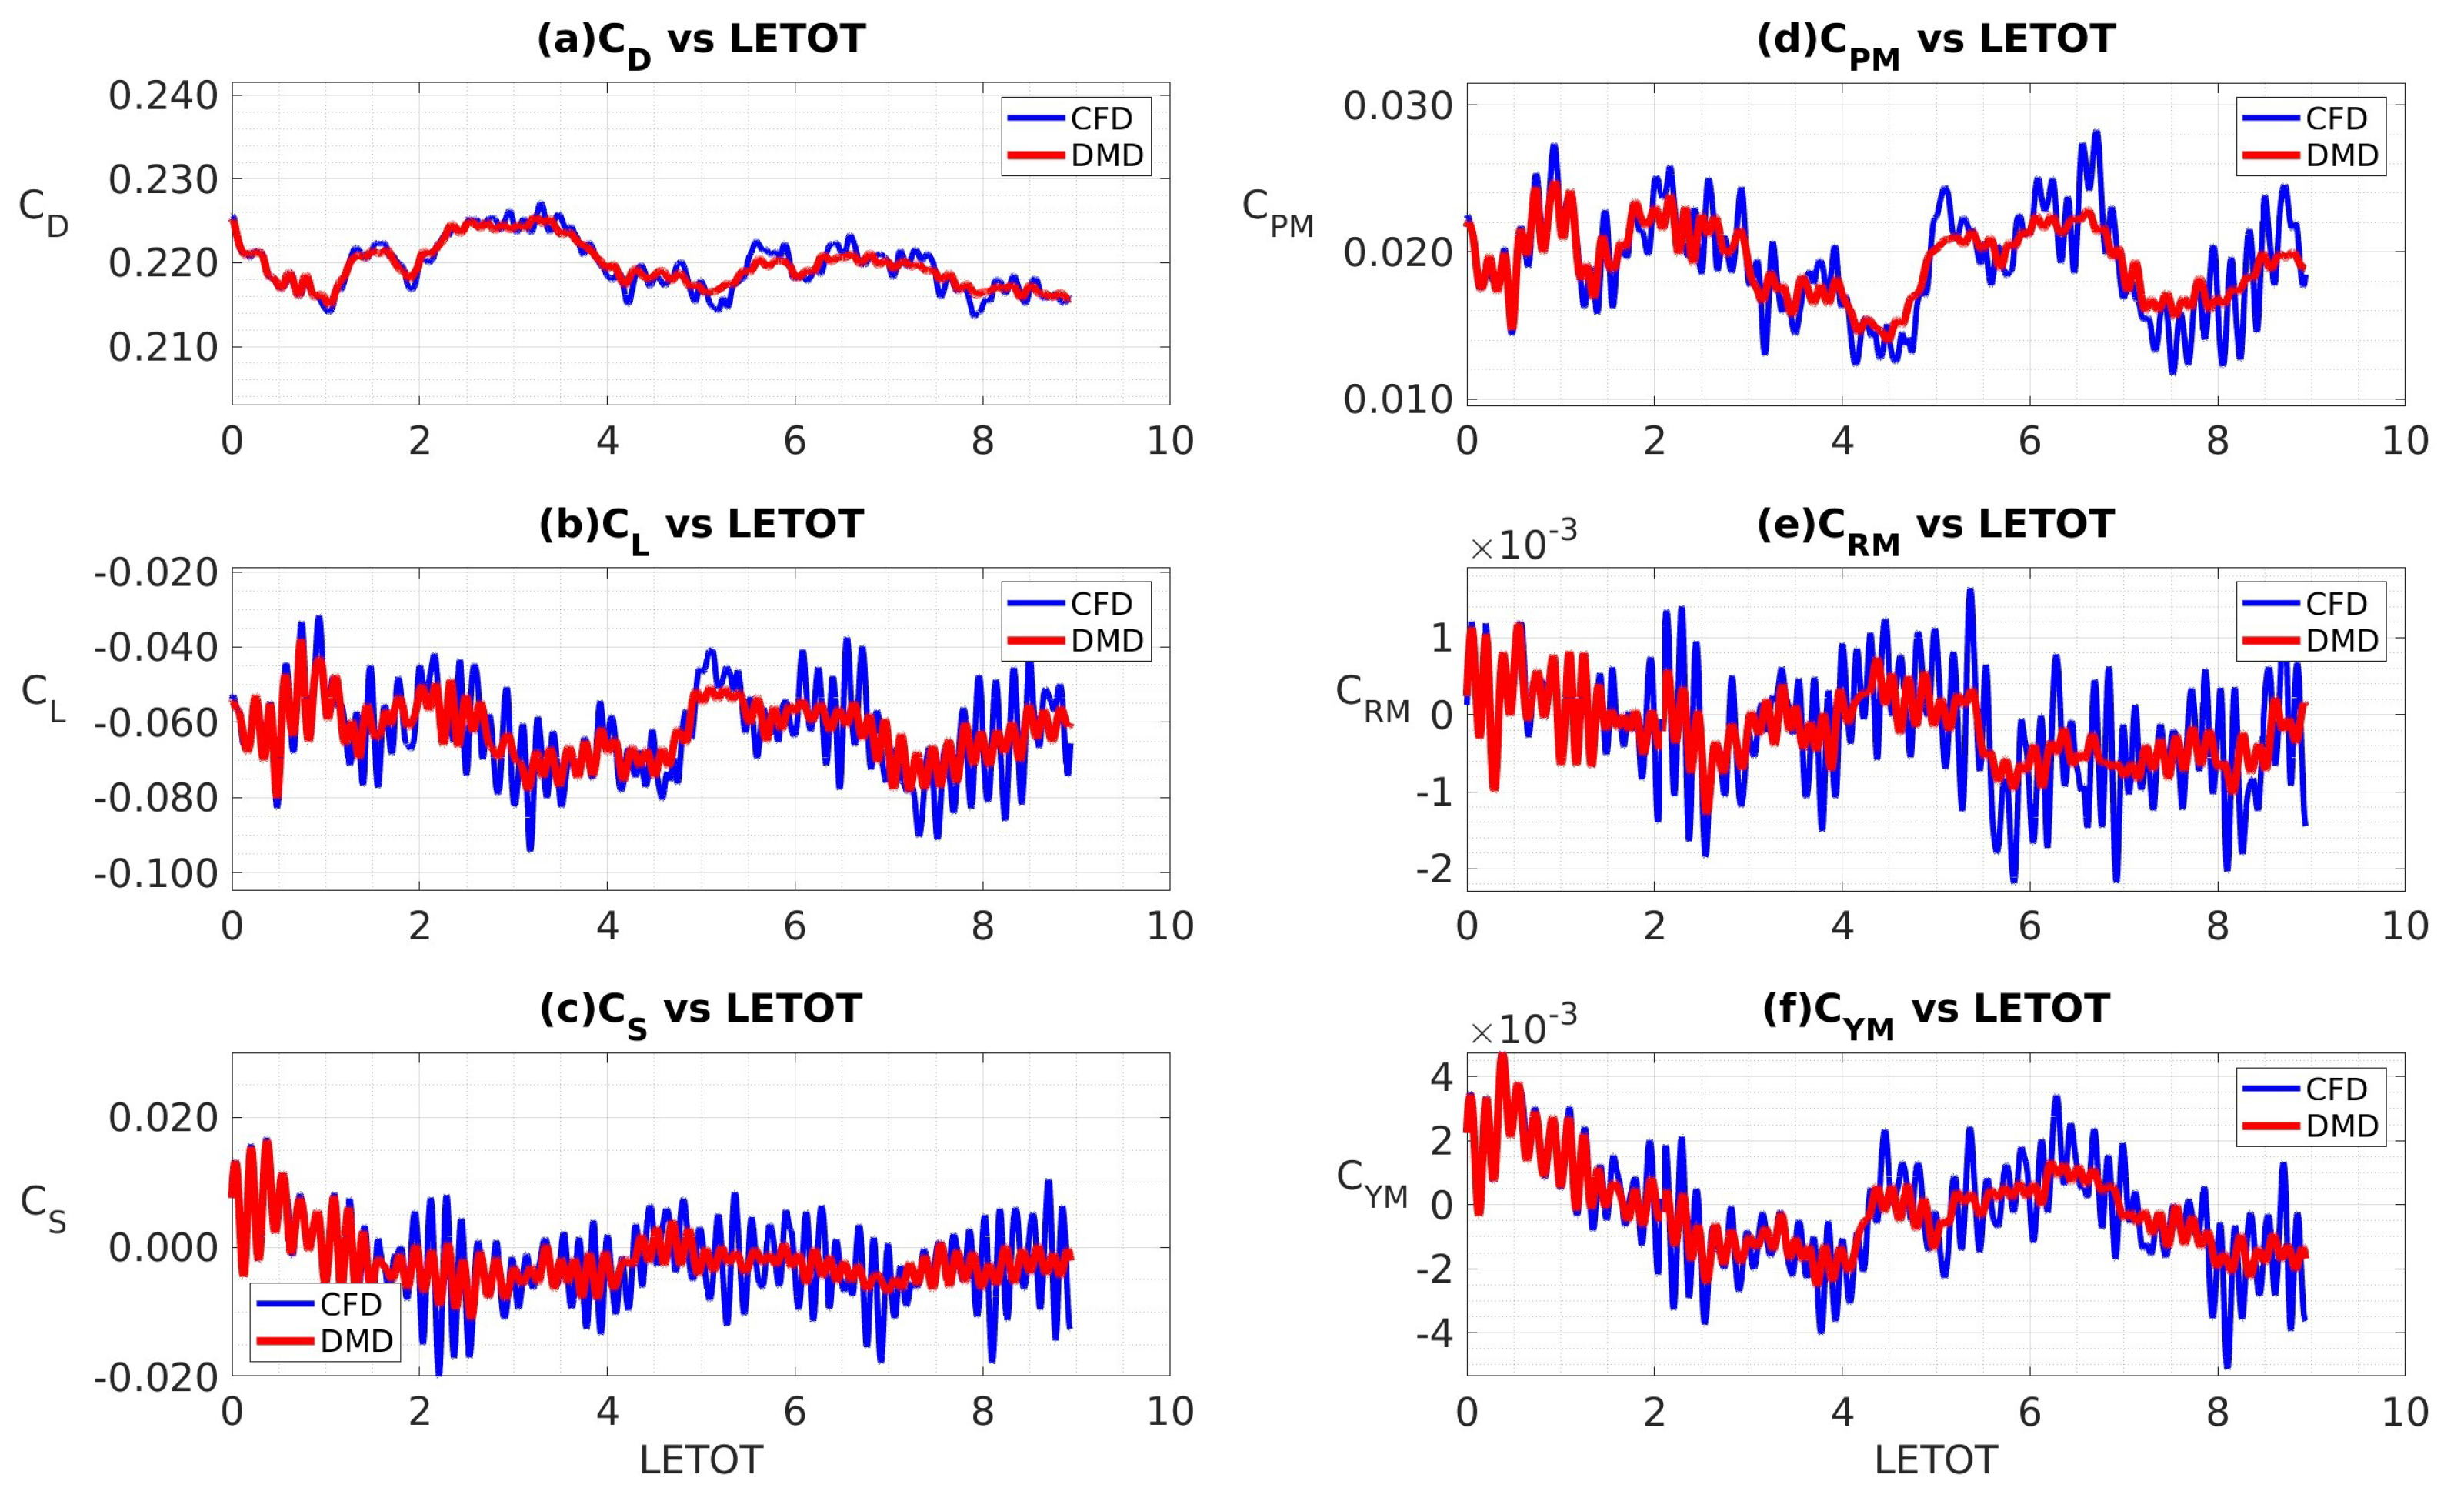
To better quantify the implications of these flow field discrepancies, we integrated the surface static pressure field to get the pressure component of force and moment coefficients from both the CFD data and the DMD reconstruction. Figure 7a–f shows the time-series data of coefficients of drag, lift, sideforce, and pitching, rolling, and yawing moments, respectively. On each subplot, the CFD simulation data-series is shown in blue and the DMD reconstruction data-series shown in red. We can see that DMD reconstruction was able to capture the mean of all the coefficients reasonably well however, the fluctuating components were seen to exist only in the first 10 % of the time-series and then dissipated rapidly thereafter. Even a low frequency motion in the CFD data was seen to be initially captured by the DMD, but that too dissipated 5 LETOTS. By investigating the time-dynamics component of Equation (5), we found nonphysical growth rates that caused the eventual dissipation of the higher frequency DMD modes. This is further corroborated by the following frequency analysis.
Figure 5. Mean of surface C p as obtained using data sampled at 4 kHz: (a) from DMD; (b) from CFD; (c) difference between (a) and (b); (d) same as (c) but bottom-right isometric view.
Preprints 72070 g005
Figure 6. RMS of surface C p fluctuations obtained using data sampled at 4 kHz: (a) from DMD; (b) from CFD; (c) difference between (a) and (b); (d) same as (c) but bottom-right isometric view.
Preprints 72070 g006
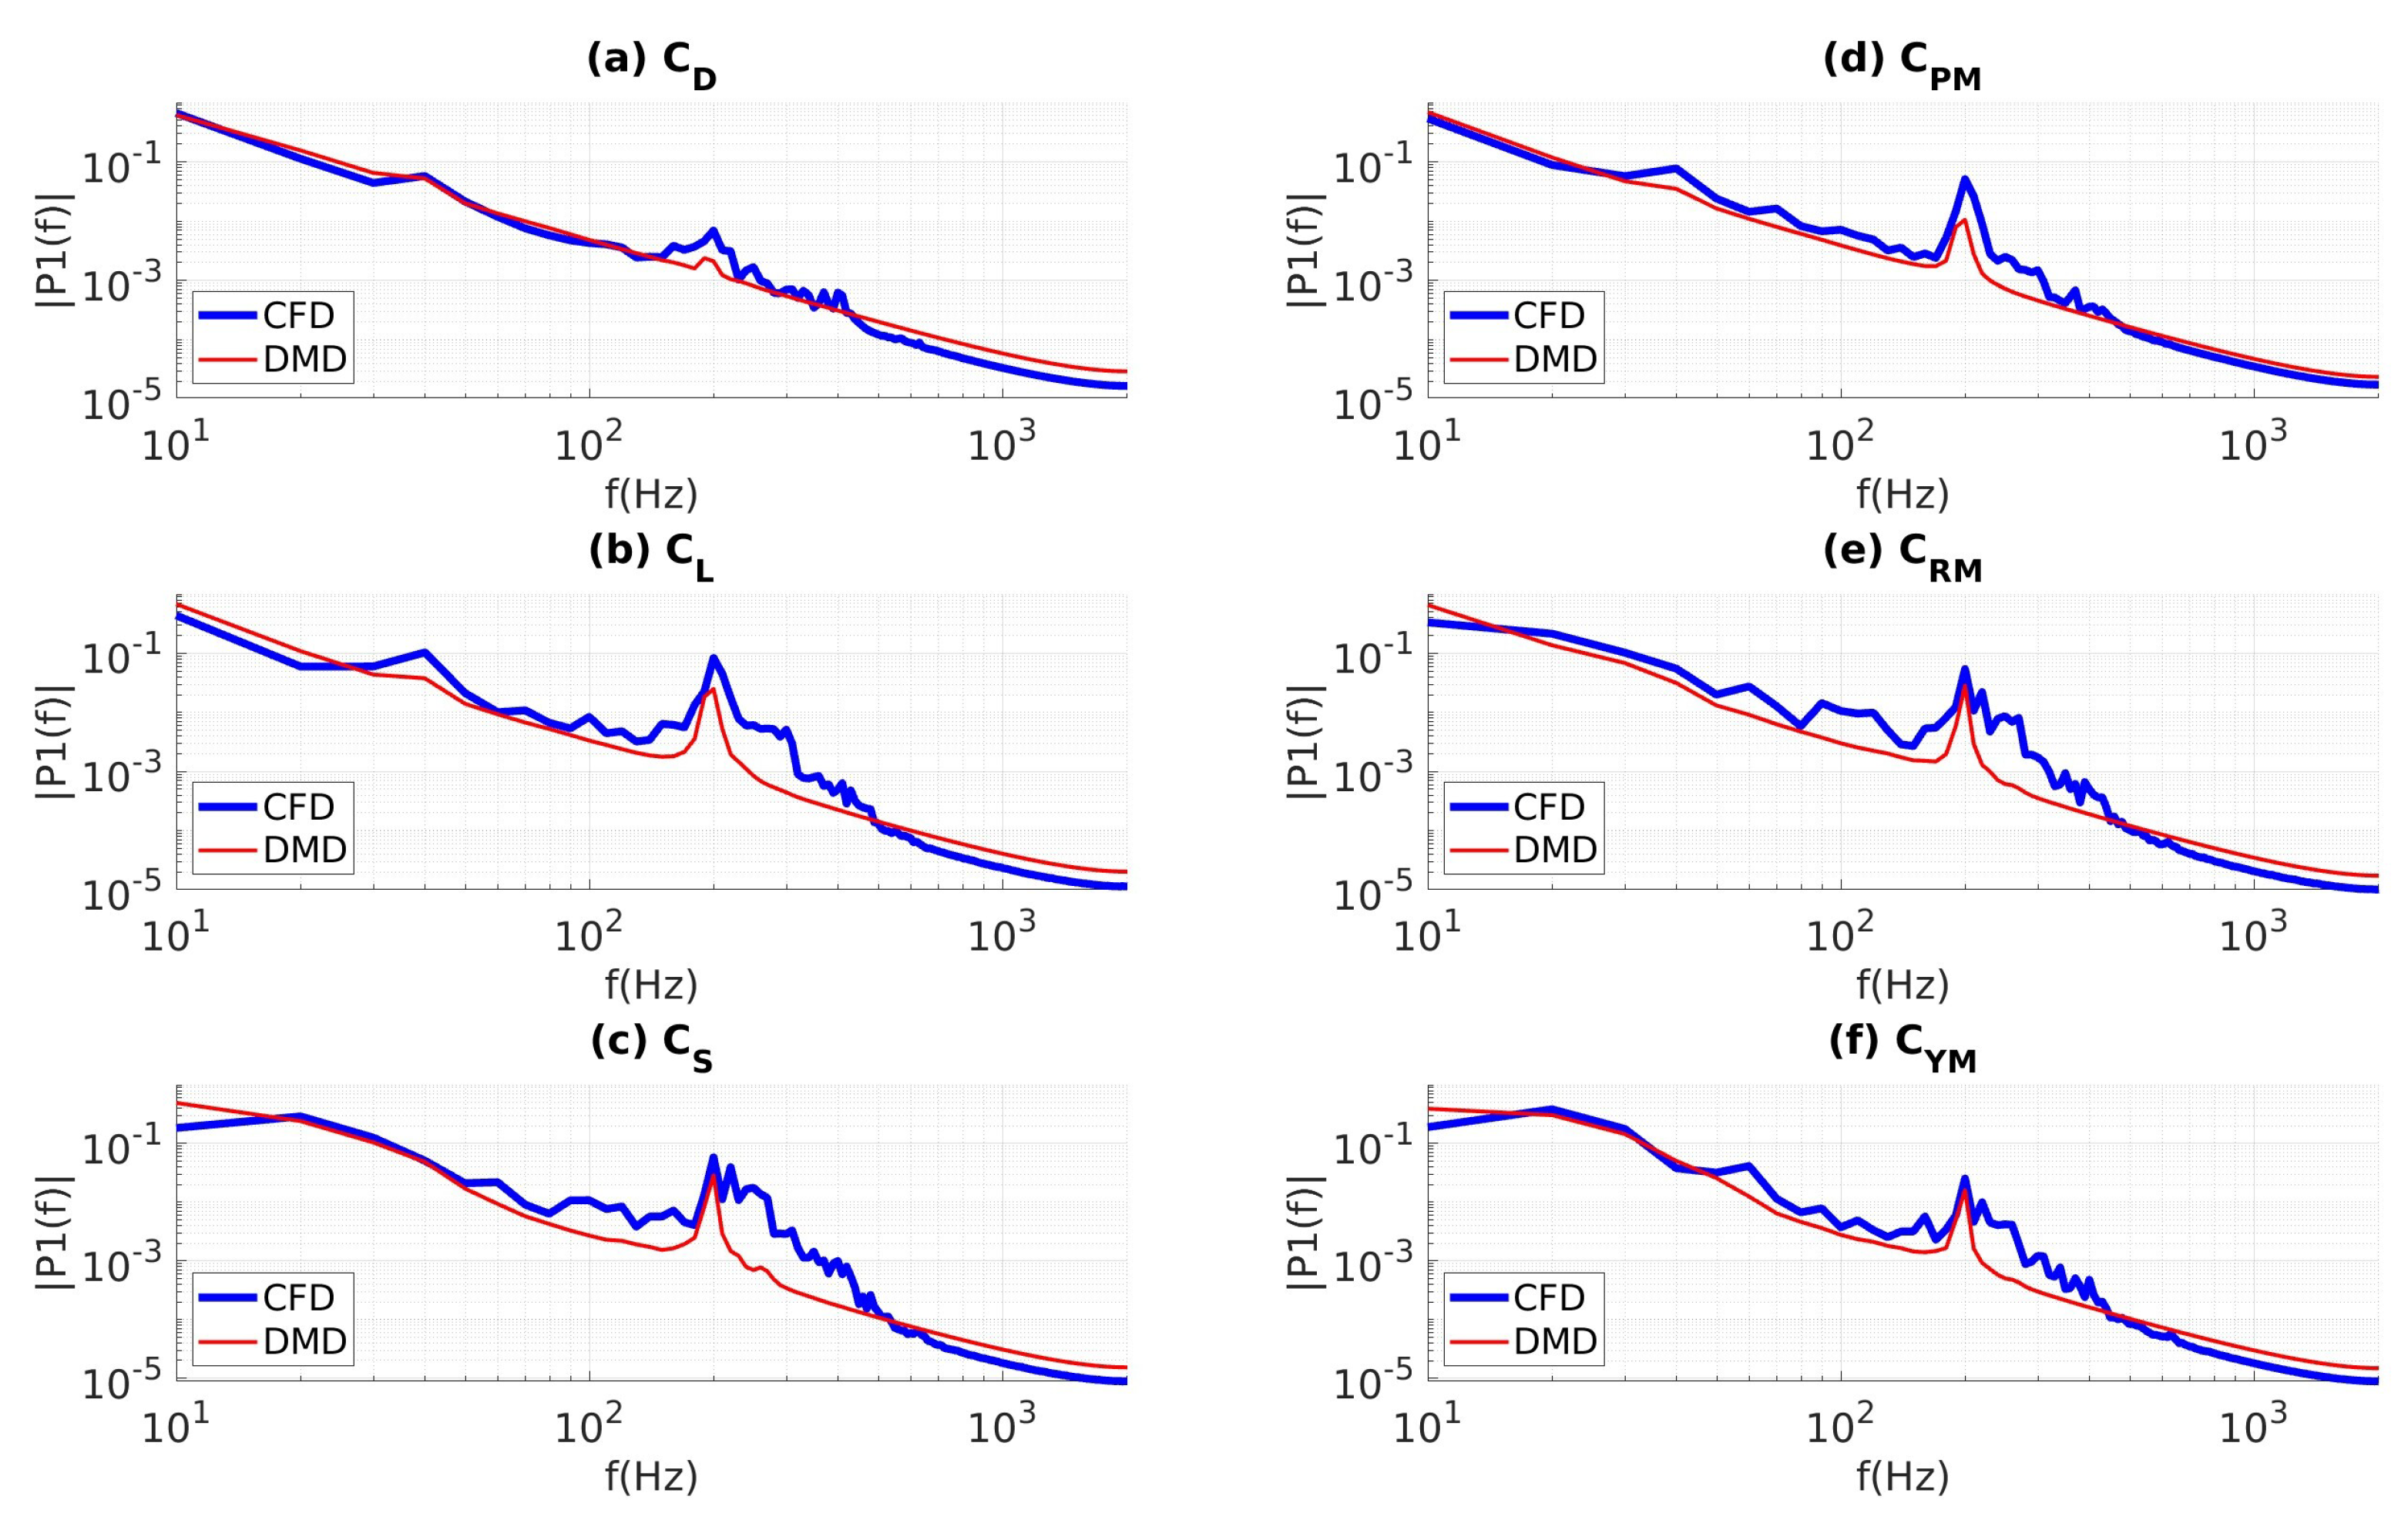
Power Spectral Density (PSD) of all the six force and moment coefficients signals are shown Figure 8a–f where the CFD data are shown in blue and the DMD reconstructions are shown in red. It can be seen that all of the DMD spectra were missing many of the characteristic frequencies of the flow. The PSD obtained form DMD calculations is underpredicted in the frequencies from 30 Hz to 300Hz, and, except for drag, many of the medium frequency motions from 100-400Hz are entirely missed for all other components of force and moment in Figure 8b–f. In Figure 8a,b,d the characteristic PSD peaks around 200Hz and, amplitude wise, is significantly underpredicted by the DMD. Thus, we inferred that the present implementation of the DMD process is suffering energy loss due to the nonphysical dampening of medium-to-high frequency motions.
Figure 7. Forces and moments obtained from CFD calculations and DMD reconstructions, sampled at 4kHz; (a) drag, (b) lift, (c) sideforce, (d) pitching moment, (e) rolling moment, and (f) yawing moment.
Preprints 72070 g007
Figure 8. PSD of forces and moments obtained from CFD calculations and DMD reconstructions, sampled at 4kHz; (a) drag, (b) lift, (c) sideforce, (d) pitching moment, (e) rolling moment, and (f) yawing moment.
Preprints 72070 g008

4.3.2. Data Sampled at 10 kHz

To address one of the fundamental questions pertaining to DMD—“What is the necessary sampling frequency for DMD of high Reynolds’s number flows?” and to help resolve the issues highlighted in Figure 7 and Figure 8, we increased our sampling frequency to 10 kHz as used by [1] for a much higher Reynolds number flow. This necessitated a reduction in our CFD time step size by 60 % to Δ t = 4 × 10 5 t * , a re-run of the CFD simulation, and fresh data collection for DMD at the 10 kHz sampling frequency. To facilitate a consistent comparison of DMD performance between the two CFD runs, the size of the data matrix of Equation (1) was kept constant. Thus the subsequent plots were generated using about 8 LETOTs of converged CFD data which represents about 0.2 s of physical time and a lowest resolved frequency of 4.8 Hz.
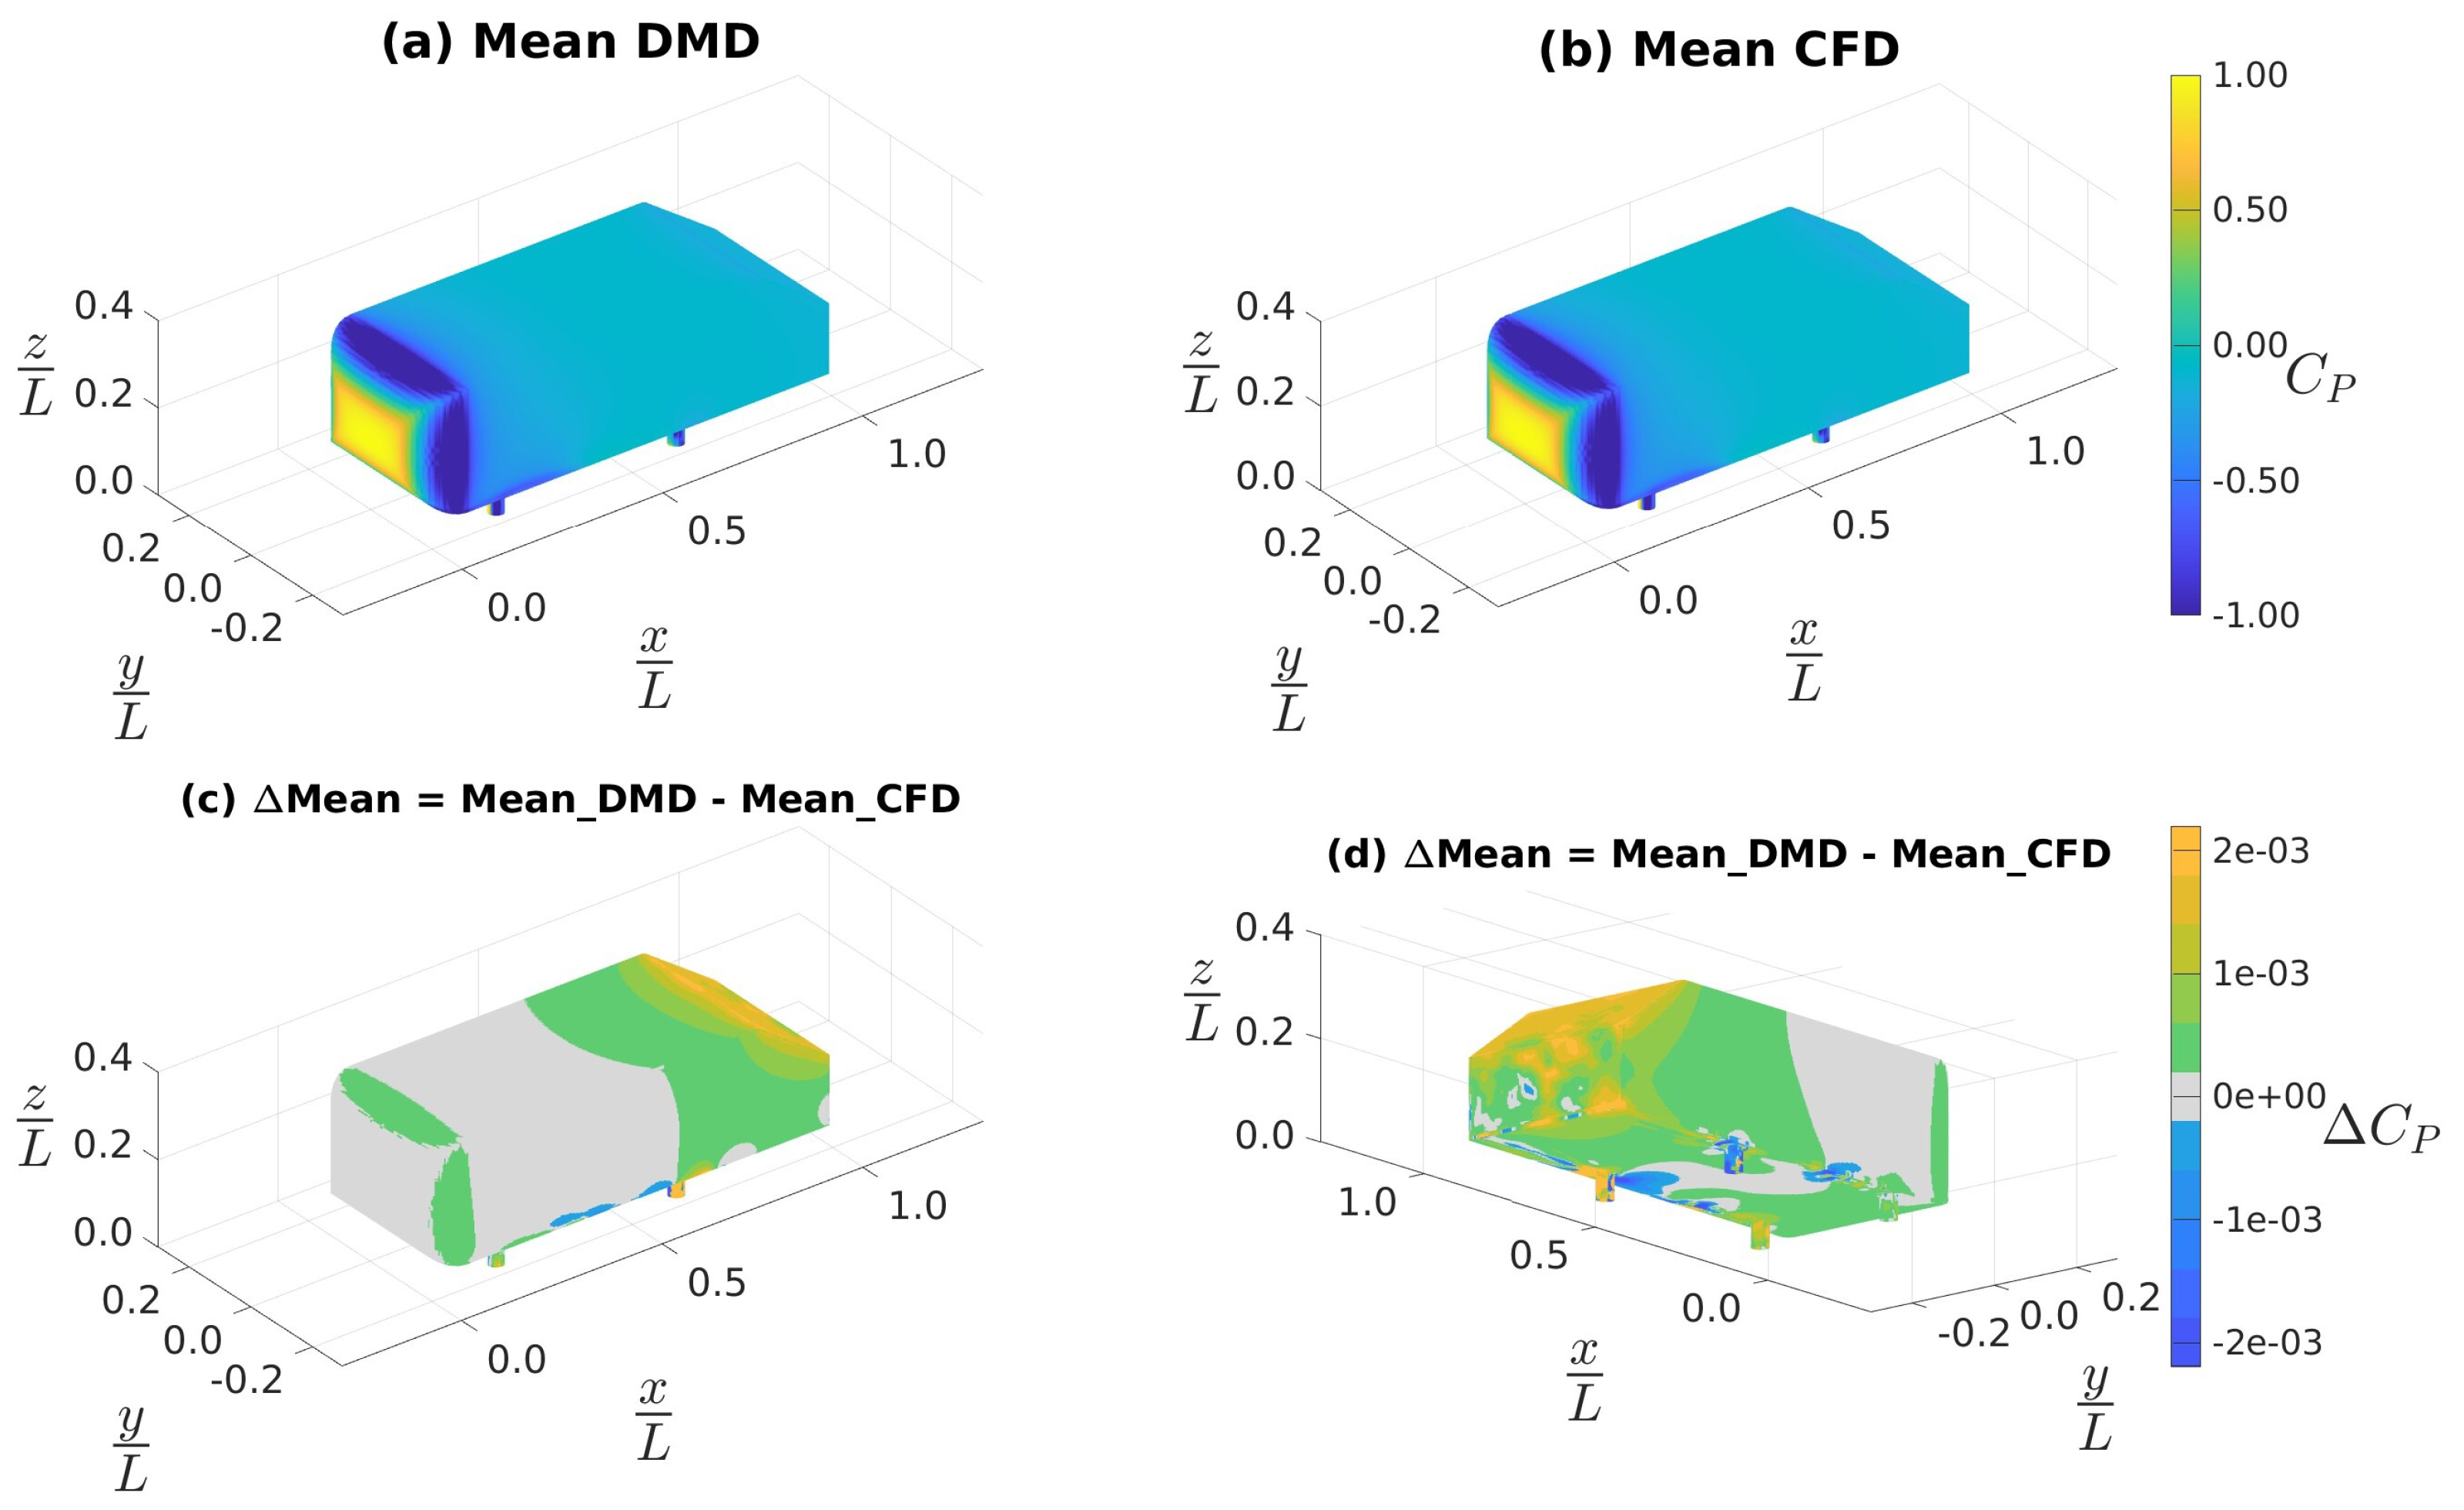
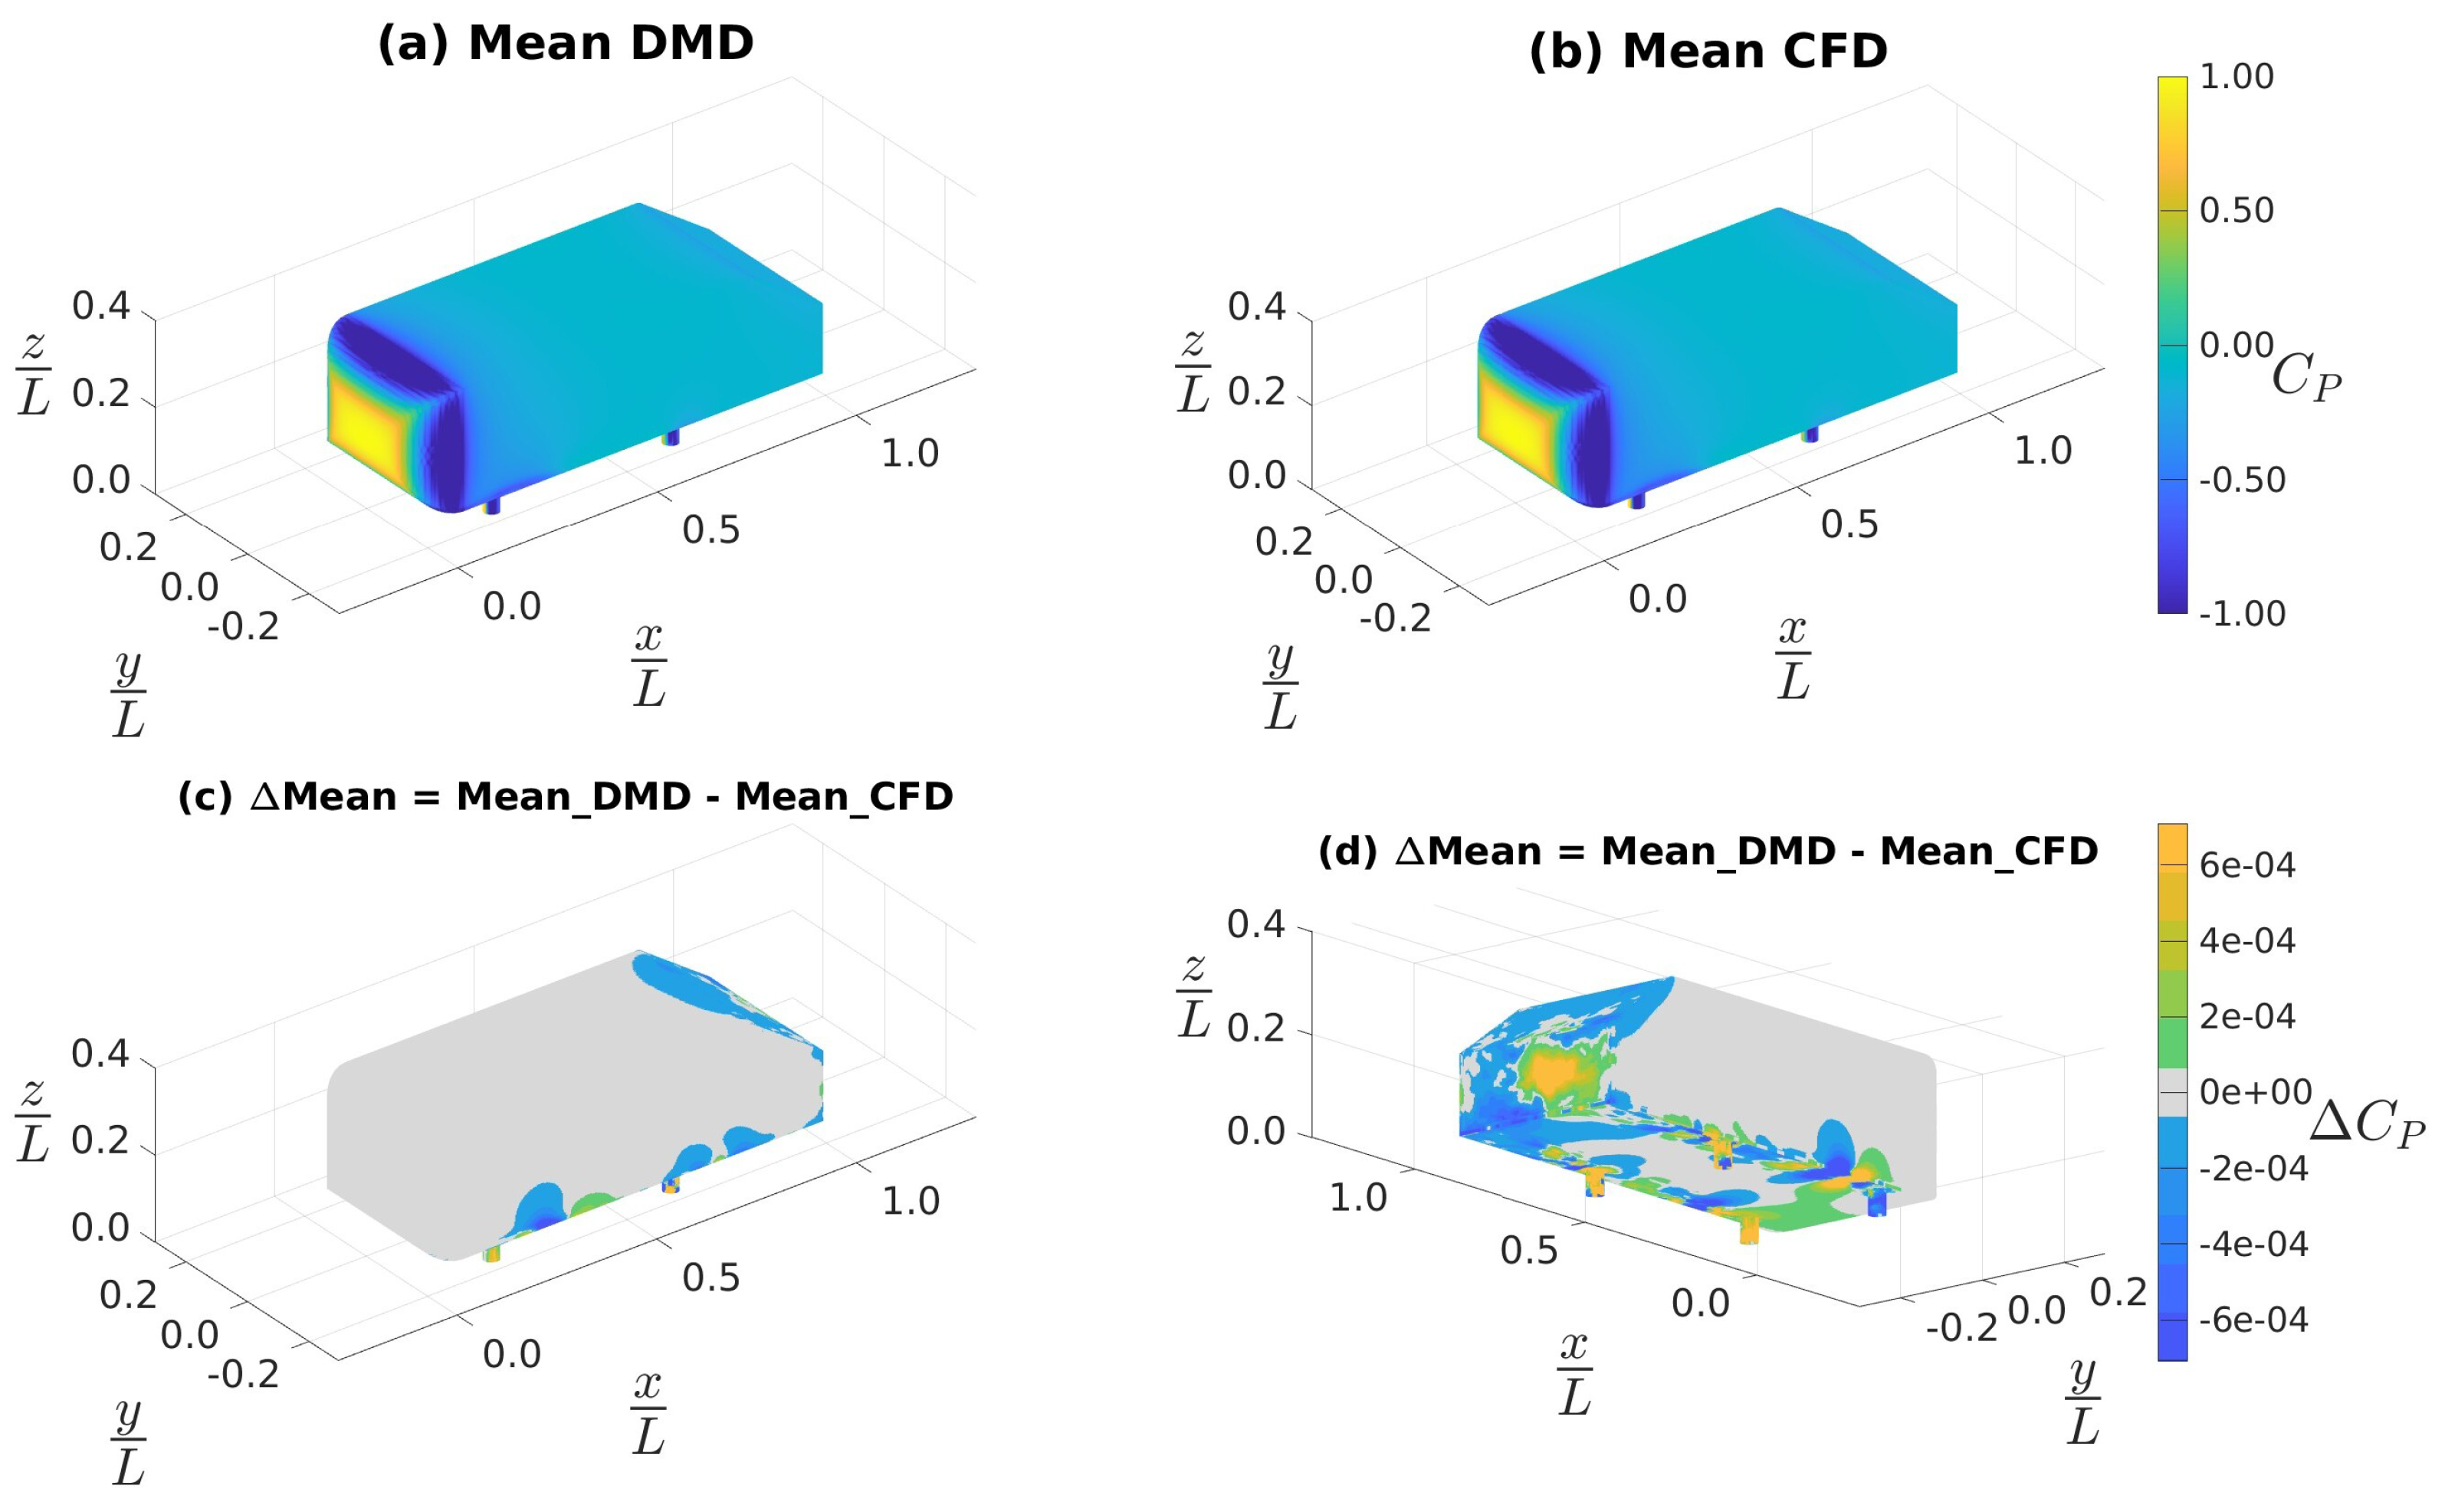
In Figure 9, we see the distribution of mean C p on the surface of the Ahmed body. Figure 9a,b show the mean C p as predicted by DMD and CFD respectively. We see that the distribution of mean C p on the GV surface is qualitatively the same in both DMD and CFD. Figure 9c,d show the discrepancies in mean C p prediction of DMD relative to CFD; in Figure 9d we changed the camera angle to a bottom-right orientation to orientation to help a better visualization of the hidden portions of Figure 9c. In both Figure 9c,d, we noted that the discrepancies were O ( 10 4 ) , which is an order of magnitude less than that associated with Figure 5c,d. In Figure 9c we observed that the errors are nearly absent from the upper surface, which shows a marked improvement along the edges of the front face, particularly relative to Figure 5c. From Figure 9d we observed that the discrepancies were still the most pronounced on the rear slant, rear fascia, and around the two downstream stilts.
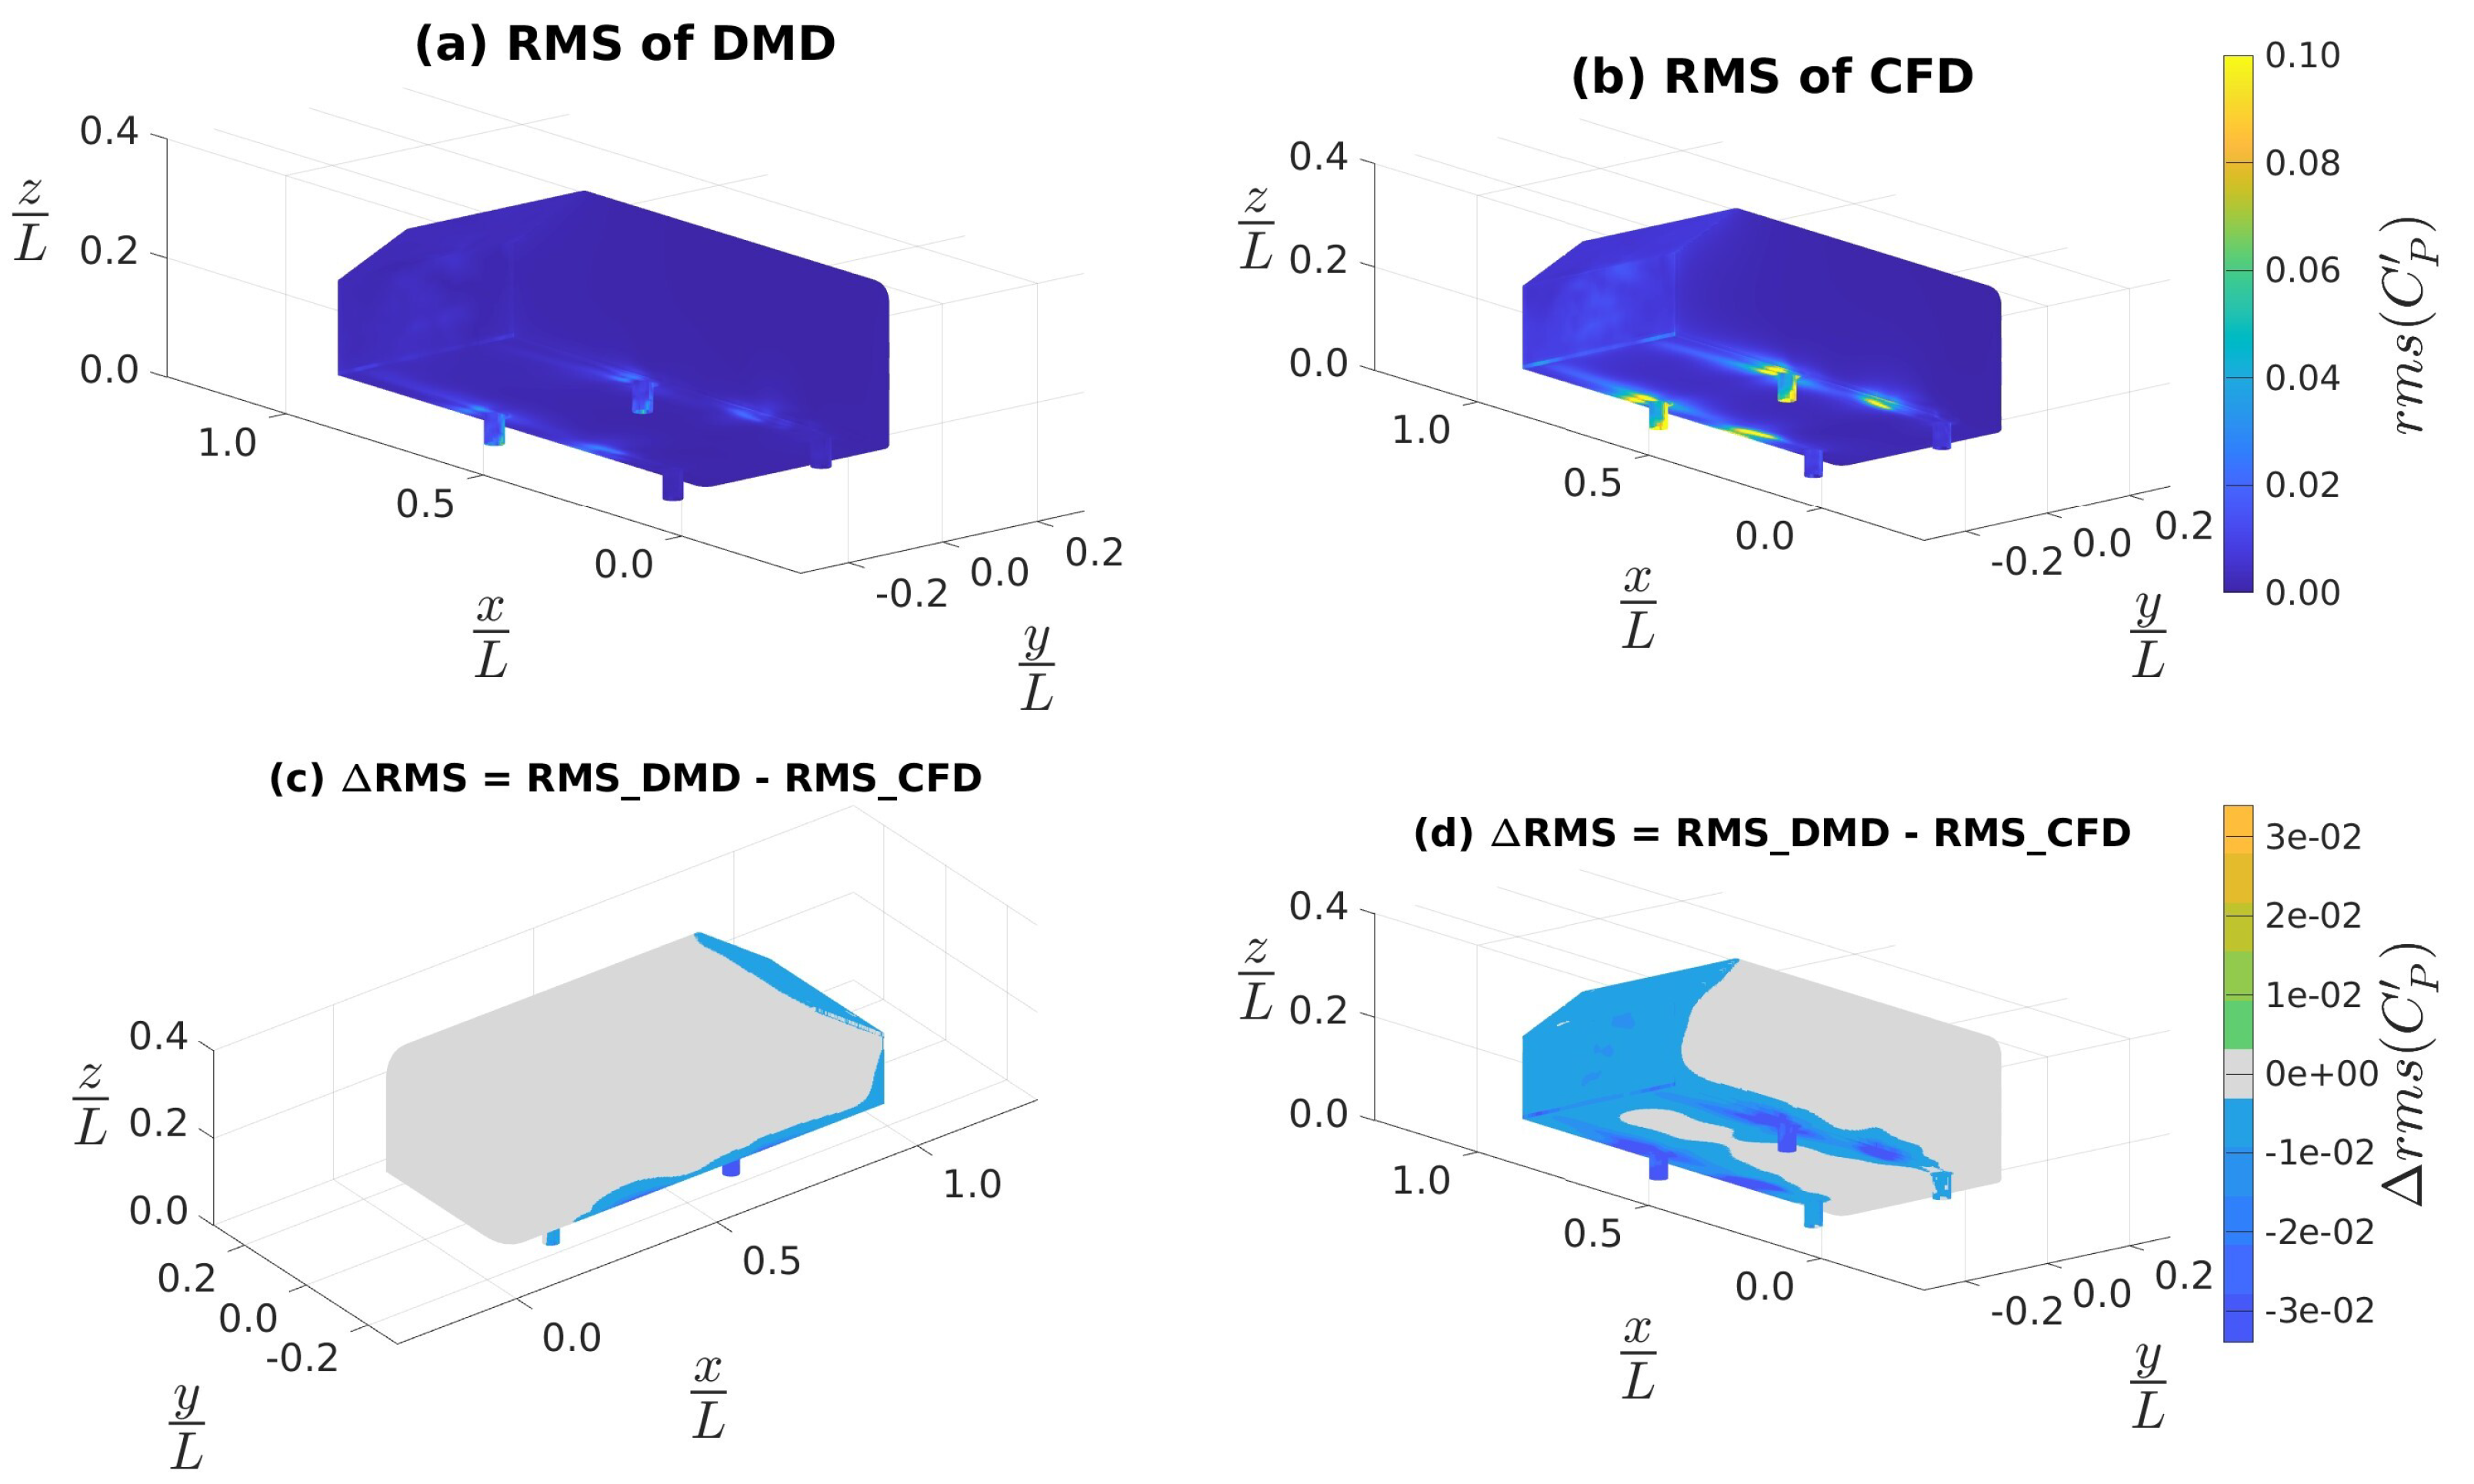
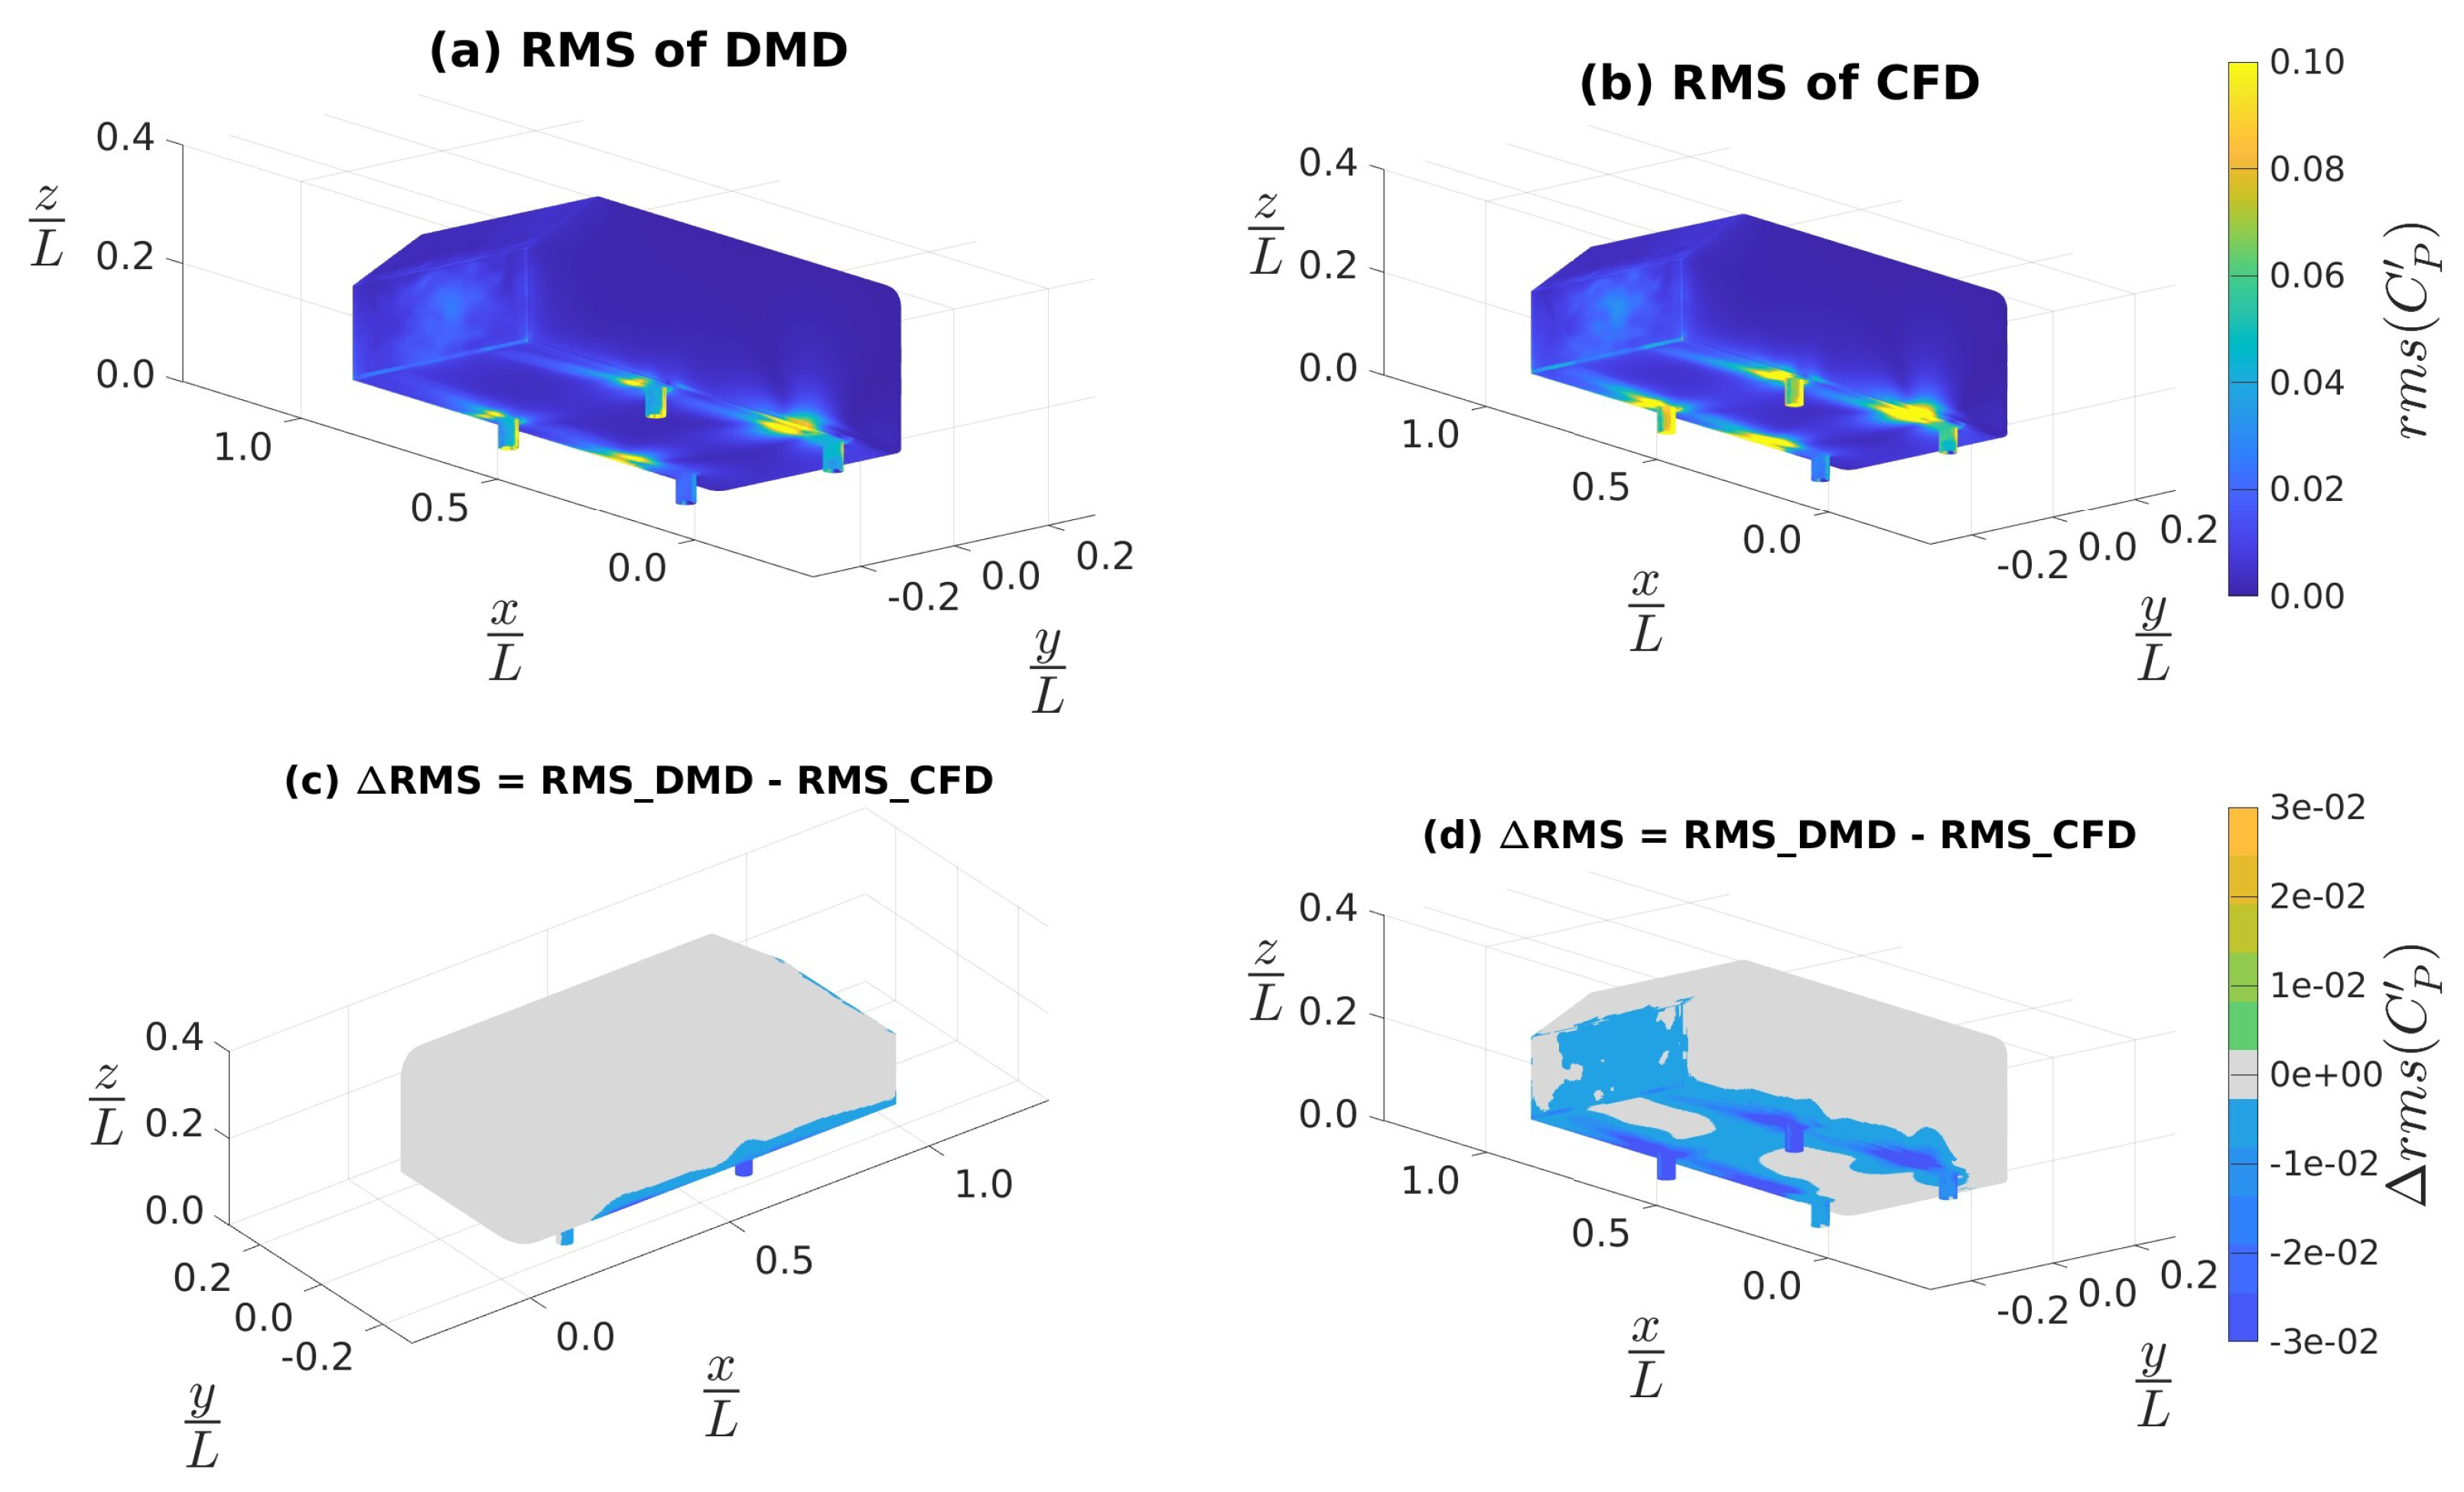
In Figure 10 we observed the distribution of RMS of C p fluctuations on the surface of the Ahmed body. Figure 10a,b show the RMS of C p as predicted by DMD and CFD respectively. In comparison to Figure 6a,b, we see a significant improvement in the region immediately downstream of the stilts. Figure 10c,d show the difference in RMS C p prediction of DMD relative to CFD; like before, in Figure 10d we changed the camera angle to a top-left orientation to help visualization of the hidden portions of Figure 10c. In both Figure 10c,d, we noted that the discrepancies were O ( 10 2 ) , which was similar to the order of magnitude seen in Figure 6c,d. In Figure 10d we observed that the discrepancies in DMD are due to underpredictions of the fluctuating components along the stilts, rear edges, rear slant and rear face. These were the same regions highlighted in Figure 6d. Thus, Figure 9 and Figure 10 indicate that the low-to-medium frequency response of DMD has improved, but that the high frequencies may yet remain unresolved.
We again integrated the surface static pressure field to get the pressure component of force and moment coefficients from both the CFD simulation and the DMD reconstruction. Figure 11a–f show the time-series data for coefficients of drag, lift, sideforce, and pitching, rolling, and yawing moments, respectively. We can see in Figure 11a–f that the DMD reconstruction was now able to capture the moving mean of all the coefficients which is a notable improvement from Figure 7a–f. But in the DMD reconstruction, the higher-frequency fluctuating components are still seen to be dissipated. By investigating the time-dynamics component of Equation (5), and plotting the mode amplitudes obtained from Equation (14) vss. their frequency, we found non-physical energies amongst the higher frequency DMD modes. This suggested that some of the time dynamics obtained by DMD reconstruction in Equation (5) involves aspects of frequency, amplitude, and growth rates that are non-physical, which may be due to a consequence of noise in the algorithm. This is further investigated by the following frequency space analysis.
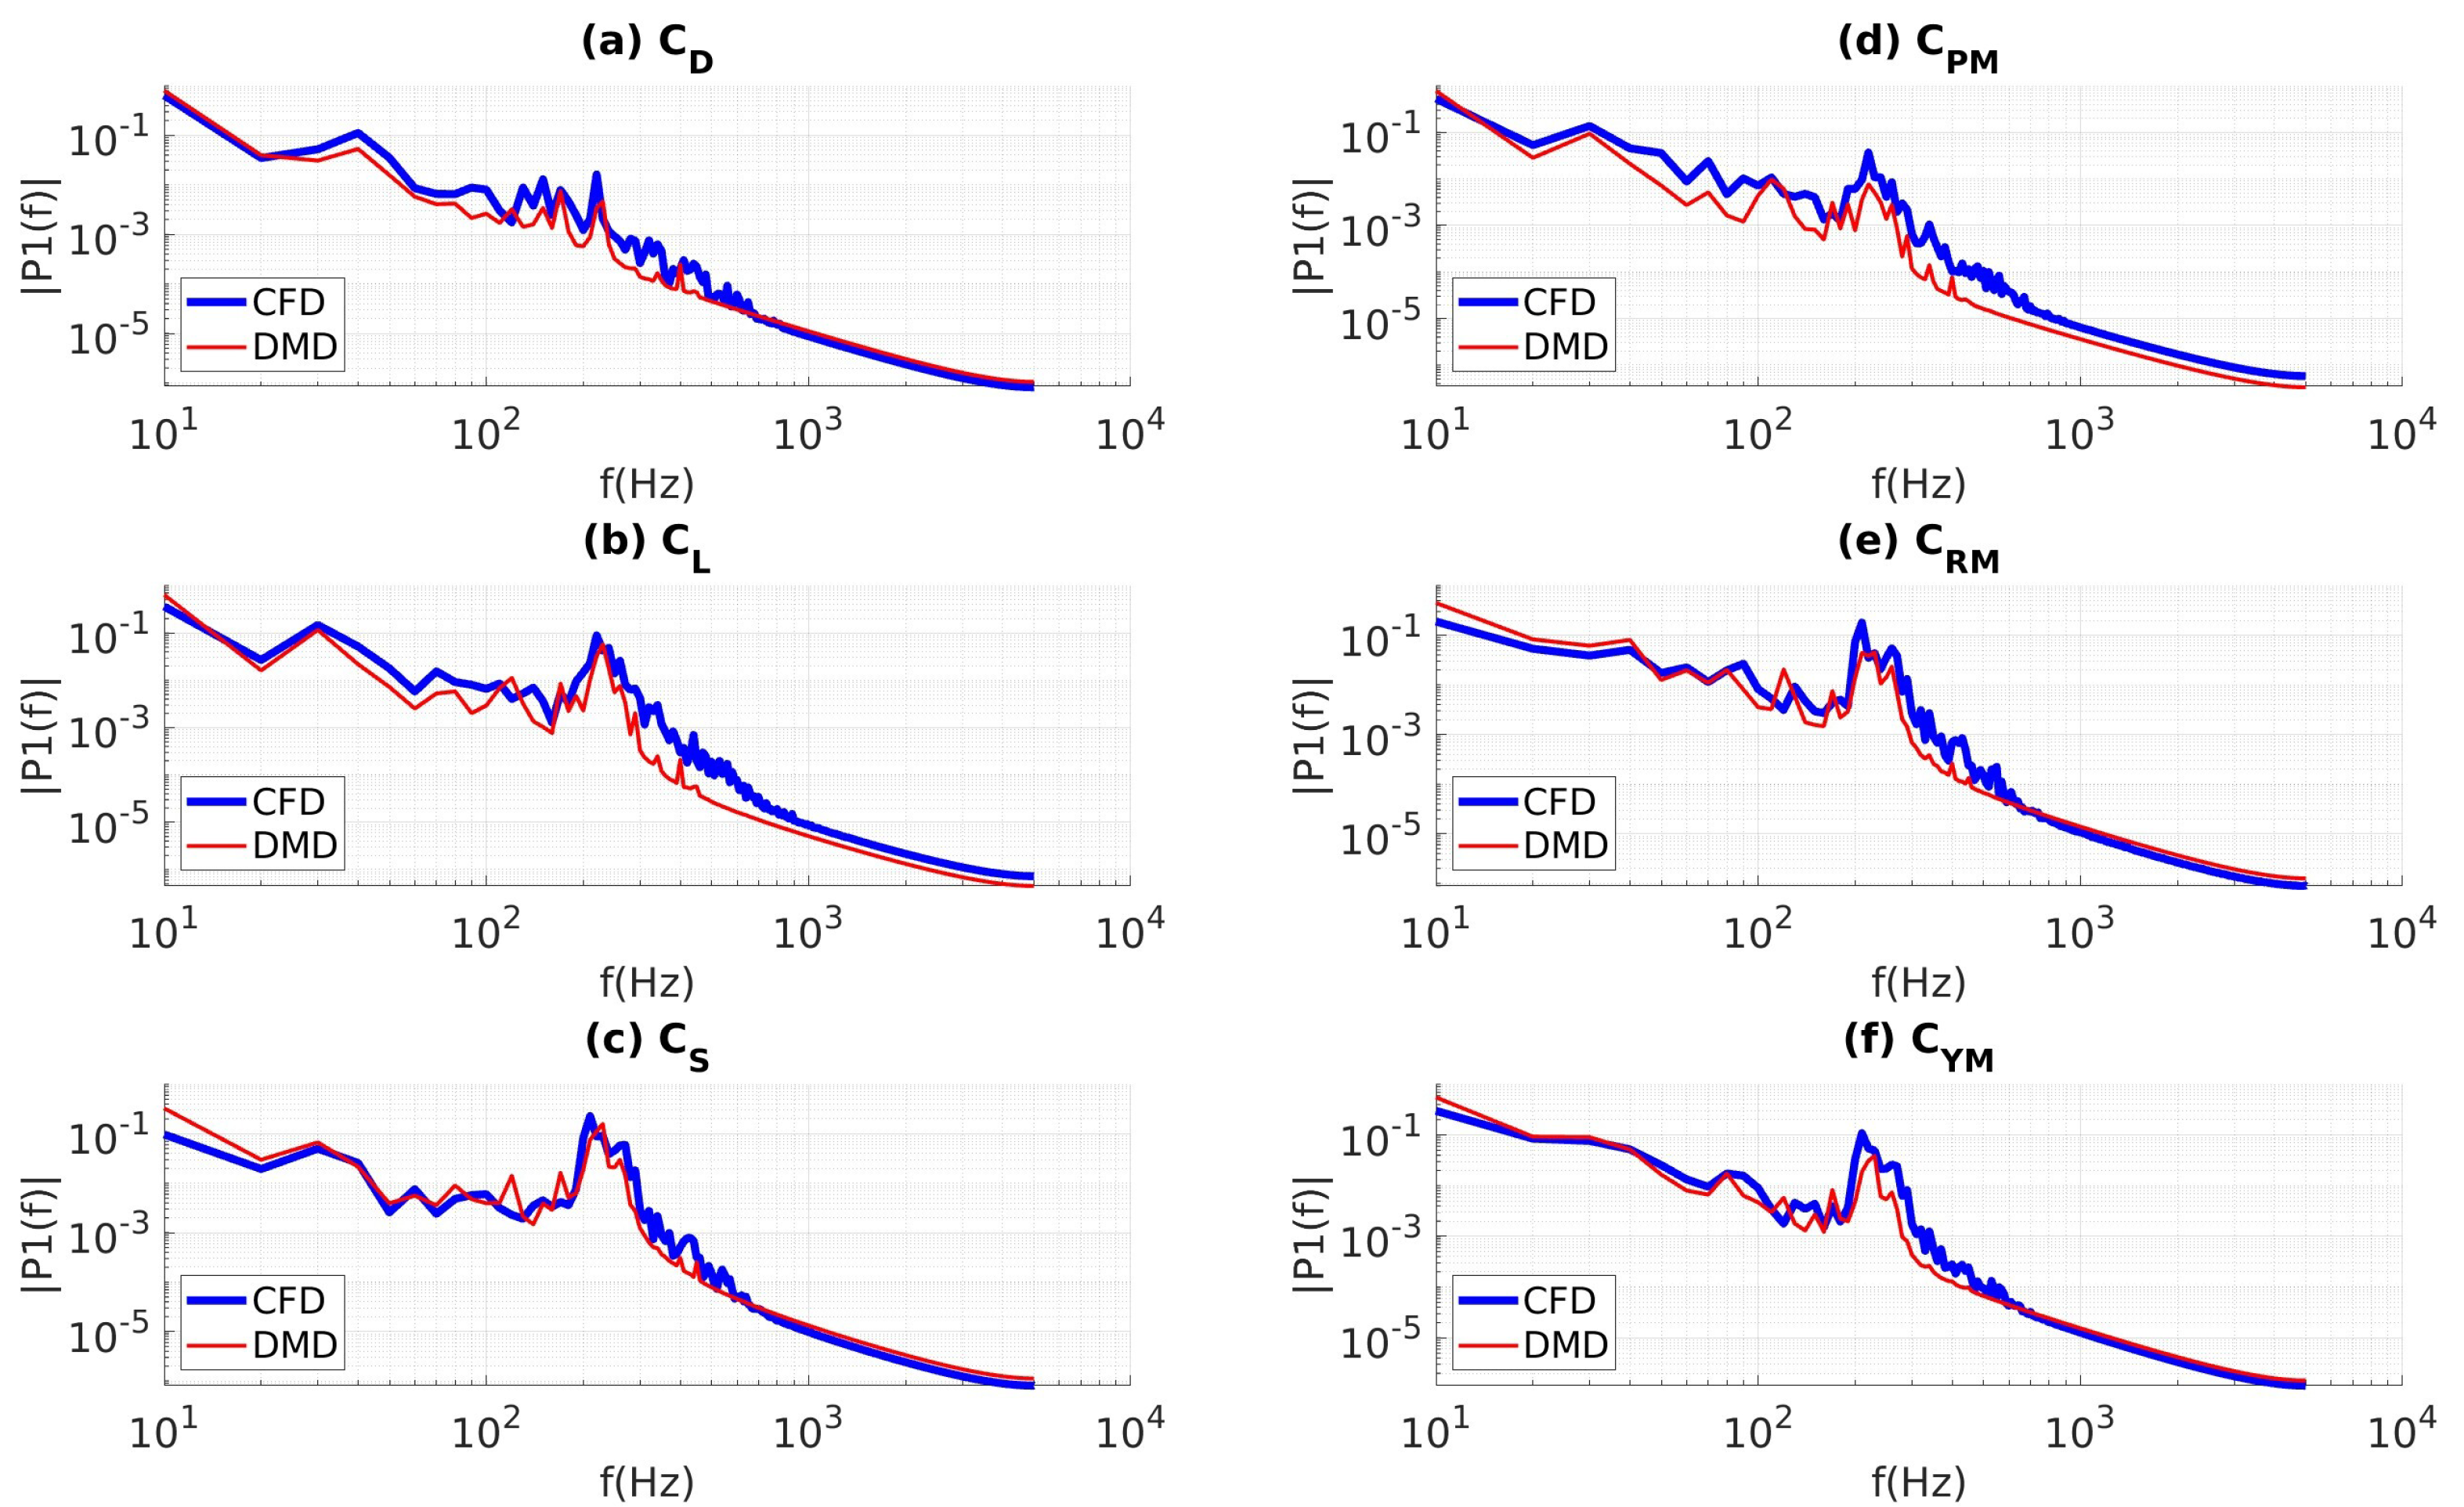
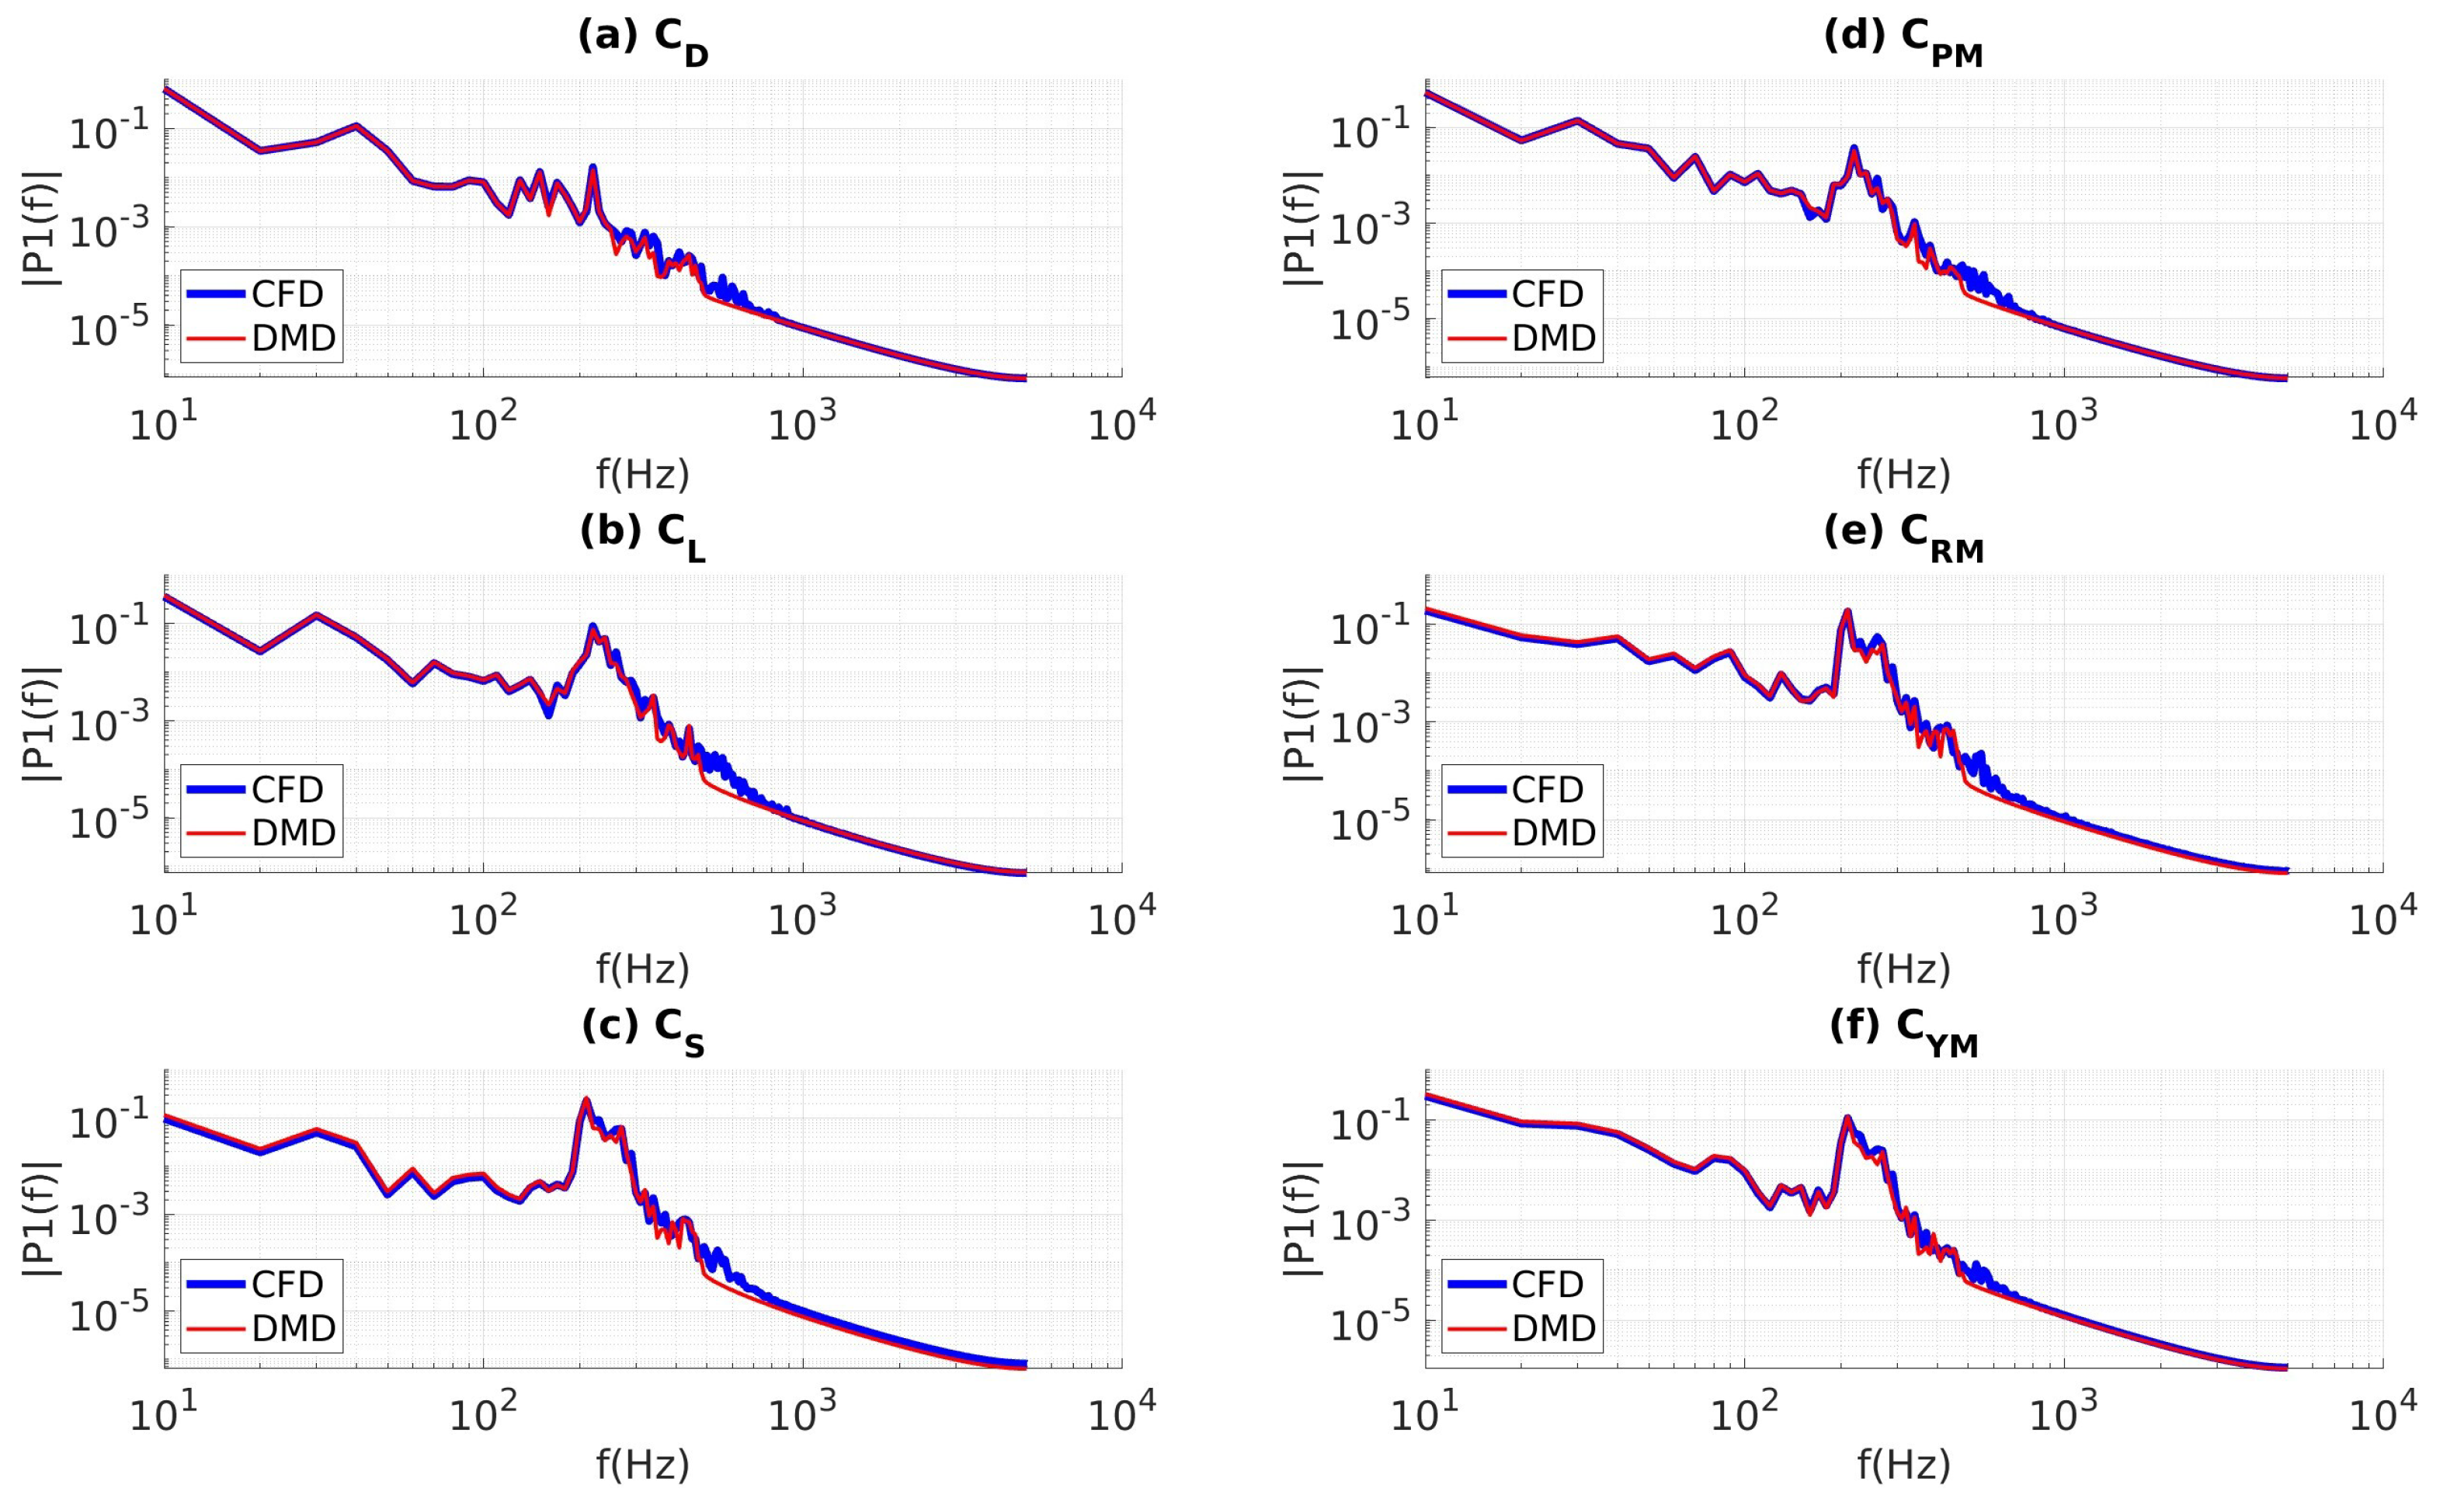
We analyzed the Power Spectral Density (PSD) of all the six force and moment coefficient signals in Figure 12a–f, which shows that the PSD of the coefficients of drag, lift, sideforce, pitching moment, rolling moment, and yawing moment respectively. Each PSD is plotted on the ordinate and the frequency on the abscissa. On each subplot, the CFD simulation data-series is shown in blue and the DMD reconstruction data-series shown in red. Comparing Figure 8 and Figure 12 we can already tell that the performance of DMD reconstruction when the data is sampled at 10 kHz is better in the medium-frequency range than when the data is sampled at 4 kHz. The high-frequency ranges from 1000 Hz and above are well correlated in Figure 12a,c,e,f, with a minor underprediction in Figure 12b,d. In Figure 12a,b,d,f, we saw that the DMD spectra manifested some underprediction of the characteristic frequencies of the flow in the medium-range frequencies from 30 Hz to 700 Hz. Within even these frequency ranges shown in Figure 12c,e, a good correlation between the DMD reconstruction and the CFD simulation result is evident. At a sampling rate of 10 kHz, flow structures involving a frequency upto 1 kHz can be expected have reasonably good anti-aliasing. Thus, the medium-frequency energies in the DMD reconstructed flow may still be adversely affected by the noise from the decomposition algorithm. Thus we next explored cleaning the decomposed modes and time dynamics with certain filtering techniques described in the next section.
Figure 11. Forces and Moments of CFD vs. DMD, sampled at 10 kHz; coefficients of (a) drag, (b) lift, (c) sideforce, (d) pitching moment, (e) rolling moment, and (f) yawing moment.
Preprints 72070 g011
Figure 12. PSD of Forces and Moments of CFD vs. DMD, sampled at 10 kHz; coefficients of (a) drag, (b) lift, (c) sideforce, (d) pitching moment, (e) rolling moment, and (f) yawing moment.
Preprints 72070 g012

4.3.3. Custom Filtering with Data Sampled at 10 kHz

To circumvent all of the issues discussed above, we made a modification to the commonly used DMD algorithm. Two changes were made. The first involves the removal of the truncation step of the SVD; the second involves the introduction of our own custom filtering of the DMD modes. We filtered the time dynamics based upon their predicted amplitudes, frequencies and contribution towards the total energy using a series of three sequential filters to identify and remove the nonphysical modes. We acknowledge that both the design of the filtration process and the cutoff criteria each require their own methodological optimization which is left for a subsequent investigation. Here we briefly describe the filtration process. However, the objective here is to is to show the concept of filtering out nonphysical modes and how it improved the DMD predictions. After several trails with many strategies and alternatives, we have developed a custom filtering approach as described below:
  • The first filter was a low-pass filter applied to the modes identified based upon their maximum instantaneous amplitude in the time dynamics term from Equation (5). The modes having a maximum instantaneous amplitude greater than 50 % of the zero-frequency mode were removed.
  • The second filter was applied to the modes based upon their frequency and their amplitude, given by the RMS version Equation (14). The second filter was designed to remove high-frequency modes having non-physically excessive energy. To accomplish this, the modes were plotted in frequency space against the amplitudes; among the high frequency-modes ( f > 250 Hz), the spurious modes were identified using a clustering-based anomaly detection algorithm. Outliers were defined as modes having an amplitude greater than a moving mean of 10 samples by more than a single local standard deviation. The outliers thus identified had their associated modes removed.
  • The third filter was designed to remove modes which contribute negligible energy to the system. The remaining modes were sorted based upon their contribution towards the total cumulative energy in the system. In this example, modes contributing collectively less than 5 % to total energy were removed; we suspect that these mode may arise from the numerical noise. However, this aspect and the effects of the mode-cut-off energy limit need to be further investigated.
This modified DMD process was applied to the 10 kHz sampled data. In this example, about 30 % of the modes were removed by this filtration process.
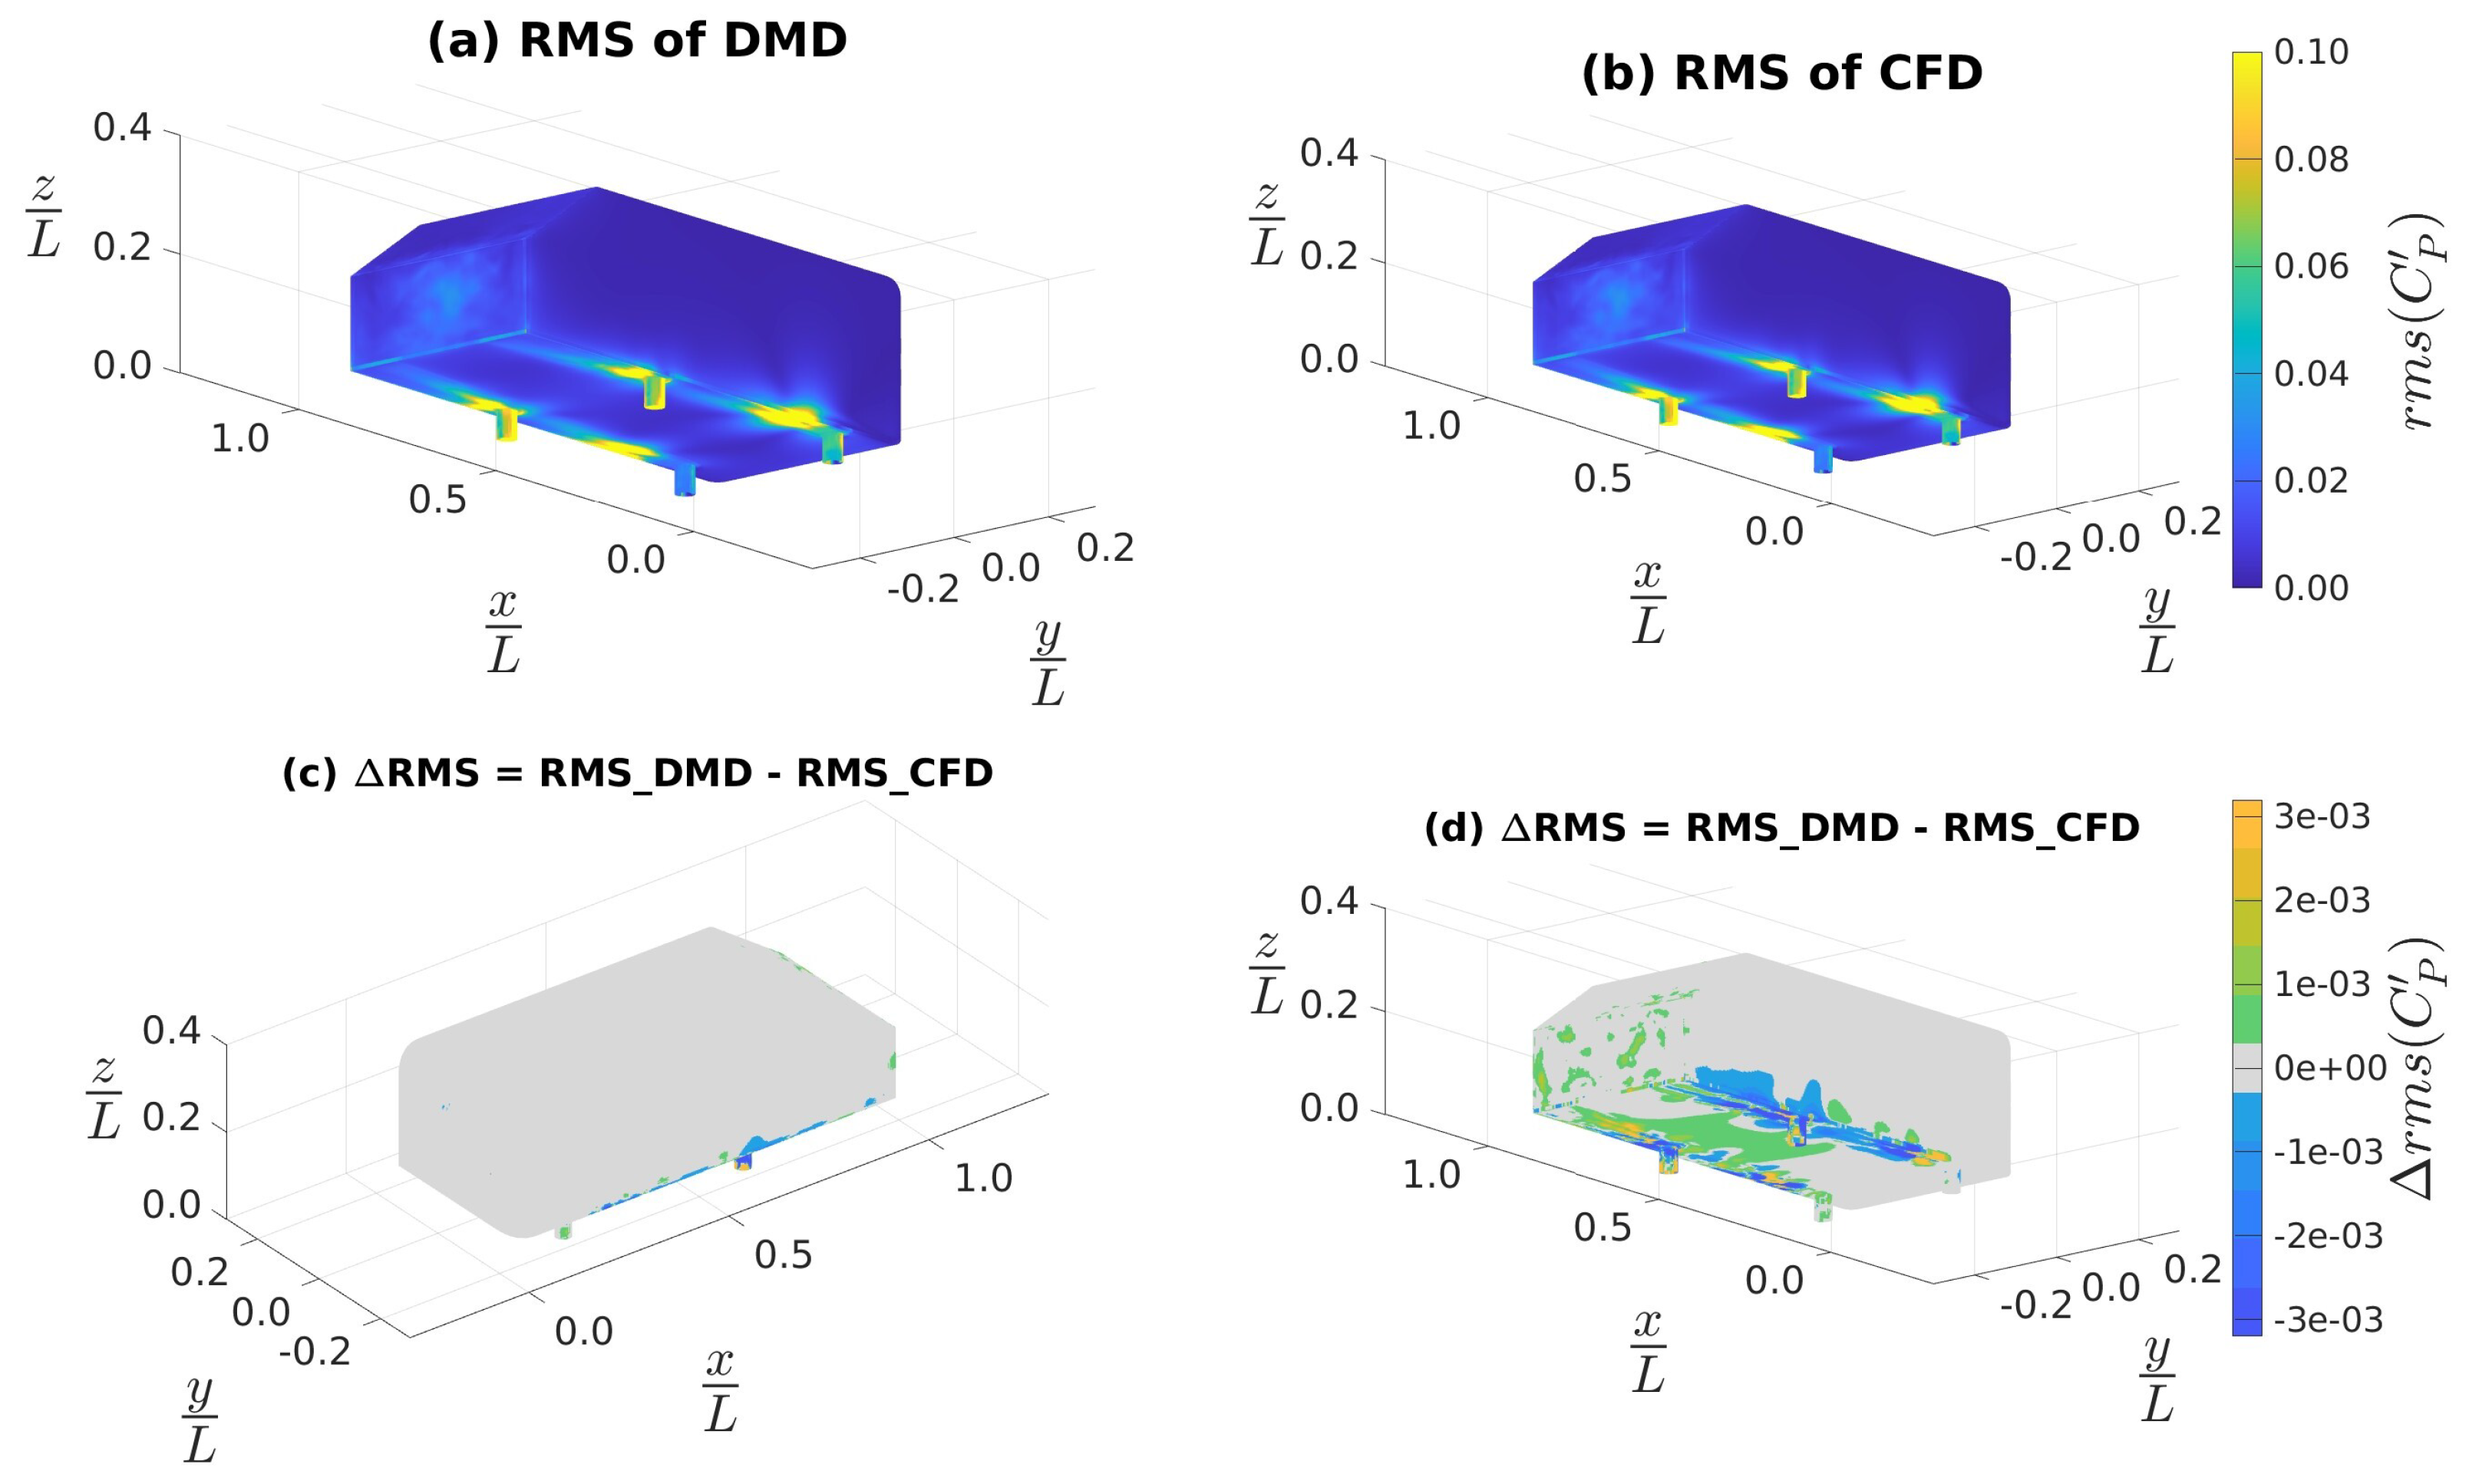
Now, let us analyze the same 10 kHz sampled dataset, this time with custom filtering, in the same manner as before. Figure 13a,b show the mean C p as predicted by DMD reconstruction and CFD prediction, respectively. We see that the distribution of mean C p on the GV surface is qualitatively the same for both the DMD and CFD results. Figure 9c,d show the discrepancy in the mean C p prediction of the DMD results relative to CFD results. In both Figure 13c,d, we noted that the discrepancies were O ( 10 4 ) , which is the order of magnitude as in Figure 9c,d. But in Figure 13d, we observed that the errors are nearly absent from the rear slant face, reduced on the rear face of the GV, and markedly improved along the edges of the front face—all of, which are are notable improvements relative to Figure 9d.
Figure 14a,b show the RMS of the fluctuating component of C p as obtained from the DMD reconstruction and CFD simulations, respectively. In contrast to Figure 10a,b, here the DMD results are virtually identical to the CFD results. Figure 14c,d show the discrepancy in the RMS of the fluctuating component of C p predicted by DMD reconstruction relative to those predicted by the CFD results; like before in Figure 14d we changed the camera angle to a top-left orientation to visualize the hidden portion of Figure 14c. In both Figure 14c,d, we noted that the discrepancies were O ( 10 3 ) which was similar to the order of magnitude seen in Figure 10c,d. This indicates a significant improvement in the prediction of the fluctuating component of the flow field. In Figure 14d, we observed that the discrepancies in the DMD reconstruction are concentrated along the rear edges between the stilts. Thus Figure 13 and Figure 14 indicate that the medium frequency response of DMD reconstruction has improved through the filtration process. We corroborate this with the subsequent analysis.
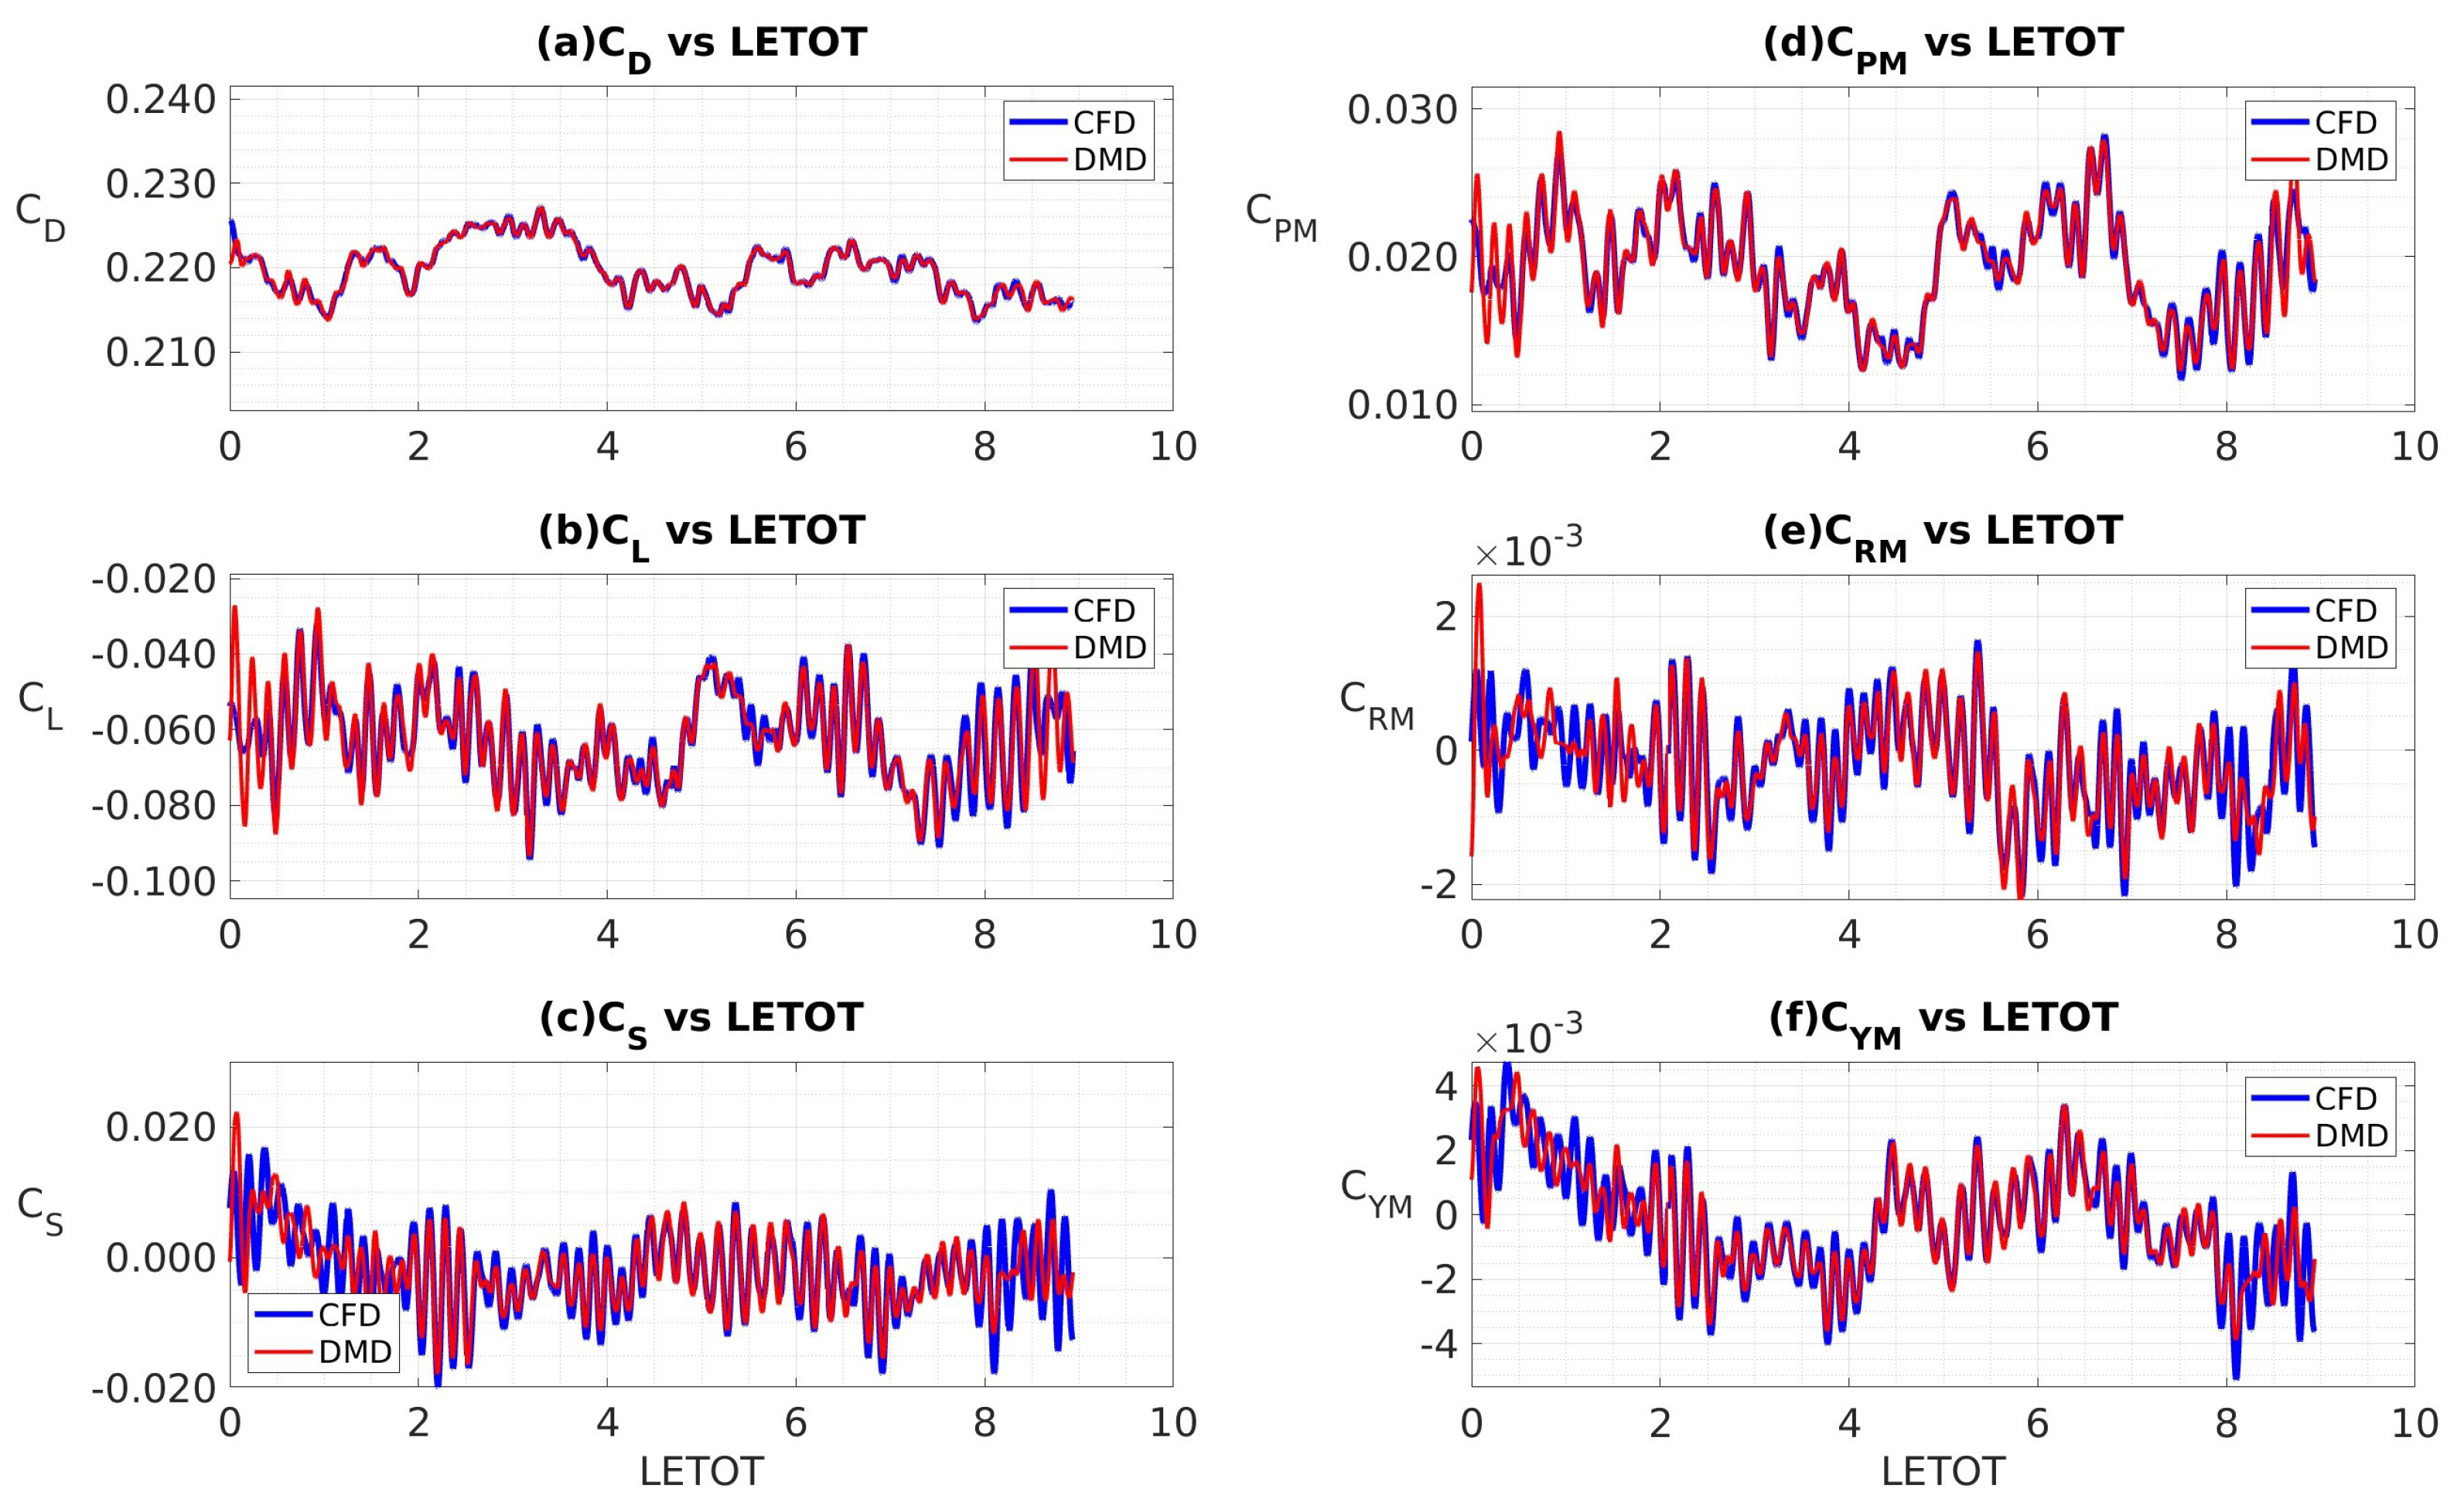
We again integrated the surface static pressure field to get the pressure component of force and moment coefficients from both the CFD simulation and the DMD reconstruction. Figure 15 shows the timeseries data for coefficients of (a) drag, (b) lift, (c) sideforce, (d) pitching moment, (e) rolling moment, and (f) yawing moment. On each subplot, the CFD simulation data are shown in blue and the DMD reconstruction data are shown in red. We can see in Figure 15a–f that the DMD reconstruction and CFD simulation predictions are very well correlated, which is a notable improvement from Figure 11a–f. But in the DMD reconstruction of Figure 15b,c,e,f, some of the local peaks associated with the CFD simulation are not captured. This could be due to excessive losses in the filtration process.
Figure 14. RMS of fluctuating component of surface C p with 10kHz sampling and custom filtering: (a) DMD reconstruction, (b) CFD simulation, (c & d) the difference between (b) and (a).
Preprints 72070 g014
Figure 16a–f shows the PSD of coefficients of drag, lift, sideforce, and pitching, rolling, and yawing moments, respectively. Comparing Figure 12 and Figure 16, we can see that the performance of DMD reconstruction using filtered modes, let’s call it fmDMD, is better in the medium frequency range. While there remains some room for improvement within the medium and high frequency ranges, we understand that data collected from an IDDES simulation cannot resolve the very high frequency flow characteristics; in other words, this imitation may be due more to the limitations of the CFD approach and ess to the limitations of the DMD approach.
Figure 15. Forces and moments of CFD simulation verses DMD reconstruction, sampled at 10 kHz and obtained using custom filters.
Preprints 72070 g015
Figure 16. PSD of Forces and moments of CFD simulation verses DMD reconstruction, sampled at 10 kHz and obtained using custom filters.
Preprints 72070 g016

4.3.4. Coefficients of Aerodynamic Forces and Moments

In order to investigate the effectiveness of DMD to predict force and moment coefficients, a comparison of statistical quantities (mean and rms of the fluctuating component) obtained from the DMD reconstructed reduced order flow field against those from the CFD simulations are presented in Table 1. Clearly, the predictions associated with this DMD method match very well to the CFD data. Note that the CFD simulation of 2 seconds of physical time requires 14,400 central processing unit (CPU) hours, where as the DMD averaging over the same period took 15 seconds of CPU time.

4.4. Future State Predictions Using DMD

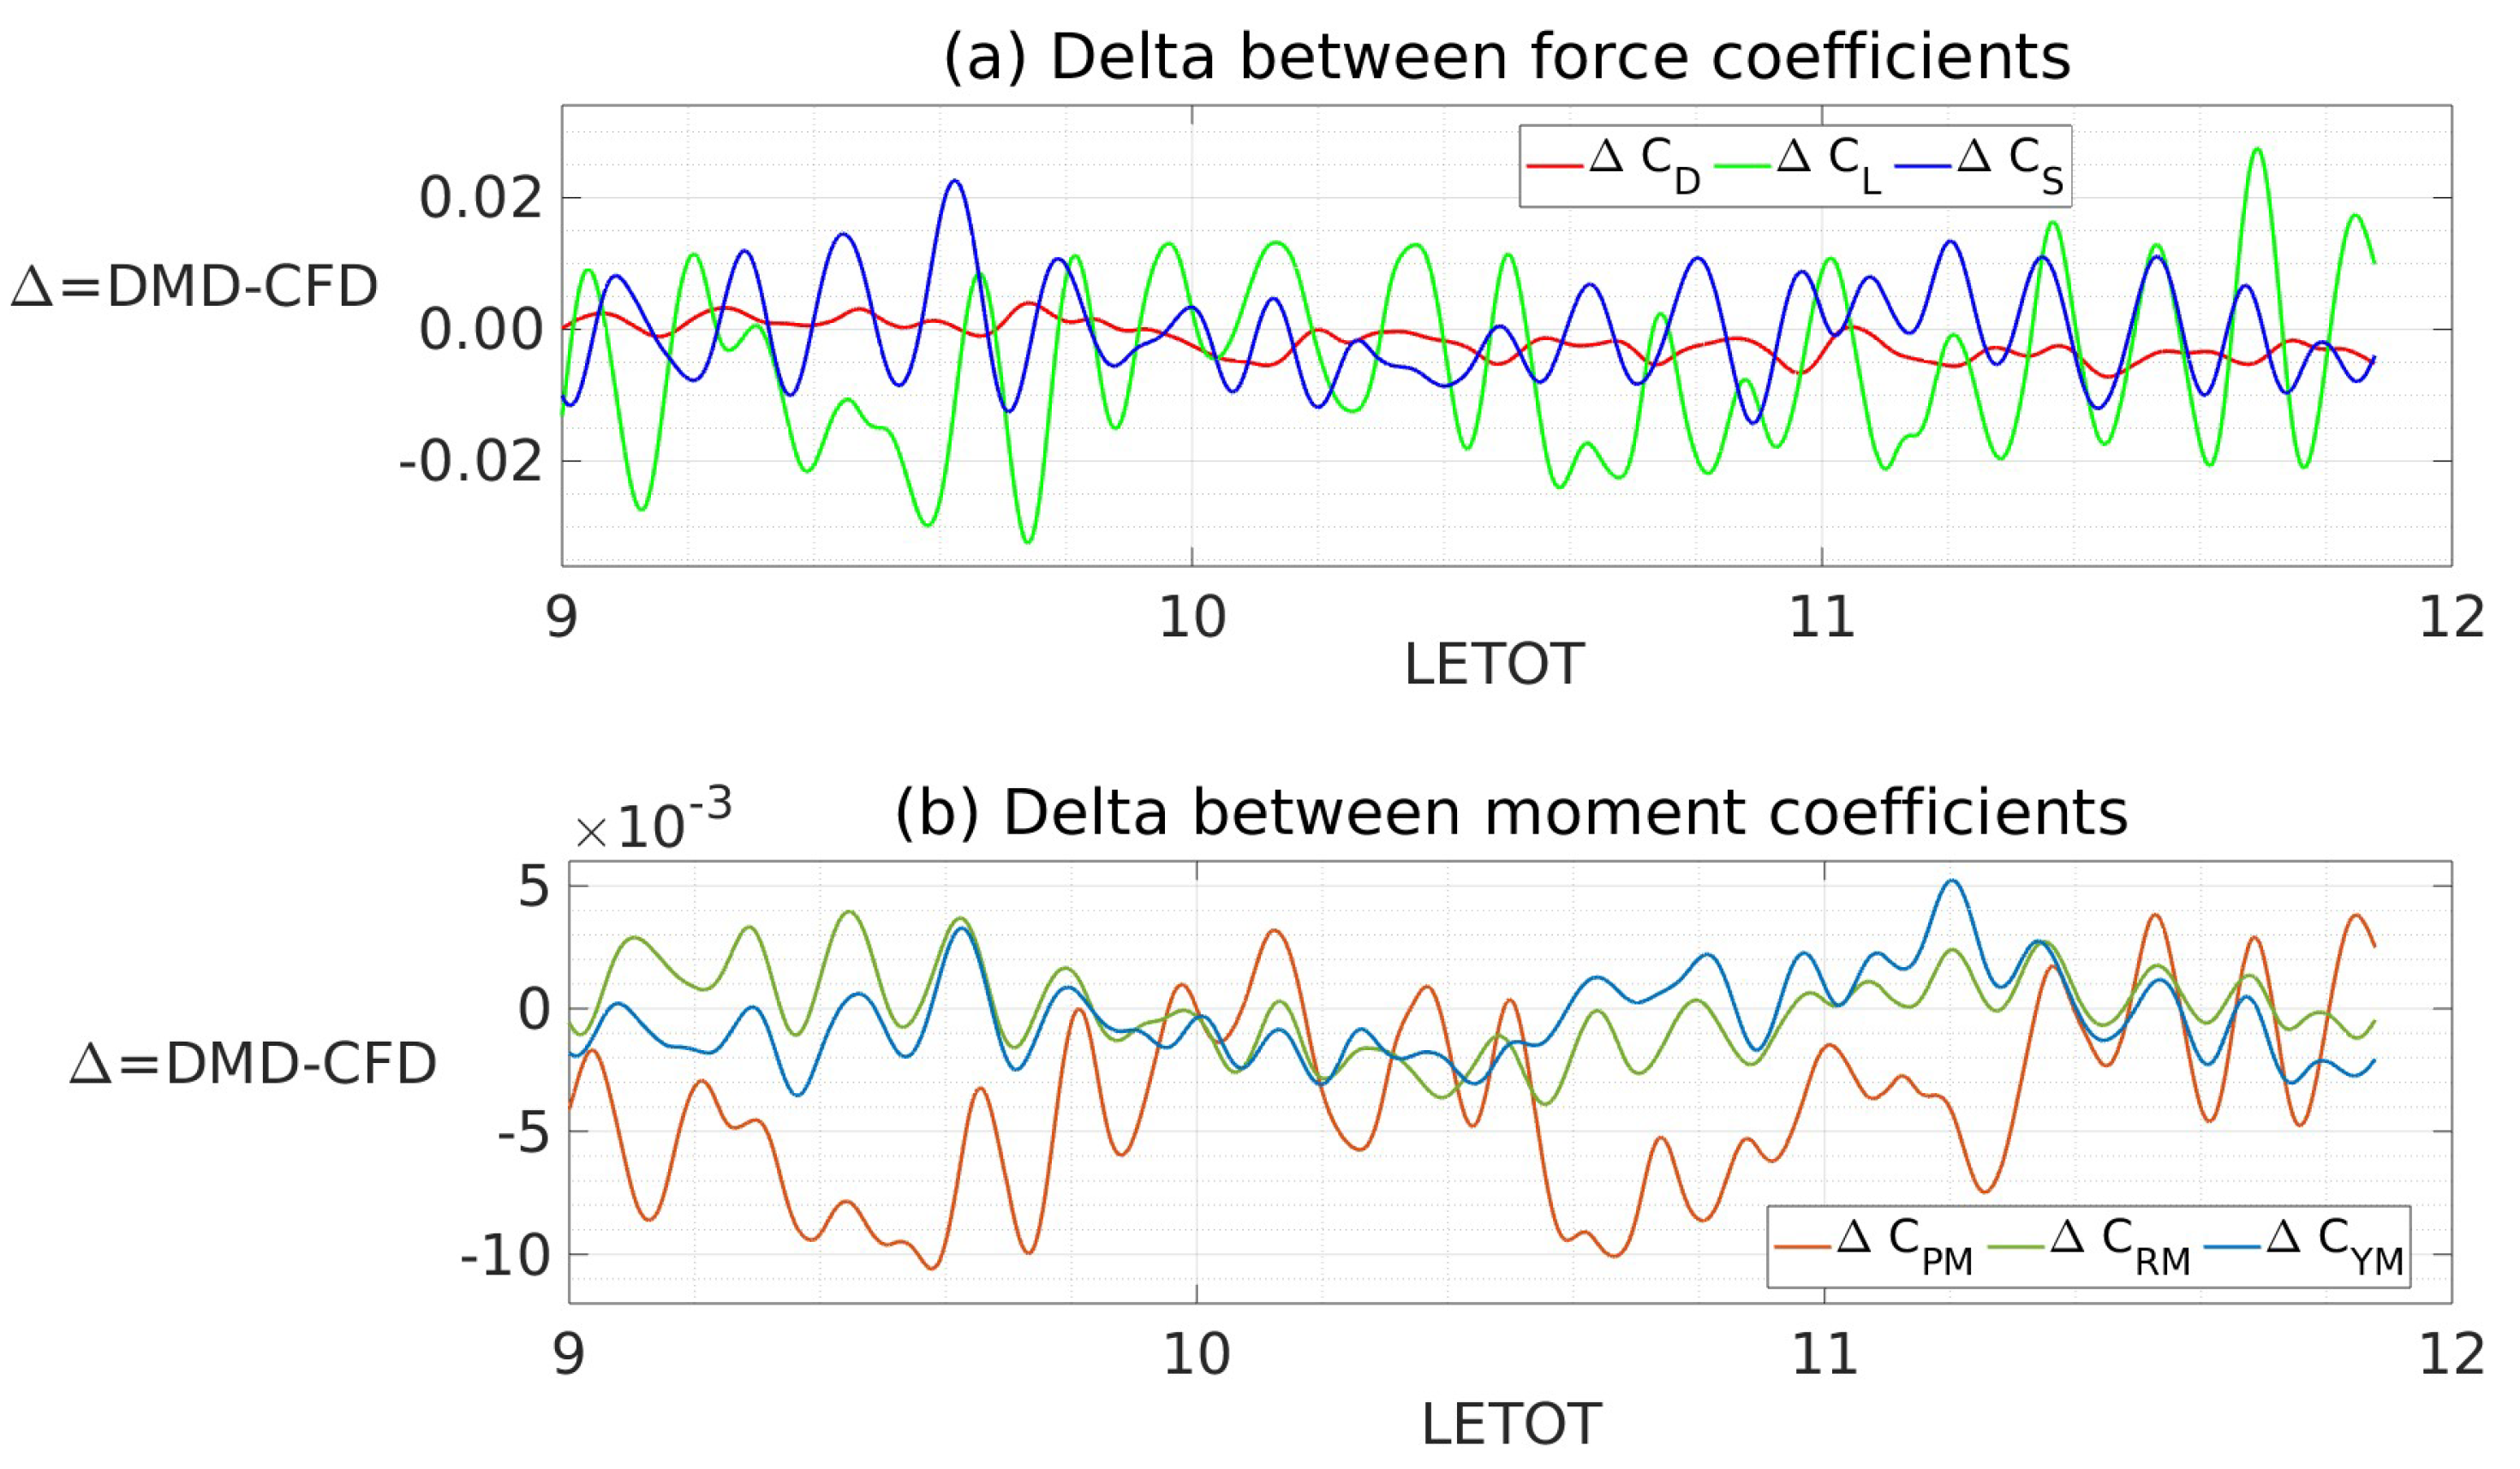
We also investigated the effectiveness of DMD to make future state predictions of the aerodynamic forces and moments. This was done by updating the initial condition vector, b in Equation (5), to represent the last time-step shown in Figure 15. Then the same coefficients of matrices Φ and Ω were used in Equation (5) to generate a future state predictions of static pressure distribution on the Ahmed body surface. This pressure distribution was integrated to calculate the aerodynamic forces and moments. Figure 17a,b show the differences between future prediction by DMD relative to known CFD data. The instantaneous future prediction by DMD has a small and oscillating difference w.r.t known CFD data. This is expected as it is impractical to perfectly recreate an instantaneous snapshot of stochastic processes like a turbulent flow tin these case parameters of interest are the statistical quantities like mean and RMS of fluctuations, and spectral distributions. We presented a comparison of these time-averaged quantities in Table 2. Generally, the predictions from this DMD method well matched to the CFD data. There is a small discrepancy in the mean CFD and mean DMD coefficients of C D , C L and C P M of between 2 to 6 counts. This is hypothesized to come from a low frequency oscillation within the flow field that was not captured in the CFD data used to generate the ROM and is, thus, not predicted by DMD. The RMS of the fluctuating components of DMD and CFD shown in Table 2 are very well matched. This suggests that the proposed ROM is successfully predicting the medium and high frequency motions.
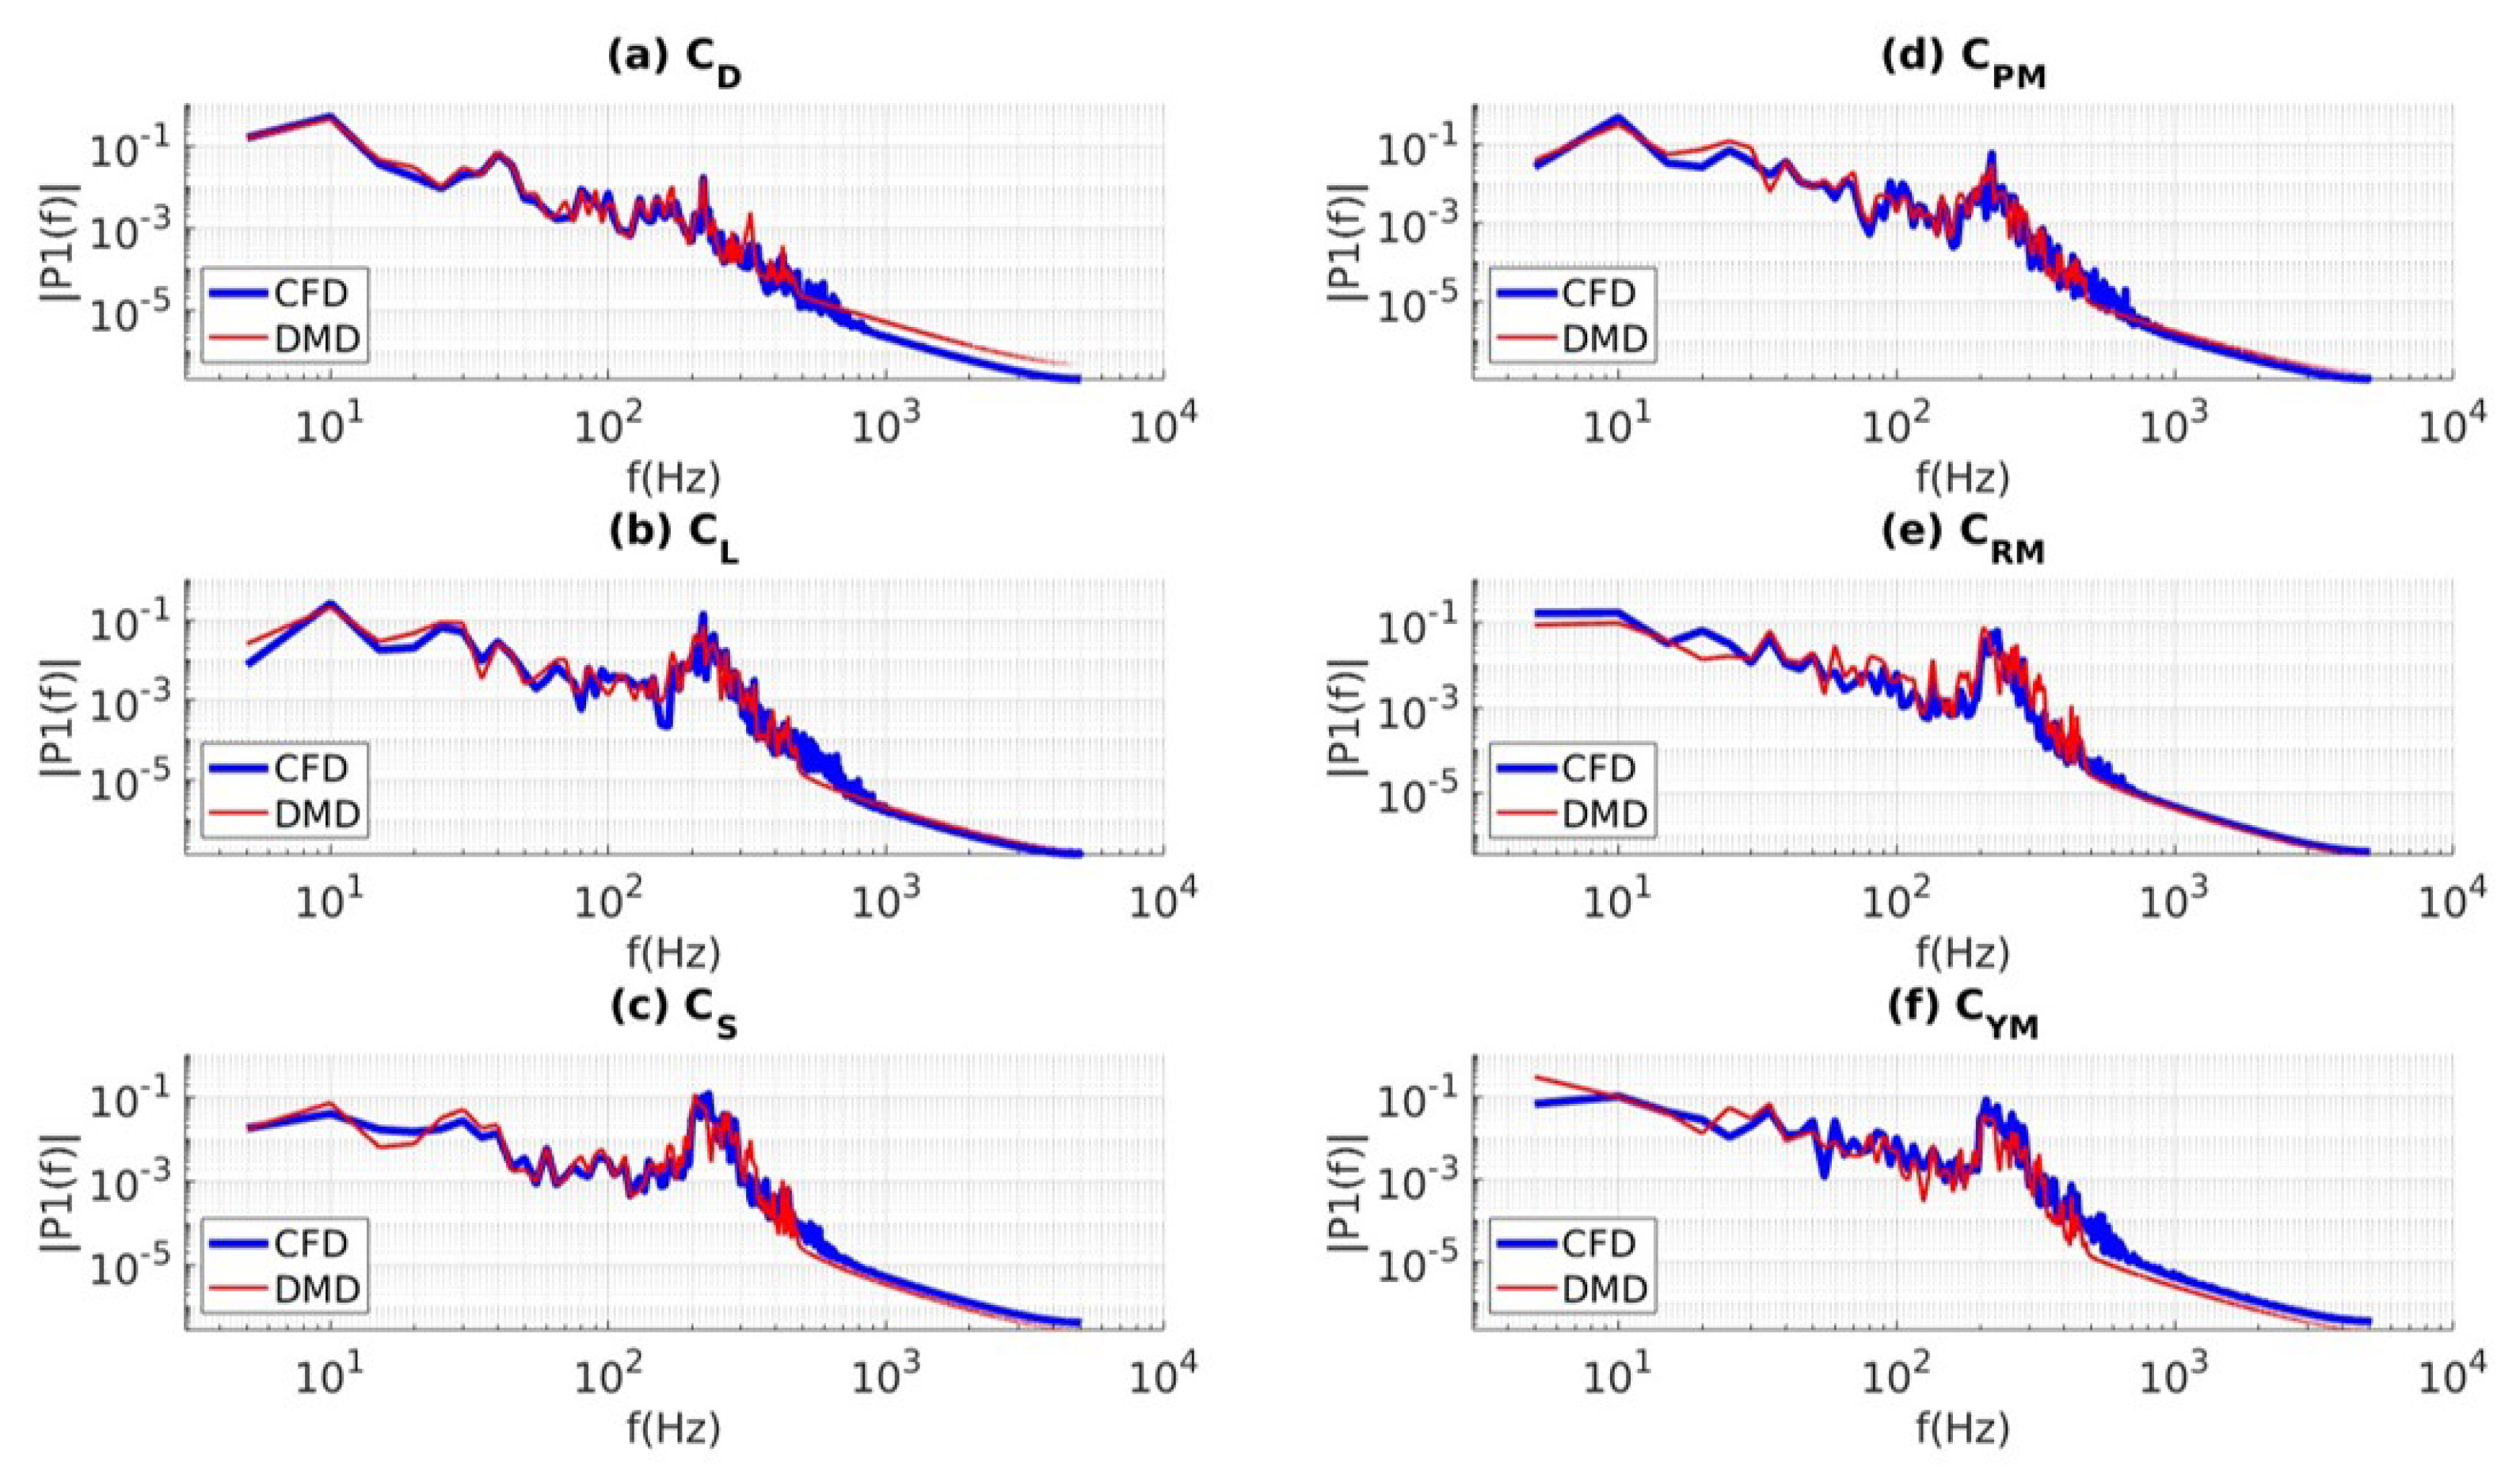
Figure 18 shows the PSD of future predictions of DMD relative to known CFD data. Similar to Figure 16, spectra of the DMD future prediction is shown in blue and spectra of the known CFD data is shown in red. Again, the future prediction by DMD is able to capture the PSD of the flow field. Small discrepancies are seen in low-to-medium frequencies in Figure 16e which indicate that there remains scope for improvemnet of the proposed ROM. A sensitivity analysis and optimization are left for a future work.

4.5. Computational Resources

In Table 3 we compare the computational resources required to run the DMD solution shown in Equation (5) against the requirements to run a full blown CFD simulation. We can see that the DMD is able to reduce total CPU time and storage requirements by two orders of magnitude. The resources required by DMD are thus expected to be within the capability of an on-board controller on a moving vehicle. The modified DMD process proposed in this paper may thus have the potential to be combined with a control modification, such as the DMD with Control (DMDc) algorithm proposed by [18], and effect real-time control of a moving vehicle. This is a very promising result as a full blown CFD for real-time control by an on-board computer is not possible.

5. Conclusion

In this paper, we intended to apply the Dynamic Mode Decomposition (DMD) approach to a high Reynolds number flow around an idealized ground vehicle with an objective of using the DMD as the engine to develop a Reduced Order predictive Model (ROM). We observed that the standard DMD algorithm, as available from the existing literature, can successfully reconstruct the low Reynolds number flow fields past a 2D cylinder. However, when the same algorithm was applied to a high Reynolds number R e , separation-dominated complex flow over an idealized ground vehicle, the existing methods failed to accurately reconstruct the flow fields using the derived DMD modes. This implies that a reduced order reconstruction of the flow-field based on the DMD modes obtained using the existing algorithm would be not very reliable for such flows.
Table 3. Computational resources required by DMD and CFD.
Parameter CFD DMD
Processors 144 1
CPU time for the entire timeseries 100 hrs < 15 s
CPU time for a single time snapshot 5 s < 0.01 s
Storage needed 20 GB < 0.20 GB
It was found that even though a time-step which may be sufficiently small for a CFD simulation to resolve the flow-field accurately, it may be inadequate to generate a well resolved dataset for a well-resolved DMD. A larger than adequate time-step caused nonphysical growth rates of the modes; this caused excessive energy dissipation of the medium to high frequency modes which eventually led to total decay of the higher-frequency DMD modes. Thus, for a high R e flows, data sampling frequency needs to be higher than what may be available on the basis of the time-step size needed for a well resolved IDDES simulation; this implies that the CFD simulation is needed to be run with a much smaller time-step than necessary for a well-resolved IDDES. Though the higher sampling rate improves the observed discrepancies between the DMD reconstructed mean values and the ground truth (values from the CFD simulation in this case) for the mean flow variables, the RMS of the fluctuating quantities still show significant errors. Also, spectral analyses show that the medium frequency motions reconstructed by DMD still show nonphysical dampening. This was hypothesized to be due to the presence of dampening modes emanating from the generation of spurious DMD modes due to the numerical noise present in the CFD training data. Thus, the mode filtration process was developed to remove the offending modes from the DMD reconstruction. This resulted in an order of magnitude improvement in the errors observed in the DMD predictions of the RMS of the fluctuating components when compared to the ground truth. The ROM synthesized via the proposed mode filtration process was able to make a future state prediction that had time averaged quantities and PSD well correlated to known CFD data.
The modified DMD reconstruction algorithm presented in this paper was able to overcome the challenges in the medium-to-high frequency range DMD modes. Thus, we demonstrated that the method, called mfDMD, is capable of flow-field reconstruction that is correct to the accuracy of the CFD modeling scheme used to generate the training data. The computational resources required by the mfDMD algorithm look feasible for the implementation alongside a DMD with Control modification to effect real-time control of a moving vehicle by an on-board controller. Applications of the modified DMD algorithm to aerodynamic interactions between vehicles in close proximity, such as dynamic platooning conditions [45], and NASCAR racecar subject to ride height and crosswind changes [21,51] are the subjects of future research.

Author Contributions

Conceptualization, A.M, M.U. and V.K.; methodology, A.M, M.U., V.K. and N.T.; software, A.M. and M.U.; validation, A.M. and M.U.; formal analysis, A.M, M.U., V.K. and N.T.; investigation, A.M. and M.U.; resources, M.U. and V.K.; data curation, A.M.; writing—original draft preparation, A.M. and M.U.; writing—review and editing, M.U., N.T. and V.K.; visualization, A.M. and M.U.; supervision, M.U.; project administration, M.U.; funding acquisition, M.U. and V.K. All authors have read and agreed to the published version of the manuscript.

Funding

The work is partially supported through a subcontract from Alion Science and Technology Corporation (subcontract number SFP1160215) against a primary contract from the US Army Ground Vehicle System Center (GVSC). The authors also thankfully acknowledge funding support from the Office of Naval Research (ONR grant# N00014-19-1-2245) through which Adit Misar was supported to work on the development of CFD based application oriented Virtual Engineering tools.

Acknowledgments

The authors gratefully acknowledge the technical support from UNC Charlotte University Research Computing (URC) and the William States Lee College of Engineering MOSAIC Computing.

Conflicts of Interest

The authors declare no conflict of interest. The funders had no role in the design of the study; in the collection, analyses, or interpretation of data; in the writing of the manuscript; or in the decision to publish the results.

Abbreviations

The following abbreviations are used in this manuscript:
CFD Computational Fluid Dynamics
DDES Delayed Detached Eddy Simulation
DES Detached Eddy Simulation
DMD Dynamic Mode Decomposition
DNS Direct Numerical Simulation
GV Ground Vehicle
GVSC Ground Vehicles Systems Center
IDDES Improved Delayed Detached Eddy Simulation
LES Large Eddy Simulation
PSD Power Spectral Density
RANS Reynolds-Averaged Navier-Stokes
SGS Sub Grid Scale
SRS Scale Resolved Simulation
SST Shear Stress Transport
SVD Singular Value Decomposition
TD Time Dynamics
VWT Virtual Wind Tunnel
WT Wind Tunnel

References

  1. Ahani, H.; Nielsen, J.; Uddin, M. The Proper Orthogonal and Dynamic Mode Decomposition of Wake Behind a Fastback DrivAer Model. Technical Report 2022-01-0888; SAE Technical Paper; United States, 2022. [Google Scholar]
  2. Ikeda, J.; Matsumoto, D.; Tsubokura, M.; Uchida, M.; Hasegawa, T.; Kobayashi, R. Dynamic mode decomposition of flow around a full-scale road vehicle using unsteady CFD. In Proceedings of the 34th AIAA Applied Aerodynamics Conference; 2016; p. 3727. [Google Scholar]
  3. Jacuzzi, E.; Granlund, K. Passive flow control for drag reduction in vehicle platoons. Journal of Wind Engineering and Industrial Aerodynamics 2019, 189, 104–117. [Google Scholar] [CrossRef]
  4. Mohammadikalakoo, B.; Schito, P.; Mani, M. Passive flow control on Ahmed body by rear linking tunnels. Journal of Wind Engineering and Industrial Aerodynamics 2020, 205, 104330. [Google Scholar] [CrossRef]
  5. Hanfeng, W.; Yu, Z.; Chao, Z.; Xuhui, H. Aerodynamic drag reduction of an Ahmed body based on deflectors. Journal of Wind Engineering and Industrial Aerodynamics 2016, 148, 34–44. [Google Scholar] [CrossRef]
  6. Siddiqui, N.; Chaab, M. A simple passive device for the drag reduction of an ahmed body. Journal of Applied Fluid Mechanics 2020, 14, 147–164. [Google Scholar]
  7. Tian, J.; Zhang, Y.; Zhu, H.; Xiao, H. Aerodynamic drag reduction and flow control of Ahmed body with flaps. Advances in Mechanical Engineering 2017, 9, 1687814017711390. [Google Scholar] [CrossRef]
  8. Zhang, B.; Liu, K.; Zhou, Y.; To, S.; Tu, J. Active drag reduction of a high-drag Ahmed body based on steady blowing. Journal of Fluid Mechanics 2018, 856, 351–396. [Google Scholar] [CrossRef]
  9. Joseph, P.; Amandolese, X.; Aider, J.L. Drag reduction on the 25° slant angle Ahmed reference body using pulsed jets. Experiments in fluids 2012, 52, 1169–1185. [Google Scholar] [CrossRef]
  10. Joseph, P.; Amandolese, X.; Edouard, C.; Aider, J.L. Flow control using MEMS pulsed micro-jets on the Ahmed body. Experiments in fluids 2013, 54, 1–12. [Google Scholar] [CrossRef]
  11. Li, Y.; Cui, W.; Jia, Q.; Li, Q.; Yang, Z.; Morzyński, M.; Noack, B.R. Explorative gradient method for active drag reduction of the fluidic pinball and slanted Ahmed body. Journal of Fluid Mechanics 2022, 932, A7. [Google Scholar] [CrossRef]
  12. Bruneau, C.H.; Creusé, E.; Depeyras, D.; Gilliéron, P.; Mortazavi, I. Coupling active and passive techniques to control the flow past the square back Ahmed body. Computers & Fluids 2010, 39, 1875–1892. [Google Scholar]
  13. Sudin, M.N.; Abdullah, M.A.; Shamsuddin, S.A.; Ramli, F.R.; Tahir, M.M. Review of research on vehicles aerodynamic drag reduction methods. International Journal of Mechanical and Mechatronics Engineering 2014, 14, 37–47. [Google Scholar]
  14. Mukut, A.M.I.; Abedin, M.Z. Review on aerodynamic drag reduction of vehicles. International Journal of Engineering Materials and Manufacture 2019, 4, 1–14. [Google Scholar] [CrossRef]
  15. Bounds, C.P.; Rajasekar, S.; Uddin, M. Development of a Numerical Investigation Framework for Ground Vehicle Platooning. Fluids 2021, 6, 404. [Google Scholar] [CrossRef]
  16. Zhang, J.; Feng, T.; Yan, F.; Qiao, S.; Wang, X. Analysis and design on intervehicle distance control of autonomous vehicle platoons. ISA transactions 2020, 100, 446–453. [Google Scholar] [CrossRef]
  17. Sivanandham, S.; Gajanand, M. Platooning for sustainable freight transportation: an adoptable practice in the near future? Transport Reviews 2020, 40, 581–606. [Google Scholar] [CrossRef]
  18. Proctor, J.L.; Brunton, S.L.; Kutz, J.N. Dynamic mode decomposition with control. SIAM Journal on Applied Dynamical Systems 2016, 15, 142–161. [Google Scholar] [CrossRef]
  19. Tennekes, H.; Lumley, J.L.; Lumley, J.L.; et al. A first course in turbulence; MIT press, 1972. [Google Scholar]
  20. Liu, K.; Zhang, B.; Zhang, Y.; Zhou, Y. Flow structure around a low-drag Ahmed body. Journal of Fluid Mechanics 2021, 913, A21. [Google Scholar] [CrossRef]
  21. Misar, A.S.; Uddin, M.; Pandaleon, T.; Wilson, J. Scale-Resolved and Time-Averaged Simulations of the Flow over a NASCAR Cup Series Racecar. Technical Report 2023-01-0735; SAE Technical Paper; United States, 2023. [Google Scholar]
  22. Guilmineau, E.; Deng, G.; Leroyer, A.; Queutey, P.; Visonneau, M.; Wackers, J. Assessment of hybrid RANS-LES formulations for flow simulation around the Ahmed body. Computers & Fluids 2018, 176, 302–319. [Google Scholar]
  23. Ashton, N.; West, A.; Lardeau, S.; Revell, A. Assessment of RANS and DES methods for realistic automotive models. Computers & fluids 2016, 128, 1–15. [Google Scholar]
  24. Kutz, J.N.; Brunton, S.L.; Brunton, B.W.; Proctor, J.L. Dynamic mode decomposition: data-driven modeling of complex systems; SIAM, 2016. [Google Scholar]
  25. Schmid, P.J. Dynamic mode decomposition and its variants. Annual Review of Fluid Mechanics 2022, 54, 225–254. [Google Scholar] [CrossRef]
  26. Schmidt, O.T.; Colonius, T. Guide to spectral proper orthogonal decomposition. Aiaa journal 2020, 58, 1023–1033. [Google Scholar] [CrossRef]
  27. Muld, T.W.; Efraimsson, G.; Henningson, D.S. Flow structures around a high-speed train extracted using proper orthogonal decomposition and dynamic mode decomposition. Computers & Fluids 2012, 57, 87–97. [Google Scholar]
  28. Sieber, M.; Paschereit, C.O.; Oberleithner, K. Spectral proper orthogonal decomposition. Journal of Fluid Mechanics 2016, 792, 798–828. [Google Scholar] [CrossRef]
  29. Berkooz, G.; Holmes, P.; Lumley, J.L. The proper orthogonal decomposition in the analysis of turbulent flows. Annual review of fluid mechanics 1993, 25, 539–575. [Google Scholar] [CrossRef]
  30. Taira, K.; Brunton, S.L.; Dawson, S.T.; Rowley, C.W.; Colonius, T.; McKeon, B.J.; Schmidt, O.T.; Gordeyev, S.; Theofilis, V.; Ukeiley, L.S. Modal analysis of fluid flows: An overview. Aiaa Journal 2017, 55, 4013–4041. [Google Scholar] [CrossRef]
  31. Schmid, P.J. Dynamic mode decomposition of numerical and experimental data. Journal of fluid mechanics 2010, 656, 5–28. [Google Scholar] [CrossRef]
  32. Schmid, P.J.; Li, L.; Juniper, M.P.; Pust, O. Applications of the dynamic mode decomposition. Theoretical and Computational Fluid Dynamics 2011, 25, 249–259. [Google Scholar] [CrossRef]
  33. Schmid, P.J.; Violato, D.; Scarano, F. Decomposition of time-resolved tomographic PIV. Experiments in fluids 2012, 52, 1567–1579. [Google Scholar] [CrossRef]
  34. Wynn, A.; Pearson, D.; Ganapathisubramani, B.; Goulart, P.J. Optimal mode decomposition for unsteady flows. Journal of Fluid Mechanics 2013, 733, 473–503. [Google Scholar] [CrossRef]
  35. Sakai, M.; Sunada, Y.; Imamura, T.; Rinoie, K. Experimental and numerical flow analysis around circular cylinders using POD and DMD. In Proceedings of the 44th AIAA Fluid Dynamics Conference; 2014; p. 3325. [Google Scholar]
  36. Hemati, M.S.; Rowley, C.W.; Deem, E.A.; Cattafesta, L.N. De-biasing the dynamic mode decomposition for applied Koopman spectral analysis of noisy datasets. Theoretical and Computational Fluid Dynamics 2017, 31, 349–368. [Google Scholar] [CrossRef]
  37. Erichson, N.B.; Mathelin, L.; Kutz, J.N.; Brunton, S.L. Randomized dynamic mode decomposition. SIAM Journal on Applied Dynamical Systems 2019, 18, 1867–1891. [Google Scholar] [CrossRef]
  38. Jovanović, M.R.; Schmid, P.J.; Nichols, J.W. Sparsity-promoting dynamic mode decomposition. Physics of Fluids 2014, 26, 024103. [Google Scholar] [CrossRef]
  39. Guéniat, F.; Mathelin, L.; Pastur, L.R. A dynamic mode decomposition approach for large and arbitrarily sampled systems. Physics of Fluids 2015, 27, 025113. [Google Scholar] [CrossRef]
  40. Mengmeng, W.; Zhonghua, H.; Han, N.; Wenping, S.; Le Clainche, S.; Ferrer, E. A transition prediction method for flow over airfoils based on high-order dynamic mode decomposition. Chinese Journal of Aeronautics 2019, 32, 2408–2421. [Google Scholar]
  41. Qiu, R.; Huang, R.; Wang, Y.; Huang, C. Dynamic mode decomposition and reconstruction of transient cavitating flows around a Clark-Y hydrofoil. Theoretical and Applied Mechanics Letters 2020, 10, 327–332. [Google Scholar] [CrossRef]
  42. Heft, A.I.; Indinger, T.; Adams, N.A. Experimental and numerical investigation of the DrivAer model. In Proceedings of the Fluids Engineering Division Summer Meeting; American Society of Mechanical Engineers, 2012; Volume 44755, pp. 41–51. [Google Scholar]
  43. Matsumoto, D.; Haag, L.; Indinger, T. Investigation of the unsteady external and underhood airflow of the DrivAer model by dynamic mode decomposition methods. International Journal of Automotive Engineering 2017, 8, 55–62. [Google Scholar] [CrossRef]
  44. Ahmed, S.R.; Ramm, G.; Faltin, G. Some salient features of the time-averaged ground vehicle wake. SAE Transactions 1984, 473–503. [Google Scholar]
  45. Uddin, M.; Nichols, S.; Hahn, C.; Misar, A.; Desai, S.; Tison, N.; Korivi, V. Aerodynamics of Landing Maneuvering of an Unmanned Aerial Vehicle in Close Proximity to a Ground Vehicle. Technical Report 2023-01-0118; SAE Technical Paper; United States, 2023. [Google Scholar]
  46. Lienhart, H.; Becker, S. Flow and turbulence structure in the wake of a simplified car model. SAE transactions 2003, 785–796. [Google Scholar]
  47. Misar, A.S. Insight into the Aerodynamics of Race and Idealized Road Vehicles Using Scale-Resolved and Scale-Averaged CFD Simulations. PhD thesis, University of North Carolina Charlotte, 2023, unpublished. [Google Scholar]
  48. Dylewsky, D.; Tao, M.; Kutz, J.N. Dynamic mode decomposition for multiscale nonlinear physics. Physical Review E 2019, 99, 063311. [Google Scholar] [CrossRef] [PubMed]
  49. Tu, J.H. Dynamic mode decomposition: Theory and applications. PhD thesis, Princeton University, 2013. [Google Scholar]
  50. Kou, J.; Zhang, W. An improved criterion to select dominant modes from dynamic mode decomposition. European Journal of Mechanics-B/Fluids 2017, 62, 109–129. [Google Scholar] [CrossRef]
  51. Misar, A.S.; Uddin, M. Effects of Solver Parameters and Boundary Conditions on RANS CFD Flow Predictions over a Gen-6 NASCAR Racecar. Technical Report 2022-01-0372; SAE WCX Technical Paper; United States, 2022. [Google Scholar]
  52. Shur, M.L.; Spalart, P.R.; Strelets, M.K.; Travin, A.K. A hybrid RANS-LES approach with delayed-DES and wall-modelled LES capabilities. International journal of heat and fluid flow 2008, 29, 1638–1649. [Google Scholar] [CrossRef]
  53. Gritskevich, M.S.; Garbaruk, A.V.; Schütze, J.; Menter, F.R.; et al. Development of DDES and IDDES formulations for the k-ω shear stress transport model. Flow Turbulence and Combustion 2012, 88, 431. [Google Scholar] [CrossRef]
  54. Spalart, P.R. Comments on the Feasibility of LES for Wings and on the Hybrid RANS/LES Approach. In Proceedings of the First AFOSR International Conference on DNS/LES; 1997; pp. 137–147. [Google Scholar]
  55. Spalart, P.R.; Streett, C. Young-person’s guide to detached-eddy simulation grids. Technical report, NASA, NASA STI Help Desk NASA Center for AeroSpace Information 7121 Standard Drive Hanover, MD 21076-1320, 2001.
  56. Spalart, P.R.; Deck, S.; Shur, M.L.; Squires, K.D.; Strelets, M.K.; Travin, A. A new version of detached-eddy simulation, resistant to ambiguous grid densities. Theoretical and computational fluid dynamics 2006, 20, 181–195. [Google Scholar] [CrossRef]
  57. Piomelli, U.; Balaras, E. Wall-layer models for large-eddy simulations. Annual review of fluid mechanics 2002, 34, 349–374. [Google Scholar] [CrossRef]
  58. Menter, F.R. Two-equation eddy-viscosity turbulence models for engineering applications. AIAA journal 1994, 32, 1598–1605. [Google Scholar] [CrossRef]
  59. Menter, F. Zonal two equation turbulence models for aerodynamic flows. In Proceedings of the 23rd fluid dynamics, 778 plasmadynamics, and lasers conference; 1993; p. 2906. [Google Scholar]
  60. Menter, F.R.; Kuntz, M.; Langtry, R. Ten years of industrial experience with the SST turbulence model. Turbulence, heat and mass transfer 2003, 4, 625–632. [Google Scholar]
  61. Zhang, C.; Bounds, C.P.; Foster, L.; Uddin, M. Turbulence modeling effects on the CFD predictions of flow over a detailed full-scale sedan vehicle. Fluids 2019, 4, 148. [Google Scholar] [CrossRef]
  62. Aultman, M.; Wang, Z.; Duan, L. Effect of time-step size on flow around generic car models. Journal of Wind Engineering and Industrial Aerodynamics 2021, 219, 104764. [Google Scholar] [CrossRef]
  63. Misar, A.S.; Bounds, C.; Ahani, H.; Zafar, M.U.; Uddin, M. On the Effects of Parallelization on the Flow Prediction around a Fastback DrivAer Model at Different Attitudes. Technical Report 2021-01-0965; SAE WCX Technical Paper; United States, 2021. [Google Scholar]
  64. Daily, J.W.; James, W.; Harleman, D.R.; et al. Fluid dynamics; Addison-Wesley, 1966. [Google Scholar]
  65. Fu, C.; Bounds, C.P.; Selent, C.; Uddin, M. Turbulence modeling effects on the aerodynamic characterizations of a NASCAR Generation 6 racecar subject to yaw and pitch changes. Proceedings of the Institution of Mechanical Engineers, Part D: Journal of Automobile Engineering 2019, 233. [Google Scholar] [CrossRef]
  66. Hunt, J.C.; Wray, A.A.; Moin, P. Eddies, streams, and convergence zones in turbulent flows. In Studying turbulence using numerical simulation databases, 2. Proceedings of the 1988 summer program; 1988. [Google Scholar]
  67. Fu, C.; Uddin, M.; Zhang, C. Computational Analyses of the Effects of Wind Tunnel Ground Simulation and Blockage Ratio on the Aerodynamic Prediction of Flow over a Passenger Vehicle. Vehicles 2020, 2, 318–341. [Google Scholar] [CrossRef]
  68. Altinisik, A.; Kutukceken, E.; Umur, H. Experimental and numerical aerodynamic analysis of a passenger car: Influence of the blockage ratio on drag coefficient. Journal of Fluids Engineering 2015, 137. [Google Scholar] [CrossRef]
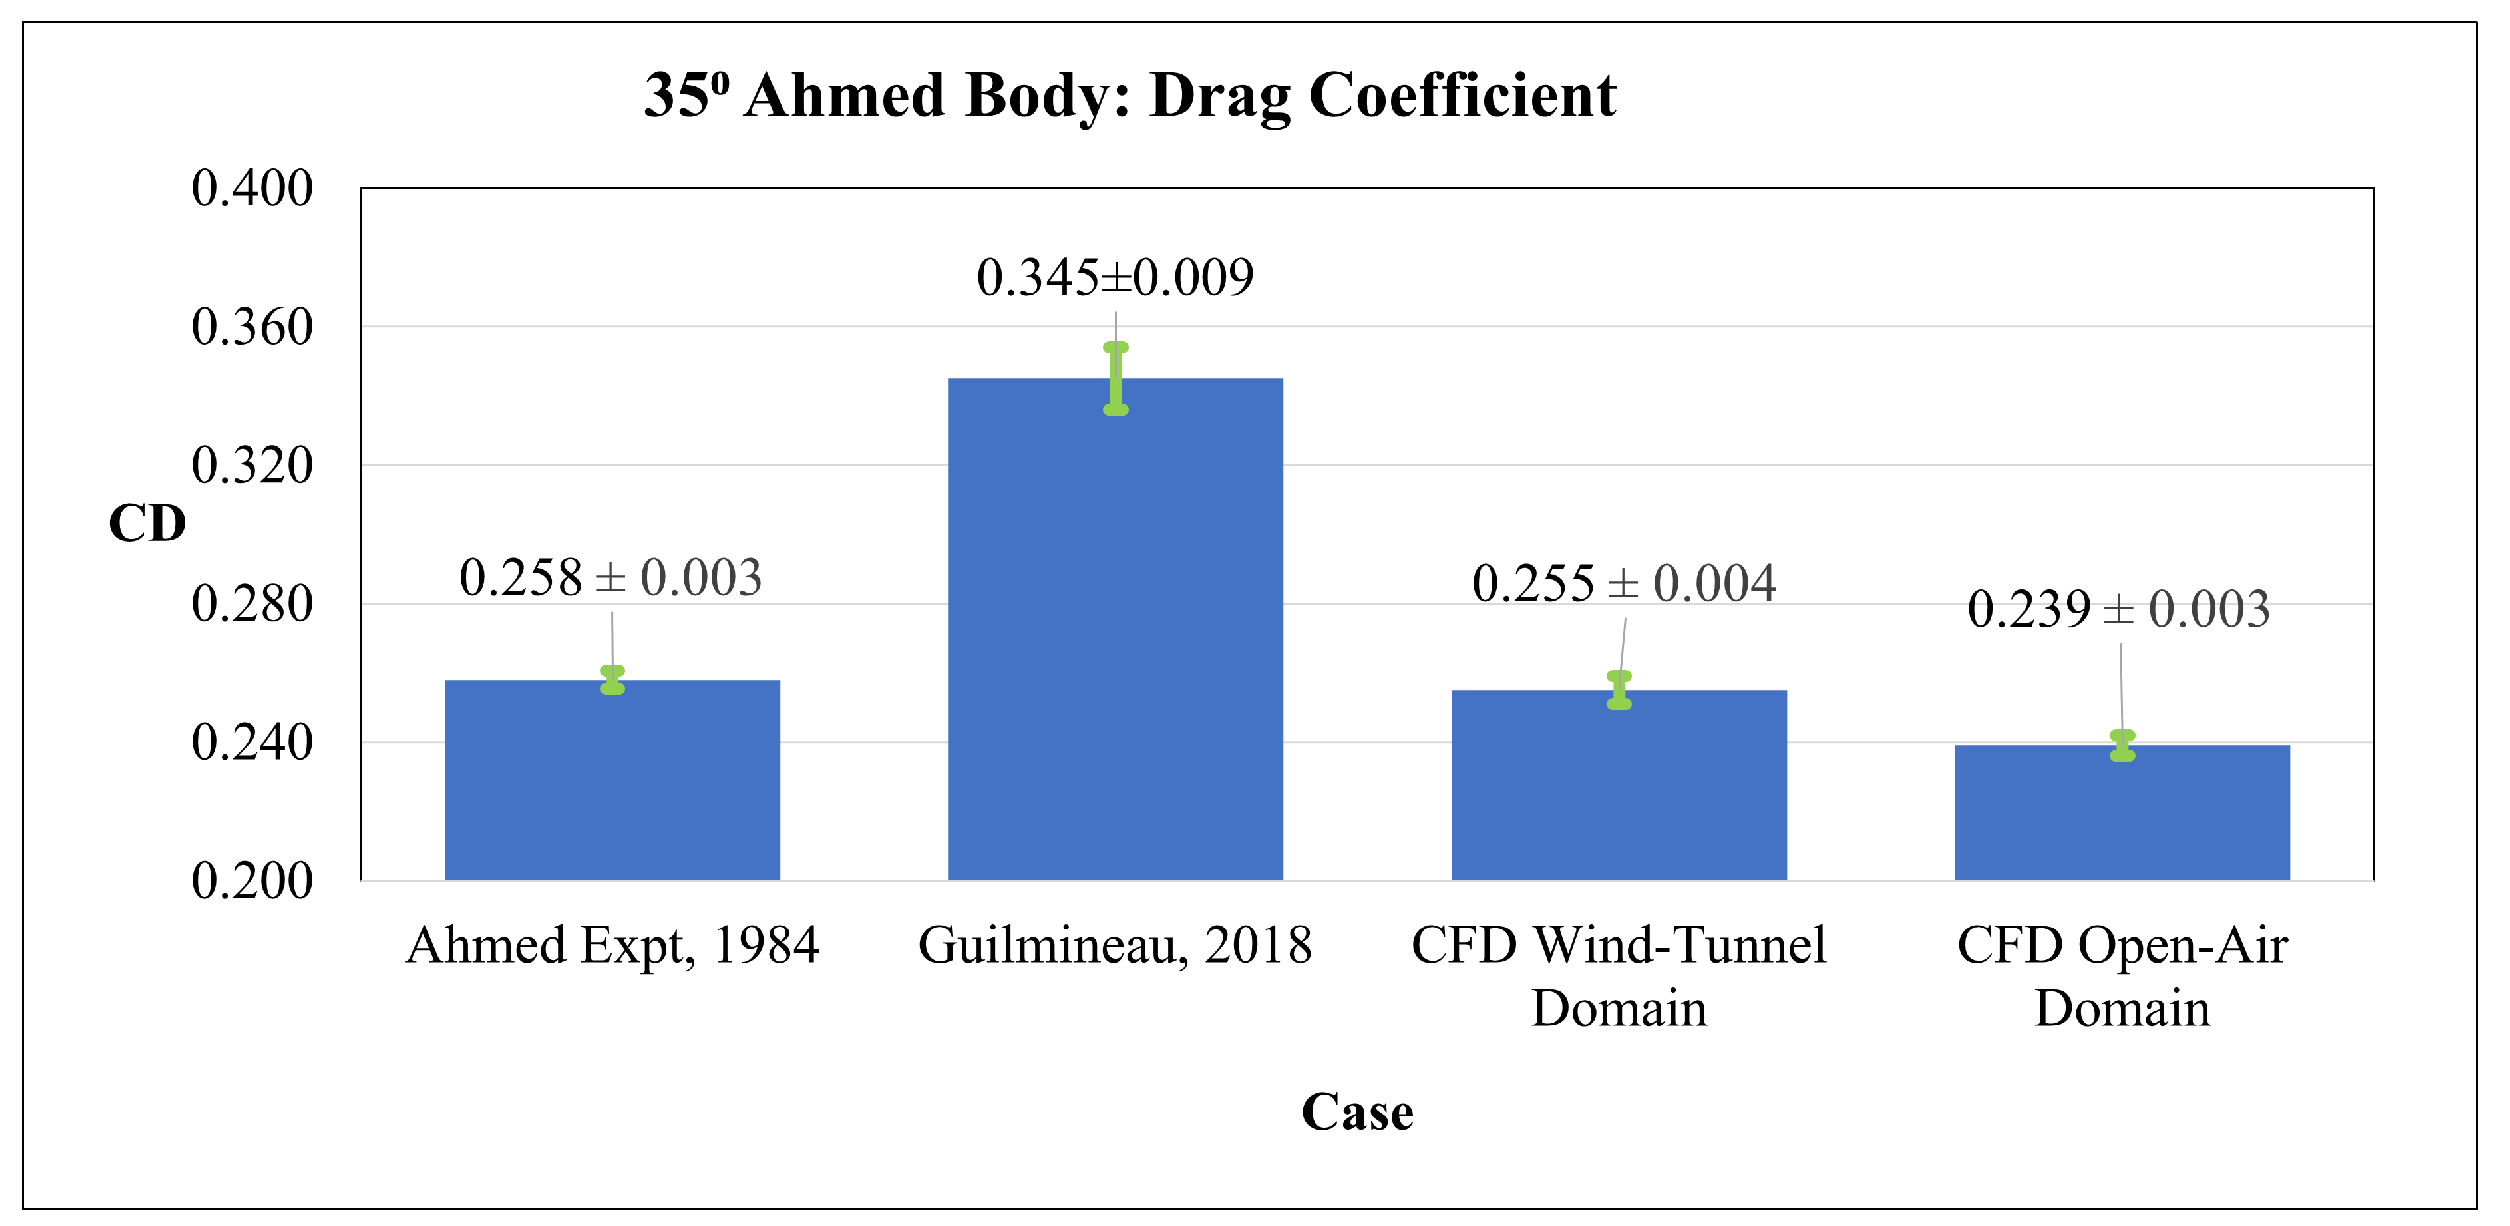
Figure 1. Validation of the CFD simulation approach and methodology.
Preprints 72070 g001
Figure 2. Instantaneous Normalized streamwise velocity for flow past a 2D cylinder: Figure 2. Instantaneous Normalized streamwise velocity for flow past a 2D cylinder: (a) CFD prediction, (b) DMD re-construction and (c) the difference between (b) and (a).
Preprints 72070 g002
Figure 9. Mean of surface C p as obtained using data sampled at 10 kHz. (a) Mean of DMD, (b) Mean of CFD, (c,d) difference between mean of DMD and mean of CFD, where (d) bottom-right isometric view.
Preprints 72070 g009
Figure 10. RMS of the fluctuating component of surface C p as obtained using data sampled at 10 kHz: (a) DMD; (b) CFD; (c) difference between (a) and (b); (d) same as (c), but bottom-right isometric view.
Preprints 72070 g010
Figure 13. Mean surface C p distribution, with 10kHz sampling and custom filtering: (a) DMD; (b) CFD (c and d) difference between (a) and (b).
Preprints 72070 g013
Figure 17. Differences between future predictions of DMD and CFD data: (a) delta of force coefficients, (b) delta of moment coefficients; delta implies the difference between the DMD predictions and CFD values.
Preprints 72070 g017
Figure 18. PSD of future predictions of DMD relative to known CFD data; coefficients of (a) drag, (b) lift, (c) sideforce, (d) pitching moment, (e) rolling moment, and (f) yawing moment.
Preprints 72070 g018
Table 1. Mean of all aerodynamic coefficients and RMS of their fluctuations as obtained from CFD simulation and DMD reconstruction.
C D C L C S C P M C R M C Y M
Mean (CFD) 0.220 -0.062 -0.002 0.019 0.000 0.000
Mean (DMD) 0.220 -0.062 -0.002 0.019 0.000 0.000
RMS (CFD) 0.003 0.012 0.006 0.004 0.002 0.001
RMS (DMD) 0.003 0.012 0.006 0.004 0.001 0.002
Table 2. Mean of all aerodynamic coefficients and RMS of their fluctuations as obtained from CFD simulation and a future prediction by a DMD based ROM.
C D C L C S C P M C R M C Y M
Mean (CFD) 0.220 -0.059 -0.001 0.022 0.000 -0.001
Mean (DMD) 0.218 -0.065 -0.001 0.018 0.000 -0.001
RMS (CFD) 0.002 0.011 0.005 0.003 0.001 0.001
RMS (DMD) 0.001 0.011 0.005 0.003 0.001 0.001
Disclaimer/Publisher’s Note: The statements, opinions and data contained in all publications are solely those of the individual author(s) and contributor(s) and not of MDPI and/or the editor(s). MDPI and/or the editor(s) disclaim responsibility for any injury to people or property resulting from any ideas, methods, instructions or products referred to in the content.
Copyright: This open access article is published under a Creative Commons CC BY 4.0 license, which permit the free download, distribution, and reuse, provided that the author and preprint are cited in any reuse.
Prerpints.org logo

Preprints.org is a free preprint server supported by MDPI in Basel, Switzerland.

Subscribe

© 2024 MDPI (Basel, Switzerland) unless otherwise stated