
Submitted:
28 April 2023
Posted:
28 April 2023
You are already at the latest version
Abstract
It is known that people perceive animacy in objects. However, many studies on animacy and emotional expressions are limited in that the investigated motions were created by experimenters themselves. This makes the objective validity unclear. Moreover, it remains unclear what types of movements can express emotions with animacy due to the limited number of investigations examining both animacy and emotional expressions. Therefore, we investigated the motion elements for both animacy perception and emotional expressions using simple objects that lack features of specific living things, such as eyes, ears, tails, and voices in this study. First, we investigated the motion elements for animacy perception and emotional expressions using a robot simulator that enabled participants to create undulatory motions by tuning parameters for speed, height, and randomness. In total, 64 participants created motions in Normal (neutral), Joy, Sad, Relaxed, and Angry conditions. The results showed that the medians of speed and height in Normal, related only to animacy, were 0.5569[Hz] and 3.050cm at the edges/4.575cm at the center. The differences in Joy were 0.4028[Hz] and 3.348cm/5.022cm, in Sad were −0.1652[Hz] and −0.9982cm/−1.497cm, in Relaxed were −0.1979[Hz] and −0.4902cm/−0.7353cm, and in Angry were 0.5212[Hz] and 4.688cm/7.032cm. Second, we investigated whether the motion elements revealed in the first experiment were sufficient to express emotions with animacy, using a robot simulator that reflected the results of the motion element investigation. In total, 44 online participants observed the simulator. The results showed that participants could understand emotional arousal levels at the same time as animacy, but they did not fully understand emotional valence. Our findings provide design guidelines for robots that exhibit emotional expressions and closely interact with humans.
Keywords:
Human Robot Interaction
; Cognition
; Emotion
; Animacy
; Affective Engineering
1. Introduction
Robots that exhibit emotional expressions and closely interact with humans, such as pet-type robots, are expected to be applied to promote human behavior in living spaces due to their psychological, physiological, and social effects on humans [1,2,3,4]. There are many situations in daily life where actions should be encouraged, such as ventilation to prevent infections and regular exercise to prevent lifestyle diseases. The utilization of pet-type robots, which possess behavior-promoting effects, is expected to encourage appropriate behaviors effectively.
However, people often feel a sense of discomfort or disappointment when robots resemble familiar living things but have slight physical differences or lower abilities than expected [5,6]. This problem can potentially reduce the psychological, physiological, and social effects of pet-type robots, thereby diminishing their expected capacity to promote behavior. Furthermore, it is also a problem that familiar living things differ among people.
Minato et al. [7] developed a teleoperated android named Elfoid, which could convey humanity with minimal elements and can be recognized as various ages and genders. While their study focused on humanity through the robot’s appearance, living things also contain dynamic elements. Hieida et al. [8] demonstrated that robots could express emotions solely through traveling motion. Although their study focused on emotional expressions through the traveling motions of the airborne flying robot, such motions are often undesirable in the real environment with limited space and many objects. Inspired by these previous studies, we aim to reveal motion elements to express emotions with animacy without associating with specific living things. Here, animacy is defined as the feeling that the subject has life. We can propose design guidelines for robots to address the challenges of pet-type robots and obtain the required effects by taking this approach.
In this study, we aim to reveal the motion elements necessary for animacy perception and emotional expressions through the undulatory motions of simple objects without specific living things’ features, such as eyes, ears, tails, or voices. Many previous studies had predetermined the movements assumed to evoke animacy perception by the experimenters themselves. There are rarely studies investigating both (1) the design of motions by participants that convey a sense of animacy and (2) whether other participants can recognize those motions as having animacy. Therefore, we conduct experiments focusing on these two aspects to reveal the motion elements required to express emotions with animacy. In this paper, we report on two experiments conducted for this motivation. First, we focus on objects that move vertically in a fixed position and reveal the motion elements necessary for animacy perception and emotional expressions. In total, 64 participants operated a robot simulator to produce vertical undulatory motions by tuning the parameters of speed, height, and randomness. Second, we reveal whether the motions demonstrated in the simulator experiment are sufficient to express emotions with animacy. In total, 44 online participants observed the movements designed by other participants and evaluated animacy and emotions. This allowed us to determine whether these motion elements were sufficient to express emotions with animacy. The contributions of this study are as follows:
- The motion elements necessary for animacy perception and emotional expressions are revealed by having participants design the movements.
- The motion elements identified in the simulator experiment are revealed whether sufficient to express emotions with animacy by having other participants observe movements.
- Through the two experiments, we showed that the median of speed required for animacy was , the median of height was at the edges/ at the center, the difference in each of these values was mainly related to emotional expression, and it was possible to express high and low arousal levels with these elements.
2. Related Work
2.1. Animacy perception
Various studies have demonstrated that people could perceive animacy from the appearance and traveling motions of robots or objects, even with minimal elements. Minato et al. [7] developed a teleoperated android called Elfoid that could be perceived as humanity with minimal elements and recognized as various ages and genders. Through a psychological experiment, they demonstrated that people felt their partner’s presence closely, even with only the body and head.
Heider et al. [9] conducted an experiment in which participants observed videos presenting the traveling motions of three types of geometrical diagrams in various directions and speeds. The results showed that many participants described the diagrams as if they were living things. Tremoulet et al. [10] reported that changes in the shape, speed, and direction of a single object within a region influenced animacy perception. The experiment revealed that people were more likely to perceive animacy from objects with increased changes in speed and direction. Chang et al. [11] demonstrated that people could perceive animacy from the traveling motions of scrambled point-lights, and that animacy perception depends on the direction of the motion. Nakayama et al. [12] developed a cubic robot with a linear movable system. Their experiment suggested that people could perceive animacy from the robot’s simple linear motions. Moreover, they reported that people could perceive animacy more strongly when the robots interacted with each other. Fukai et al. [13] focused on animacy from the traveling motions of dots and analyzed the randomness, inanimacy, and animacy of the motions created by participants. The experiment revealed that pink noise and white noise were related to animacy. These studies demonstrated that people could perceive animacy from the motion of a single object without features of specific living things, such as eyes, ears, tails, and voices.
As the common issues across these studies, while they limited to free traveling motions, in the real environment, there are many situations where free traveling is not desirable, such as narrow spaces like a desk or places with many objects. In addition, many studies only used motions assumed to evoke animacy perception, which had been designed by the experimenters themselves.
Our thoughts are described below based on these related studies. Inspired by these studies, we suppose that people can perceive animacy from the simple motions of objects. Therefore, we focus on the vertical undulatory motion of curved surfaces without features of specific living things. We think that this motion can convey roundness and breathing, which are common features in living things. Moreover, we can deeply investigate the elements of animacy perception by having participants create motions using the robot simulator. Furthermore, we expect that our findings can be broadly applied in various situations in the future by limiting the object’s motion in place.
2.2. Emotional expression
Various studies on emotional expressions through the motions of robots and objects have shown that emotions could be conveyed to people by only motion. Hieida et al. [8] conducted an experiment in which participants observed videos of actions that could express emotions created by other participants. The results revealed that people could understand emotions from the flying robot’s movements. This study focused on the robot’s movements in the air. Santos et al. [14] demonstrated that swarm robots’ movements and interactions expressed emotions at a level that people could recognize through an experiment. Jafarinaimi et al. [15] developed a system called “Breakaway” to encourage behavioral change through linear motions without traveling. The experiment showed that differences in the intensity of the object’s curve could express states, such as sleepiness and fatigue. Hu et al. [16] investigated emotional expressions through changes in the robot’s skin texture and amplitude and period at that time. Their experiment revealed that emotions could be expressed in each case of watching the video, observing motion, and touching the system. Tan et al. [17] investigated emotional expressions through the shape-changing interface created by the experimenters based on the theory of the relationship between biological motions and emotions. The experiment showed that emotions could be expressed through motion and kinetic variables such as speed and direction had a greater impact on emotional evaluation. These studies demonstrated that emotions could be expressed through motion, even if the robots or objects did not have features of specific living things, and regardless of whether they had traveling movements.
As the common issues in these studies, many studies on motions for emotional expressions did not consider animacy perception simultaneously. Even when both emotional expressions and animacy perception were studied, many studies on animacy perception were conducted using motions that had been designed by the experimenters themselves to convey animacy. In this study, we investigate the motion elements necessary for both animacy perception and emotional expressions by an objective method. These two successive investigations can reveal the fundamental motions that express both animacy and emotions, which can be used to propose design guidelines for pet-type robots.
3. Experiment 1: Motion Elements for Animacy Perception and Emotional Expressions
There are two objectives in this experiment. The one is to reveal motion elements that induce animacy perception. The other is to reveal motion elements to express emotions with animacy. In this section, we describe the method and the results of the experiment.
3.1. Method
3.1.1. Our approach
In this experiment, we built and used a robot simulator that allowed participants to create motions by their operations to achieve the objectives. There were three reasons for this approach. First, it was to reveal motion elements for animacy perception that did not solely depend on the experimenter’s subjective impression. Depending solely on the experimenter’s subjective impression, it may introduce unconscious biases to reveal motion elements for animacy perception. Therefore, we built a robot simulator that allowed participants to tune multiple parameters to reveal motion elements that people generally perceived as animacy. Second, it was to collect quantitative data related to motion elements for both animacy perception and emotional expressions. We aim to broadly apply the findings of this study to robots in the future. Collecting quantitative as well as qualitative data is beneficial for this purpose. Third, it was to investigate various motions more readily and cost-effectively than with an actual device. Creating various motions by freely tuning multiple parameters takes substantial costs, such as time, effort, and money when using the actual device. Using a robot simulator enables us to experiment with various motions readily since we can address any issues by rewriting the program.
3.1.2. Simulator implementation
The robot simulator worked on a PC, and the screen appeared on a stationary monitor. Participants could control the simulator using their mouse. We used Unity, a game engine with an integrated development environment (IDE), to build the robot simulator. The individual components of the robot simulator are described below.
Graphical user interface: The screenshot of the robot simulator is shown in Figure 1. The simulator contained widgets for motion control and experiment instructions within the Unity-created scene. The object operated by participants was designed to resemble something that could be placed on a desk at home. Office Room Furniture [18] was downloaded from Unity Asset Store and applied as the room environment to provide participants with a sense of the object’s size. We confirmed with Unity Technologies Japan that it was permissible to use this asset in our study and publish the screenshots in the present paper. The sliders used for tuning motion parameters are shown in Figure 2. Participants used these sliders on the screen to tune the parameters and create motions.
Object motion visualization: We focused on the motions of an object installed in a narrow space, such as a desk, and assumed that these motions would be achieved using linear actuators [19,20,21]. The object’s motion was designed to express the assumed behavior. Specifically, we used the cuboid with dimensions of ××, consisting of 242 cubes with long sides arranged in a vertical × horizontal configuration of 11 × 22 cubes. This configuration was chosen based on empirical evidence indicating that it would provide a better representation of the motions.
Object motion synthesis: Here, the equations and parameters used for synthesizing the object’s motion are described. First, the basic settings related to the object’s fundamental motions are outlined. Vertical movement in each cube was employed to express the discrete undulatory motions of curved surfaces, which was achieved using sin waves. The phase and height differences were set empirically to represent smoother curved surfaces. The motion of each cube was designed with a phase difference of 2 degrees and 10 degrees from the edge to center, both forward and backward, and left and right, respectively. Setting the height lower at the edges and higher at the center resulted in a smoother, more rounded object specific to living things. Therefore, the maximum height of each cube was designed so that both edges were , increasing by toward the center. The basic equation used to describe the vertical motions was based on the sin wave formula and the settings mentioned above. The equation is
where y is height of cubes, h is the maximum height, f is frequency (, where T is the period), is the angle, is the phase difference in forward and backward (), and is the phase difference in left and right ().
Second, the parameters tuned by participants are described. Speed and height were included as parameters because they were fundamental elements for the undulatory motion of curved surfaces. Additionally, the randomness which was found to contribute to animacy in previous studies [13,22] was also added as the parameter. Randomness could be applied to both the amplitude and period of motion. Participants could tune the type (none, 1/f noise, or normal random numbers), intensity, and frequency (low or high). The range and frequency for each parameter were empirically selected by the experimenter to achieve more natural motions. Details for each parameter are described below.
Speed: Speed was a continuous value ranging from 0 to 10 times the basic speed. The basic speed was approximately in terms of frequency.
Height: Height was a continuous value ranging from 0 to 5 times the basic height. The basic height was on both edges and on the center and incremented by from the edge to the center.
Randomness: The types of randomness included none (“0” in Figure 2 ), 1/f noise (“1” in Figure 2), and normal random numbers (“2” in Figure 2). 1/f noise was calculated by the intermittent chaos method [23]. The formula was devised based on [24] to be suitable for this experiment. The initial value was set to 0.1. As the calculated value approached the end of the interval, the fluctuations became smaller, causing the motion to almost disappear. The value was randomly set in the interval (0, 1) when it was less than 0.005 or more than 0.995 to prevent the motion from disappearing. The calculated value was multiplied by a random factor of or and added to the object’s motion in the vertical direction. The calculation algorithm of 1/f noise in this experiment is below.
| Algorithm 1: Calculate 1/f noise |
|
Normal random numbers were generated by Box–Muller’s method [25] and added to the motion in the vertical direction. The calculation algorithm for generating normal random numbers by Box–Muller’s method is
where w is the value of normal random numbers, and are independent probability variables formed by the same rectangular density function on the interval (0, 1).
The intensity of randomness was the continuous value between 0.1 and 2 times the basic value in each type of randomness. The basic value means the random value calculated by the algorithms of the intermittent chaos method and Box–Muller’s method for 1/f noise and normal random numbers, respectively.
The frequency of randomness included low (“0” in Figure 2) and high (“1” in Figure 2). For low frequency, randomness was added if the calculated uniform number in the interval (1, 10) was less than 1.5. In other words, the frequency of added randomness was approximately 5.6%. For high frequency, randomness was added whenever the calculated uniform number was equal to or more than 1.5.
Finally, the equations with added parameters to Equation (3.1) are below. The equation with added parameters of speed and height is
where a is the multiplying factor of the maximum height, and b is the multiplying factor of speed. The equations with added randomness to the amplitude are
when the type is 1/f noise, and
when the type is normal random numbers, where p is 1/f noise, w is normal random numbers, and s is the intensity of randomness. The equations with added randomness to the period are
when the type is 1/f noise, and
when the type is normal random numbers.
3.1.3. Experimental setup
The configuration of the system used in this experiment is shown in Figure 3. In this experiment, participants were called from our laboratory and online. Participants from our laboratory were called using Slack application 1 [26]. Online participants were called using Amazon Mechanical Turk (MTurk) 2 [27]. Therefore, experimental systems were built to suit each location. The entire experiment was conducted on an Internet browser without the presence of the experimenter. The experimental systems were built to allow us to conduct it online. The web-based experiment system included the robot motion simulator, recording function for parameter values, questionnaire, and operation manual. This system was available on unityroom [28]. The recording function for parameter values was allowed using NIFCLOUD mobile backend (NCMB) [29]. The data was recorded after participants had finished tuning the parameters in each task. The questionnaire was created on Google Forms™ [30] and was displayed in another tab of the Internet browser after participants had finished tuning the parameters in each task. For the MTurk version of the experiment, necessary functions were added to these basic functions. The necessary functions included the functions for obtaining the consent form before the experiment and displaying the final password after participants input their own WorkerID. WorkerID and the final password were needed to confirm whether participants completed all tasks or not. The URL of unityroom including the experimental system was shared on Slack application and MTurk to call for participants from our laboratory and online participants, respectively.
3.1.4. Procedure
The experiment was conducted in the following steps.
- Read the experiment instruction and responded to the consent form.
- Read through the operation manual of the system.
- Practiced the simulator operation for three minutes.
- Executed each task.
- Answered questionnaire about motions in each task.
- Repeated steps 3 to 4.
In this experiment, we used the term “organic-like” as a substitute for animacy because we thought animacy was an unfamiliar term for most people. Participants tuned parameters to create the “organic-like” motion that expressed the designated emotion in each experimental task. The emotions for each task were decided by referring to Russell’s Circumplex Model [31]. Joy (JY), Sad (SD), Relaxed (RL), and Angry (AG) were chosen as representative emotions for four quadrants of the model. Additionally, Normal (NM) was included as a neutral emotion that was not applicable to the other four emotions. The placement of these five emotions is shown in Figure 4. The y axis represents arousal level, with “sleepy” in the negative direction, and “arousal” in the positive direction. The x axis represents valence, with “displeasure” in the negative direction, and “pleasure” in the positive direction. This experiment consisted of five tasks below.
- Task 1
- To create “organic-like” motion expressing “Normal (NM)” state
- Task 2
- To create “organic-like” motion expressing “Joy (JY)” state
- Taks 3
- To create “organic-like” motion expressing “Sad (SD)” state
- Task 4
- To create “organic-like” motion expressing “Relaxed (RL)” state
- Task 5
- To create “organic-like” motion expressing “Angry (AG)” state
All participants first performed Task 1 related to the Normal (neutral) state, which was the baseline of the motion. They performed Task 2, Task 3, Task 4, and Task 5 in a randomized order to avoid any order effects after Task 1.
Participants answered a questionnaire after each task, with the items that are shown in Table 1. Q1 to Q6 were asked to understand participants’ attitudes towards living things and their intentions when creating the motion. Q7 to Q9 were asked to find the importance of each parameter for “organic-like” motion. Q10 was included to assess the degree to which participants felt the motion was “organic-like” when they completed each task. Q4 (b) and Q7 to Q10 were rated on a 7-point Likert scale (1: strongly disagree, 7: strongly agree). A video demonstrating the experimental system used in this experiment is available in the Supplementary Materials.
3.1.5. Participants
Participants were recruited from both our laboratory and online. Participants from our laboratory belonged to different groups with the experimenter and were unaware of the experiment’s objectives. Online participants were recruited under the condition that the approval rate for their past HITs on MTurk was equal to or more than 95% based on the previous case [32], and they were offered a reward of 8 US dollars after completion of all the tasks. In total, 118 participants (18 from the laboratory and 100 online) participated in the experiment. Valid data were obtained from 64 participants, comprising 13 laboratory participants (8 Japanese, 4 Chinese, and 1 Thai; 11 males and 2 females; mean ages: 23.8 ) and 51 online participants (48 American, 2 Brazilian, 1 Estonian, and 1 German; 31 males and 20 females; mean ages: 34.7 ). The valid data means each participant completed all the experimental tasks and the questionnaires provided in the experiment. For MTurk participants, valid data also means each participant inputs the correct WorkerID, which is necessary to be offered the reward, and the correct final password. The parameter values in each task and questionnaire responses after each task were collected by the experimenter during the experiment. No time limit was imposed on laboratory participants, while online participants were given a time limit of 1 hour based on a previous pilot study. Participants in both groups who completed all the tasks finished them within 30 minutes to 1 hour.
3.2. Results
3.2.1. Motion elements for animacy perception
Speed: The result of the speed is shown in Figure 5a. The median was 3.498 [times] which was equivalent to .
Height: The result of the height is shown in Figure 5b. The median was 1.525 [times], which was equivalent to when the basic height was and when the basic height was .
Randomness: The results of the type and frequency of randomness are shown in Table 2. For the amplitude, the highest percentage of 56.3% of participants selected none. Participants who chose 1/f noise and normal random numbers were 35.9% and 7.81%, respectively. Participants who chose low and high frequencies were 23.4% and 12.5%, respectively, in participants who selected 1/f noise. Participants who chose low and high frequencies were 4.69% and 3.13%, respectively, in participants who selected normal random numbers. For the period, the highest percentage of 71.9% of participants selected none. Participants who chose 1/f noise and normal random numbers were 20.3% and 7.81%, respectively. Participants who chose low and high frequencies were 12.5% and 7.81%, respectively, in participants who selected 1/f noise. Participants who chose low and high frequencies were 6.25% and 1.56%, respectively, in participants who selected normal random numbers. The result of the intensity of randomness is shown in Figure 6. For the amplitude, the medians were 0.6974 [times] and 0.8353 [times] for 1/f noise and normal random numbers, respectively. For the period, the medians were 1.008 [times] and 1.646 [times] for 1/f noise and normal random numbers, respectively.
Importance of each parameter: The score of the importance of each parameter is shown in Figure 7. The medians in speed, height, and randomness were 6, 5, and 4, respectively. The Friedman test revealed a significant difference among the three conditions (). A post-hoc analysis by Wilcoxon signed-rank sum test with BH (Benjamini-Hochberg) method showed significant differences between speed and height, and height and randomness (). A significant difference was also found between speed and height ().
3.2.2. Motion elements for expressing emotions
Speed: The differential values for speed are shown in Figure 8. Each value represents the difference in magnification from the NM condition. The medians of the differential values in JY, SD, RL, and AG were 2.530, −1.038, −1.243, and 3.274, which were equivalent to , , , and , respectively, in terms of frequency. The Friedman test revealed a significant difference among the four conditions (). A post-hoc analysis by Wilcoxon signed-rank sum test with the BH method showed significant differences between JY and SD, JY and RL, SD and AG, and RL and AG (). A significant difference was also found between JY and AG ().
Height: The differential values for height are shown in Figure 9. Each value represents the difference in magnification from the NM condition. The medians of the differential values in JY, SD, RL, and AG were 1.674, −0.4991, −0.2451, and 2.344, respectively, which were equivalent to , , , and when the basic height was and , , , and when the basic height was . The Friedman test revealed a significant difference among the four conditions (). A post-hoc analysis by Wilcoxon signed-rank sum test with the BH method showed significant differences between JY and SD, JY and RL, JY and AG, SD and AG, and RL and AG (). A significant difference was also found between JY and AG ().
Randomness: The differences in the type and frequency are shown in Table 3. Each value demonstrates the difference between numbers. The larger and smaller numbers mean the increase and decrease from the NM condition, respectively.
For the amplitude, the differences in numbers who selected none in JY, SD, RL, and AG were −2, −4, 6, and −17, respectively. Those who selected 1/f noise in JY, SD, RL, and AG were 0, 0, −8, and 5, respectively. The differences in numbers who chose low frequency in JY, SD, RL, and AG were −2, −1, −6, and −8, respectively, and those who chose high frequency in JY, SD, RL, and AG were 2, 1, −2, and 13, respectively, in participants who selected 1/f noise. The differences in numbers who selected normal random numbers in JY, SD, RL, and AG were 2, 4, 2, and 12, respectively. The differences in numbers who chose low frequency in JY, SD, RL, and AG were 1, 2, 1, and 0, respectively, and those who chose high frequency in JY, SD, RL, and AG were 1, 2, 1, and 12, respectively, in participants who selected normal random numbers.
For the period, the differences in numbers who selected none in JY, SD, RL, and AG were −4, −2, 0, and −21, respectively. Those who selected the 1/f noise in JY, SD, RL, and AG were −3, 2, 1, and 5, respectively. The differences in numbers who chose low frequency in JY, SD, RL, and AG were −3, 2, 4, and 0, respectively, and those who chose high frequency in JY, SD, RL, and AG were 0, 0, −3, and 5, respectively, in participants who selected 1/f noise. The differences in numbers who selected normal random numbers in JY, SD, RL, and AG were 7, 0, −1, and 16, respectively. The differences in numbers who chose low frequency in JY, SD, RL, and AG were 2, 0, −2, and 1, respectively, and those who chose high frequency in JY, SD, RL, and AG were 5, 0, 1, and 15, respectively, in participants who selected normal random numbers.
The differences in the medians of the intensity from the NM condition are shown in Table 4. Each value represents the difference in magnification. For the amplitude, the values of 1/f noise in JY, SD, RL, and AG were 0.1174, 0.05656, −0.02828, and 0.2790, respectively. Those of normal random numbers in JY, SD, RL, and AG were 0.7105, 0.08837, 0.1167, and 1.106, respectively. For the period, the values of 1/f noise in JY, SD, RL, and AG were −0.04627, −0.3394, −0.3111, and −0.2545, respectively. Those of normal random numbers in JY, SD, RL, and AG were −0.2695, −0.1936, −0.4719, and 0.07095, respectively.
3.2.3. Motion expressing emotions with animacy
The scores for the degree of “organic-like” perception in the NM, JY, SD, RL, and AG conditions are shown in Figure 10. The score shows how much participants perceived the motion as “organic-like” when they finished creating it by tuning the parameters in each task. The medians of scores were 6 in all the conditions. The Friedman test revealed a significant difference among the five conditions (). A post-hoc analysis by Wilcoxon signed-rank sum test with the BH method showed no significant differences between the conditions.
4. Experiment 2: Emotion Understanding from Representative Motion Elements
We revealed the motion elements for animacy perception and emotional expressions in Experiment 1. The robot motion simulator capable of expressing emotions with animacy was created by combining these results. We investigated whether the motions obtained from Experiment 1 were sufficient to express emotions with animacy using this simulator. We explain the method and demonstrate the experimental results.
4.1. Methods
4.1.1. Our approach
In this experiment, we built a robot motion simulator reflecting parameter values in Normal (NM), Joy (JY), Sad (SD), Relaxed (RL), and Angry (AG) conditions obtained from Experiment 1. The motion simulator was observed by a distinct set of participants from Experiment 1. Participants evaluated the simulated motion in terms of animacy, emotional expressions, arousal level, and emotional valence in each condition. We aimed to reveal whether the motion elements obtained from Experiment 1 were sufficient to express emotions with animacy by this method.
The screenshot of the robot simulator is shown in Figure 11. The simulator was built by Unity, which incorporated parameters for both animacy perception and emotional expressions. The value of each parameter was decided based on the results obtained in Experiment 1. The value of each parameter is shown in Table 5. The median value in each condition was adopted for the intensity of speed, height, and randomness. The type and frequency of randomness were decided through a majority based-rule. The type was selected from either none, 1/f noise, or normal random numbers. The frequency was selected from either low or high. A video of motions reflecting the results of this experiment is included in the Supplementary Materials.
4.1.2. Simulator implementation
4.1.3. Experimental setup
The configuration of the system used in this experiment is shown in Figure 12. The entire experiment was conducted on an Internet browser, online via MTurk, without the presence of the experimenter. The experimental system was built to allow us to conduct it online. The web-based experiment system included the robot simulator, data recording function, questionnaire, consent form function, experimental instructions, WorkerID input function, and final password display function. This system was available on unityroom. The data recording function allowed to record of each participant’s consent forms, ID, and password using NCMB. This enabled us to confirm whether each participant rightly completed all experiments. The questionnaire was created on Google Forms™ and was displayed in another tab of the Internet browser after participants had observed the robot simulator in each task. The URL of unityroom including the experimental system was shared on MTurk. Participants were available to participate in the experiment from it.
4.1.4. Procedure
The experiment was conducted in the following steps.
- Read the experiment instruction and responded to the consent form.
- Read through the operation manual of the system.
- Answered the pre-questionnaire.
- Executed each task. Observed the simulator for 1 minute per each task.
- Answered the questionnaire about motions in each task.
- Repeated steps 4 to 5.
- Answered the final questionnaire.
In this experiment, we used the term “organic-like” as a substitute for animacy because we thought animacy was an unfamiliar term for most people. The emotions for each task were decided by referring to Russell’s Circumplex Model [31], which was also referred to in Experiment 1 (see Figure 4). The y axis represents arousal level, “sleepy” in the negative direction, and “arousal” in the positive direction. The x axis represents valence, “displeasure” in the negative direction, and “pleasure” in the positive direction. This experiment consisted of five tasks below.
- Task 1
- To observe the “organic-like” motion expressing “Normal (NM)” state
- Task 2
- To observe the “organic-like” motion expressing “Joy (JY)” state
- Task 3
- To observe the “organic-like” motion expressing “Sad (SD)” state
- Task 4
- To observe the “organic-like” motion expressing “Relaxed (RL)” state
- Task 5
- To observe the “organic-like” motion expressing “Angry (AG)” state
Participants performed all the tasks in a randomized order to avoid any order effects. Participants answered three types of questionnaires in this experiment. The first questionnaire was related to their attitudes toward living things and was answered before the experiment. The items of the questionnaire are shown in Table 6. The second questionnaire was related to the observed object’s motion and was answered after the end of each task. The items of the questionnaire are shown in Table 7. Q3, Q4, and Q6 were rated on a 7-point Likert scale (Q3: 1: pleasure, 7: displeasure; Q4: 1: arousal, 7: sleepy; Q6: 1: strongly disagree, 7: strongly agree). Q5 required participants to choose from NM, JY, SD, RL, and AG. The third questionnaire was related to the entire experiment and was answered after all the tasks. The items of the questionnaire are shown in Table 8. A video demonstrating the experimental system used in this experiment is available in the Supplementary Materials.
4.1.5. Participants
Participants were recruited online. They were recruited through MTurk, under the condition that they had past HITs approval rate of 95% or more [32], and had not participated in Experiment 1. Participants were offered a reward of 8 US dollars after completion of all the tasks. In total, 100 participants participated in the experiment. Valid data were obtained from 44 participants (36 American, 4 Brazilian, 2 Indian, 1 Turk, and 1 nationality unknown; 25 males, 18 females, and 1 others; mean ages: 36.0). The valid data means each participant rightly completed all the experimental tasks and the questionnaires provided in the experiment and did not provide inappropriate answers, such as inputting all “1” in both open-ended and closed-ended questions. A time limit of 2 hours was set because of considering any troubles, although the required time was approximately 30 minutes to 1 hour.
4.2. Results
4.2.1. “Organic-like” perception
The scores for the degree of “organic-like” perception are shown in Figure 13. The medians of scores were 6 in NM, JY, and SD, and 5 in AG. The Friedman test showed no significant differences.
4.2.2. Arousal level
The results of the questionnaire regarding arousal level (degree of arousal and sleepy) in each task are shown in Figure 14. The medians of arousal level were 3 in NM and JY, 5 in SD and RL, and 2 in AG. The Friedman test showed statistically significant differences (). A post-hoc analysis by Wilcoxon signed-rank sum test with BH method showed significant differences () between NM and SD, NM and RL, NM and AG, JY and SD, JY and RL, SD and AG, and RL and AG. They also showed significant differences () between NM and JY, and JY and AG.
4.2.3. Emotional valence
The results of the questionnaire regarding valence (degree of pleasure and displeasure) in each task are shown in Figure 15. The medians of valence were 3 in NM, JY, SD, RL, and AG. The Friedman test showed no significant differences.
4.2.4. Understanding of emotions
The results of the questionnaire regarding the understanding of emotions in each task are shown in Table 9. We demonstrate the results separately for each task in this section.
Motion expressing “Normal” state: Participants who answered the correct answer “Normal” were 36.4%. According to further examination of answers when participants observed the motion expressing “Normal” state, 16 participants (36.4%) answered “Normal (NM)”, 12 participants (27.2%) answered “Joy (JY)”, 13 participants (29.6%) answered “Relaxed (RL)”, and 3 (6.82%) participants answered “Angry (AG).” No participants who answered “Sad (SD).” The highest number of participants answered NM of the five conditions. On the other hand, participants often selected different states such as JY or RL.
Motion expressing “Joy” state: Participants who answered the correct answer “Joy” were 36.4%. According to further examination of answers when participants observed the motion expressing “Joy” state, 18 participants (40.9%) answered NM, 16 participants (36.4%) answered JY, 2 participants (4.55%) answered SD, 5 participants (11.4%) answered RL, and 3 participants (6.82%) answered AG. The second highest number of participants answered JY of the five conditions. Participants often selected NM, the most of all conditions.
Motion expressing “Sad” state: Participants who answered the correct answer “Sad” were 11.4%. According to further examination of answers when participants observed the motion expressing “Sad” state, 8 participants (18.2%) answered NM, 4 participants (9.09%) answered JY, 5 participants (11.4%) answered SD, and 27 participants (61.4%) answered RL. No participants answered AG. The third highest number of participants answered SD of the five conditions. Participants often selected RL, which was most of all conditions and accounted for more than half of the total answers.
Motion expressing “Relaxed” state: Participants who answered the correct answer “Relaxed” were 54.5%. According to further examination of answers when participants observed the motion expressing “Relaxed” state, 10 participants (22.7%) answered NM, 5 participants (11.4%) answered JY, 4 participants (9.09%) answered SD, 24 participants (54.6%) answered RL, and 1 participant (2.27%) answered AG. The highest number of participants answered RL of the five conditions and accounted for more than half of the total answers.
Motion expressing “Angry” state: Participants who answered the correct answer “ Angry” were 34.1%. According to further examination of answers when participants observed the motion expressing “Angry” state, 10 participants (22.7%) answered NM, 16 participants (36.4%) answered JY, 2 participants (4.55%) answered SD, 1 participant (2.27%) answered RL, and 15 participants (34.1%) answered AG. The second highest number of participants answered AG of the five conditions. Participants often selected JY, the most of all conditions.
5. Discussion
5.1. Motion elements for animacy perception
In Experiment 1, motion elements for animacy perception were investigated. For this purpose, the motion in the NM (neutral) condition was focused on because of including only elements related to animacy.
The score for the degree of “organic-like” perception showed that each participant perceived the motion in the NM condition as animacy when they finished creating it. Therefore, the values of each parameter in the NM condition can be regarded as motion elements for animacy perception.
The importance of each parameter when participants created motions perceived as animacy in the NM condition was examined. The median of importance score of speed was the highest, followed by height and randomness, in that order. Significant differences were found among the three parameters. Therefore, speed is demonstrated as the most important for animacy perception. Height also indicated critical based on the median of importance score. In contrast, randomness seemed to be less emphasized compared to speed and height, according to the median. Additionally, 56.3% and 71.3% of participants selected none for the amplitude and period, respectively, when creating motions. Thus, these results suggest that randomness is not as critical for animacy perception.
5.2. Motion elements for expressing emotions
In Experiment 1, motion elements for emotional expressions were investigated. Joy (JY), Sad (SD), Relaxed (RL), and Angry (AG) were selected as representative emotions for four quadrants of Russell’s Circumplex Model. For this purpose, we focused on differential values calculated by subtracting the values in the NM condition, which were solely related to animacy. As a result, these differential values calculated in the four conditions included aspects related to emotional expressions. We discuss each parameter below.
Speed and Height: The value in the NM condition was subtracted from each value in the JY, SD, RL, and AG conditions. The medians were positive values in the JY and AG conditions and negative values in the SD and RL conditions for both speed and height. First, we focus on the arousal level of Russell’s Circumplex Model. JY and AG are categorized as high arousal conditions, while SD and RL are categorized as low arousal conditions. Significant differences were found between JY and SD, JY and RL, SD and AG, and RL and AG. The results demonstrated that the values of both speed and height were different between high and low arousal levels. Second, we focus on the emotional valence of Russell’s Circumplex Model. JY and RL are categorized as positive valence conditions, while SD and AG are categorized as negative valence conditions. A significant difference was shown between JY and AG, but not between SD and RL. The results revealed that the values of both speed and height were different between positive and negative valence conditions in high arousal conditions. Therefore, speed and height elements play critical roles in expressing arousal levels, but expressing positive and negative valence solely through these elements is challenging.
Type and frequency of randomness: The value in the NM condition was subtracted from each value in the JY, SD, RL, and AG conditions. The values represent the number of selections. For the amplitude, the differences in numbers choosing none were negative values in the JY, SD, and AG conditions, and positive values in the RL condition. The high frequency was preferred to select in the JY, SD, and AG conditions in both 1/f noise and normal random numbers. The difference was particularly larger in the AG condition. For the period, the differences in numbers choosing none were negative values in the JY, SD, and AG conditions and 0 in the RL condition. Participants tended to select the low frequency of 1/f noise in the SD condition. On the other hand, participants tended to choose the high frequency of normal random numbers in the JY and AG conditions. The difference was particularly larger in the AG condition. First, we focus on the arousal level of Russell’s Circumplex Model. There appeared to be differences to some extent between high and low arousal levels, especially in negative valence conditions, as indicated by the number of choosing none for both the amplitude and period. Additionally, there seemed to be differences to some extent between high and low arousal levels based on the result of frequency for both the amplitude and period. Second, we focus on the emotional valence of Russell’s Circumplex Model. There appeared to be differences to some extent between positive and negative valence, especially in high arousal levels, as indicated by the number of choosing none for both the amplitude and period. Additionally, there seemed to be differences between positive and negative valence in high arousal conditions based on the result of frequency for both the amplitude and period. Therefore, the type and frequency are believed to be involved in the expression of both arousal level and emotional valence to some extent, whereas expressing valence in low arousal conditions may be challenging.
Intensity of randomness: The median in the NM condition was subtracted from medians in the JY, SD, RL, and AG conditions. The values were continuous. The values of 1/f noise for the amplitude were positive in JY, SD, and AG, and negative in RL. The values of normal random numbers were positive in all the conditions. The values of 1/f noise for the period were negative in all the conditions. The values of normal random numbers were negative in JY, SD, and RL, and positive in AG. The results were not sufficient to indicate that there were significant differences between high and low arousal levels and positive and negative valence. Therefore, it can be inferred the type and frequency of randomness may be more important in expressing emotions than its intensity.
5.3. Emotional expression by motions perceived animacy
In Experiment 1, the scores for the degree of “organic-like” perception were investigated. The median in each condition showed that participants perceived the motion as more animacy. Speed, height, and randomness can express emotions, as mentioned above. Therefore, it is considered that motions in the JY, SD, RL, and AG conditions can express emotions with animacy.
Then, in Experiment 2, we investigated whether the motions obtained from Experiment 1 were sufficient to express emotions with animacy. The motion in the NM condition was included in the experiment as a baseline. We discuss the results of the score for the degree of “organic-like” perception, arousal level, emotional valence, and understanding of emotions below.
Score for the degree of “organic-like” perception: The medians demonstrated that participants perceived motions as animacy in all the conditions. Therefore, motion elements obtained from Experiment 1 are sufficient for animacy perception in all conditions. Additionally, the vertical undulatory motion of discrete curved surfaces can be perceived as animacy under the inclusion of these elements.
Arousal level: The medians of arousal level scores showed that participants recognized high arousal states in the NM, JY, and AG conditions and low arousal states in the SD and RL conditions. Significant differences were found between NM and SD, NM and RL, NM and AG, JY and SD, JY and RL, SD and AG, RL and AG, NM and JY, and JY and AG, whereas no significant difference was found between SD and RL. The results indicated motions could express arousal levels. Therefore, vertical motions made solely by speed, height, and randomness can express high and low arousal levels.
Emotional valence: The medians of emotional valence scores showed that participants recognized high valence states in all the conditions. There were no significant differences between all the conditions. The result contradicted the theory of Russell’s Circumplex Model. According to this model, SD and AG are supposed to be recognized as low emotional valence states. However, these conditions were recognized as high emotional valence states. Therefore, vertical motions made solely by speed, height, and randomness are insufficient to express positive and negative emotional valence. It does not support the discussion about the relationship between randomness and emotional valence in Section 5.2.
Understanding of emotions: JY, SD, RL, and AG were most commonly selected in the case of correct conditions. The percentage of the correct answer was highest in the RL condition and lowest in the SD condition. These two conditions are low arousal levels and have different emotional valences. RL and SD are positive and negative emotional valences, respectively. Participants answered JY as much as NM in the NM condition, NM as much as JY in the JY condition, and JY as much as AG in the AG condition. Both JY and AG are high arousal levels and have different emotional valences. JY and AG are positive and negative emotional valences, respectively. Therefore, vertical motions made solely by speed, height, and randomness are sufficient to express emotions of different arousal levels. Additionally, it is considered that high arousal states can express positive and negative emotional valences to some extent in high arousal states. However, it is challenging to express emotional valence in low arousal states using only these elements, and other elements may be involved.
5.4. Limitation
In this study, we revealed fundamental motion elements for animacy perception and emotional expressions. Moreover, our findings indicated that only these elements could express arousal levels in emotions with animacy. However, several limitations should be considered in the future. First, the motion was constrained to the vertical direction, and the elements were limited solely to speed, height, and randomness. Only these motions and elements could express emotions with animacy to some extent. However, expressing emotional valence proved to be challenging. Therefore, future studies should incorporate different directions and additional elements for a more comprehensive analysis. Second, the formula for calculating 1/f noise in this study was based on the method described in [24]. However, this method incorporated processes that did not include in the original algorithm. The method possibly caused some unexpected behaviors and may not meet the definition of true 1/f noise. It is possible that these unexpected behaviors could have influenced the results of randomness in this study. Therefore, future studies should aim to use the original algorithm and validate the obtained results. Finally, this study was limited to surveys using the robot simulator. We aim to apply the findings to the motions of actual robots in the future. Therefore, it is necessary to build an actual device based on the motions revealed in the experiment using the robot simulator, and conduct additional investigations in the future. The actual device can be built based on inForm [19] and shapeShift [20], but there is a concern that using a large number of actuators as in the robot simulator, may cause a system to be too large. Thus, it is considered that smooth curved surfaces will be made using structures and materials as in Steed et al. [21].
6. Conclusion
In this paper, we revealed the motion elements that contributed to animacy perception and emotional expressions. Additionally, we also revealed whether these elements were sufficient to express emotions with animacy. Two experiments were conducted to investigate these topics.
In Experiment 1 in Section 3, we used a robot simulator that could be created motions by tuning the parameters of speed, height, and randomness (type, intensity, and frequency). The results demonstrated that speed and height were important parameters for animacy perception. Emotional expressions were considered based on Russell’s Circumplex Model. The results suggested that speed and height possibly played significant roles in expressing high and low arousal levels. Moreover, randomness possibly contributed to the expression of positive and negative valence.
In Experiment 2 in Section 4, we used the robot simulator reflecting the parameters shown in Experiment 1. The results showed that the parameters shown in Experiment 1 were sufficient to express high and low arousal levels. In contrast, it was challenging to express positive and negative valence, especially in conditions of low arousal levels. Therefore, the motions presented in this paper are sufficient to express arousal levels, whereas expressing valence remains a challenging task.
The findings of this study can provide design guidelines for robots to solve the challenges of pet-type robots while delivering the expected benefits. However, several issues require further investigation and resolution, for example, motion directions, types of motion elements, the 1/f noise calculation algorithm, and investigations using actual devices. Therefore, it is necessary to investigate these issues in future studies.
Supplementary Materials
The following supporting information can be downloaded at: https://doi.org/10.5281/zenodo.7838217, Video S1: System operation in Experiment 1; Video S2: Motions reflecting the results of Experiment 1; Video S3: System operation in Experiment 2.
Author Contributions
Conceptualization, M.K., N.I., H.U., N.S., J.T., and K.K.; methodology, M.K., N.I., H.U., N.S., J.T., and K.K.; software, M.K.; validation, M.K.; formal analysis, M.K.; investigation, M.K.; resources, N.I., H.U., N.S., J.T., and K.K.; data curation, M.K.; writing—original draft preparation, M.K.; writing—review and editing, H.U., J.T., and K.K.; visualization, M.K.; supervision, K.K.; project administration, K.K.; funding acquisition, K.K. All authors have read and agreed to the published version of the manuscript.
Funding
This research received no external funding.
Informed Consent Statement
Informed consent was obtained from all subjects involved in the study.
Data Availability Statement
The data presented in this study are available in Supplementary Materials.
Conflicts of Interest
The authors declare no conflict of interest.
Abbreviations
The following abbreviations are used in this manuscript:
| PC | Personal Computer |
| IDE | Integrated Development Environment |
| MTurk | Amazon Mechanical Turk |
| NCMB | NIFCLOUD mobile backend |
| URL | Uniform Resource Locator |
| JY | Joy |
| SD | Sad |
| RL | Relaxed |
| AG | Angry |
| NM | Normal |
| HITs | Human Intelligence Tasks |
| BH | Benjamini-Hochberg |
References
- Robinson, H.; MacDonald, B.; Kerse, N.; Broadbent, E. The psychosocial effects of a companion robot: a randomized controlled trial. Journal of the American Medical Directors Association 2013, 14, 661–667. [Google Scholar] [CrossRef] [PubMed]
- Robinson, H.; MacDonald, B.; Broadbent, E. Physiological effects of a companion robot on blood pressure of older people in residential care facility: a pilot study. Australasian journal on ageing 2015, 34, 27–32. [Google Scholar] [CrossRef] [PubMed]
- Lane, G.W.; Noronha, D.; Rivera, A.; Craig, K.; Yee, C.; Mills, B.; Villanueva, E. Effectiveness of a social robot,“Paro,” in a VA long-term care setting. Psychological services 2016, 13, 292. [Google Scholar] [CrossRef] [PubMed]
- Petersen, S.; Houston, S.; Qin, H.; Tague, C.; Studley, J. The utilization of robotic pets in dementia care. Journal of alzheimer’s disease 2017, 55, 569–574. [Google Scholar] [CrossRef]
- de Graaf, M.M.A.; Allouch, S.B. The influence of prior expectations of a robot’s lifelikeness on users’ intentions to treat a zoomorphic robot as a companion. International Journal of Social Robotics 2017, 9, 17–32. [Google Scholar] [CrossRef]
- Löffler, D.; Kaul, A.; Hurtienne, J. Expected behavior and desired appearance of insect-like desk companions. Proceedings of the Eleventh International Conference on Tangible, Embedded, and Embodied Interaction, 2017, pp. 289–297. [CrossRef]
- Minato, T.; Nishio, S.; Ogawa, K.; Ishiguro, H. Development of cellphone-type tele-operated android. Proceedings of the 10th Asia Pacific Conference on Computer Human Interaction. Citeseer, 2012.
- Hieida, C.; Matsuda, H.; Kudoh, S.; Suehiro, T. Action elements of emotional body expressions for flying robots. 2016 11th ACM/IEEE International Conference on Human-Robot Interaction (HRI). IEEE, 2016, pp. 439–440. [CrossRef]
- Heider, F.; Simmel, M. An experimental study of apparent behavior. The American journal of psychology 1944, 57, 243–259. [Google Scholar] [CrossRef]
- Tremoulet, P.D.; Feldman, J. Perception of animacy from the motion of a single object. Perception 2000, 29, 943–951. [Google Scholar] [CrossRef]
- Chang, D.H.; Troje, N.F. Perception of animacy and direction from local biological motion signals. Journal of Vision 2008, 8, 3–3. [Google Scholar] [CrossRef] [PubMed]
- Nakayama, M.; Yamanaka, S. Perception of animacy by the linear motion of a group of robots. Proceedings of the Fourth International Conference on Human Agent Interaction, 2016, pp. 3–9. [CrossRef]
- Fukai, H.; Terada, K.; Hamaguchi, M. Animacy Perception Based on One-Dimensional Movement of a Single Dot. Human Interface and the Management of Information. Interaction, Visualization, and Analytics: 20th International Conference, HIMI 2018, Held as Part of HCI International 2018, Las Vegas, NV, USA, July 15-20, 2018, Proceedings, Part I 20. Springer, 2018, pp. 185–193. [CrossRef]
- Santos, M.; Egerstedt, M. From motions to emotions: Can the fundamental emotions be expressed in a robot swarm? International Journal of Social Robotics 2021, 13, 751–764. [Google Scholar] [CrossRef]
- Jafarinaimi, N.; Forlizzi, J.; Hurst, A.; Zimmerman, J. Breakaway: an ambient display designed to change human behavior. CHI’05 extended abstracts on Human factors in computing systems, 2005, pp. 1945–1948. [CrossRef]
- Hu, Y.; Hoffman, G. Using skin texture change to design emotion expression in social robots. 2019 14th ACM/IEEE International Conference on Human-Robot Interaction (HRI). IEEE, 2019, pp. 2–10. [CrossRef]
- Tan, H.; Tiab, J.; Šabanović, S.; Hornbæk, K. Happy moves, sad grooves: using theories of biological motion and affect to design shape-changing interfaces. Proceedings of the 2016 ACM Conference on Designing Interactive Systems, 2016, pp. 1282–1293. [CrossRef]
- Elcanety. Office Room Furnituire. Available online: https://assetstore.unity.com/packages/3d/props/furniture/office-room-furniture-70884 (accessed on 5 March 2023).
- Follmer, S.; Leithinger, D.; Olwal, A.; Hogge, A.; Ishii, H. inFORM: dynamic physical affordances and constraints through shape and object actuation. Uist. Citeseer, 2013, Vol. 13, pp. 2501–988. [CrossRef]
- Siu, A.F.; Gonzalez, E.J.; Yuan, S.; Ginsberg, J.; Zhao, A.; Follmer, S. shapeShift: A mobile tabletop shape display for tangible and haptic interaction. Adjunct Proceedings of the 30th Annual ACM Symposium on User Interface Software and Technology, 2017, pp. 77–79. [CrossRef]
- Steed, A.; Ofek, E.; Sinclair, M.; Gonzalez-Franco, M. A mechatronic shape display based on auxetic materials. Nature Communications 2021, 12, 4758. [Google Scholar] [CrossRef] [PubMed]
- Fukuda, H.; Ueda, K. Interaction with a moving object affects one’s perception of its animacy. International Journal of Social Robotics 2010, 2, 187–193. [Google Scholar] [CrossRef]
- Kohyama, T.; Aizawa, Y. Theory of the intermittent chaos: 1/f spectrum and the Pareto-Zipf law. Progress of theoretical physics 1984, 71, 917–929. [Google Scholar] [CrossRef]
- Available online: http://tryoutartprogramming.blogspot.com/2015/11/1f-3.html (accessed on 5 March 2023).
- Box, G.E.; Muller, M.E. A note on the generation of random normal deviates. The annals of mathematical statistics 1958, 29, 610–611. [Google Scholar] [CrossRef]
- Slack Technologies, LLC. slack. Available online: https://slack.com (accessed on 8 March 2023).
- Amazon company. Amazon mechanical turk. Available online: https://www.mturk.com/ (accessed on 5 March 2023).
- unityroom. Available online: https://unityroom.com/ (accessed on 5 March 2023).
- FUJITSU CLOUD TECHNOLOGIES LIMITED. NIFCLOUD mobile backend. Available online: https://mbaas.nifcloud.com/en/ (accessed on 8 March 2023).
- Google LLC. Google Forms. Available online: https://www.google.com/forms/about/ (accessed on 8 March 2023).
- Russell, J.A. A circumplex model of affect. Journal of personality and social psychology 1980, 39, 1161. [Google Scholar] [CrossRef]
- Albayram, Y.; Khan, M.M.H.; Jensen, T.; Nguyen, N. ... better to use a lock screen than to worry about saving a few seconds of time”: Effect of fear appeal in the context of smartphone locking behavior. Thirteenth Symposium on Usable Privacy and Security (SOUPS 2017). USENIX Association, 2017, pp. 49–63.
Figure 1.
The screenshot of the robot simulator.
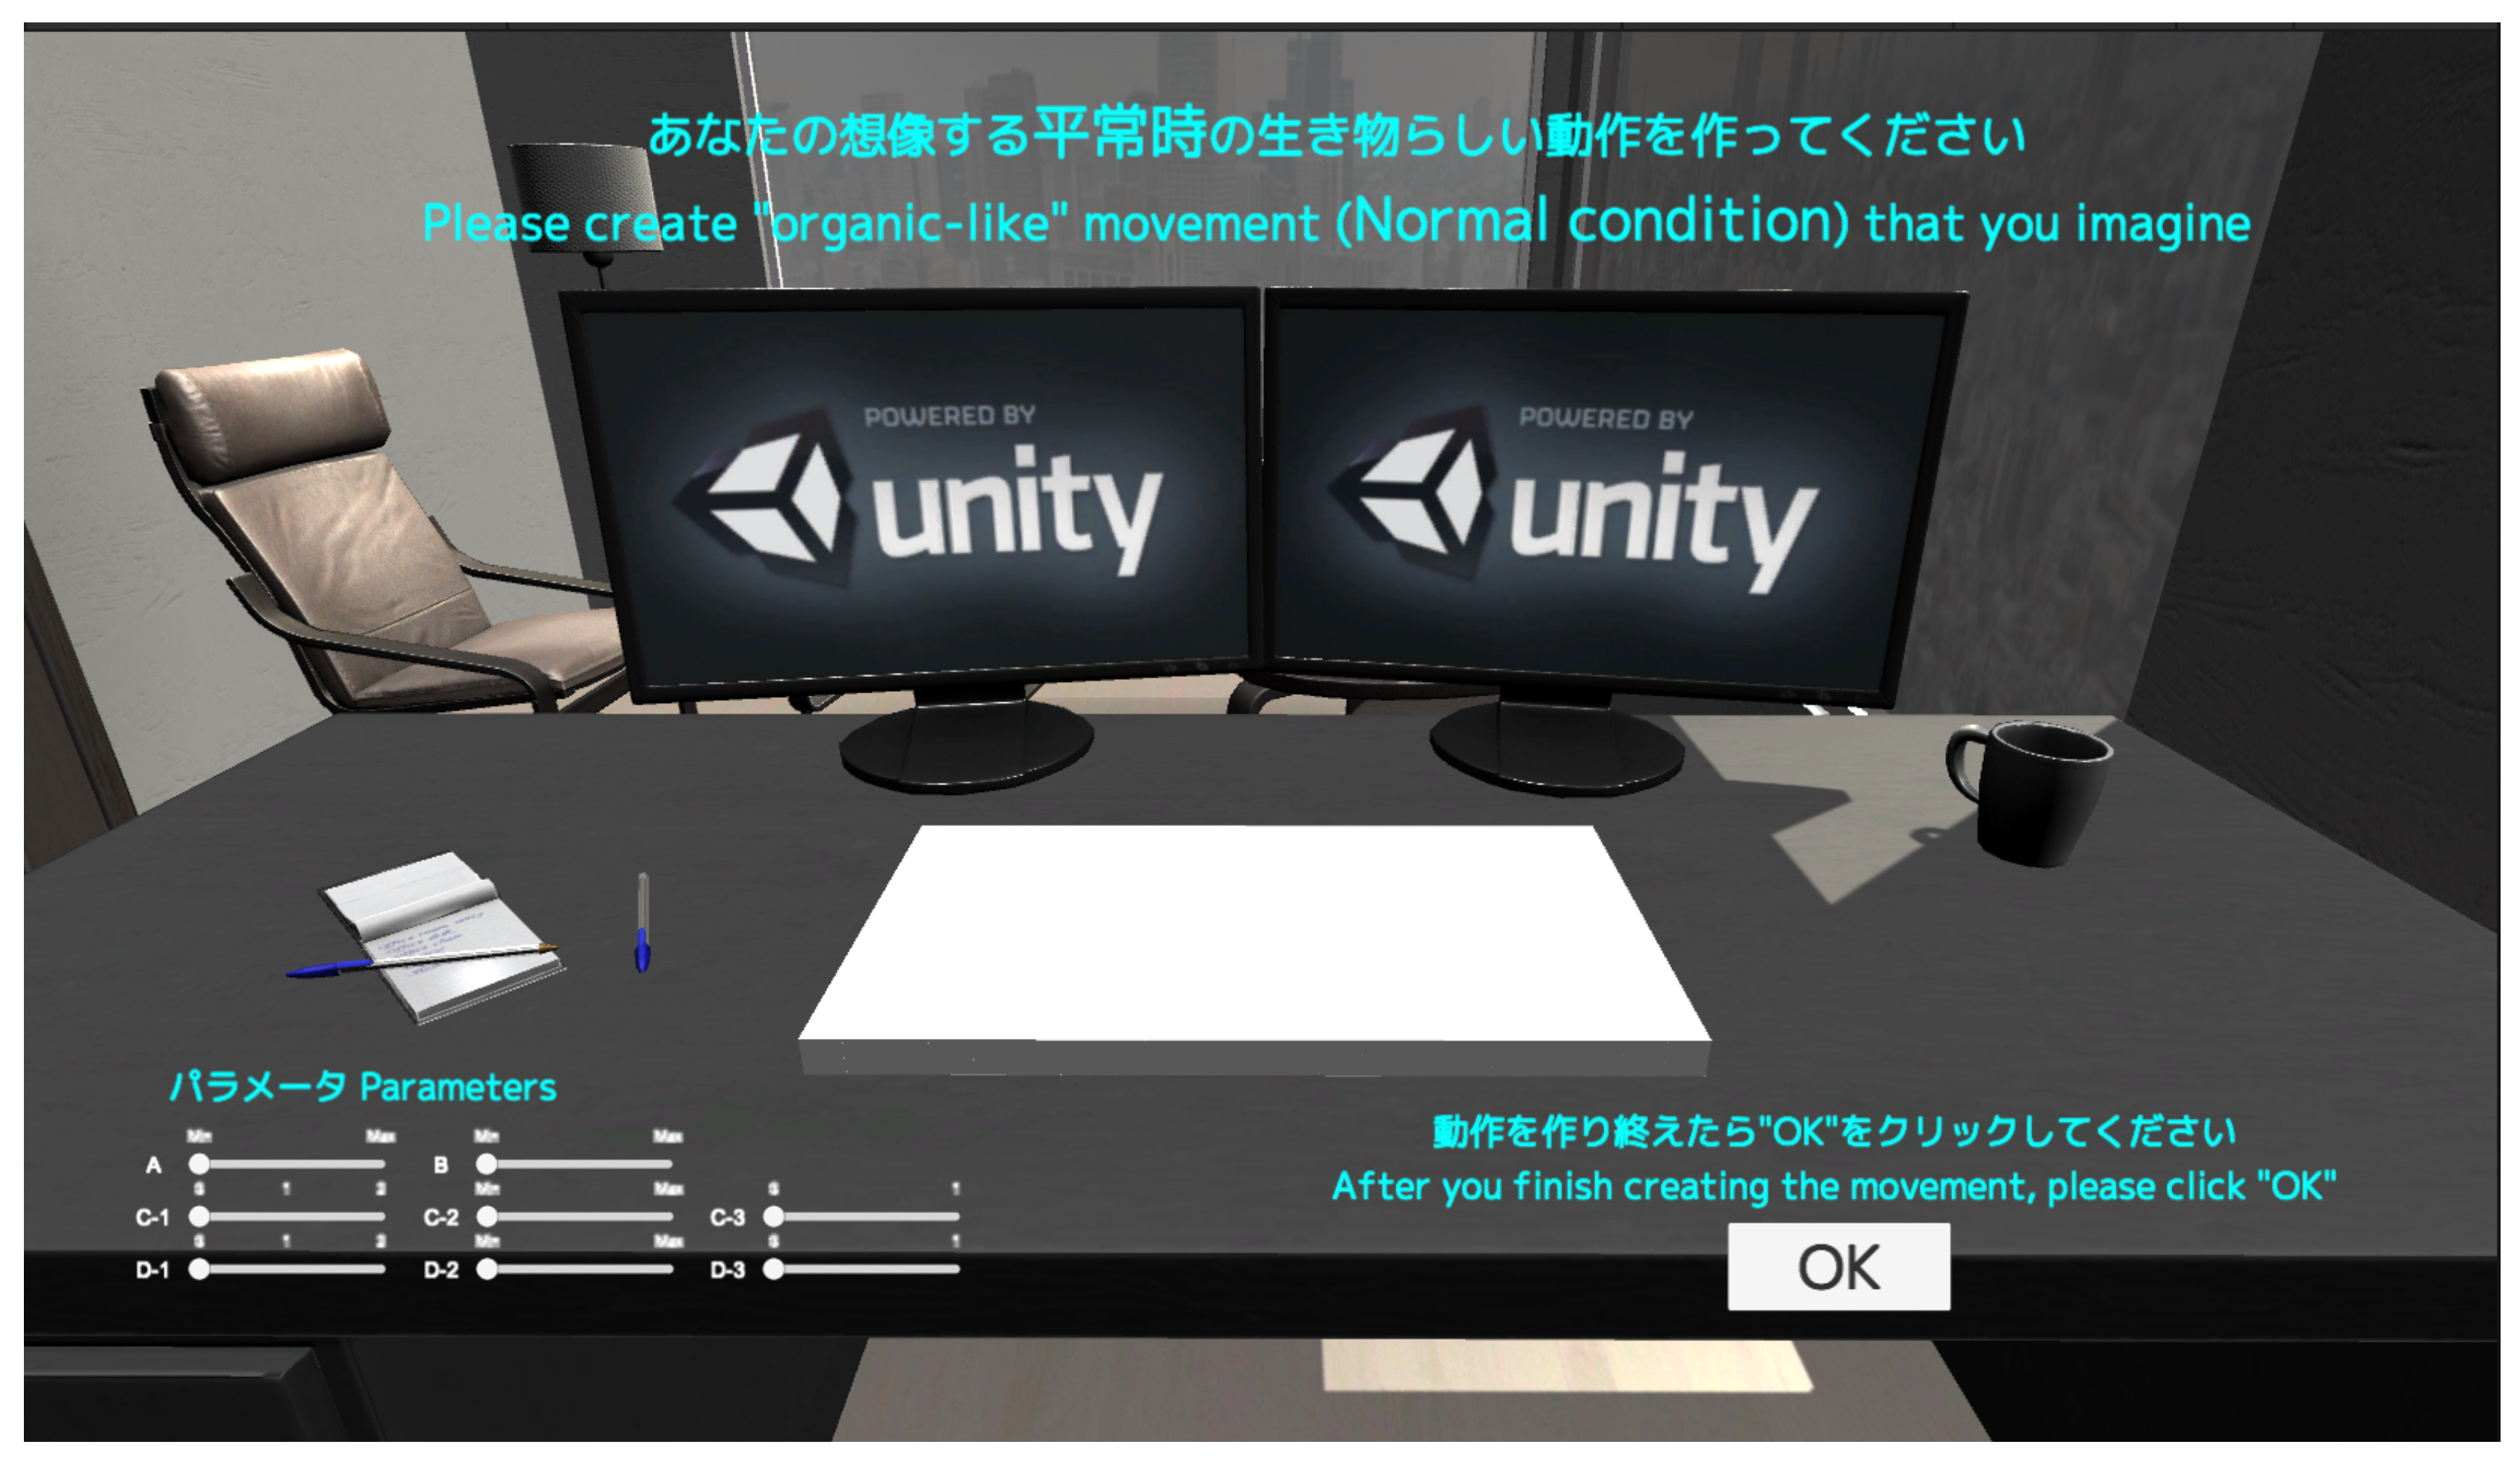
Figure 2.
The sliders for tuning parameters.
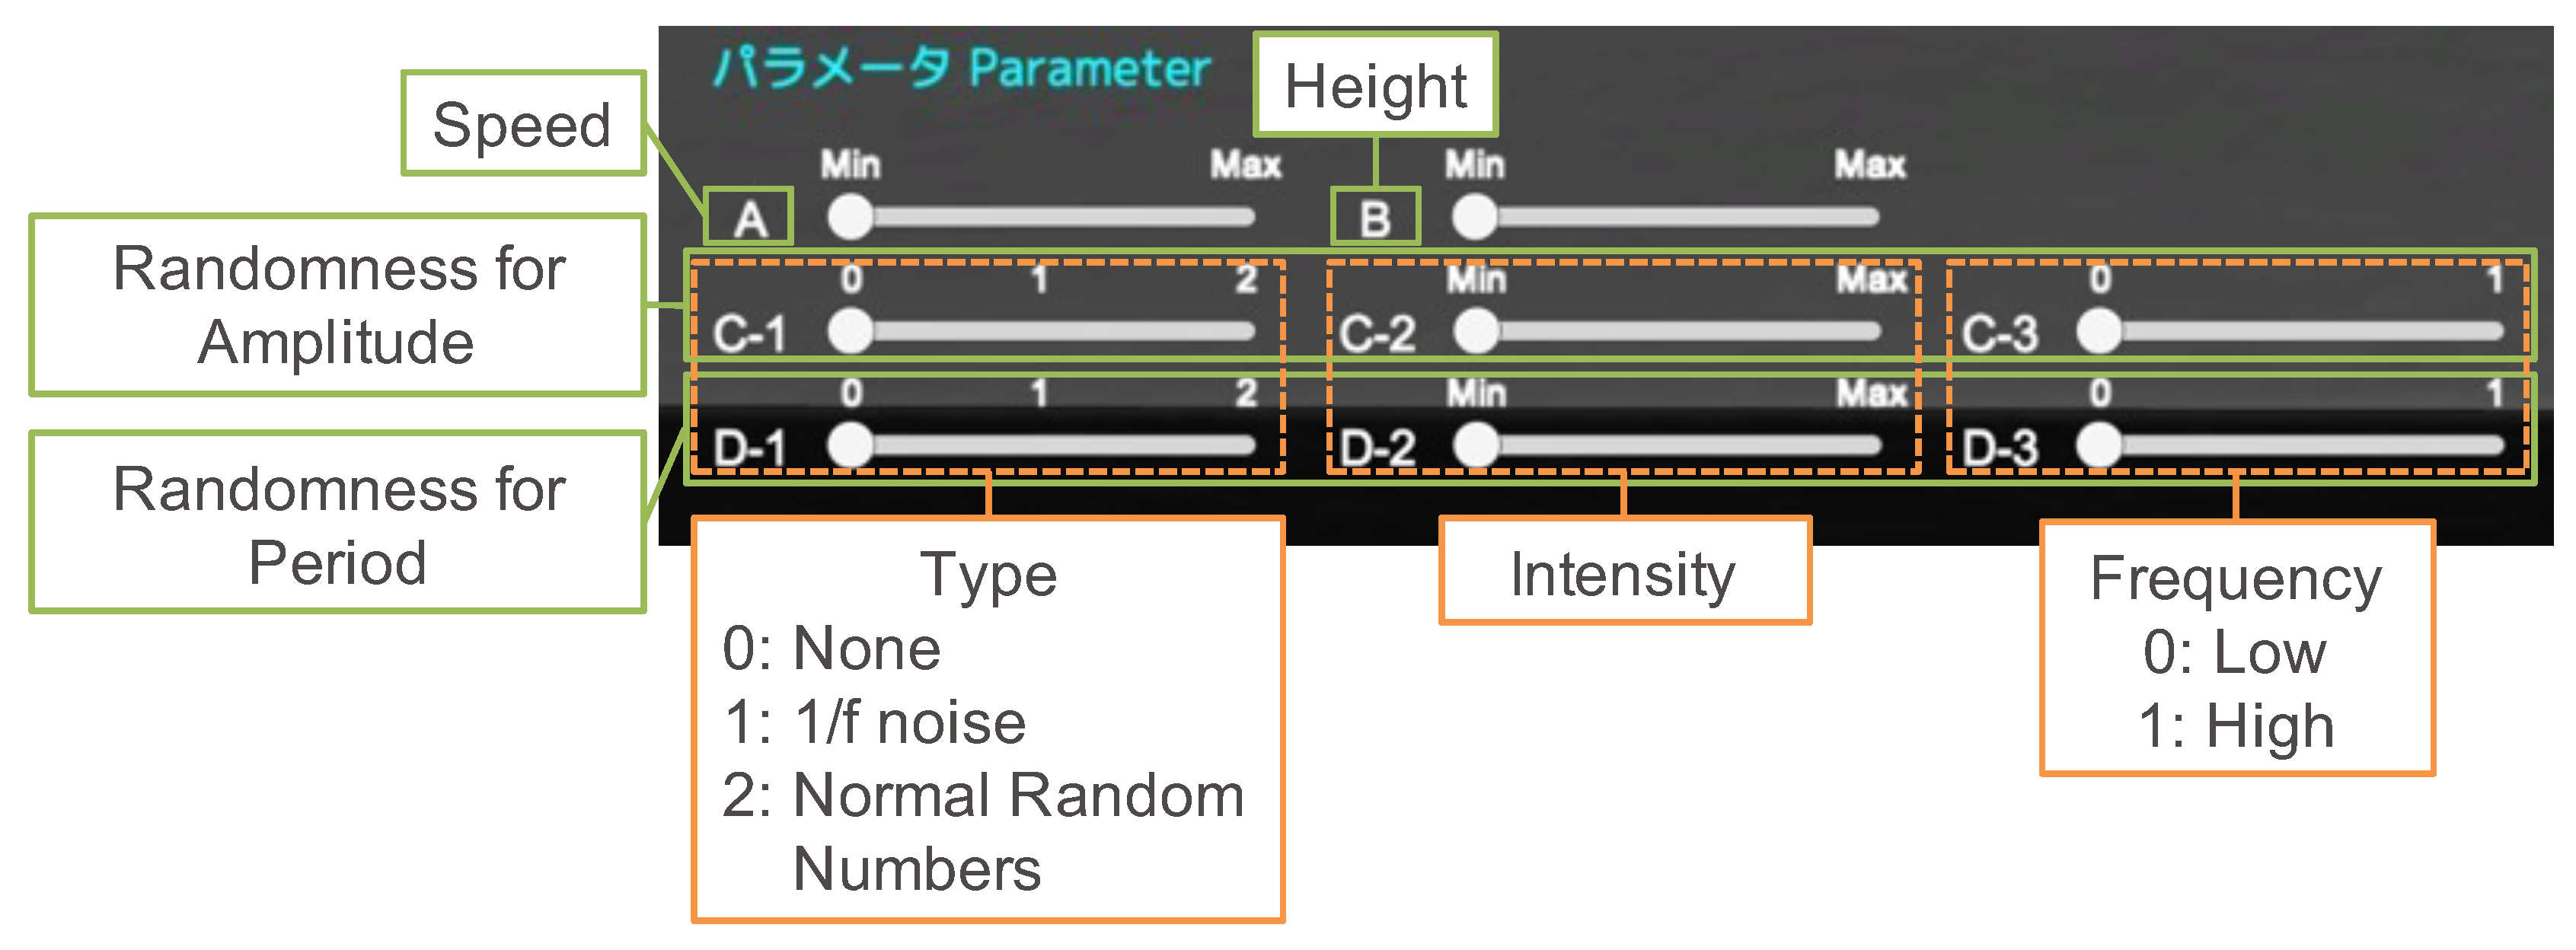
Figure 3.
(a) The system configuration used by participants in the lab; (b) The system configuration used by online participants.
Figure 3.
(a) The system configuration used by participants in the lab; (b) The system configuration used by online participants.
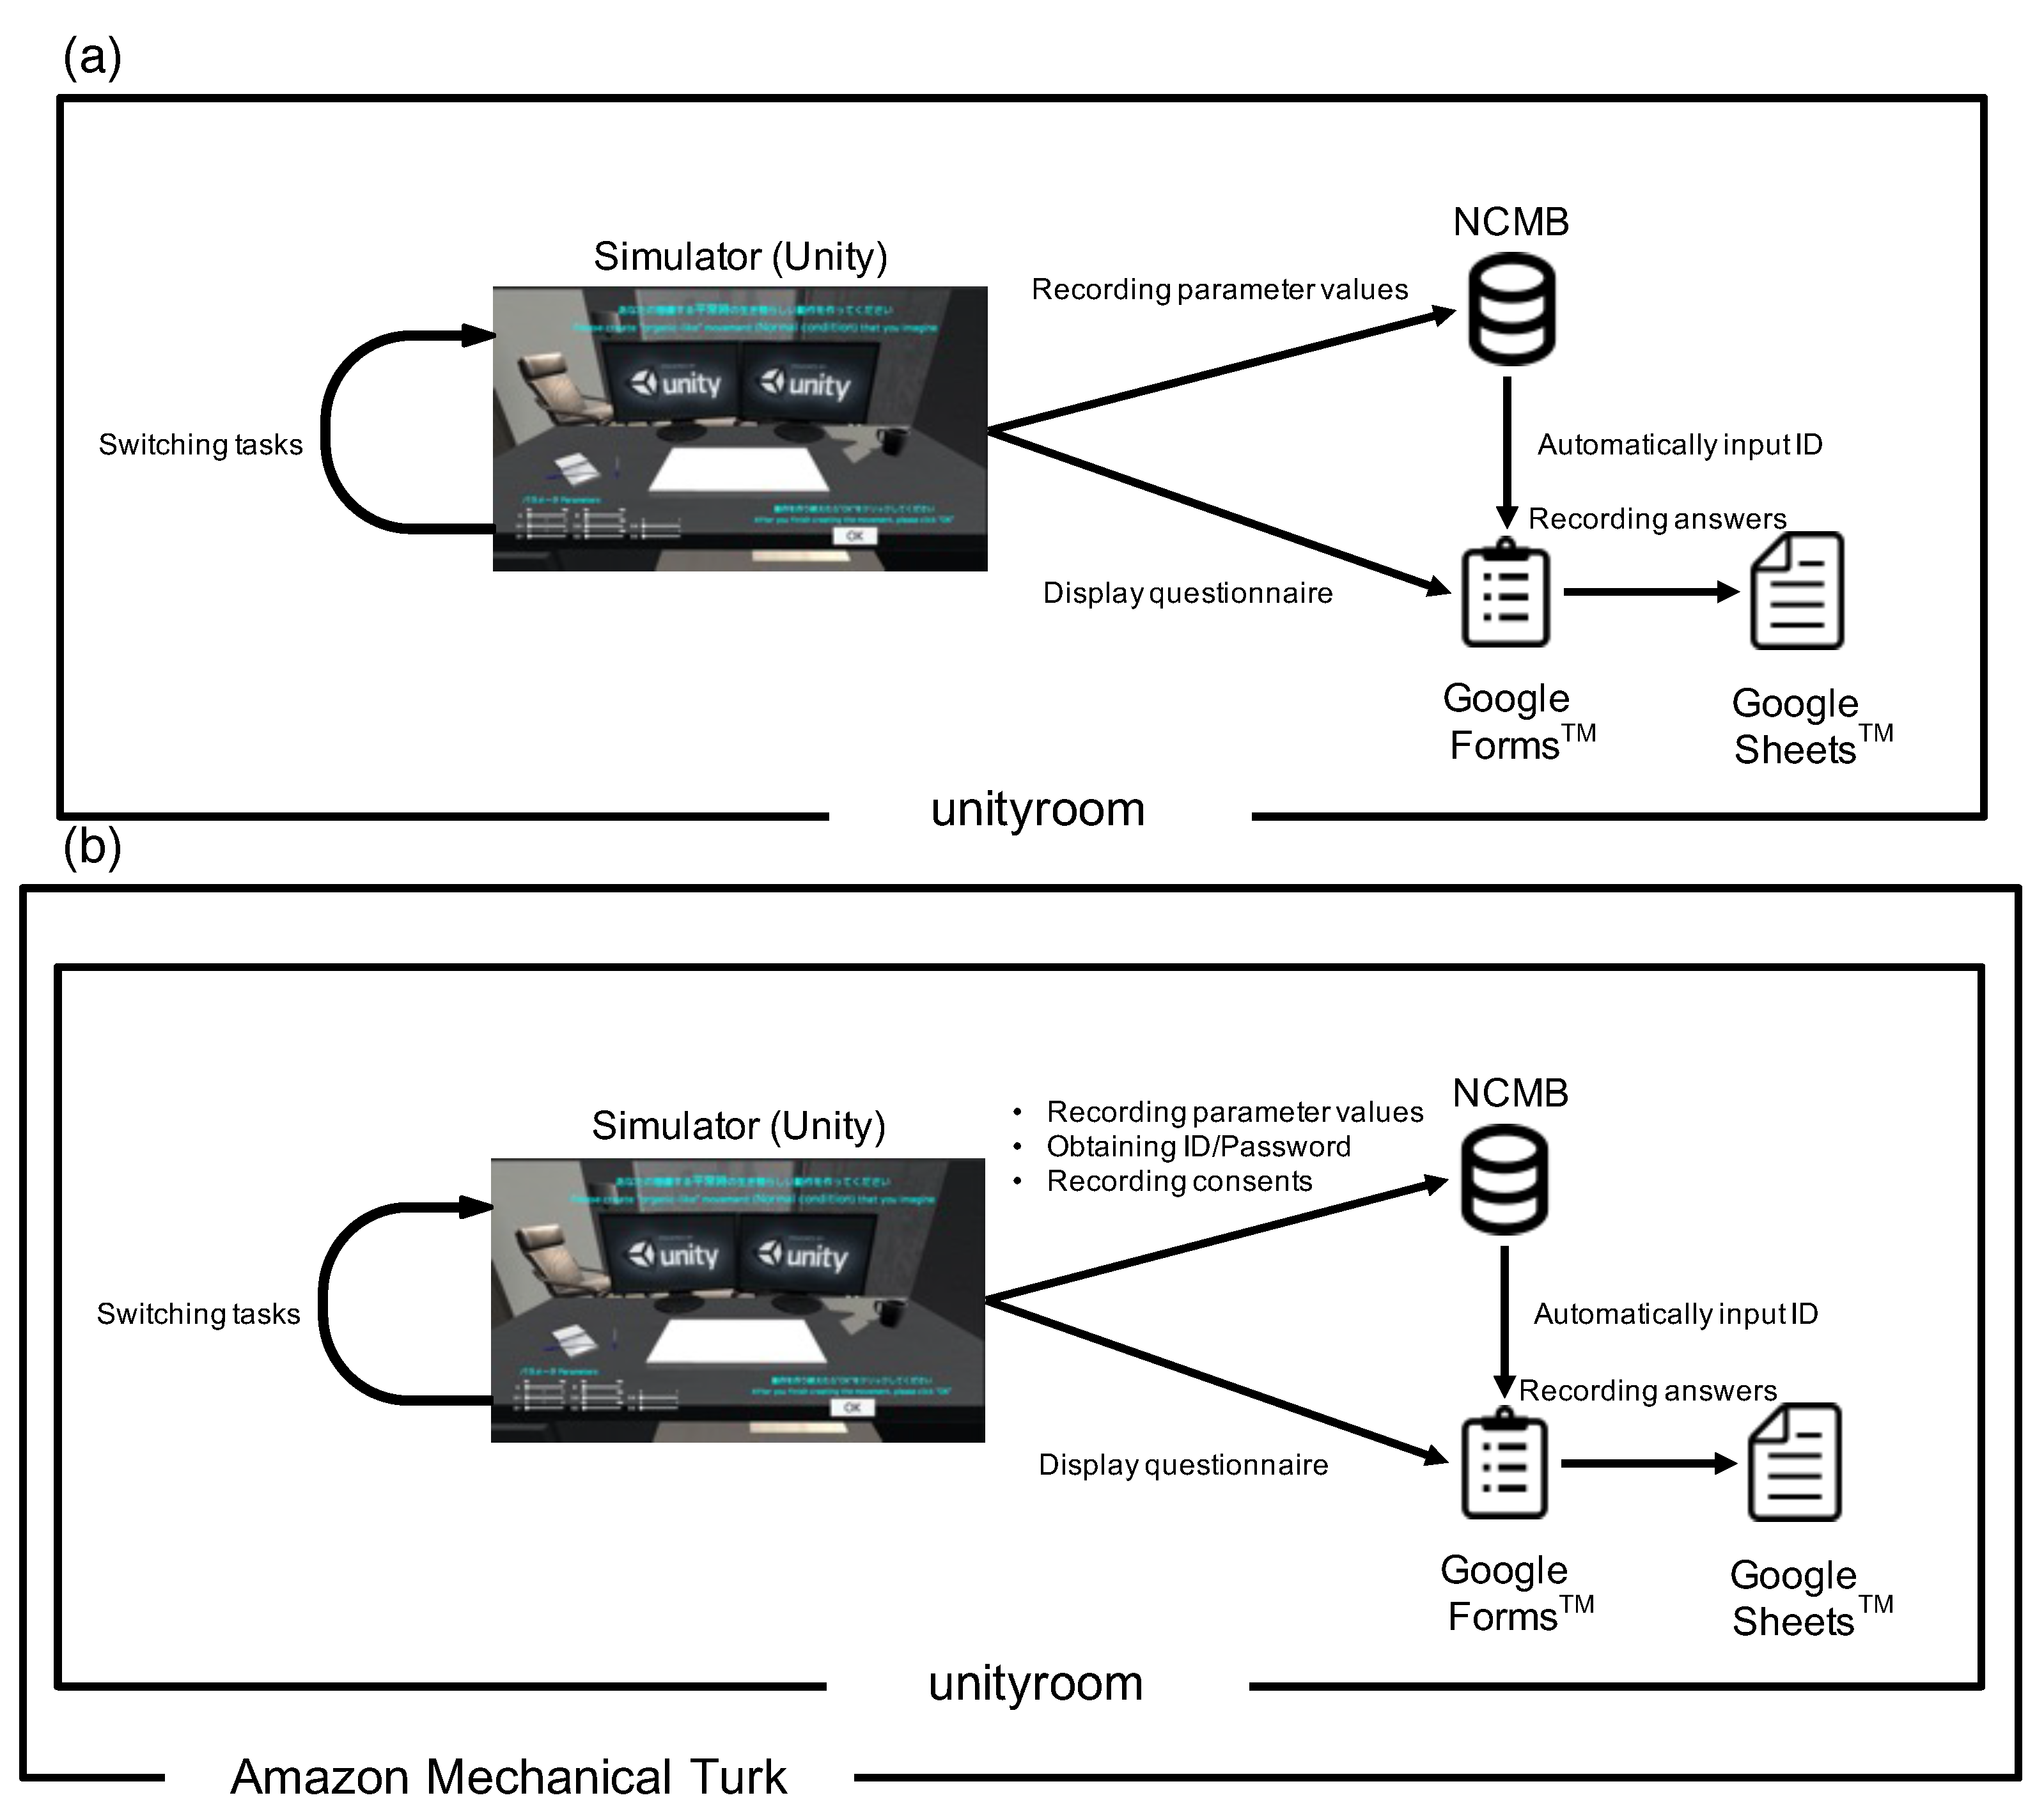
Figure 4.
The positioning of Normal (NM), Joy (JY), Sad (SD), Relaxed (RL), and Angry (AG).
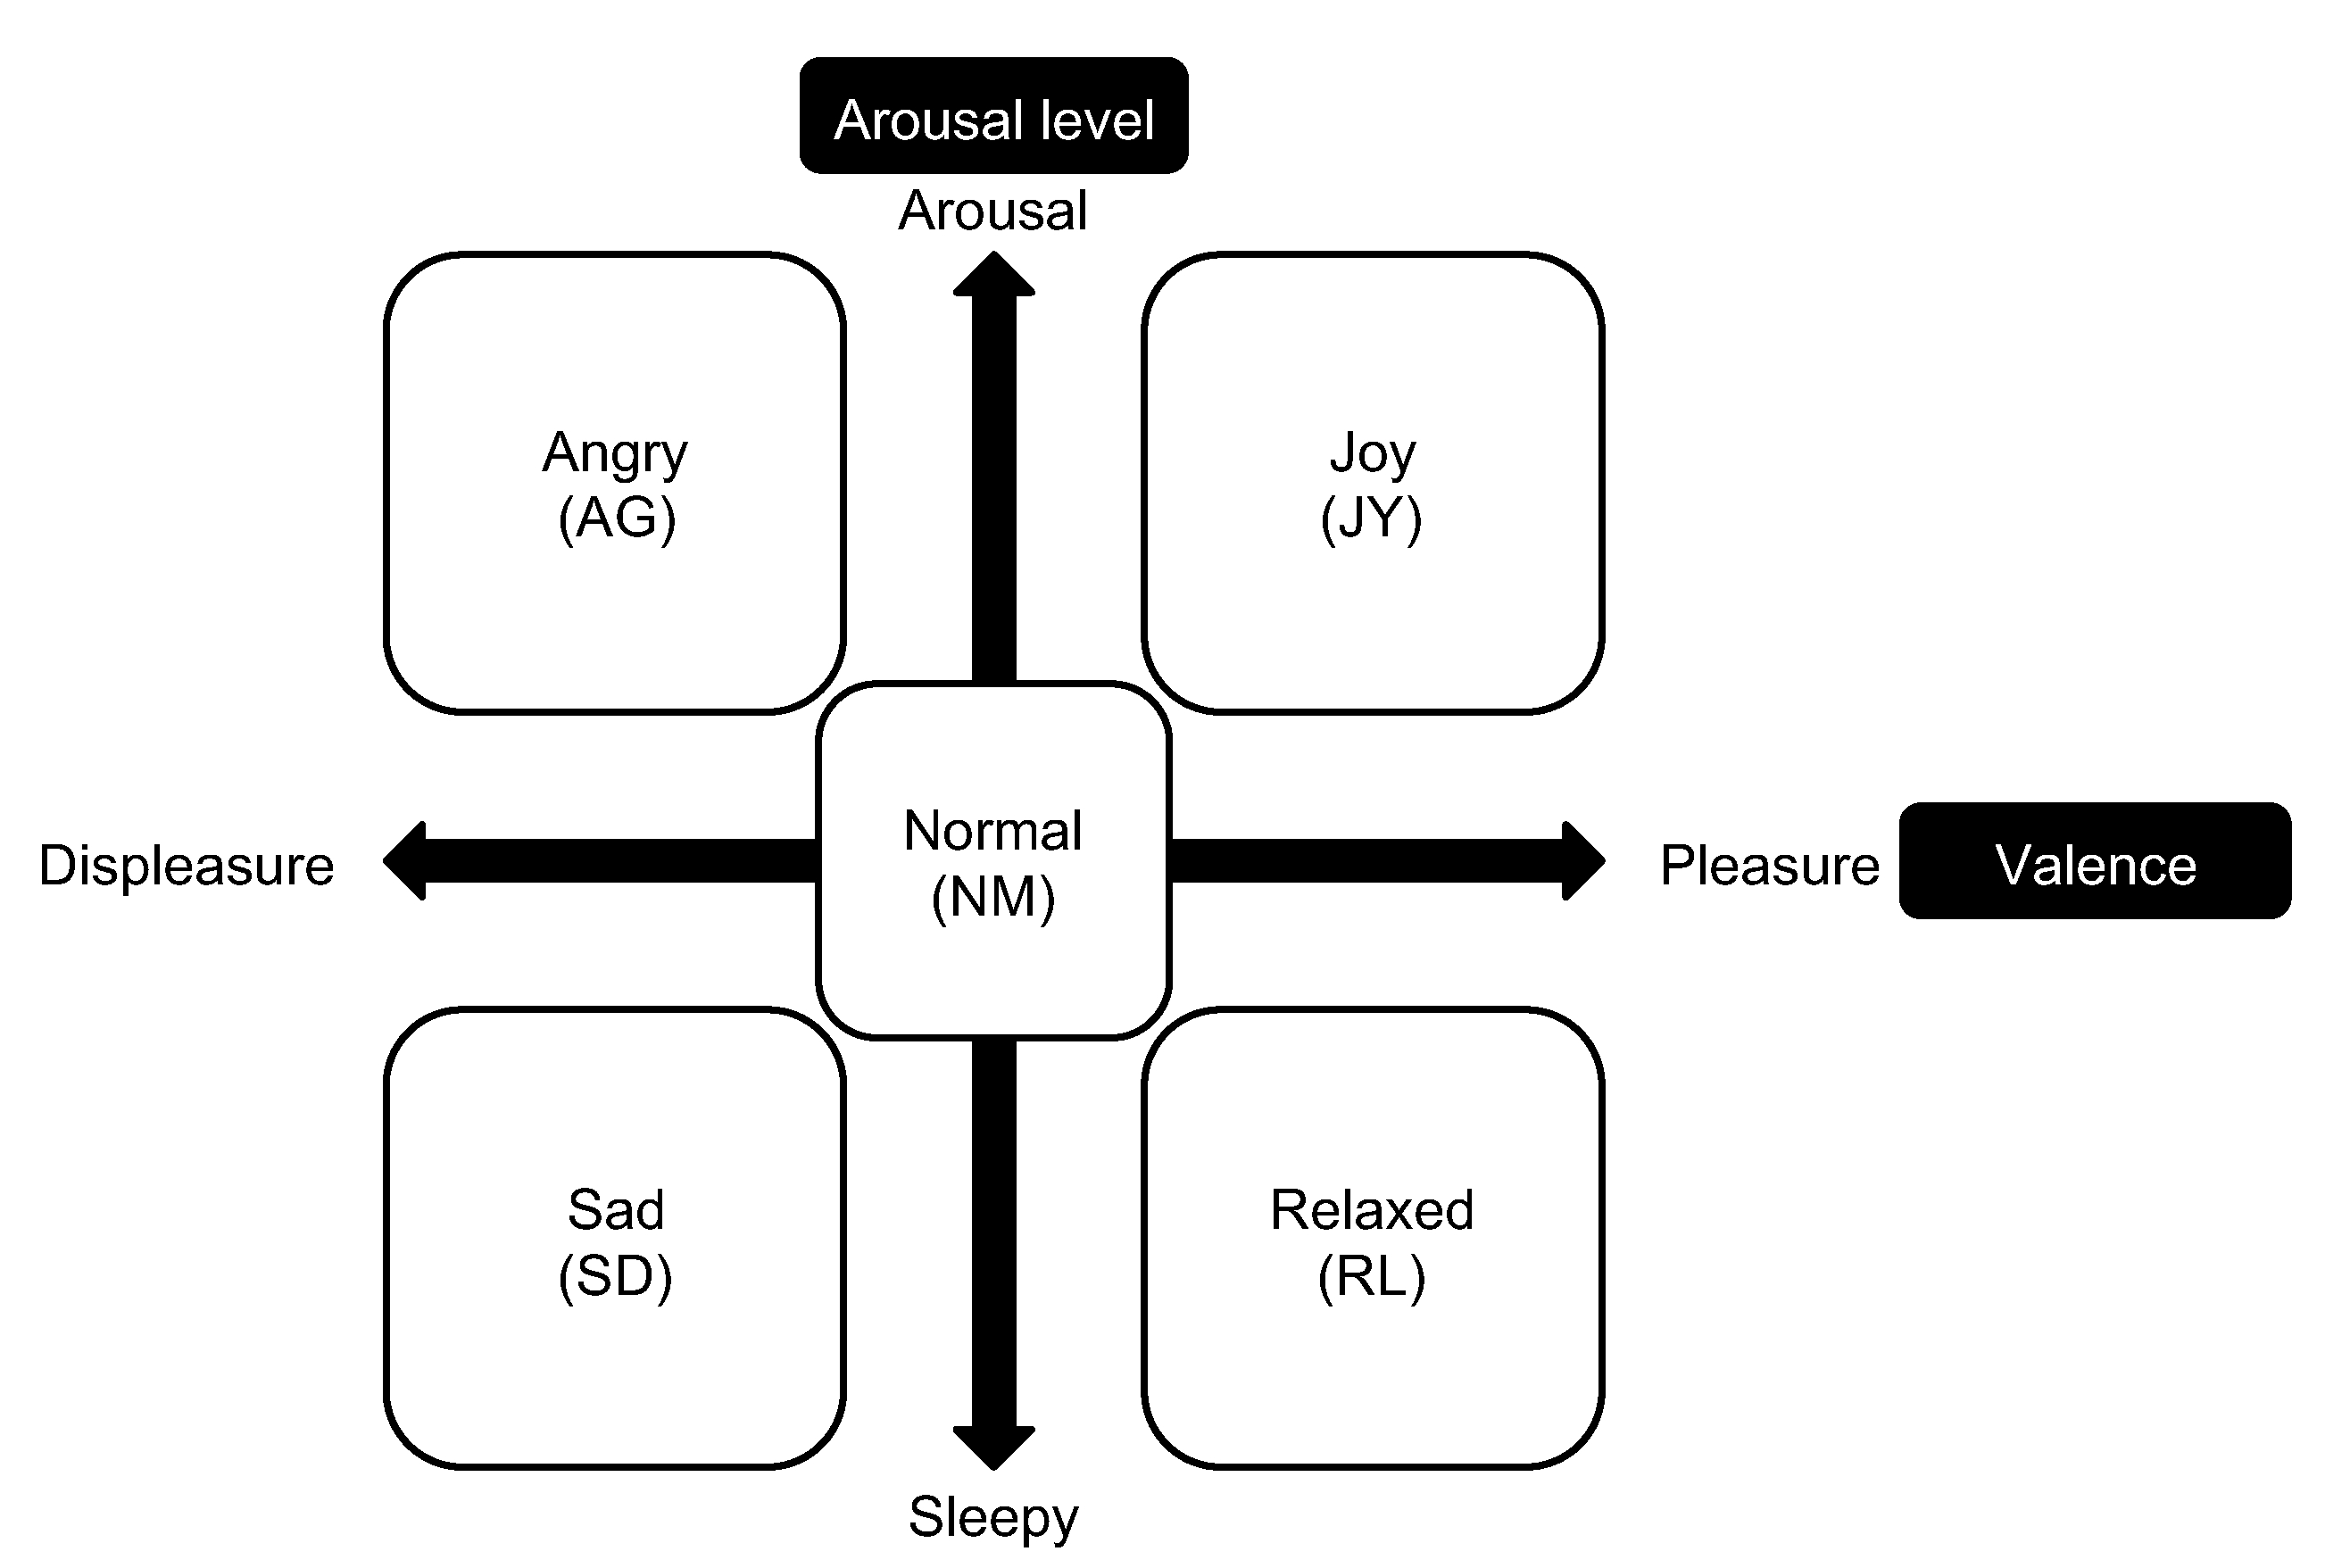
Figure 5.
(a) The value of speed in the NM condition; (b) The value of height in the NM condition.
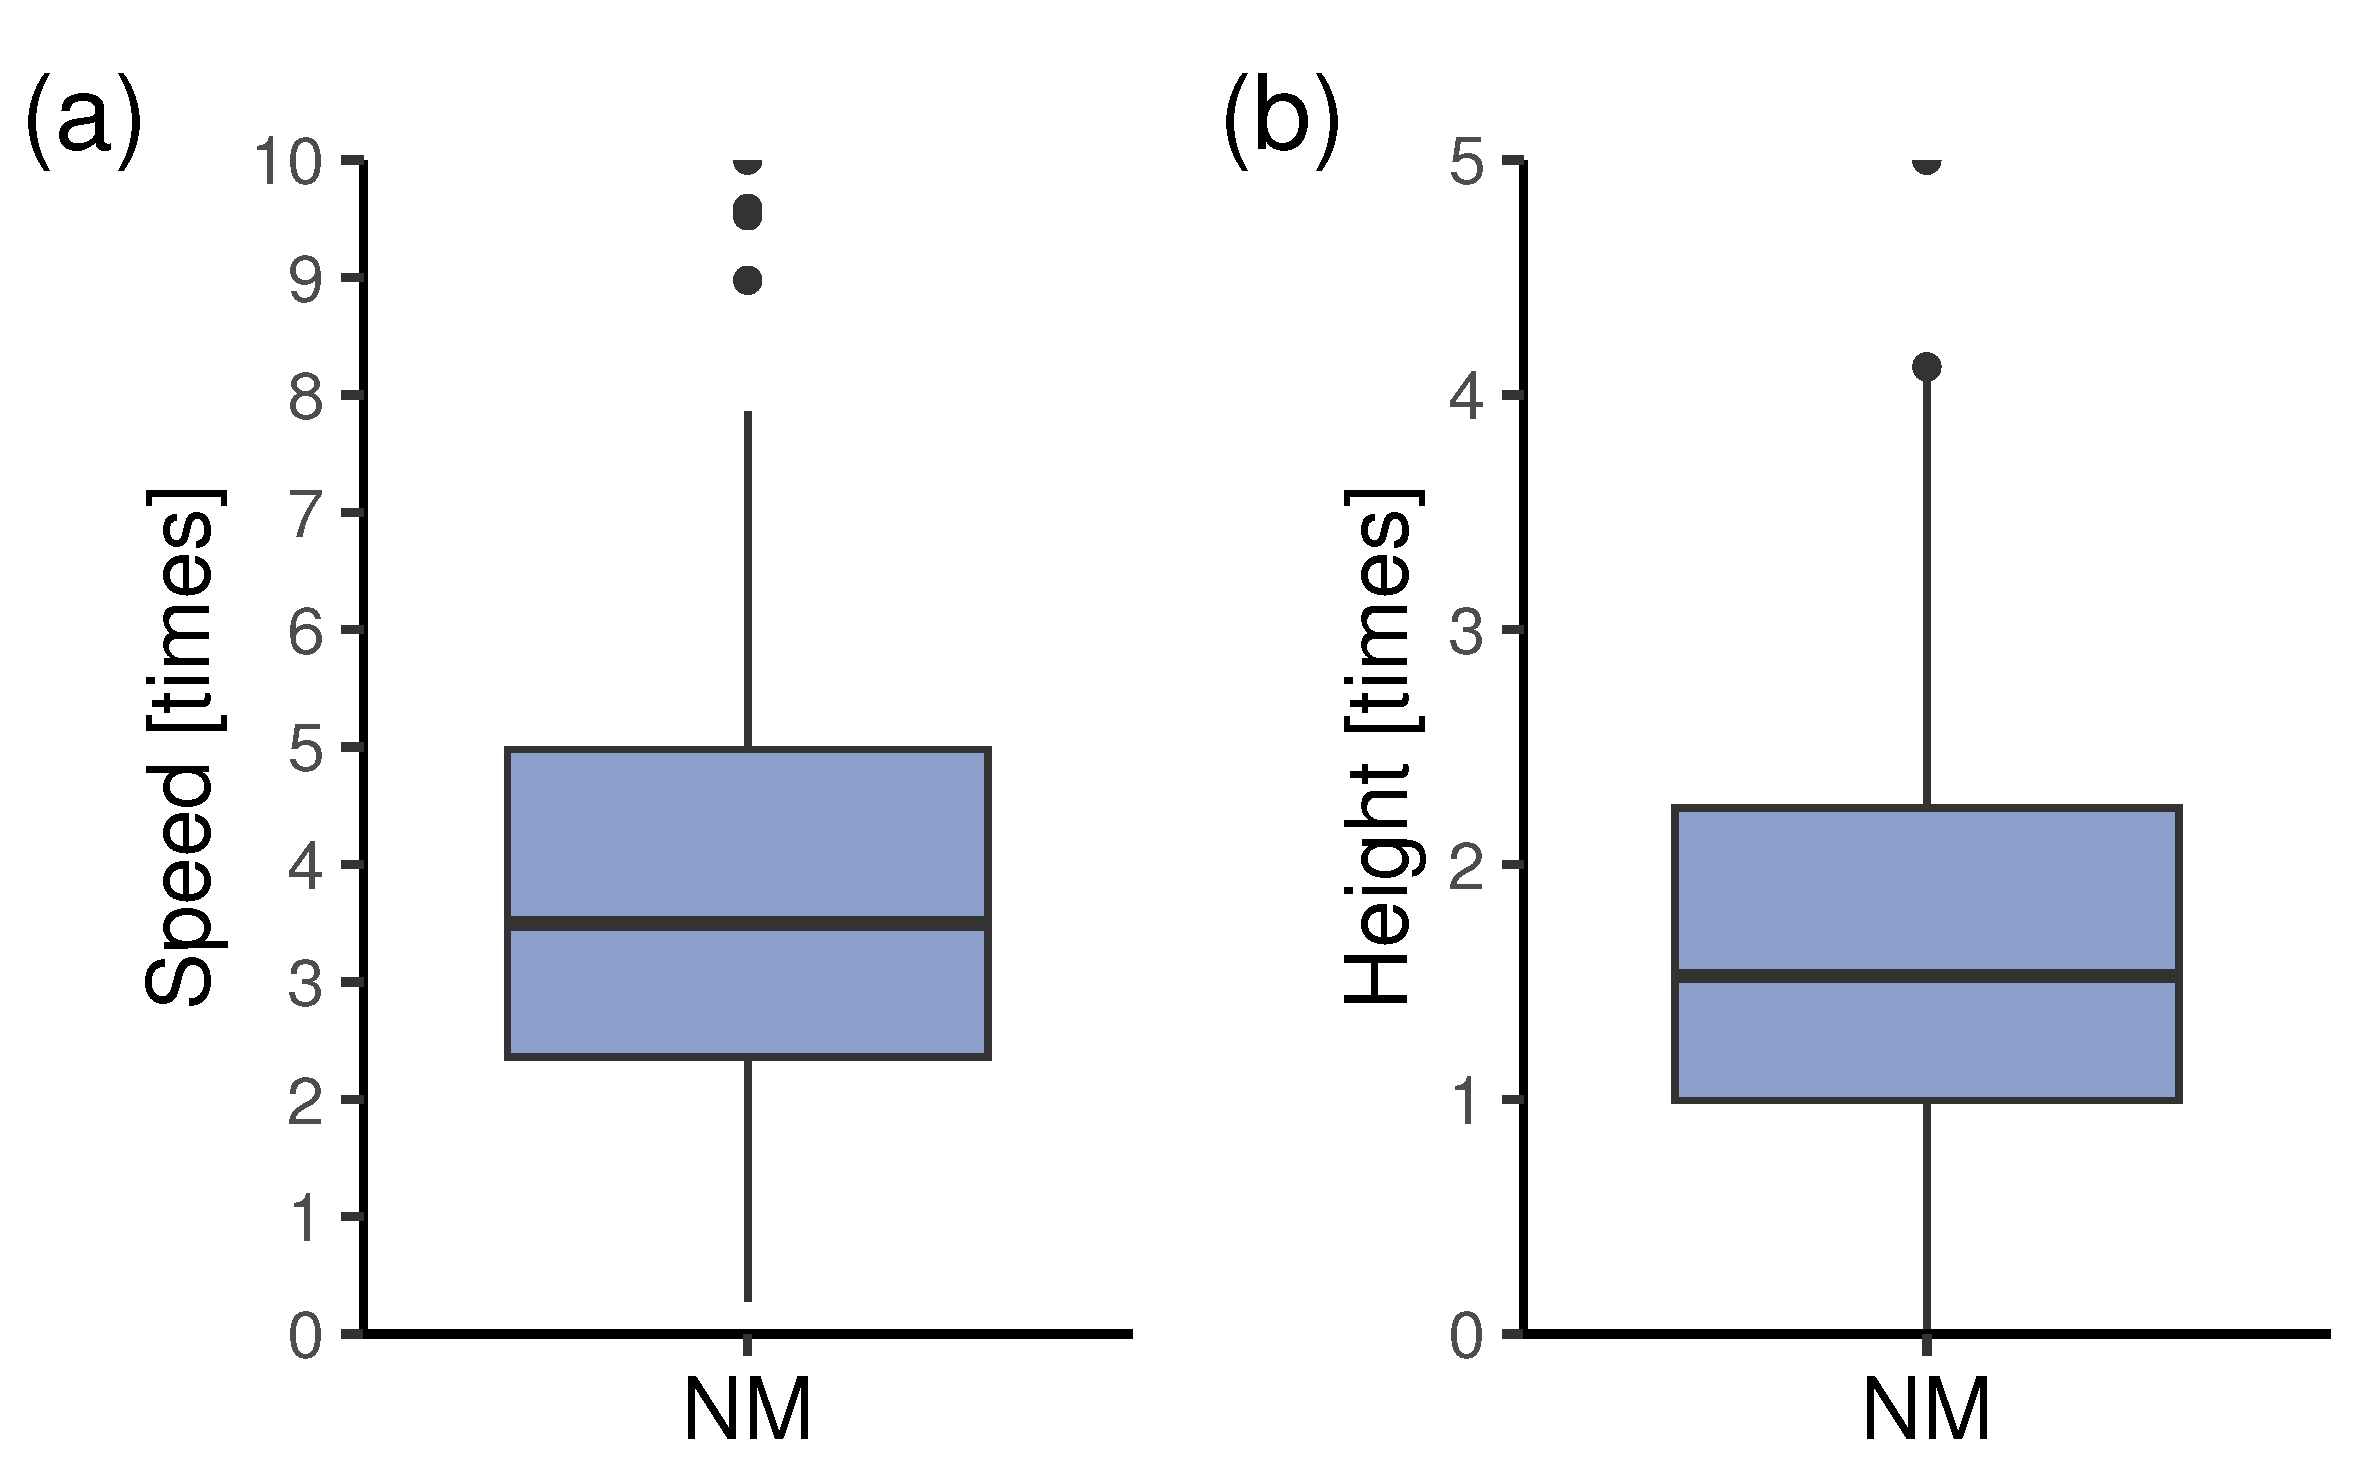
Figure 6.
The value of the intensity of randomness in the NM condition.
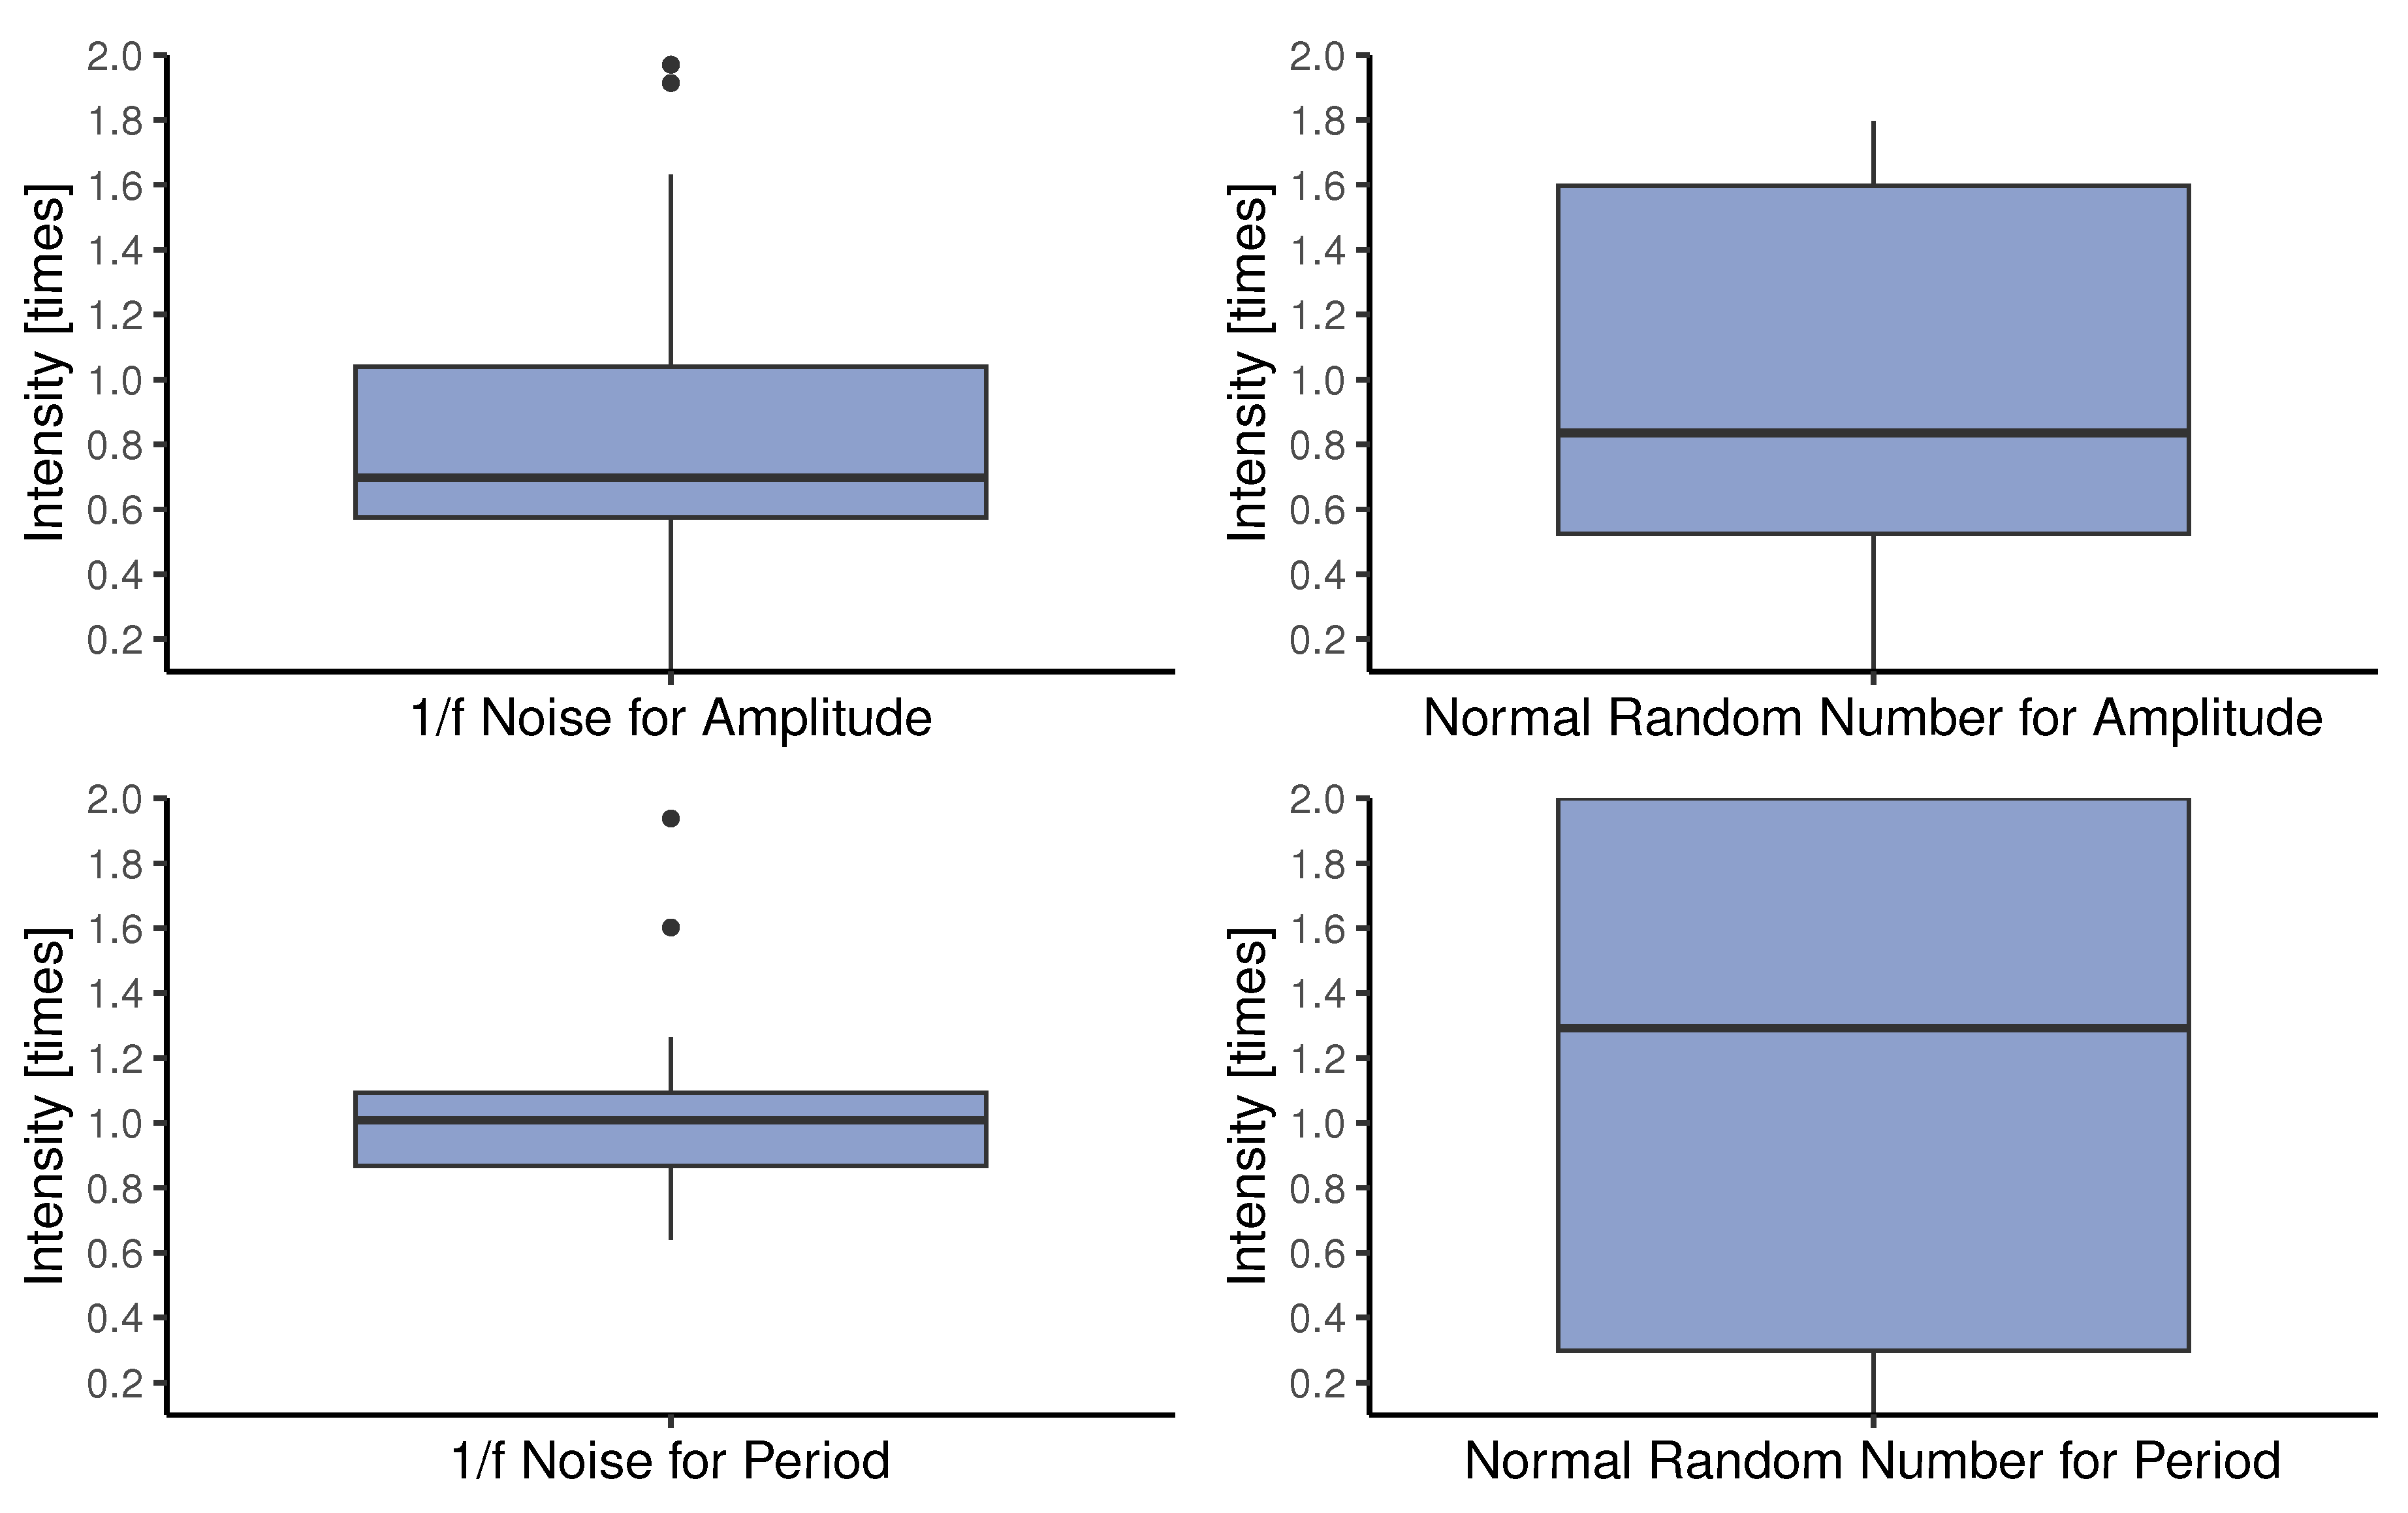
Figure 7.
The score of the importance of each parameter in the NM condition.
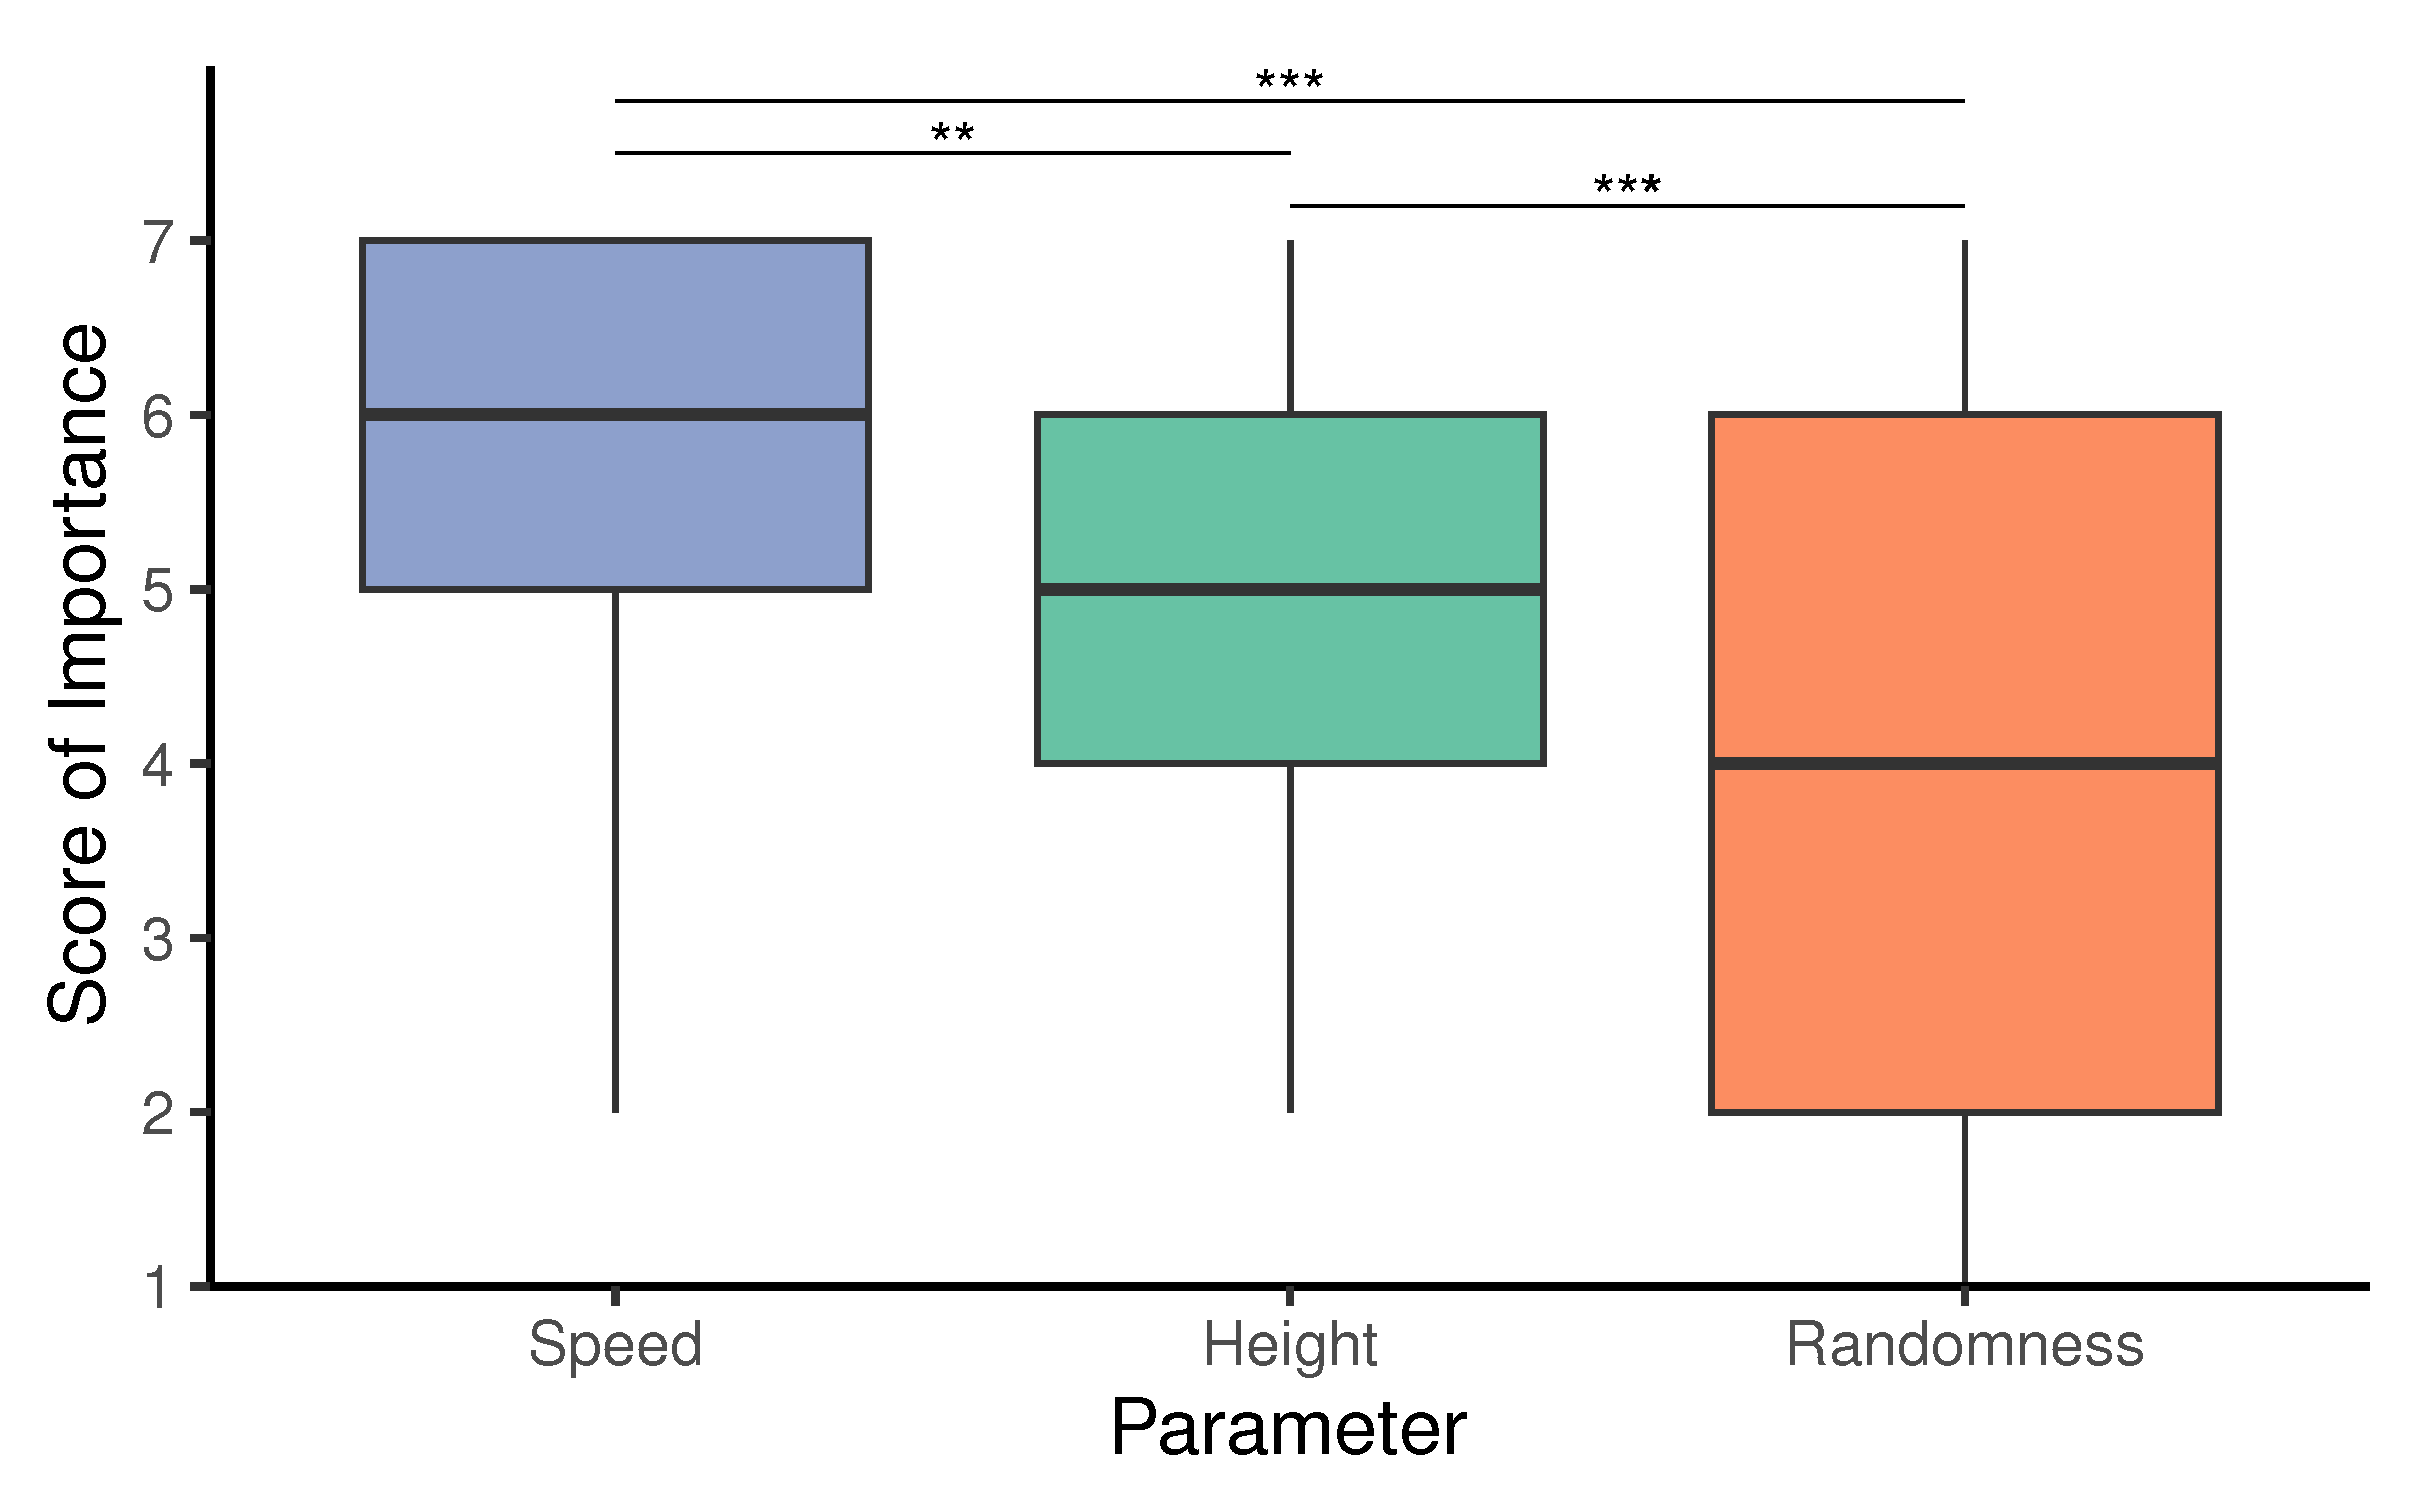
Figure 8.
The differential value from the NM condition for speed.
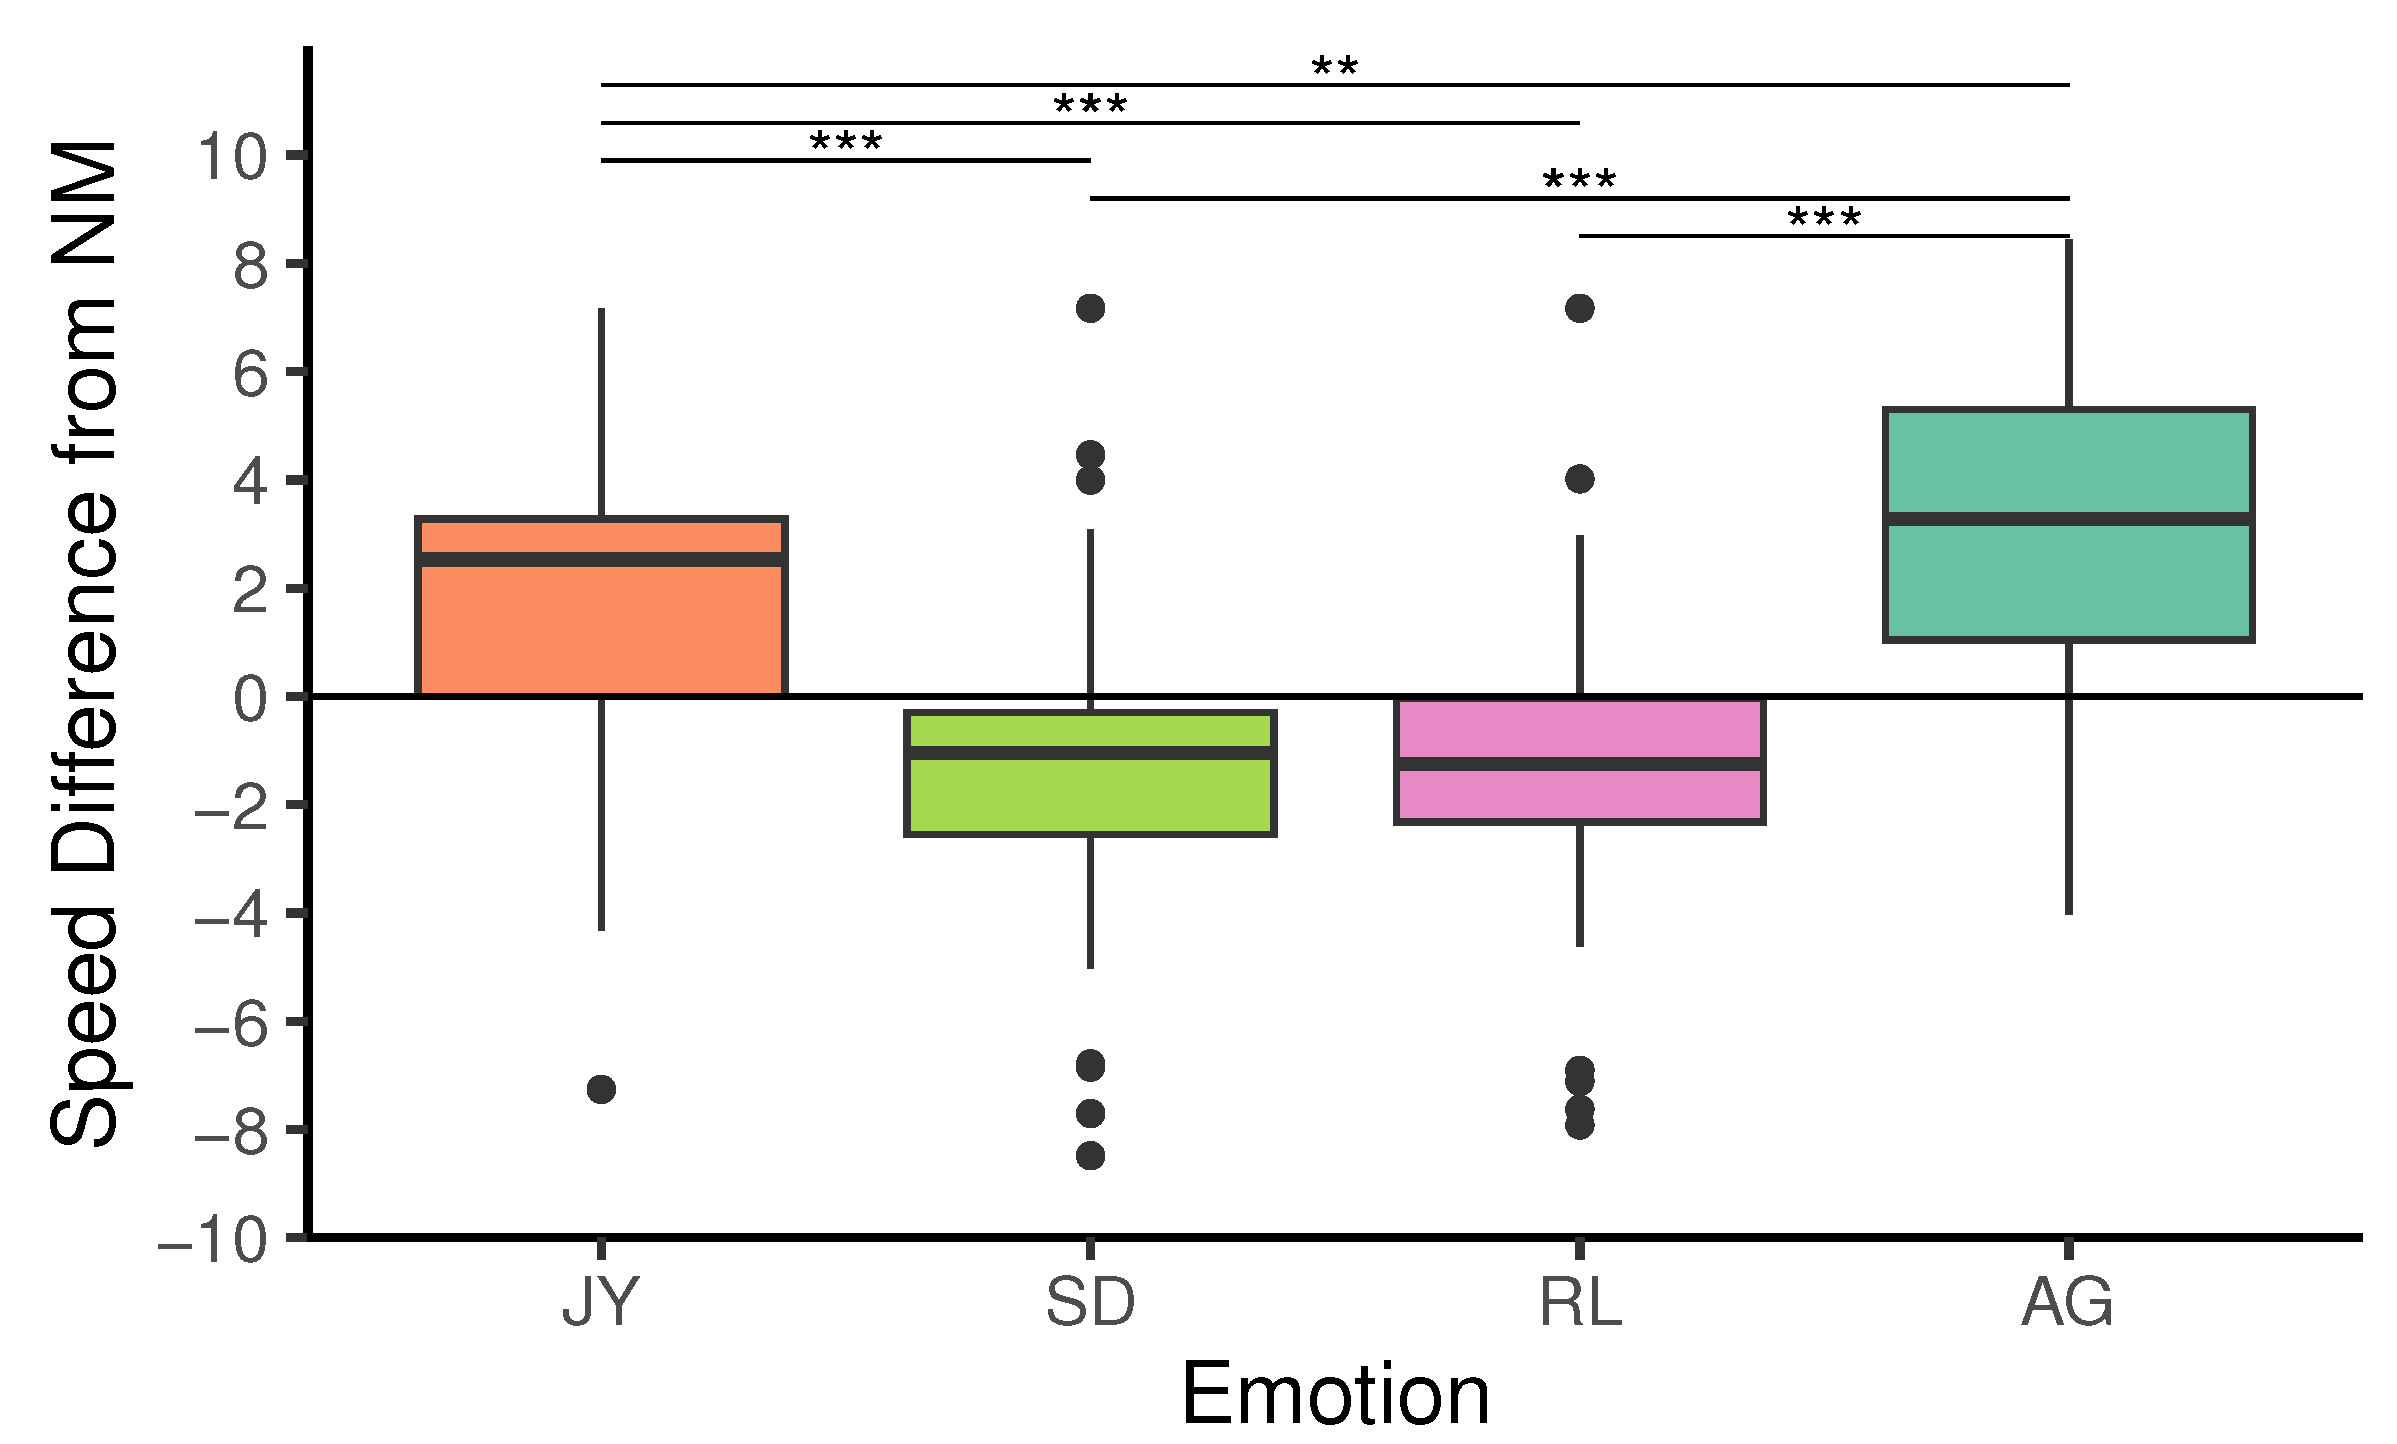
Figure 9.
The differential value from the NM condition for height.
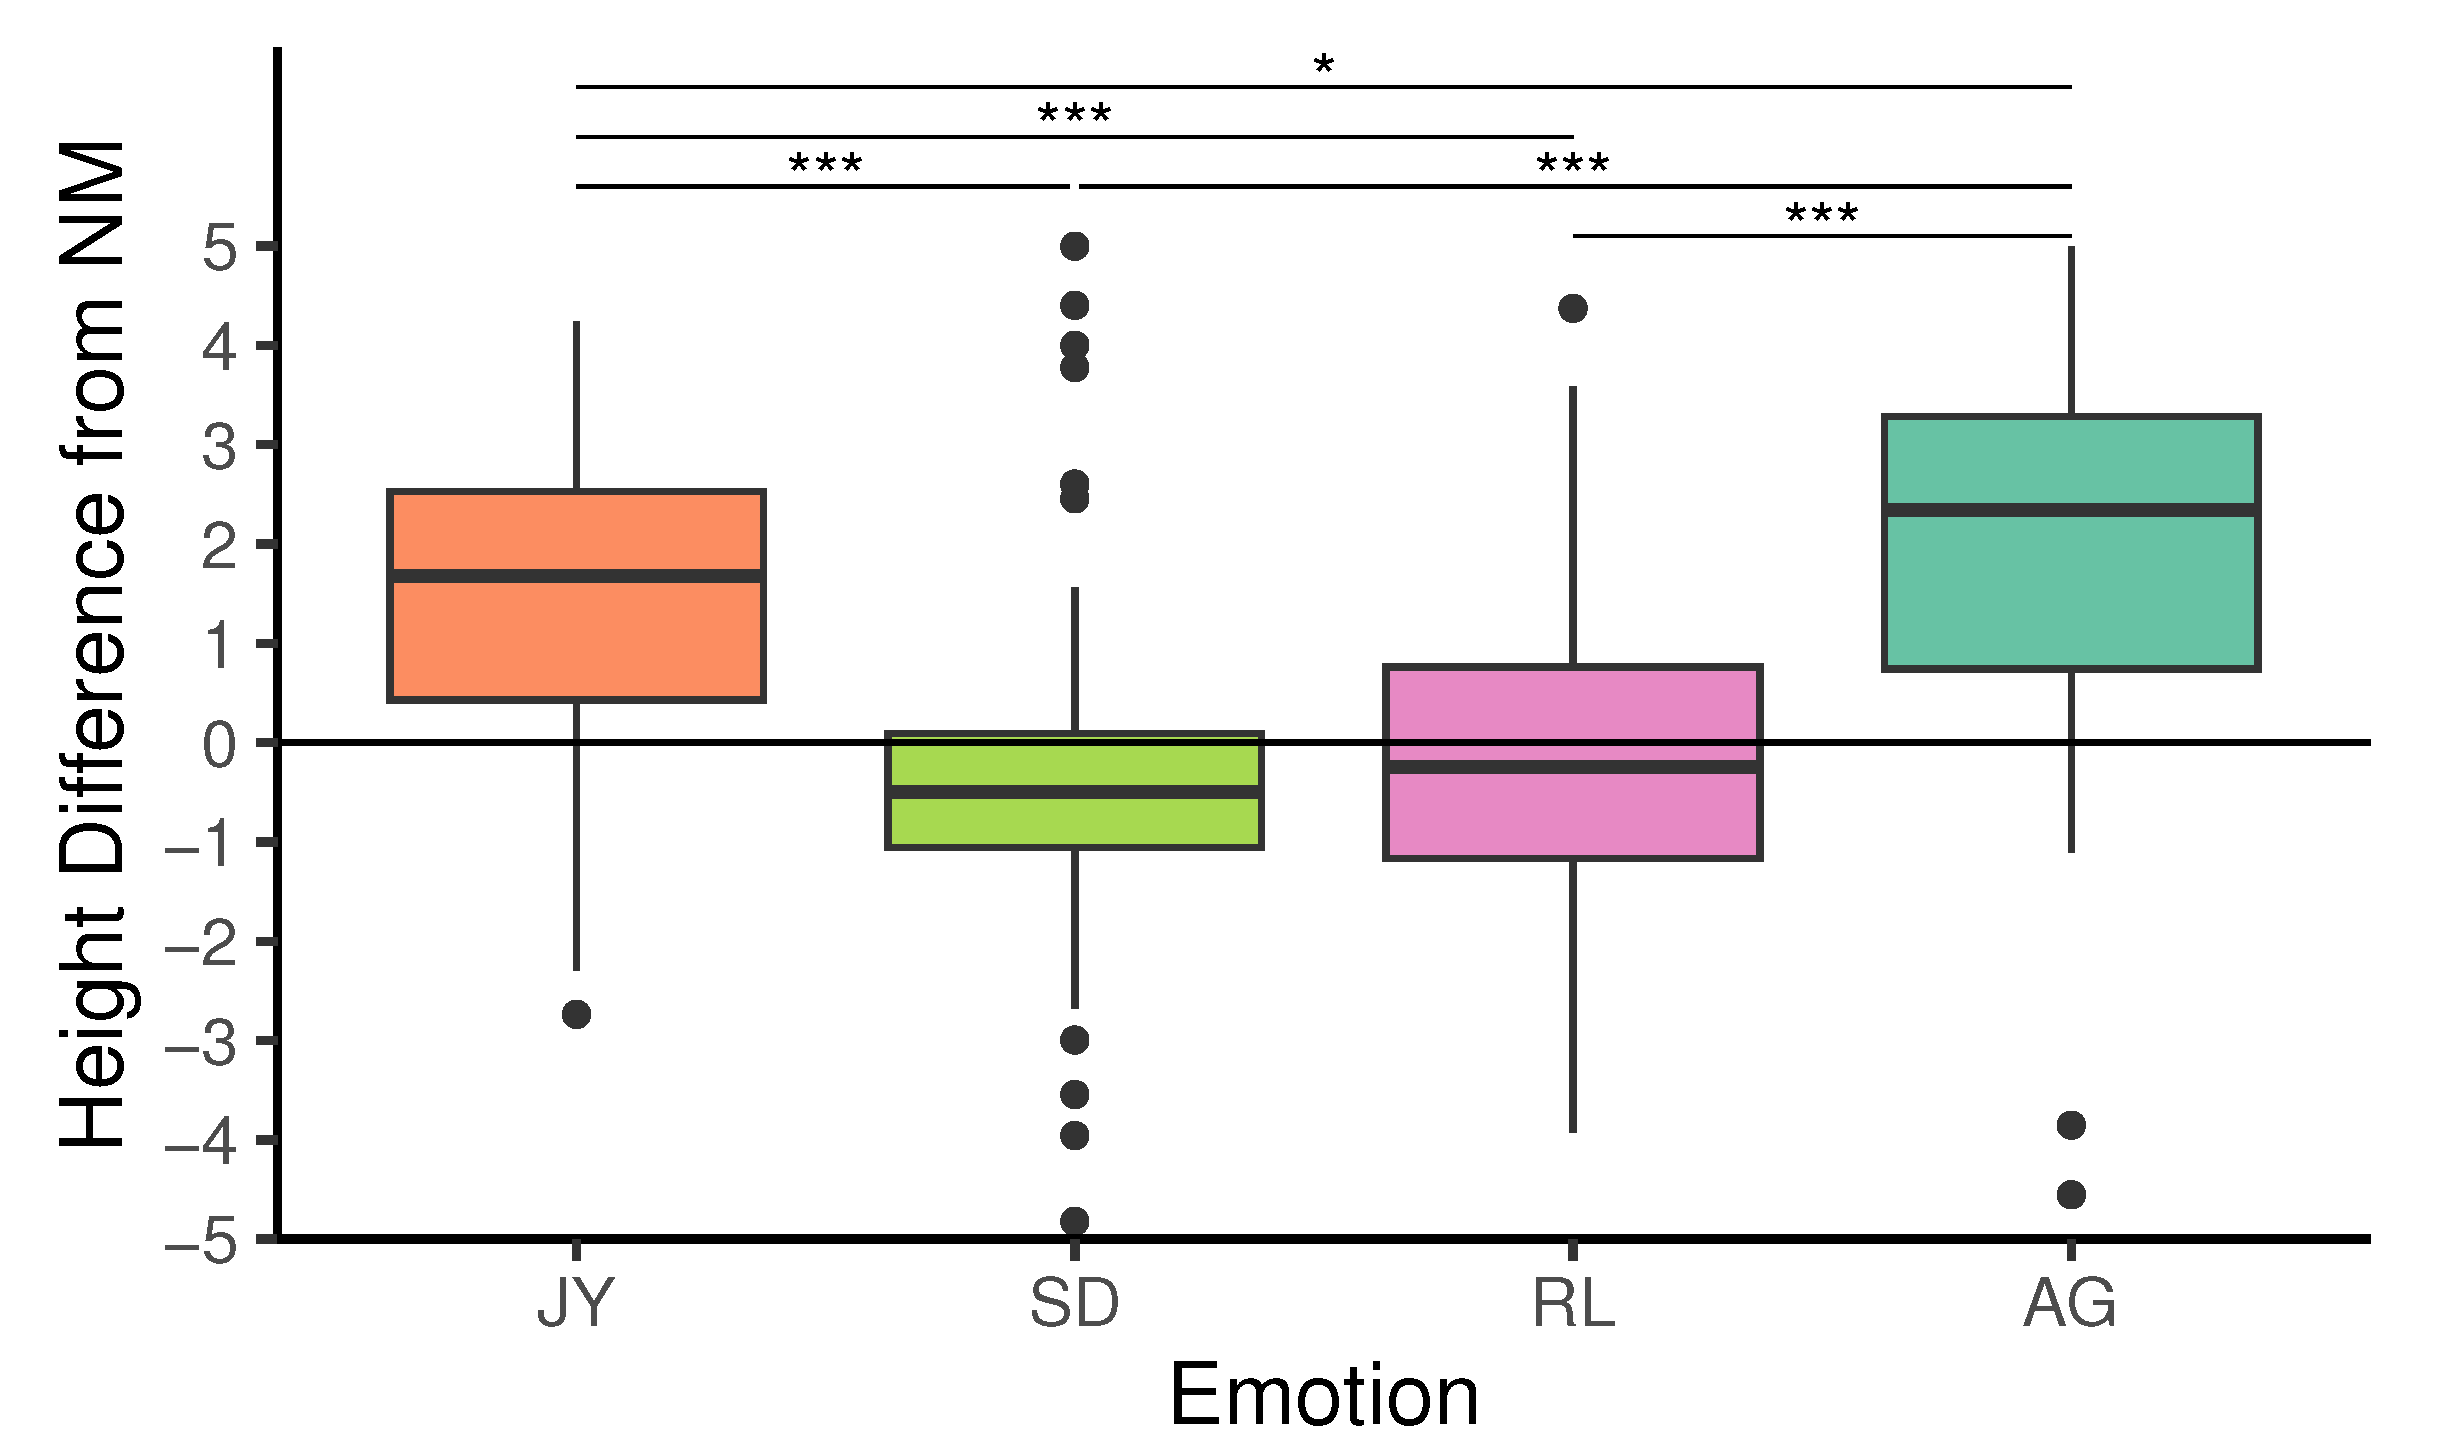
Figure 10.
The score for the degree of “organic-like” perception in each condition in Experiment 1.
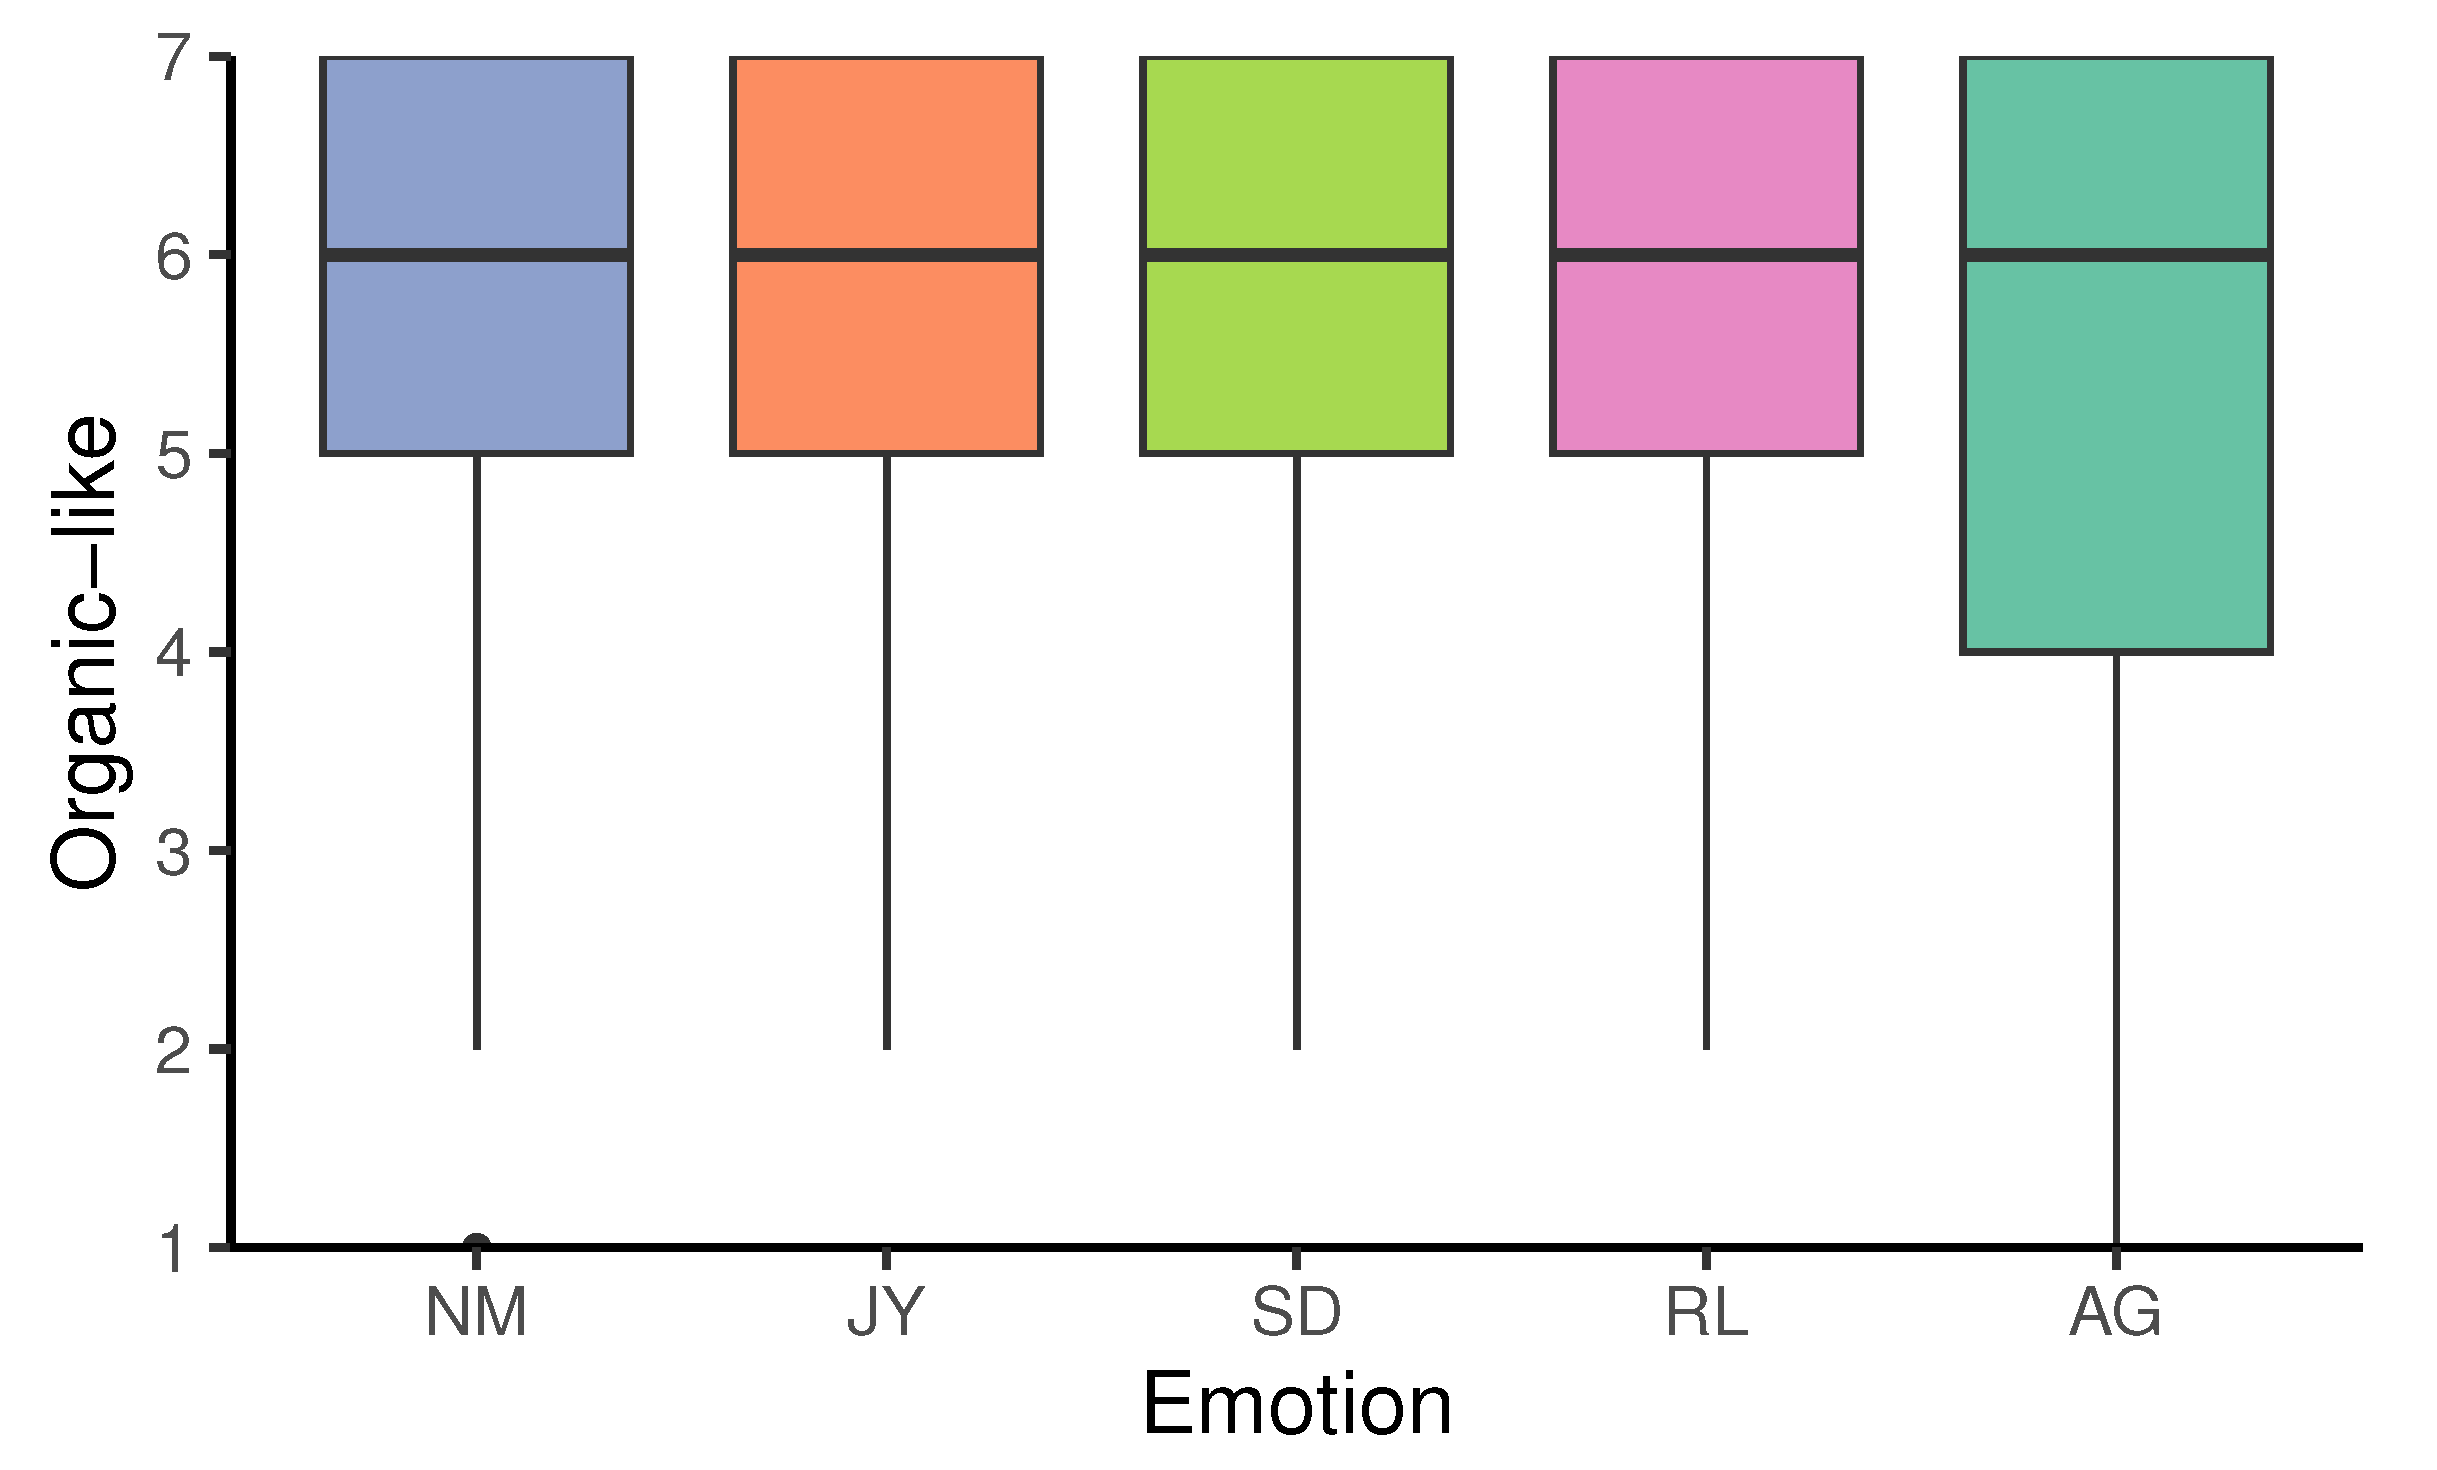
Figure 11.
The screenshot of the robot simulator.
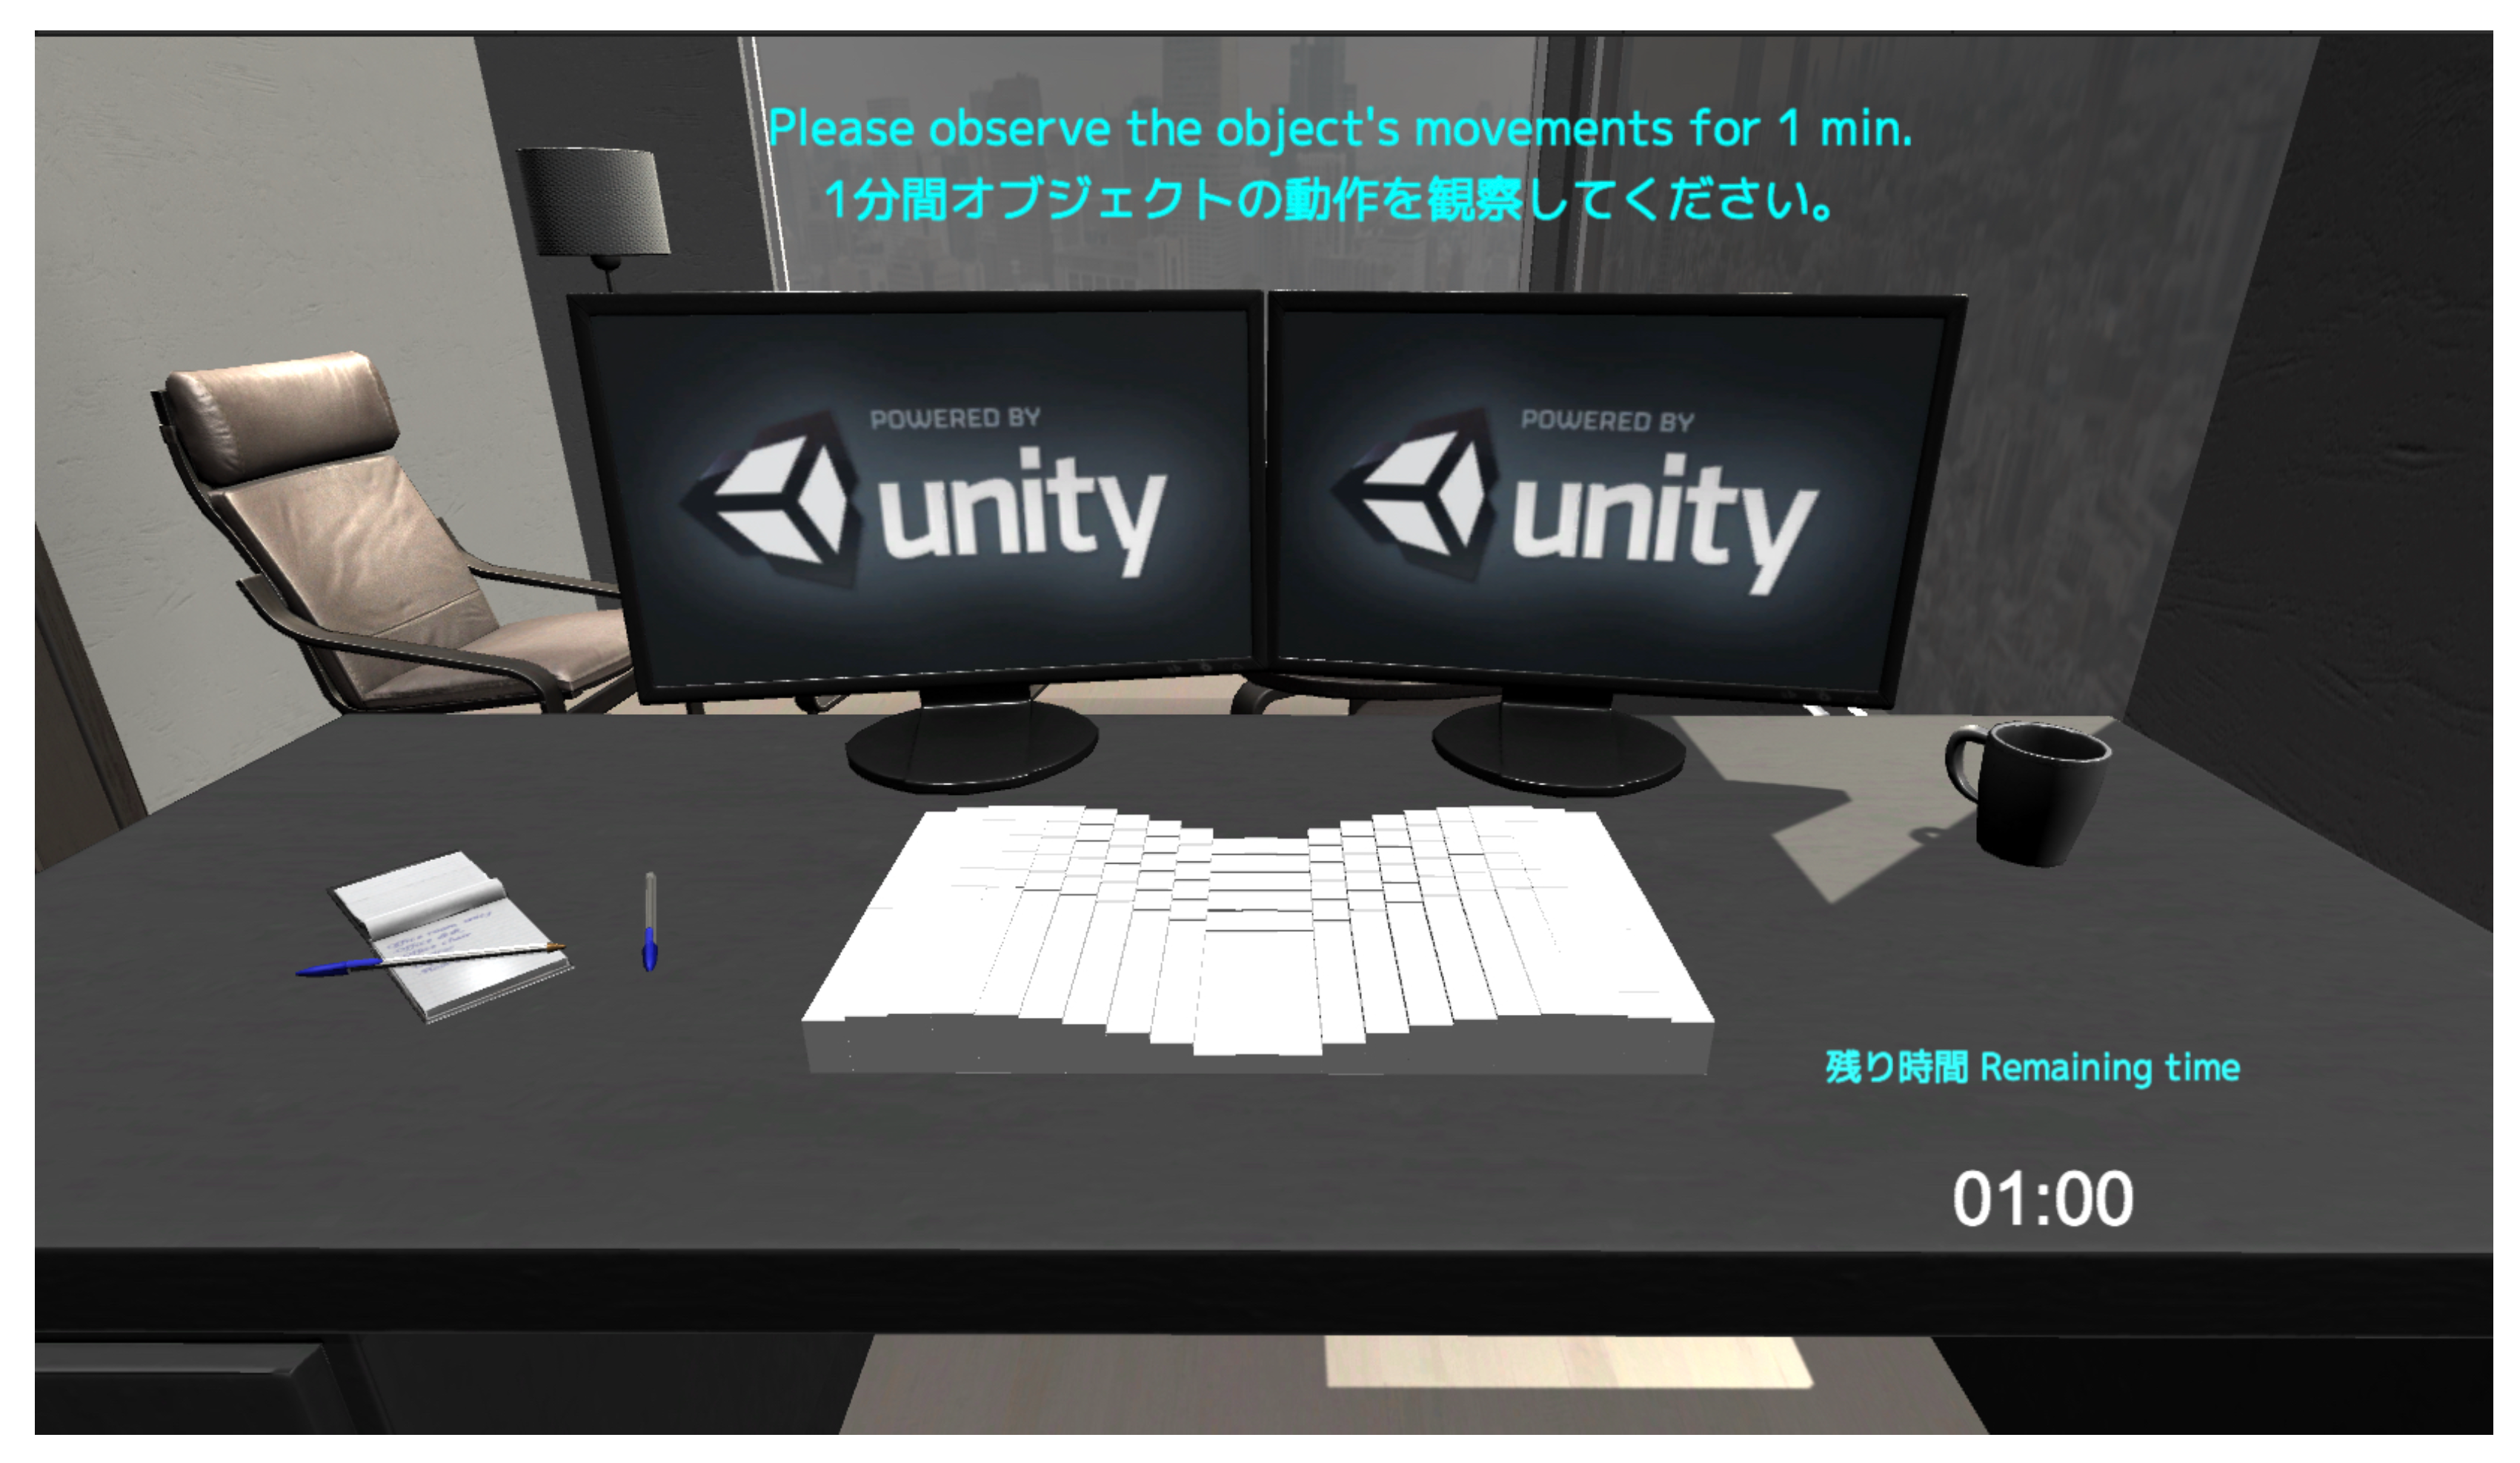
Figure 12.
The system configuration used in Experiment 2.
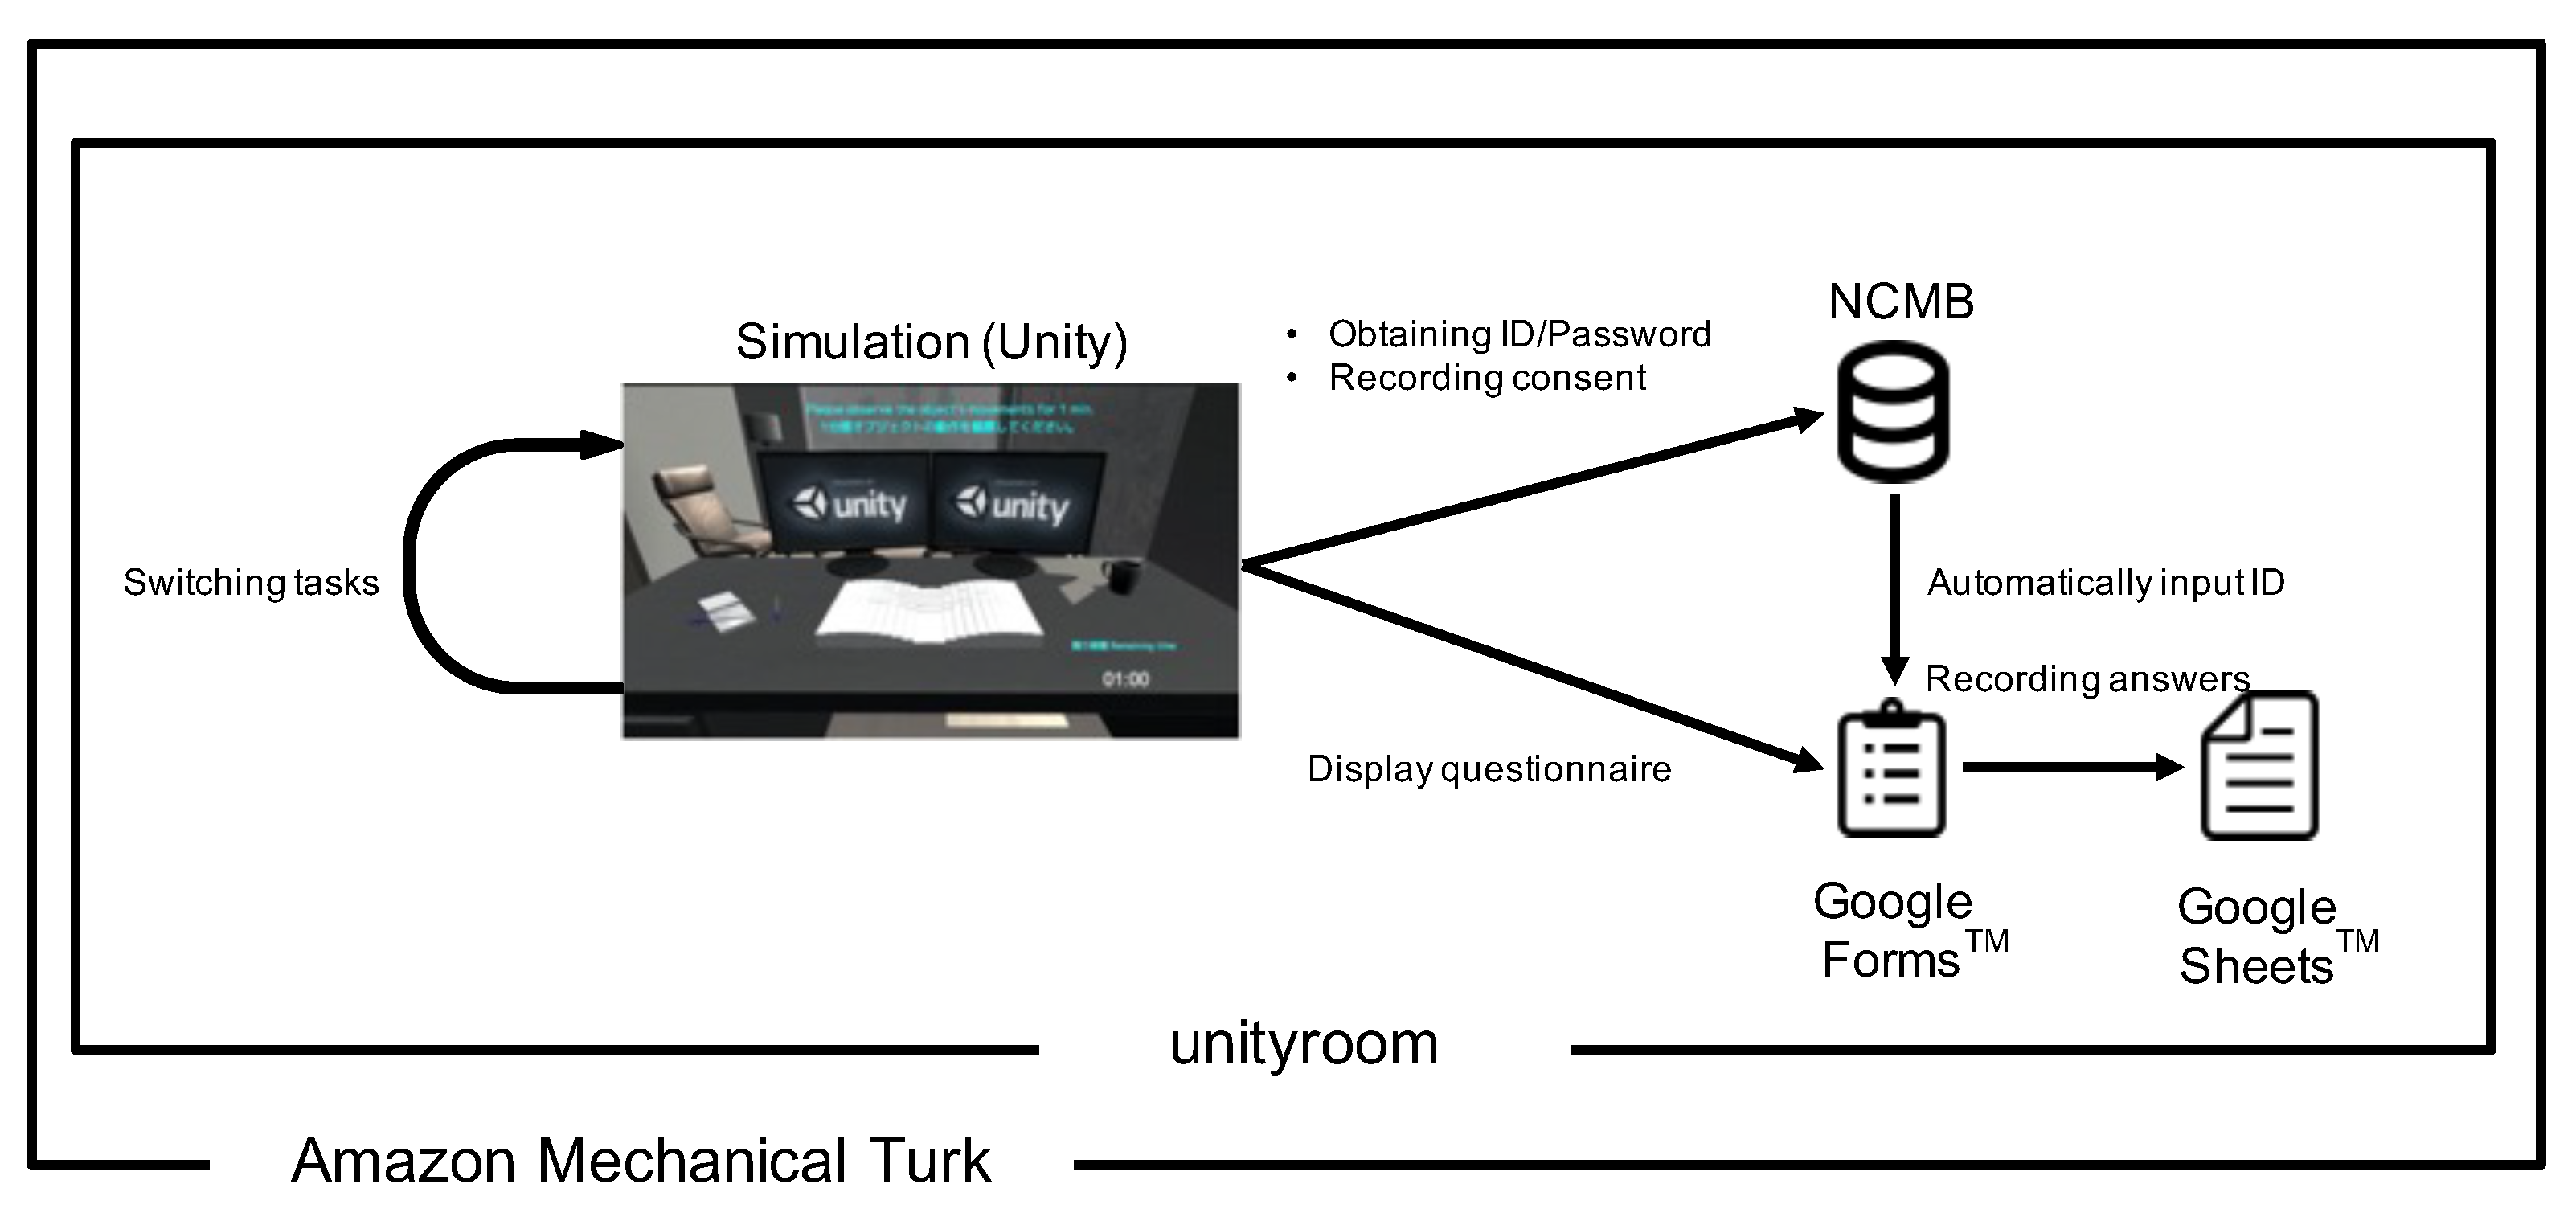
Figure 13.
The score of “organic-like” in each condition in Experiment 2.
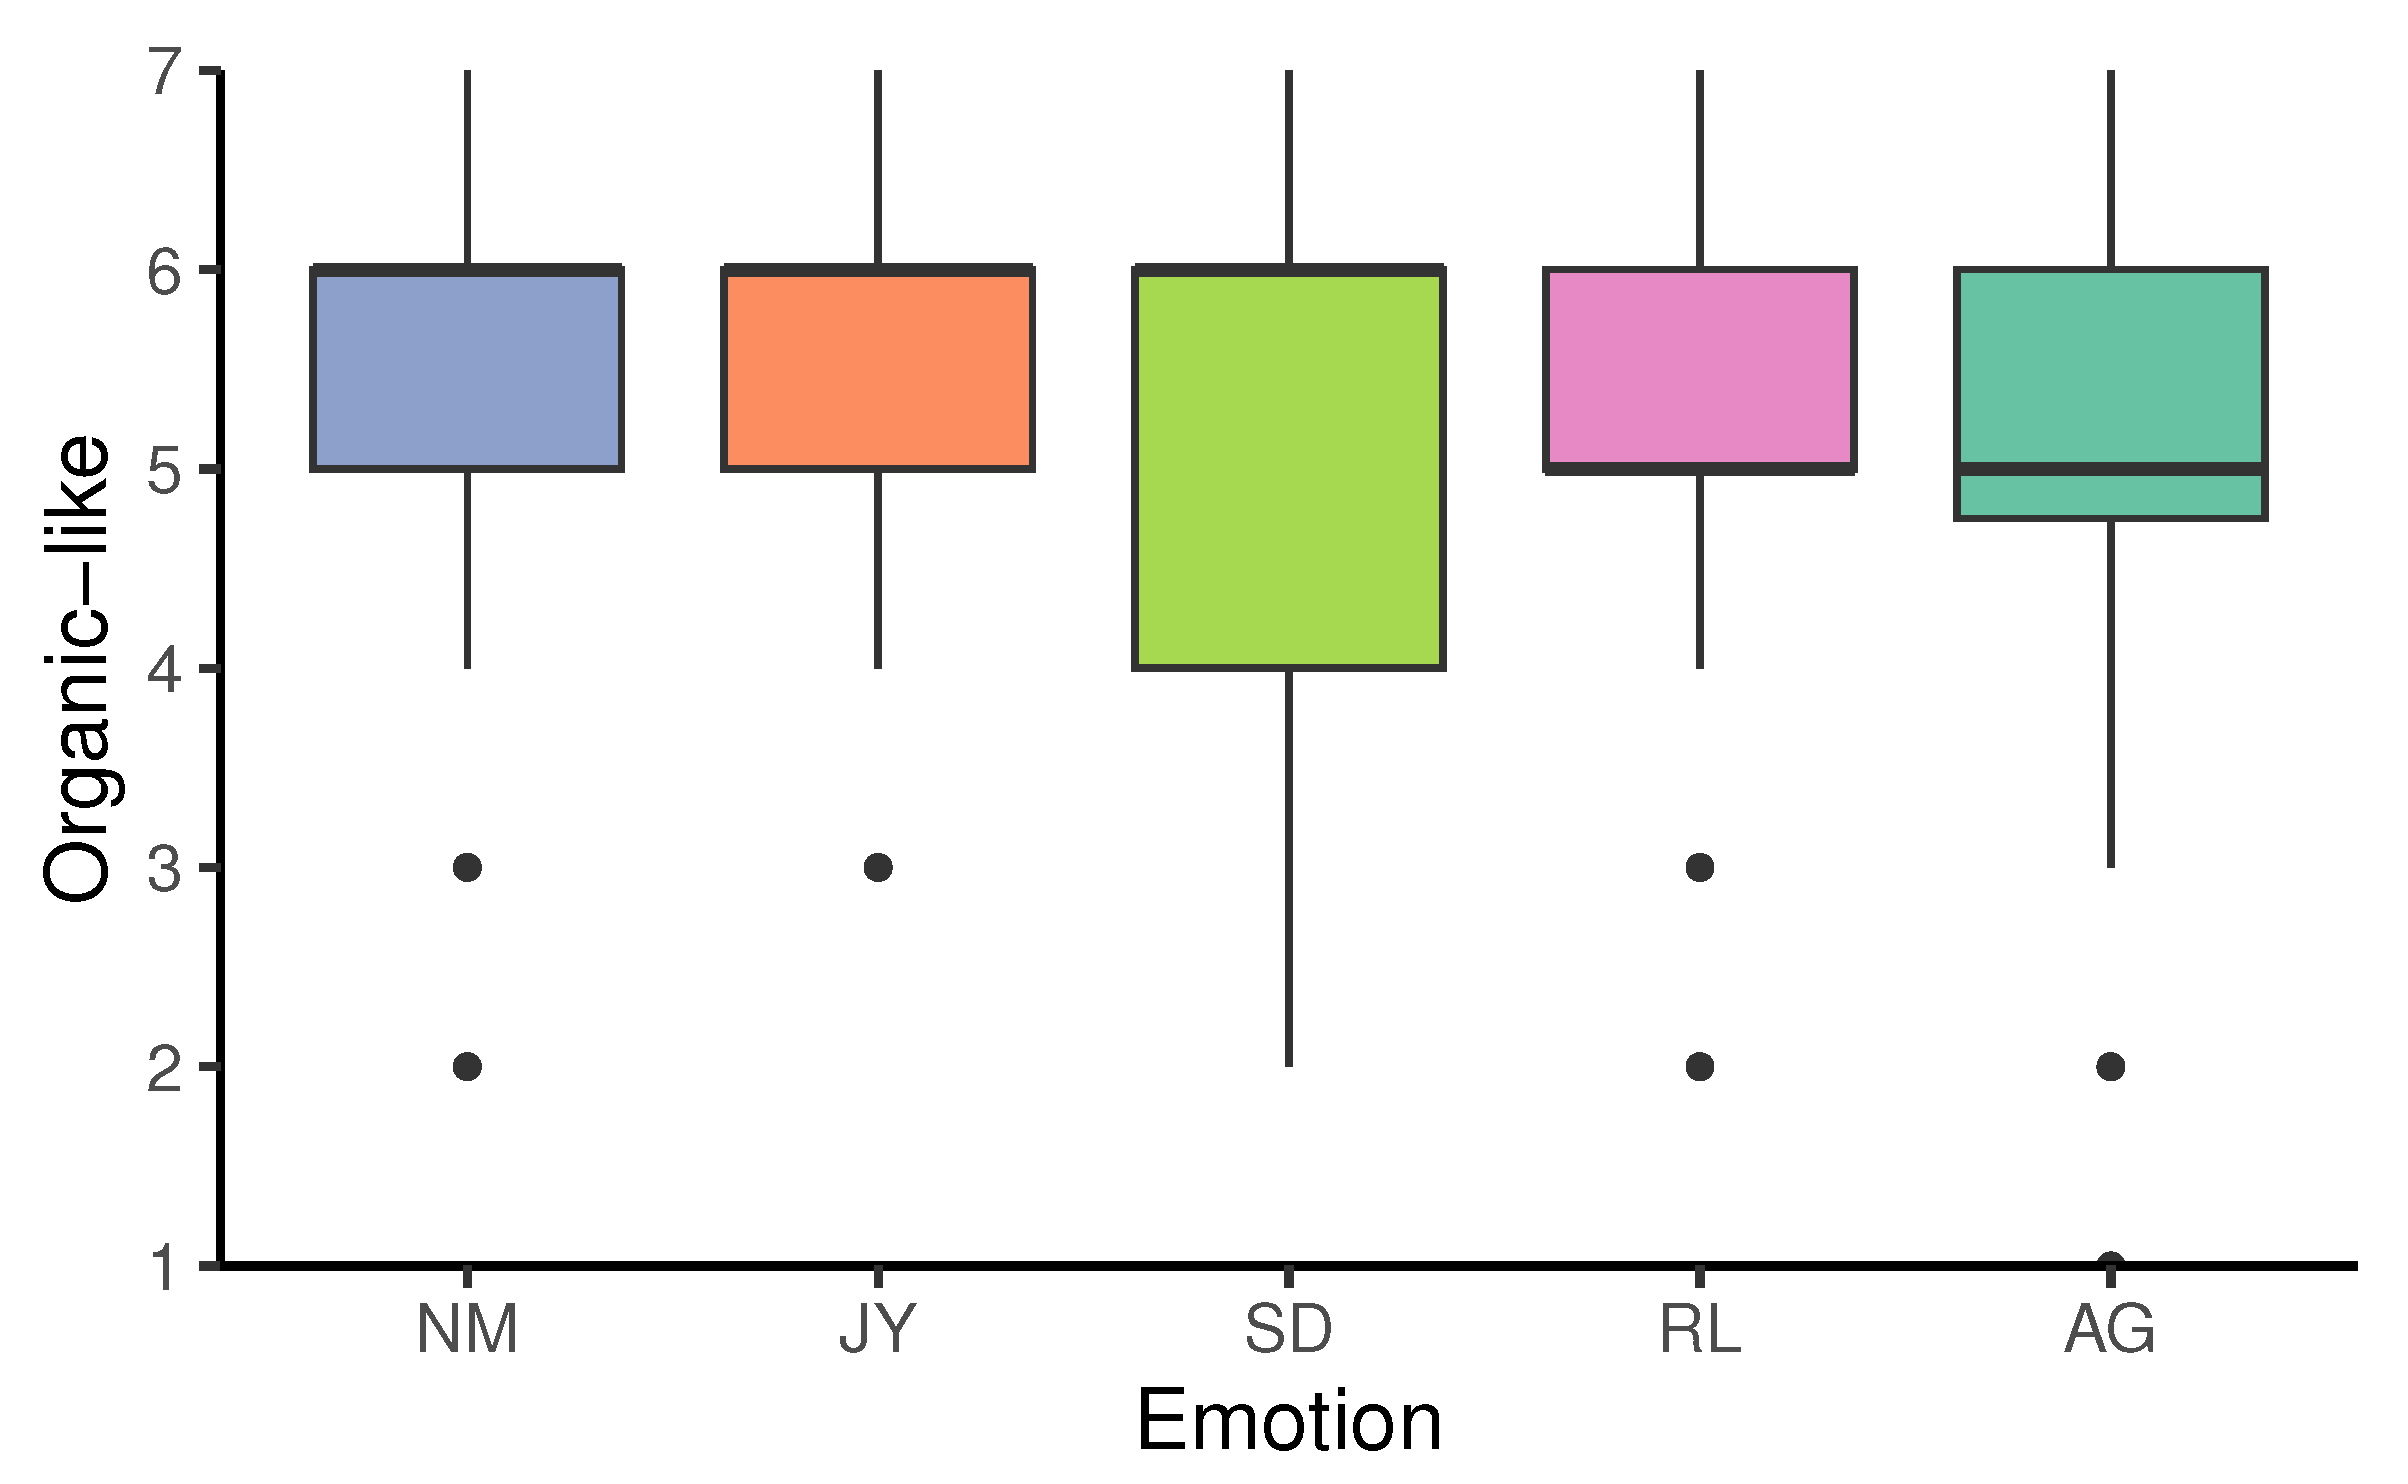
Figure 14.
The score of arousal level in each condition.
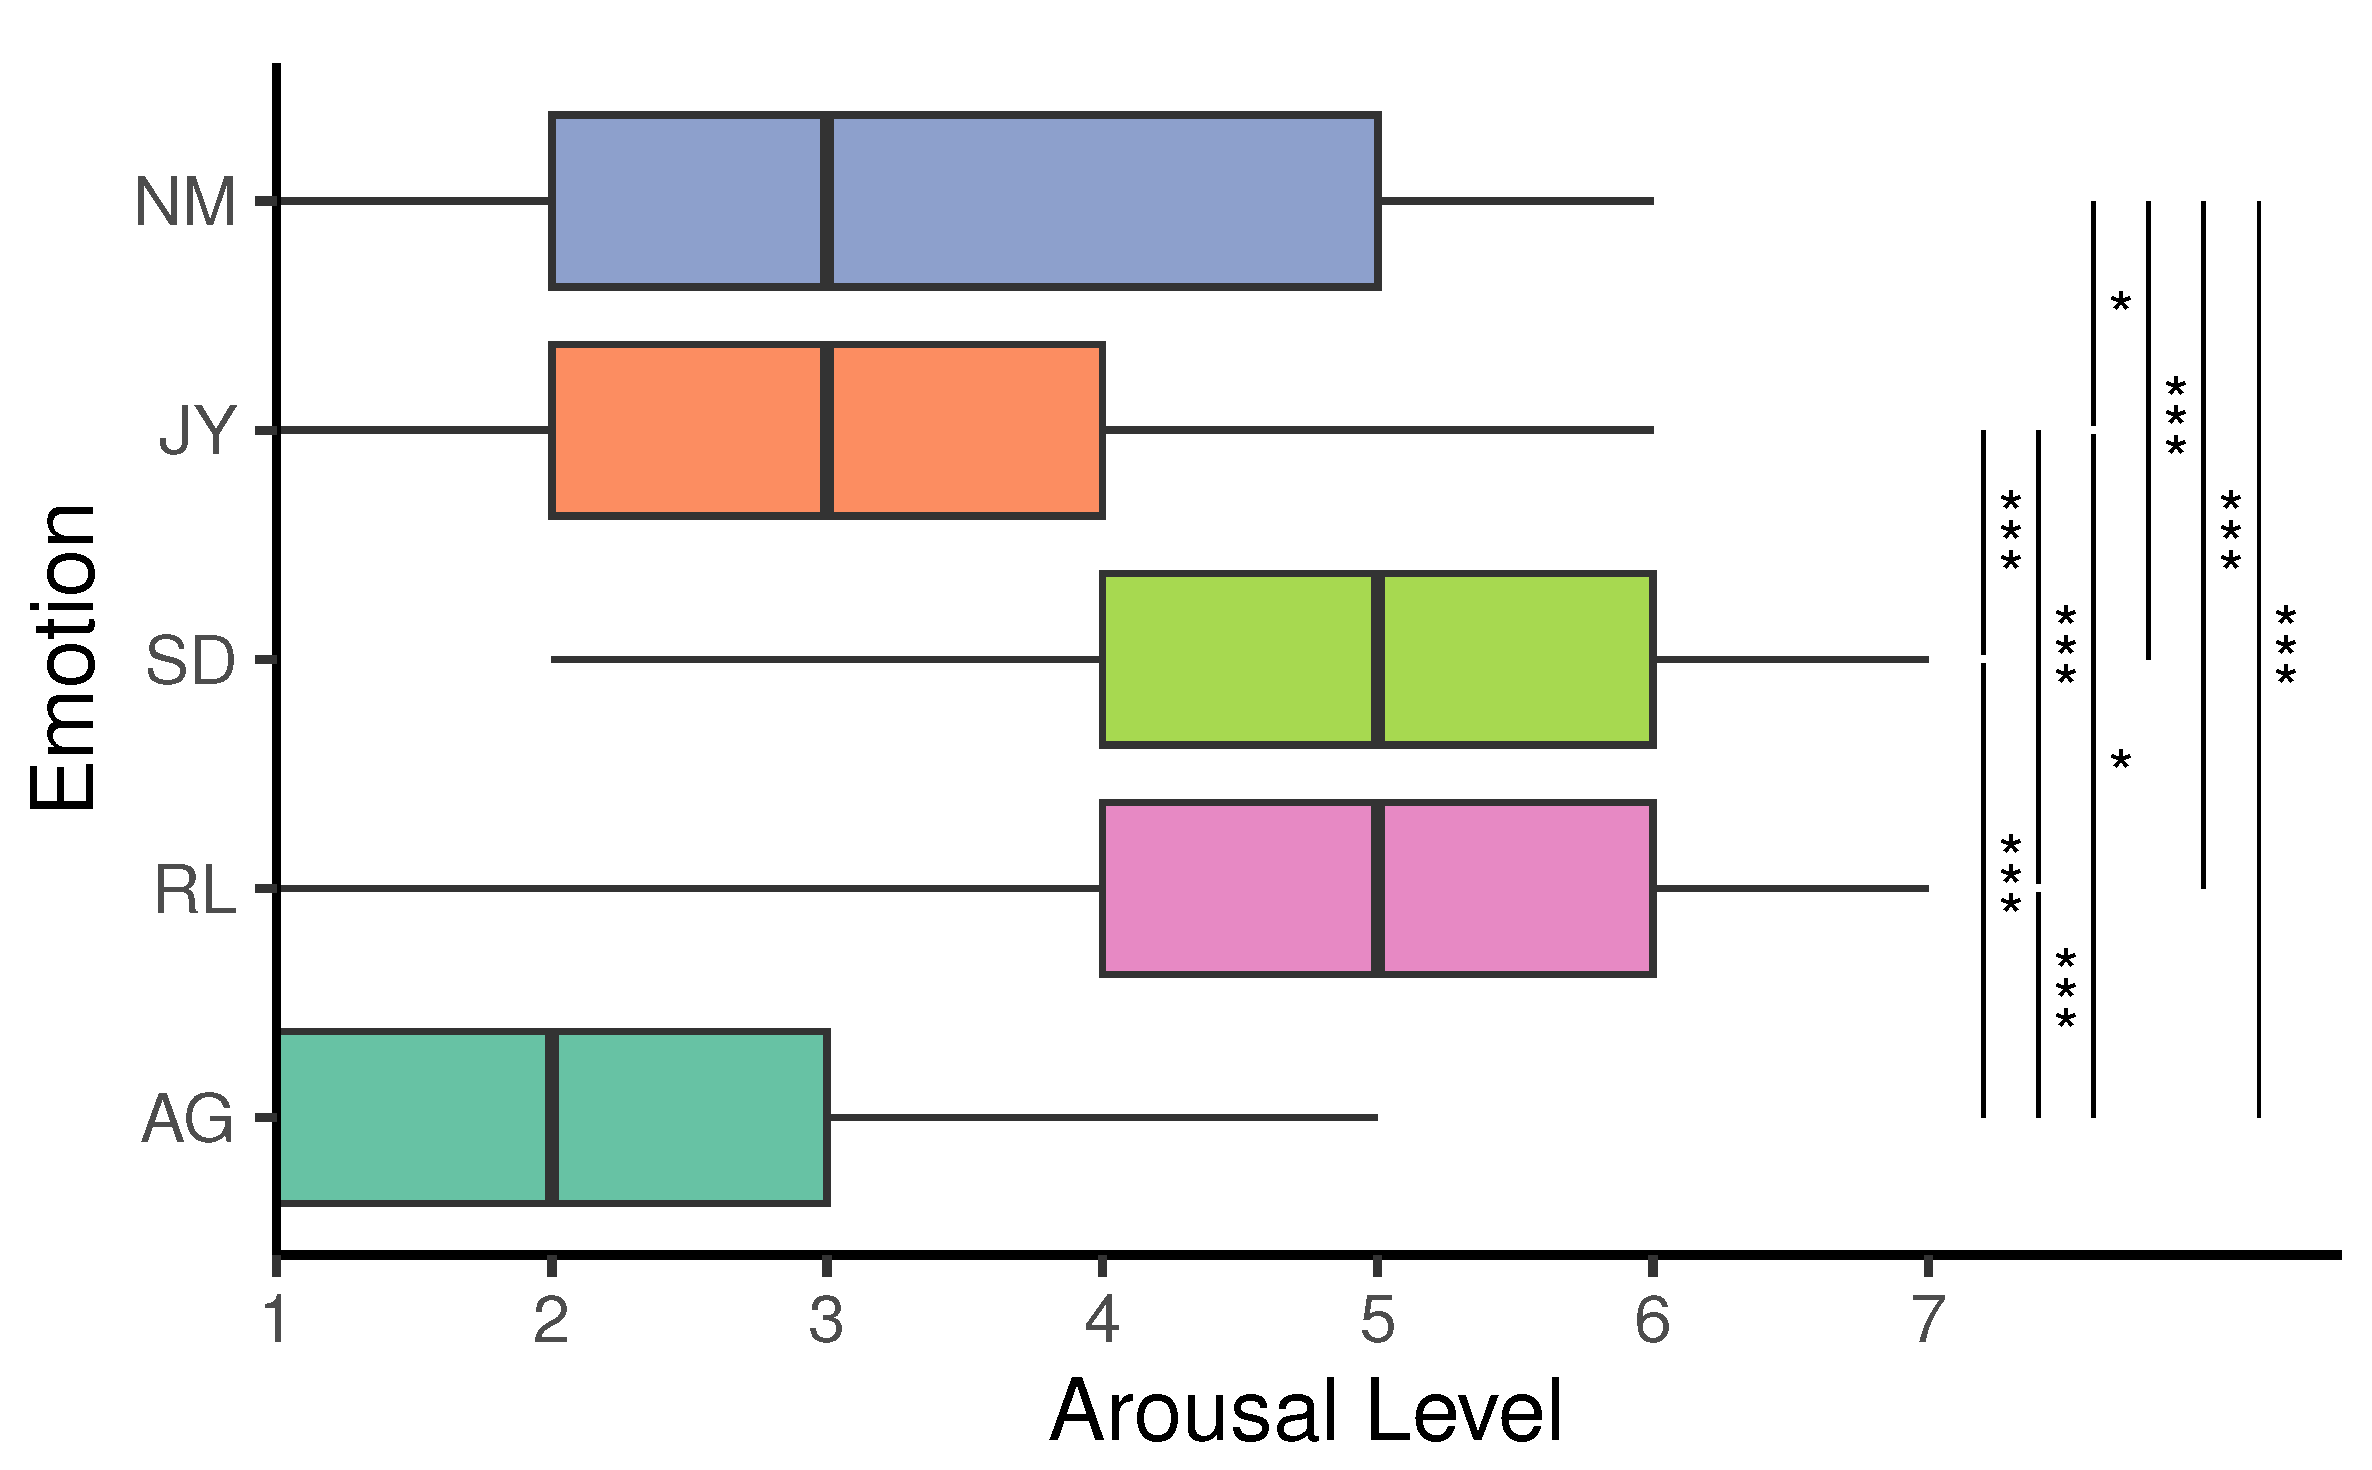
Figure 15.
The score of valence in each condition.
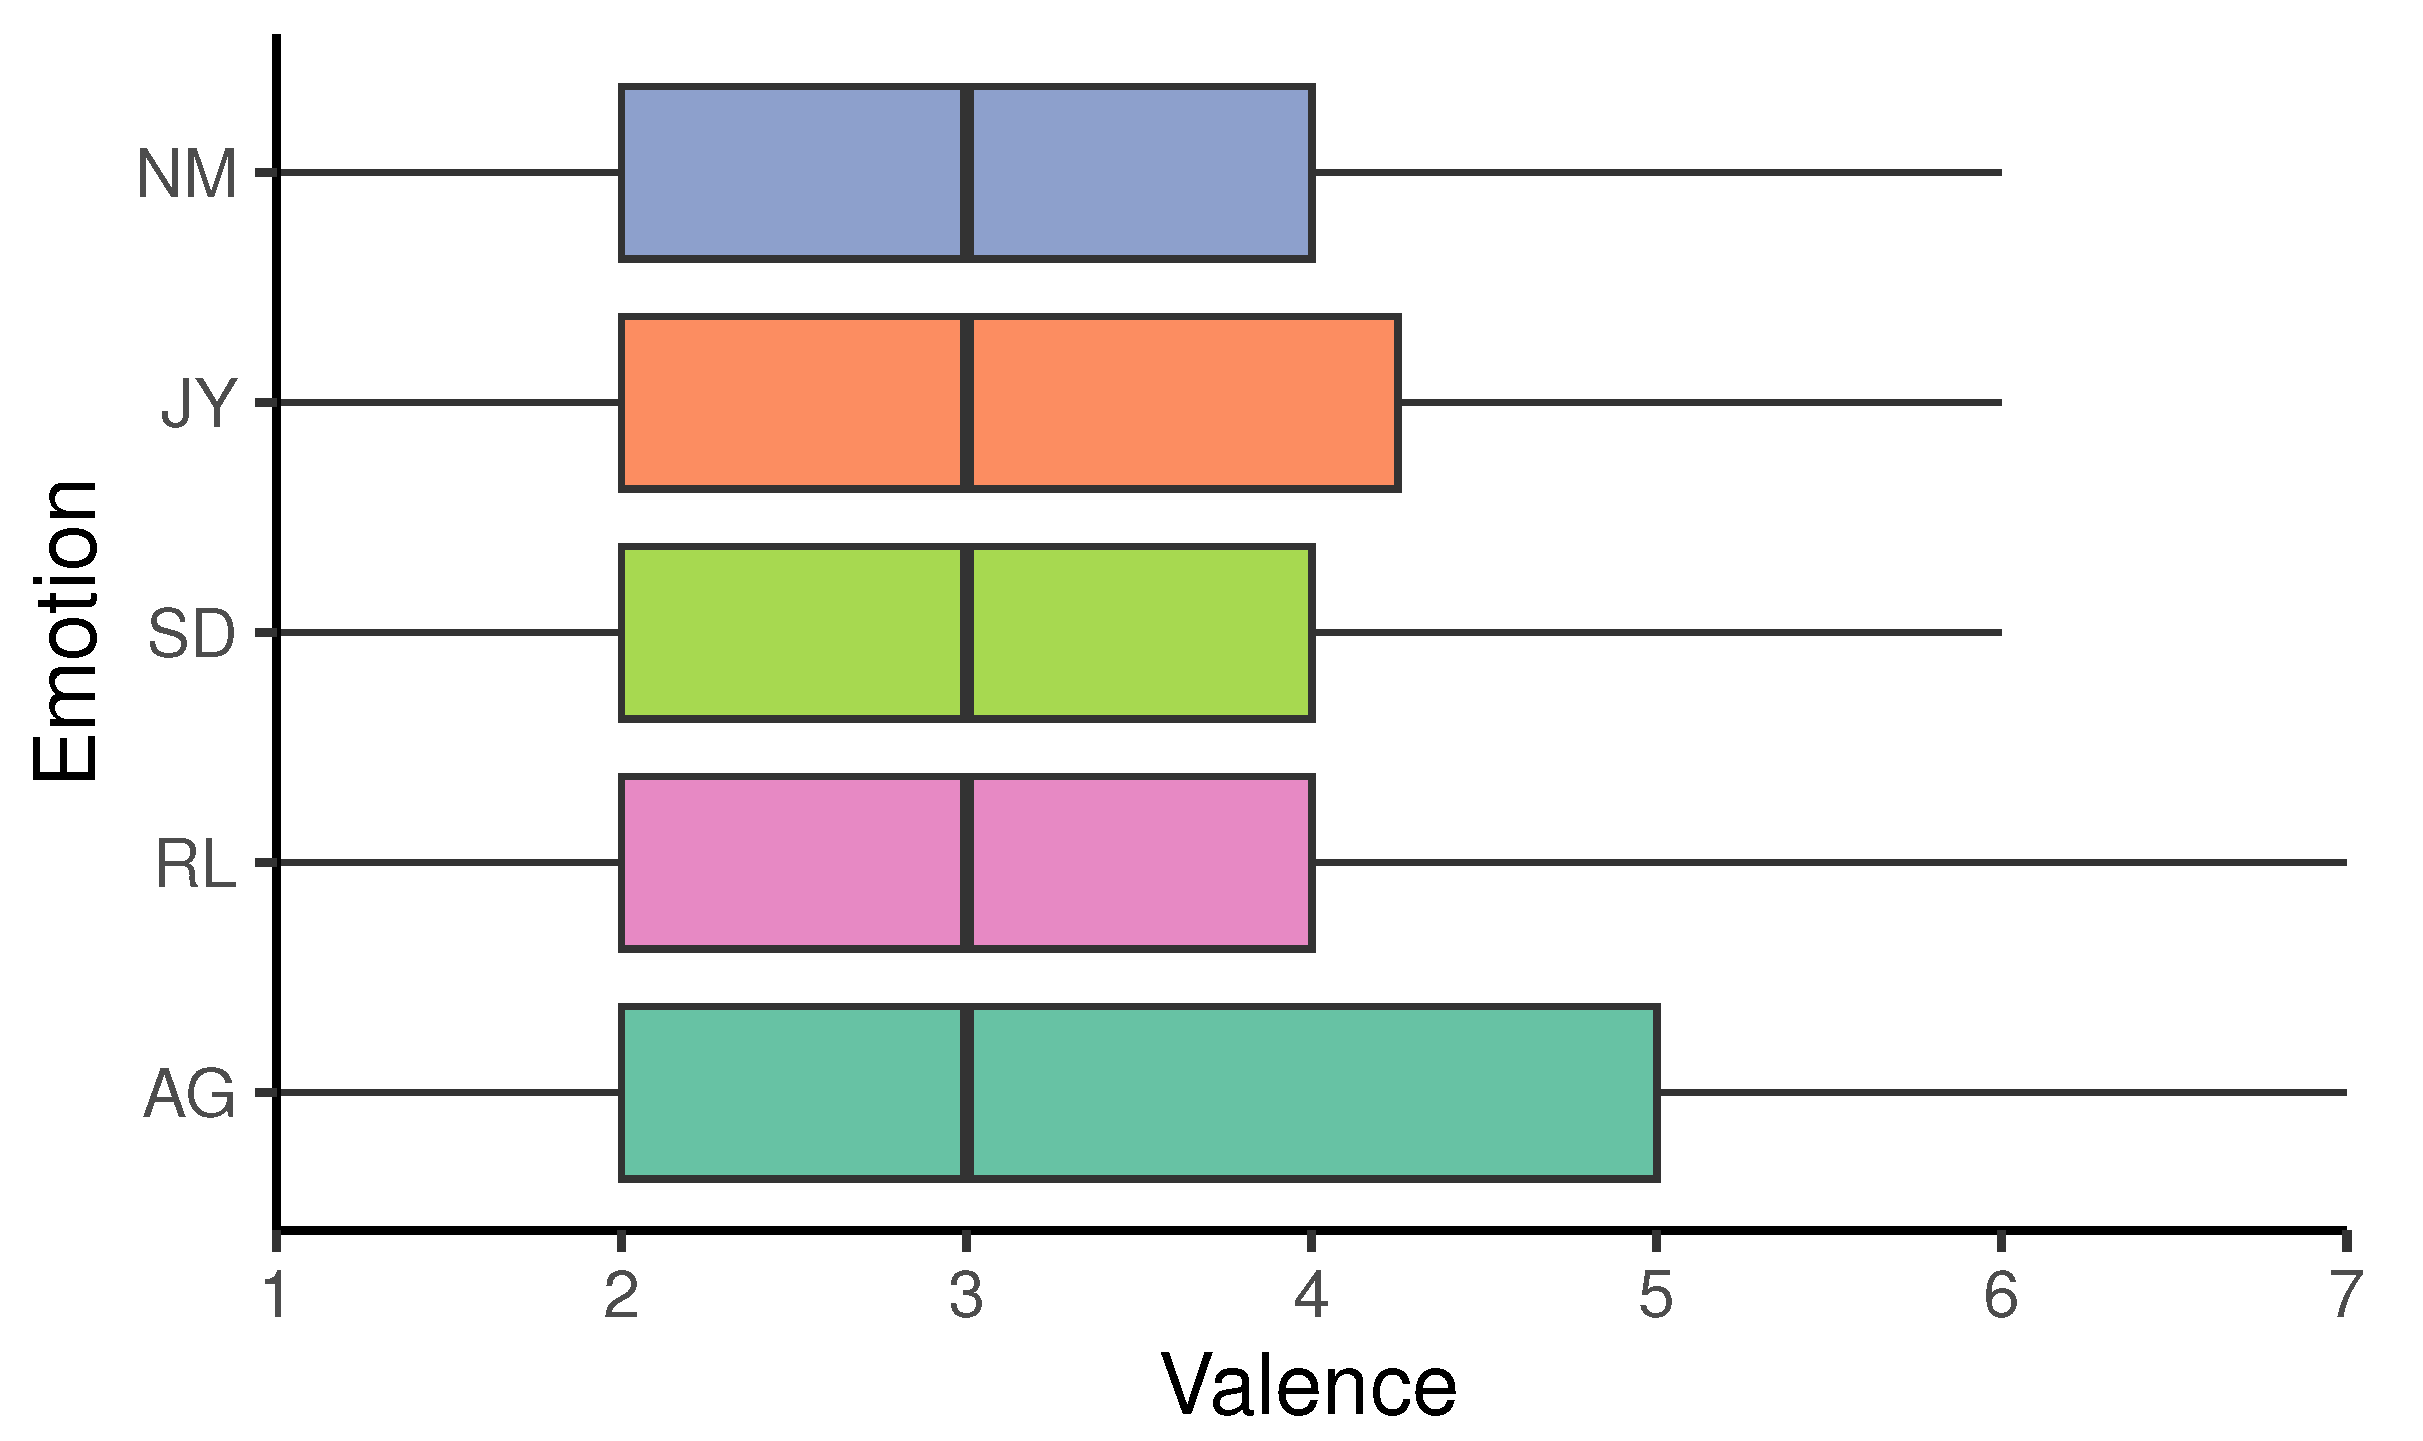

Table 1.
The items of the questionnaire.
| Questionnaire | Note | |
|---|---|---|
| Q1 | I like creatures. | Only after Task 1 |
| Q2 | Why do you choose it in Q1? | Only after Task 1 |
| Q3 | Have you had any creatures? | Only after Task 1 |
| Q4 | a) What kind of creatures do/did you have?, b) I want to own any creatures. | Only the first time. If Q3 is “Yes”, a). If Q3 is “No”, b). |
| Q5 | What kind of creature(s) do you associate with the object’s movements? | |
| Q6 | What body parts of the creatures do you think closely resemble the object? | |
| Q7 | I valued the speed of the object. | |
| Q8 | I valued the height of the object. | |
| Q9 | I valued the randomness of the object. | |
| Q10 | The movement of the object I made felt “organic-like”. | |
| Q11 | What kind of movements do you think should add to this experiment’s object for feeling more “organic-like”? | Optional |
| Q12 | What kind of features do you think are necessary for an object to feel “organic-like””? | |
| Q13 | Comments about the experiment | Optional |
Table 2.
The type and the frequency of randomness in the NM condition.
| None | 1/f noise | Normal Random Numbers | |||
|---|---|---|---|---|---|
| Low | High | Low | High | ||
| Amplitude | 36 (56.3%) | 15 (23.4%) | 8 (12.5%) | 3 (4.69%) | 2 (3.13%) |
| Period | 46 (71.9%) | 8 (12.5%) | 5 (7.81%) | 4 (6.25%) | 1 (1.56%) |
Table 3.
The difference of type and frequency of randomness from the NM condition.
| State | None | 1/f noise | Normal Random | |||
|---|---|---|---|---|---|---|
| Numbers | ||||||
| Low | High | Low | High | |||
| Amplitude | JY | −2 | −2 | 2 | 1 | 1 |
| SD | −4 | −1 | 1 | 2 | 2 | |
| RL | 6 | −6 | −2 | 1 | 1 | |
| AG | −17 | −8 | 13 | 0 | 12 | |
| Period | JY | −4 | −3 | 0 | 2 | 5 |
| SD | −2 | 2 | 0 | 0 | 0 | |
| RL | 0 | 4 | −3 | −2 | 1 | |
| AG | −21 | 0 | 5 | 1 | 15 | |
Table 4.
The difference of median from NM for the intensity of randomness.
| State | 1/f noise | Normal Random | |
|---|---|---|---|
| Numbers | |||
| Amplitude | JY | 0.1174 | 0.7105 |
| SD | 0.05656 | 0.08837 | |
| RL | −0.02828 | 0.1167 | |
| AG | 0.2790 | 1.106 | |
| Period | JY | −0.04627 | −0.2695 |
| SD | −0.3394 | −0.1936 | |
| RL | −0.3111 | −0.4719 | |
| AG | −0.2545 | 0.07095 |
Table 5.
The value of each parameter for the robot simulator.
| State | Speed | Height | Randomness | ||
|---|---|---|---|---|---|
| Type | Intensity | Frequency | |||
| NM | 3.498 | 1.525 | None | – | – |
| JY | 5.719 | 3.215 | None | – | – |
| SD | 1.923 | 0.8037 | None | – | – |
| RL | 1.879 | 1.169 | None | – | – |
| AG | 6.835 | 4.049 | (Amplitude) 1/f noise | 0.9764 | Low |
Table 6.
The items of the questionnaire about the attitude to living things in Experiment 2.
| Questionnaire | Note | |
|---|---|---|
| Q1 | I like creatures. | |
| Q2 | Why do you choose it in Q1? | |
| Q3 | Have you had any creatures? | |
| Q4 | a) What kind of creatures do/did you have?, b) I want to own any creatures. | Only the first time. If Q3 is “Yes”, a). If Q3 is “No”, b). |
Table 7.
The items of the questionnaire about the motion of object they observed in Experiment 2.
| Questionnaire | Note | |
|---|---|---|
| Q1 | What creature(s) do you associate with the object’s movements? | |
| Q2 | What body parts of the creature do you think closely resemble the object? | |
| Q3 | What impression of the object’s movements do you have? | Pleasure–Displeasure |
| Q4 | What impression of the object’s movements do you have? | Arousal–Sleepy |
| Q5 | Which state do the object’s movements express? | |
| Q6 | The movement of the object felt “organic-like”. | |
| Q7 | What kind of movements do you think should add to this experiment’s object for feeling more “organic-like”? | Optional |
Table 8.
The items of the questionnaire about the entire Experiment 2.
| Questionnaire | Note | |
|---|---|---|
| Q1 | What kind of features do you think are necessary for an object to feel “organic-like”? | |
| Q2 | Comments about the experiment | Optional |
Table 9.
The result of the questionnaire about the understanding of emotions.
| Answers | ||||||
|---|---|---|---|---|---|---|
| Conditions | NM | JY | SD | RL | AG | |
| NM | 36.4% | 27.2% | 0% | 29.6% | 6.82% | |
| JY | 40.9% | 36.4% | 4.55% | 11.4% | 6.82% | |
| SD | 18.2% | 9.09% | 11.4% | 61.4% | 0% | |
| RL | 22.7% | 11.4% | 9.09% | 54.6% | 2.27% | |
| AG | 22.7% | 36.4% | 4.55% | 2.27% | 34.1% | |
| 1 | Slack is a trademark and service mark of Slack Technologies, Inc., registered in the U.S. and in other countries. |
| 2 | Amazon Web Services, AWS, the Powered by AWS logo, and MTurk are trademarks of Amazon.com, Inc. or its affiliates. |
Disclaimer/Publisher’s Note: The statements, opinions and data contained in all publications are solely those of the individual author(s) and contributor(s) and not of MDPI and/or the editor(s). MDPI and/or the editor(s) disclaim responsibility for any injury to people or property resulting from any ideas, methods, instructions or products referred to in the content. |
© 2023 by the authors. Licensee MDPI, Basel, Switzerland. This article is an open access article distributed under the terms and conditions of the Creative Commons Attribution (CC BY) license (http://creativecommons.org/licenses/by/4.0/).
Copyright: This open access article is published under a Creative Commons CC BY 4.0 license, which permit the free download, distribution, and reuse, provided that the author and preprint are cited in any reuse.


