Preprint
Article

Data-driven Time Model for Subway Emergency Evacuation: A Case Study and Simulation

Altmetrics

Downloads

128

Views

50

Comments

0

This version is not peer-reviewed

Submitted:

28 April 2023

Posted:

28 April 2023

You are already at the latest version

Alerts
Abstract
High density of buildings and the large traffic volume of cities give rise to narrow spaces and high passenger flows in most subway stations. When evacuation is required during an emergency, these problems may trigger issues in operational safety. Therefore, it is imperative to comprehensively assess subway station emergency evacuation times and capacities during the operating process to ensure the design is safe, science-based, and rational. To further enhance safe evacuation capacity, this paper proposes an overall evacuation time model that considers the multielement charac-teristics of subway stations in multiple segments. The evacuation route is decomposed into five stages according to the critical nodes in the evacuation process. An overall emergency evacuation time model is established based on the diversity of bottlenecks in the five stages, integrating elements such as the horizontal movement velocity of passengers, subway equipment parameters, and human density. Taking Xi’an Wulukou Subway Station as an example, this paper verifies the outcomes of the theoretical model against the Pathfinder software and conducts additional anal-yses of the evacuation conditions of stairs and exits. The results show that the error between the theoretical emergency evacuation time and simulation evacuation time was 5.4%, The emergency evacuation model established in this study boasts strong robustness and stability.
Keywords: 
Subject: Physical Sciences  -   Applied Physics

1. Introduction

Citizens require increasing travel services with rapid urban development. To meet these substantial traffic demands, comprehensive transportation systems, including road traffic, rail transit, and sharing slow-moving traffic, have been developed in many cities [1]. Among them, subways have become one of the major transportation modes for citizens because of their significant reliability, high transportation rates, and ample passenger capacities. However, because of the high density of buildings and limited construction space in cities, subway stations are designed with unique architectural features, such as airtightness and limited ventilation and vision. Once an emergency occurs, hidden dangers such as congestion and stampedes may easily occur during emergency passenger evacuation, posing a substantial threat to lives and property [2]. Therefore, evaluating the emergency evacuation and operation safety performance of such public places is one of the critical links in their comprehensive performance evaluation. Effectively calculating the evacuation time of a subway station to judge whether it conforms to the “Code for Design of Metro” (GB 50157-2013) [3] is an important indicator to measure whether it has a reasonable structural layout and evacuation capacity.
Present domestic and overseas research mainly focuses on the mathematical modeling of crowd evacuation [4-5], data fitting [6,7,8], and field investigation [9,10,11]. Regarding evacuation model establishment, Chen et al. [12] used the M/G/c/c model to analyze the evacuation capacity of passages and stairs in subway stations, discovering that they are the most congested bottlenecks. Through a statistical combination of the trajectories of stairs and passages, all possible routes were planned, and the optimal route with the shortest evacuation time was determined. However, their analysis of the overall evacuation capacity of the station failed to consider the influence of facilities such as gates, escalators, and elevators, resulting in a short calculated final evacuation time.
Chen et al. [13] proposed the shortest route algorithm of network weights based on fuzzy multifactors, provided a theoretical derivation and calculation at the mathematical level, and proved its theoretical practicality. However, the route planning of subway stations involves a variety of facility obstacles, so the shortest route transformation of each obstacle constraint point involves complex theoretical modeling and computer programming simulation, resulting in an extremely low solution efficiency.
Xu et al. [14] researched the passenger flow on the floor of a subway platform and applied mathematical modeling to quantitatively analyze the boarding time of waiting passengers, obtaining a final calculation formula for the boarding time. Experimentally observed data were compared with the mathematical model results, and the 10% error fell within the normal allowable range. However, their study mainly focused on the subway platform floor and did not comprehensively consider the entire emergency evacuation process conditions.
In summary, existing research has made some progress in analyzing subway station passenger and emergency evacuation flows. However, there is still room for improvement in analyzing the influence of key facilities and obstacles and the overall analysis of the emergency evacuation process.
Regarding field investigation and data fitting, Togawa [15] proposed an empirical formula for the crowd evacuation time of complex buildings as early as the 1950s. This formula can obtain calculation results for comprehensive emergency evacuation based on different evacuee flow rates and exit widths but ignores the distribution of facilities inside the building. Consequently, the calculated evacuation times are slightly shorter than the actual values. Since then, Pauls et al. [16] obtained more reliable experimental data in researching multistory buildings after organizing multiple evacuation drills. He proposed the concept of the “effective width” of stairs, which was considered in his empirical formula for evacuation time. Existing research in this area has mainly focused on actual measurements and empirical formula construction of a single bottleneck area. Further localization and scene-based processing are still required to deal with highly complex scenes such as subway stations.
In the simulation and testing research area, Hu et al. [17] conducted simulations on evacuation with the Building Exodus software, considering the crowd structure, number of entrances and exits, widths of stairs, and fire conditions. Mei et al. [18] built a subway emergency evacuation simulation system with the Pathfinder software. They obtained the quantitative relationship between evacuation time, the number of evacuated passengers, the passenger flow rate, and other important parameters, providing an objective basis for future science-based emergency evacuation management.
Qin et al. [19] changed the passenger flow in the station by defining fire scenarios with Pathfinder and analyzed evacuation situations in different states. They concluded that the entrance of the stairs was subject to the highest evacuation pressure, and the exit width had little effect on relieving the pressure. The above simulation tools can sufficiently support the design of actual subway stations, but detailed modeling and parameter settings are required for specific stations, resulting in low evaluation efficiency.
Clearly, many achievements have been realized in the research evaluating the emergency evacuation capabilities of subway stations. However, research on emergency evacuation time failed to account for the influence of the many key facilities and obstacles. The curve fitting of the evacuation time for key bottleneck areas based on empirical formulas and experimental data cannot be applied to specific evacuation scenarios, and there is little research on the overall evacuation time. In addition, various uncertainties in subway station emergency evacuation research, including human, construction, environment, traffic, and management factors, have created new challenges in using traditional empirical formulas and computer simulation methods.
Given these challenges, this paper comprehensively considers the unique geographical structure of subway stations based on the concept of emergency evacuation in complex buildings and divides the evacuation process into segments by analyzing its critical nodes. This paper accounts for the influence of key facilities and obstacles in different evacuation stages and establishes an overall evacuation time model with multiple factors on the segments considered. The results obtained using the theoretical model developed in this paper are compared with Pathfinder simulation results, thereby verifying the proposed model’s validity.

2. Establishment of the Evacuation Time Model

This paper uses the segmented research concept to develop models for different periods. Through on-site investigation and detailed consideration of the common factors of subway station facility structures, it is concluded that the main facility structures along the evacuation route include the subway train, platform, platform stairs, station hall, gates, and exit stairs. The evacuation route is divided into five stages (corresponding to five periods): ① from the subway train to the platform; ② from the platform to the stairway entrance; ③ from the platform stairs to the station hall (including stair congestion time and the time to travel the stairs); ④ from the station hall to the stairway (including the congestion time passing the gates); ⑤ from the station hall stairs to the ground floor (including the stair congestion time and the time to travel the stairs).
The formula for calculating the evacuation time is established based on the number of people in the subway station (including the number of people on the subway train, on the platform, and in the station hall), the flow rate of people, and the density of people. The recursive accumulation of time was carried out based on the principle of the continuous flow of people. Then, the results obtained using the model were compared with the subway station calculation results from the Pathfinder software to demonstrate that the model effectively explores the crowd emergency evacuation laws in subway stations. The technical roadmap of this paper is shown in Figure 1.

2.1. Model Assumptions

The specific assumptions in the overall segmented evacuation time model based on multifactor analysis are as follows:
(1)
The number of people on the stairs is negligible before the evacuation and does not hinder the evacuation.
(2)
When the evacuation begins, the impact of the passenger flow hedging in subway stations is not considered.
(3)
The numbers of people in the subway, platform, and station hall are all subject to average distributions. In other words, the selection of each elevator and passage is affected by subjective factors, and each stairway and passage has the same capacity.
(4)
At the beginning of the evacuation, the automatic escalators are stopped and used as walking escalators (stairs).
(5)
For the people on the floor of the station hall, the gates are fully open, and the ticket gates are used as evacuation gates during the emergency evacuation.
(6)
For the stairs leading from the station hall to the ground floor, the hindrance to pedestrians caused by the stairs’ inflection points is not considered.
(7)
The stairs connecting the two platforms in the transfer station are not used as the planned evacuation route for emergency evacuation.

2.2. Evacuation Model Equations

(1)
t1: Time to evacuate from the subway to the platform
Previous investigators have focused on analyzing the relationship between the number of passengers and the evacuation time from the perspective of mathematical models and experimental research. Based on this research, it has been concluded that on a horizontal platform, the time required for all passengers to exit the subway can be calculated using the following equation [20]:
t 1 = s 2 n 2 2 K w · 2.2 + e 2 2.2 e 2 ln 4.4 e
n = N f
where t 1 refers to the average time for the people in each subway car to evacuate from the subway to the platform in seconds, and s is the average floor space occupied by ​​each person, generally taken as 0.2 m2 [21]. N is the total number of people in the subway cars in units of pers, n is the average number of people in each car in pers, and e is a fixed value representing the width of the car door. For instance, the width of the car door of Xi’an Metro Line 1 is 1.3 m. K represents a dimensionless model parameter, with the value changing with different stations, w is the half-width of the door for exiting the car in m, f is the number of cars in a subway train in the units of cars, and i indicates the serial number corresponding to each door (i = 1, 2, 3,…).
(2)
t2: Time to evacuate from the platform to the stairway entrance
The relationship between flow velocity and flow density was analyzed from a dynamics perspective, and it was concluded that the flow velocity in horizontal places satisfies the equations [21]:
v 0 = v m ( α A + β B + γ ) A = 1.32 0.82 ln ρ i B = 3.0 0.76 ρ i
where v 0 refers to the horizontal flow rate of evacuated people on the platform floor in m/s, and v m is the maximum average flow rate in m/s. In an emergency, the maximum average flow rate v m = 1 . 2 m / s . The variables α , β , γ refer to the contributed weight to the flow rate under the influence of the front and rear, left and right, and other factors, respectively. The values of α are 0.25 and 0.44, β is 0.014 and 0.088, and γ is 0.15 and 0.26. The average values of α , β , γ were selected as the final weights: α = 0.35 , β = 0.05 , and γ = 0.20 (rounded to two decimal places).
Time t 2 is computed as
t 2 = L v 0
where L is the maximum distance from the crowd to the stairway entrance in m.
(3)
t3: Time to travel the stairs from the platform
The time the crowd spends on the stairs is divided into two parts: the time for the crowd to travel the stairs and the congestion time on the platform floor at the stairway entrance.
Previous researchers [22] obtained the following expression for the time t 31 for everyone on the station floor to travel the stairs:
b m = 8.04 t 31 1.37
t 31 = 8.04 m 1 b 1 1.37
where b 1 refers to the effective width of the stairs on the platform floor, which is the width in m actually used by pedestrians, and m 1 is the total number of people on the platform floor in pers.
Time t 32 is the time needed for everyone on the platform floor to travel the stairs, calculated as
t 32 = s 3 v 3 ( 1.57 r 1 l 1 ) 1 2
where s 3 is the horizontal stairway length on the platform floor in m, r 1 is the stair rung height on the platform floor in m, l 1 is the stair step height on the platform floor in m, and v 3 is people’s stair-climbing speed in m/s.
(4)
t4: Time to evacuate from the station hall floor to the exit
Based on the formula for calculating the time to evacuate from the platform floor to the stairway entrance and considering the congestion time for passengers to pass through the gates on the station hall floor, the time to evacuate from the station hall floor to the exit is calculated as
t 4 = t 41 + t 42
v 0 = v m ( α A + β B + γ ) A = 1.32 0.82 ln ρ i B = 3.0 0.76 ρ i
Where the parameters and variables in Equation (9) are defined in the description of Equation (2) above, and
t 41 = s 4 v 4
t 42 = 8.04 m 2 ' b 2 1.37
where s 4 is the maximum distance from the crowd to the safety exit in m, b 2 is the effective width of the gate, which is to the actual width used in m, m 2 is the total number of people on the station hall floor in pers, and m 2 ' is the total number of people in the enclosed gate area in pers. The equation for m 2 ' is
m 2 ' = n 3 s 3 s 2
where s 2 is the actual usable floor area of​the station hall in m2, and s 3 is the usable enclosed gate area in m2.
(5)
t5: Time to evacuate from the exit to the ground floor
This evacuation time is calculated using a method similar to the time for stair congestion and stair travel. Previous investigators [22] obtained the following formula for the congestion time t 51 for everyone on the station hall floor to travel the exit stairs:
b m = 8.04 t 51 1.37
t 51 = 8.04 m 3 b 3 1.37
and the time for everyone on the station hall floor to travel the stairs is t 52 , calculated as
t 52 = s 5 v 5 ( 1.57 r l ) 1 2
where the description of Equation (3) above provides the parameter descriptions for Equation (15).
(6)
Additional equations used in the calculations are
Maximum evacuation capacity of the car doors:
q 1 = n 1 t 1
Maximum evacuation capacity of platform stairs:
q 2 = n 2 t 3
Maximum evacuation capacity of station hall stairs:
q 3 = n 3 t 5
Maximum evacuation capacity of the station hall floor (including turnstiles):
q 4 = n 3 t 4 s 3 s 2
Based on the principle that the person closest to the exit (the first person to the ground) is safely evacuated first, the time for everyone in the subway station to reach the safety zone is taken as the total evacuation time t t o t a l :
t e x t r a = [ ( t 4 + t 5 t 2 ) q 2 + ( t 4 + t 5 t 1 t 2 ) q 2 ] / q 3
t t o t a l = [ t 4 + t 5 ] + t 4 + t e x t r a
where t e x t r a is the time needed for the remaining people on the platform floor and the subway train to travel the exit stairs after the people on the station hall floor are evacuated, t 4 + t 5 is the time for the people on the station hall floor to be evacuated, and t 4 is the time for the people on the platform floor and the subway train to pass through the station hall.

3. Subway Station Case Study using the Evacuation Time Model

3.1. Statement of the Research Case

Taking the Wulukou subway station in Xi’an, China as an example, this paper adopts the established model to calculate the evacuation time and study the evacuation routes of passengers in the subway station. The studied subway station is a transfer station for metro Line 1 and Line 4 and includes the platform floor of Line 4, the platform floor of Line 1, and the station hall floor (including the paid and non-paid station hall areas). The platform floor areas of Line 4 and Line 1 are 1427 m2 and 1410 m2, respectively. The paid floor area of the station hall is 1344 m2, while its non-paid area is 3380 m2. The distribution of each of these areas is demonstrated in Figure 2, Figure 3 and Figure 4.

3.2. Theoretical Model Value Analysis and Evacuation Time Calculation

The evacuation time is calculated based on the established mathematical model according to the actual situation and a data analysis of the Wulukou Subway Station. The layout of the evacuation facilities is distributed as shown in Figure 2, with stairs A, B, C, and D and exits A, B, C, D, E, and F.
For the number of evacuees, the vehicle in Wulukou Subway Station is type B according to the real-time passenger flow and the particular geographical location of Wulukou Subway Station. Each car occupies an area of 52 m2. Considering the area occupied by the seats on both sides and the anti-fall handrails in the middle, the actual area of each car is 40 m2. There are six cars, and the platform is an island-style structure. During morning rush hours, the average density of passengers on the subway train is 3 pers/m2, during which passengers would be in contact with each other. Therefore, the total number of passengers in a train is N 0 = 40 × 6 × 3 = 720 pers.
In the station hall area, considering the field data analysis, the number of people in the non-paid area is 338 pers, while the number in the paid area is 269 pers. The number of people on the Line 4 platform floor is 285 pers, while there are 282 pers on the Line 1 platform floor. According to the simulated evacuation conditions, with four trains arriving at the station simultaneously and the distribution of evacuees on the platform floor and the station hall floor unchanged, the total number of evacuees was 4054 pers.
According to the values in Equation (3), α = 0.35 , β = 0.05 , and γ = 0.20 . Under emergency evacuation conditions [23], the maximum average flow rate of passengers is 1.2 m/s in Equation (3). Thus, the flow rate on the platform floor is obtained as 1.19 m/s. Survey data is analyzed according to the actual conditions, in which the step height of the stairs is r = 0.18 m, and the step width is b = 0.28 m. The horizontal length of the stairs is L = 27.65 m for Line 4 and L = 10.80 m for Line 1. The effective width of the four sets of stairs is 1.9 × 3 × 4 m, the maximum distance from the Line 4 platform floor to the stairway entrance is 46 m, and the maximum distance from the Line 1 platform floor to the stairway entrance is 33 m.
Considering the particular geographical structure of Wulukou Subway Station, the cumulative evacuation time of the platform floor of Line 4 and Line 1 is first calculated as T 1 and T 2 . The final total evacuation time is
T t o t a l = max { T 1 , T 2 }
The established mathematical model is solved using the GUI function module of MATLAB [24], and the results are shown in Table 1.

3.3. Simulation Experiment Research and Comparative Analysis with Pathfinder
The passenger flow for Xi’an Wulukou Subway Station under extreme emergency evacuation conditions was simulated with the Pathfinder software [25]. Pathfinder is an agent-based evacuation simulation software developed by the Thunderhead Engineering Company (USA). Pathfinder supports two modes of movement simulation: Society of Fire Protection Engineers (SFPE) mode and steering mode.
In SFPE mode, the evacuation route is defined with the walking route length as the primary reference standard, meaning that passengers choose the closest exit according to proximity. The simulation can automatically identify the density of the evacuation space to adjust the passenger flow rate, and the doors restrict the passenger flow.
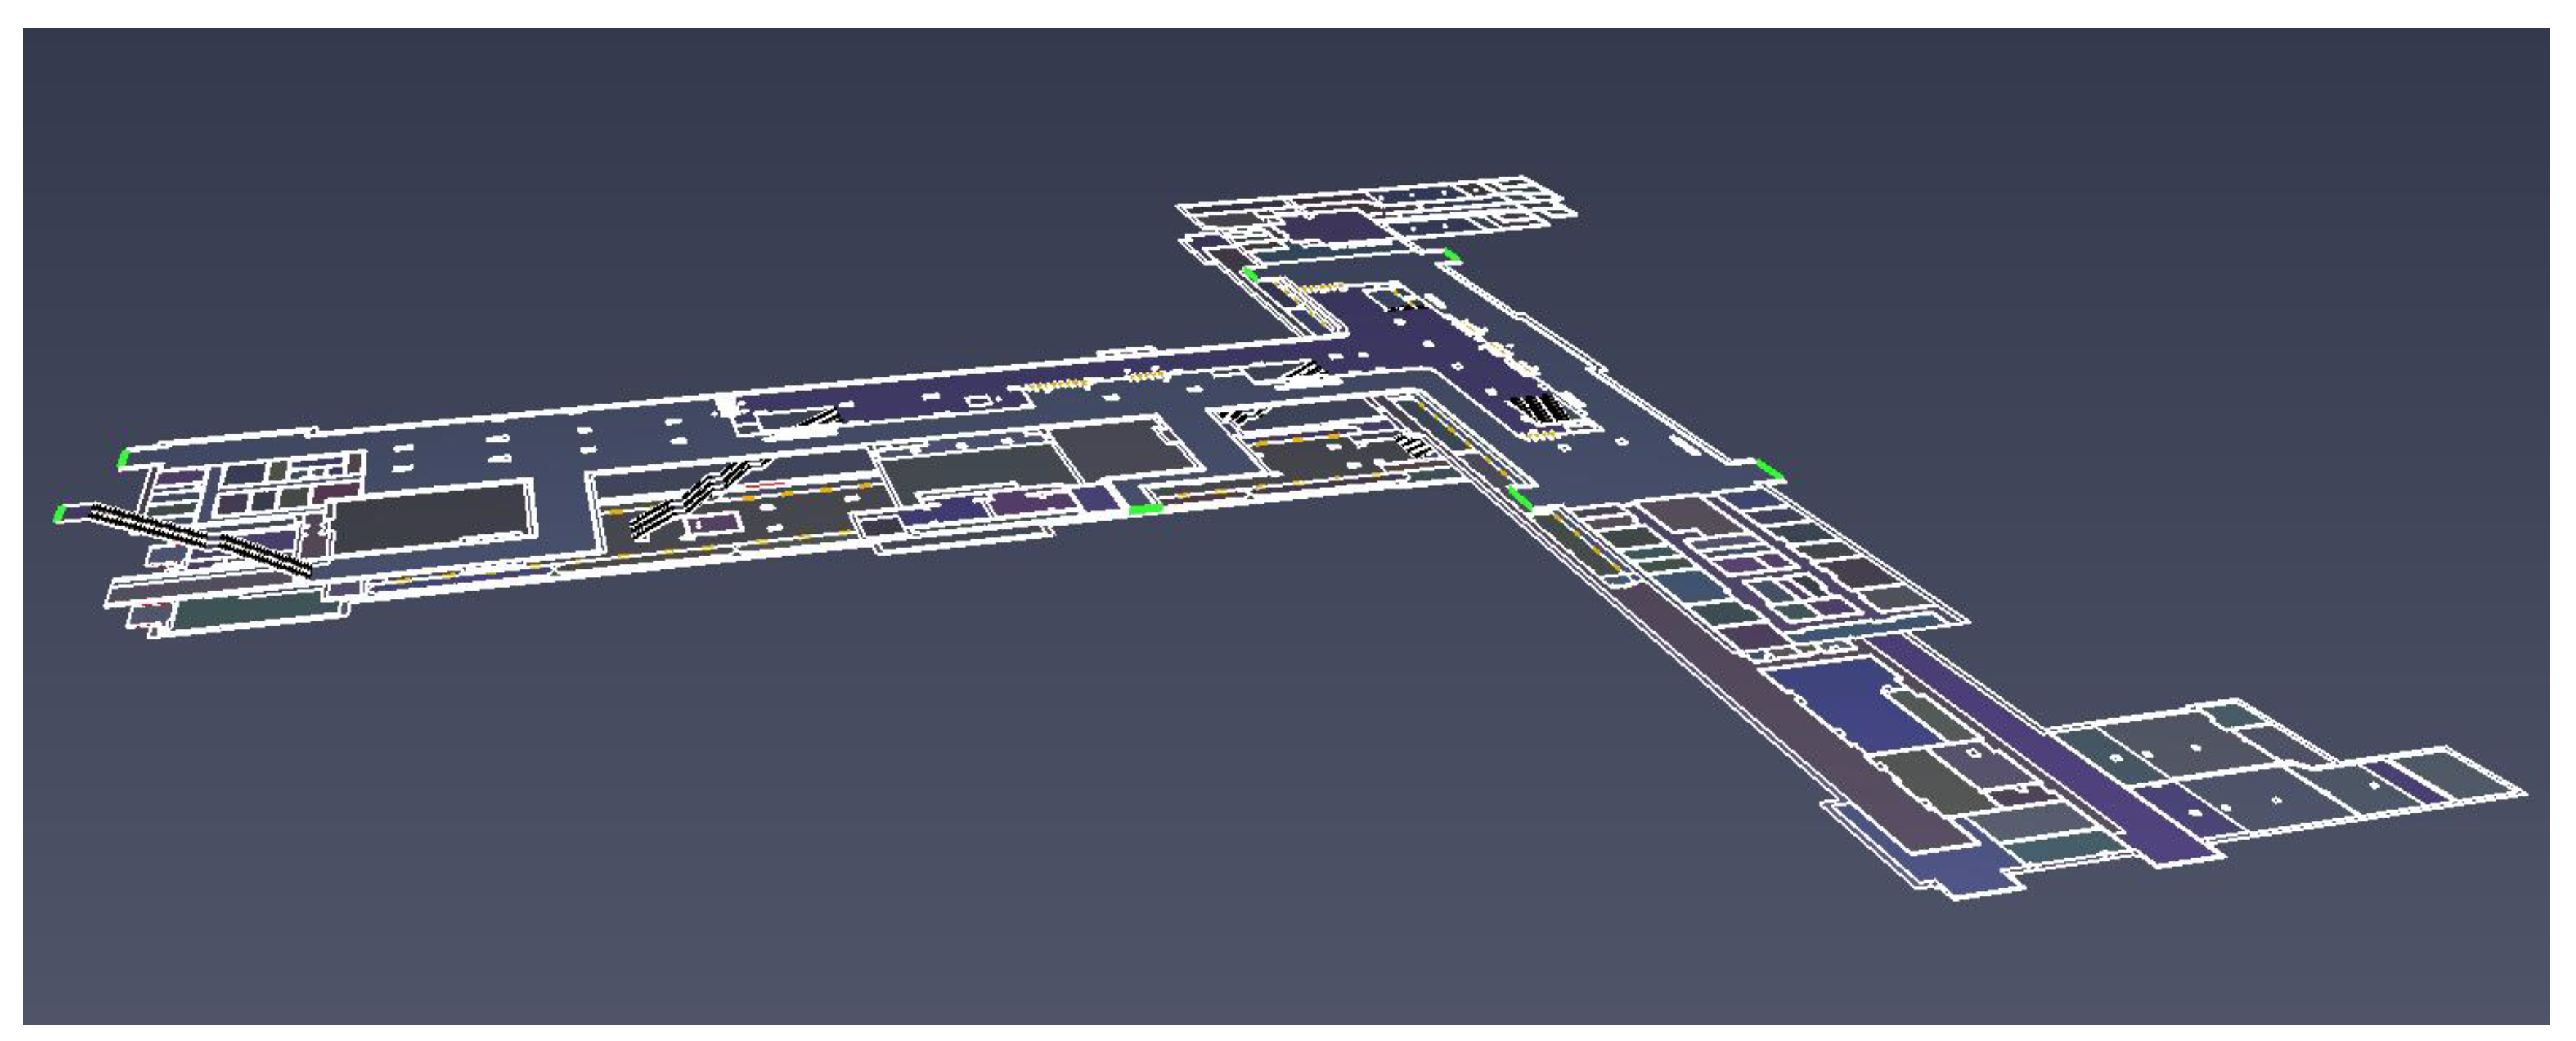
In steering mode, the evacuation strategy is formulated based on route planning and passenger collision, and the evacuation route is determined according to the evacuation distance and the passenger-to-passenger distance. The doors no longer restrict the passenger flow. Passengers can complete their current movements and respond to environmental changes. Therefore, steering mode is more applicable to the actual situation considered. Therefore, steering mode is adopted for the simulation experiment in this study. The passenger distribution inside the subway station is displayed in Table 2, and the three-dimensional view of the subway station is shown in Figure 7.
Figure 5 provides a three-dimensional view of the Wulukou Subway Station, including the Line 4 platform floor, the Line 1 platform floor, and the complete station hall floor of Line 1 and Line 4. The overall layout is T-shaped. Figure 6 shows passengers’ distribution after 50 s of evacuation time. The figure shows that over 50 s, the passengers on the platform floor and the station hall floor gather at the entrance of the stairs, forming a congestion point. Further, passengers on the station hall floor gather at the gates, forming another bottleneck.
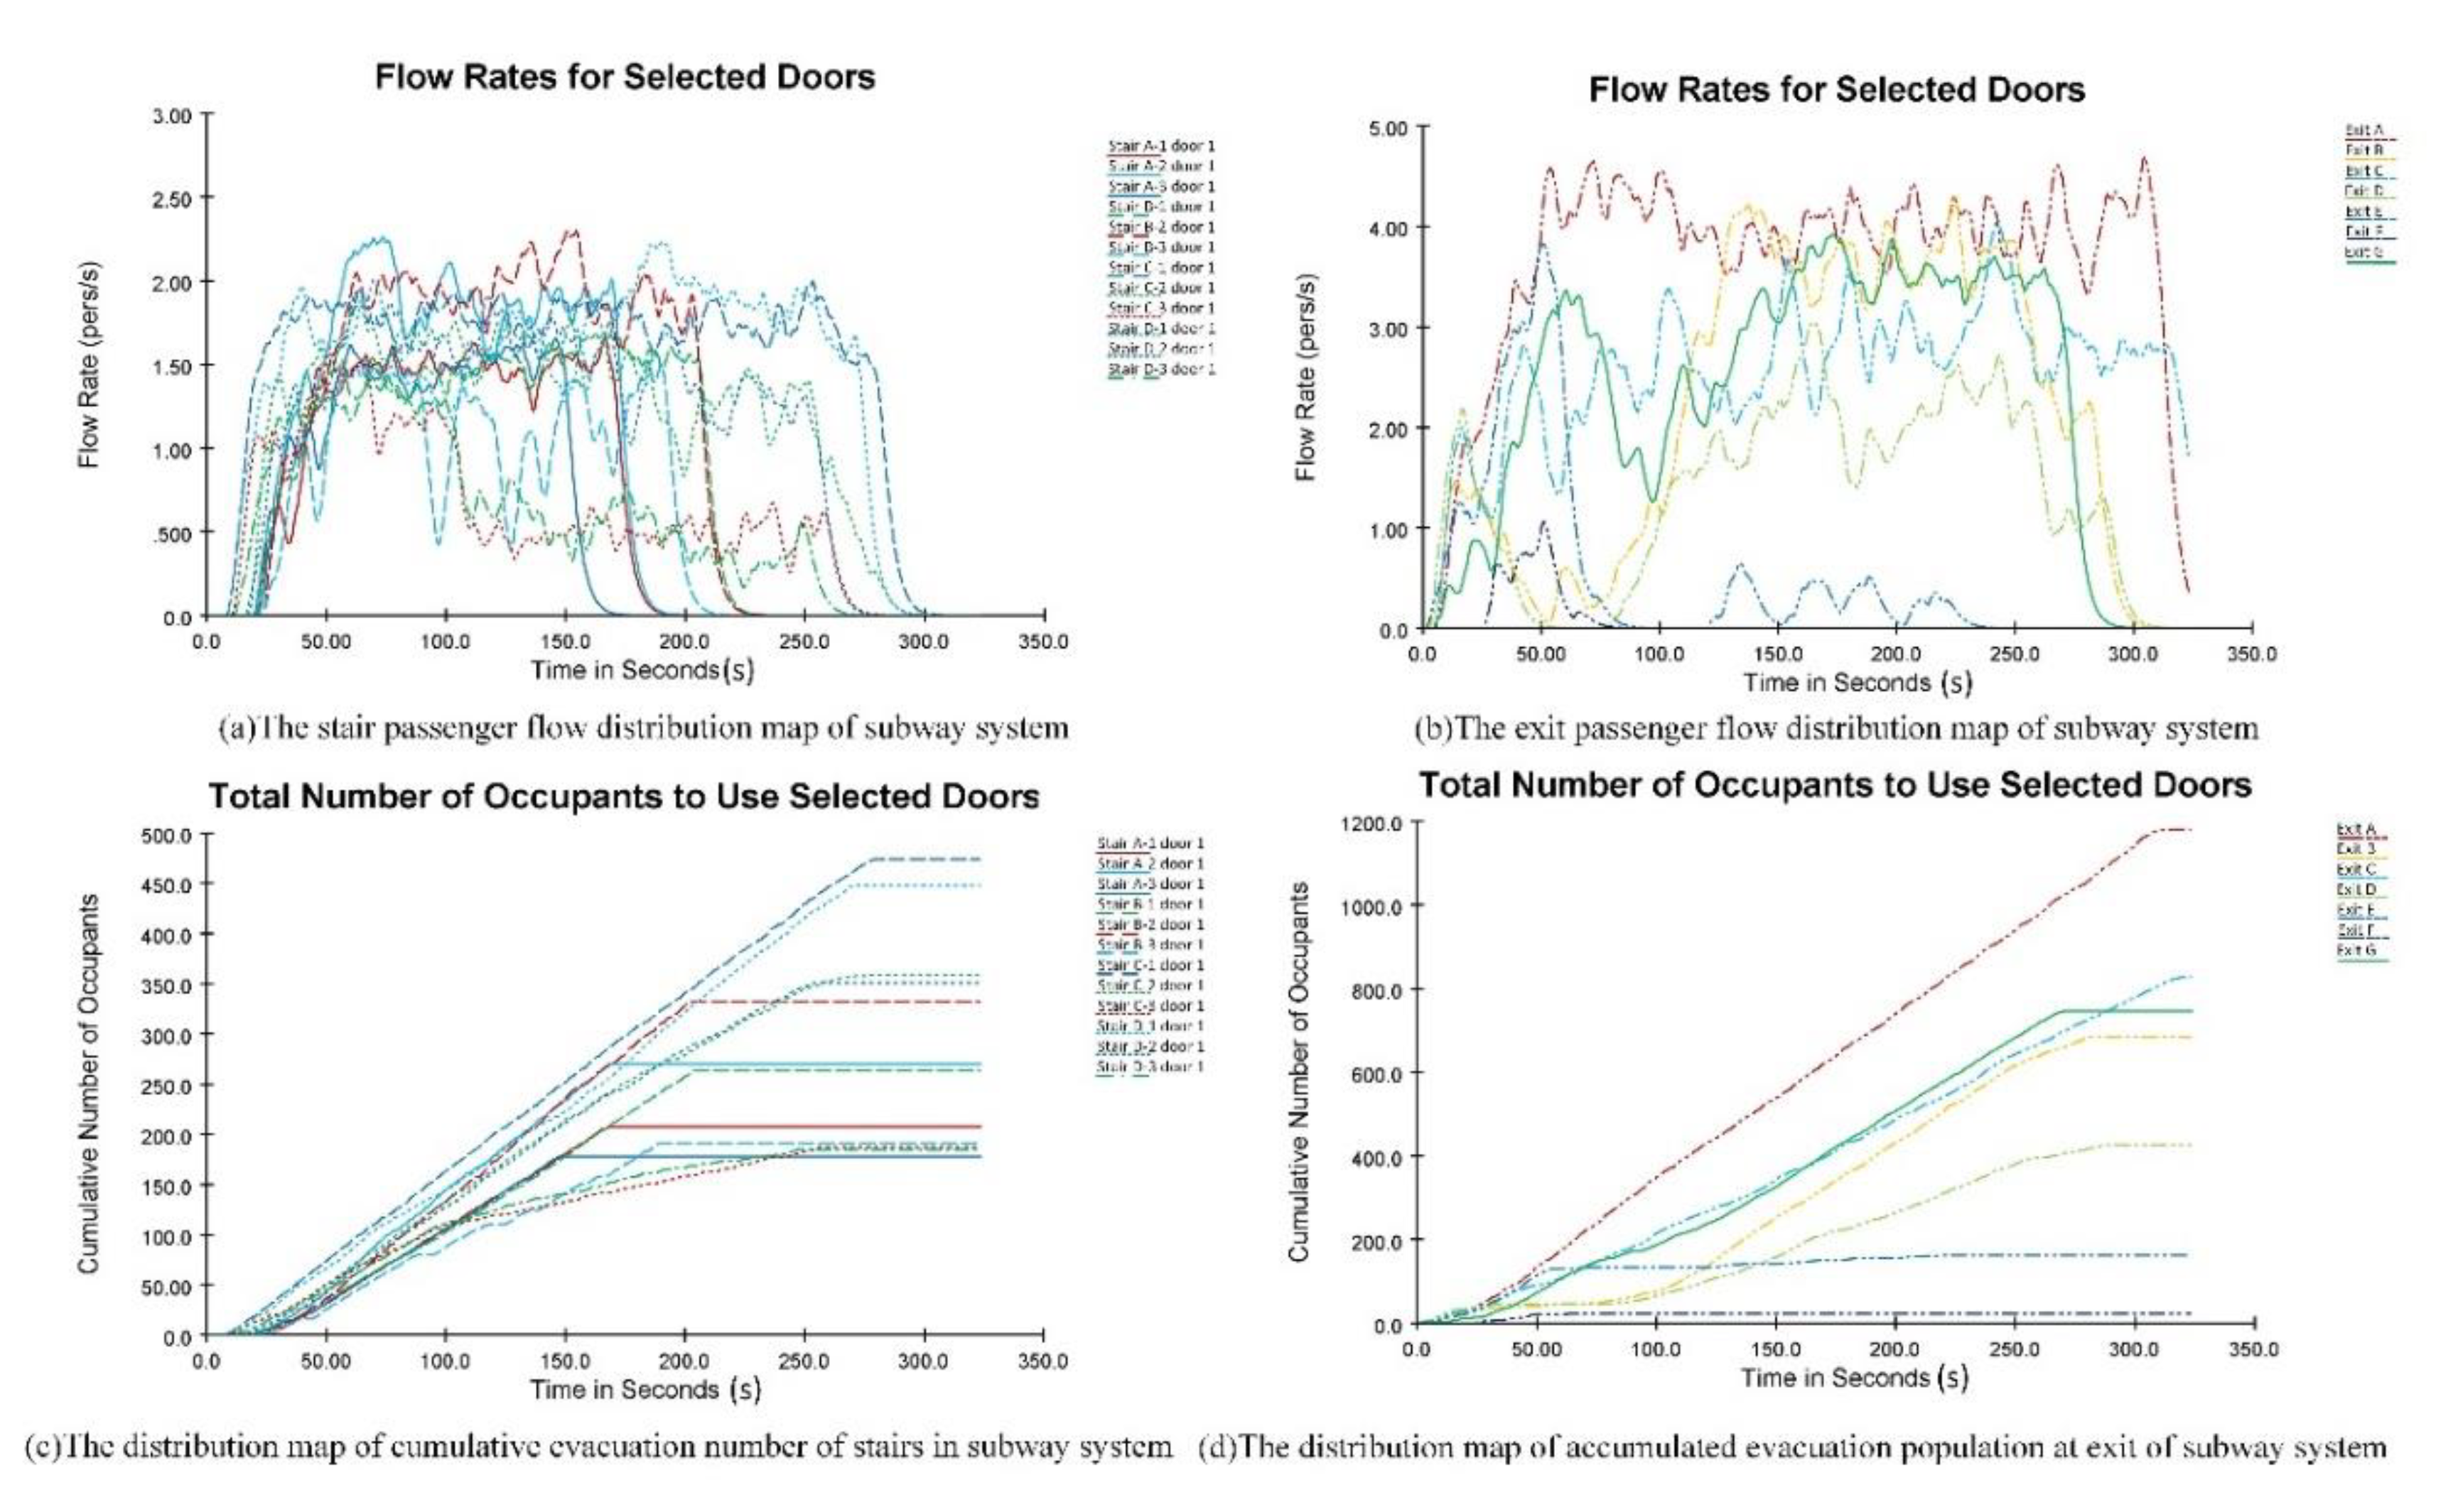
Figure 7a is the distribution diagram of passenger flow on the subway system stairs, and Figure 7c is the distribution diagram of the cumulative evacuees in the subway system. Based on the analysis results, it can be concluded that the overall evacuation capacity has been improved. During the evacuation, the cumulative number of evacuees on the left stairs of C and D reaches their maximum values (474 and 478, respectively). The flow rate is recorded as 1.5~2.5 pers/s, and the utilization rate increases as some passengers pass through the transfer station, traveling from the Line 4 platform floor to the Line 1 platform floor. According to the proximity principle, passengers prioritize the surrounding stairs (the left stairs of C and D). In this situation, the utilization rate of stairs A and B is lower than for stairs C and D because congestion is less likely to occur in Line 4 because of its relatively long walking distance on the platform floor and low passenger density.
Figure 7b is the distribution diagram of the passenger flow at the exits, and Figure 7d is the distribution diagram of the cumulative evacuees at the subway system exits. The passenger flow rate of Exit A is the largest throughout the evacuation at 3~5 pers/s, and the cumulative number of evacuees is as high as 1,180. Further analysis also reveals that the gates close to Exit A are subject to more severe congestion, prolonging evacuation time. The Exits B, C, and G utilization rates are relatively high, with the cumulative number of evacuees at 686, 829, and 746, respectively. Exits E and F have the lowest utilization rates, with 163 and 23 cumulative evacuees.
The highest passenger flows during the 50~60 s period are recorded for Exits E and F. However, they are idle with zero flow after 60 s. Therefore, guides could be added to relieve the pressure of bottleneck points and improve evacuation efficiency. Figure 8 shows that it would take 323.53 s to evacuate all the passengers at Wulukou Subway Station.
Figure 7. Evacuee distribution maps of bottleneck points at the subway station.
Preprints 72128 g007
Figure 8. The relationship between remaining evacuees and required evacuation time.
Preprints 72128 g008
In this simulation, the error between the calculated theoretical evacuation time and the value of the simulation experiment is
ε = | t t h e o r e t i c a l - t s i m u l a t i o n | t t h e o r e t i c a l × 100 % = | 341.92 323.53 | 341.92 × 100 % = 5.4 %
The calculation result in the simulation experiment is consistent with the mathematical model, which was 341.92 s. The error, at 5.4%, is below 10%, demonstrating that the mathematical model is scientific and rational.

5. Conclusions

The conclusions from this study are summarized as follows:
(1)
An emergency evacuation time model has been established for a subway station’s complex structure, accounting for factors such as the horizontal flow rate of passengers, the physical parameters of the subway facilities, and the crowd density. According to the data obtained using the model, it can be concluded that the evacuation time is influenced mainly by the horizontal walking distance, horizontal flow rate, subway train size, and the physical parameters of the stairs.
(2)
The emergency evacuation model can predict the locations of bottleneck points. These bottleneck points are the gates > car doors > stairs (in descending order). “Arch-shaped” congestion is most likely to occur at the gates. The model provides a foundation for evaluating the emergency evacuation capacity of multiline subway transfer stations and is an effective reference for formulating emergency evacuation plans.
(3)
The evacuation time calculated by the mathematical model is consistent with the time obtained in the simulation experiment using the Pathfinder software, with an error of 5.4%, indicating that the emergency evacuation model established in this paper is scientific and reasonable.

Author Contributions

Funding acquisition, Y. H. and H, P.; Conceptualization, Q. Y.; Investigation, Y. H. and Q. Y.; Data curation, Y. H.; Formal analysis, Y. H. and H. P.; Methodology, Y. H. and Q. Y.; Writing original draft, Y. H. All authors have read and agreed to the published version of manuscript.

Funding

This research was supported in part by the National Nature Science Foundation of China under Grant No. 52072044, in part by the National Science Foundation of Shaanxi Province under Grant No. 2021JQ-295.

Institutional Review Board Statement

Not applicable.

Informed Consent Statement

Not applicable.

Data Availability Statement

Not applicable.

Conflicts of Interest

The authors declare no conflict of interest.

References

  1. Shi, C.; Zhong, M.; Nong, X.; He, L.; Shi, J.; Feng, G. Modeling and safety strategy of passenger evacuation in a metro station in China. Saf. Sci. 2012, 50, 1319–1332. [Google Scholar] [CrossRef]
  2. Yang, P.; Li, C.; Chen, D. Fire emergency evacuation simulation based on integrated fire–evacuation model with discrete design method. Adv. Eng. Softw. 2013, 65, 101–111. [Google Scholar] [CrossRef]
  3. Yang, Y. X.; Chen, C.; Qu, L. R. Discussion on Some Problems of Evacuation from Metro Train Fire. Safety Science, 2006, 9, pp. 45–50. [Google Scholar]
  4. Chen, Y. M. ; Wang, Hui, C. Y. et al. Emergency evacuation simulation at starting connection of cross-sea bridge: Case study on Haicang Avenue Subway Station in Xiamen Rail Transit Line. Journal of Building Engineering, 2020, 29, pp. 1–12. [Google Scholar]
  5. Jin, B.; Wang, J.; Wang, Y.; Gu, Y.; Wang, Z. Temporal and spatial distribution of pedestrians in subway evacuation under node failure by multi-hazards. Saf. Sci. 2020, 127, 104695. [Google Scholar] [CrossRef]
  6. Ding, N.; Chen, T.; Zhu, Y.; Lu, Y. State-of-the-art high-rise building emergency evacuation behavior. Phys. A: Stat. Mech. its Appl. 2020, 561, 125168. [Google Scholar] [CrossRef]
  7. Jiang, C.; Yuan, F.; Chow, W. Effect of varying two key parameters in simulating evacuation for subway stations in China. Saf. Sci. 2010, 48, 445–451. [Google Scholar] [CrossRef]
  8. Li, Y.; Wang, X.; Sun, S.; Ma, X.; Lu, G. Forecasting short-term subway passenger flow under special events scenarios using multiscale radial basis function networks. Transp. Res. Part C: Emerg. Technol. 2017, 77, 306–328. [Google Scholar] [CrossRef]
  9. Qu, L.; Chow, W. Platform screen doors on emergency evacuation in underground railway stations. Tunn. Undergr. Space Technol. 2012, 30, 1–9. [Google Scholar] [CrossRef]
  10. Zhou, M.; Ge, S.; Liu, J.; Dong, H.; Wang, F.-Y. Field observation and analysis of waiting passengers at subway platform — A case study of Beijing subway stations. Phys. A: Stat. Mech. its Appl. 2020, 556, 124779. [Google Scholar] [CrossRef]
  11. Rostami, R.; Alaghmandan, M. Performance-based design in emergency evacuation: From maneuver to simulation in school design. J. Build. Eng. 2020, 33, 101598. [Google Scholar] [CrossRef]
  12. Chen, S. K.; Liu, S.; Xiao, X. Bottleneck Analysis of the Evacuation Capacity of Stairs in Subway Stations Based on M/G/c/c Model. Journal of Railways, 2012, 1, volume 34, pp. 7–12. [Google Scholar]
  13. Chen, Y. M.; Gong, J.Y. Algorithm for the Determination of Multi-factor Road Network Weight Based on Fuzzy Mathematics. Journal of Wuhan University (Information Science Edition), 2007, 10, pp. 928–931. [Google Scholar]
  14. Xu, W. N.; Wu, Z. Mathematical Model of Passenger Flow in the Waiting Hall of Subway Station. Journal of Railway Science and Engineering, 2005, 2, pp. 70–75. [Google Scholar]
  15. Togawa, K. Report No. 14, in Building Research Institute. 1955: Tokyo.
  16. Pauls, J.; Nelson, H. E.; Maclennan, H. A. SFPE Handbook of Fire Protection Engineering. 1995: Borehamwood.
  17. Hu, K.; Duan, Z. X. Simulation Research on Safe Evacuation in Subway Stations with Island Platforms. Computer Engineering and Applications, 2014, 15, volume 50, pp. 261–266. [Google Scholar]
  18. Mei, Y. L.; Xie, K. F.; Liu, S. Analysis Model and Simulation of Emergency Evacuation Capacity of Dense Crowds in Subway Stations. Journal of Wuhan University of Technology (Information and Management Engineering Edition), 2018, 4, volume 40, pp. 370–375+382. [Google Scholar]
  19. Qin, J.; Liu, C.; Huang, Q. Simulation on fire emergency evacuation in special subway station based on Pathfinder. Case Stud. Therm. Eng. 2020, 21, 100677. [Google Scholar] [CrossRef]
  20. Wu, Z.; Wang, Y.; Shen, J. Y. Research on the Mathematical Model for the Evacuation Time of Passengers in the Waiting Hall of Subway Station. Fudan Journal (Natural Science Edition), 2006, 5, pp. 594–598. [Google Scholar]
  21. Jun, J. N.; Fang, Z.; Lu, Z. M. Mathematical Model for the Evacuation Speed of People in Buildings. Journal of Wuhan University (Engineering Science Edition), 2002, 2, pp. 66–70. [Google Scholar]
  22. Hu, X. L.; Liu, C. X.; Chen, H. Computer Simulation of Safe Evacuation Time for People in High-rise Buildings. Journal of Chongqing University (Natural Science Edition), 2004, 10, pp. 105–108. [Google Scholar]
  23. Zhao, J. L.; Sun, B. Y. Simulation on emergency evacuation of crowd in Special subway Station based on Pathfinder. Journal of Safety Science and Technology, 2020, 8, volume 16, pp. 146–150. [Google Scholar]
  24. Wang, Y. H. Simulation Evaluation Model for the Emergency Evacuation Capacity of Beijing Subway Stations Based on BP Neural Network Algorithm. China Safety Production Science and Technology, 2012, 1, volume 8, pp. 5–10. [Google Scholar]
  25. Wang, F. Multi-Scenario Simulation of Subway Emergency Evacuation Based on Multi-Agent. Int. J. Simul. Model. 2021, 20, 387–397. [Google Scholar] [CrossRef]
Figure 1. The technical roadmap of the paper.
Preprints 72128 g001
Figure 2. Schematic diagram of the station hall floor.
Preprints 72128 g002
Figure 3. Schematic diagram of the Line 4 platform floor.
Preprints 72128 g003
Figure 4. Schematic diagram of the Line 1 platform floor.
Preprints 72128 g004
Figure 5. Three-dimensional view of the Wulukou subway station.
Preprints 72128 g005
Figure 6. The distribution of passengers after 50 seconds of evacuation time.
Preprints 72128 g006
Table 1. Theoretical model results.
Category Line 4 Line 1
Number of people in a train (pers) 1440 1440
Number of people on the platform floor (pers) 285 282
Number of people on the station hall floor (pers)Evacuation capacity of the car doors (pers/sec) 6078.58 6078.57
Evacuation capacity of platform stairs (pers/sec) 9.39 12.99
Evacuation capacity of station hall stairs (pers/sec) 11.30 12.45
Evacuation capacity of the turnstile (pers/sec)Time to exit the train (sec)Time on the platform (sec) 1.26167.8730.35 1.26167.8721.72
Time on the stairs (sec) 53.72 48.80
Time on the station hall (sec) 120.52 120.52
Time of exit (sec)Total time (sec) 87.74341.92 87.74291.97
Table 2. Passenger distribution inside the subway station.
Subway station structure Inner structure Usable area (m2) Number of people
Platform floor Platform floor of Line 1 1410 282
Platform floor of Line 4 1427 285
Train on the left side of Line 4 312 720
Train on the right side of Line 4 312 720
Train on the left side of Line 1 312 720
Train on the right side of Line 1 312 720
Station hall Paid area 1344 269
Non-paid area 3380 338
Disclaimer/Publisher’s Note: The statements, opinions and data contained in all publications are solely those of the individual author(s) and contributor(s) and not of MDPI and/or the editor(s). MDPI and/or the editor(s) disclaim responsibility for any injury to people or property resulting from any ideas, methods, instructions or products referred to in the content.
Copyright: This open access article is published under a Creative Commons CC BY 4.0 license, which permit the free download, distribution, and reuse, provided that the author and preprint are cited in any reuse.
Prerpints.org logo

Preprints.org is a free preprint server supported by MDPI in Basel, Switzerland.

Subscribe

© 2024 MDPI (Basel, Switzerland) unless otherwise stated