1. Introduction
Muti-beam bathymetric system (MBS) is frequently used for marine depth measurement. In the process of MBS soundings, one of the key steps is sound velocity correction. To reduce the influence of sound velocity errors on soundings, two groups of sound velocity profiles (SVP) shall be measured with CTD (Conductance, Temperature, Depth) before and after the MBS carries out, respectively. Then, the SVP is selected by the time and space proximity principle for calculating the beam footprints based on the acoustic ray tracing method. However, there are errors between the measured SVP and the real SVP due to the physical mechanism of CTD and complex ocean phenomena [
1,
2], which leads to the topography distortion for MBS soundings [
3].
It is generally accepted that the central beam of MBS has the smallest sounding errors, and as the initial incidence angle increases, the sounding errors also increase [
4]. The coefficient method is a popular technique to correct the deviation data of MBS soundings, which calculates the error coefficient between the survey soundings and the actual soundings in a flat sea area. Then, the error coefficient is used to correct the soundings of other sea areas [
5,
6]. Xiao proposed to construct a submarine topography trend line with adjacent central beams as prior information [
7]. Then, Kalman Filter (KF) is applied to correct the systematic errors of soundings caused by sound velocity errors. Zhao also put forward an opinion that the footprint of the marginal beams upwarps due to the SVP errors, while the central beam is less affected by it, which can correctly reflect the actual seafloor topography change [
8]. Wu also believes that the errors of marginal beams mainly influence the quality of multi-beam soundings, and the key factor of marginal beam quality is accurate SVP [
9].
All the above studies for correcting distorted topography are based on the viewpoint of the soundings of the central beam is the most accurate. However, this paper presents a critical conclusion that the beam footprint is closest to the real seafloor when the initial incidence angle is about 45 °. This conclusion is proven theoretically and experimentally in the following section. In
Section 2.1, two types of ray tracing methods are introduced. In
Section 2.2, the influence of sound velocity errors on the soundings of the central beam is analyzed. In
Section 2.3, the topography distortion law caused by sound velocity errors is studied. In
Section 2.4, we proved an important fact that the sounding errors are the smallest when the beam angle is about 45° instead of the central beam. In
Section 3.1, a simulation is launched to verify our theoretical analysis. In Section 3.2, a method is proposed to correct the topography distortion by compensating the sound velocity profile area, and another simulation is carried out to correct the distorted topography data shown in the first simulation.
2. Materials and Methods
2.1. Ray tracing method
The ray tracing method is generally used for searching the position of beam footprints because of its high accuracy. There are two types of calculation processes for this method. One assumes that the sound velocity gradient of the unit water layer is a constant (the Constant Gradient Ray Tracing Method, CGRT). The other assumes that the sound velocity gradient of the unit water layer is zero (the Zero Gradient Ray Tracing Method, ZGRT). The CGRT method has higher accuracy because its assumption is closer to the real sound velocity profile, However, it also brings greater computational complexity. The accuracy of the two methods is relatively close when the stratified interval of water layers is quite small. To make the proof more feasible to proceed, the ZGRT method is used for the following derivation process [
10,
11].
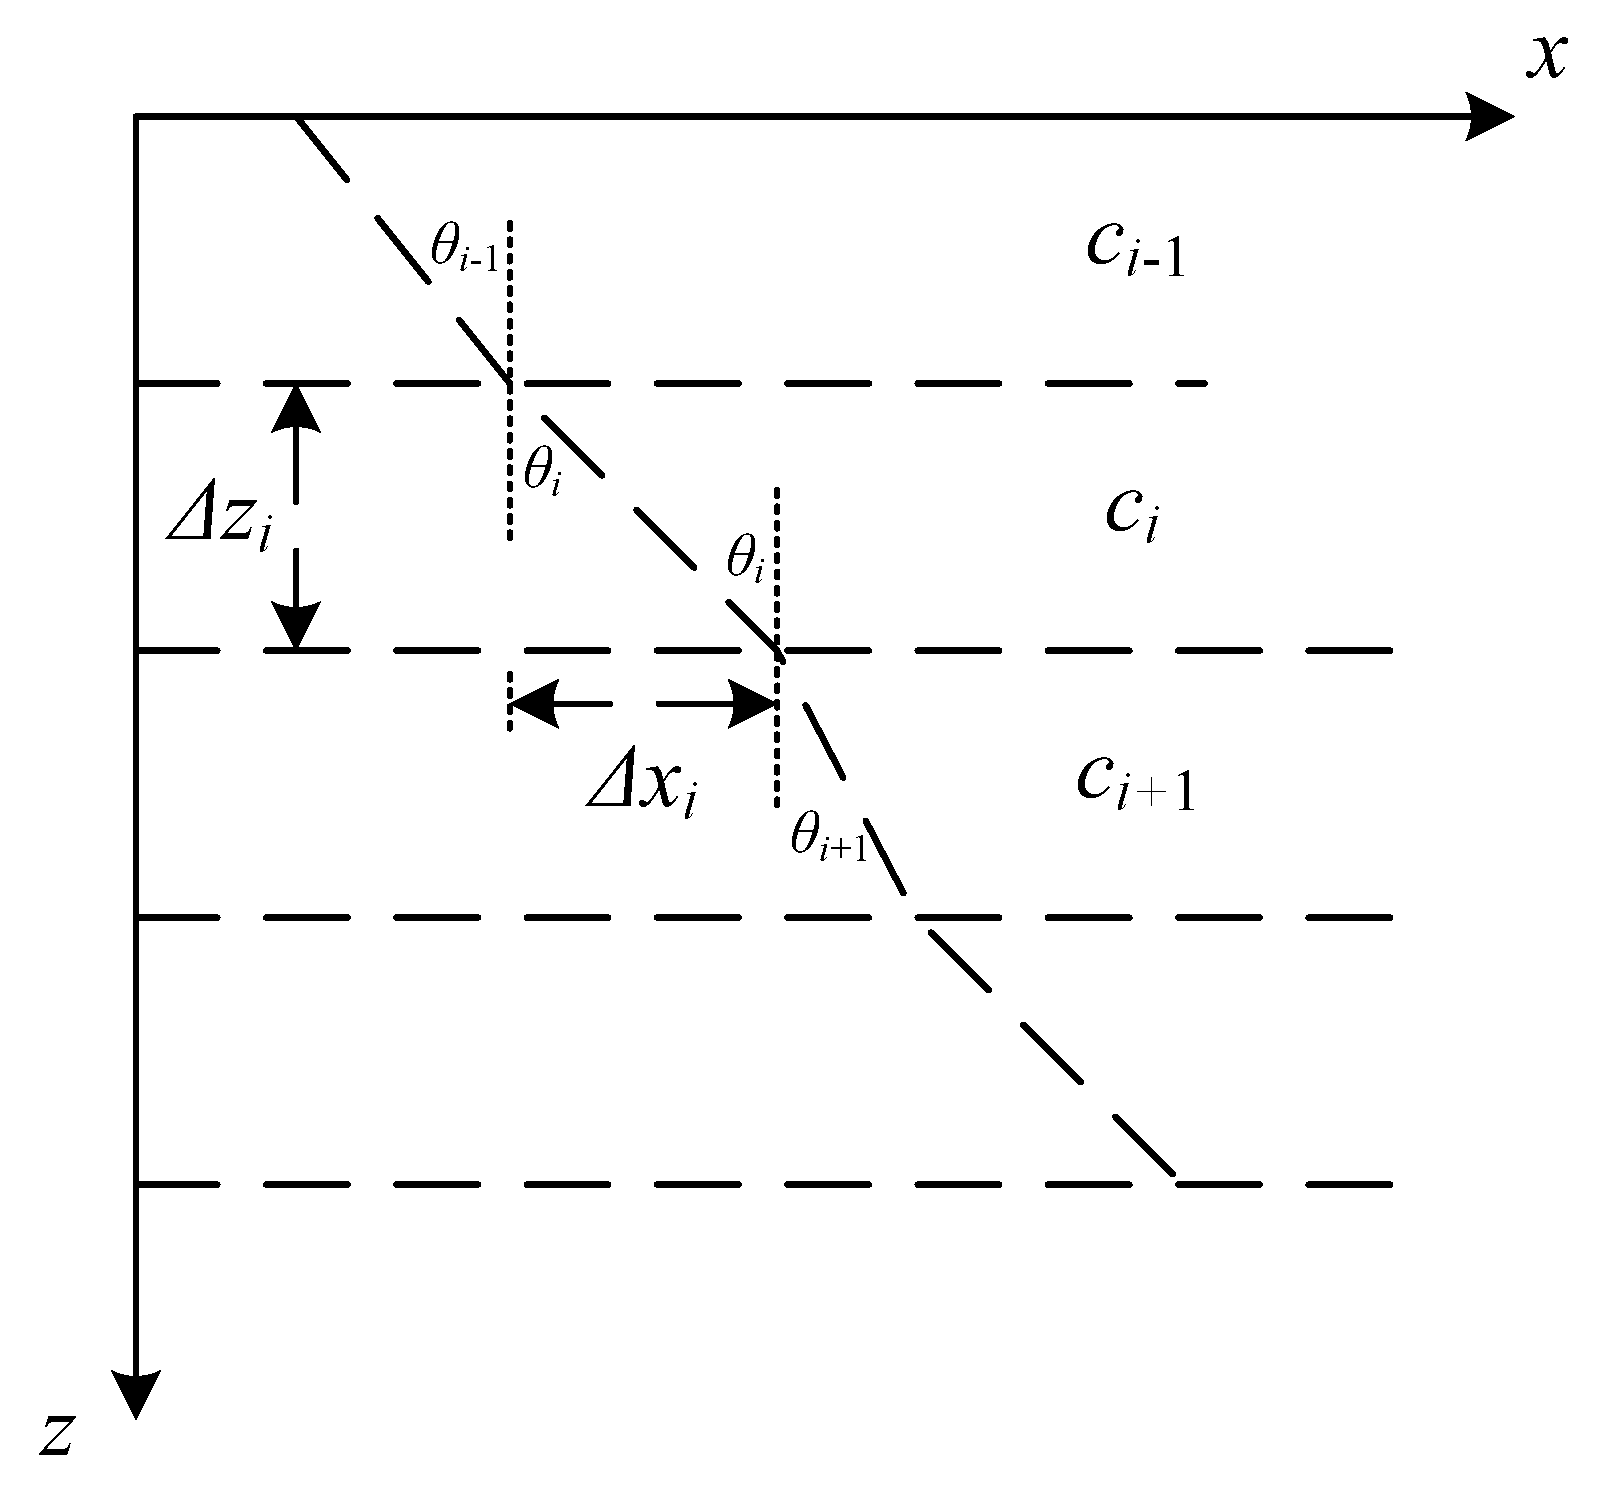
Figure 1 shows the acoustic ray trajectory of the ZGRT method.
If the acoustic ray propagates with a constant sound velocity (zero gradients) in unit water layer
i, the horizontal distance Δ
xi and the propagation time Δ
ti can be expressed as [
12,
13]
where
p is Snell’s refraction constant,
ci,
θi, and Δ
zi are the sound velocity, the beam incidence angle, and the thickness of the water layer
i, respectively.
In the process of acoustic ray tracing, Δ
xi and Δ
ti are calculated layer by layer and accumulated as ΣΔ
xi and ΣΔ
ti. This process ends when the ΣΔ
ti reaches the observation time
t measured by MBS. The horizontal displacement and the vertical displacement in the last water layer are respectively [
14]
where,
, is the residual time of acoustic ray tracing,
cn, and
θn are the sound velocity and the incident angle in the last water layer, respectively. The positions of the beam footprint are obtained by accumulative the horizontal displacement Δ
xi and vertical displacement Δ
zi of the whole water layers.
2.2. Influence of sound velocity errors on the central beam
It is widely believed that the sounding accuracy of the central beam is higher than the marginal beams because the incident angle of the central beam in all the water layers is zero, and the acoustic ray does not bend during propagation. However, the sounding errors will still accumulate due to the inaccurate measurement of the sound velocity profile. The position of the central beam footprint will deviate from the actual seafloor depth in the vertical direction.
Since the incident angle of the acoustic ray is 0, the propagation time Δ
ti of the central beam in the water layer
i can be written as [
15]
where Δ
si =
ci × Δ
zi, is the area enclosed by the sound velocity profile and the
z-axis in water layer
i [
16].
If the Δ
ci is the measurement error of sound velocity
ci in water layer
i, there would be an error
δti with respect to the propagation time Δ
ti and an error
δsi with respect to the SVP area Δ
si. Taking the sound velocity error Δ
ci into account. Equation (5) can be rewritten as
Since the
δti and
δsi are less than a few parts in 10
3 of Δ
si and Δ
ti, respectively. The second-order term
δti ·
δsi is much smaller than the others and can be neglected. For the actual values of Δ
si and Δ
ti satisfy equation (5),
δti can be described as
If the sound velocity of each layer is replaced by the harmonic average sound velocity
ch, that will cause the error to be less than a few parts in 10
4 of the total propagation time, and the variation of the total propagation time
δT for the whole water layer can be simplified as
where
δS is the SVP area for the whole water layers.
Equation (8) reveals the relationship between the variation of the propagation time δT and the SVP area difference δS. As the δS is positive, the δT is negative. It means that the accumulated time which is calculated by the ray tracing method from the surface layer to the last layer is less than the measured propagation time. So, the ray tracing program continues to run until the accumulated propagation time reaches the measured propagation time. Resulting in the sounding of the central beam is greater than the actual water depth. Similarly, the δT is positive when the δS is negative, which indicates that the beam footprint does not reach the real seafloor when the accumulated propagation time is equal to the measured propagation time. This will cause the water depth measured by the central beam to be smaller than the real water depth.
2.3. Topography distortion law caused by sound velocity error
The sounding error caused by the same SVP error changes along with the initial incidence angles. This would distort the measured marine topography into a convex or concave shape.
The relationship between the propagation time Δ
ti and the depth Δ
zi in the water layer
i can be described as
If the measured sound velocity with an error Δ
ci, i.e.,
, the vertical displacement Δ
zi′ on the same propagation time Δ
ti is given by
where is the updated incident angle as the sound velocity varies.
From Equations (9) and (10), the vertical displacement deviation
δzi in water layer
i can be derived as
According to Snell’s law, it has
The Equation (11) can be rewritten as
As Equation (12) shows, the displacement deviation δzi is negative when 0°≤θi′≤θi<45° or 45°≤θi≤θi′<90°, and the δzi is positive when 45°≤θi′≤θi<90° or 0°≤θi≤θi′<45°. It implies that the soundings are smaller than the actual sea depth when 0°≤θi′≤θi<45° or 45°≤θi≤θi′<90°, and the soundings are greater than the actual sea depth when 45°≤θi′≤θi<90° or 0°≤θi≤θi′<45°.
The Equation (12) can be rewritten as
To analyze the relationship between the vertical displacement deviation
δzi and the initial incidence angle, the
ci and Δ
ci can be taken as a constant. The derivative of
δzi with
p is given by
where
p=sin(
θ0)/
c0 is Snell constant,
θ0 and
c0 are the initial incidence angle and surface sound velocity, respectively. If Δ
ci < 0, the displacement deviation
δzi would decrease with the initial incidence angle
θ0 increasing. On the contrary, if Δ
ci > 0, the
δzi would increase with the initial incident angle θ0 increasing.
Considering the whole water layers, . If the SVP area δS is less than zero, the central beam footprint would be above the real seafloor. This leads to the vertical δZ displacement deviation decreasing as the initial incidence angle increases, and the shape of the calculated seafloor topography shows a convex shape. On the contrary, the calculated seafloor topography would show a shape of concave when the SVP area δS is bigger than zero.
2.4. An important fact about the initial incidence angle is 45 degree
Different from the previous viewpoint of the central beam has the most accuracy. We present an important fact that MBS has a minimal sounding error instead of the central beam when the initial incidence angle is about 45°. In this section, this fact would be proved as follow.
The SVP area in water layer
i is defined as
Taking into Equation (2), the propagation time in water layer
i can be expressed as
where
and
.
Taking the partial derivative of Eq(16)with respect to
ci is given by
The function
f(
θ) is defined as
Since the initial incidence angle
θ0 and layer thickness Δ
zi is a constant, the Δ
zi·
p2 is a constant. The change law
is only determined by the function
f(
θ). The greater the function
f(
θ) is, the more significant influence of the sound velocity disturbance on the propagation time. The smaller the function
f(
θ) is, the weaker influence of the sound velocity disturbance on the propagation time. The relationship between the function
f(
θ) and the incident angle is shown as
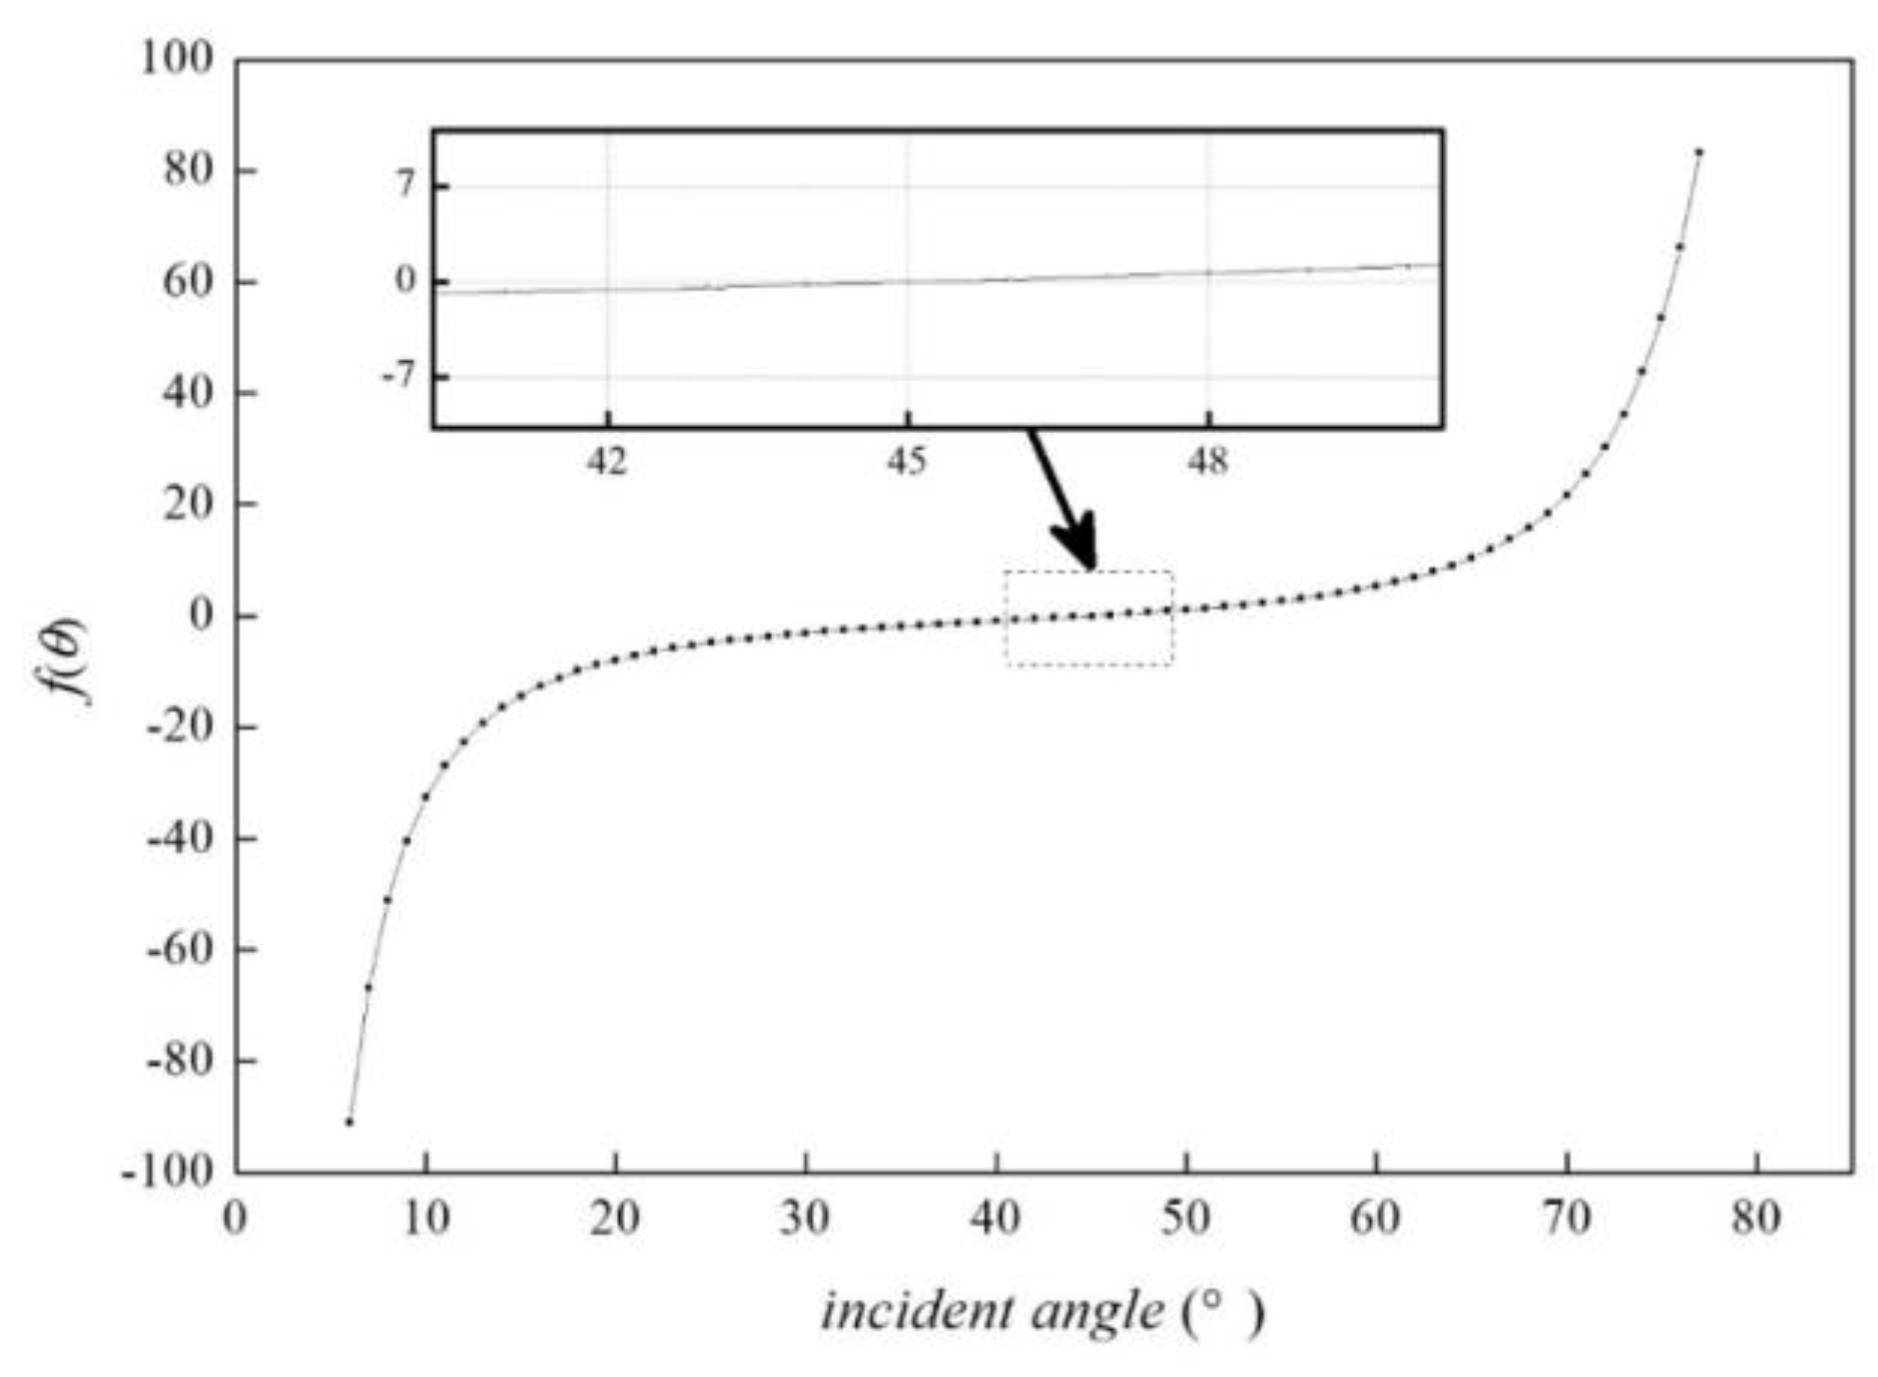
Figure 2.
It can be seen from
Figure 2 that the function curve
f(
θ) is an approximate straight line and slowly increases when the incident angle varies from 20 ° to 60 °. The value of
f(
θ) is 0 when the incident angle is about 45°. It changes violently as the incident angle is smaller than 20 ° or bigger than 60 °.
The sound velocity has the vertical variation and the measurement error. Assuming that the initial incidence angle is 45°. The vertical variation range of sound velocity is range from -20m/s to 20m/s and the measurement error range of sound velocity is from -2m/s to 2m/s. The total variation of sound velocity will result in the fluctuation of the incident angle from 0.7589° to 0.7691. Equivalent to the vertical error is from 7.0687e-05 to 7.1637e-05 and the horizontal error is from 6.8838e-05 to 7.3586e-05 for the water depth is 1 m. It means that the influence of sound velocity error on the propagation time is relatively small when the initial incidence angle is about 45°. The measured depth obtained by the ray tracing method will be close to the real seafloor, and the horizontal displacement for the whole water layer is terribly small on the various SVP errors. Therefore, the beam footprint line affected by various SVP errors can be approximated regard as converging at the real water depth.
We draw the following conclusions through the previous theoretical analysis. 1) Soundings of the central beam are greater than the real water depth when the SVP area difference is positive, and it is less than the real water depth when the SVP area difference is negative. 2) The topography presents a concave shape when the SVP area difference is positive, and the topography presents a convex shape when the SVP area difference is negative. 3) The position of the beam footprint is near the real water depth for various sound velocity errors when the initial incidence angle is about 45°.
3. Simulated examples and analysis
3.1. Simulated examples
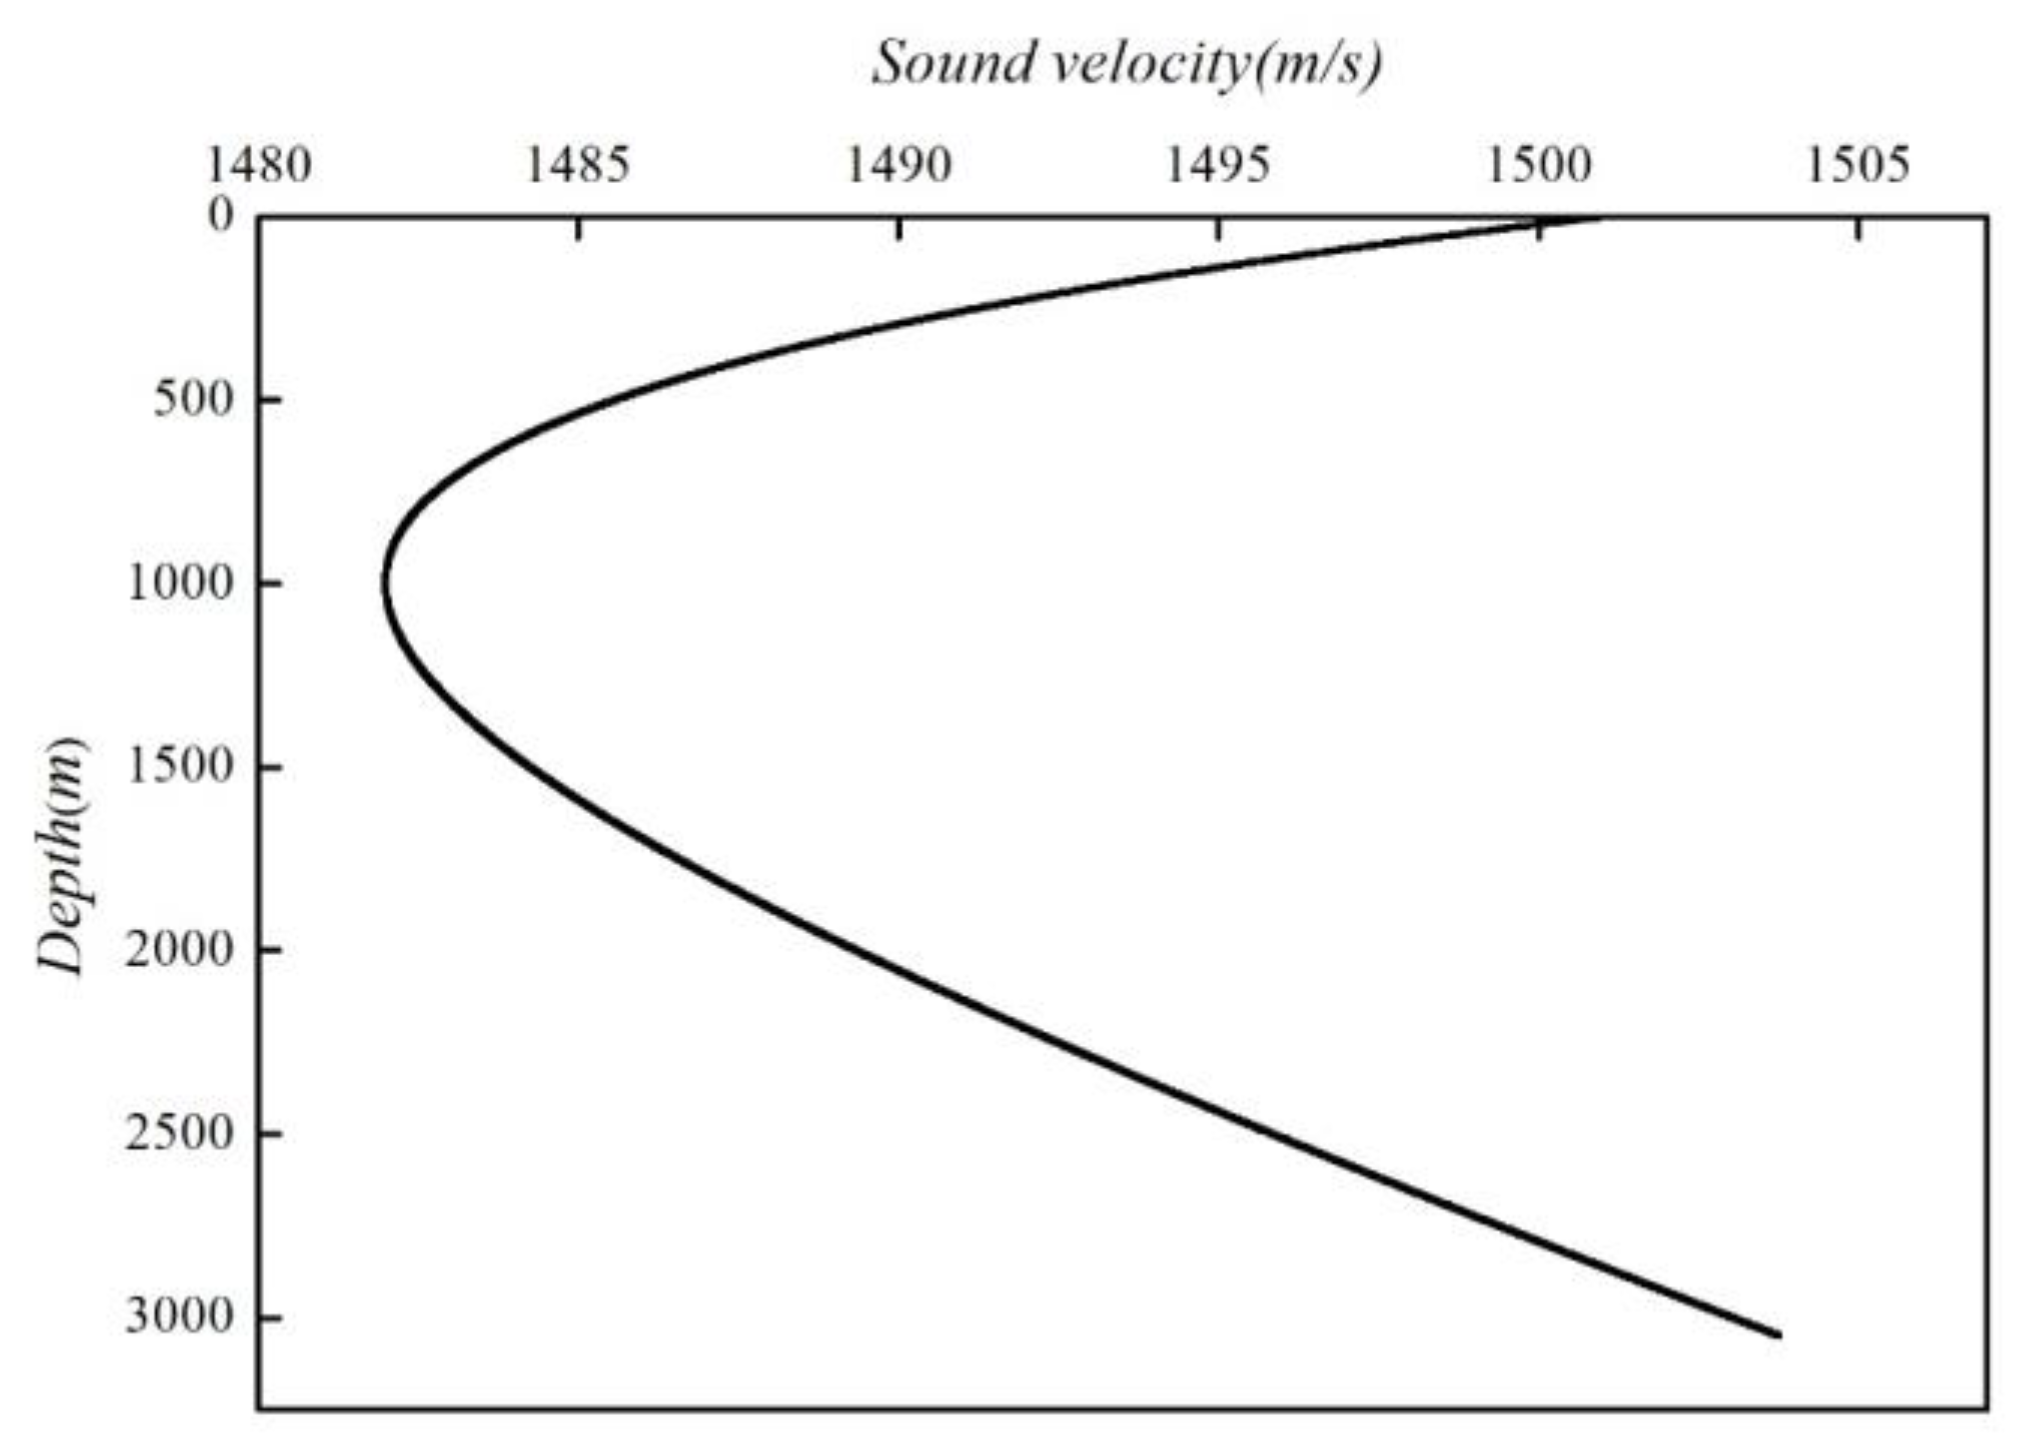
We carried out the following simulations to verify the above theoretical analysis. The SVP used in the simulations was obtained by the Munk standard equation [
17]
where
z1=1000 m is the depth of the sound channel axis,
C1=1482 m/s is the sound velocity at this depth,
ε=7.4×10
-3 is the perturbation coefficient,
B=1400 m is the stratification scale, and
z is the depth to the sea surface.
Figure 3 is a background SVP simulated by Eq. (19).
Other simulation parameters are set as
Water depth 3000 meters
Draught of the transducer 1 meter
Thickness of the unit water layer 1 meter
Swath coverage of the MBS 120 degrees
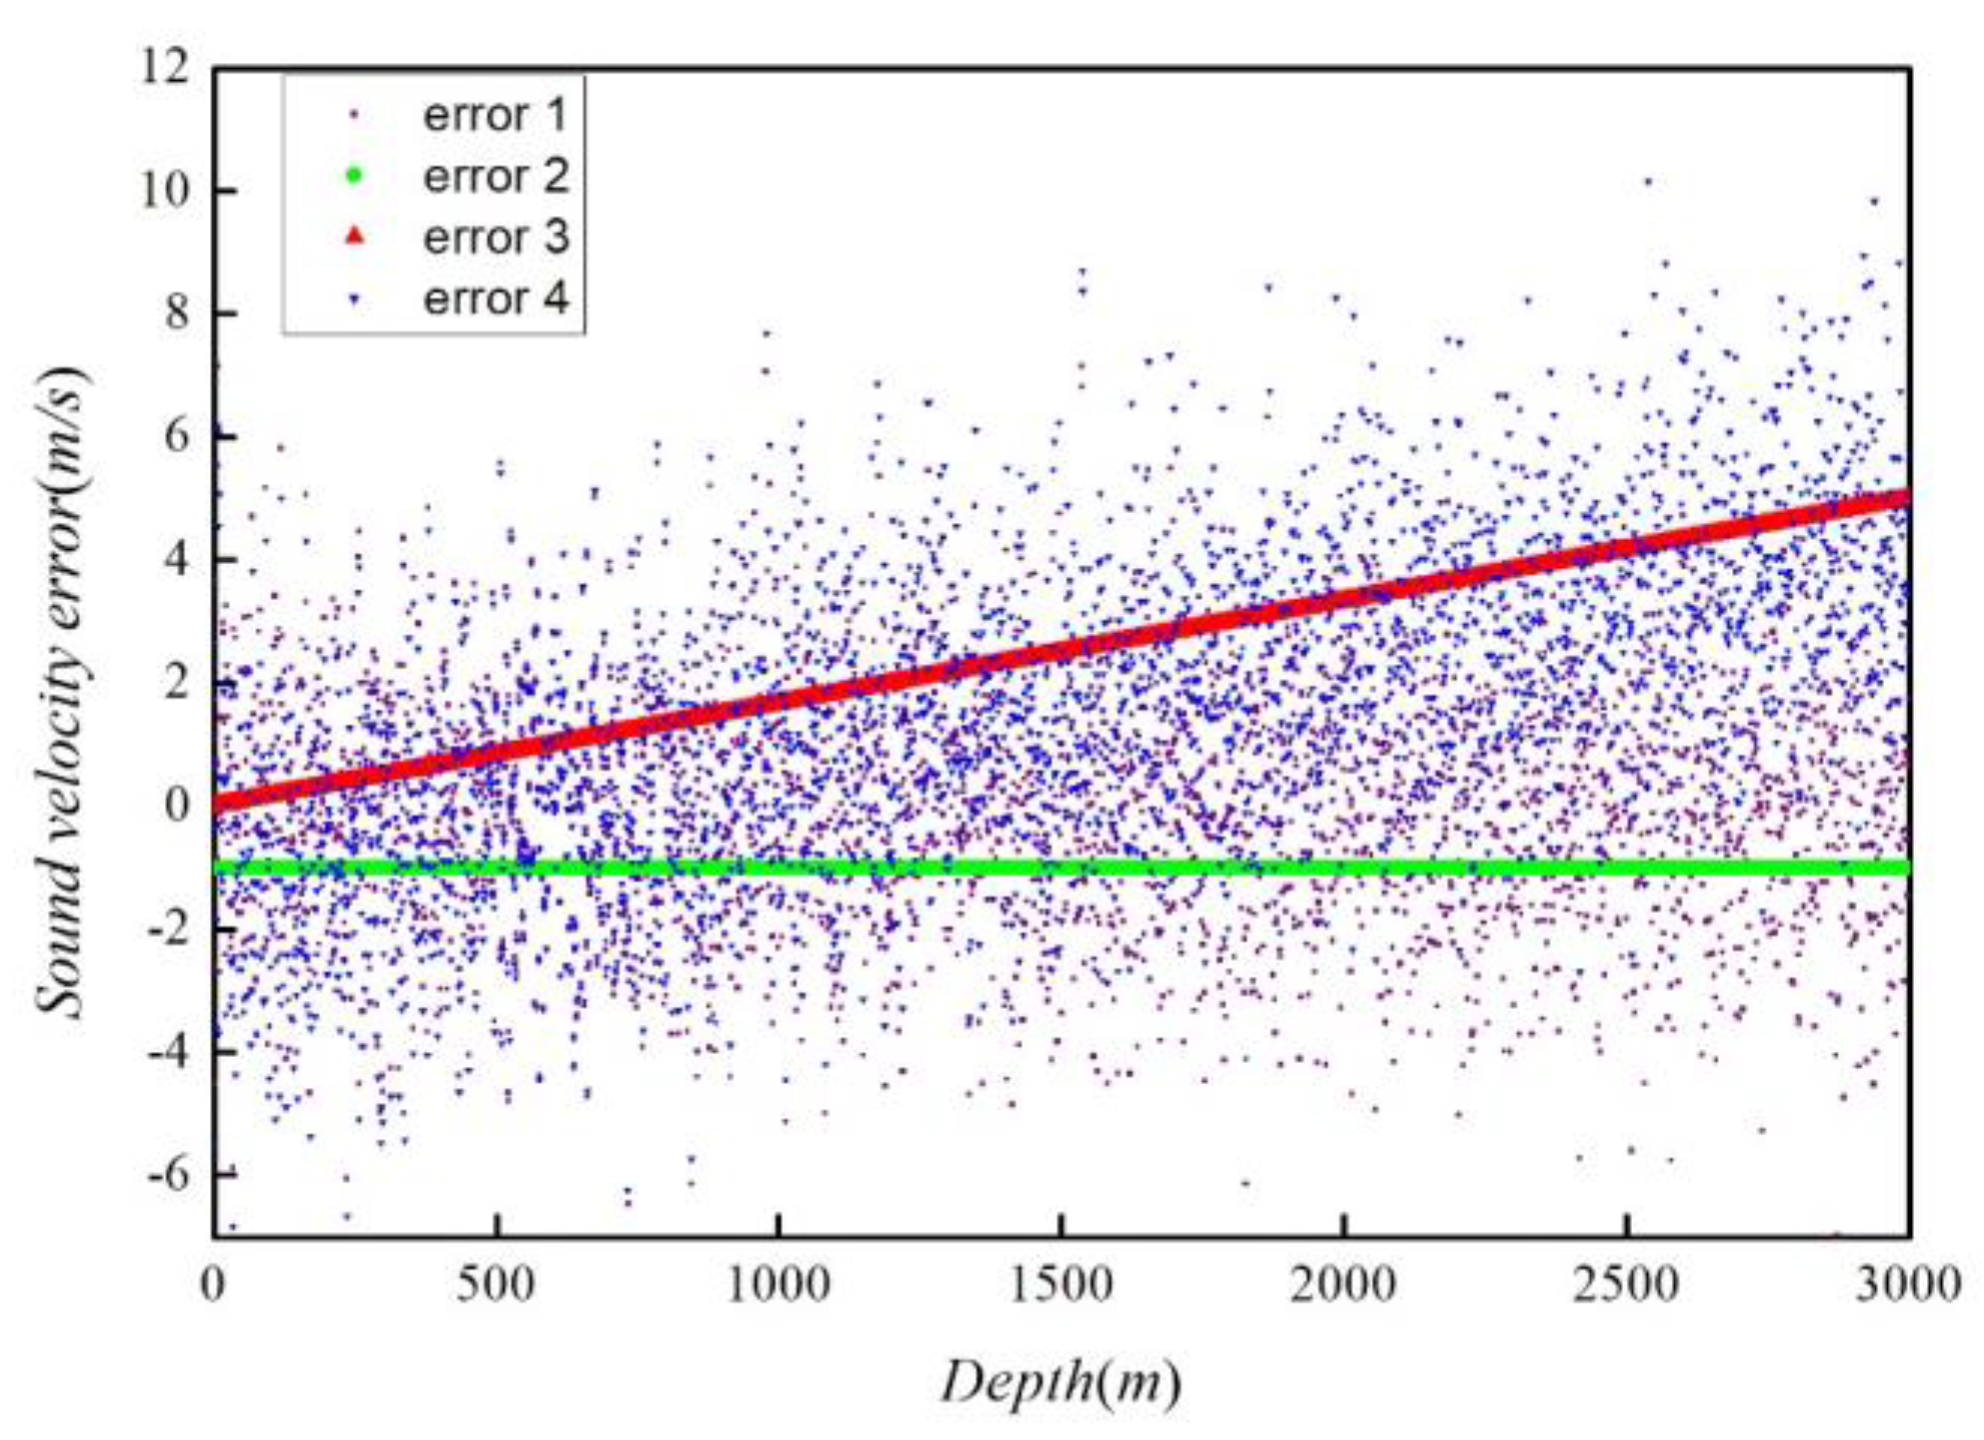
In addition, we assumed that the seafloor topography is flat without fluctuation. To make the simulation more convincing, four types of sound velocity error were designed and shown as follows
The random error with variance is 2m/s;
The systematic error whose value is the constant and set as -1m/s;
The systematic error whose value increases with depth;
Including all the above terms.
Figure 4 shows the distribution of the four types of sound velocity errors.
The propagation time observations are calculated by the CGRT [
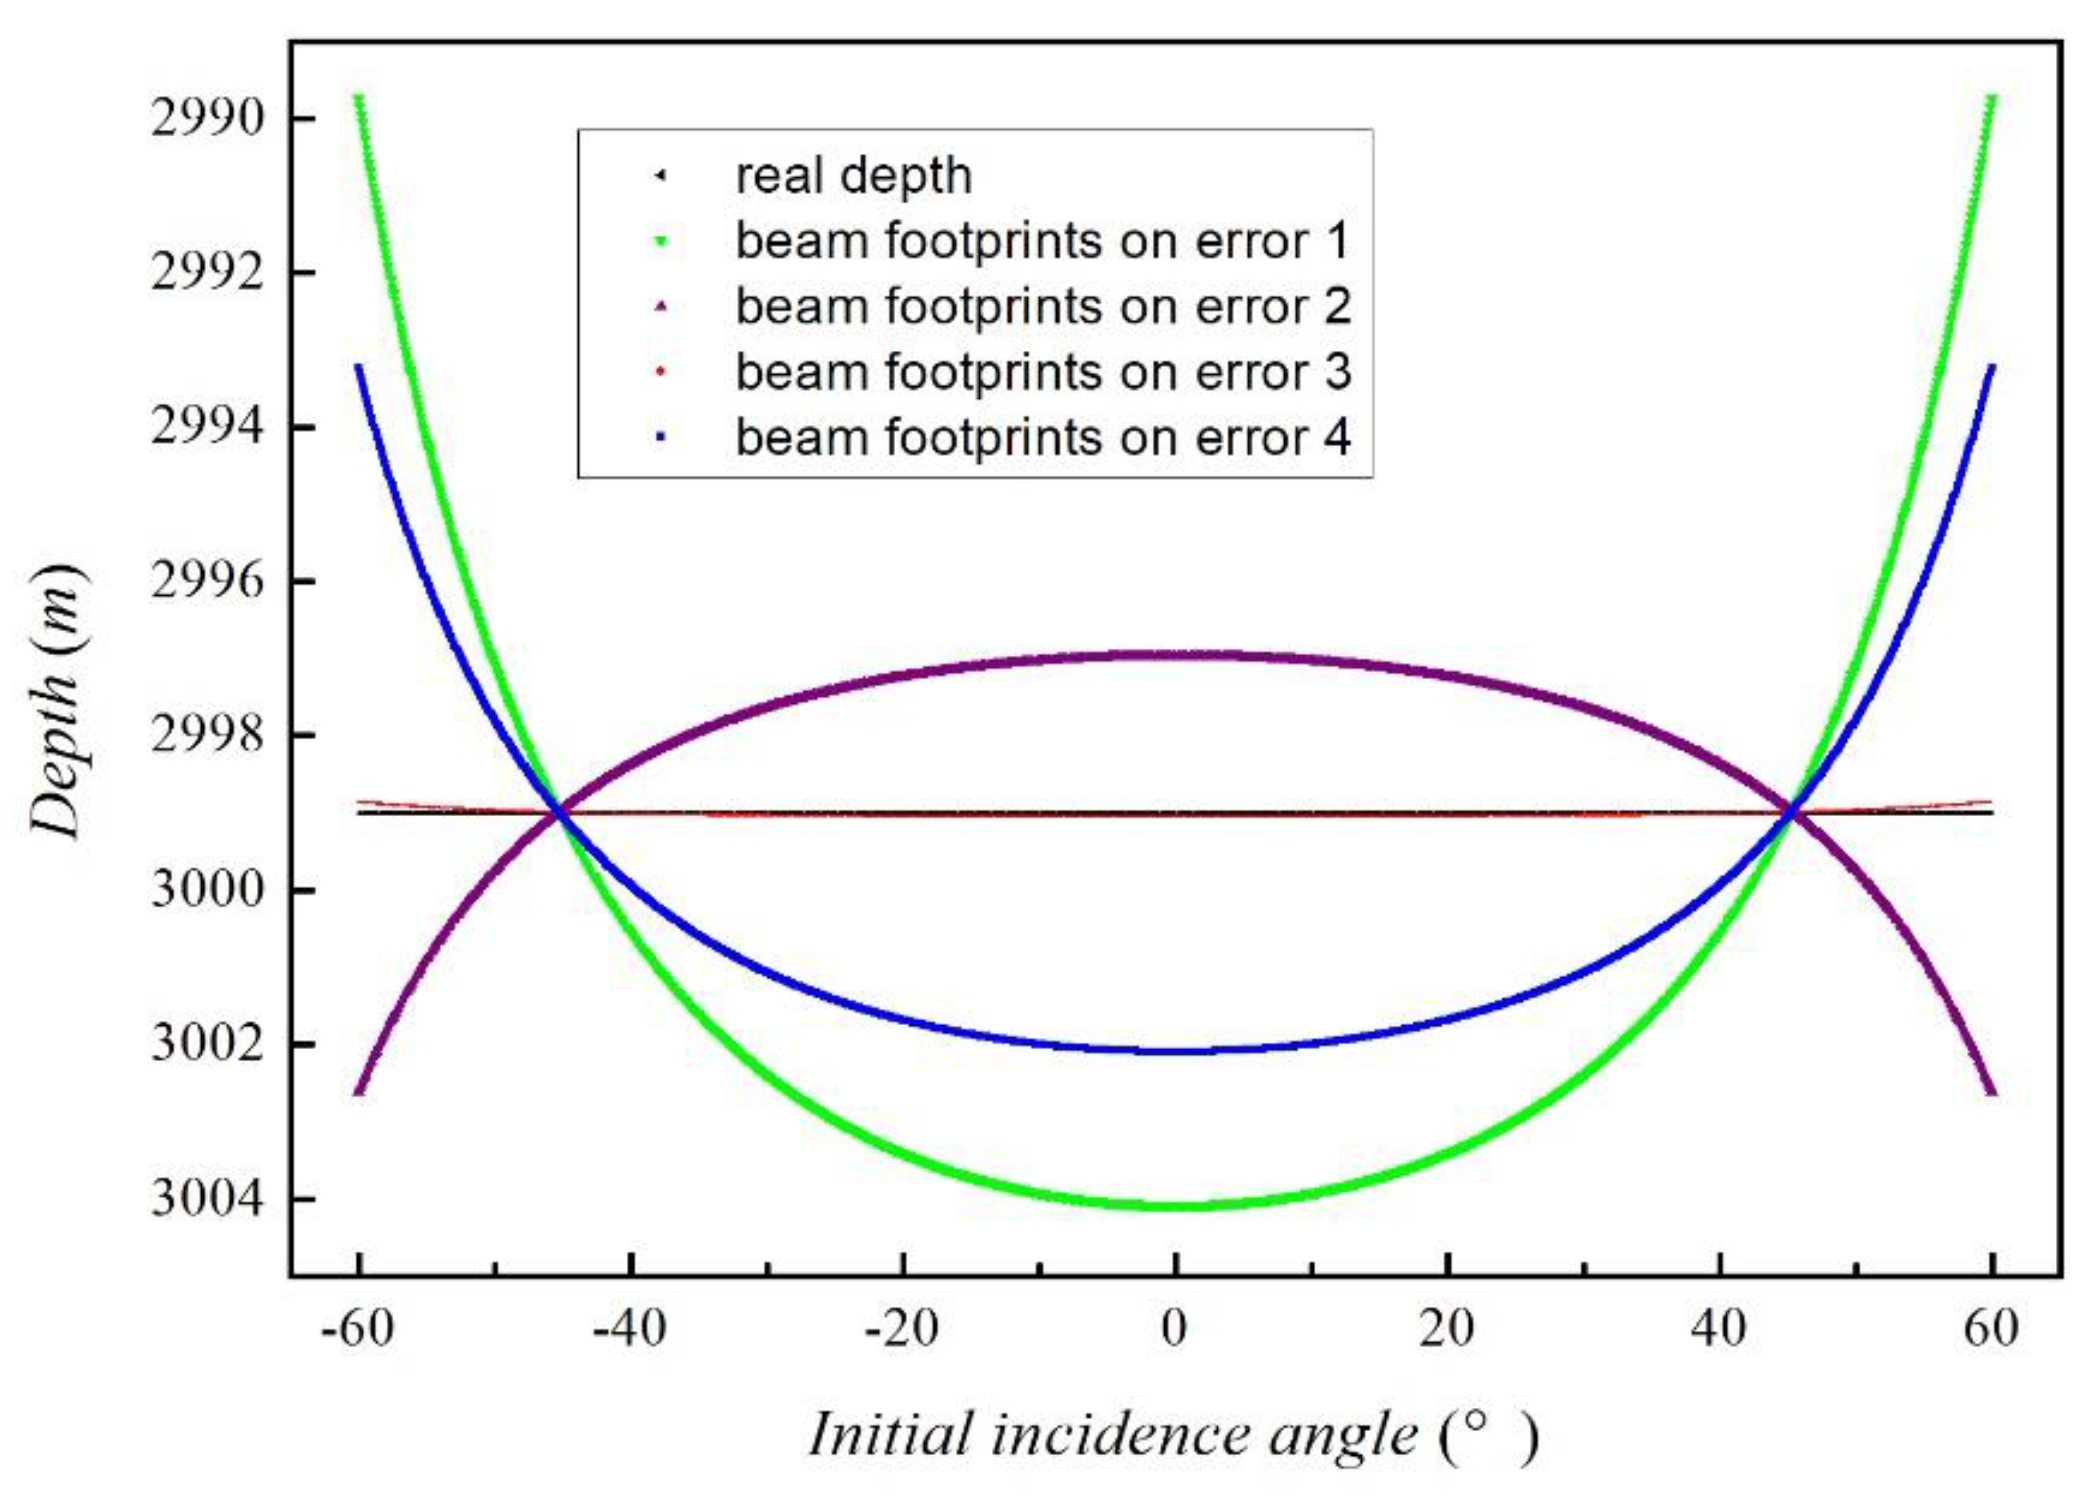
18]. Four types of sound velocity error were separately added to the background SVP. Then, calculate the positions of the beam footprint with the range of initial incidence angle from -60° to 60°. The result is shown in
Figure 5.
Figure 5 shows that it seems like the beam footprint lines on the different sound velocity errors would intersect with the real water depth at the same point when the initial incidence angle is about 45°. The beam footprint line on the error term 2 is the purple curve and its SVP area difference is -2.9985×10
-3. The sounding of the central beam is smaller than the real water depth and the shape of the beam footprint line is convex shape. The SVP area difference of terms 1, 3, and 4 are 7.5×10
3, 27.723, and 4.5292×10
3, respectively. As shown in the green, red, and blue curves in
Figure 5. The soundings of the central beam are greater than the real water depth and the shape of the beam footprint line is concave. The larger the SVP area difference is, the more serious topography distortion happens. It indicates that the main factor that determines the seafloor topography distortion is the SVP area difference. The results are consistent with the theoretical analysis.
3.1. Application
The main factor that affects the seafloor topography distortion is the SVP area difference according to the previous analysis and simulation. In this section, a correction method was proposed to correct the topography distortion by compensating the SVP area. The specific steps of method are given below.
1. The shape of the beam footprint line is used to judge the positive or negative of the SVP area difference, which is obtained by the ray tracing method with measured SVP and propagation time observations.
2. An initial sound velocity correction δc and a given tolerance εD were set. The average depth Dm of the marginal beam on both sides was calculated. Then, calculate the depth difference D between the average depth Dm and the depth of the central beam. The sound velocity of each layer was added by the correction δc when D is bigger than zero. The sound velocity of each layer was reduced by the correction δc when D is smaller than zero. The SVP was updated in this way.
3. The depth difference
D was recalculated by the updated SVP and marked as
D1. The difference between
D and
D1 was calculated and marked as
δD. If
δD is less than the
εD, jump out of the cycle and output the result. If
δD is bigger than the
εD, update the sound velocity correction value according to the following equation
4. Return to step (2) and circularly calculated step (3) until δD is smaller than εD.
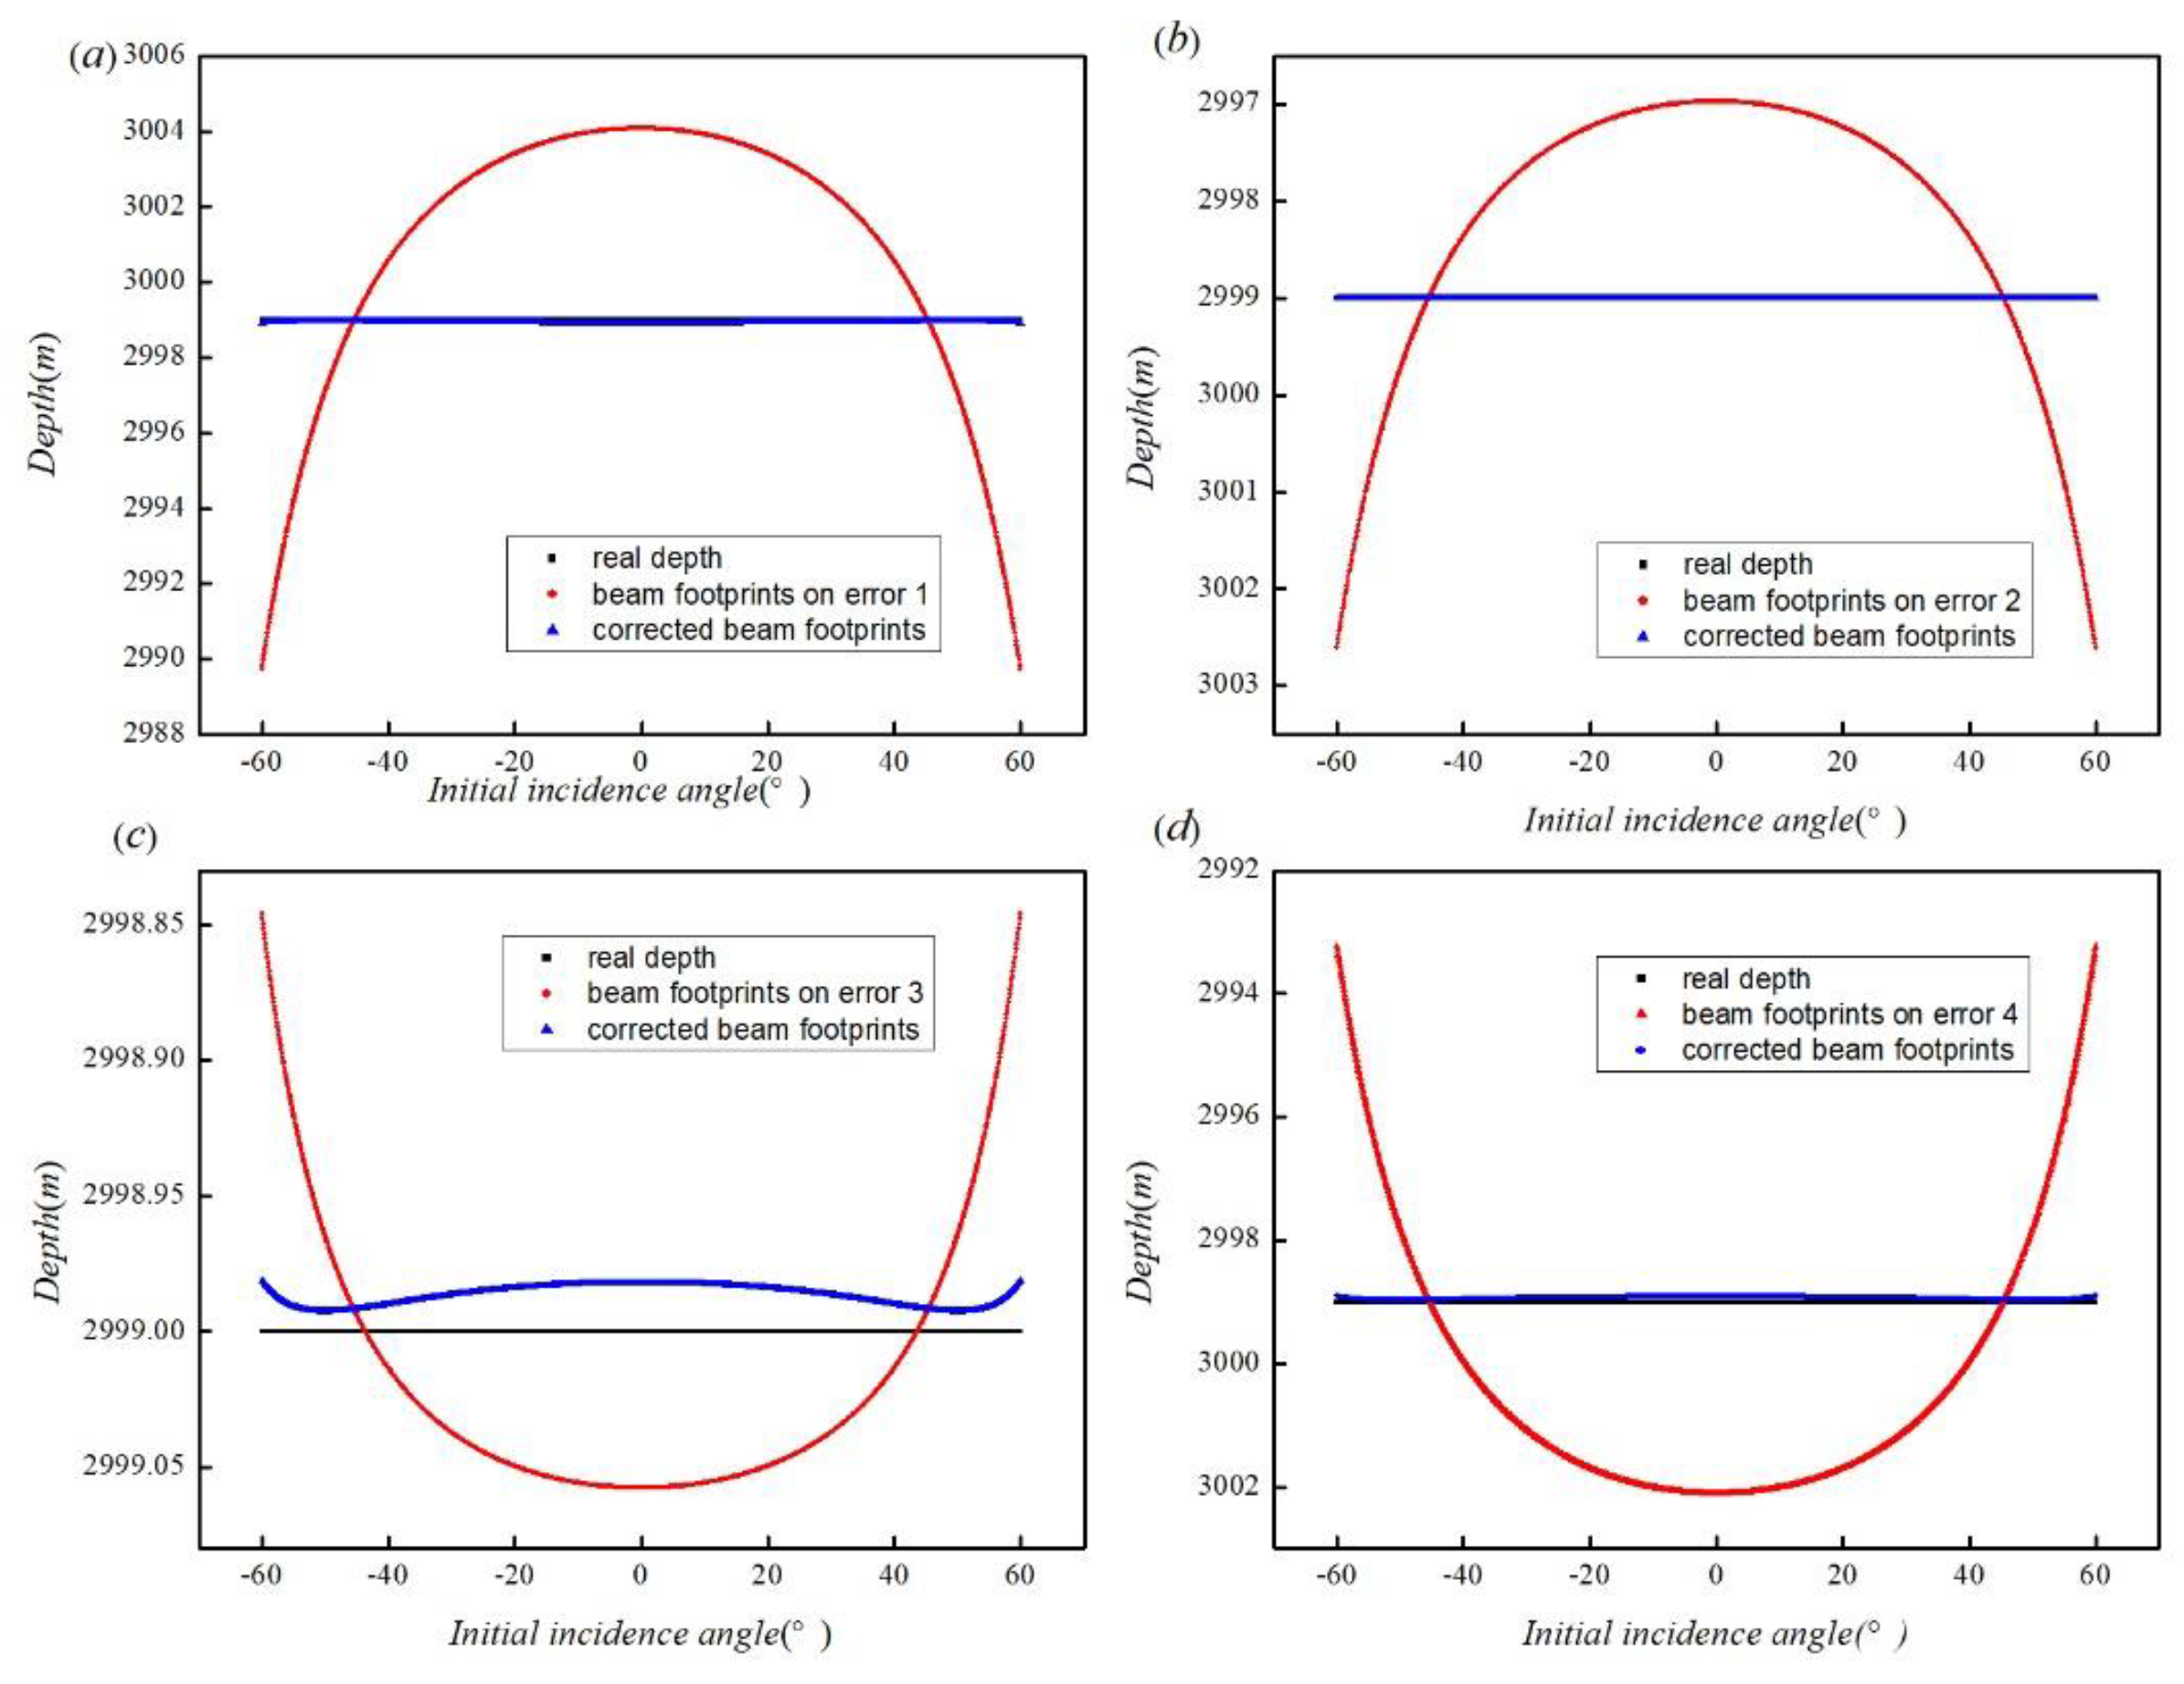
Another simulation was designed to correct the topography distortion caused by the four types of sound velocity error shown in
Figure 5. The initial sound velocity correction value
δc is set as 1 m/s, and the given tolerance
εD is 0.01 m.
Figure 6 shows the distorted topography after being corrected by this method. Both the beam footprint of the marginal beam and the central beam are close to the real water depth, and the magnitude of difference between them is only a few centimeters. It shows that the topography correction method can effectively improve the accuracy of the MBS soundings. Whether it is a system error, a random error, or both included. It proves the robustness of this method.
4. Conclusions
This study focuses on the problem of seafloor topography distortion caused by sound velocity error. We carried out a series of theoretical analyses about how the SVP area difference affects the topography distortion. An important fact that the sound velocity error has the least influence on MBS soundings when the initial incidence angle is about 45° was found. All the viewpoints have been verified by the two simulations. Finally, the following conclusions are drawn out.
1. The SVP area difference is the main factor that determines the position of the beam footprint of the central beam and the distortion extent of seafloor topography.
2. The beam footprint line and the real water depth will intersect when the initial incidence angle is about 45°. This conclusion is not affected by the various sound velocity errors.
3. Since the seafloor topography distortion mainly depends on the SVP area difference, we can add a correction of sound velocity to each layer for reducing the SVP area difference. This method can effectively improve the accuracy of MBS soundings.
Author Contributions
Conceptualization, W.Z.S.; methodology, W.Z.S. and A.M.Z.; software, X.Z.; validation, W.Z.S. and X.Z.; formal analysis, W.Z.S.; investigation, Z.X.; resources, A.M.Z.; data curation, X.Z.; writing—original draft preparation, W.Z.S.; writing—review and editing, A.M.Z. and Z.X.; supervision,A.M.Z.; project administration, A.M.Z.; funding acquisition, A.M.Z.
Funding
This work is supported by China Postdoctoral Science Foundation (2022M723888); National Natural Science Foundation of China (Grant No. 41931076); National Key Research and Development Program of China (Grant No.2020YFB0505801); Financially supported by Laoshan Laboratory (LSKJ.202205101).
References
- Zhang, L., S. Ye, S. D. Zhou, F. Liu, and Y. Q. Han. Review of measurement techniques for temperature, salinity and depth profile of sea water, Marine Science Bulletin. 2017, 36(5): 481-489.
- Petitt, R. A., R. W. Schmitt, and N. Brown. A new conductive-temperature-depth device for high resolution oceanographic measurement. Oceans. 2005, 2: 1070-1074.
- Sun, W. C., J. Y. BAO, S. h. JIN, F. M. Xiao, and Y. Cui. Inversion of Sound Velocity Profiles by Correcting the Terrain Distortion. Geomatics and information Science of Wuhan University. 2016, 41(3): 349-355.
- Canepa G., O. Bergem, and N. G. Pace. A New Algorithm for Automatic Processing of Bathmetric Data. IEEE Journal of oceanic Engineering. 2003, 28(1): 62-77.
- Yang, F. l., J. B. Li, Z. Y. Wu, X. L. Jin, and F. Y. Chu. Fine Processing of Shallow Water Multi-beam Survey Data. Acta Geodaetica et Cartographica Sinica. 2008, 37(4): 444-457.
- Zhu, Qing., and D. R. Li. Error Analysis and Processing of Multibeam Soundings. Journal of Wuhan Technique University of Surveying and Mapping. 1998, 23(1):1-4.
- Xiao, Y. B., R. C. Peng, J. Y. Bao, J. Dong, and C. lv. Sounding Velocity Integrated Error Correction Method of Muti-beam Data Based on Kalman filtering. Geomatics and information Science of Wuhan University. 2020, 45(9): 1461-1468.
- Zhao, J. H., H. M. Zhang, and J. Yan. Weakening Influence of Residual Error for MBS Sounding. Geomatics and information Science of Wuhan University. 2013, 38(10): 1184-1187.
- Wu, Z. Y., X. L. Jin, Y. L. Zheng, J. B. Li, and P. Yu. Integrated error correction of multi-beam marginal sounding beam. Acta Oceanologica Sinica. 2005, 27(4): 88-94.
- Yang, F. L., X. S. Lu, J. B. LI, L. T. Han and Z. Y. Zheng. Precise positioning of underwater static objects without sound speed profile Marine Geodesy. 2011, 34(2): 138-151.
- Chadwell, C. D., and A. D. Sweeney. Acoustic ray-trace equations for seafloor geodesy. Marine Geodesy. 2010, 33(2-3): 164-184.
- Sakic, Pi., V. Ballu, C. Wayne, and W. Guy. Acoustic Ray Tracing Comparisons in the Context of Geodetic Precise off-shore Positioning Experiments. Marine Geodesy. 2018, 41(4), 315–330.
- Zhao, J. H., and J. N. Liu. Development of Method in Precise Multibeam Acoustic Bathymetry. Geomatics and Information Science of Wuhan University. 2002, 27(5): 453-457.
- Sun, W. Z., X. D. Yin, A. M. Zeng, and Q. Liu.. Calculating the Starting Incidence Angle by Iterative Method for Positioning Seafloor Control Ponits. Geomatics and Information Science of Wuhan University. 2020, 45(10): 1588-1593.
- Sun, W. Z., X. D. Yin, and A. M. Zeng. The Relationship between Propagation Time and Sound Velocity for Positioning Seafloor Reference Points. Marine Geodesy. 2019, 42(2): 186-200.
- Geng, X. Y., Zielinski A. Precise Multibeam Acoustic Bathymetry. Marine Geodesy. 1999, 22: 157-167.
- Munk, W. H. Sound channel in an exponentially stratified, with application to SOFAR. The Journal of the Acoustical Society of America. 1974, 55(2): 220-226.
- Lu, X. P., S. F. Bian, M. T. Huang, and G. J. Zhai. An Improved Method for Calculating Average Sound Speed in Constant Gradient Sound Ray Tracing Technology. Geomatics and Information Science of Wuhan University. 2012, 37(5): 590-593.
|
Disclaimer/Publisher’s Note: The statements, opinions and data contained in all publications are solely those of the individual author(s) and contributor(s) and not of MDPI and/or the editor(s). MDPI and/or the editor(s) disclaim responsibility for any injury to people or property resulting from any ideas, methods, instructions or products referred to in the content. |
© 2023 by the authors. Licensee MDPI, Basel, Switzerland. This article is an open access article distributed under the terms and conditions of the Creative Commons Attribution (CC BY) license (http://creativecommons.org/licenses/by/4.0/).
