Submitted:
27 April 2023
Posted:
28 April 2023
You are already at the latest version
Abstract
Keywords:
1. Introduction
2. Results and discussion
2.1. Concentrations of NEOs in rice and drinking water
2.2. Fates of NEOs in rice through heat treatment process
2.3. Fates of NEOs in water through heat treatment process
3. Materials and methods
3.1. Chemicals and reagents
3.2. Sample collection
3.3. Rice sample preparation
3.4. Water sample preparation
3.5. Instrumental analysis
3.6. Quality assurance and quality control
3.7. Statistical analysis
4. Conclusions
Supplementary Materials
Author Contributions
Funding
Notes
References
- Douglas, M.R.; Tooker, J.F. Large-scale deployment of seed treatments has driven rapid increase in use of neonicotinoid insecticides and preemptive pest management in US field crops. Environ. Sci. Technol. 2015, 49, 5088–5097. [Google Scholar] [CrossRef]
- Tomizawa, M.; Casida, J.E. Selective toxicity of neonicotinoids attributable to specificity of insect and mammalian nicotinic receptors. Annu. Rev. Entomol. 2003, 48, 339–364. [Google Scholar] [CrossRef]
- Gu, Y.H.; Li, Y.; Huang, X.F.; Zheng, J.F.; Yang, J.; Diao, H.; Yuan, Y.; Xu, Y.; Liu, M.; Shi, H.J.; Xu, W.P. Reproductive effects of two neonicotinoid insecticides on mouse sperm function and early embryonic development in vitro. PLoS One 2013, 8, e70112. [Google Scholar] [CrossRef]
- Gibbons, D.; Morrissey, C.; Mineau, P. A review of the direct and indirect effects of neonicotinoids and fipronil on vertebrate wildlife. Environ. Sci. Pollut. Res. 2015, 22, 103–118. [Google Scholar] [CrossRef]
- Chen, M.; Tao, L.; McLean, J.; Lu, C. Quantitative analysis of neonicotinoid insecticide residues in foods: implication for dietary exposures. J. Agric. Food Chem. 2014, 62, 6082–6090. [Google Scholar] [CrossRef] [PubMed]
- Song, S.; Zhang, T.; Huang, Y.; Zhang, B.; Guo, Y.; He, Y.; Huang, X.; Bai, X.; Kannan, K. Urinary Metabolites of Neonicotinoid Insecticides: Levels and Recommendations for Future Biomonitoring Studies in China. Environ. Sci. Technol. 2020, 54, 8210–8220. [Google Scholar] [CrossRef] [PubMed]
- Mendy, A.; Pinney, S.M. Exposure to neonicotinoids and serum testosterone in men, women, and children. Environ. Toxicol. 2022, 37, 1521–1528. [Google Scholar] [CrossRef] [PubMed]
- Li, A.J.; Banjabi, A.A.; Takazawa, M.; Kumosani, T.A.; Yousef, J.M.; Kannan, K. Serum concentrations of pesticides including organophosphates, pyrethroids and neonicotinoids in a population with osteoarthritis in Saudi Arabia. Sci. Total. Environ. 2020, 737. [Google Scholar] [CrossRef] [PubMed]
- Osaka, A.; Ueyama, J.; Kondo, T.; Nomura, H.; Sugiura, Y.; Saito, I.; Nakane, K.; Takaishi, A.; Ogi, H.; Wakusawa, S.; Ito, Y.; Kamijima, M. Exposure characterization of three major insecticide lines in urine of young children in Japan-neonicotinoids, organophosphates, and pyrethroids. Environ. Res. 2016, 147, 89–96. [Google Scholar] [CrossRef] [PubMed]
- Ospina, M.; Wong, L.Y.; Baker, S.E.; Serafim, A.B.; Morales-Agudelo, P.; Calafat, A.M. Exposure to neonicotinoid insecticides in the U.S. general population: Data from the 2015-2016 national health and nutrition examination survey. Environ. Res. 2019, 176, 108555. [Google Scholar] [CrossRef]
- Wang, P.; Yang, X.; Wang, J.; Cui, J.; Dong, A.J.; Zhao, H.T.; Zhang, L.W.; Wang, Z.Y.; Xu, R.B.; Li, W.J.; Zhang, Y.C.; Zhang, H.; Jing, J. Multi-residue method for determination of seven neonicotinoid insecticides in grains using dispersive solid-phase extraction and dispersive liquid-liquid micro-extraction by high performance liquid chromatography. Food Chem. 2012, 134, 1691–1698. [Google Scholar] [CrossRef] [PubMed]
- Huang, Y.; Zhang, B.; Xue, J.; Lan, B.; Guo, Y.; Xu, L.; Zhang, T. A Pilot Nationwide Survey on the Concentrations of Neonicotinoids and Their Metabolites in Indoor Dust from China: Application for Human Exposure. Bull. Environ. Contam. Toxicol. 2022, 109, 900–909. [Google Scholar] [CrossRef] [PubMed]
- Zhang, C.; Tian, D.; Yi, X.; Zhang, T.; Ruan, J.; Wu, R.; Chen, C.; Huang, M.; Ying, G. Occurrence, distribution and seasonal variation of five neonicotinoid insecticides in surface water and sediment of the Pearl Rivers, South China. Chemosphere 2019, 217, 437–446. [Google Scholar] [CrossRef] [PubMed]
- He, Y.; Zhang, B.; Wu, Y.; Ouyang, J.; Huang, M.; Lu, S.; Sun, H.; Zhang, T. A pilot nationwide baseline survey on the concentrations of Neonicotinoid insecticides in tap water from China: Implication for human exposure. Environ. Pollut. 2021, 291, 118117. [Google Scholar] [CrossRef]
- Shi, Y.; Chen, S.; Xu, K.; Zhao, L.; Liu, Y.; Zou, Q.; Zhang, H.; Zhu, H.; Zhang, T.; Sun, H. Exposure to nitrogenous based flame retardants in Chinese population: Evidence from a national-scale study. J. Hazard. Mater. 2023, 445, 130653. [Google Scholar] [CrossRef] [PubMed]
- Shi, Y.; Chen, S.; Yan, M.; Cheng, Z.; Zhao, L.; Liu, Y.; Zhang, B.; Zhu, H.; Zhang, T.; Kannan, K. Elevated levels of biomarkers of oxidative stress and renal injury linked to nitrogenous flame retardants exposure in e-waste dismantling site: A case study in China. Chemosphere 2023, 314, 137747. [Google Scholar] [CrossRef]
- Zhang, H.; Bai, X.; Zhang, T.; Song, S.; Zhu, H.; Lu, S.; Kannan, K.; Sun, H. Neonicotinoid Insecticides and Their Metabolites Can Pass through the Human Placenta Unimpeded. Environ. Sci. Technol. 2022. [Google Scholar] [CrossRef]
- Watanabe, M.; Ueyama, J.; Ueno, E.; Ueda, Y.; Oda, M.; Umemura, Y.; Tanahashi, T.; Ikai, Y.; Saito, I. Effects of processing and cooking on the reduction of dinotefuran concentration in Japanese rice samples. Food Addit. Contam. Part A 2018, 35, 1316–1323. [Google Scholar] [CrossRef]
- Klarich, K.L.; Pflug, N.C.; DeWald, E.M.; Hladik, M.L.; Kolpin, D.W.; Cwiertny, D.M.; LeFevre, G.H. Occurrence of Neonicotinoid Insecticides in Finished Drinking Water and Fate during Drinking Water Treatment. Environ. Sci. Technol. Lett. 2017, 4, 168–173. [Google Scholar] [CrossRef]
- Iancu, V.-I.; Radu, G.-L. Occurrence of neonicotinoids in waste water from the Bucharest treatment plant. Anal. Methods 2018, 10, 2691–2700. [Google Scholar] [CrossRef]
- Wan, Y.; Han, Q.; Wang, Y.; He, Z. Five degradates of imidacloprid in source water, treated water, and tap water in Wuhan, central China. Sci. Total. Environ. 2020, 741. [Google Scholar] [CrossRef] [PubMed]
- Shao, X.; Liu, Z.; Xu, X.; Li, Z.; Qian, X. Overall status of neonicotinoid insecticides in China: Production, application and innovation. J. Pestic. Sci. 2013, 38, 1–9. [Google Scholar] [CrossRef]
- Mao, L.; Xu, D.; Yuan, S.; Li, F.; Zhang, L.; Zhang, Y.; Jiang, H. Analysis on the status of neonicotinoids insecticides registered in China based on the recommended dosage. Plant Prot. 2020, 46, 200–210. [Google Scholar] [CrossRef]
- Zhang, M.H.; Zhao, P.; Yan, Q.X.; Xin, L.I. The Market and Environmental Impact of the Neonicotinoid Insecticides. Agrochem. 2012. [Google Scholar] [CrossRef]
- Huang, Z.; Li, H.; Wei, Y.; Xiong, J.; You, J. Distribution and ecological risk of neonicotinoid insecticides in sediment in South China: Impact of regional characteristics and chemical properties. Sci. Total. Environ. 2020, 714, 136878. [Google Scholar] [CrossRef]
- Liu, Z.; Zhang, L.; Zhang, Z.; An, L.; Hough, R.; Hu, P.; Li, Y.F.; Zhang, F.; Wang, S.; Zhao, Y.; Ke, Y.; Cui, S. A review of spatiotemporal patterns of neonicotinoid insecticides in water, sediment, and soil across China. Environ. Sci. Pollut. Res. 2022, 29, 55336–55347. [Google Scholar] [CrossRef]
- Chen, Y.; Zang, L.; Liu, M.; Zhang, C.; Shen, G.; Du, W.; Sun, Z.; Fei, J.; Yang, L.; Wang, Y.; Wang, X.; Zhao, M. Ecological risk assessment of the increasing use of the neonicotinoid insecticides along the east coast of China. Environ. Int. 2019, 127, 550–557. [Google Scholar] [CrossRef]
- Zhang, T.; Song, S.; Bai, X.; He, Y.; Zhang, B.; Gui, M.; Kannan, K.; Lu, S.; Huang, Y.; Sun, H. A nationwide survey of urinary concentrations of neonicotinoid insecticides in China. Environ. Int. 2019, 132, 105114. [Google Scholar] [CrossRef]
- Liu, T.; Zhang, X.; Wang, X.; Chen, D.; Li, Y.; Wang, F. Comparative toxicity and bioaccumulation of two dinotefuran metabolites, UF and DN, in earthworms (Eisenia fetida). Environ. Pollut. 2018, 234, 988–996. [Google Scholar] [CrossRef]
- Ford, K.A.; Casida, J.E. Comparative Metabolism and Pharmacokinetics of Seven Neonicotinoid Insecticides in Spinach. J. Agric. Food Chem. 2008, 56, 10168–10175. [Google Scholar] [CrossRef]
- Ford, K.A.; Casida, J.E. Chloropyridinyl neonicotinoid insecticides: Diverse molecular substituents contribute to facile metabolism in mice. Chem. Res. Toxicol. 2006, 19, 944–951. [Google Scholar] [CrossRef]
- Ford, K.A.; Casida, J.E. Unique and common metabolites of thiamethoxam, clothianidin, and dinotefuran in mice. Chem. Res. Toxicol. 2006, 19, 1549–1556. [Google Scholar] [CrossRef]
- Yi, X.; Zhang, C.; Liu, H.; Wu, R.; Tian, D.; Ruan, J.; Zhang, T.; Huang, M.; Ying, G. Occurrence and distribution of neonicotinoid insecticides in surface water and sediment of the Guangzhou section of the Pearl River, South China. Environ. Pollut. 2019, 251, 892–900. [Google Scholar] [CrossRef]
- Lu, C.; Lu, Z.; Lin, S.; Dai, W.; Zhang, Q. Neonicotinoid insecticides in the drinking water system - Fate, transportation, and, their contributions to the overall dietary risks. Environ. Pollut. 2020, 258. [Google Scholar] [CrossRef] [PubMed]
- Saka, M.; Iijima, K.; Nishida, M.; Koma, Y.; Hasegawa, N.; Sato, K.; Kato, Y. Effects of processing and cooking on the levels of pesticide residues in rice samples. J. Food Hyg. Soc. Jpn. 2008, 49, 141–149. [Google Scholar] [CrossRef]
- Satoh, M.; Sakaguchi, M.; Kobata, M.; Sakaguchi, Y.; Tanizawa, H.; Miura, Y.; Sasano, R.; Nakanishi, Y. Effects of rice cleaning and cooking process on the residues of flutolanil, fenobucarb, silafluofen and buprofezin in rice. J. Food Hyg. Soc. Jpn. 2003, 44, 7–12. [Google Scholar] [CrossRef] [PubMed]
- Hanafi, A.; Elsheshetawy, H.E.; Faied, S.F. Reduction of pesticides residues on okra fruits by different processing treatments. J. Verbr. Lebensm. 2016, 11, 337–343. [Google Scholar] [CrossRef]
- Kumarathilaka, P.; Seneweera, S.; Ok, Y.S.; Meharg, A.; Bundschuh, J. Arsenic in cooked rice foods: Assessing health risks and mitigation options. Environ. Int. 2019, 127, 584–591. [Google Scholar] [CrossRef]
- Chen, Z.; Song, S.; Mao, L.; Wei, J.; Li, Y.; Tan, H.; Li, X. Determinations of dinotefuran and metabolite levels before and after household coffee processing in coffee beans using solid-phase extraction coupled with liquid chromatography-tandem mass spectrometry. J. Sci. Food Agric. 2019, 99, 1267–1274. [Google Scholar] [CrossRef]
- Zhang, Q.; Wang, X.; Rao, Q.; Chen, S.; Song, W. Imidacloprid dissipation, metabolism and accumulation in Agaricus bisporus fruits, casing soil and compost and dietary risk assessment. Chemosphere 2020, 254. [Google Scholar] [CrossRef]
- Fusetto, R.; White, J.M.; Hutton, C.A.; O'Hair, R.A. Structure of olefin-imidacloprid and gas-phase fragmentation chemistry of its protonated form. Org. Biomol. Chem. 2016, 14, 1715–1726. [Google Scholar] [CrossRef] [PubMed]
- Cengiz, M.; Certel, M.; Gocmen, H. Residue contents of DDVP (Dichlorvos) and diazinon applied on cucumbers grown in greenhouses and their reduction by duration of a pre-harvest interval and post-harvest culinary applications. Food Chem. 2006, 98, 127–135. [Google Scholar] [CrossRef]
- Mekonen, S.; Ambelu, A.; Spanoghe, P. Effect of Household Coffee Processing on Pesticide Residues as a Means of Ensuring Consumers' Safety. J. Agric. Food Chem. 2015, 63, 8568–8573. [Google Scholar] [CrossRef]
- Todey, S.A.; Fallon, A.M.; Arnold, W.A. Neonicotinoid insecticide hydrolysis and photolysis: Rates and residual toxicity. Environ. Toxicol. Chem. 2018, 37, 2797–2809. [Google Scholar] [CrossRef]
- Chen, R.; Yin, H.; Zhang, C.; Luo, X.; Liang, G. Hydrolysis of a neonicotinoid: a theoretical study on the reaction mechanism of dinotefuran. Struct. Chem. 2017, 29, 315–325. [Google Scholar] [CrossRef]
- Zapol’skii, V.A.; Fischer, R.; Namyslo, J.C.; Kaufmann, D.E. Chemistry of polyhalogenated nitrobutadienes, 8: Nitropolychlorobutadienes—Precursors for insecticidal neonicotinoids. Bioorg. Med. Chem. 2009, 17, 4206–4215. [Google Scholar] [CrossRef] [PubMed]
- Schaeffer, A.; Wijntjes, C. Changed degradation behavior of pesticides when present in mixtures. Eco-Environ. Health 2022, 1, 23–30. [Google Scholar] [CrossRef]
- Náfrádi, M.; Hlogyik, T.; Farkas, L.; Alapi, T. Comparison of the heterogeneous photocatalysis of imidacloprid and thiacloprid – reaction mechanism, ecotoxicity, and the effect of matrices. J. Environ. Chem. Eng. 2021, 9. [Google Scholar] [CrossRef]
- Botias, C.; David, A.; Horwood, J.; Abdul-Sada, A.; Nicholls, E.; Hill, E.; Goulson, D. Neonicotinoid Residues in Wildflowers, a Potential Route of Chronic Exposure for Bees. Environ. Sci. Technol. 2015, 49, 12731–12740. [Google Scholar] [CrossRef]
- Iwafune, T.; Ogino, T.; Watanabe, E. Water-based extraction and liquid chromatography-tandem mass spectrometry analysis of neonicotinoid insecticides and their metabolites in green pepper/tomato samples. J. Agric. Food Chem. 2014, 62, 2790–2796. [Google Scholar] [CrossRef]
- Mahai, G.; Wan, Y.; Xia, W.; Wang, A.; Shi, L.; Qian, X.; He, Z.; Xu, S. A nationwide study of occurrence and exposure assessment of neonicotinoid insecticides and their metabolites in drinking water of China. Water Res. 2021, 189, 116630. [Google Scholar] [CrossRef] [PubMed]


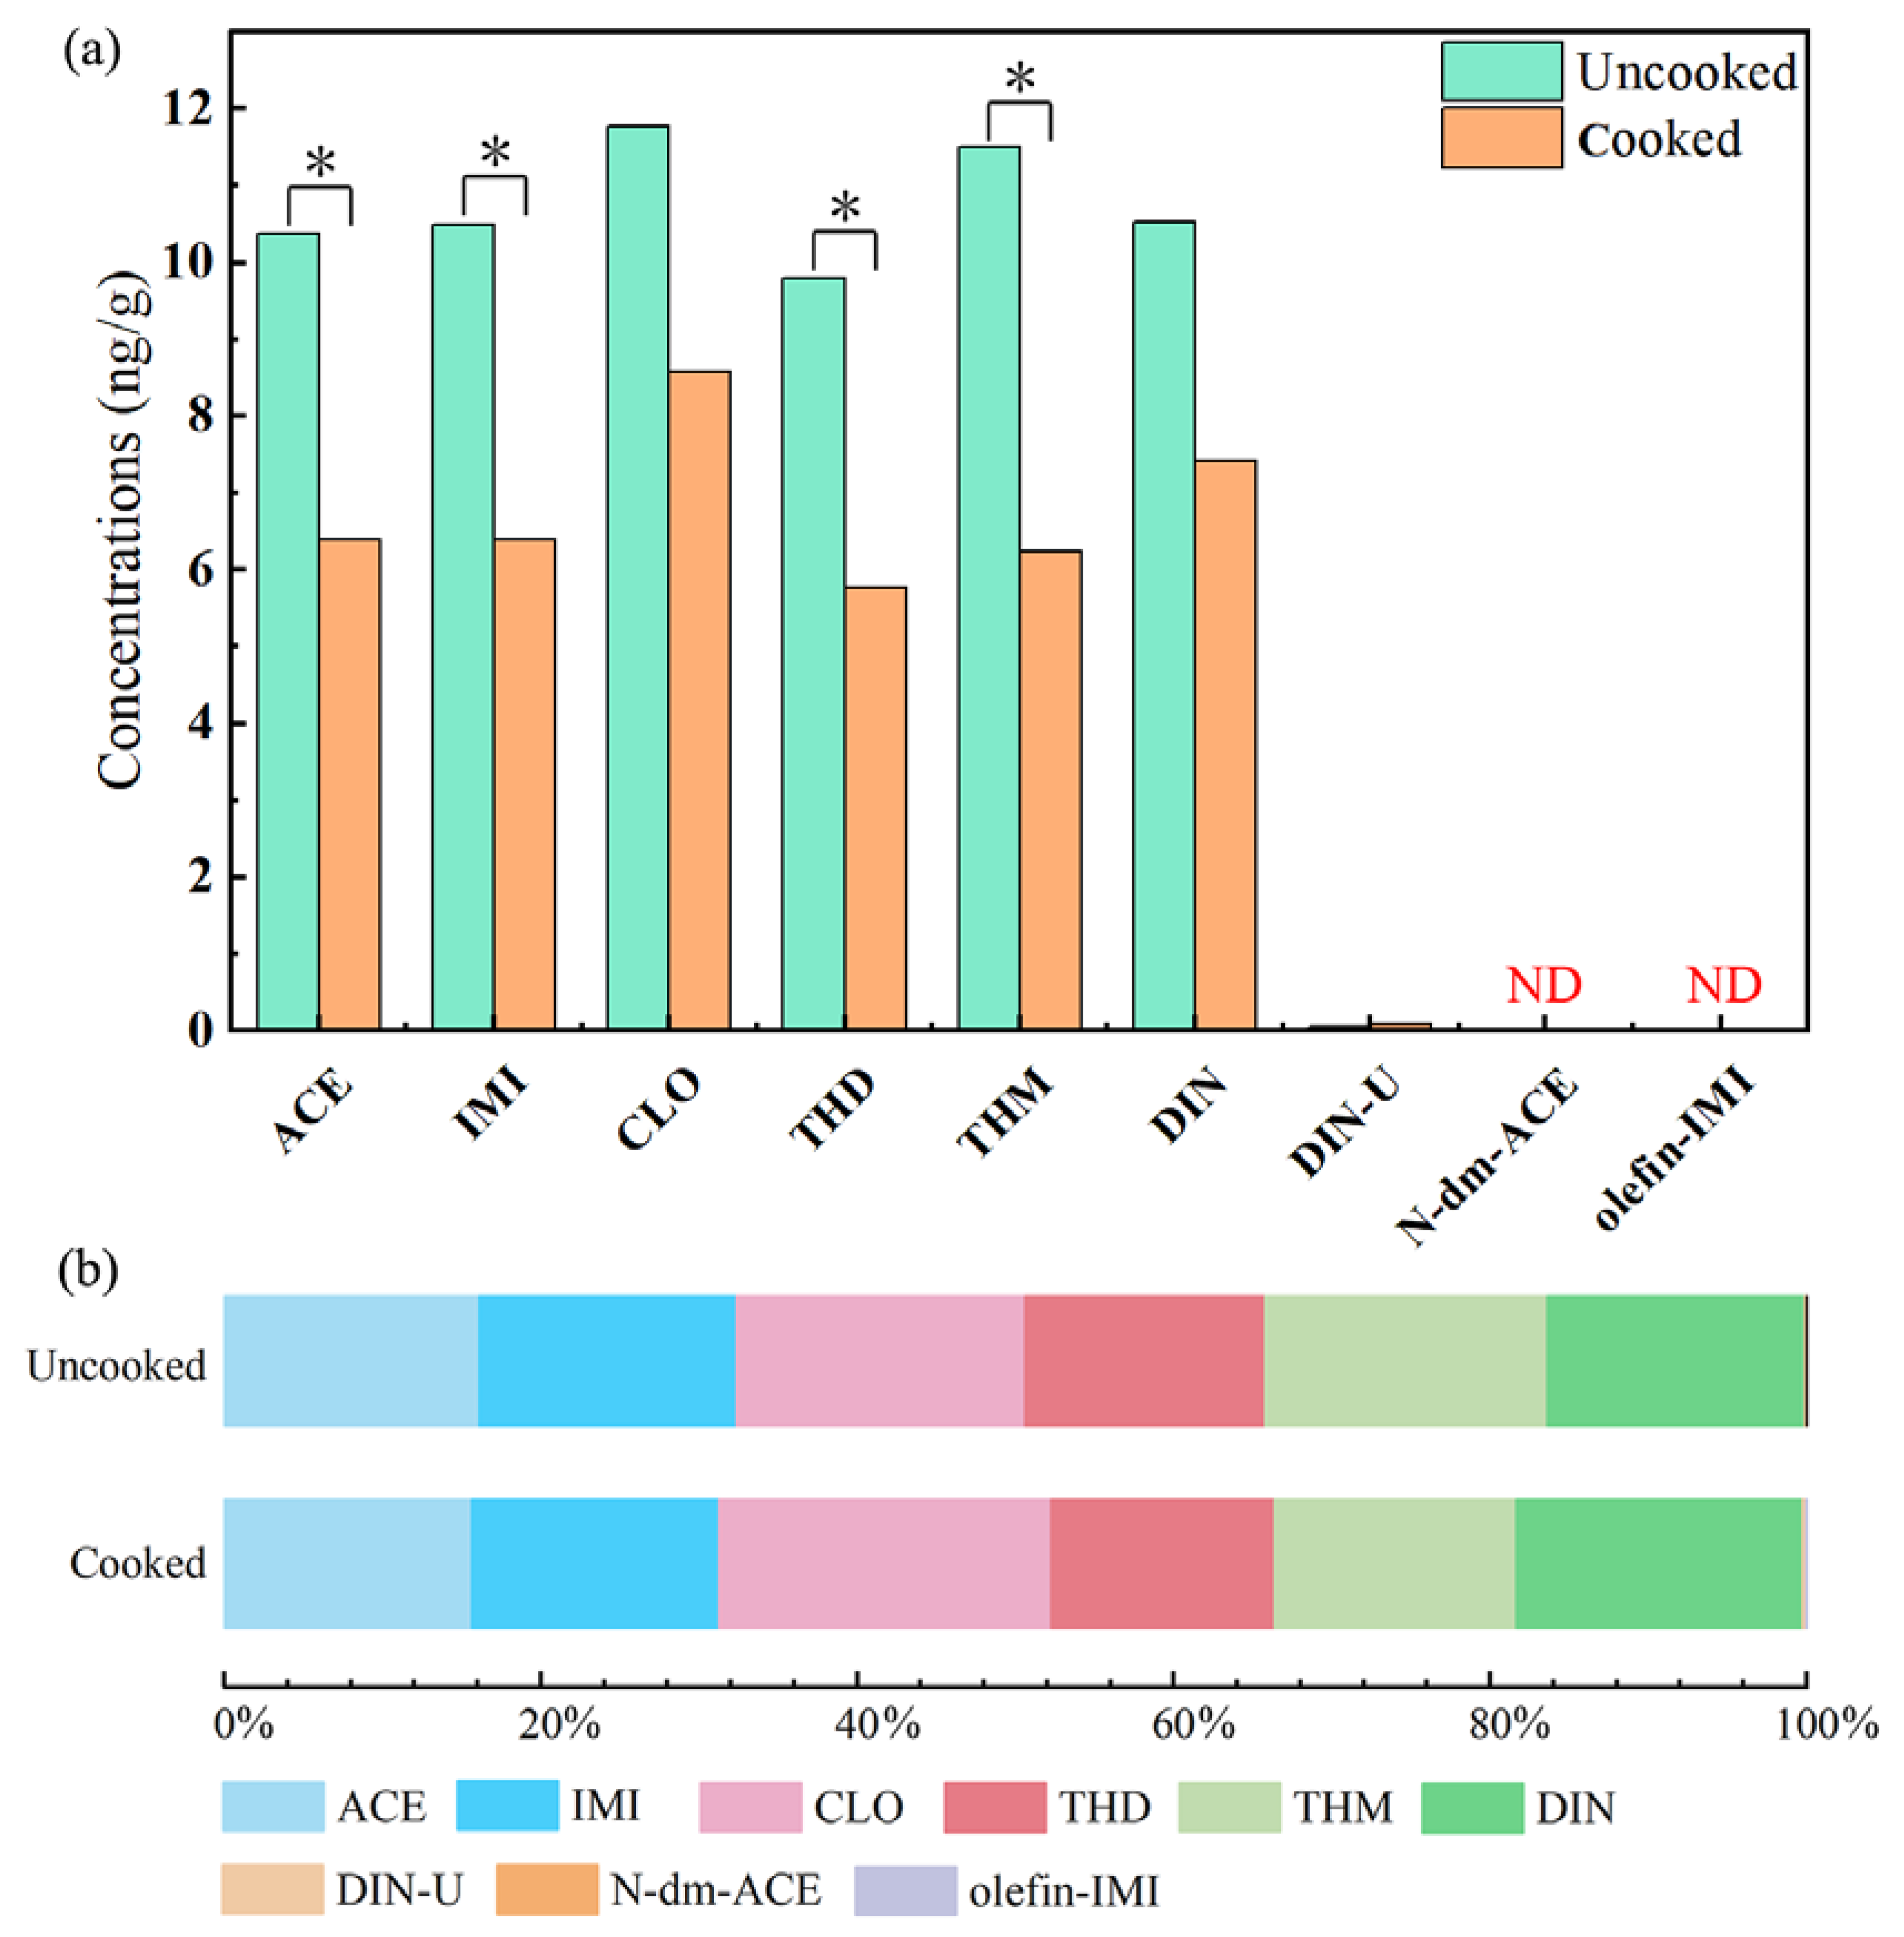
| p-NEOs | Σp-NEOs a | m-NEOs | Σm-NEOsb | ΣNEOs c | |||||||||
| ACE | IMI | CLO | THD | THM | DIN | DIN-U | N-dm-ACE | olefin-IMI | |||||
| LOQ | 0.001 | 0.01 | 0.01 | 0.003 | 0.01 | 0.01 | 0.01 | 0.01 | 0.01 | ||||
| Uncooked | DR (%) d | 91 | 80 | 71 | 71 | 89 | 69 | 97 | 54 | 46 | 46 | 74 | 97 |
| median | 10.4 | 10.5 | 11.8 | 9.79 | 11.5 | 10.5 | 66.8 | 0.06 | < LOQ | < LOQ | 0.51 | 71.4 | |
| mean | 12.3 | 13.8 | 16.8 | 11.8 | 14.2 | 13.5 | 82.3 | 0.40 | 8.33 | 10.33 | 19.1 | 101 | |
| GMe | 1.55 | 1.85 | 1.58 | 0.88 | 2.07 | 1.24 | 12.4 | 0.06 | 0.17 | 0.19 | 0.82 | 19.2 | |
| min | < LOQ | < LOQ | < LOQ | < LOQ | < LOQ | < LOQ | 0.02 | < LOQ | < LOQ | < LOQ | 0.02 | 0.04 | |
| max | 74.5 | 92.5 | 114 | 71.2 | 86.9 | 92.9 | 532 | 2.62 | 38.0 | 59.9 | 91.4 | 532 | |
| Cooked | DR (%) | 89 | 71 | 66 | 66 | 74 | 57 | 97 | 60 | 40 | 34 | 80 | 97 |
| median | 6.38 | 6.39 | 8.58 | 5.77 | 6.24 | 7.41 | 41.4 | 0.09 | < LOQ | < LOQ | 0.36 | 44.1 | |
| mean | 7.03 | 7.31 | 9.45 | 6.56 | 7.45 | 7.97 | 45.8 | 0.40 | 5.62 | 6.88 | 12.9 | 58.7 | |
| GM | 0.81 | 0.64 | 0.68 | 0.29 | 0.61 | 0.45 | 5.58 | 0.06 | 0.08 | 0.08 | 0.64 | 8.42 | |
| min | < LOQ | < LOQ | < LOQ | < LOQ | < LOQ | < LOQ | 0.02 | < LOQ | < LOQ | < LOQ | 0.02 | 0.04 | |
| max | 25.0 | 20.3 | 32.2 | 22.0 | 28.1 | 23.3 | 141 | 4.14 | 33.7 | 47.1 | 77.8 | 180 | |
Disclaimer/Publisher’s Note: The statements, opinions and data contained in all publications are solely those of the individual author(s) and contributor(s) and not of MDPI and/or the editor(s). MDPI and/or the editor(s) disclaim responsibility for any injury to people or property resulting from any ideas, methods, instructions or products referred to in the content. |
© 2023 by the authors. Licensee MDPI, Basel, Switzerland. This article is an open access article distributed under the terms and conditions of the Creative Commons Attribution (CC BY) license (http://creativecommons.org/licenses/by/4.0/).


