Submitted:
28 April 2023
Posted:
28 April 2023
You are already at the latest version
Abstract
Keywords:
1. Introduction
2. Materials and Methods
2.1. Cantharidin
2.2. Total antioxidant activity
2.3. Animals
2.4. Cantharidin hemagglutinating and haemolytic activities
2.5. Cytotoxic activity of cantharidin
2.6. Cantharidin bactericidal and bacteriostatic activity
2.7. Statistical analysis
3. Results
3.1. Total antioxidant activity
3.2. Hemagglutinating and haemolytic activity of cantharidin
3.3. Cytotoxic activity of cantharidin
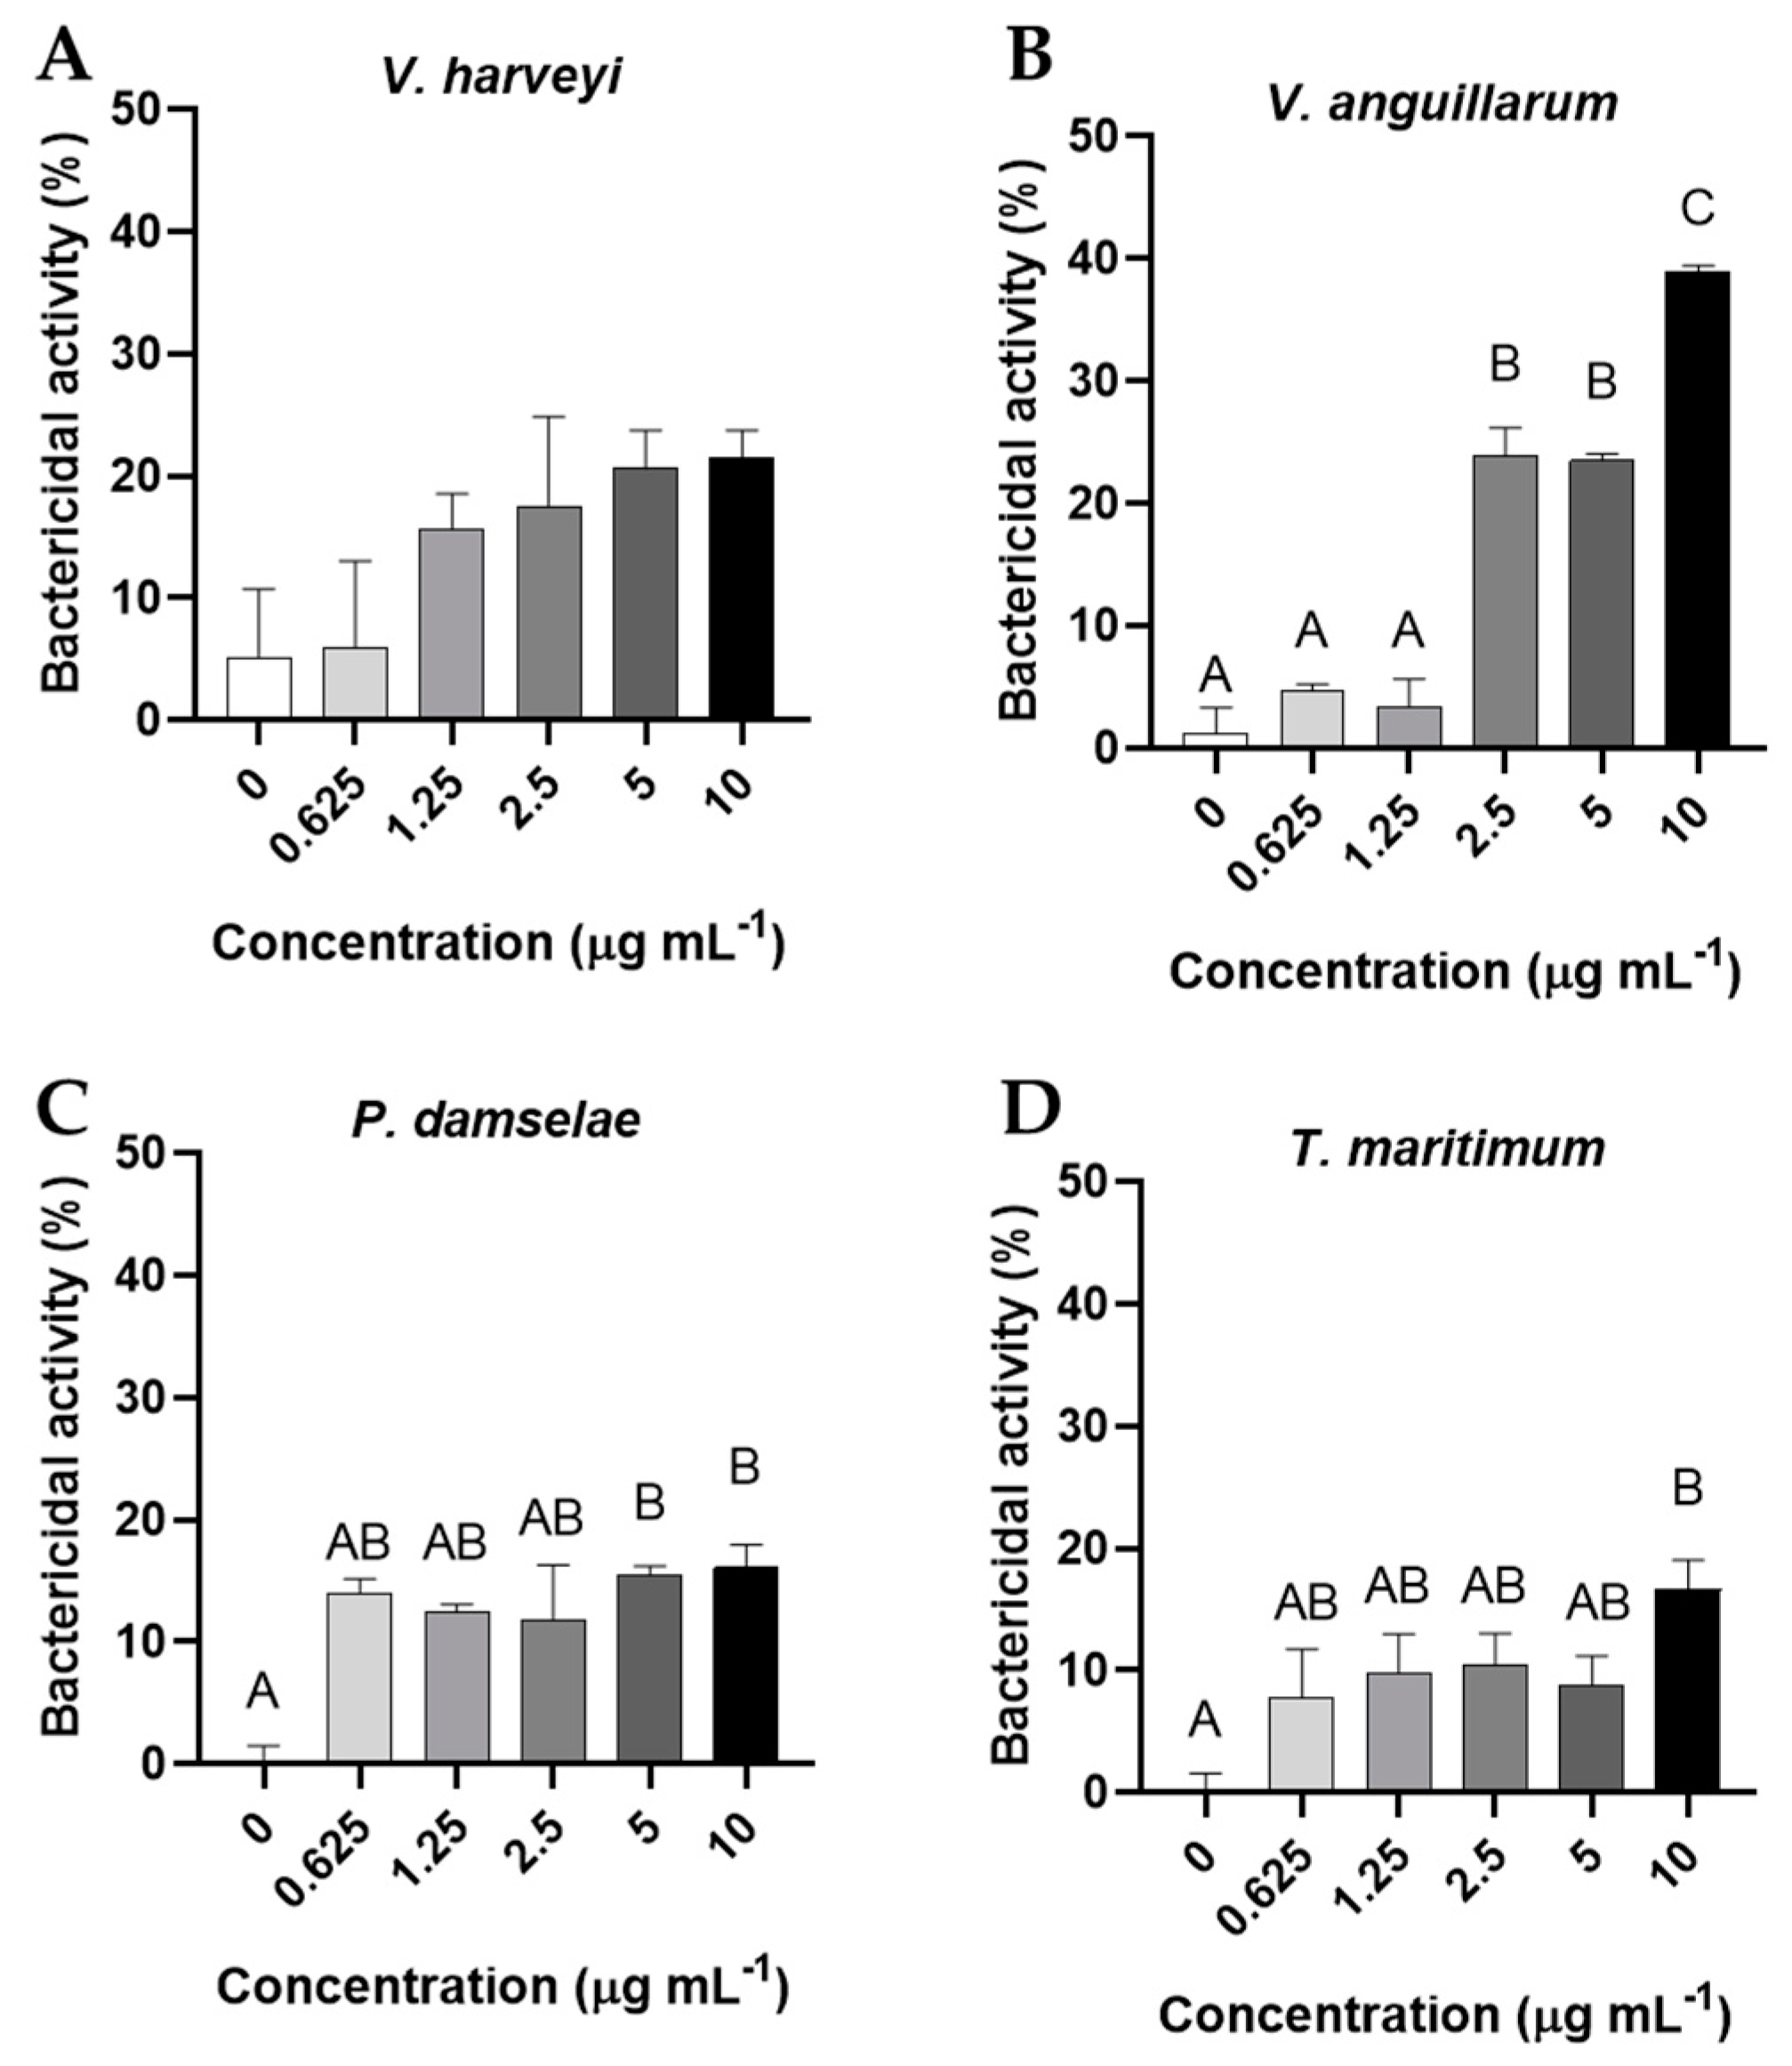
3.4. Bactericidal and bacteriostatic activity
4. Discussion
5. Conclusions
Supplementary Materials
Author Contributions
Funding
Institutional Review Board Statement
Informed Consent Statement
Data Availability Statement
Conflicts of Interest
References
- FAO, FAO Aquaculture Newsletter, 61 (2020).
- Salinas, I.; Díaz-Rosales, P.; Cuesta, A.; Meseguer, J.; Chabrillón, M.; Moriñigo, M. .; Esteban, M.. Effect of heat-inactivated fish and non-fish derived probiotics on the innate immune parameters of a teleost fish (Sparus aurata L.). Veter- Immunol. Immunopathol. 2006, 111, 279–286. [Google Scholar] [CrossRef] [PubMed]
- Imsland, A.K.; Foss, A.; Dinis, M.T.; Delbare, D.; Schram, E.; Kamstra, A.; Rema, P.; White, P.; Conceição, L.E.C. A review of the culture potential of Solea solea and S. senegalensis. Rev. Fish Biol. Fish. 2003, 13, 379–408. [Google Scholar] [CrossRef]
- Mohanty, B.; Sahoo, P. Immune responses and expression profiles of some immune-related genes in Indian major carp, Labeo rohita to Edwardsiella tarda infection. Fish Shellfish. Immunol. 2010, 28, 613–621. [Google Scholar] [CrossRef] [PubMed]
- Girón-Pérez, M.I.; Santerre, A.; Gonzalez-Jaime, F.; Casas-Solis, J.; Hernández-Coronado, M.; Peregrina-Sandoval, J.; Takemura, A.; Zaitseva, G. Immunotoxicity and hepatic function evaluation in Nile tilapia (Oreochromis niloticus) exposed to diazinon. Fish Shellfish. Immunol. 2007, 23, 760–769. [Google Scholar] [CrossRef] [PubMed]
- Pineiro, M.; Stanton, C. Probiotic Bacteria: Legislative Framework—Requirements to Evidence Basis1, J. Nutr. 2007, 137, 850S–853S. [Google Scholar] [CrossRef] [PubMed]
- Guardiola, F.; Bahi, A.; Jiménez-Monreal, A.; Martínez-Tomé, M.; Murcia, M.; Esteban, M. Dietary administration effects of fenugreek seeds on skin mucosal antioxidant and immunity status of gilthead seabream (Sparus aurata L.). Fish Shellfish. Immunol. 2018, 75, 357–364. [Google Scholar] [CrossRef] [PubMed]
- Beltrán, J.M.G.; Espinosa, C.; Guardiola, F.A.; Esteban, M. . In vitro effects of Origanum vulgare leaf extracts on gilthead seabream (Sparus aurata L.) leucocytes, cytotoxic, bactericidal and antioxidant activities. Fish Shellfish. Immunol. 2018, 79, 1–10. [Google Scholar] [CrossRef]
- Messina, C.M.; Panettieri, V.; Arena, R.; Renda, G.; Ruiz, C.E.; Morghese, M.; Piccolo, G.; Santulli, A.; Bovera, F. The Inclusion of a Supercritical Fluid Extract, Obtained From Honey Bee Pollen, in the Diet of Gilthead Sea Bream (Sparus aurata), Improves Fish Immune Response by Enhancing Anti-oxidant, and Anti-bacterial Activities. Front. Veter- Sci. 2020, 7, 95. [Google Scholar] [CrossRef]
- Cámara-Ruiz, M.; Balebona, M.C.; Moriñigo, M. .; Esteban, M.. Probiotic Shewanella putrefaciens (SpPdp11) as a Fish Health Modulator: A Review. Microorganisms 2020, 8, 1990. [Google Scholar] [CrossRef]
- Sánchez-Barbudo, I.S.; Camarero, P.R.; García-Montijano, M.; Mateo, R. Possible cantharidin poisoning of a great bustard (Otis tarda). Toxicon 2012, 59, 100–103. [Google Scholar] [CrossRef]
- Ghaffarifar, F. Leishmania major: In vitro and in vivo anti-leishmanial effect of cantharidin. Exp. Parasitol. 2010, 126, 126–129. [Google Scholar] [CrossRef]
- Whitman, D.W.; Andrés, M.F.; Martínez-Díaz, R.A.; Ibáñez-Escribano, A.; Olmeda, A.S.; González-Coloma, A. Antiparasitic Properties of Cantharidin and the Blister Beetle Berberomeloe majalis (Coleoptera: Meloidae). Toxins 2019, 11, 234. [Google Scholar] [CrossRef]
- Honkanen, R.E. Cantharidin, another natural toxin that inhibits the activity of serine/threonine protein phosphatases types 1 and 2A. FEBS Lett. 1993, 330, 283–286. [Google Scholar] [CrossRef] [PubMed]
- Wisniak, J. Pierre-Jean Robiquet. Educ. Quim 2013, 24, 139–149. [Google Scholar] [CrossRef]
- Moed, L.; Shwayder, T.A.; Chang, M.W. Cantharidin Revisited. Arch. Dermatol. 2001, 137, 1357–1360. [Google Scholar] [CrossRef] [PubMed]
- Karras, D.J.; E Farrell, S.; A Harrigan, R.; Henretig, F.M.; Gealt, L. Poisoning from “Spanish fly” (cantharidin). Am. J. Emerg. Med. 1996, 14, 478–483. [Google Scholar] [CrossRef] [PubMed]
- Swingle, M.; Ni, L.; Honkanen, R.E. Small-molecule inhibitors of ser/thr protein phosphatases: Specificity, use and common forms of abuse. Methods Mol. Biol. 2007, 365, 23–38. [Google Scholar] [CrossRef] [PubMed]
- Hsiao, Y.-P.; Tsai, C.-H.; Wu, P.-P.; Hsu, S.-C.; Liu, H.-C.; Huang, Y.-P.; Yang, J.-H.; Chung, J.-G. Cantharidin induces G2/M phase arrest by inhibition of Cdc25c and Cyclin A and triggers apoptosis through reactive oxygen species and the mitochondria-dependent pathways of A375.S2 human melanoma cells. Int. J. Oncol. 2014, 45, 2393–2402. [Google Scholar] [CrossRef] [PubMed]
- Huang, W.-W.; Ko, S.-W.; Tsai, H.-Y.; Chung, J.-G.; Chiang, J.-H.; Chen, K.-T.; Chen, Y.-C.; Chen, H.-Y.; Chen, Y.-F.; et al. Cantharidin induces G2/M phase arrest and apoptosis in human colorectal cancer colo 205 cells through inhibition of CDK1 activity and caspase-dependent signaling pathways. Int. J. Oncol. 2011, 38, 1067–1073. [Google Scholar] [CrossRef]
- Hsia, T.-C.; Yu, C.-C.; Hsu, S.-C.; Tang, N.-Y.; Lu, H.-F.; Huang, Y.-P.; Wu, S.-H.; Lin, J.-G.; Chung, J.-G. Cantharidin induces apoptosis of H460 human lung cancer cells through mitochondria-dependent pathways. Int. J. Oncol. 2014, 45, 245–254. [Google Scholar] [CrossRef]
- Nazim, U.; Yin, H.; Park, S. Downregulation of c-FLIP and upregulation of DR-5 by cantharidin sensitizes TRAIL-mediated apoptosis in prostate cancer cells via autophagy flux. Int. J. Mol. Med. 2020, 46, 280–288. [Google Scholar] [CrossRef] [PubMed]
- Chung; Kuo, J. -H.; Chu, Y.-L.; Yang, J.-S.; Lin, J.-P.; Lai, K.-C.; Kuo, H.-M.; Hsia, T.-C.; Chung, J.-G. Cantharidin induces apoptosis in human bladder cancer TSGH 8301 cells through mitochondria-dependent signal pathways. Int. J. Oncol. 2010, 37, 1243–1250. [Google Scholar] [CrossRef]
- Sun, Y.; Zhang, D.; Mao, M.; Lu, Y.; Jiao, N. Roles of p38 and JNK protein kinase pathways activated by compound cantharidin capsules containing serum on proliferation inhibition and apoptosis of human gastric cancer cell line. Exp. Ther. Med. 2017, 14, 1809–1817. [Google Scholar] [CrossRef] [PubMed]
- Yi, S.; Wass, J.; Vincent, P.; Iland, H. Inhibitory effect of norcantharidin on K562 human myeloid leukemia cells in vitro. Leuk. Res. 1991, 15, 883–886. [Google Scholar] [CrossRef]
- Huan, S.K.-H.; Lee, H.-H.; Liu, D.-Z.; Wu, C.-C.; Wang, C.-C. Cantharidin-induced cytotoxicity and cyclooxygenase 2 expression in human bladder carcinoma cell line. Toxicology 2006, 223, 136–143. [Google Scholar] [CrossRef]
- Li, W.; Xie, L.; Chen, Z.; Zhu, Y.; Sun, Y.; Miao, Y.; Xu, Z.; Han, X. Cantharidin, a potent and selective PP2A inhibitor, induces an oxidative stress-independent growth inhibition of pancreatic cancer cells through G2/M cell-cycle arrest and apoptosis. Cancer Sci. 2010, 101, 1226–1233. [Google Scholar] [CrossRef]
- Yeh, C.-B.; Su, C.-J.; Hwang, J.-M.; Chou, M.-C. Therapeutic effects of cantharidin analogues without bridging ether oxygen on human hepatocellular carcinoma cells. Eur. J. Med. Chem. 2010, 45, 3981–3985. [Google Scholar] [CrossRef]
- Bravo, C.; Bautista, L.M.; García-París, M.; Blanco, G.; Alonso, J.C. Males of a Strongly Polygynous Species Consume More Poisonous Food than Females. PLOS ONE 2014, 9, e111057. [Google Scholar] [CrossRef]
- Shao, H.; Zhang, Y. Non-target effects on soil microbial parameters of the synthetic pesticide carbendazim with the biopesticides cantharidin and norcantharidin. Sci. Rep. 2017, 7, 5521–5521. [Google Scholar] [CrossRef]
- Day, R.M.; Harbord, M.; Forbes, A.; Segal, A.W. Cantharidin blisters: a technique for investigating leukocyte trafficking and cytokine production at sites of inflammation in humans. J. Immunol. Methods 2001, 257, 213–220. [Google Scholar] [CrossRef]
- Dinh, P.H.D.; Corraza, F.; Mestdagh, K.; Kassengera, Z.; Doyen, V.; Michel, O. Validation of the cantharidin-induced skin blister as anin vivomodel of inflammation. Br. J. Clin. Pharmacol. 2011, 72, 912–920. [Google Scholar] [CrossRef]
- Maini, A.A.; George, M.J.; Motwani, M.P.; Day, R.M.; Gilroy, D.W.; O’brien, A.J. A Comparison of Human Neutrophils Acquired from Four Experimental Models of Inflammation. PLOS ONE 2016, 11, e0165502. [Google Scholar] [CrossRef] [PubMed]
- Chen, X.; Liu, J.; Zhang, Y. Cantharidin impedes the activity of protein serine/threonine phosphatase in Plutella xylostella. Mol. Biosyst. 2013, 10, 240–250. [Google Scholar] [CrossRef]
- Máthé, C.; Garda, T.; Freytag, C.; M-Hamvas, M. The Role of Serine-Threonine Protein Phosphatase PP2A in Plant Oxidative Stress Signaling—Facts and Hypotheses. Int. J. Mol. Sci. 2019, 20, 3028. [Google Scholar] [CrossRef] [PubMed]
- Vanlerberghe, G.C.; Robson, C.A.; Yip, J.Y. Induction of Mitochondrial Alternative Oxidase in Response to a Cell Signal Pathway Down-Regulating the Cytochrome Pathway Prevents Programmed Cell Death. Plant Physiol. 2002, 129, 1829–1842. [Google Scholar] [CrossRef] [PubMed]
- Campos-Sánchez, J.C.; Guardiola, F.A.; Esteban, M. . In vitro effects of cantharidin on gilthead seabream (Sparus aurata) head-kidney leucocytes. Fish Shellfish. Immunol. 2022, 123, 20–35. [Google Scholar] [CrossRef]
- Arnao, M.B.; Cano, A.; Acosta, M. Methods to Measure the Antioxidant Activity in Plant Material. A Comparative Discussion. Free. Radic. Res. 1999, 31, 89–96. [Google Scholar] [CrossRef]
- Morcillo, P.; Romero, D.; Meseguer, J.; Esteban, M. .; Cuesta, A. Cytotoxicity and alterations at transcriptional level caused by metals on fish erythrocytes in vitro. Environ. Sci. Pollut. Res. 2016, 23, 12312–12322. [Google Scholar] [CrossRef]
- Li, Y.; Liu, Q.; Wang, H.; Ng, T. A novel lectin with potent antitumor, mitogenic and HIV-1 reverse transcriptase inhibitory activities from the edible mushroom Pleurotus citrinopileatus. Biochim. et Biophys. Acta (BBA) - Gen. Subj. 2008, 1780, 51–57. [Google Scholar] [CrossRef]
- Stevens, M.G.; Kehrli, M.E.; Canning, P.C. A colorimetric assay for quantitating bovine neutrophil bactericidal activity. Veter- Immunol. Immunopathol. 1991, 28, 45–56. [Google Scholar] [CrossRef]
- Sunyer, J.O.; Tort, L. Natural hemolytic and bactericidal activities of sea bream Sparus aurata serum are effected by the alternative complement pathway. Veter- Immunol. Immunopathol. 1995, 45, 333–345. [Google Scholar] [CrossRef] [PubMed]
- Bauer, A.W. , Kirby, W.M., Sherris, J.C., Turck, M. Antibiotic susceptibility testing by a standardized single disk method. Am. J. Clin. Pathol. 1966, 45, 493–496. [Google Scholar] [CrossRef] [PubMed]
- CLSI, Clinical and laboratory standards institute 2018: performance standards for antimicrobial susceptibility testing. 28th edition, CLSI Supplement M100. Clinical and Laboratory Standard Institute, Wayne, PA, 2018, n.d.
- M. Gronquist, F.C. M. Gronquist, F.C. Schroeder, Insect natural products, Compr. Nat. Prod. II Chem. Biol. 2 (2010) 67–108. [CrossRef]
- McCormick, J.P.; Carrel, J.E.; Doom, J.P. Origin of oxygen atoms in cantharidin biosynthesized by beetles. J. Am. Chem. Soc. 1986, 108, 8071–8074. [Google Scholar] [CrossRef]
- Matsuzawa, M.; Graziano, M.J.; Casida, J.E. Endothal and cantharidin analogs: relation of structure to herbicidal activity and mammalian toxicity. J. Agric. Food Chem. 1987, 35, 823–829. [Google Scholar] [CrossRef]
- P. Cohen, The structure and regulation of protein phosphatases, Annu. Rev. Biochem. 58 (1989) 453–508.
- Li, H.-C.; Xia, Z.-H.; Chen, Y.-F.; Yang, F.; Feng, W.; Cai, H.; Mei, Y.; Jiang, Y.-M.; Xu, K.; Feng, D.-X. Cantharidin Inhibits the Growth of Triple-Negative Breast Cancer Cells by Suppressing Autophagy and Inducing Apoptosis in Vitro and in Vivo. Cell. Physiol. Biochem. 2017, 43, 1829–1840. [Google Scholar] [CrossRef]
- Massicot, F.; Dutertre-Catella, H.; Pham-Huy, C.; Liu, X.-H.; Duc, H.T.; Warnet, J.-M. In vitro Assessment of Renal Toxicity and Inflammatory Events of Two Protein Phosphatase Inhibitors Cantharidin and Nor-Cantharidin*. Basic Clin. Pharmacol. Toxicol. 2005, 96, 26–32. [Google Scholar] [CrossRef]
- van Zyl, R.L.; Seatlholo, S.T.; van Vuuren, S.F.; Viljoen, A.M. The Biological Activities of 20 Nature Identical Essential Oil Constituents. J. Essent. Oil Res. 2006, 18, 129–133. [Google Scholar] [CrossRef]
- Paduch, R.; Kandefer-Szerszeń, M.; Trytek, M.; Fiedurek, J. Terpenes: substances useful in human healthcare. Arch. Immunol. et Ther. Exp. 2007, 55, 315–327. [Google Scholar] [CrossRef]
- Kozłowska, M.; Laudy, A.E.; Przybył, J.; Ziarno, M.; Majewska, E. CHEMICAL COMPOSITION AND ANTIBACTERIAL ACTIVITY OF SOME MEDICINAL PLANTS FROM LAMIACEAE FAMILY. Acta Pol. Pharm. -Drug Res. 2015, 72, 757–767. [Google Scholar]
- Yanishlieva, N.V.; Marinova, E.M.; Gordon, M.H.; Raneva, V.G. Antioxidant activity and mechanism of action of thymol and carvacrol in two lipid systems. Food Chem. 1999, 64, 59–66. [Google Scholar] [CrossRef]
- Ruberto, G.; Baratta, M.T. Antioxidant activity of selected essential oil components in two lipid model systems. Food Chem. 2000, 69, 167–174. [Google Scholar] [CrossRef]
- Knapp, J.; Boknı́k, P.; Huke, S.; Gombosová, I.; Linck, B.; Lüss, H.; Müller, F.U.; Müller, T.; Nacke, P.; Schmitz, W.; et al. Contractility and Inhibition of Protein Phosphatases by Cantharidin. Gen. Pharmacol. Vasc. Syst. 1998, 31, 729–733. [Google Scholar] [CrossRef] [PubMed]
- Sahu, P.K.; Tomar, R.S. The natural anticancer agent cantharidin alters GPI-anchored protein sorting by targeting Cdc1-mediated remodeling in endoplasmic reticulum. J. Biol. Chem. 2019, 294, 3837–3852. [Google Scholar] [CrossRef] [PubMed]
- Patzlaff, J.S.; Terrenoire, E.; Turner, B.M.; Earnshaw, W.C.; Paulson, J.R. Acetylation of core histones in response to HDAC inhibitors is diminished in mitotic HeLa cells. Exp. Cell Res. 2010, 316, 2123–2135. [Google Scholar] [CrossRef] [PubMed]
- Alzoubi, K.; Egler, J.; Briglia, M.; Fazio, A.; Faggio, C.; Lang, F. Induction of Suicidal Erythrocyte Death by Cantharidin. Toxins 2015, 7, 2822–2834. [Google Scholar] [CrossRef]
- Dreischer, P.; Duszenko, M.; Stein, J.; Wieder, T. Eryptosis: Programmed Death of Nucleus-Free, Iron-Filled Blood Cells. Cells 2022, 11, 503. [Google Scholar] [CrossRef]
- Howell, M.; Dumitrescu, D.G.; Blankenship, L.R.; Herkert, D.; Hatzios, S.K. Functional characterization of a subtilisin-like serine protease from Vibrio cholerae. J. Biol. Chem. 2019, 294, 9888–9900. [Google Scholar] [CrossRef]
- Patel, S. A critical review on serine protease: Key immune manipulator and pathology mediator. Allergol. et Immunopathol. 2017, 45, 579–591. [Google Scholar] [CrossRef]
- Kulkarni, N.; Shendye, A.; Rao, M. Molecular and biotechnological aspects of xylanases. FEMS Microbiol. Rev. 1999, 23, 411–456. [Google Scholar] [CrossRef]
- Zhang, W.-W.; Sun, K.; Cheng, S.; Sun, L. Characterization of DegQ Vh, a Serine Protease and a Protective Immunogen from a Pathogenic Vibrio harveyi Strain. Appl. Environ. Microbiol. 2008, 74, 6254–6262. [Google Scholar] [CrossRef]
- Lissina, E.; Weiss, D.; Young, B.; Rella, A.; Cheung-Ong, K.; Del Poeta, M.; Clarke, S.G.; Giaever, G.; Nislow, C. A Novel Small Molecule Methyltransferase Is Important for Virulence in Candida albicans. ACS Chem. Biol. 2013, 8, 2785–2793. [Google Scholar] [CrossRef] [PubMed]
Disclaimer/Publisher’s Note: The statements, opinions and data contained in all publications are solely those of the individual author(s) and contributor(s) and not of MDPI and/or the editor(s). MDPI and/or the editor(s) disclaim responsibility for any injury to people or property resulting from any ideas, methods, instructions or products referred to in the content. |
© 2023 by the authors. Licensee MDPI, Basel, Switzerland. This article is an open access article distributed under the terms and conditions of the Creative Commons Attribution (CC BY) license (http://creativecommons.org/licenses/by/4.0/).


