Allgemein
The fatigue life of springs has been investigated for many years, but has not yet been fully evaluated. A good understanding of fatigue processes is particularly important in those industries where potential failure can become a threat to people as a consequence. This applies to the aerospace, energy and automotive industries, among others. One of the unsolved problems is the reduction of the complex stress state to its uniaxial equivalent. For this purpose, different types of strength hypotheses have been proposed, leading to correlations for the comparative curve expressed in stress or strain. As a result, the amplitudes of the stresses or strains are obtained. On this basis, the fatigue life is evaluated. The dominant stresses in leaf and disc springs are the normal stresses. For shear compression or helical tension springs, the shear stresses should be used instead of the normal stresses. Fatigue characteristics are determined by analyzing all damage parameters and the corresponding fatigue properties. The equivalent stress hypotheses have the greatest potential [
1]. For a loading with the fully occupied stress tensor, the application of the equivalent scalar stress magnitudes is suitable. It was found that the damage in the general, multi-axial stress is defined either by the equivalent scalar stress or by a scalar energy parameter [
2,
3]. The equivalent scalar stress for isotopic materials is a function of the invariants of the stress tensor. The definition of equivalent stress close to MISES is used very often. This definition is based on the determination of the deformation energy in a given material, i.e. the energy associated with shape changes in this material, as opposed to the energy associated with volume changes in the same material. According to this criterion, a given material is safe as long as the maximum value of deformation energy per unit volume in that material is less than the deformation energy per unit volume required to cause yielding in a tensile test of the same material.
Based on the same equivalent stress, higher fatigue strengths typically result for springs subjected to normal stress than for springs subjected to shear stress made of the same material. For this reason, numerous alternative equivalent stress criteria have been developed. The multiaxial fatigue criteria, can be divided into stress criteria, strain criteria and energy criteria (stress-strain) depending on the physical nature of the failure parameter. These criteria are intended for a large number of cycles to failure. In this case, the plastic deformations assume very small values, which can be neglected in the calculation. Alternatively, for large plastic deformations, strain criteria have been proposed that reduce the complex strain state to the uniaxial equivalent. In the following, the stress is referred to as a appropriate equivalent stress.
Fatigue strength diagrams
Fatigue strength is the stress amplitude or stress range at which a component can withstand an infinite number of load cycles. The fatigue strength
denotes the stress amplitude that can be sustained under alternating stress. On the Wöhler line, this range is marked by the horizontal curve to the right of the inflection point. As soon as a component is subjected to higher stresses than the fatigue strength, the fatigue check is referred to as fatigue strength [
4].
The analysis of the fatigue strength diagram is based on the static strength parameters and on the fatigue strength . The static strength parameters include tensile strength and yield strength . The Wöhler line of the spring elements depends on different parameters of the following influencing factors:
Spring material incl. thermal treatment
Notch effect, corrosion, roughness
Stress (normal or shear stress, mixed stress)
Load spectrum
component size
operating temperature
Residual stress (shot peening, roller burnishing, laser peening, tapping)
mean stress
Stress gradient
Experience states that the fatigue strength is proportional to the tensile strength of the material. The higher the tensile strength, the higher the fatigue strength. Other influences of the material condition on the fatigue strength arise from ductility, grain size, heat treatment, presence of the flaws and inclusions in the material.
The notch effect on the surface of the spring has a determining influence on the fatigue strength. Surface defects such as blowholes, hard inclusions, corrosion cavities, hairline cracks, decarburization or grooves act like notches. The sharper the notch, the lower the fatigue strength of the component with respect to the nominal stresses.
In load spectra where individual load levels result in stresses above the fatigue strength, the fatigue strength is reduced. Thus, previously uncritical load levels can contribute to damage accumulation. This effect is accounted for by Wöhler lines, which do not run horizontally behind the buckling point but slope down to different degrees. Experimental investigations show that the fatigue strength decreases strongly with progressive corrosion of the component. In fatigue-stressed components, corrosion is responsible for the development of incipient cracks as well as for supporting crack growth. The roughness profile on the component surface generated by the manufacturing process acts as a notch in conjunction with the microstructure on the surface. In the literature, the correlation of fatigue strength with the other material properties, such as ductility and strength, is done. The influence of roughness on the reduction of fatigue strength with increasing brittleness (and indirectly with increasing strength) increases according to VDI 2226 [
5].
The influence of the component size is caused by different mechanisms:
technological influences (edge layer thickness, edge strength, surface hardening); Size of the highly stressed volume or surface of a spring. Depending on how far the stressed area extends over the volume of the spring, there may be an increased influence of statistically distributed flaws and inclusions.
The higher the stress gradient, the higher the supporting effect of the surrounding material. A higher support effect positively influences the fatigue behavior. Support effect does not play a special role for the springs, since the spatial gradients of stresses are low and stress distributions of similar springs are identical.
With geometrically similar springs and equally high stress maxima, the smaller spring has a higher stress gradient and thus more favorable fatigue behavior.
At low temperature, the fatigue strength of most materials increases in accordance with the static strength. However, notch sensitivity and the tendency to brittle fracture increase. Accordingly, an increase in temperature generally results in a decrease in fatigue strength. Depending on the material, however, there are some special features here. Residual stresses occur in the springs as a result of almost any treatment in the manufacturing process. These can assume values up to the yield point. The effects on the fatigue strength depend on the value of the residual stresses. Compressive residual stresses have a positive effect on the fatigue strength, while tensile residual stresses significantly reduce the fatigue strength depending on the amount. This is caused by the influence of the residual stresses on the magnitude of the mean stresses.
Influence of mean stress on fatigue strength
The dependence of the fatigue strength on the mean stress or the stress ratio can be represented in fatigue strength diagrams. Usually, the fatigue strength diagrams according to SMITH and HAIGH are used. In the SMITH diagram, the tolerable upper stresses
and lower stresses
can be read as a function of the mean stress (
). The mean stress is the average value of the upper stress (
) and the lower stress (
u) of the oscillating stress:
The stress ratio is the ratio of lower stress to upper stress in cycle:
The tensile strength is plotted as an upper stress on the ordinate axis and as a mean stress on the abscissa axis. The resulting point lies with the coordinate origin on a 45° line. From this point, the GOODMAN straight line for the top stress is generated in the simplified SMITH diagram by connecting it to the alternating stress on the ordinate. The same procedure is followed for the GOODMAN straight line for the lower stress. The fatigue strength range resulting between the GOODMAN straight lines is bounded at the top by the yield strength. Due to the symmetry between the upper stress and the lower stress, the fatigue strength range below the 45° line is adjusted accordingly. From the SMITH diagram, it is possible to read off the upper and lower stresses that can be sustained and the stress amplitudes as a function of the mean stress .
In the HAIGH diagram, the steady-state voltage amplitude over the mean voltage can be read directly. Furthermore, the stress ratios can be assigned to the pairs of values from stress amplitude and mean stress by means of origin lines. Similar to the Smith diagram, the Goodman straight line is drawn as a simplification, starting from the alternating strength on the ordinate. In the HAIGH diagram, however, this point is connected to the point of tensile strength on the mean stress axis (abscissa). Below the Goodman line, the fatigue range is obtained, which is bounded on the right by a straight line passing between the yield strengths on the amplitude axis and on the mean stress axis. In the compression range, the Goodman straight line is extended to the yield point or conservatively replaced by a horizontal line at the level of the alternating strength (). The fatigue strength range is also limited here by a straight line between the yield strengths (or, in the compression range, the crush limit).
Mean stress sensitivity
The mean stress sensitivity can be determined from the slope of the GOODMAN straight line in the HAIGH diagram. The mean stress sensitivity according to SCHÜTZ [
6] corresponds to the tangent of the angle between the horizontal and the GOODMAN straight line:
n general, alloys with increasing tensile strength exhibit higher sensitivity with respect to mean stress. Another correlation is found in the ductility of the materials. Brittle alloys tend to exhibit higher medium stress sensitivity. In a strength verification according to FKM [
7], a stress condition consisting of mean stress
and amplitude stress
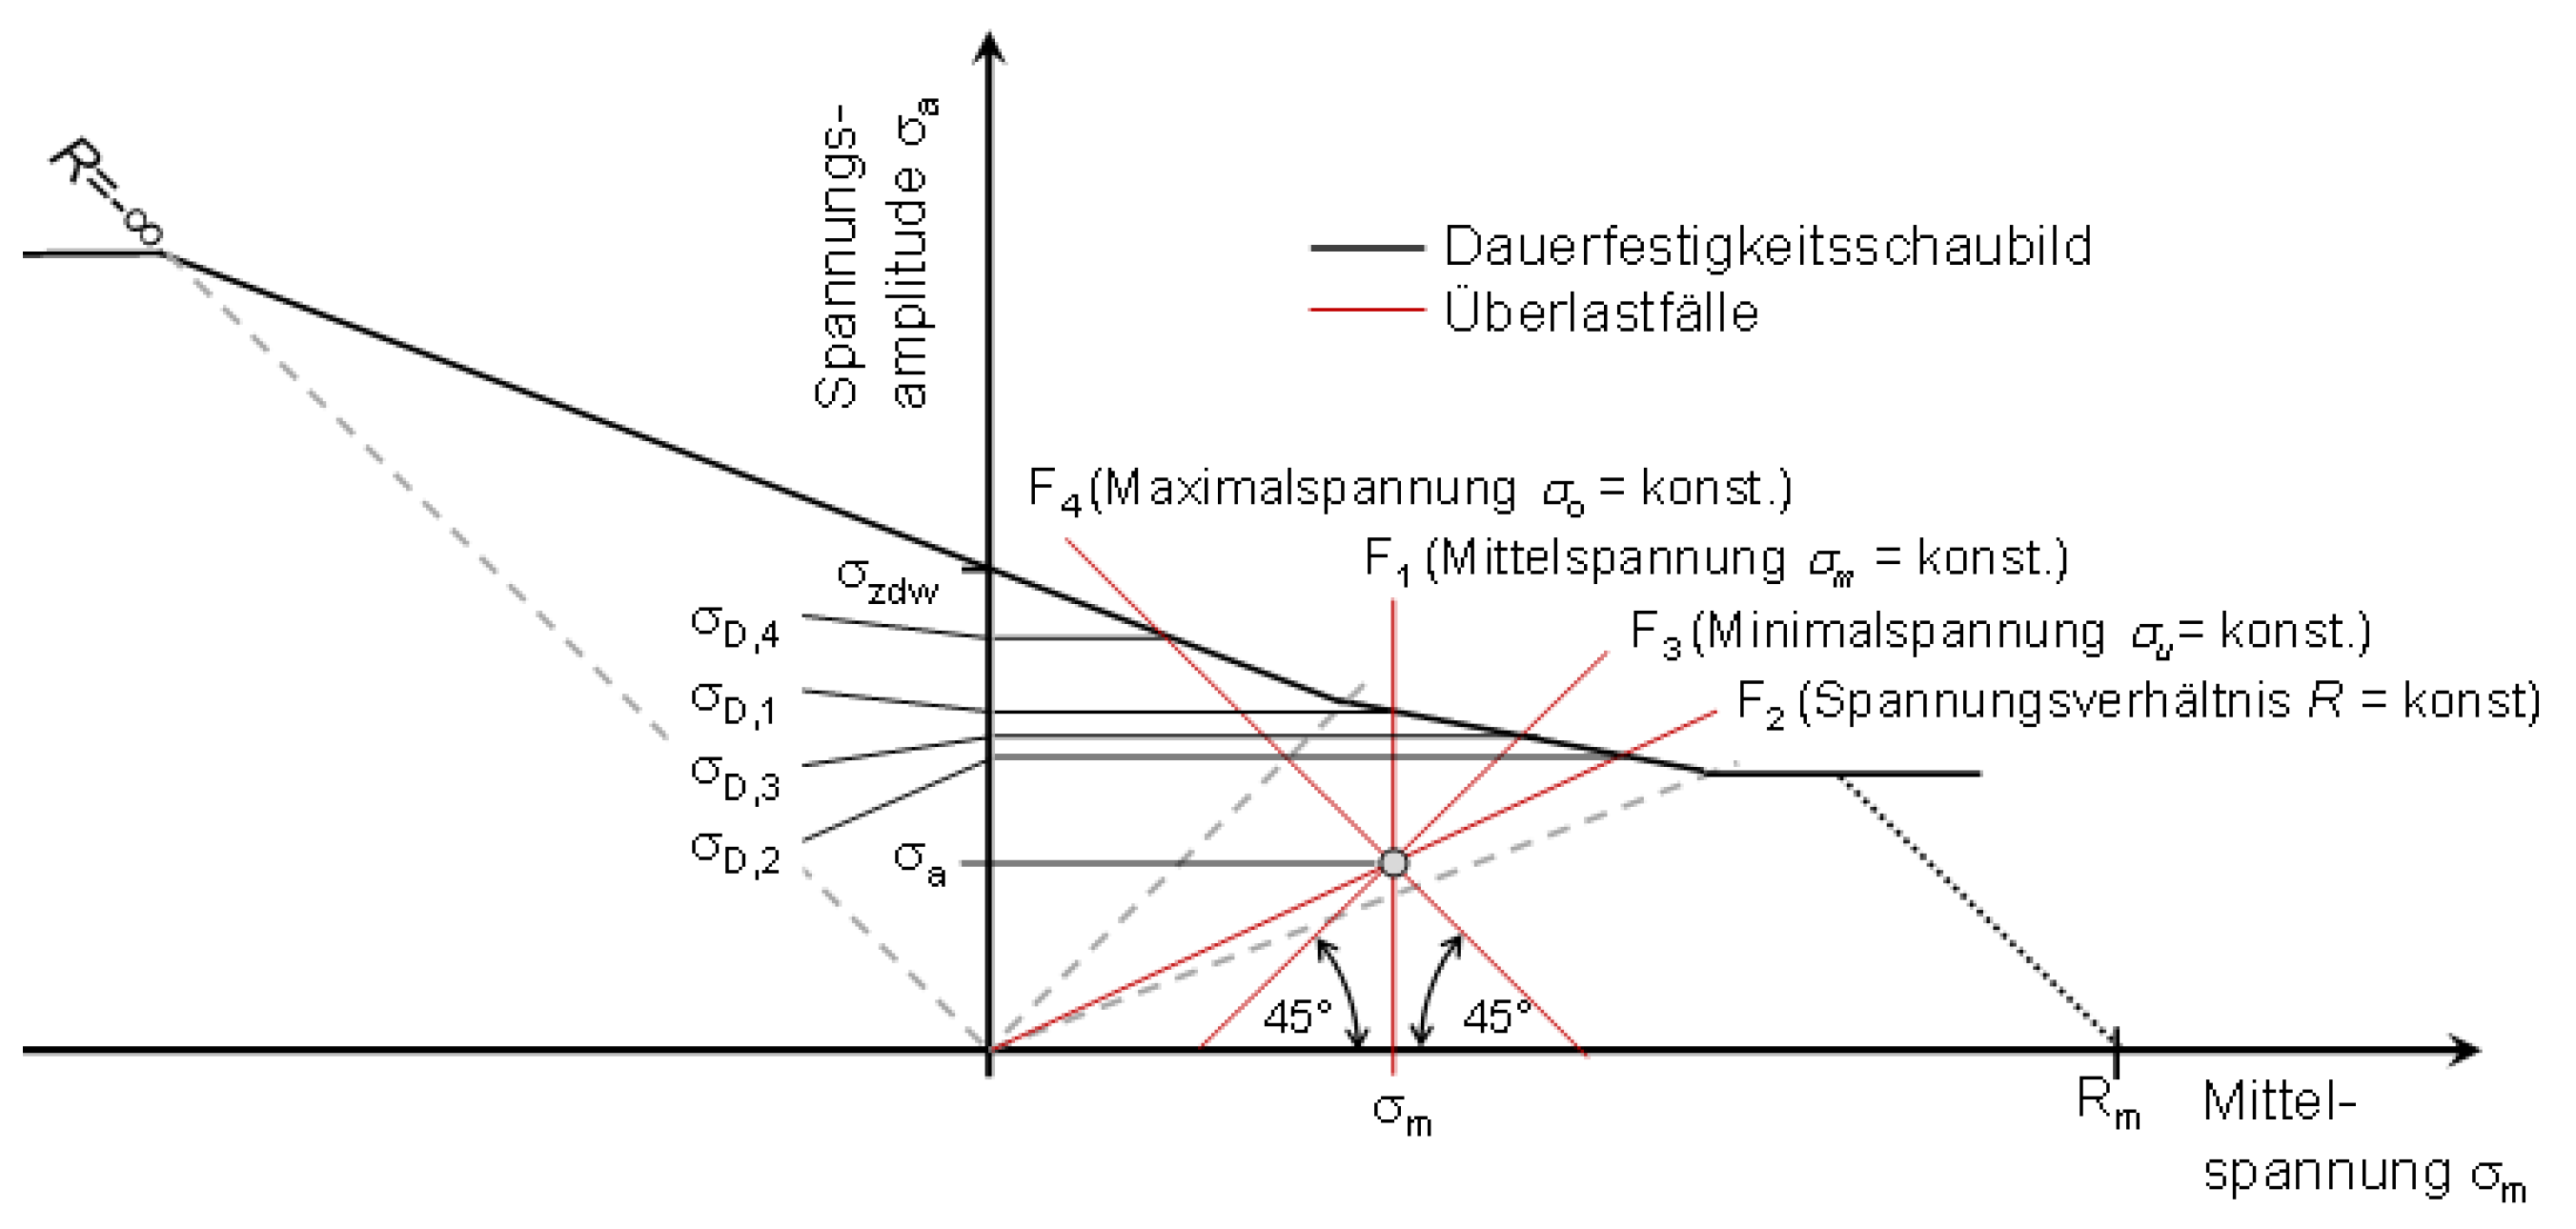
is compared with the fatigue strength diagram. The amplitude that can be sustained is sought. The overload case describes the relationship between mean and amplitude stress during a load change. There are the following overload cases according to the FKM guideline:
Overload case F1: Constant medium voltage ()
Overload case F2: Constant voltage ratio (
Overload case F3: Constant undervoltage ()
Overload case F4: Constant high voltage ()
Figure 1.
Visualization of the mean stress sensitivity with the parameter according to FKM.
Figure 1.
Visualization of the mean stress sensitivity with the parameter according to FKM.
Mean stress sensitivity according to SMITH-WATSON-TOPPER
The SMITH-WATSON-TOPPER parameter (
) [
8] was developed in its original form to estimate the fatigue life of metallic materials in a uniaxial loading condition in the range up to fatigue crack initiation with nonzero mean values. This parameter is based on the analysis of both stress and strain. Therefore, the stress-strain criterion is the focus rather than the energy criterion. In this paper, the original
model and its numerous modifications are presented. In the first part, different versions of this parameter defined by the normal parameters are presented. Then, versions defined by the tangent parameter and the most promising parameter defined by the tangent and normal parameters are presented.
Table 2.
Determination of the damage parameter and mean stress sensitivity according to SMITH-WATSON-TOPPER.
Table 2.
Determination of the damage parameter and mean stress sensitivity according to SMITH-WATSON-TOPPER.
Parameter SMITH-WATSON-TOPPER has been successfully used to describe uniaxial cyclic fatigue with non-zero mean value over the whole range of fatigue life. Here we can mention the following sources, where the results of cyclic tests for numerous materials are presented using the P_SWT parameter, where a function is used to describe fatigue tests with zero and nonzero mean values [
9,
10,
11,
12,
13,
14]. This parameter was later modified several times and used to describe fatigue life in a complex loading condition. Recently, so-called energy criteria have been developed [
15].
Mean stress sensitivity according to WALKER
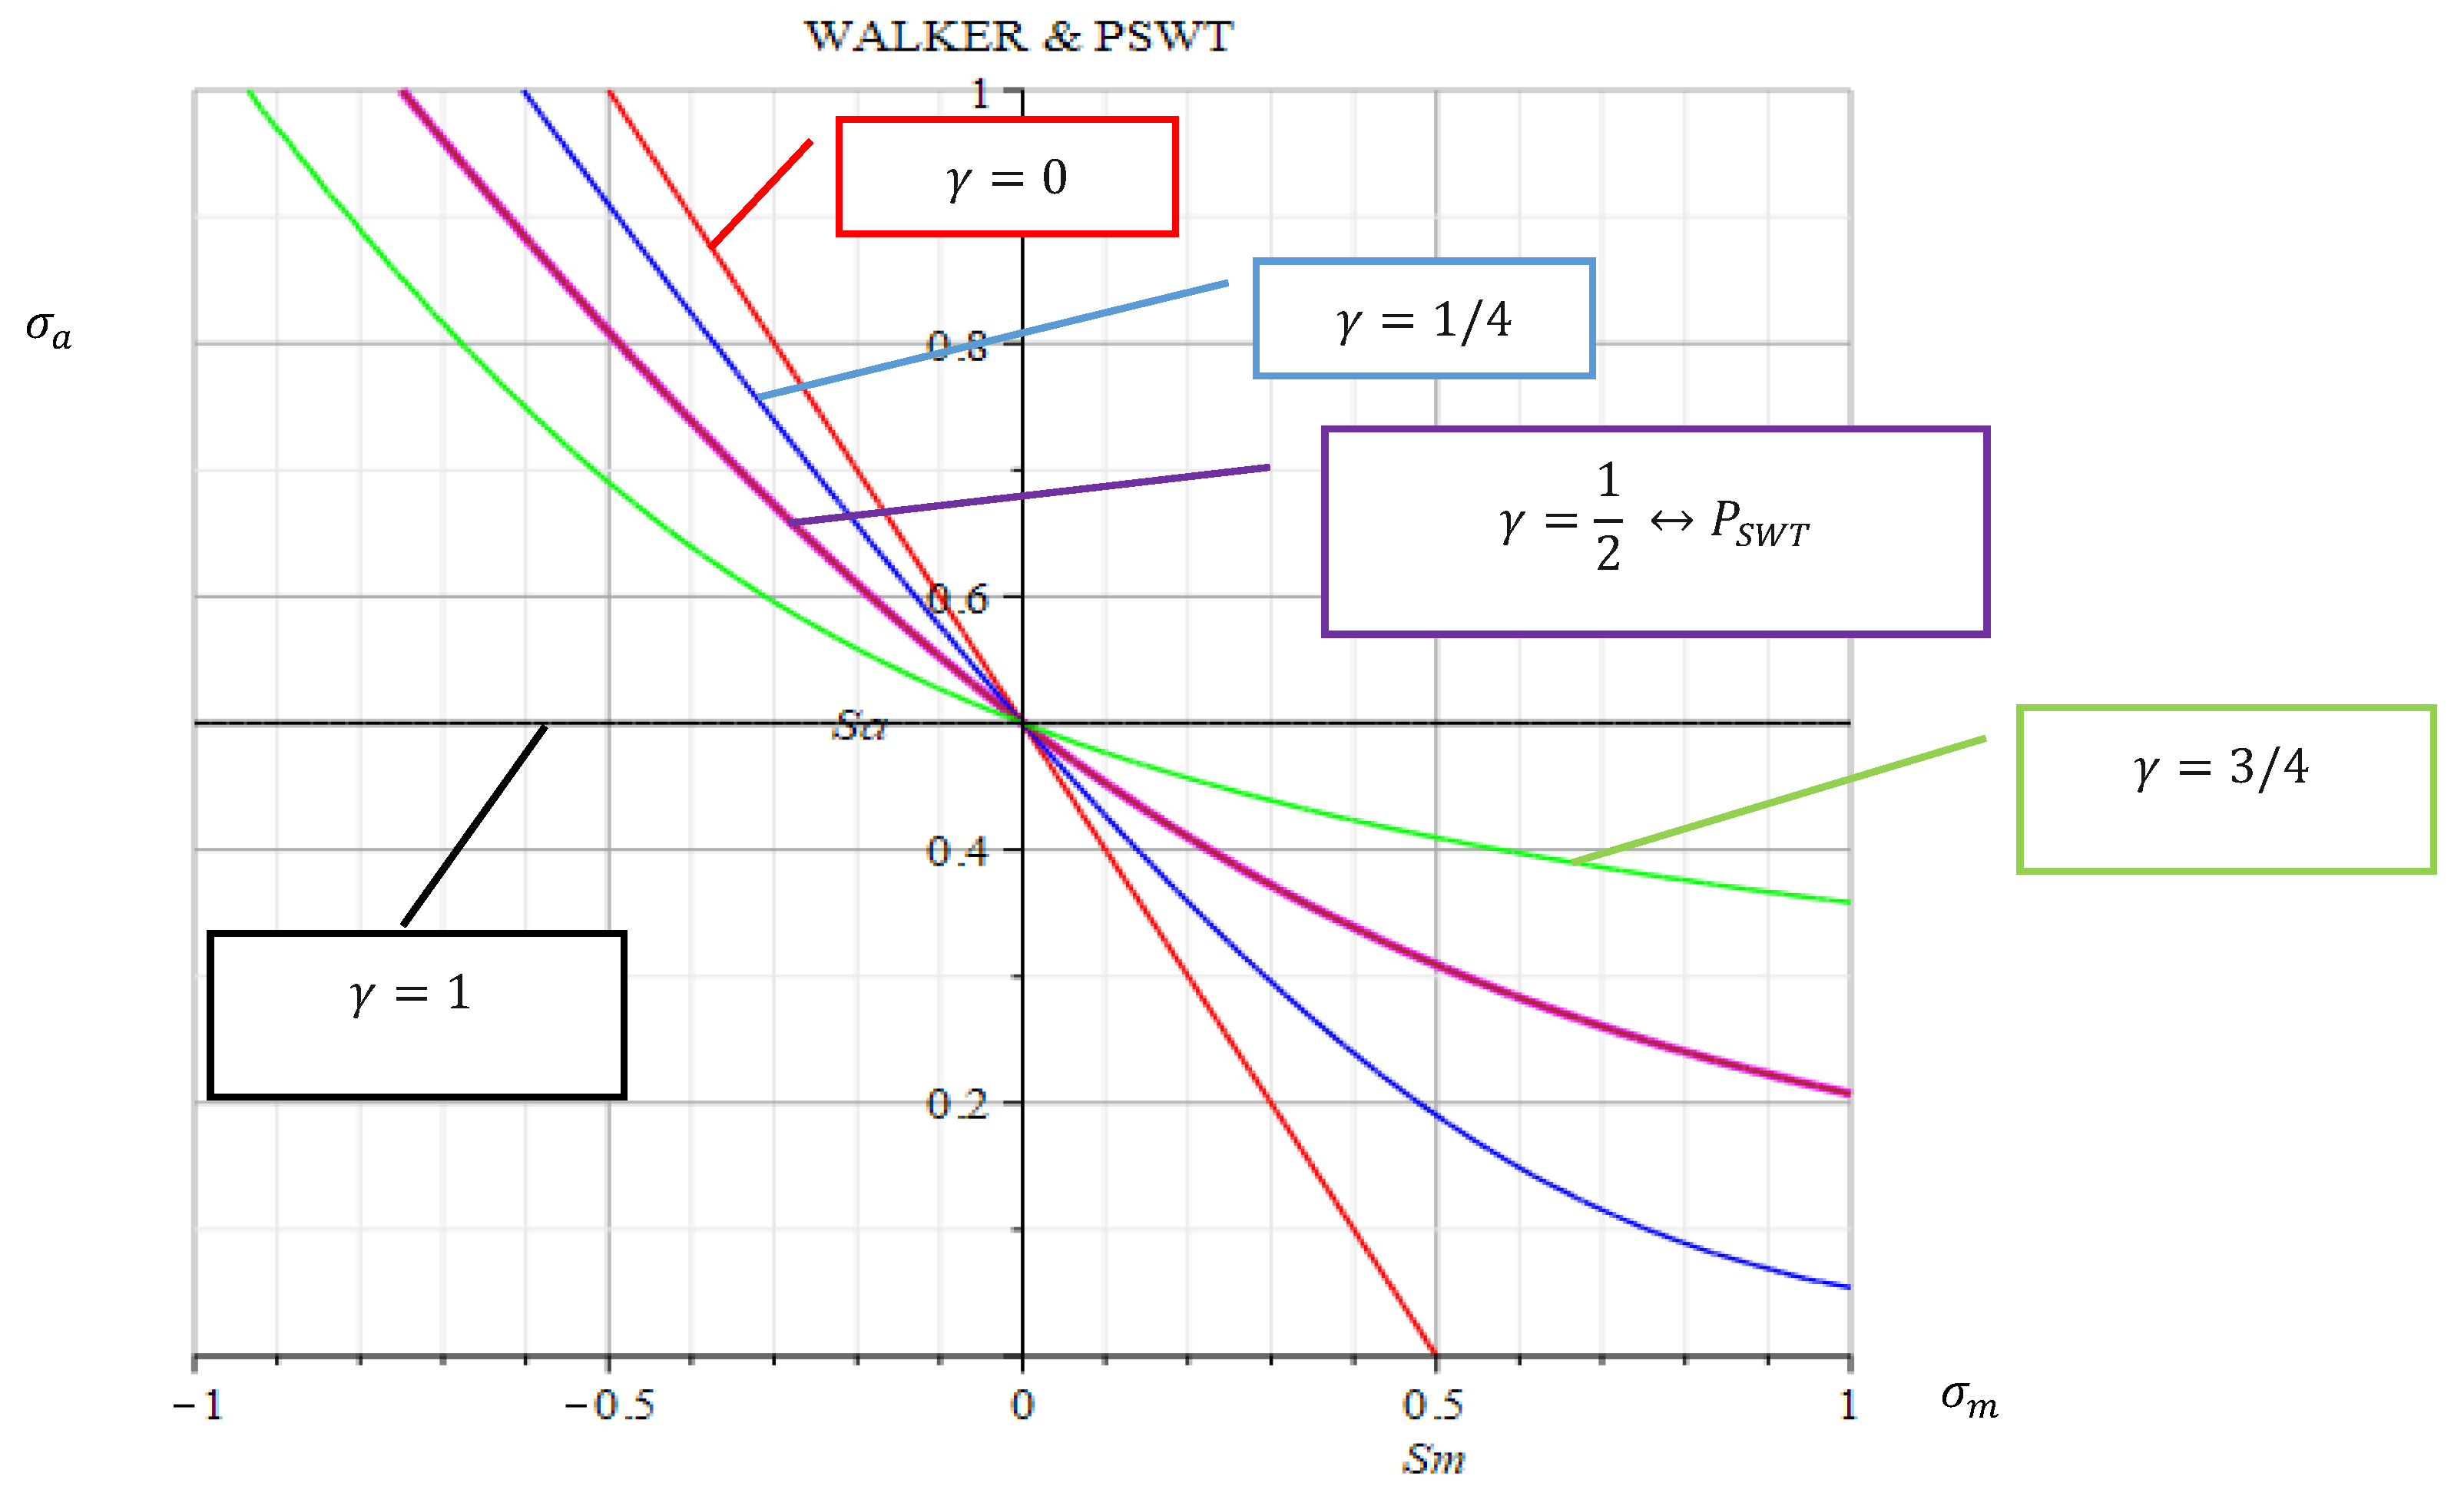
The empirical relations were developed by MORROW and WALKER. The effect of the mean can be written according to the proposal of Walker [
16]. In the relation of WALKER a new parameter γ was introduced. The parameter γ characterizes the exponent of the stress amplitude. WALKER's relations were used to fit the experimental data and predict the fatigue life behavior at different mean strain values during cyclic loading. The authors [
17,
18,
19] evaluated the influence of mean strain on the total number of cycles to fatigue failure of the spring material based on the WALKER approach.
Table 3.
Determination of the damage parameter and mean stress sensitivity according to WALKER.
Table 3.
Determination of the damage parameter and mean stress sensitivity according to WALKER.
Figure 2.
Visualization of the mean stress sensitivity with the parameter of WALKER.
Figure 2.
Visualization of the mean stress sensitivity with the parameter of WALKER.
Crucially, the WALKER exponent
depends directly on the mean stress sensitivity:
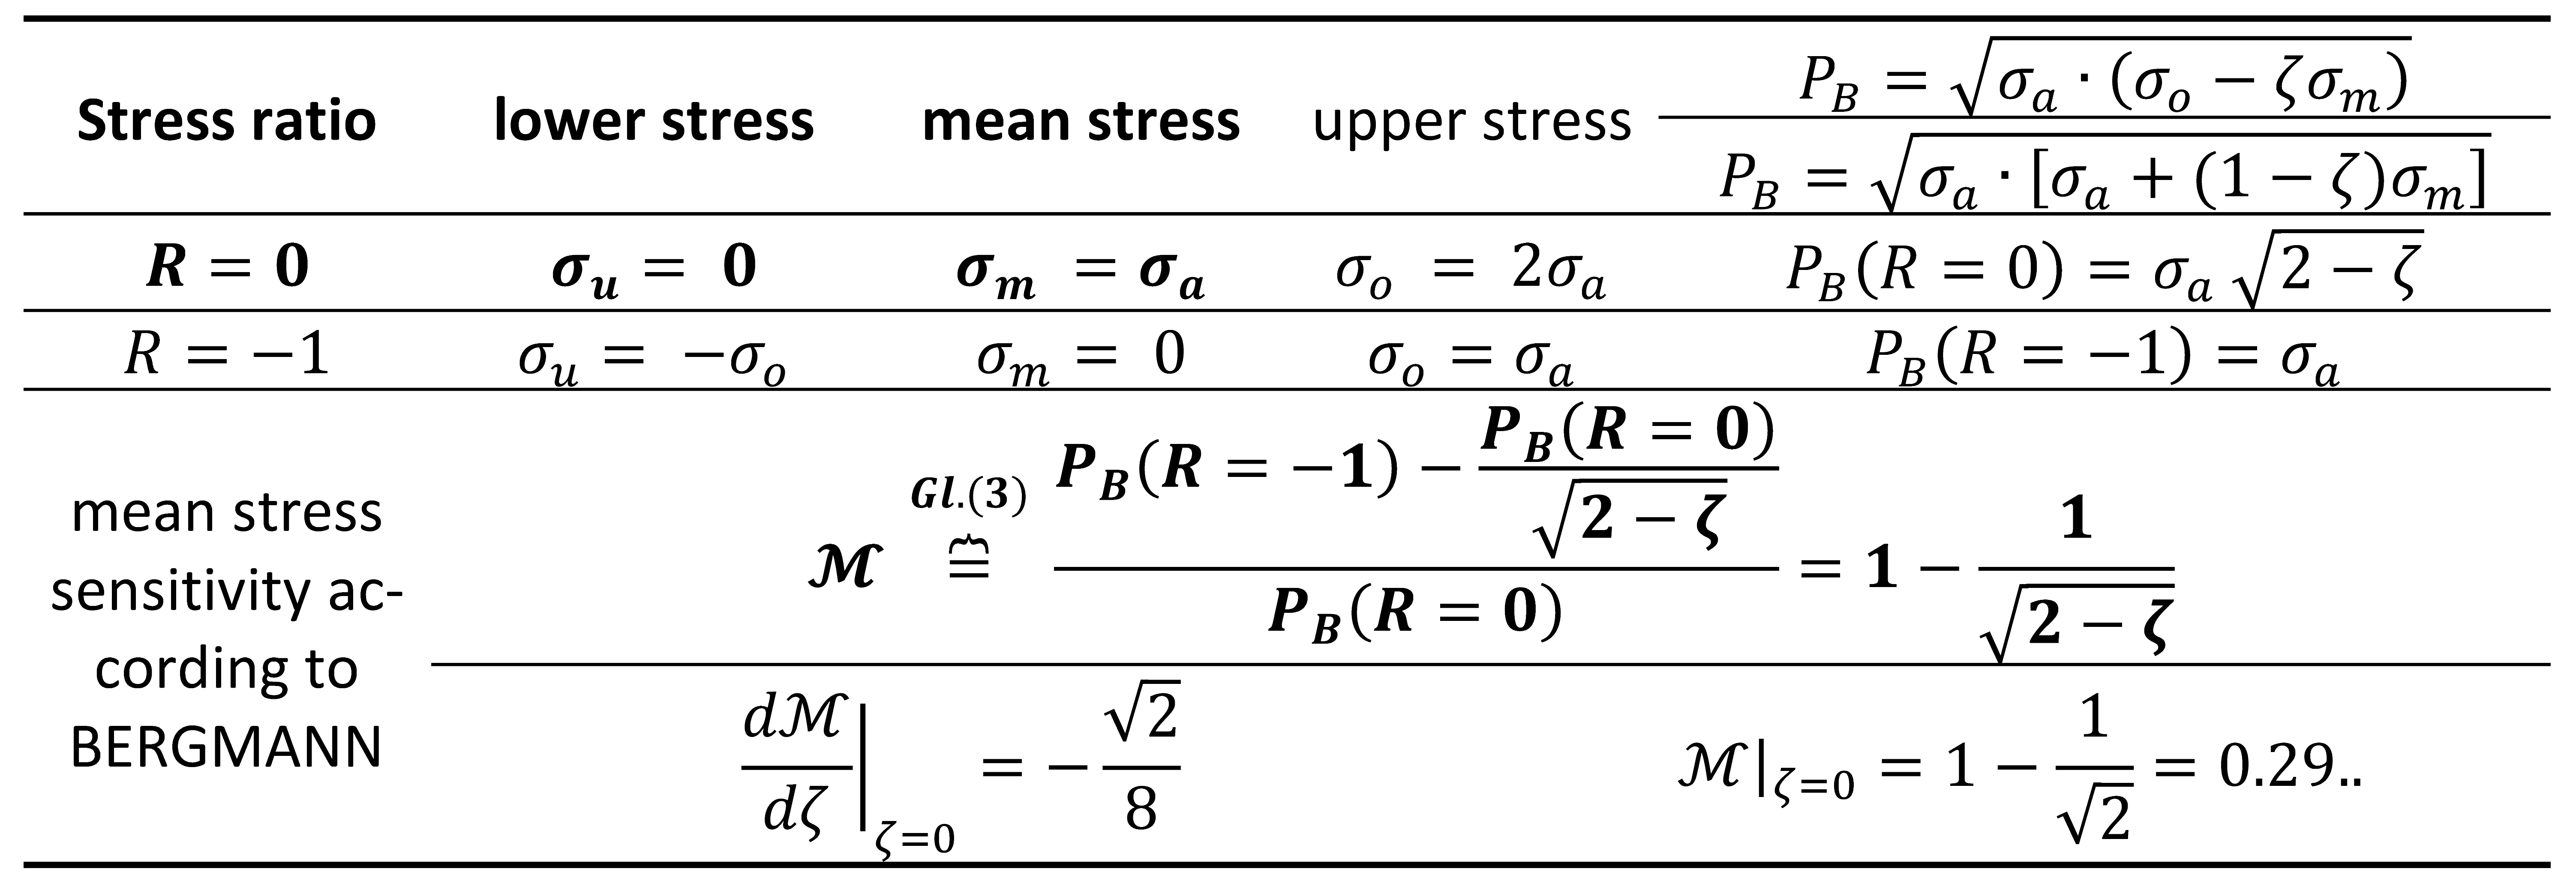
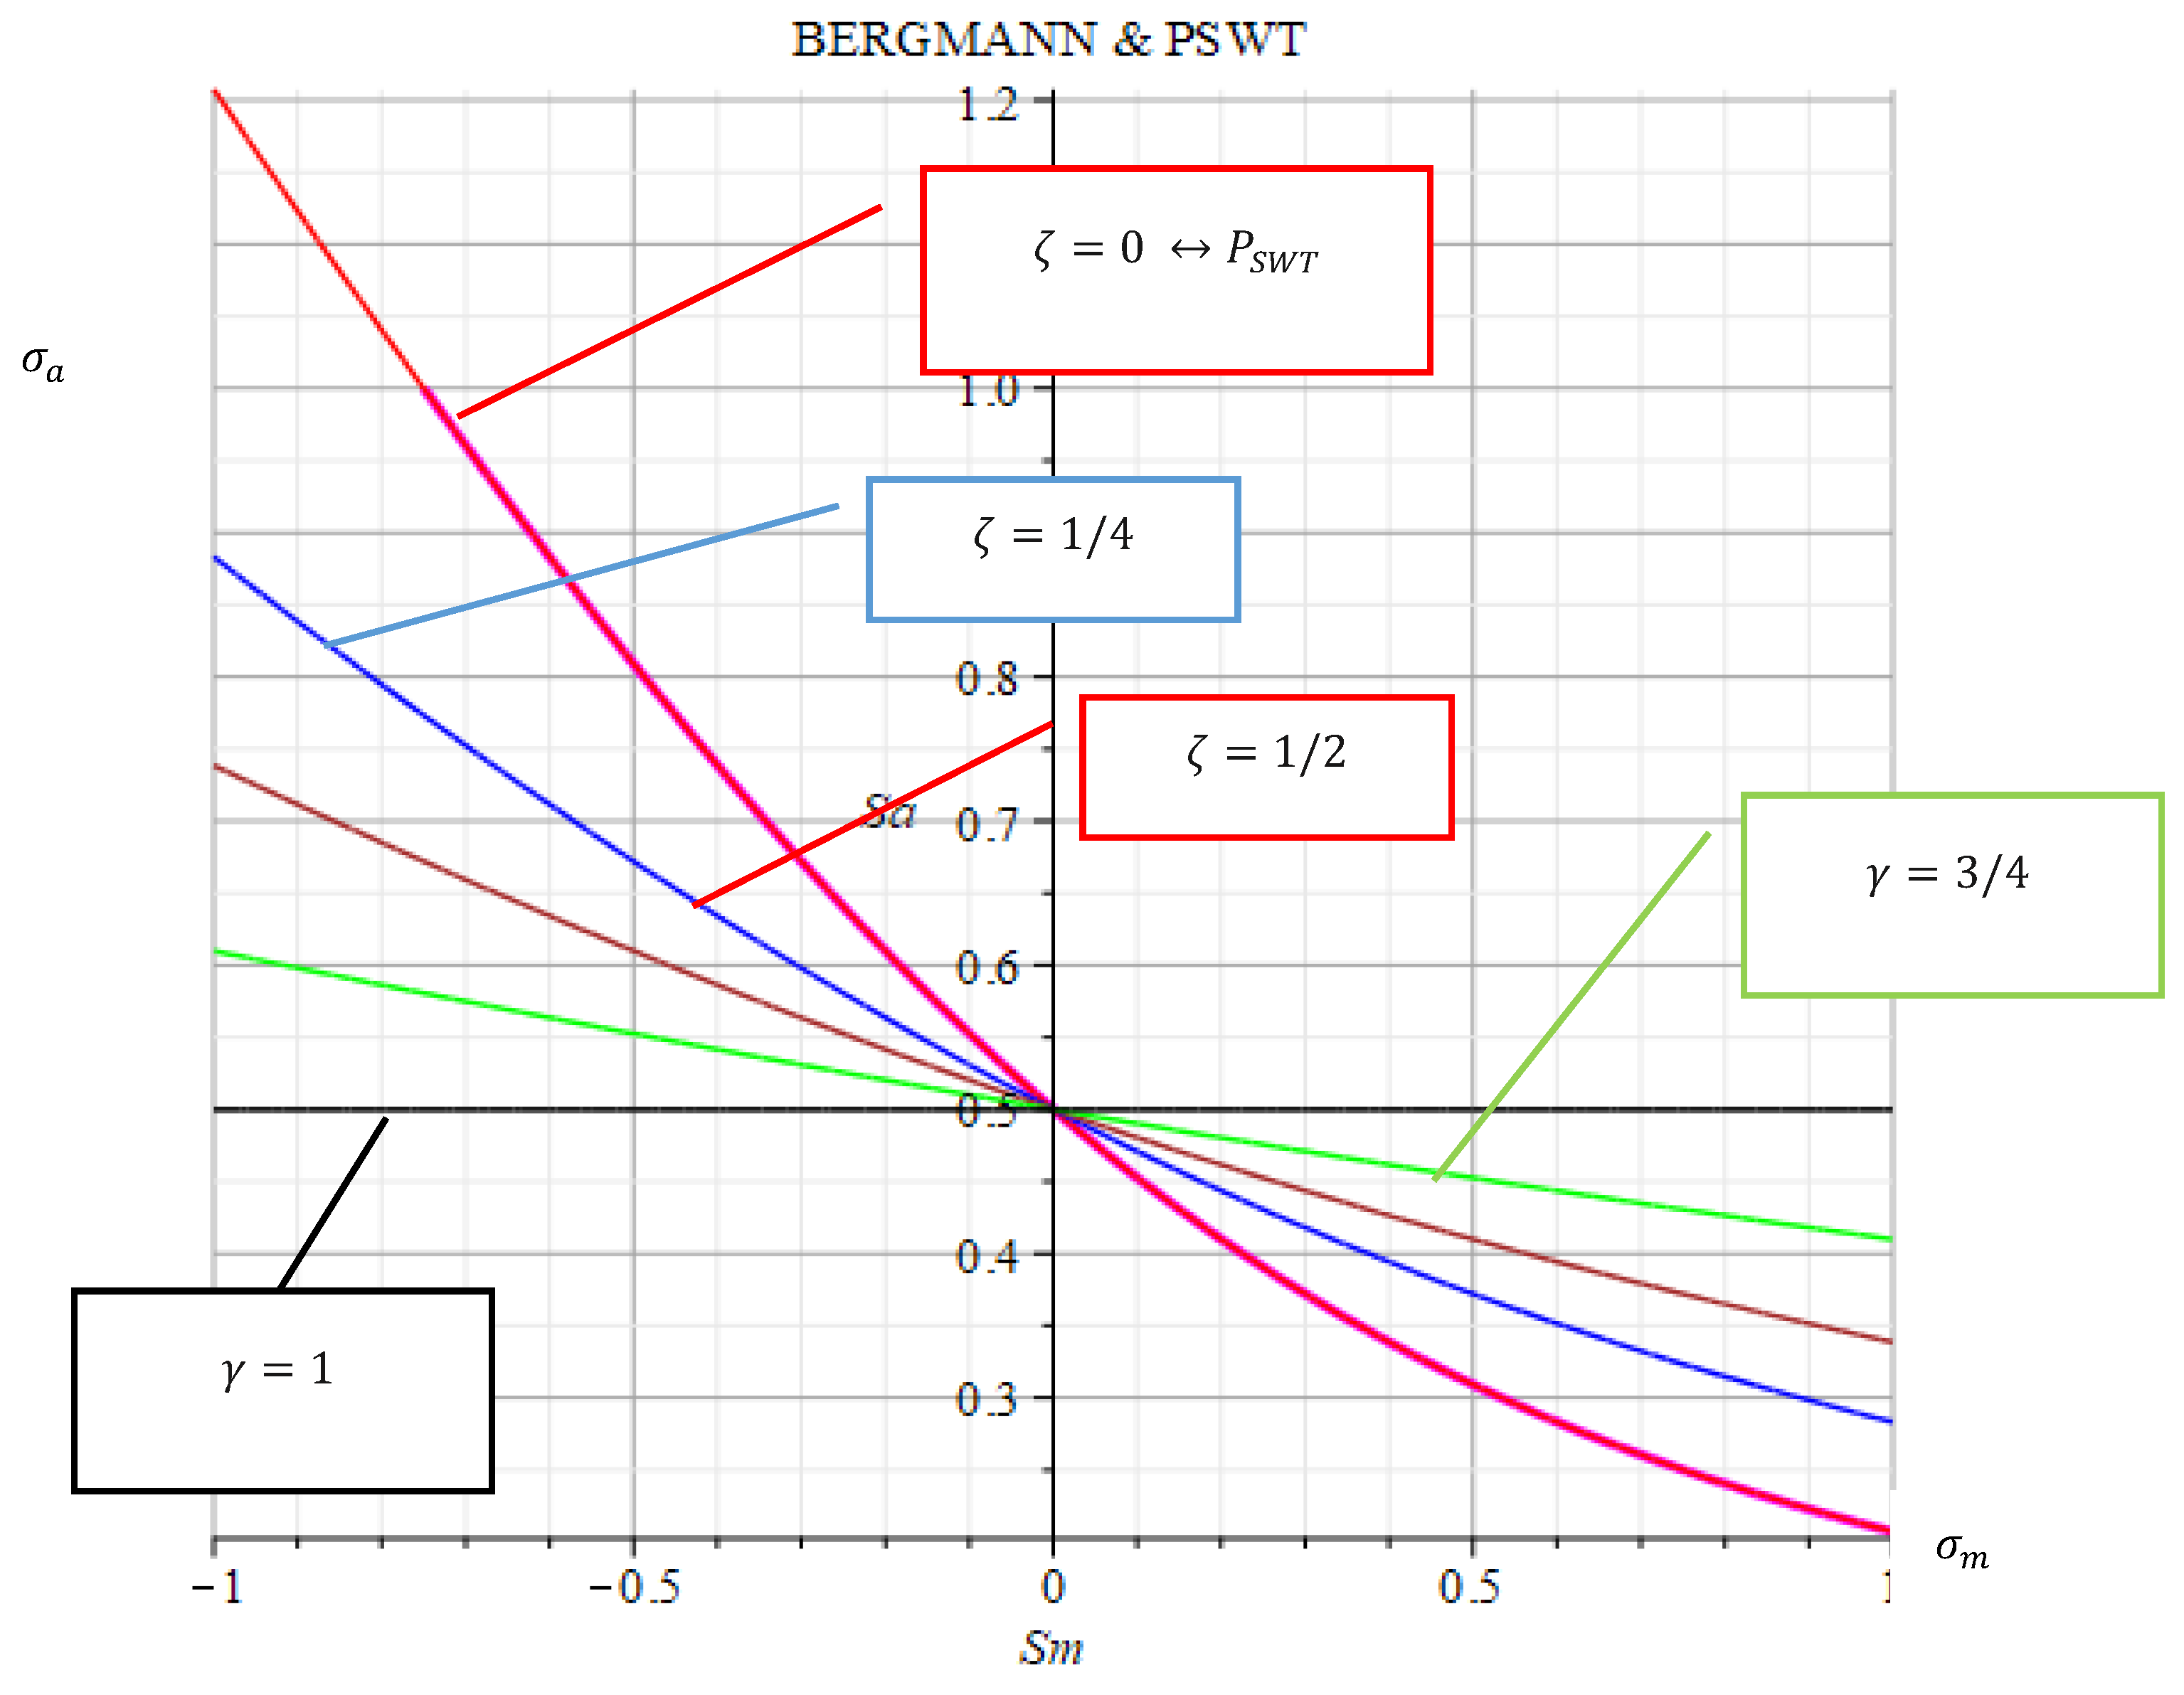
Mean stress sensitivity according to BERGMANN
Different models were proposed by BERGMANN [
20,
21]. The factor used in this paper differs from the original parameter of BERGMANN
. With the parameter
the similarity with the criterion of WALKER becomes clear (
Figure 3). The medium stress sensitivity disappears
. Bergmann's adaptation is based on the fact that the value of the ζ-factor need not be zero. When analyzing the results obtained for carbon steel
,
was present. Better agreement with experiment was obtained for
,
[
22]. For the 1045 steel grade, the smallest error compared to the experiment was obtained for
[
23].
Table 4.
Determination of the damage parameter and mean stress sensitivity according to BERGMANN.
Table 4.
Determination of the damage parameter and mean stress sensitivity according to BERGMANN.
It is worth noting that BERGMANN parameters are certain functions of mean stress sensitivity:
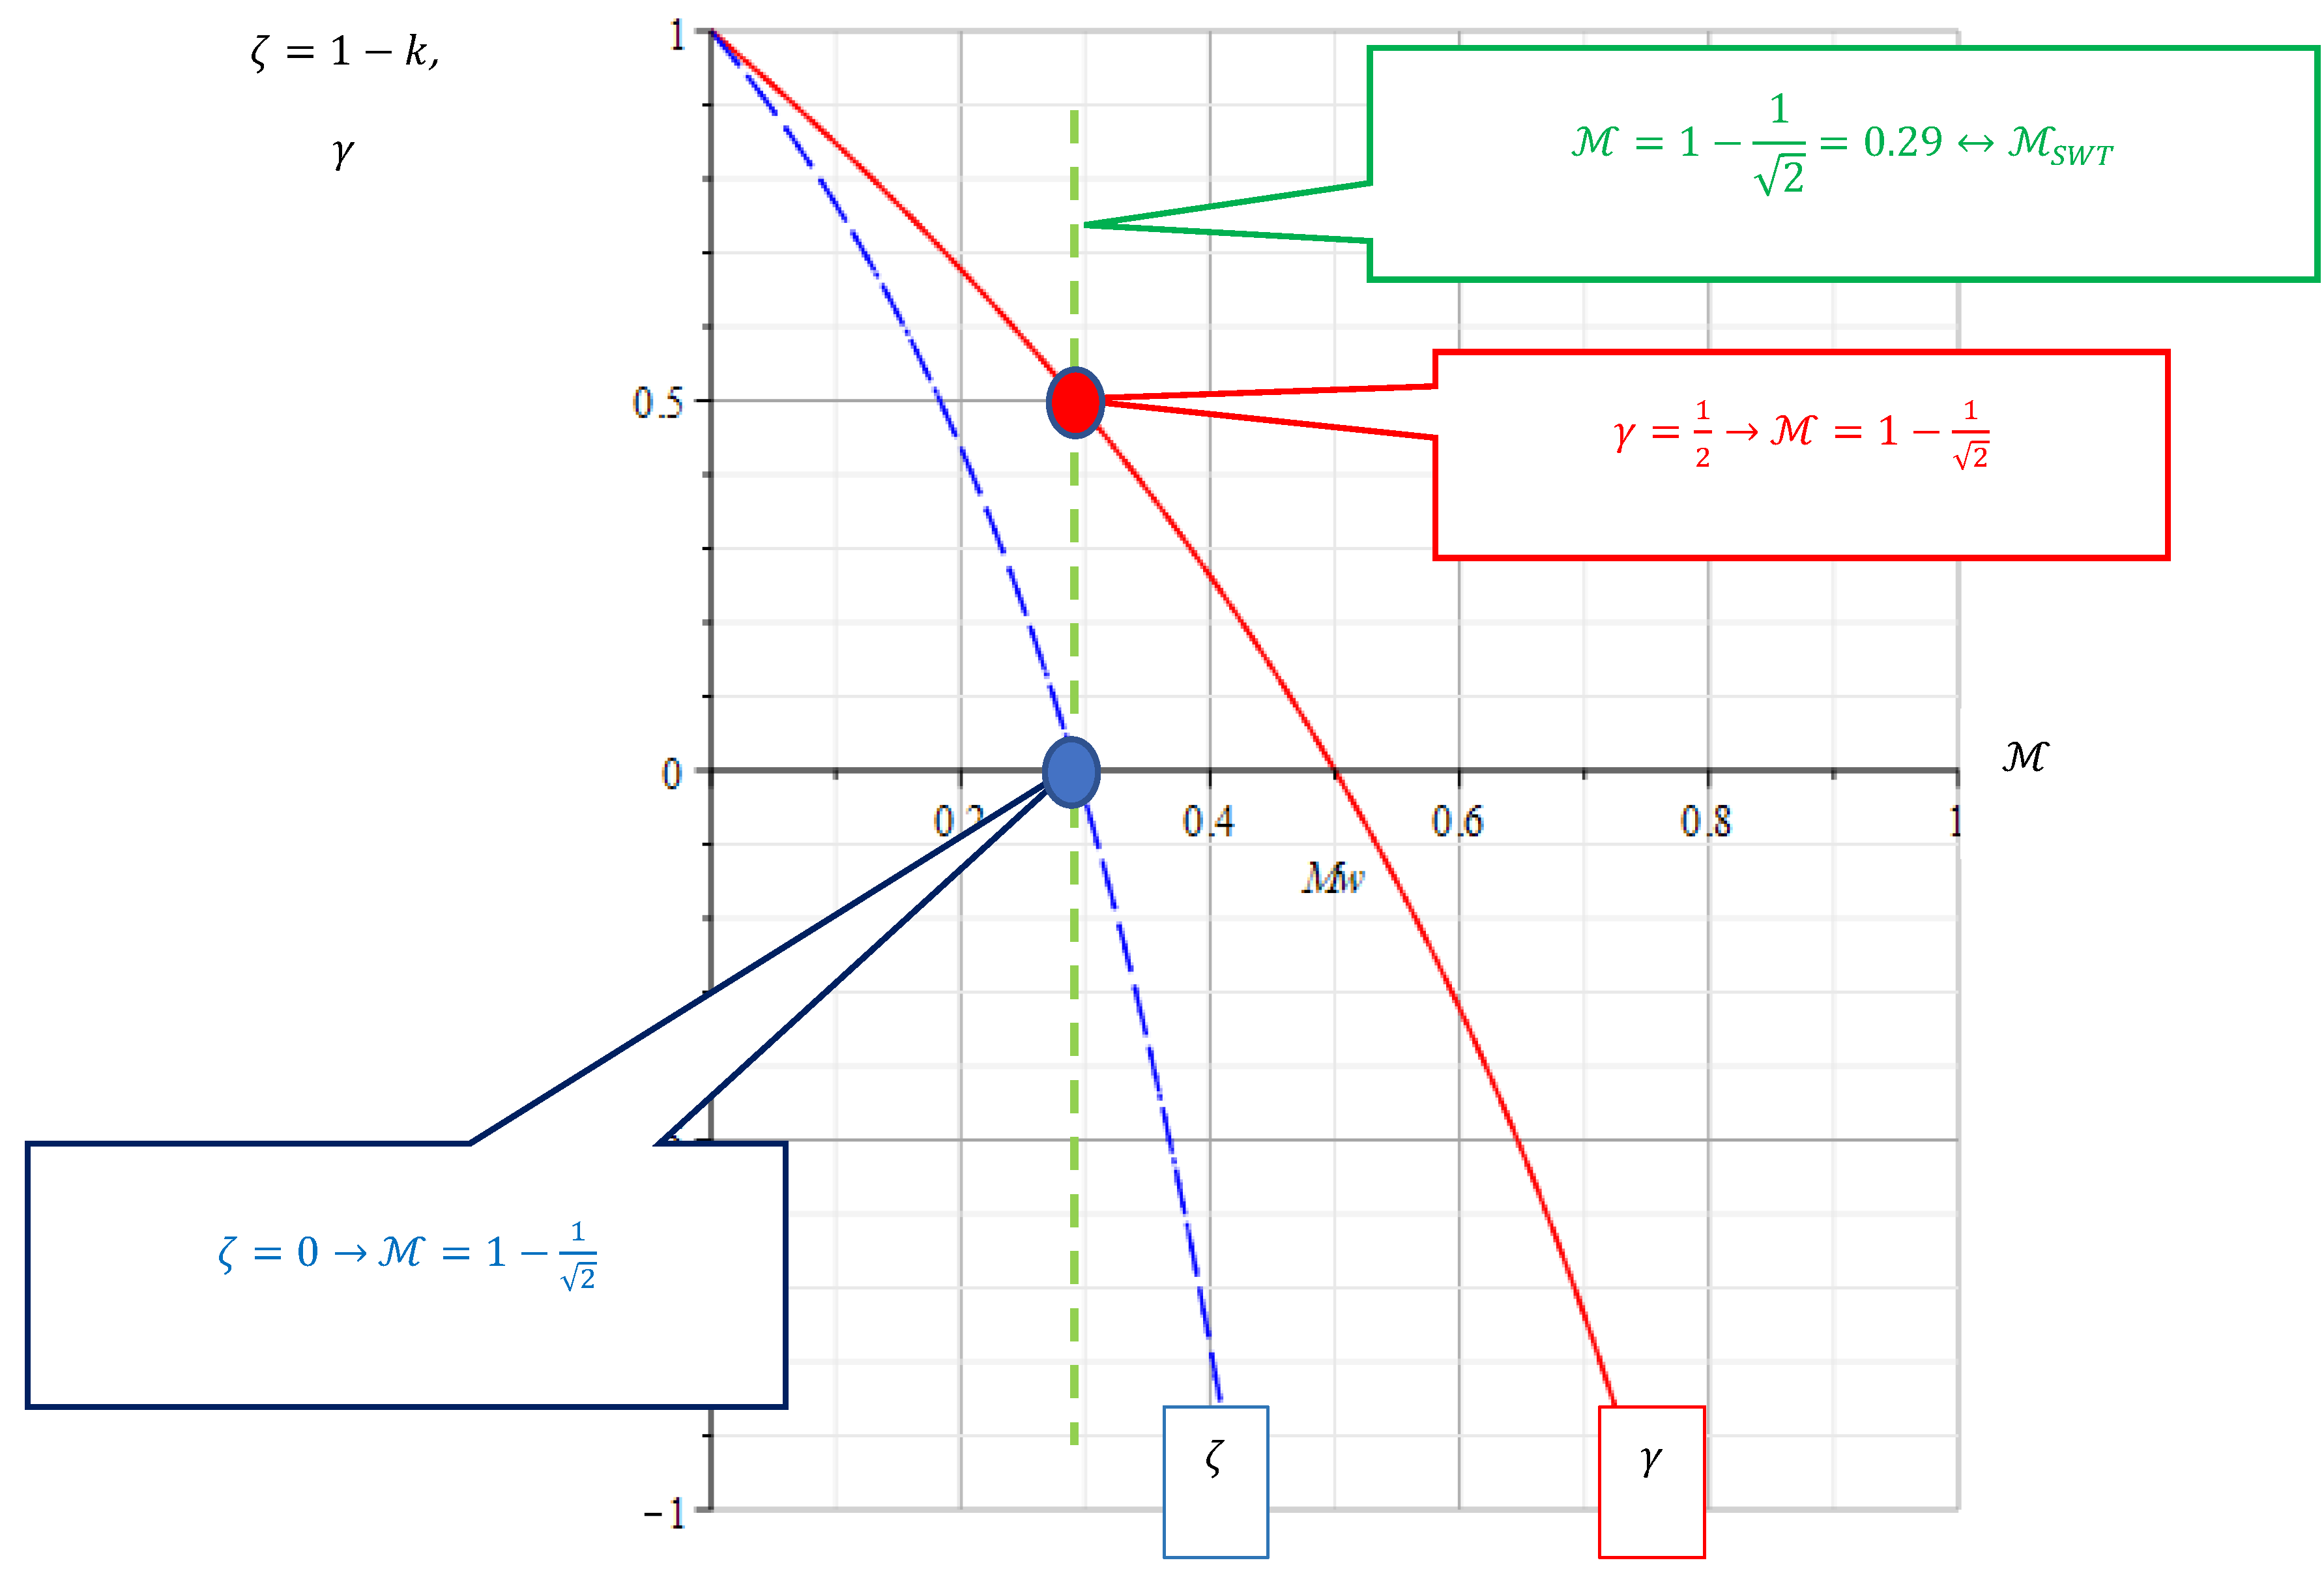
Figure 4 demonstrates the graphs of the functions
. The green vertical line shows the determined medium-voltage sensitivity
., which results from the calculation of the damage parameter
according to SMITH-WATSON-TOPPER. From the graphs (
Figure 4), the reduction of both parameters with the increasing medium voltage sensitivity is clearly visible.
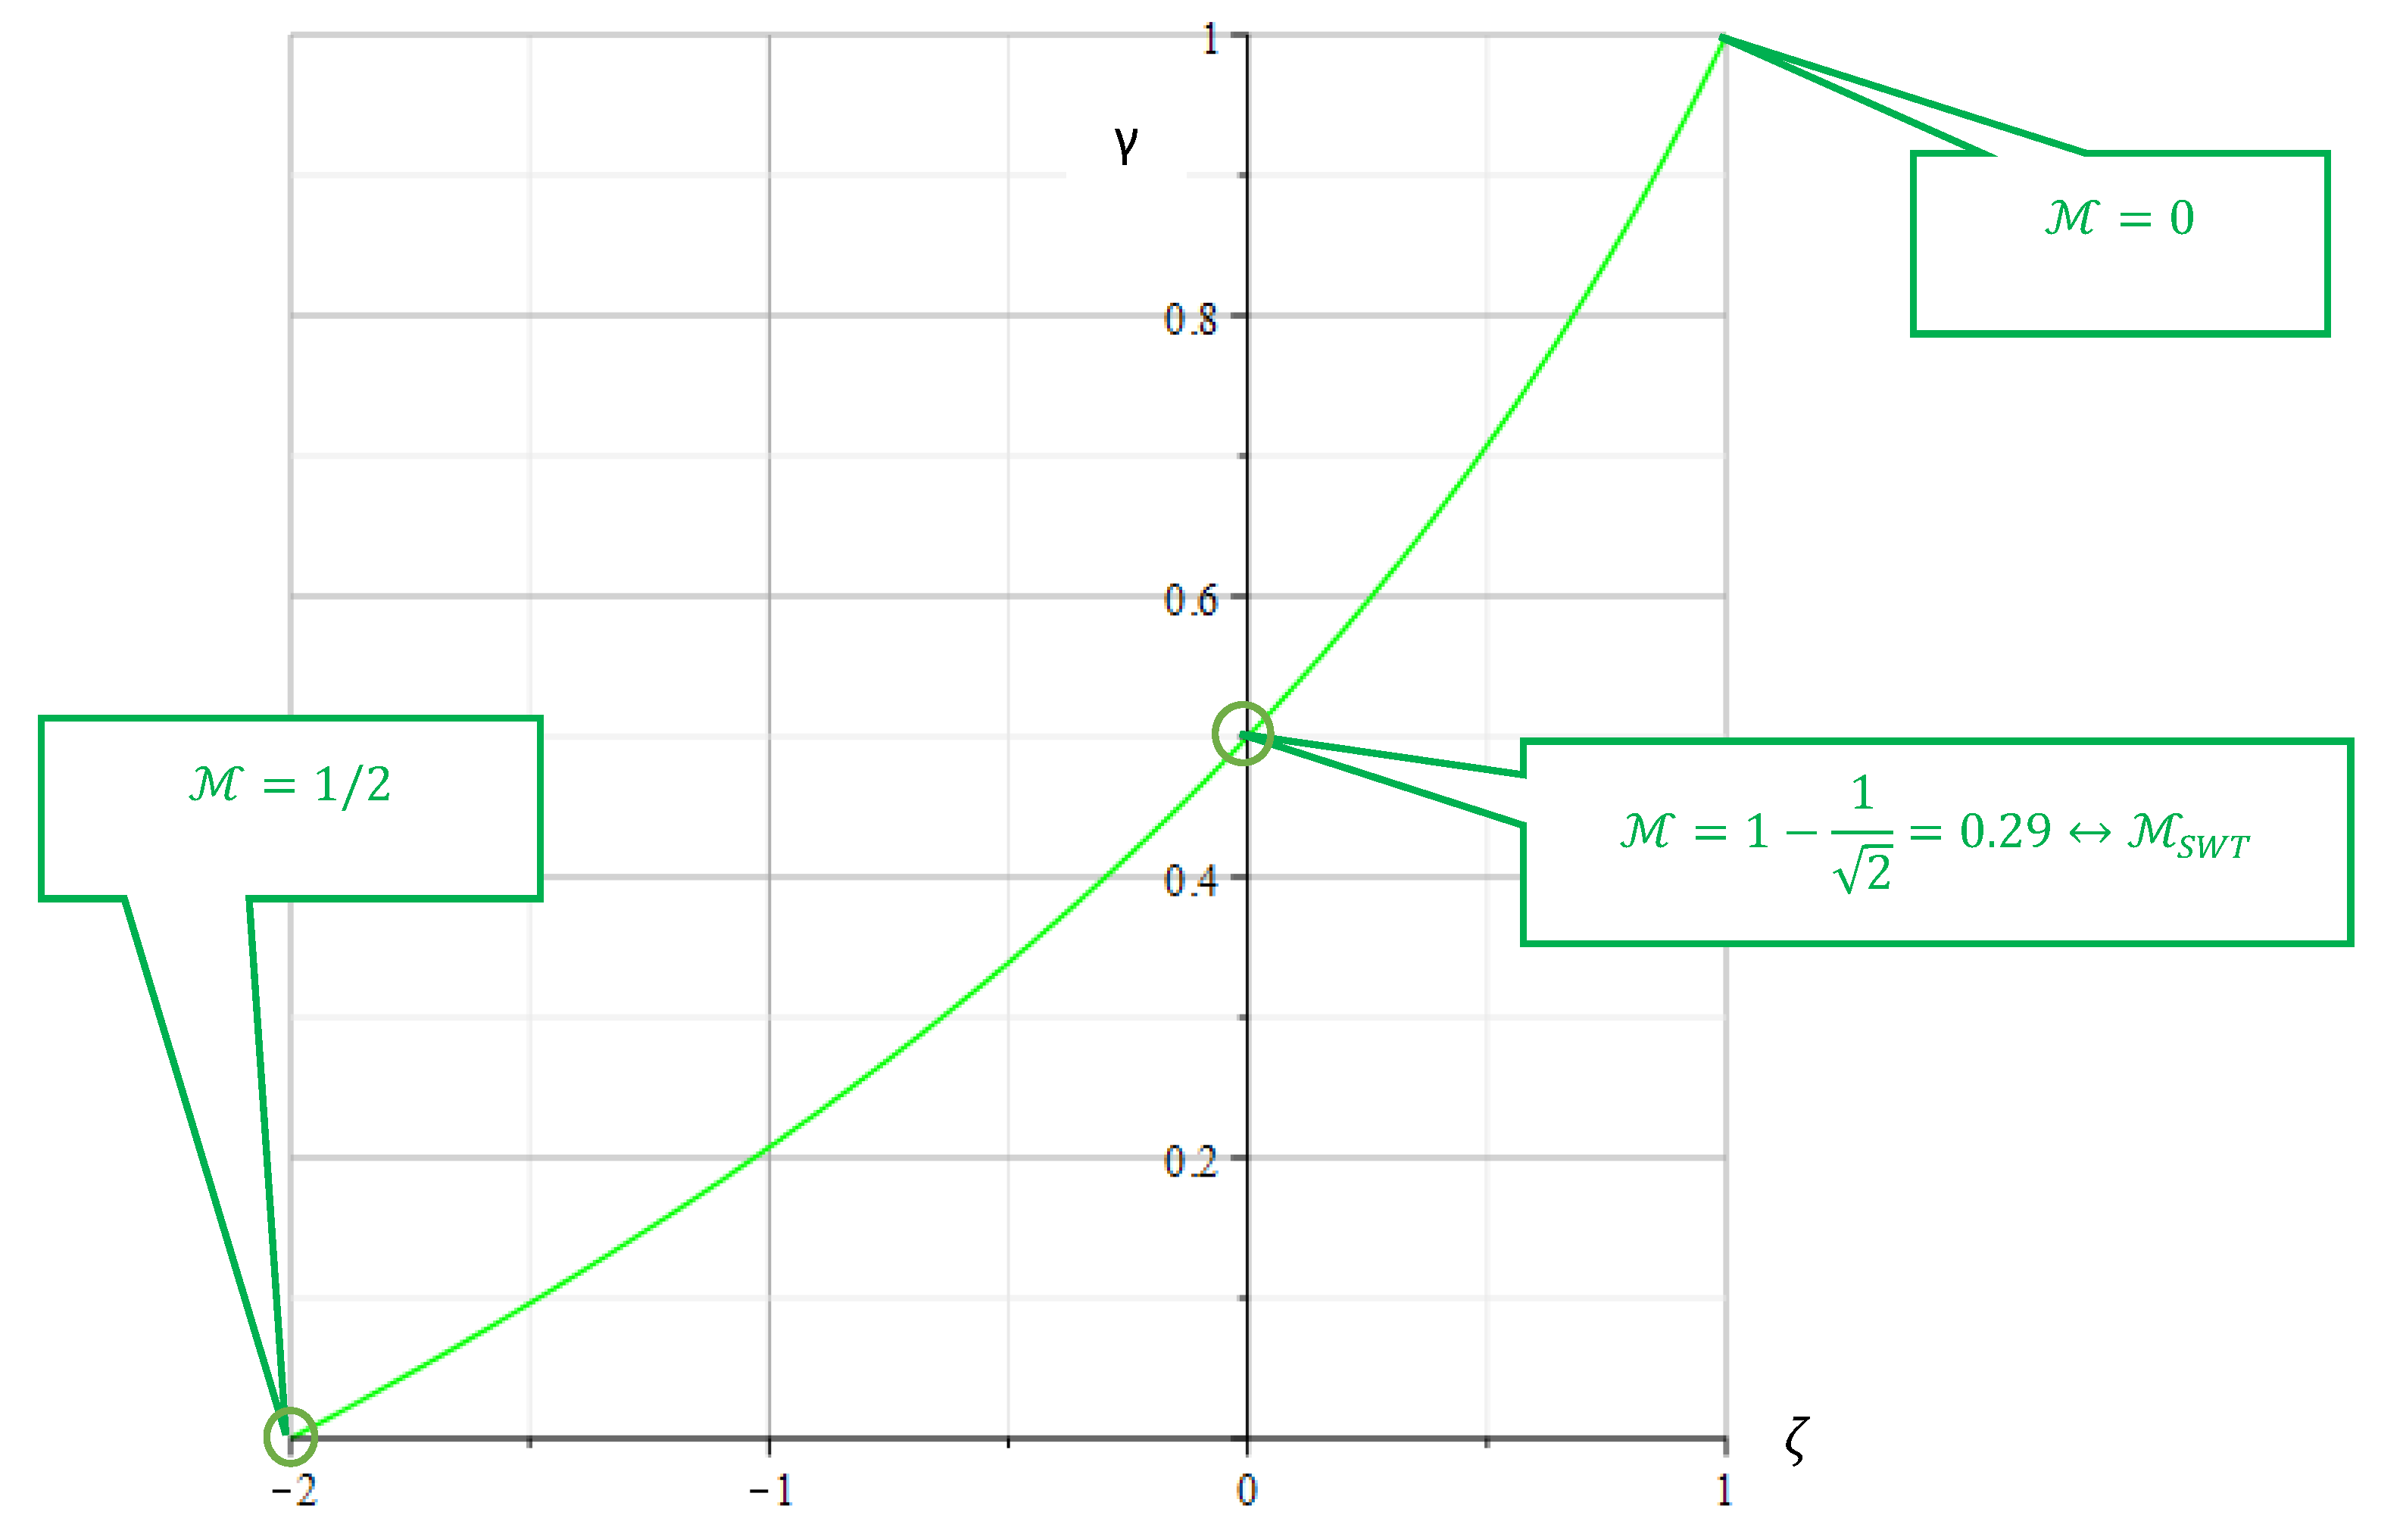
The dependence between the BERGMANN parameter
and the WALKER exponent
, which corresponds to the identical medium voltage sensitivity
, follows from the equation:
Resolving Equation (6) to ζ gives the desired dependence as:
Figure 3.
Visualization of the mean stress sensitivity with the parameter of BERGMANN.
Figure 3.
Visualization of the mean stress sensitivity with the parameter of BERGMANN.
Figure 4.
Parameters of WALKER γ and BERGMANN ζas functions of the mean stress sensitivity .
Figure 4.
Parameters of WALKER γ and BERGMANN ζas functions of the mean stress sensitivity .
Figure 5.
WALKER γ as a function of BERGMANN ζ.
Figure 5.
WALKER γ as a function of BERGMANN ζ.
Accumulation of damage and sequence effects
MINER rule
Damage caused during cyclic loading corresponds to the accumulation of partial damage of time variable equivalent stress. Linear damage accumulation is used to evaluate the influence of a load collective on the service life of a component [
24,
25,
26]. To calculate the service life, the amplitude collective is divided into individual rectangular collectives with constant amplitude and a partial cycle number
. According to the linear damage accumulation method, a partial damage is now calculated for each partial collective by dividing the partial vibration cycle number by the maximum tolerable vibration cycle number of a Wöhler line
:
The partial damages of all sub-collectives are summed up. According to MINER rule, the sum of the partial damages characterizes the total damage:
If the damage exceeds the value 1, a fracture is to be expected. If one imagines a two-stage loading, according to the linear damage accumulation it does not matter in which order the loadings come. Min the MINER rule Equation (9) sequence effects cannot be explained.
Relaxation of damage and reduction of cumulative damage.
Frequently, one finds that the partial damages reduce continuously with time. The reduction of partial damages is explained by the creep effect. The relaxation of the stresses due to creep of the material at the tip of the microcracks leads to the reduction of the partial damages. The partial damages now become functions of time. If the instantaneous partial damage
with index
is caused at the instant
, the permanent partial damage
becomes smaller at the later moment
. In the simplest case of viscous creep, the relaxation is given as an exponential function of the time between the moment
of partial damage and the observation time
:
The time constant
in Equation (10) represents the rapidity of the relaxation. The partial damages
of all sub-collectives, continuously reduced with time, are summed. The sum of the partial damages characterizes the current total damage in the observation time
:
Sequence effects are appealingly explained by the time-dependent cumulative damage reduction , Equation (11). Clearly, the current total damage (11) reduces exponentially with time in the simplest case of viscous creep.
Summary
When studying the literature on fatigue failure of materials, one encounters a number of models for estimating fatigue life. At first glance, several models seem to be new. On closer analysis, one finds that some of them are based on the same idea as the SMITH-WATSON-TOPPER model. Unfortunately, the model of SMITH-WATSON-TOPPER has a decisive disadvantage. The medium voltage sensitivity in the model is exclusively ...
Corresponding corrections are already known from the literature. The models of WALKER and BERGMANN each include an additional parameter and allow the representation of actual, experimentally determined sensitivity from the medium voltage. These models clearly describe the experimentally observed reduction of the tolerable amplitude with increasing mean voltage and replace the continuous-linear representation from FKM. In this paper dependences of parameters WALKER and BERGMANN on medium voltage sensitivity and thus slope of GOODMAN straight line are established. Observations indicate that the partial damages reduce continuously with time. The reduction of partial damages was explained by the creep effect. The relaxation of stresses due to creep of the material at the tip of the microcracks leads to the reduction of partial damages. For the calculation, only a constant τ is needed, which characterizes the characteristic time of stress relaxation. Sequence effects are explained by the cumulative exponential damage reduction. The cumulative exponential damage reduction hypothesis can be used to calculate damage due to complex load spectra.
References
- Kobelev, V. Durability of Springs, 2nd ed.; Springer, 2022; ISBN 978-3-030-59255-4. [Google Scholar]
- Łagoda, T.; et al. Using the Smith-Watson-Topper Parameter and Its Modifications to Calculate the Fatigue Life of Metals: The State-of-the-Art. Materials 2022, 15, 3481. [Google Scholar] [PubMed]
- Gadouini, H.; Nadot, Y.; Rebours, C. Influence of mean stress on the multiaxial fatigue behaviour of defective materials. Int. J. Fatigue 2008, 30, 1623–1633. [Google Scholar] [CrossRef]
- Rechnerischer Festigkeitsnachweis für Federn und Federelemente (2018) FKM-Vorhaben Nr. 600, Heft 332.
- VDI 2226:1965-07 (1965) Empfehlung für die Festigkeitsberechnung metallischer Bauteile, VDI.
- Schütz, W. (1967) Über eine Beziehung zwischen der Lebensdauer bei konstanter und bei veränderlicher Beanspruchungsamplitude und ihre Anwendbarkeit auf die Bemessung von Flugzeugbauteilen. Z. f. Flugwissenschaften 15 H. 11, S. 407/419.
- Forschungskuratorium Maschinenbau: Rechnerischer Festigkeitsnachweis für Maschinenbauteile. VDMA-Verlag, 2012; ISBN 978-3-8163-0605-4.
- Smith, K.N.; Watson, P.; Topper, T.H. A stress-strain function for the fatigue of metals. J. Mater. ASTM 1970, 5, 767–778. [Google Scholar]
- Boeller, C.; Seeger, T. Materials Data for Cyclic Loading, Part A: Unalloyed Steels. In Materials Data for Cyclic Loading; Materials Science Monographs 42A; Elsevier: Amsterdam, The Netherlands, 1987; https://www.elsevier.com/books/materials-data-for-cyclic-loading/boller/978-0-444-42871-4.
- Boeller, C.; Seeger, T. Materials Data for Cyclic Loading, Part B: Low-alloyed Steels. In Materials Data for Cyclic Loading; Materials Science Monographs 42B; Elsevier: Amsterdam, 1987. [Google Scholar]
- Boeller, C.; Seeger, T. Materials Data for Cyclic Loading, Part C: High-alloyed Steels. In Materials Data for Cyclic Loading; Materials Science Monographs 42C; Elsevier: Amsterdam, 1987. [Google Scholar]
- Boeller, C.; Seeger, T. Materials Data for Cyclic Loading, Part D: Aluminium and Titanium Alloys. In Materials Data for Cyclic Loading; Materials Science Monographs 42D; Elsevier: Amsterdam, 1987. [Google Scholar]
- Boeller, C.; Seeger, T. Materials Data for Cyclic Loading, Part E: Cast and welded materials. In Materials Data for Cyclic Loading; Materials Science Monographs 42E; Elsevier: Amsterdam, 1987. [Google Scholar]
- Boeller, C.; Seeger, T. Materials Data for Cyclic Loading, Suplement 1. In Materials Data for Cyclic Loading; Materials Science Monographs 61; Elsevier: Amsterdam, 1990. [Google Scholar]
- Garud, Y.S. A New Approach to the Evaluation of Fatigue under Multiaxial Loadings. J. Eng. Mater. Technol. 1981, 103, 118–125. [Google Scholar] [CrossRef]
- Walker, K. The effect of stress ratio during crack propagation and fatigue for 2024-T3 and 7075-T6 aluminum. In Effects of Environment and Complex Load History on Fatigue Life; ASTM STP 462; West Conshohocken, PA, 1970; pp. 1–14. [Google Scholar]
- Geilen, M.B.; Klein, M.; Oechsner, M. On the influence of ultimate number of cycles on lifetime prediction for compression springs manufactured from VDSiCr class spring wire. Materials 2020, 13, 3222. [Google Scholar] [CrossRef] [PubMed]
- Karr, U.; et al. Inclusion initiated fracture in spring steel under axial and torsion very high cycle fatigue loading at different load ratios. Int. J. of Fatigue 2020, 134, 105525. [Google Scholar] [CrossRef]
- Karr, U.; et al. Effects of Non-Metallic Inclusions and Mean Stress on Axial and Torsion Very High Cycle Fatigue of SWOSC-V Spring Steel. Metals 2022, 12, 1113. [Google Scholar] [CrossRef]
- Bergmann, J.; Seeger, T. On the Influence of Cyclic Stress-Strain Curves, Damage Parameters, and Various Evaluation Concepts on the Life Prediction by the Local Approach. In Proceedings of the 2nd European Conference on Fracture, VDI-Report of Progress, Darmstadt, Germany; 1979; Volume 18. [Google Scholar]
- Bergmann, J.W. Zur Betriebsfestigkeit gekerbter Bauteile auf der Grundlage der örtlichen Beanspruchung. Dissertation, Technische Hochschule Darmstadt, 1983. [Google Scholar]
- Nihei, M.; et al. Evaluation of mean stress effect on fatigue life by use of damage parameters. Int. J. Fatigue 1986, 8, 119–126. [Google Scholar] [CrossRef]
- Wehner, T.; Fatemi, A. Effects of mean stress on fatigue behaviour of a hardened carbon steel. Int. J. Fatigue 1991, 13, 241–248. [Google Scholar] [CrossRef]
- Palmgren, A. Die Lebensdauer von Kugellagern. Zeitschrift des Vereins Deutscher Ingenieure. Band 68, Nr. 14, 1924, S. 339–341.
- Langer, B.F. Fatigue failure from stress cycles of varying amplitude. Journal of Applied Mechanics. Band 59, 1937, S. A160–A162. [CrossRef]
- Miner, M.A. Cumulative damage in fatigue. Journal of Applied Mechanics. Band 12, Nr. 3, 1945, S. 159–164. [CrossRef]
|
Disclaimer/Publisher’s Note: The statements, opinions and data contained in all publications are solely those of the individual author(s) and contributor(s) and not of MDPI and/or the editor(s). MDPI and/or the editor(s) disclaim responsibility for any injury to people or property resulting from any ideas, methods, instructions or products referred to in the content. |
© 2023 by the authors. Licensee MDPI, Basel, Switzerland. This article is an open access article distributed under the terms and conditions of the Creative Commons Attribution (CC BY) license (http://creativecommons.org/licenses/by/4.0/).

