1. Introduction
In recent times, there has been a significant shift towards using electric vehicles (EVs) in comparison to traditional fuel-based vehicles. This transition can be attributed to the limitations of conventional vehicles, such as their harmful impact on the environment due to increased pollution and reliance on non-renewable energy sources [
1,
2]. On the other hand, EVs have garnered immense popularity due to their eco-friendliness and the ability to charge them with renewable energy sources, as they can run on a direct DC supply [
3]. According to the International Energy Agency (IEA), the number of electric cars on the road exceeded 15 million in 2022, up from just a few thousand a decade ago. China has become the largest EV market, accounting for about half of the world’s EV sales [
4]. The United States and Europe are also experiencing significant growth in EV adoption, with countries like Norway and the Netherlands leading the charge. In India, the electric vehicle [
5,
6] market has experienced substantial growth, thanks to the implementation of favourable government policies and programs. It is exciting to note that between 2022 to 2030, we expect a remarkable compound annual growth rate (CAGR) of 49% for the domestic EV market in India. Despite this growth, EV adoption in India is still limited, with only 13 lakh electric vehicles currently on Indian roads as of August 2022.
1.1. Motivation
One of the biggest challenges to EV growth in India is the lack of sufficient charging stations, which leads to longer charging times and limited options for EV owners. However, a potential solution to this problem is V2V charging[
7]. V2V charging enables EV owners to transfer charge between two vehicles, reducing the need for charging stations and the burden on the grid. This technology is particularly useful in emergencies or when a vehicle is parked for an extended period. Transferring excess charge from one vehicle to another can provide a quick and convenient charging solution without requiring a traditional charging station.
Moreover, V2V charging has several potential benefits, including increasing the range of electric vehicles while on the road and reducing the need for large-scale charging infrastructure, which can be expensive and take up space. Various converters are used to transfer charge between two vehicles to build a V2V charger [
8]. One such converter is the NIBC, which has low losses, high efficiency, and fewer components, making it suitable for low-voltage-level applications. Apart from V2V charging, these converters are also helpful for V2G [
9] applications, where vehicles can charge from the grid during off-peak hours and supply power to the grid during peak hours. This technology benefits the grid and allows EV owners to get paid for transferring the charge to the grid on a kWh basis, which could incentivize more people to adopt electric vehicles. Overall, V2V charging and bi-directional converters have the potential to revolutionize the way we charge our EVs and help accelerate the adoption of EVs in India.
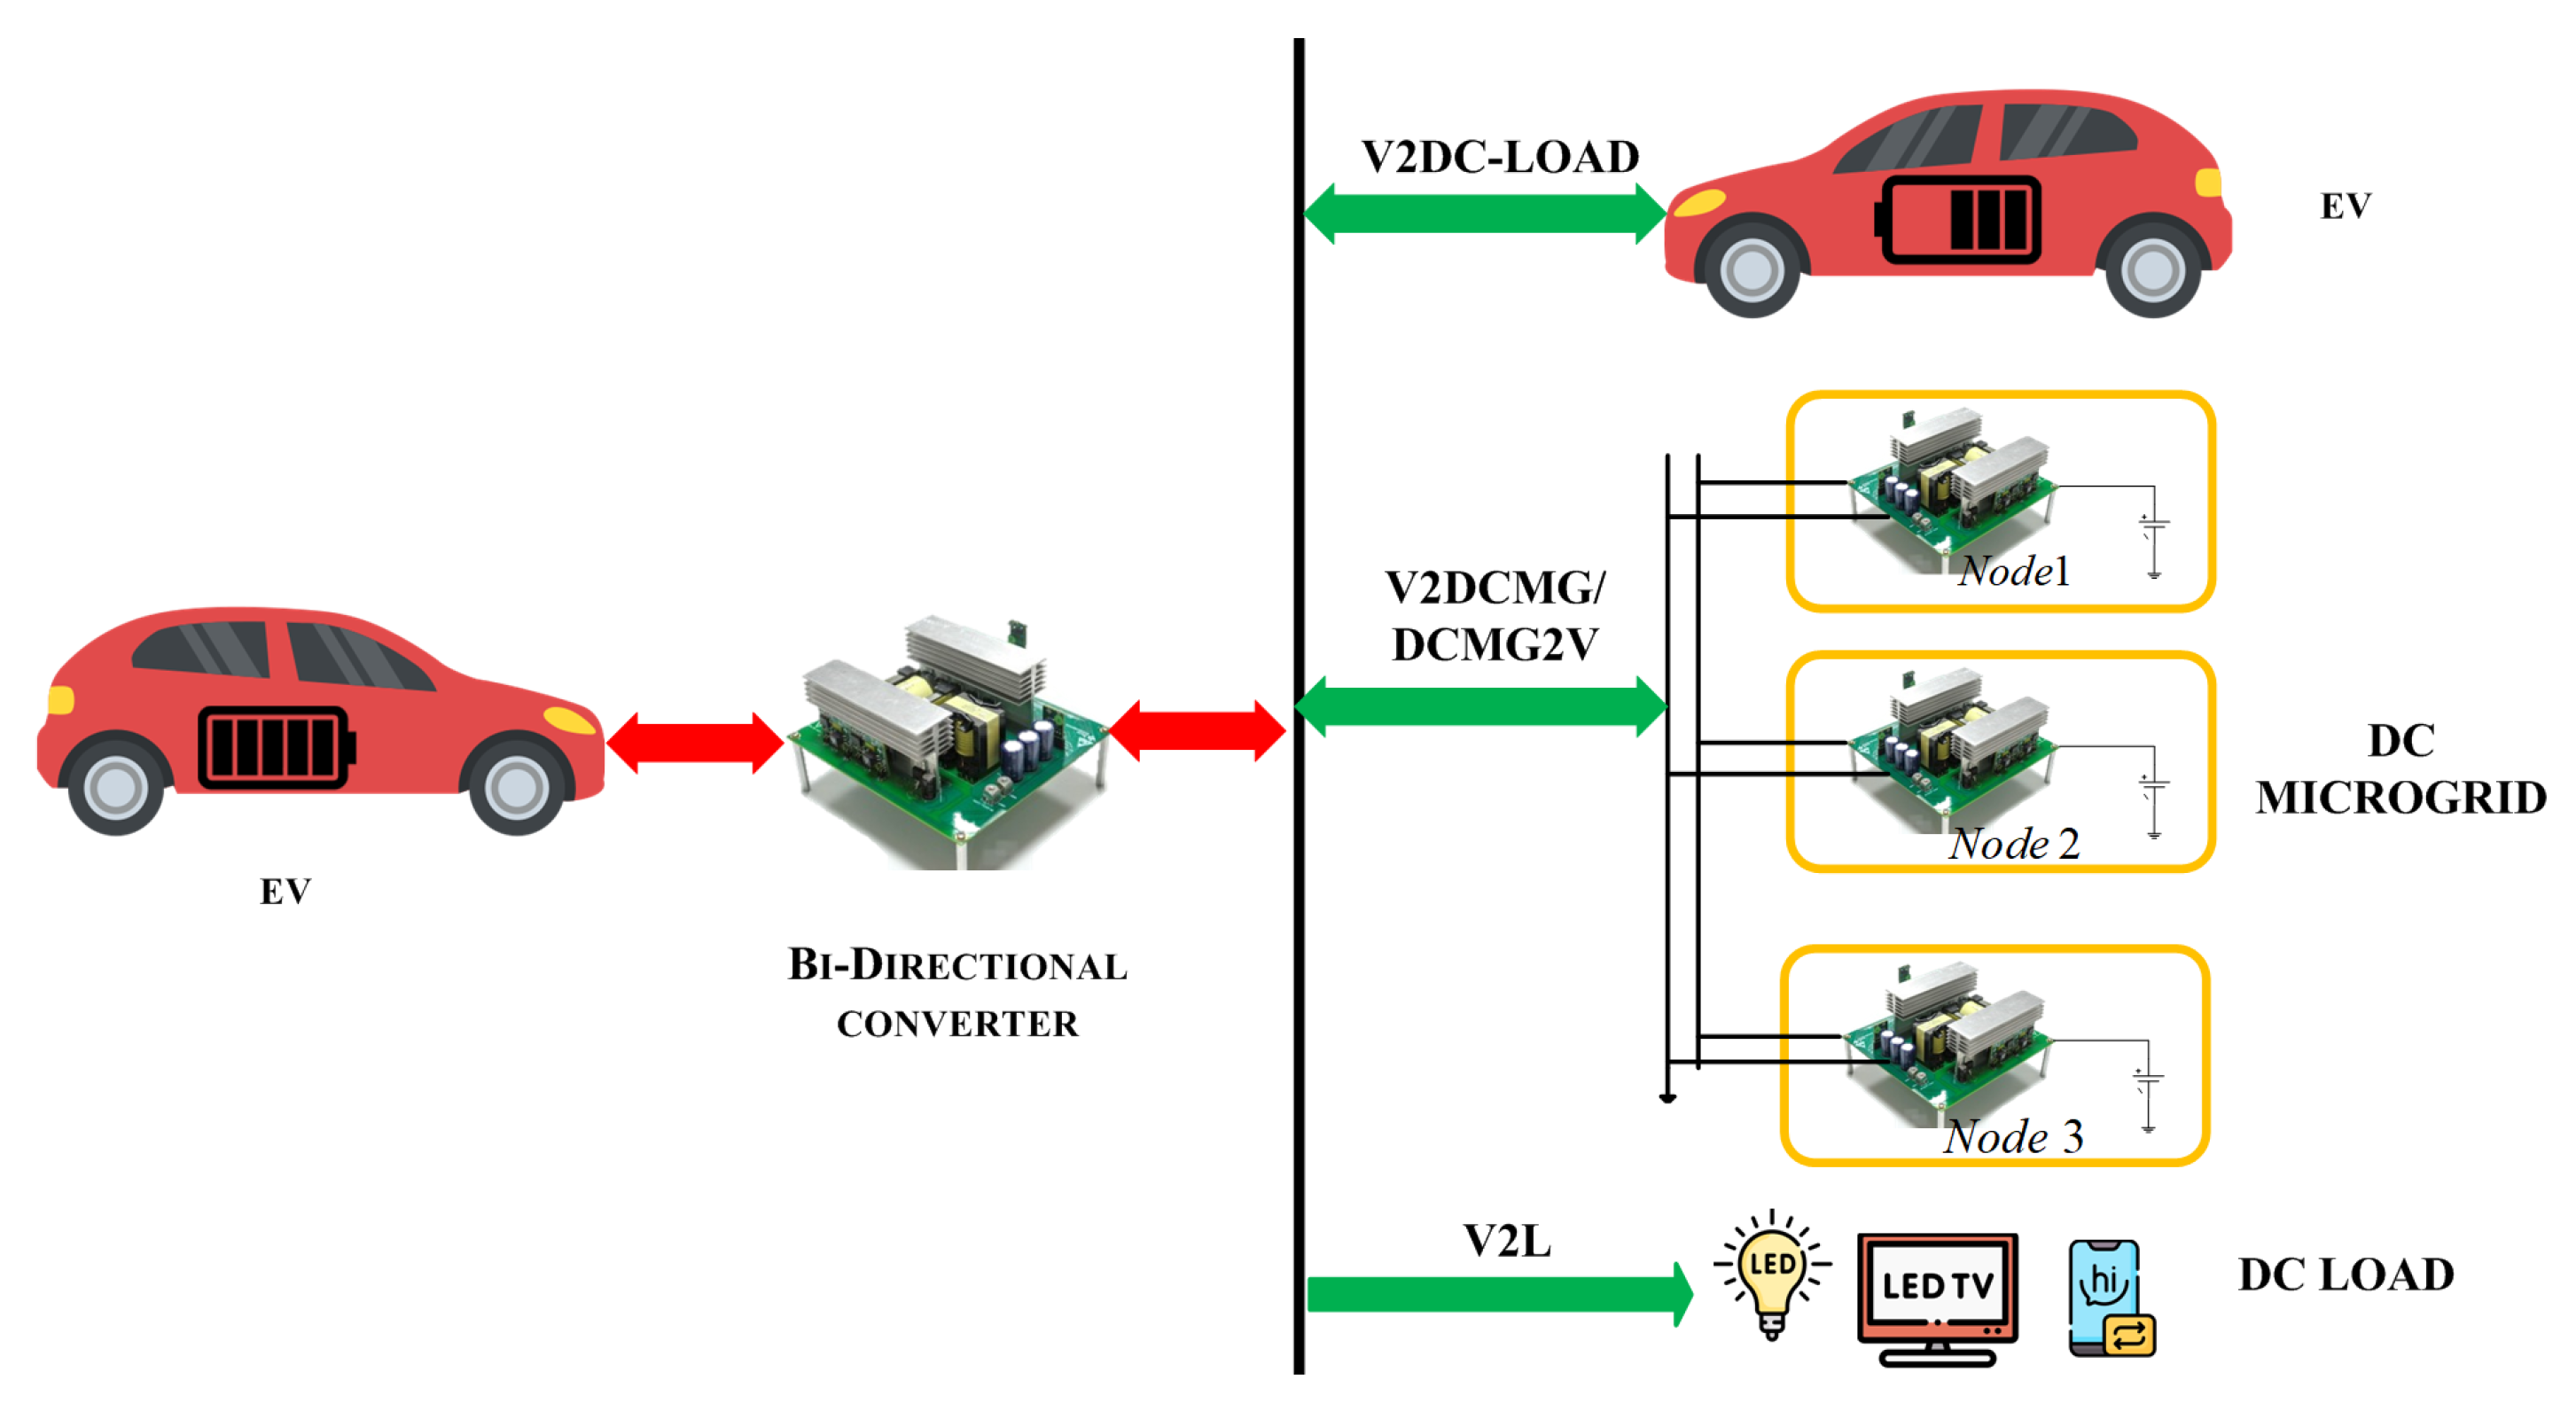
Figure 1.
Comprehensive functions of bi-directional converter .
Figure 1.
Comprehensive functions of bi-directional converter .
1.2. Literature review
The performance of switched-mode DC-DC power converters is dependent on various factors, including a more comprehensive stable operating range, high accuracy in maintaining a constant output voltage, and faster dynamic response. Achieving these parameters requires the development of effective control techniques, which can be challenging. Over the years, researchers have developed various control techniques, such as the voltage mode controller [
10], current mode controller [
11], and sliding mode controller [
12]. The most used control technique for NIBC is the proportional integral derivative (PID) based control technique [
13], which industries widely use due to its robustness and simple implementation. However, tuning PID control gains can be difficult, and gains of PID control need to be changed by altering the system parameters. Fuzzy logic control [
14] is another rule-based technique that has a more comprehensive operating range and is cheaper to implement. However, this technique has a slower response to dynamic changes, which can destabilize the system. In recent years, researchers have shown interest in the ANN-based control technique [
15], a data-driven control technique that does not depend on system parameters. This technique decreases inaccuracy and improves the system’s stability, with a faster response to dynamic changes. In [
16], the ANN-based control algorithm showed better results than other controlling techniques. With its ability to adapt to different operating conditions, ANN-based control techniques can potentially revolutionize how we control switched-mode DC-DC power converters.
While traditional control techniques such as PID control will continue to be used in industries, data-driven control techniques such as ANN are the future of power converter control. This paper presents a novel approach for V2V and V2G charging using a deep learning neural network (DNN) based controller with a non-isolated bidirectional converter (NIBC).
1.3. Key contributions:
- 1.
The design of a highly efficient, modular bi-directional converter for V2V charging.
- 2.
Design of DNN-based closed-loop control for Bi- directional V2V and V2G charger.
- 3.
Elimination of PI control and its comparison with proposed technology.
1.4. Organization:
This paper presents a comprehensive analysis of a NIBC for V2V charging and is structured as follows: In Section II, the operation of the converter in both charging and discharging modes is explained. Section III outlines the proposed design for the converter’s controller. Section IV presents the simulation results of the bidirectional converter with the PID controller, and we also discuss the real-time implementation of V2V charging using deep learning techniques.
2. Section II - Operation of NIBC
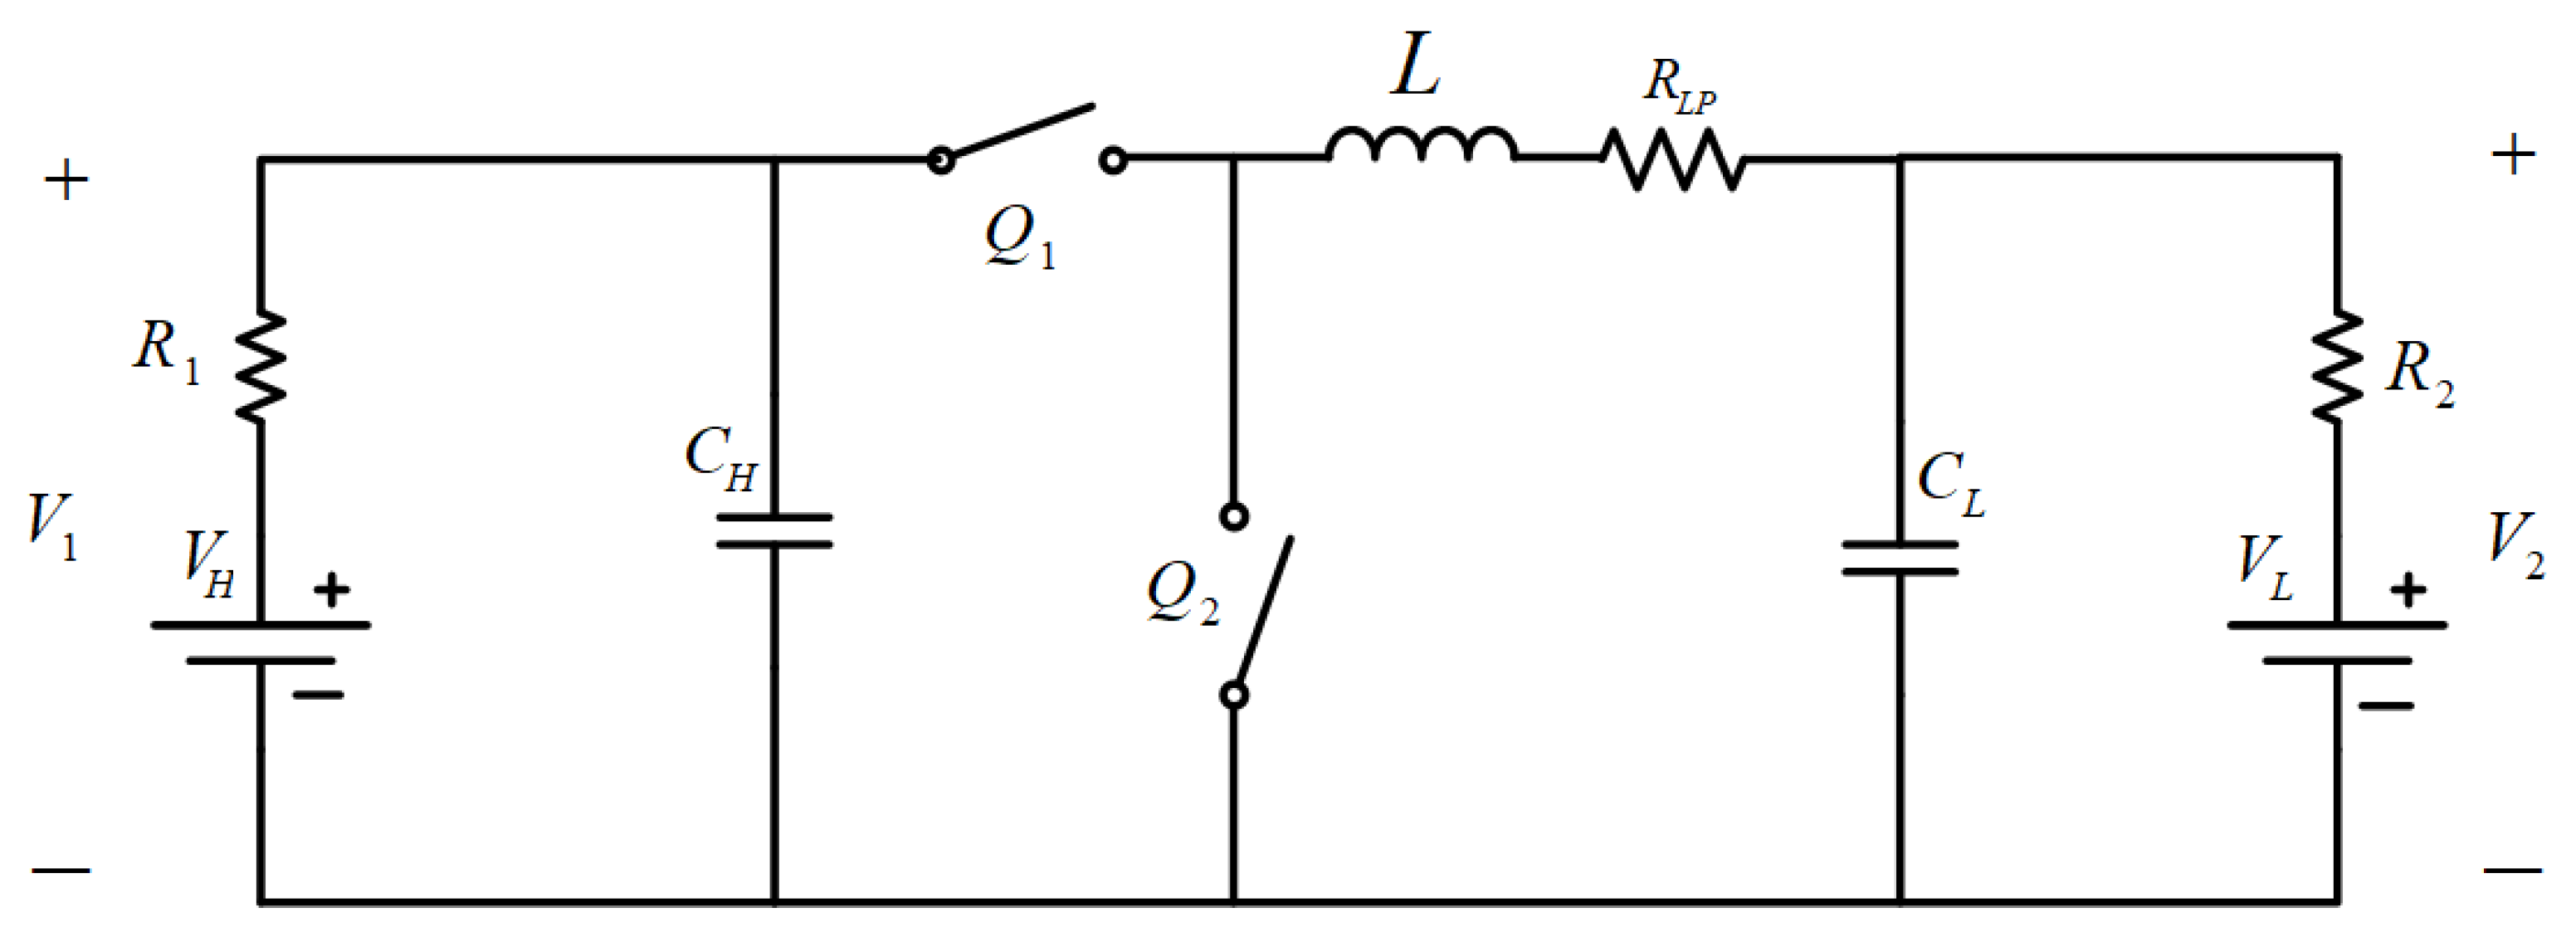
The NIBC (Non-Isolated Bidirectional Converter) is a circuit that consists of several components, including two switches (
and
) with an on-state resistance
, an inductor (L) with an internal resistance of
, and capacitors on both sides of the source to filter out voltage variations (
and
). The two batteries, HV (High Voltage
) and LV (Low Voltage
), are connected at either side of the converter. The HV battery, with an internal resistance of
, and the LV battery, with an internal resistance of
, form two voltage sources,
and
, respectively, as shown in
Figure 2. The converter can operate in two modes: charging and discharging. In charging mode, the HV side battery charges the LV side battery. In contrast, in discharging mode, the LV side battery charges the HV side battery. Understanding these modes is crucial to developing a control strategy for the NIBC.
The operation of two modes are explained below:
2.1. Mode I:
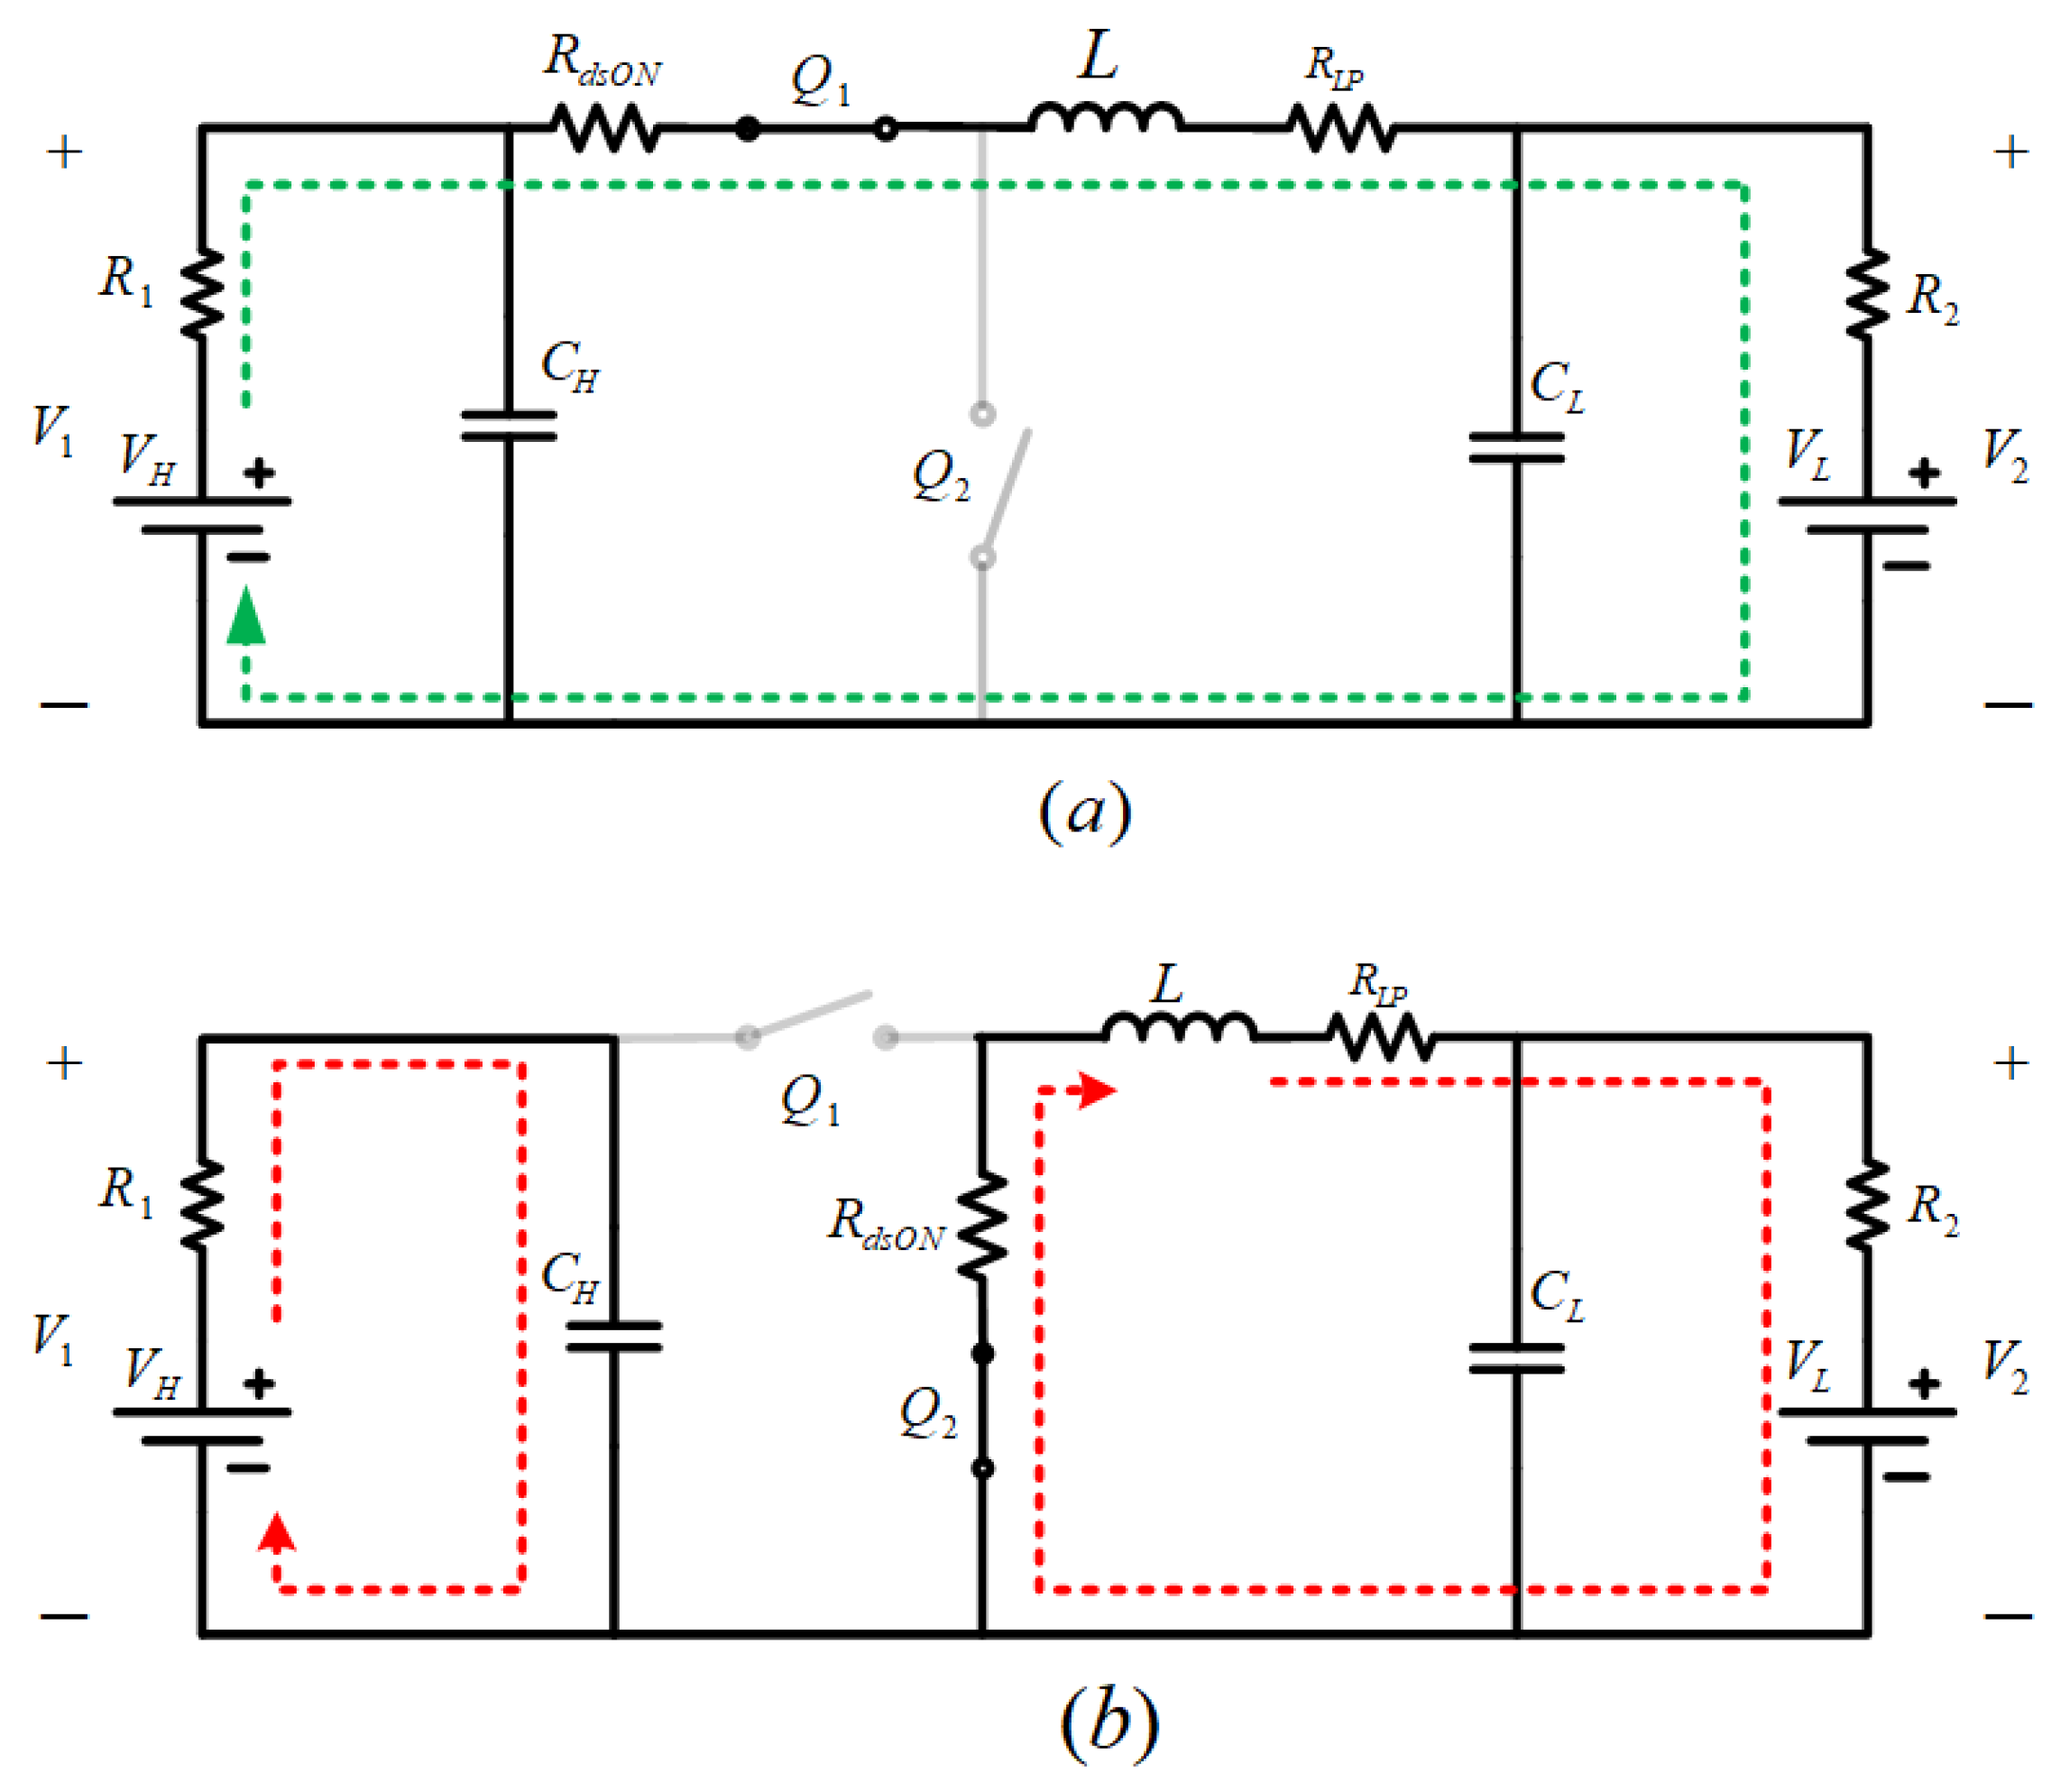
During this mode, the HV side battery charges the LV side battery, operating as a buck mode. When the
switch is turned on, inductor L accumulates energy during the on period.
remains on for the DTs period, and the current flows from
-
-L-
-
, as illustrated in
Figure 3a. When
is turned off, the energy stored in the inductor is transferred to the LV side by turning on the
switch.
remains off for the (1-D) Ts period, and the current flows from L-
-
-L, as illustrated in
Figure 3b.
2.2. Mode II:
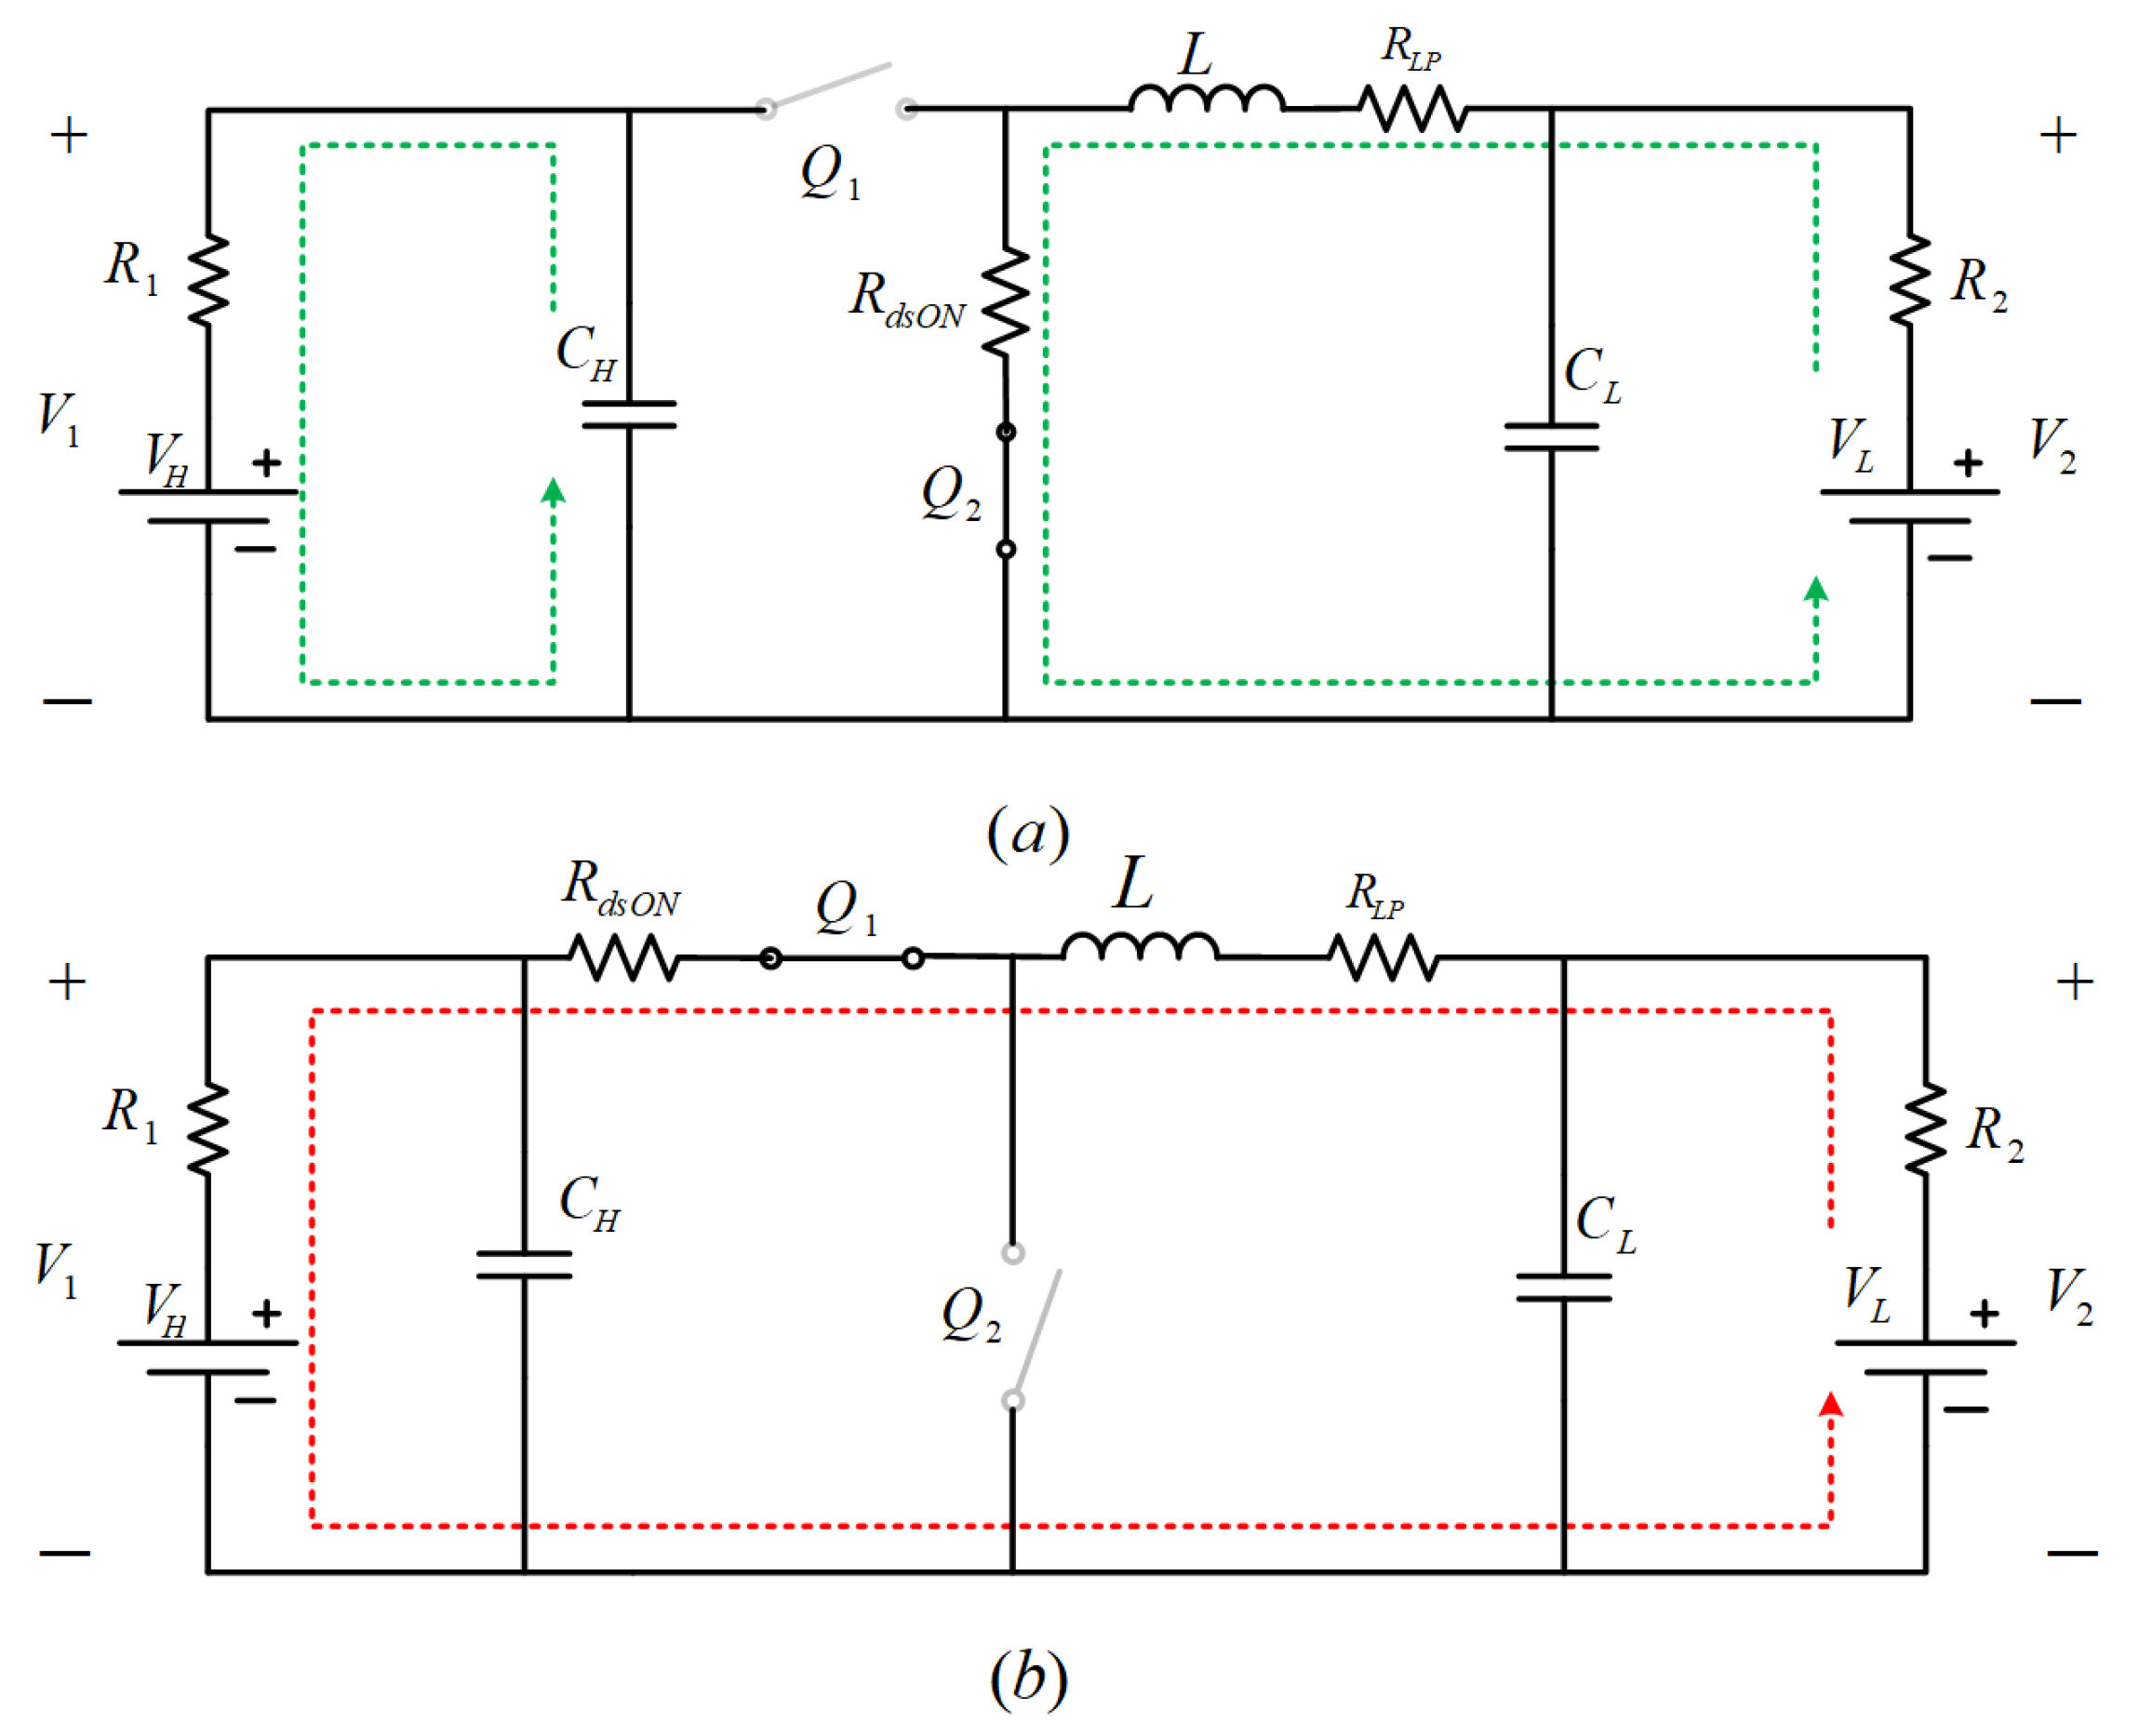
During this mode of operation, the LV side battery charges the HV side battery in a boost mode of operation. Inductor L accumulates energy from the LV side battery when
is turned on. During this period, the
capacitor charges the HV side battery. The
switch remains on for the duration of DTs. The current path during this period is
-L-
-
and
-
-
, as depicted in
Figure 4a. When
is turned off, the energy stored in the inductor and the LV side battery combine to charge the HV side battery by turning on the
switch. The
switch remains off for the duration of (1-D) Ts. The current path during this period is
-L-
-
-
, as shown in
Figure 4b.
Designing a controller requires the small-signal modelling of the converter. The small-signal model for a DC-DC converter is a linearized representation of the converter around an operating point. It is used to design control systems that can regulate the converter’s output and achieve the desired performance.
To create a small-signal model for a DC-DC converter, we typically begin with the nonlinear equations that describe the converter’s behaviour, such as the current and voltage equations for the inductor and capacitor. We then linearize these equations around an operating point, which is usually the steady-state point of the converter.
From the above modes of operation, whether in charging or discharging mode, only two sub-intervals take place when Q1 and Q2 are on. The nonlinear equations for the two modes are similar. Therefore, the steady-state representation of the charging mode is:
Buck mode(Off):
Dynamic model consists of steady state representation and small signal model Now substituting :
Now, differentiation of steady state values is zero and product of small signal models are neglected i.e.,
and
then the state space representation becomes:
so, the above state space is represented as:
The linearized equations resulting from the small signal model provide a description of the converter’s behavior near the operating point, enabling the design of a controller to regulate the inductor current. Typically, the controller adjusts the converter’s duty cycle based on the difference between the desired and actual current, to achieve the desired response.
The small signal model is represented by a transfer function that relates the converter’s duty cycle to the desired output. This transfer function can be used to design a controller using control theory techniques, such as pole placement or optimal control.
3. Controller design
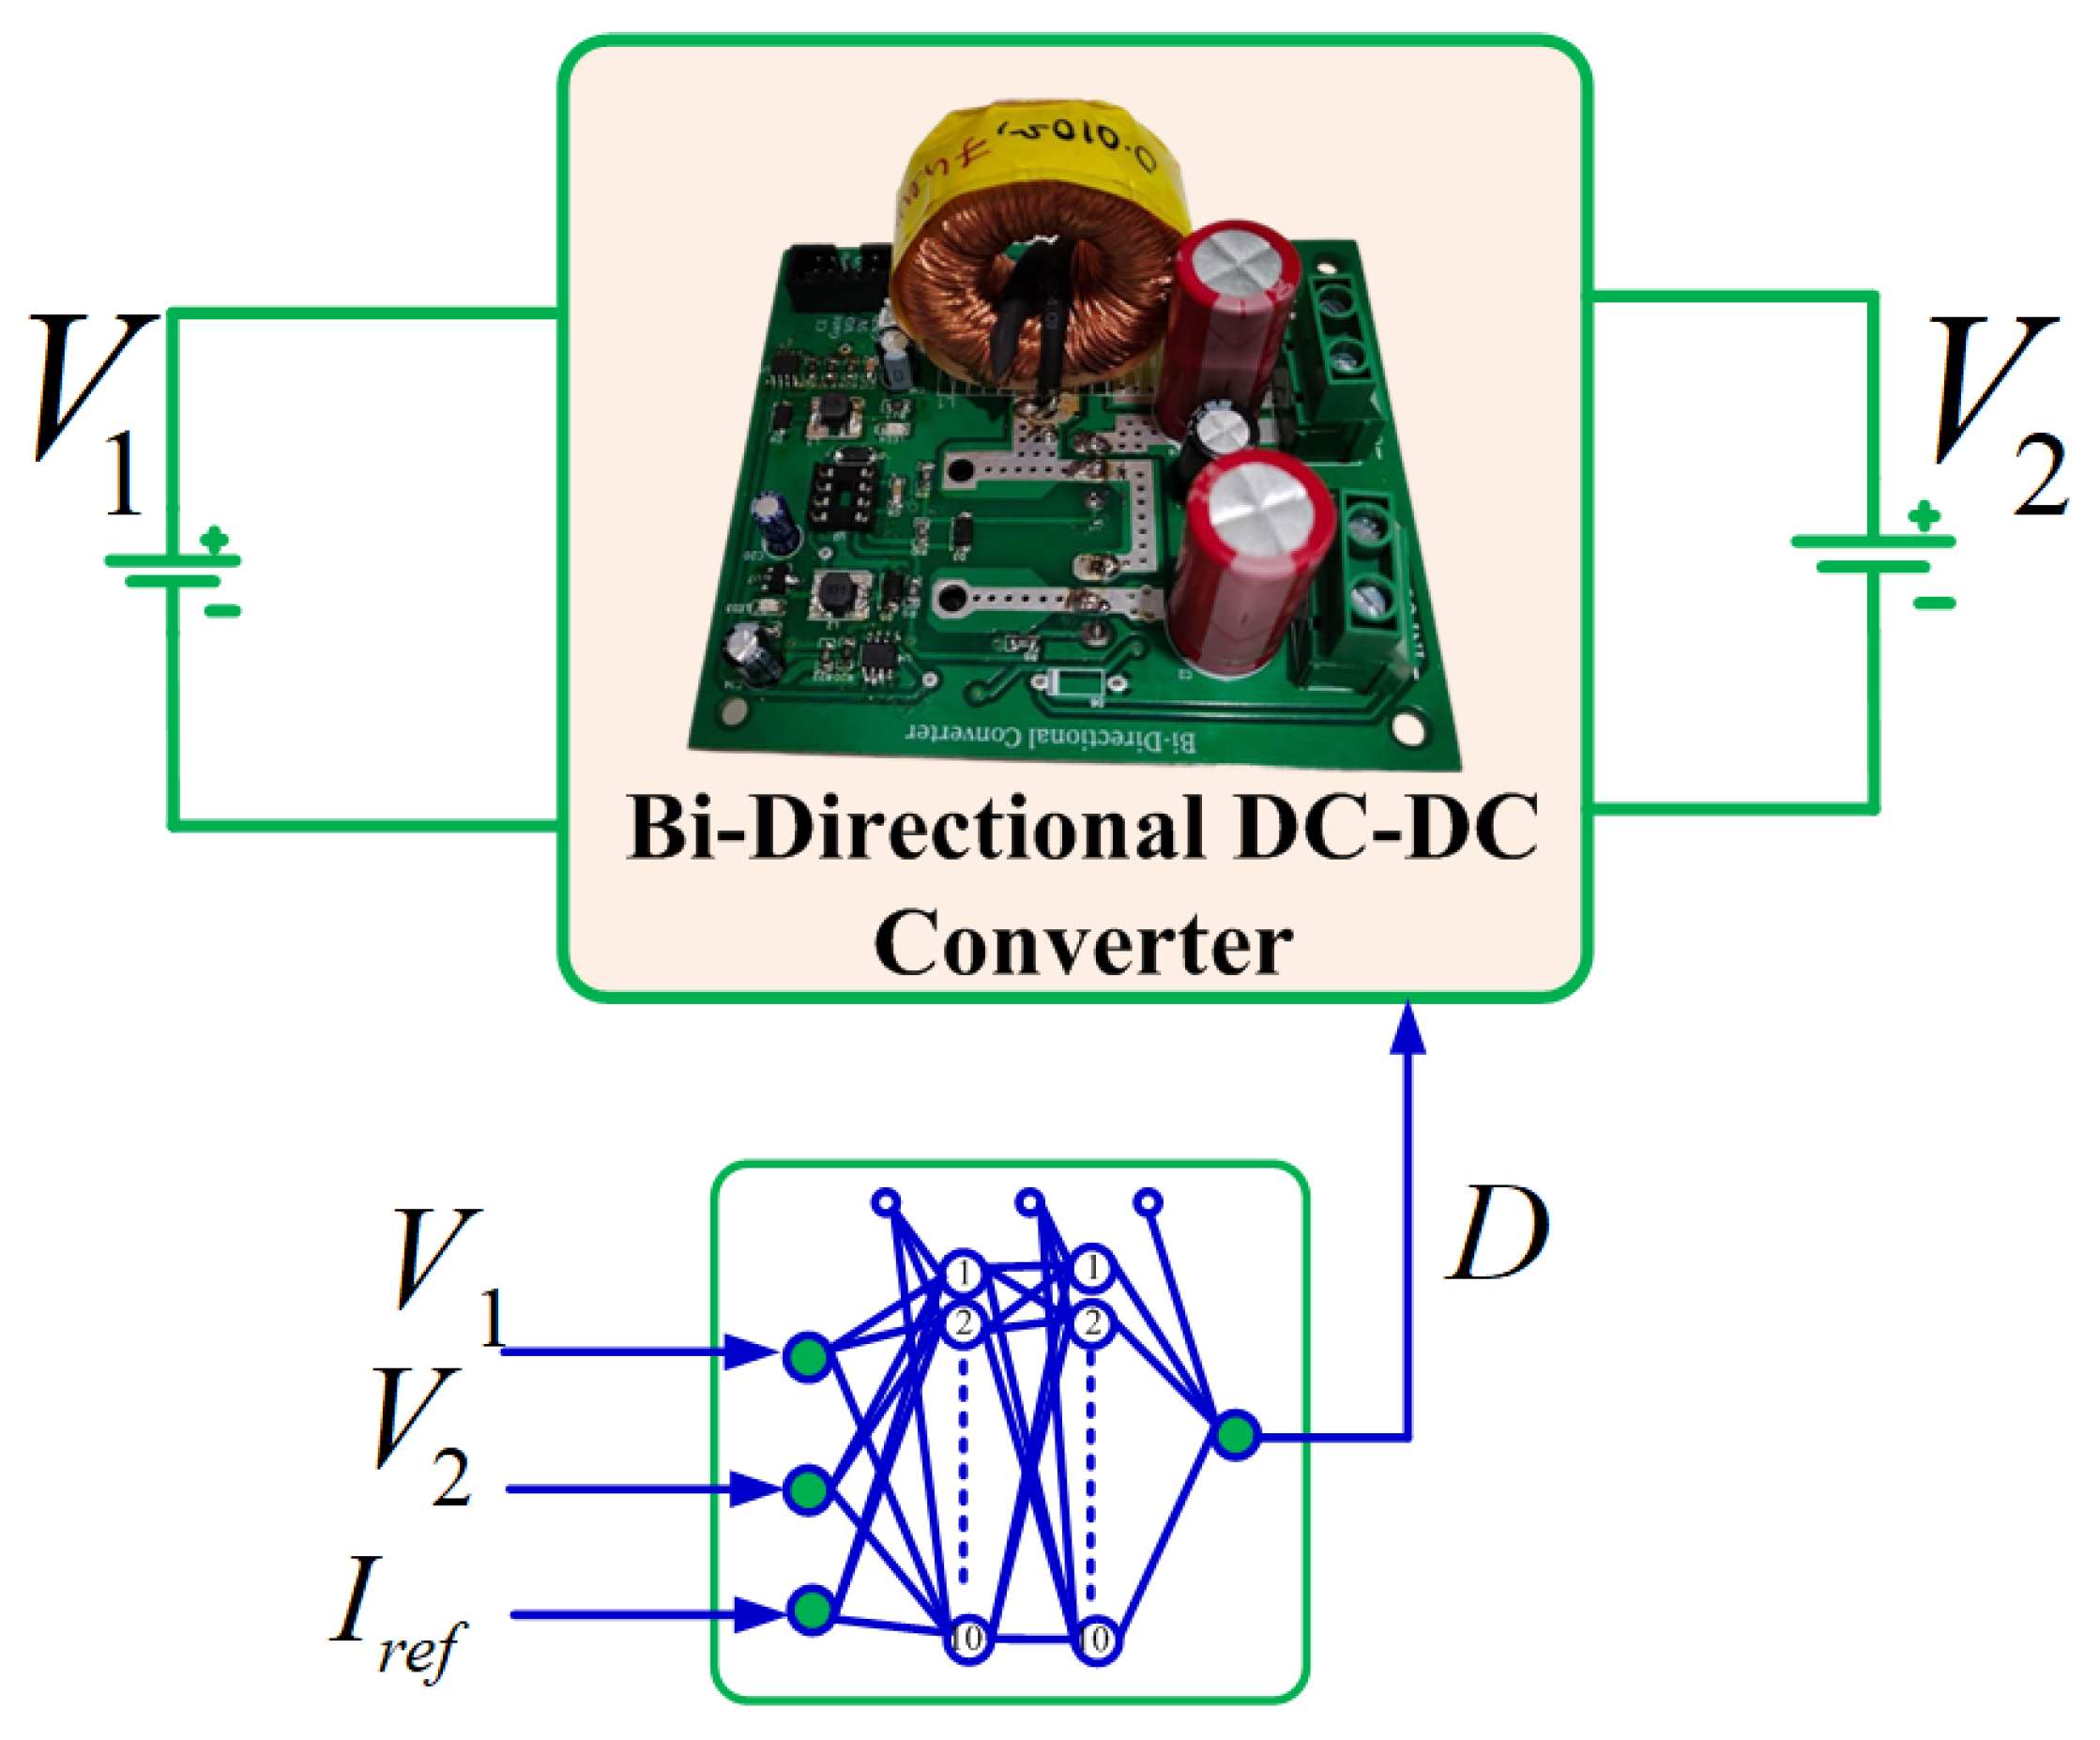
We have designed a control system based on a deep neural network (DNN), as depicted in
Figure 5, to enable bidirectional flow in the converter. This controller produces a duty cycle based on the HV side battery voltage, LV side battery voltage, and current reference. The microcontroller then feeds this duty cycle to the converter [
17]. The converter generates two complementary pulses based on the received duty cycle using the driver, which drives the switches in the converter, enabling them to work as intended. This DNN-based control design offers several benefits, such as improved accuracy, faster response time, and enhanced stability, making it an excellent option for various applications. By integrating the latest developments in deep learning and control systems design, this control technique opens up opportunities for more efficient and dependable converter operation
The DNN network comprises three inputs and one output, with the output being dependent on these three inputs, as shown in Equation (
10):
The power flow through the converter heavily relies on the duty cycle and direction of the current. Therefore, we have implemented a DNN-based control design to determine the duty cycle required for efficient converter operation. The duty cycle is based on two instances, which are discussed below
The first instance involves setting high and low limits for the two battery voltages. The DNN generates the duty cycle based on these limits, and the converter operates either in charging or discharging mode, depending on the battery voltages. The converter is in charging mode when the HV side battery voltage is higher than , and the LV side battery voltage is lower than . Conversely, if the HV side battery voltage is lower than , and the LV side battery voltage is higher than . the converter operates in discharging mode. However, this instance is rare, as the converter’s operation mainly depends on the current reference.
In the second instance, the DNN generates the duty cycle based on the current reference, which determines the mode of operation. If the current reference is positive, the converter operates in a buck or charging mode, with the HV side battery charging the LV side battery. On the other hand, if the current reference is negative, the converter operates in boost or discharging mode, with the LV side battery charging the HV side battery. Therefore, the DNN-based control design ensures that the bi-directional converter operates smoothly and efficiently, with minimal loss of power during the transition between different modes of operation.
3.1. Training and testing of proposed DNN controller:
To design a controller capable of managing a broader operating range and delivering a quicker dynamic response to the system, it is essential to consider datasets that reflect uncertainties and disturbances present in real-world scenarios. Although datasets created with past historical data can be helpful, they may not accurately reflect the uncertainties in real-time setups. To overcome this limitation, we used MATLAB software to simulate the converter and generate datasets that incorporate all uncertainties and disturbances present in the system. By incorporating this data into our models, we can design more robust and effective controllers that perform well in real-world situations. The generated datasets include both normal and abnormal data, enabling us to develop more comprehensive models that can handle a wide range of scenarios.
3.1.1. Hyper parameter selection:
Hyperparameter selection involves choosing the appropriate number of epochs, activation function, weight update rule, and network architecture parameters to train an effective neural network model that minimizes error. The activation function introduces nonlinearities in the system and improves the trained model’s efficiency for non-linear systems. Among the available activation functions,sigmoid (), tanh () and ReLU () are the most used.
TThe weight update policy minimizes the error between the obtained and reference output. Optimizers such as stochastic gradient descent (SGD), adaptive moment estimation (ADAM), and root mean square propagation (RMSprop) are generally used for weight updating policy.
Selecting the right hyperparameters is crucial for developing efficient deep-learning models. Root mean square error (RMSE) is a commonly used metric for evaluating the models’ performance, which measures the difference between the predicted and actual values. Choosing the optimal combination of optimization techniques and activation functions is essential for optimal performance.
Table 1 provides a list of RMSE values for different combinations of these techniques and functions, with each epoch consisting of a single weight update. The RMSE values are reported for 50, 100, and 150 epochs, providing a comprehensive overview of each combination’s performance. By selecting the combination with the lowest RMSE value, we can determine the optimal hyperparameters for our deep-learning model.
According to Table 1, the ReLU activation function with SGD optimization function gives a lower RMSE compared to other combinations.
The collected dataset contains a diverse range of values, and normalizing the data between -1 to +1 or 0 to 1 is necessary for accurate and reliable analysis. The normalization process is typically done using standard scalar and min-max functions. In our case, we opted for the min-max function to normalize the data from 0 to 1 to enhance our data analysis and interpretation.
The scaled input is given in (11)
where
represents the current input value of parameter x
represents the minimum value of x and
represents the maximum value of x
After scaling the data, we divided it into three sections for optimal utilization. The training process used 70% of the data, while 15% was used for validation and another 15% for testing. This approach helped us achieve an optimal balance between training the model, validating its performance, and testing its accuracy, ensuring the model’s predictions were reliable.
3.2. Algorithm
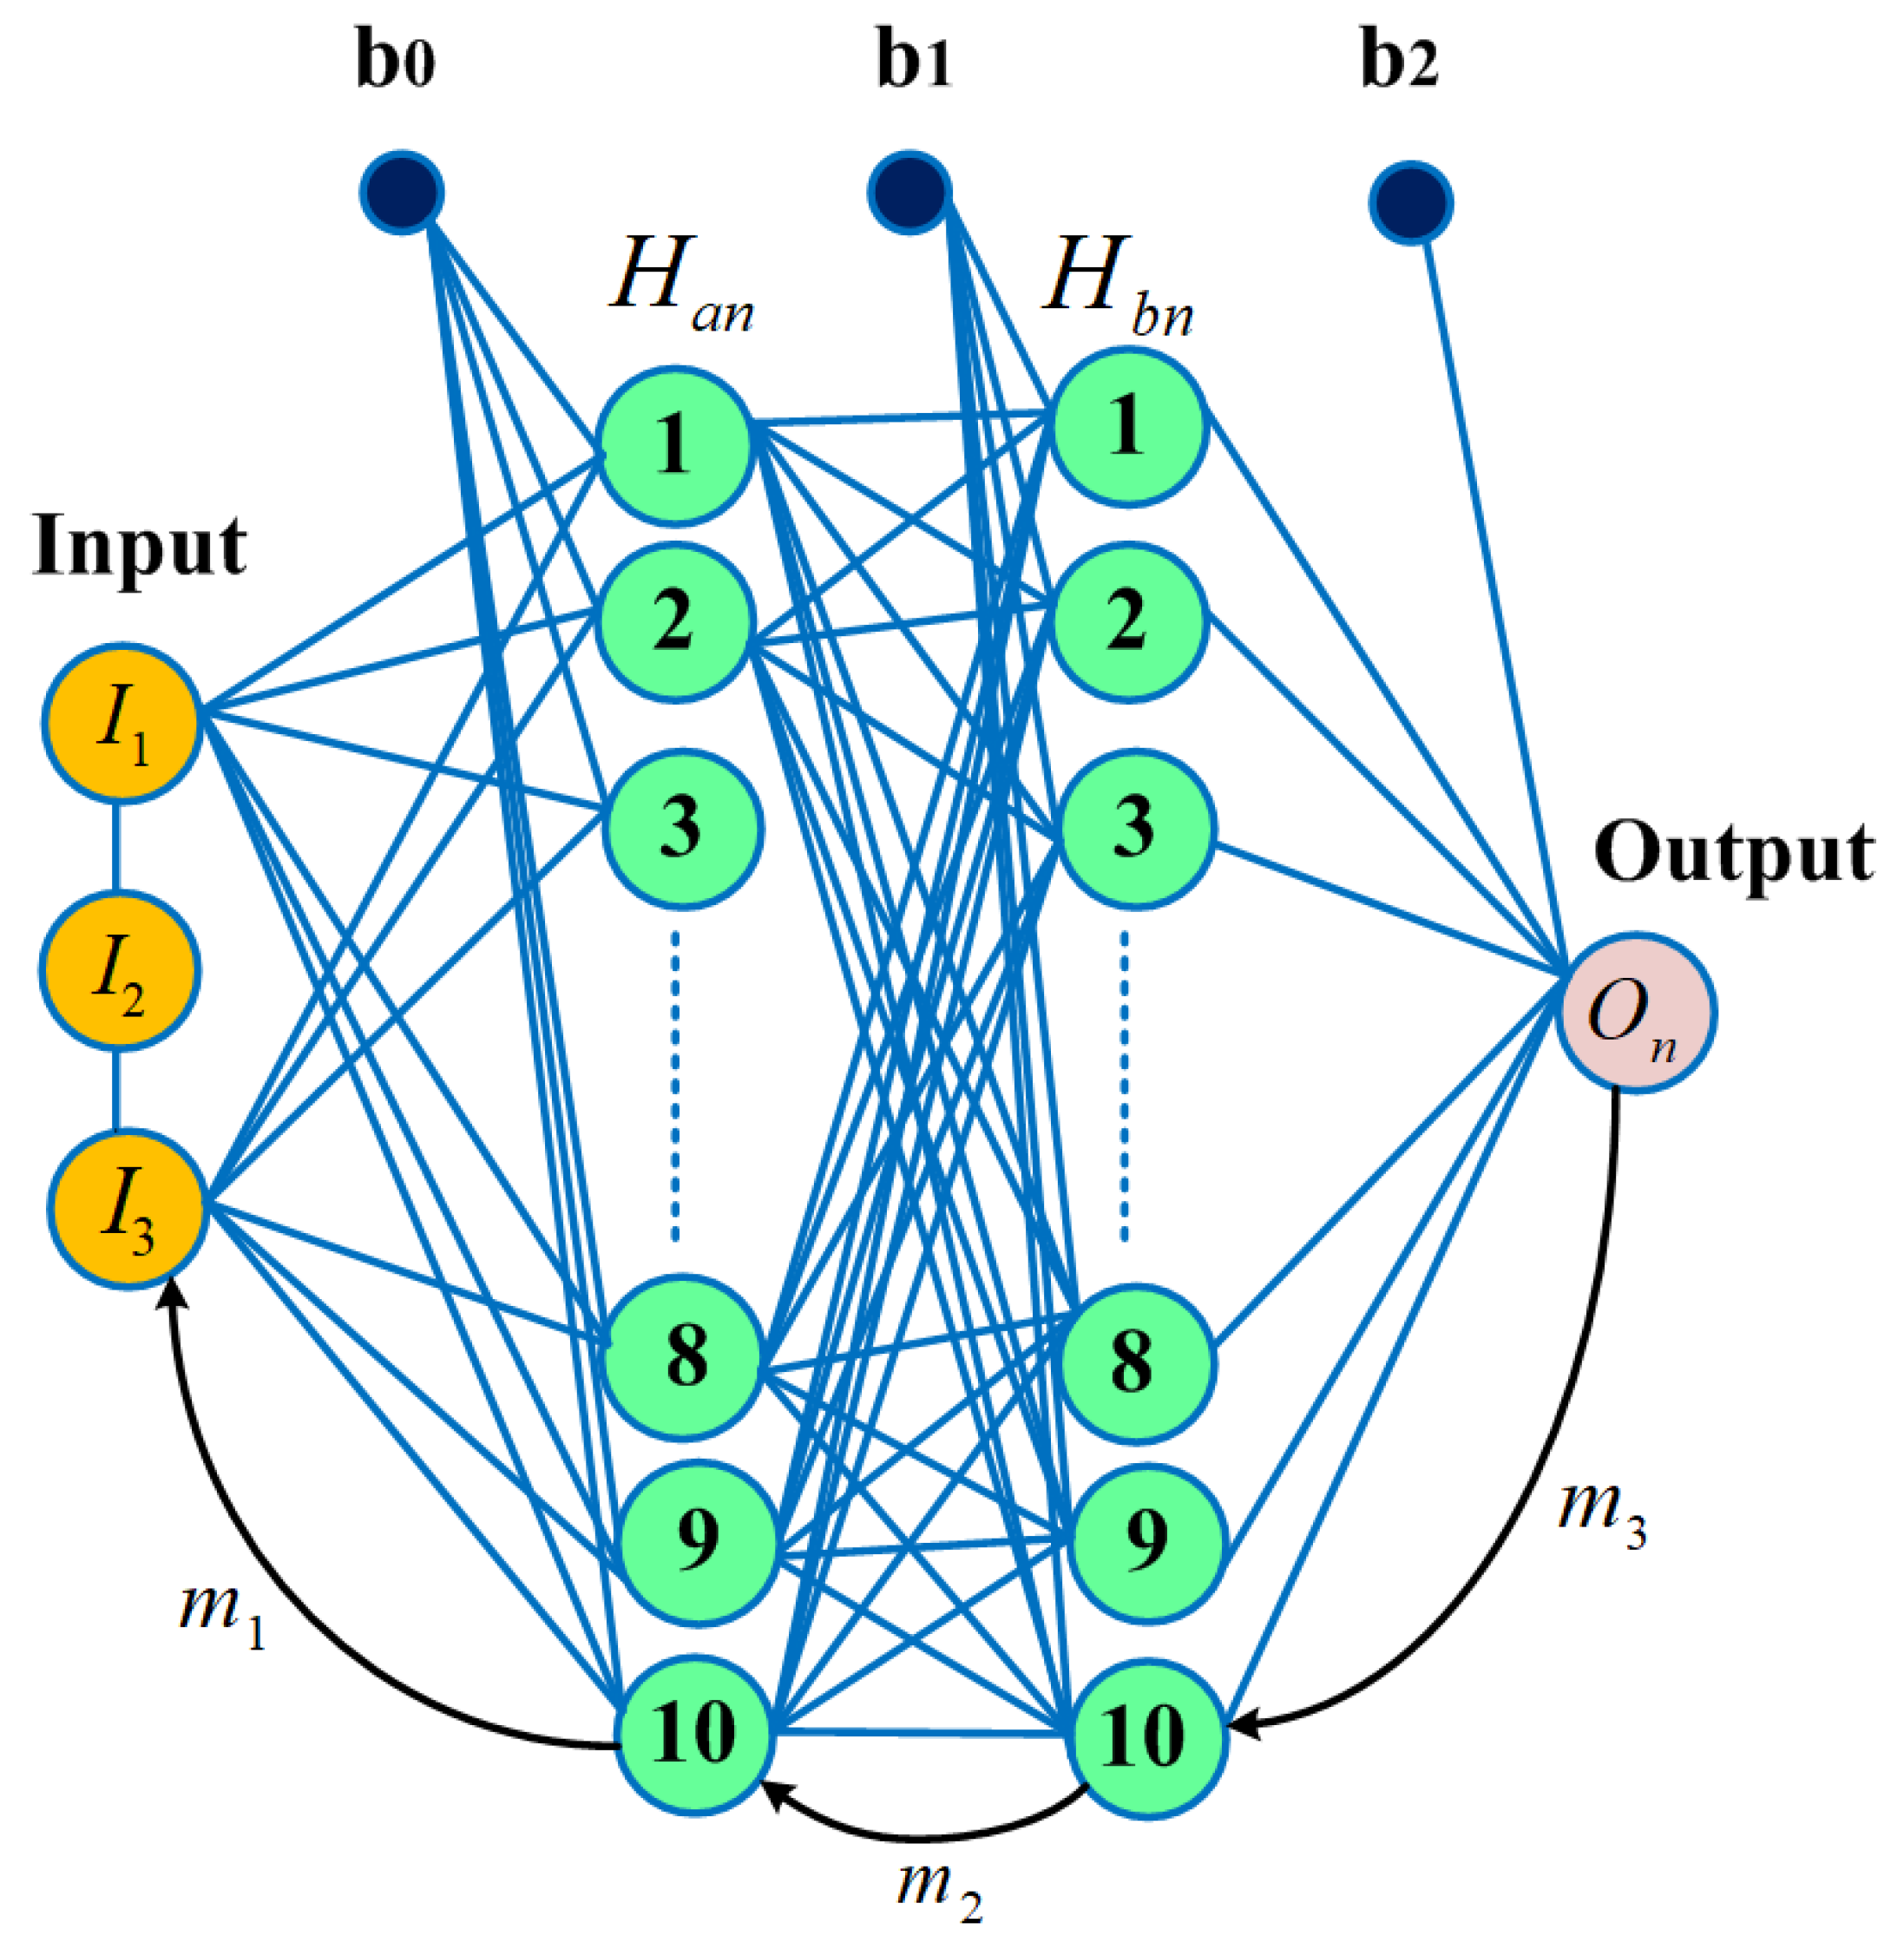
The DNN model comprises four layers, with one input layer consisting of three input nodes denoted as "
", while two hidden layers with ten nodes each represented as "
" and "
," respectively. The output layer with one output node is indicated as "
". The weight parameters between "
" and "
," "
" and "
," and "
" and "
,"are represented by m1, m2, and m3, respectively, as shown in
Figure 6.
To predict the output , the proposed model begins by learning parameters of , , and , which are used as initial conditions. Equations (12), (13), and (14) show the output prediction.
The model is trained using the ReLU activation function and SGD optimization function, which yields better results compared to other combinations.
The RMSE metric is used for performance evaluation of proposed model and is shown in (15)
The cost function is used to minimize RMSE between predicted and output value and is shown in (16)
Stochastic Gradient Descent (SGD) selects a small subset of training data from the entire training state space randomly. As a result, the time taken for a single weight update iteration in SGD is significantly lower compared to gradient descent (GD).
In general, the weight update for Input and hidden layer is (16)
The weight update for bias is given in (17)
To ensure the accuracy and robustness of a DNN model, the model parameters are typically trained over multiple epochs. After the training is complete, the resulting model is tested and validated to assess its performance on new, unseen data. This iterative training, testing, and validation process allows fine-tuning of the model to achieve better results and improve its predictive power.
4. Results
In this section, we evaluate the performance of a bi-directional converter using two different controllers, namely PID and DNN. The performance of the bi-directional converter with the PID controller was simulated using MATLAB Simulink. Meanwhile, a real-time setup was used to evaluate the bi-directional converter with the DNN controller. We discuss the performance of these two different controllers in detail below.
4.1. PID Controller:
A MATLAB simulation was conducted on a bi-directional converter with a PID controller for both charging to discharging and discharging to charging operations. For the charging operation, we used a positive current reference, and for the discharging operation, we used a negative current reference. The simulation results are presented below:
4.1.1. Charging to discharging mode:
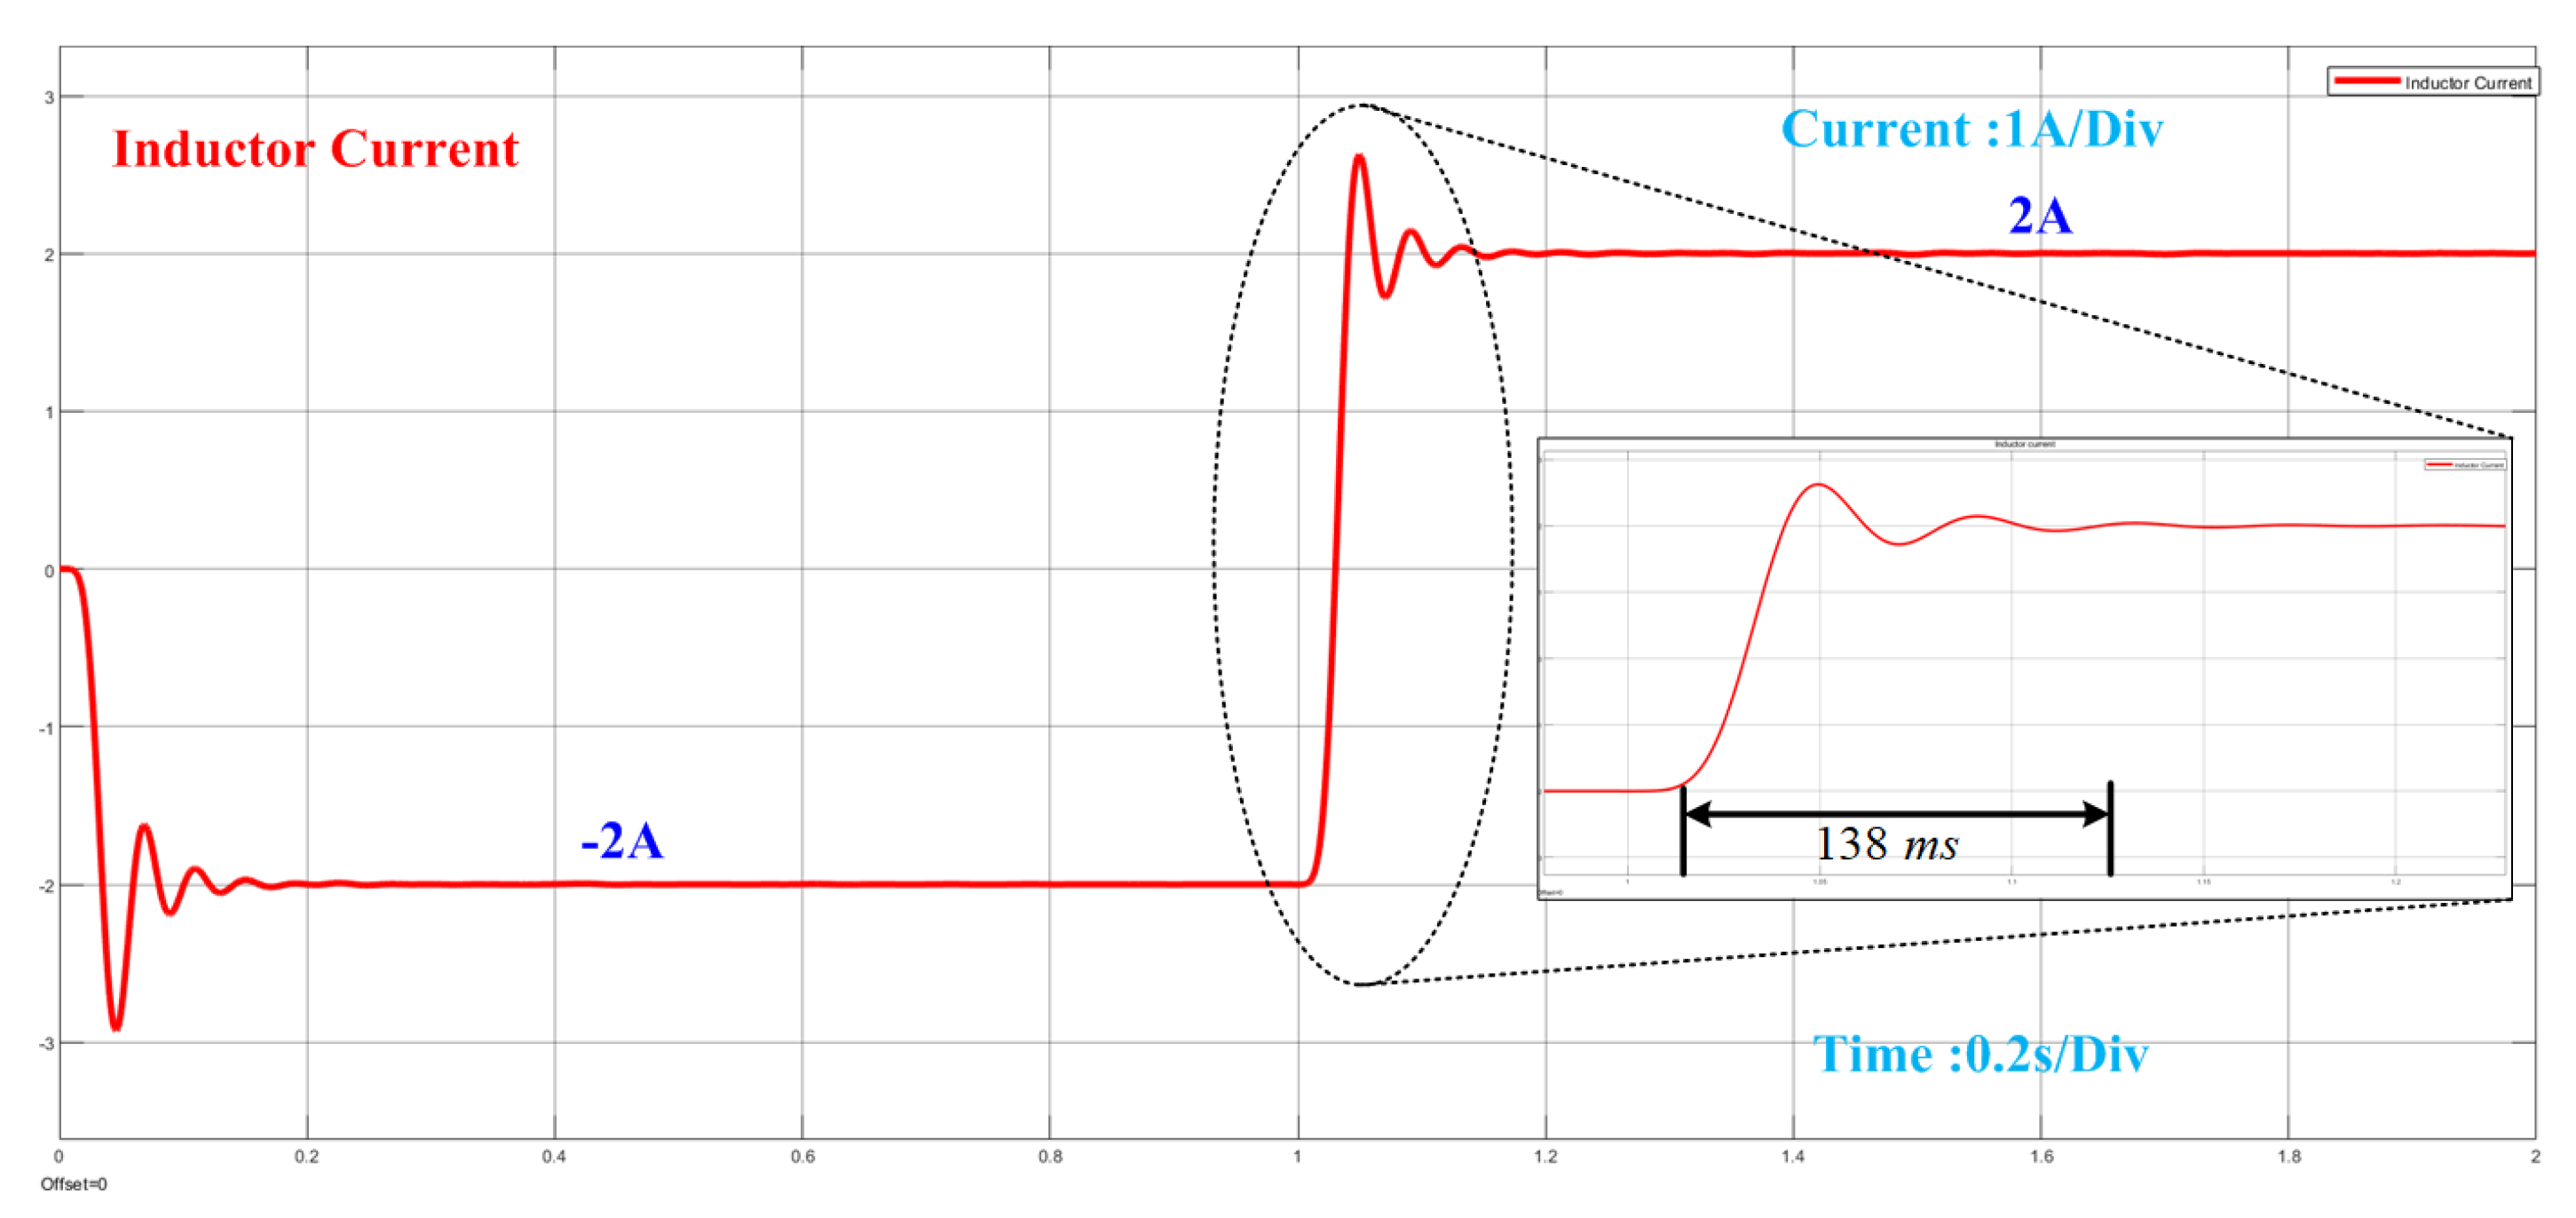
In this case, by altering the current reference from -2A to 2A, we successfully transitioned the operation of the bi-directional converter from charging to discharging mode using the PID controller. The inductor current in the bi-directional converter reached the new reference value in a mere 138ms, as shown in
Figure 7.
4.1.2. Discharging to charging mode:
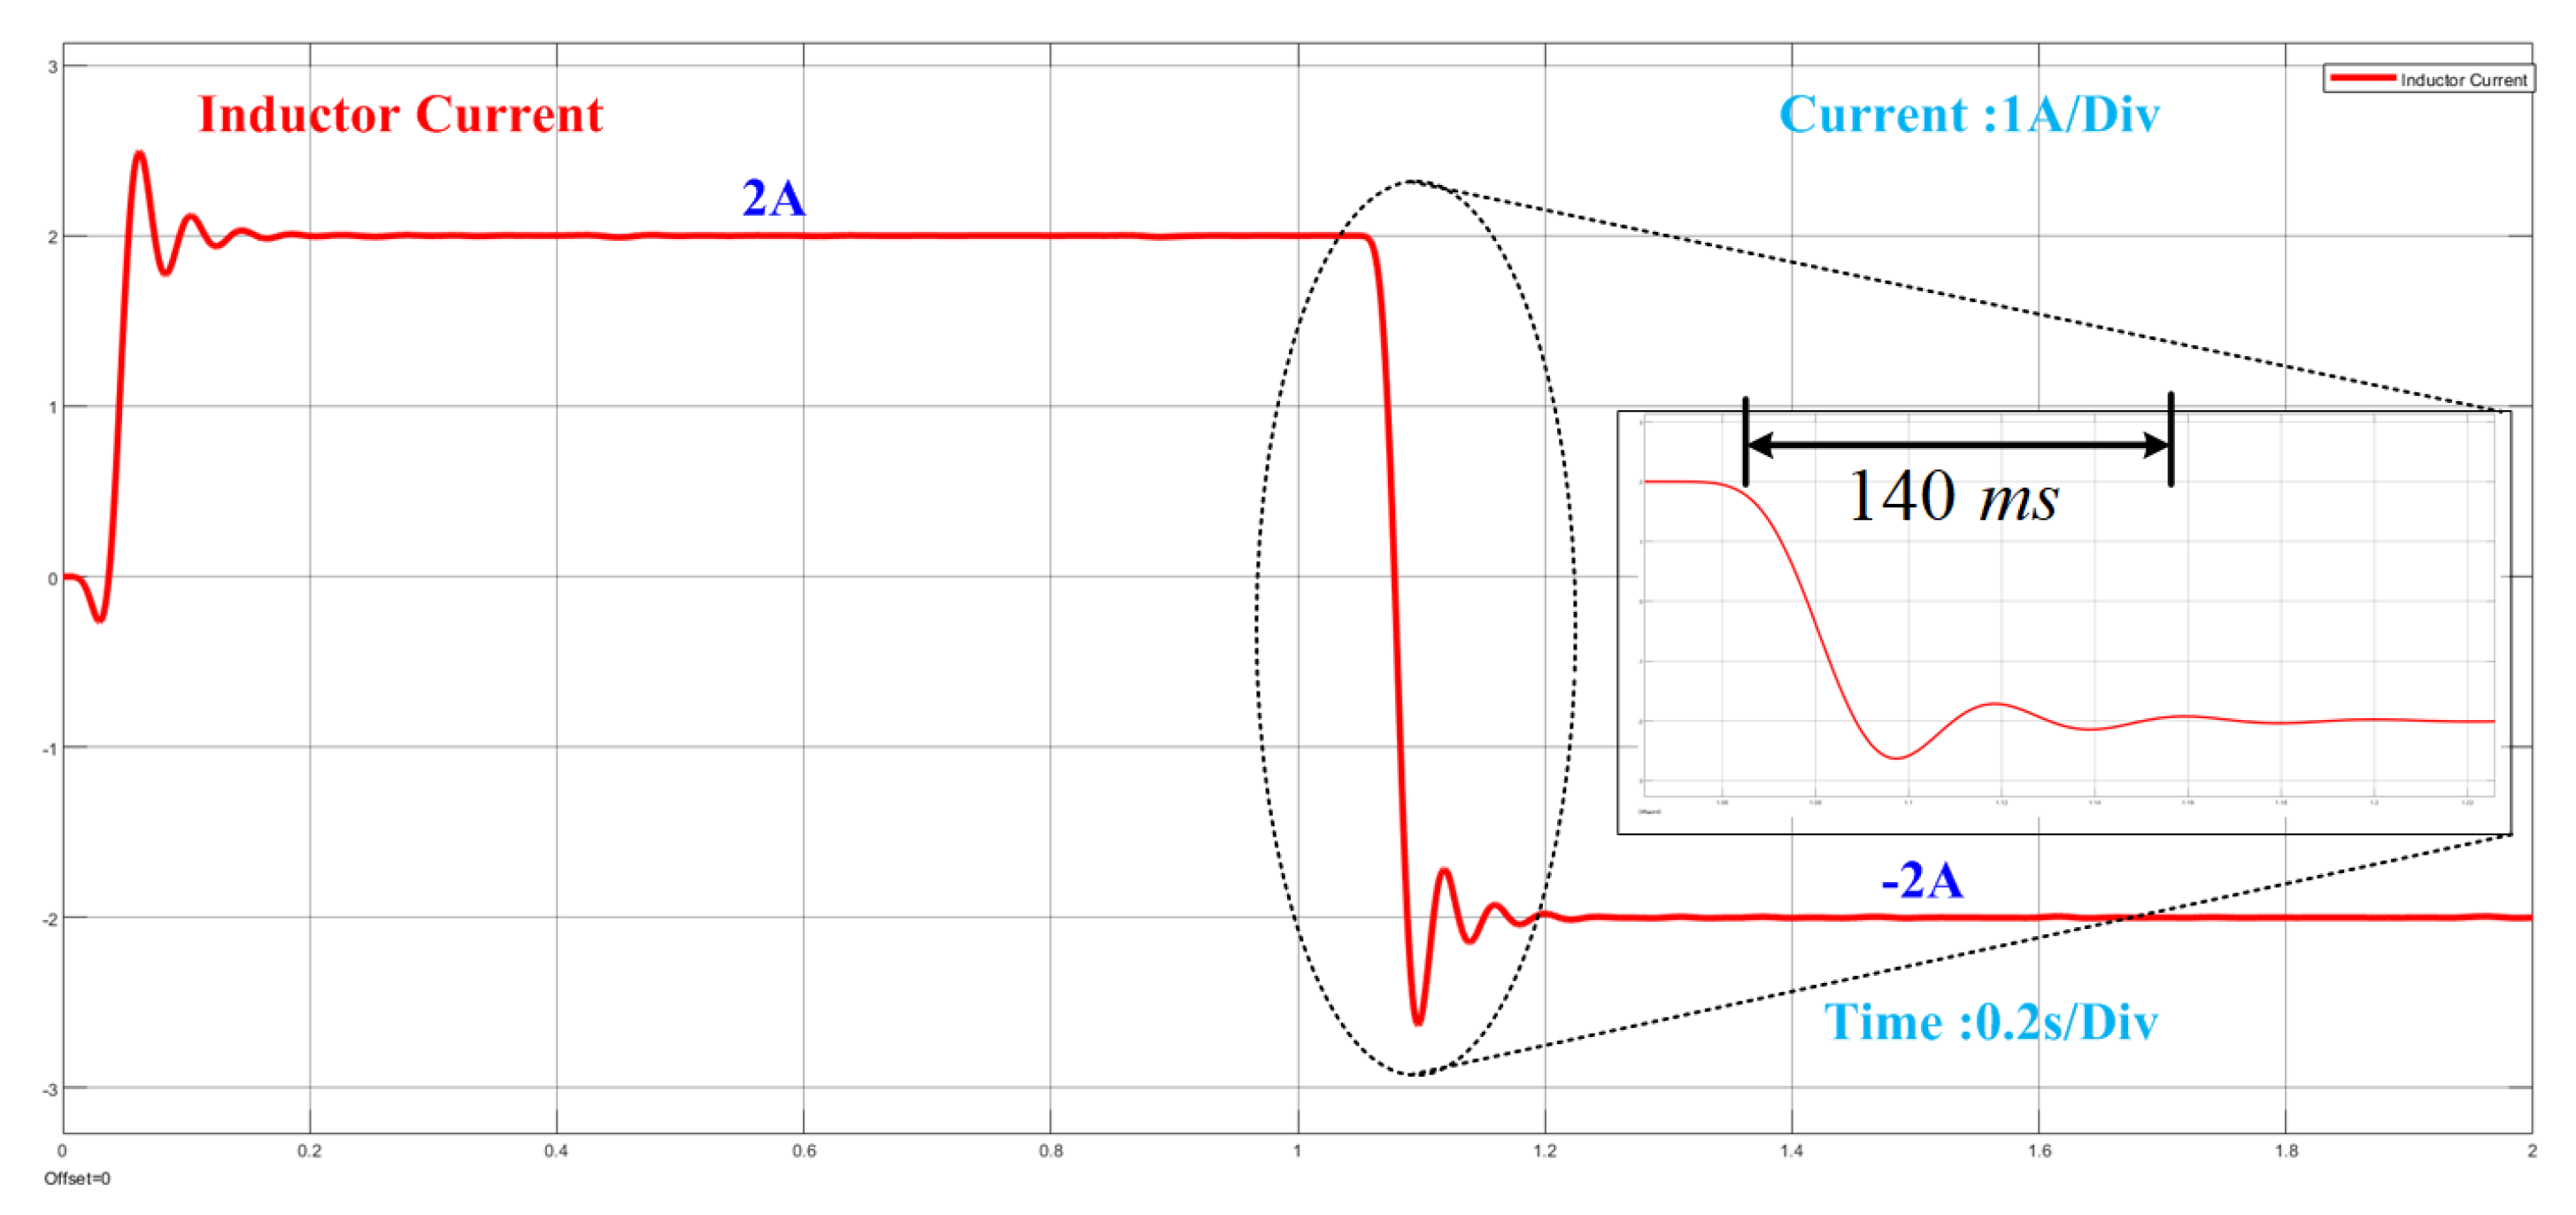
Upon implementing the PID controller for the bi-directional converter, we adjusted the current reference from 2A to -2A, which caused the converter to switch from discharging to charging mode. The time taken by the inductor current to reach the reference current during this transition is illustrated in the
Figure 8 , and it was measured to be 140 ms.
4.2. DNN Controller:
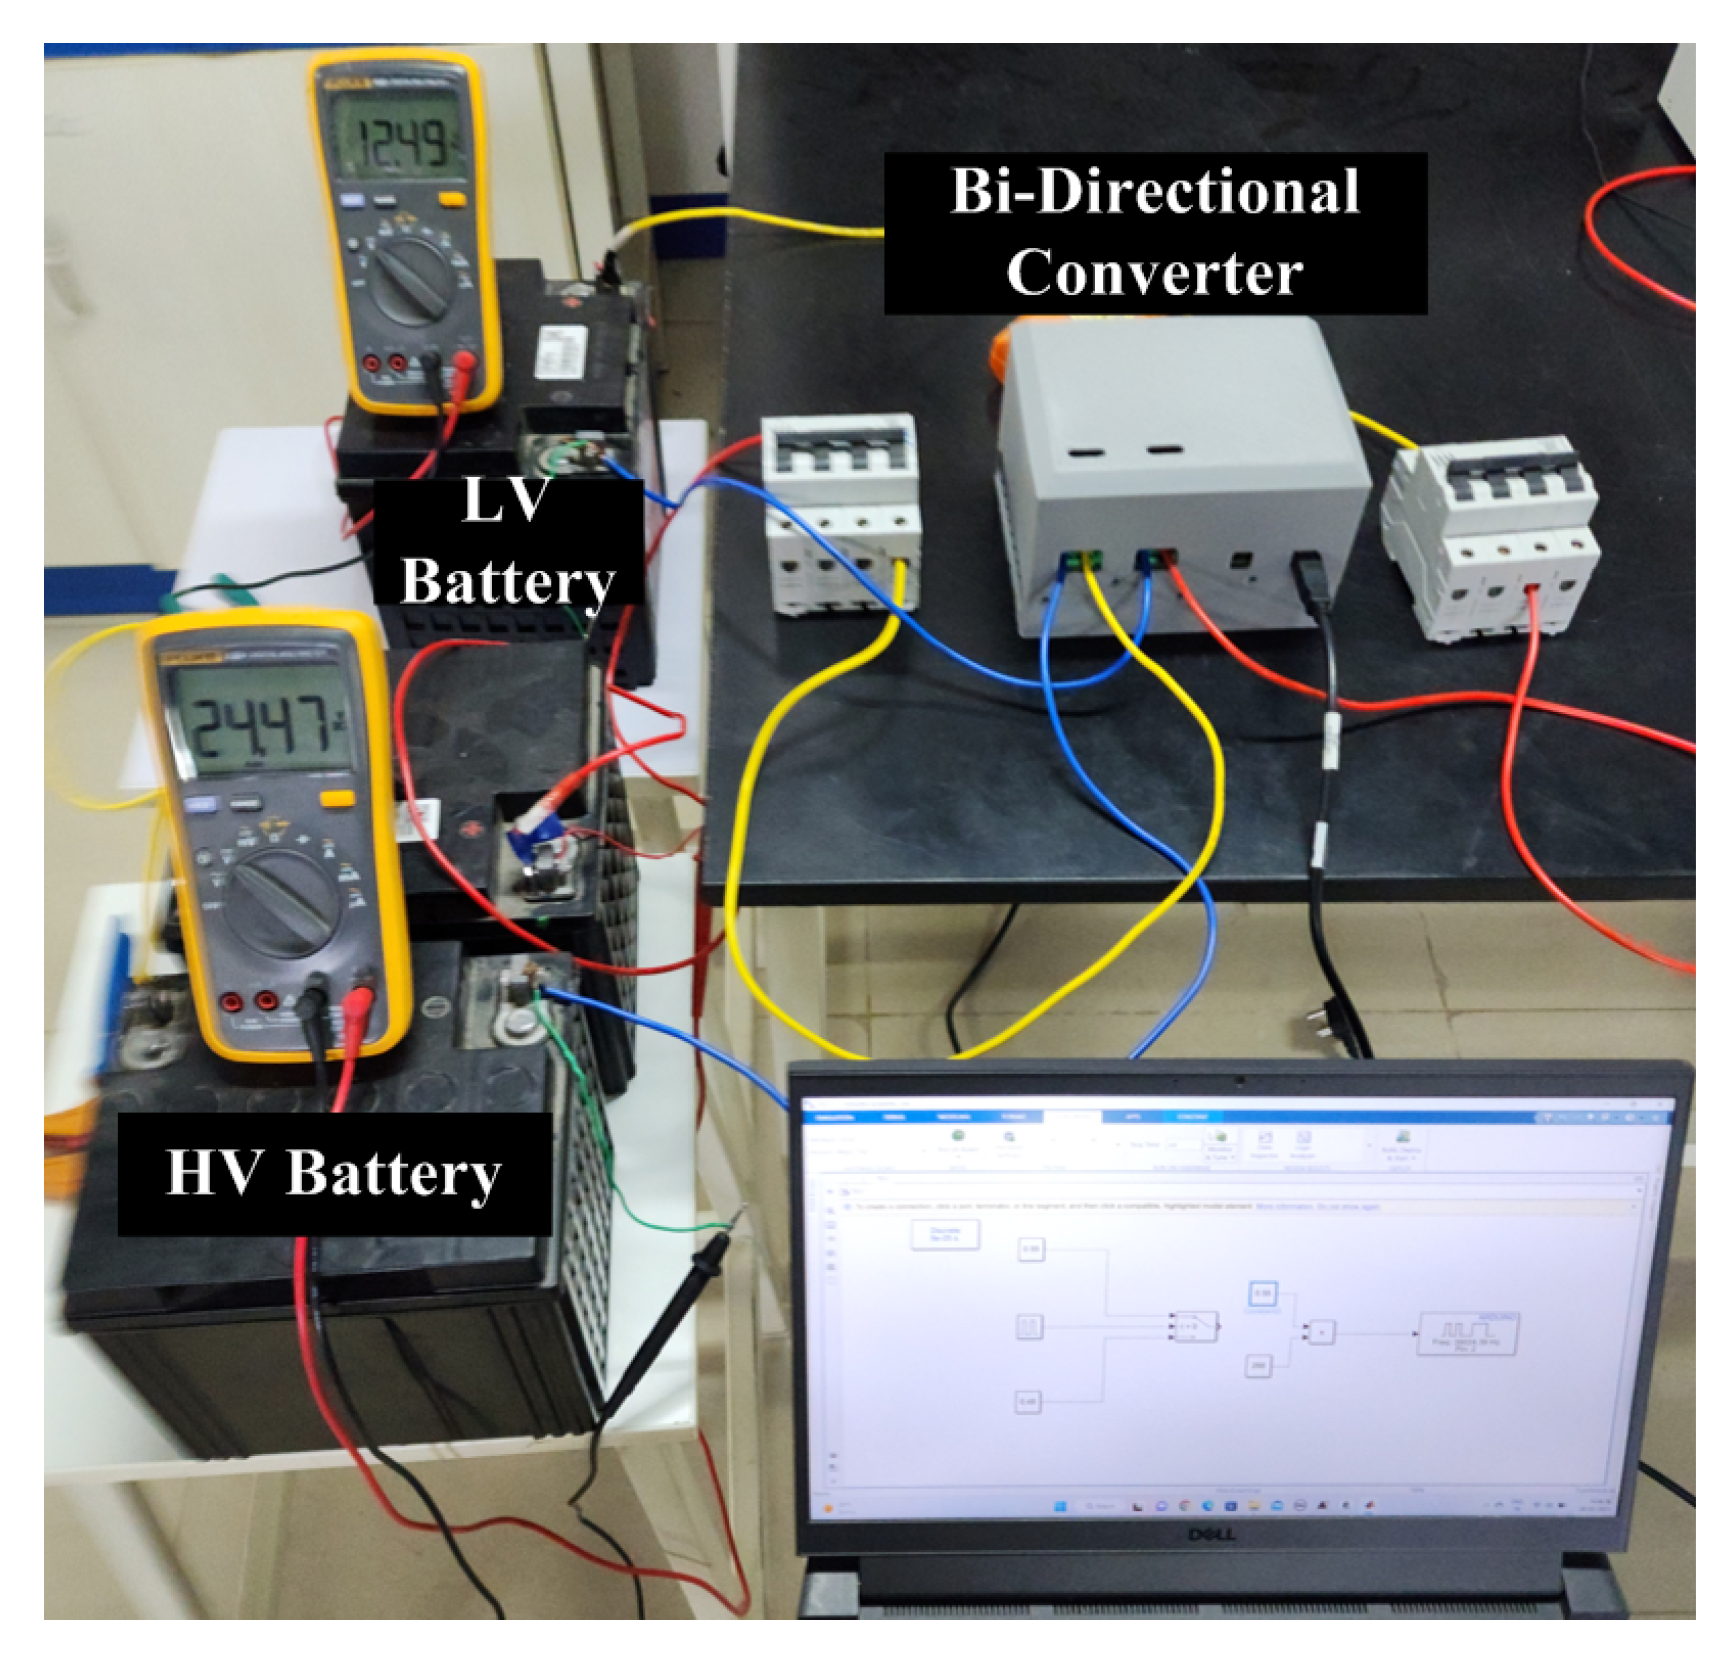
The real-time implementation of a bi-directional converter featuring two batteries, which are replicas of those found in two vehicles, is presented. The setup showcases a higher voltage on one end and a lower voltage on the other end of the converter, as depicted in
Figure 9. This innovative approach is crucial in ensuring efficient and reliable energy transfer between the two batteries. The successful implementation of this setup represents a significant step towards improving the efficiency and reliability of bi-directional converters in real-world applications.
Real-time implementation of a bi-directional converter with a DNN controller can facilitate smooth transitions from charging to discharging and vice versa. To demonstrate the effectiveness of this setup, we have included the inductor current for both mode transitions, as well as the voltage across the two batteries. The results showcase the seamless transition between the two modes, further emphasizing the importance and efficiency of DNN controllers in the bi-directional converter setup.
4.2.1. Charging to discharging mode:
Inductor Current:
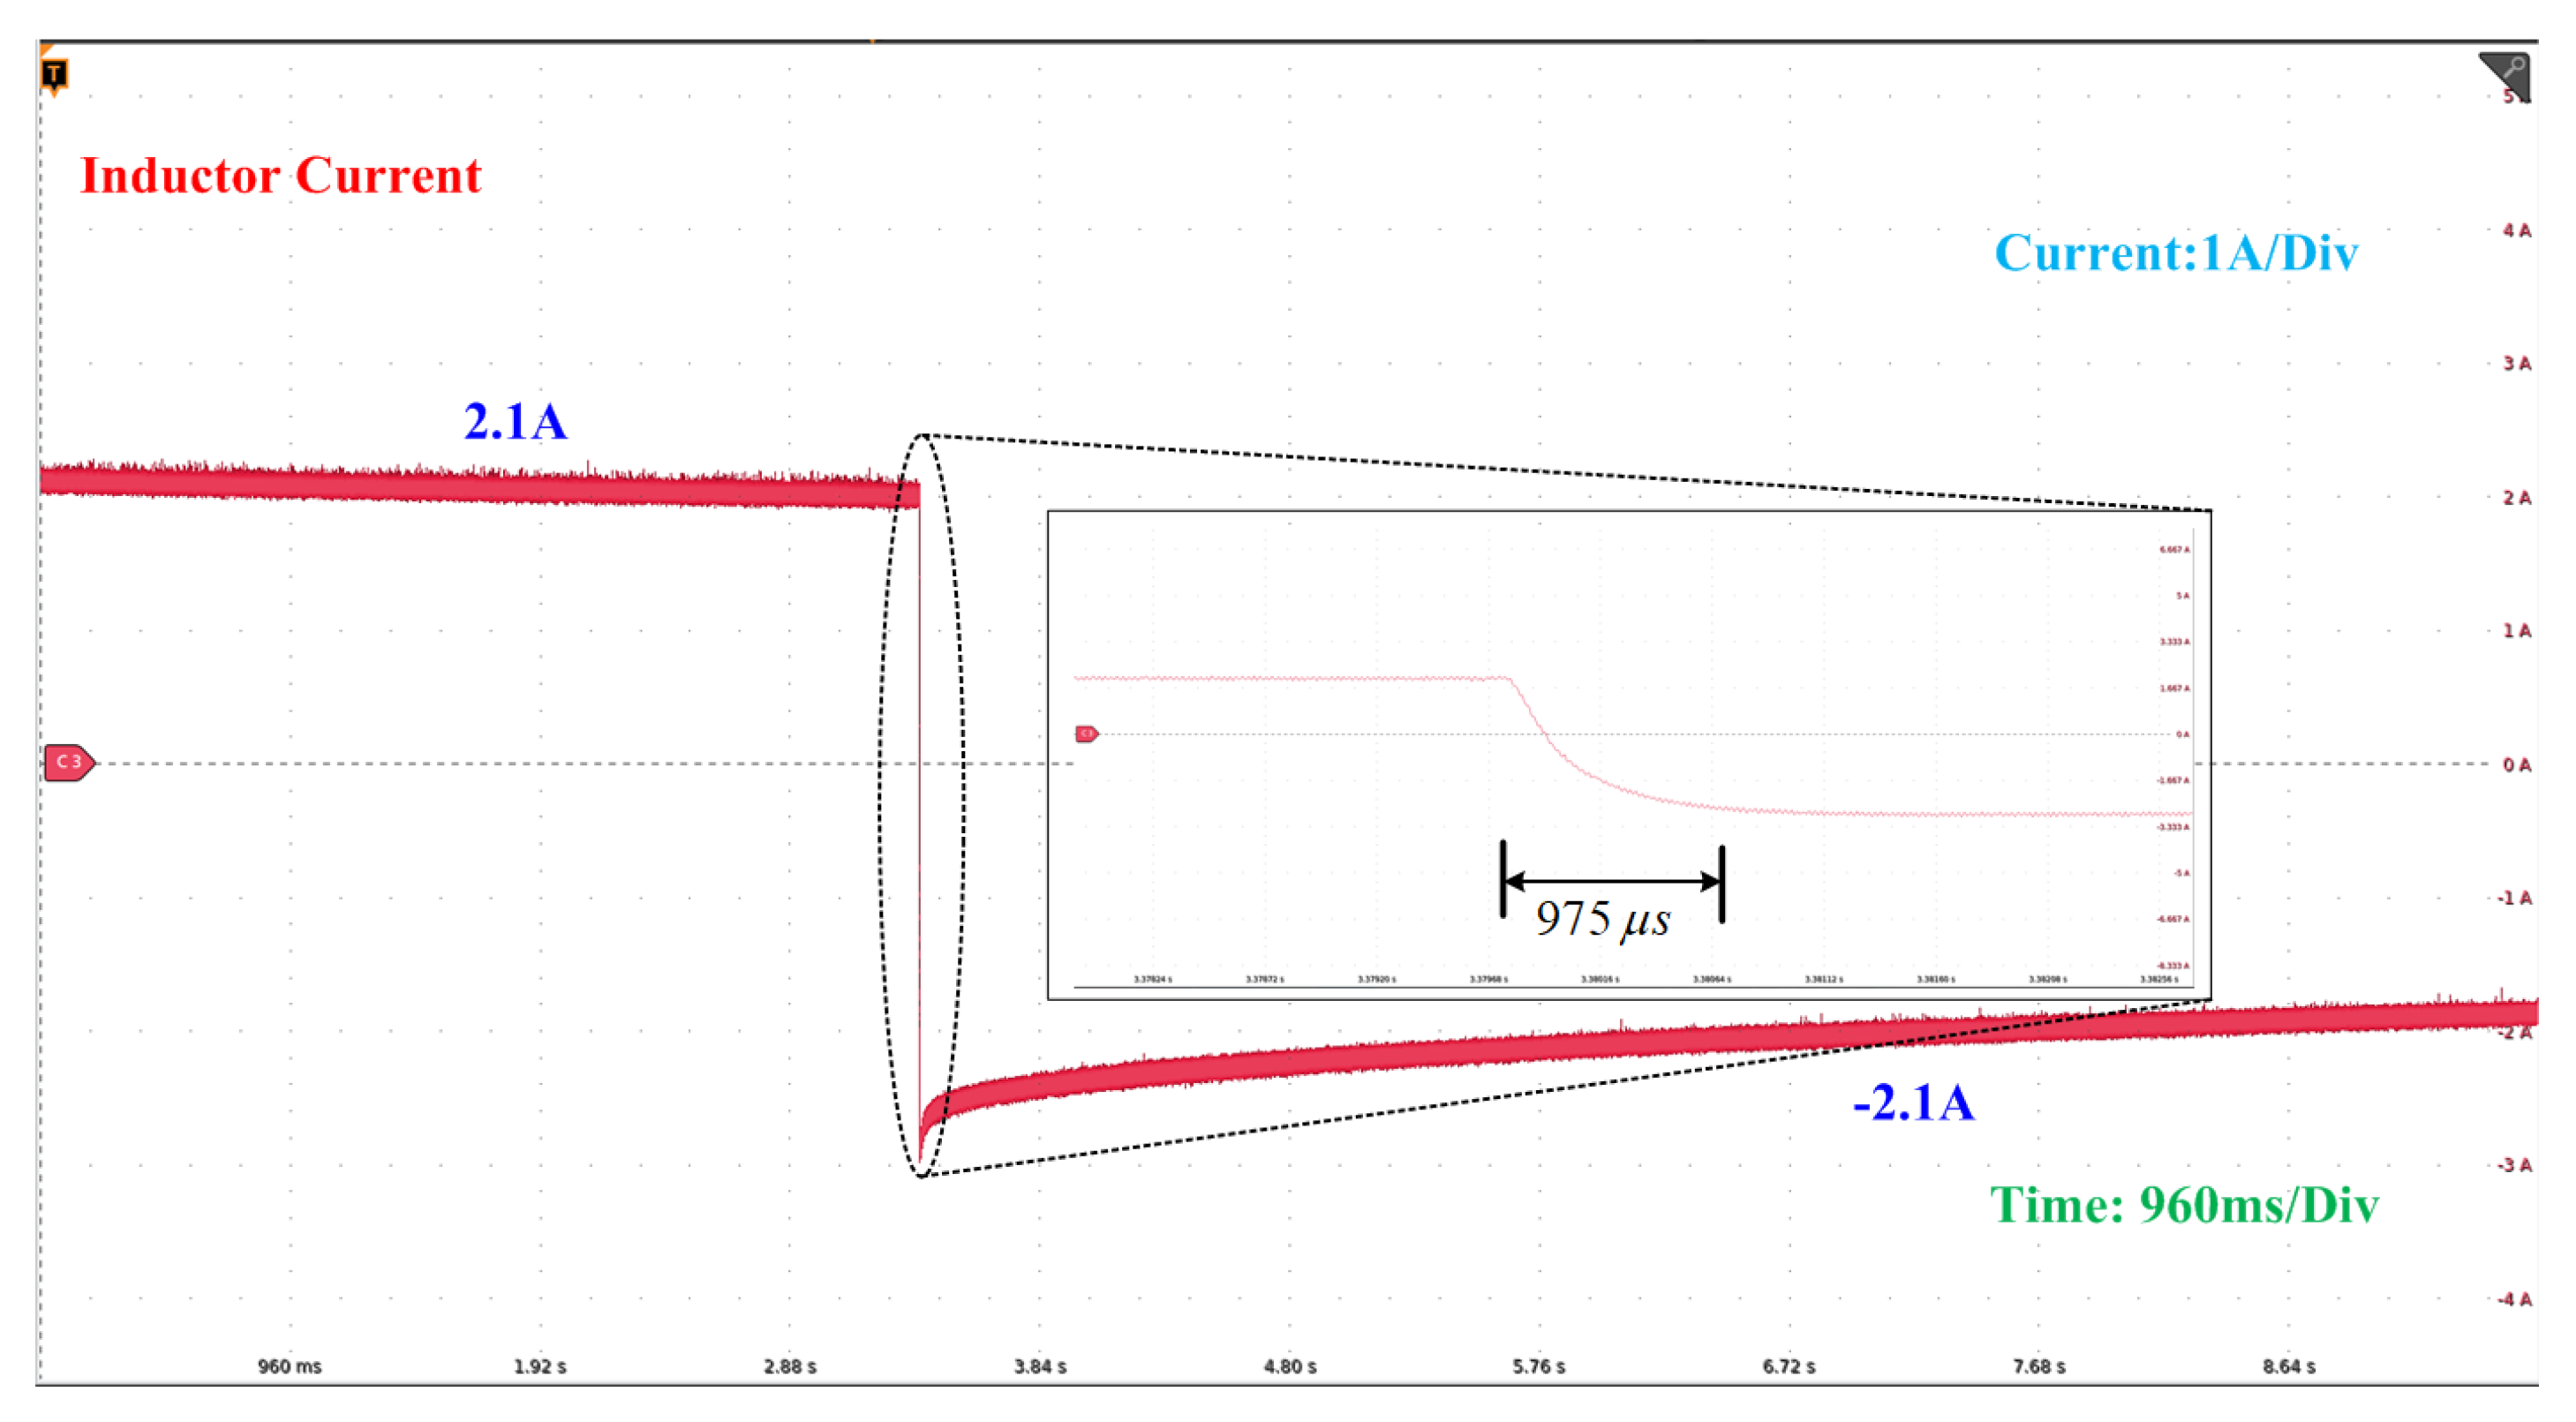
In this case, we performed a charging-to-discharging mode transition in a bi-directional converter by changing the current reference from 2.1A to -2.1A.
Figure 10 shows the waveform of the inductor current during the transition from charging to discharging mode. Impressively, the inductor current reached the new reference value in approximately 975us, significantly faster than what the PID controller achieved. This outcome highlights the superior performance of the DNN controller over the PID controller in achieving a new reference value for the inductor current.
HV Battery () :
In this case, we discuss the voltage behavior of an HV side battery during the mode transition from charging to discharging operations. When the converter is in charging mode, the HV side battery will discharge and charge the LV side battery. The voltage across the HV side battery in this mode is around 24.48V. However, when the converter switches from charging to discharging operation, the HV side battery is charged by the LV side battery, causing a slight increase in the HV side battery voltage to around 24.75V. To accurately depict these slight changes in voltage, we used a voltage scale of 0.34/Div, as shown in
Figure 11.
LV Battery ():
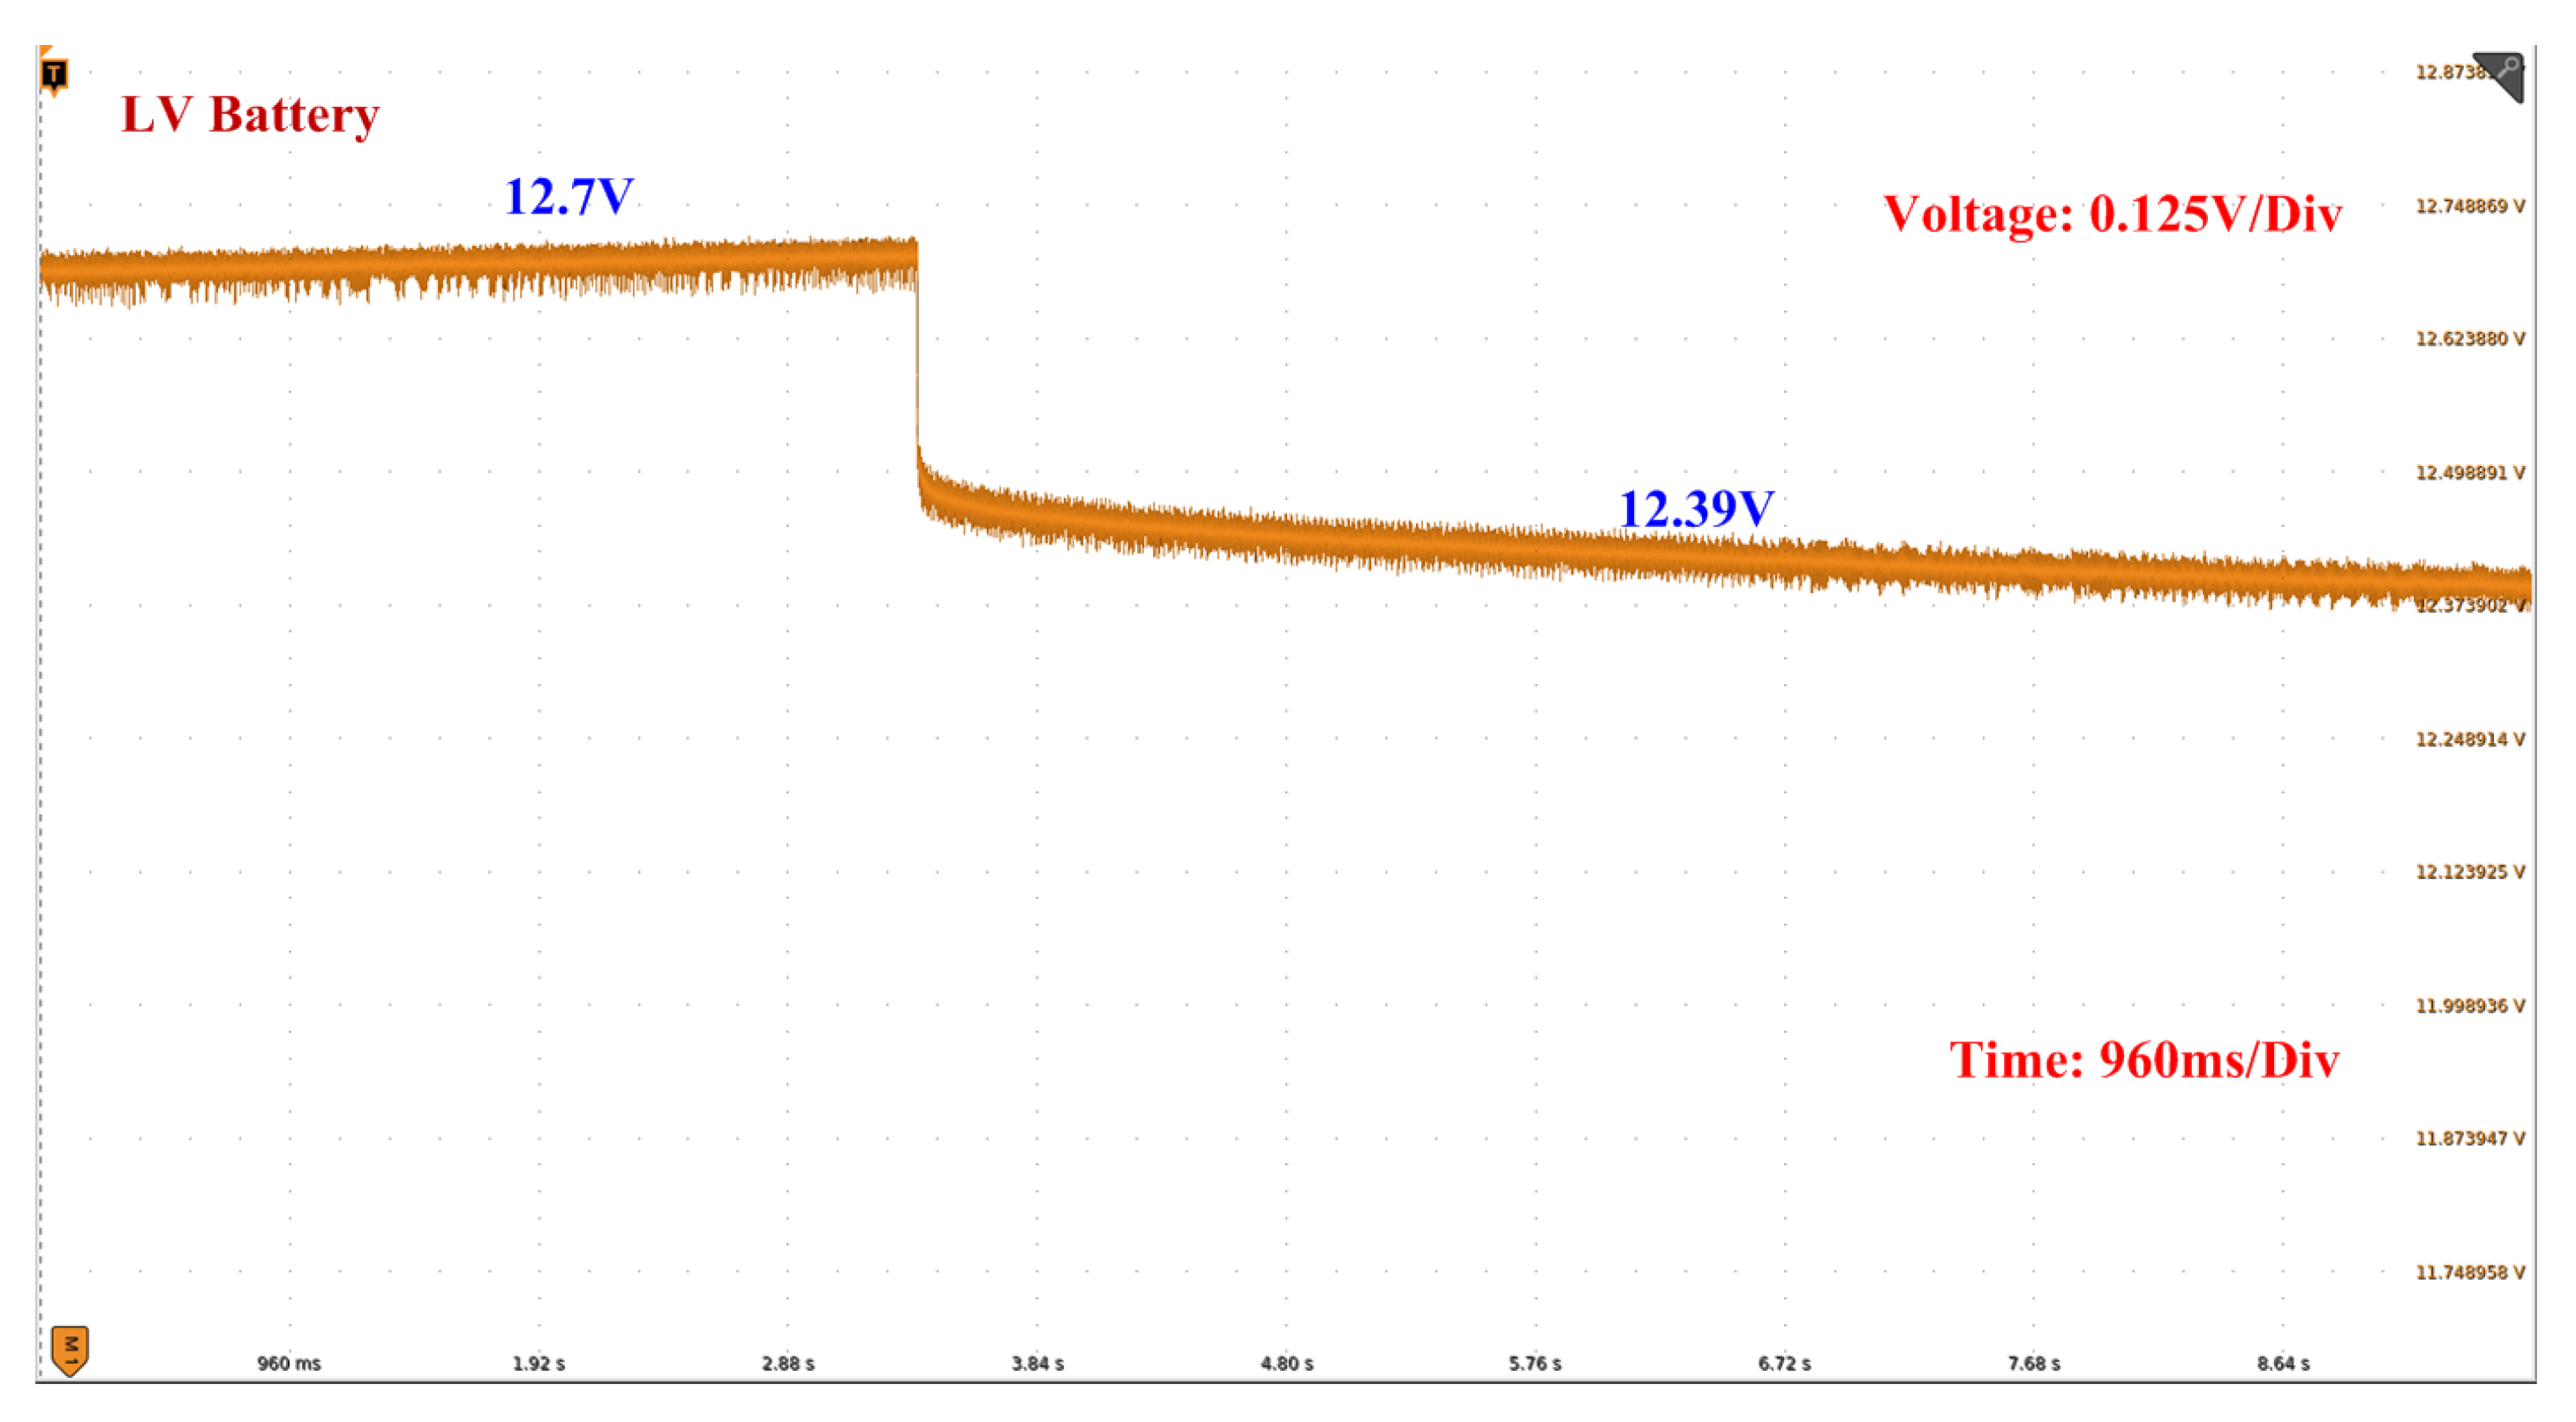
In this case, we will discuss the voltage behavior of an LV side battery during the mode transition from charging to discharging operations. When the converter operates in charging mode, the HV side battery charges the LV side battery. The voltage across the LV side battery in this mode is approximately 12.7V. However, when the converter switches from charging to discharging operation, the LV side battery discharges and charges the HV side battery, leading to a decrease in LV side battery voltage to about 12.39V. To precisely depict these slight changes in voltage, we used a voltage scale of 0.125V/Div, as demonstrated in
Figure 12.
4.2.2. Discharging to charging mode:
Inductor Current:
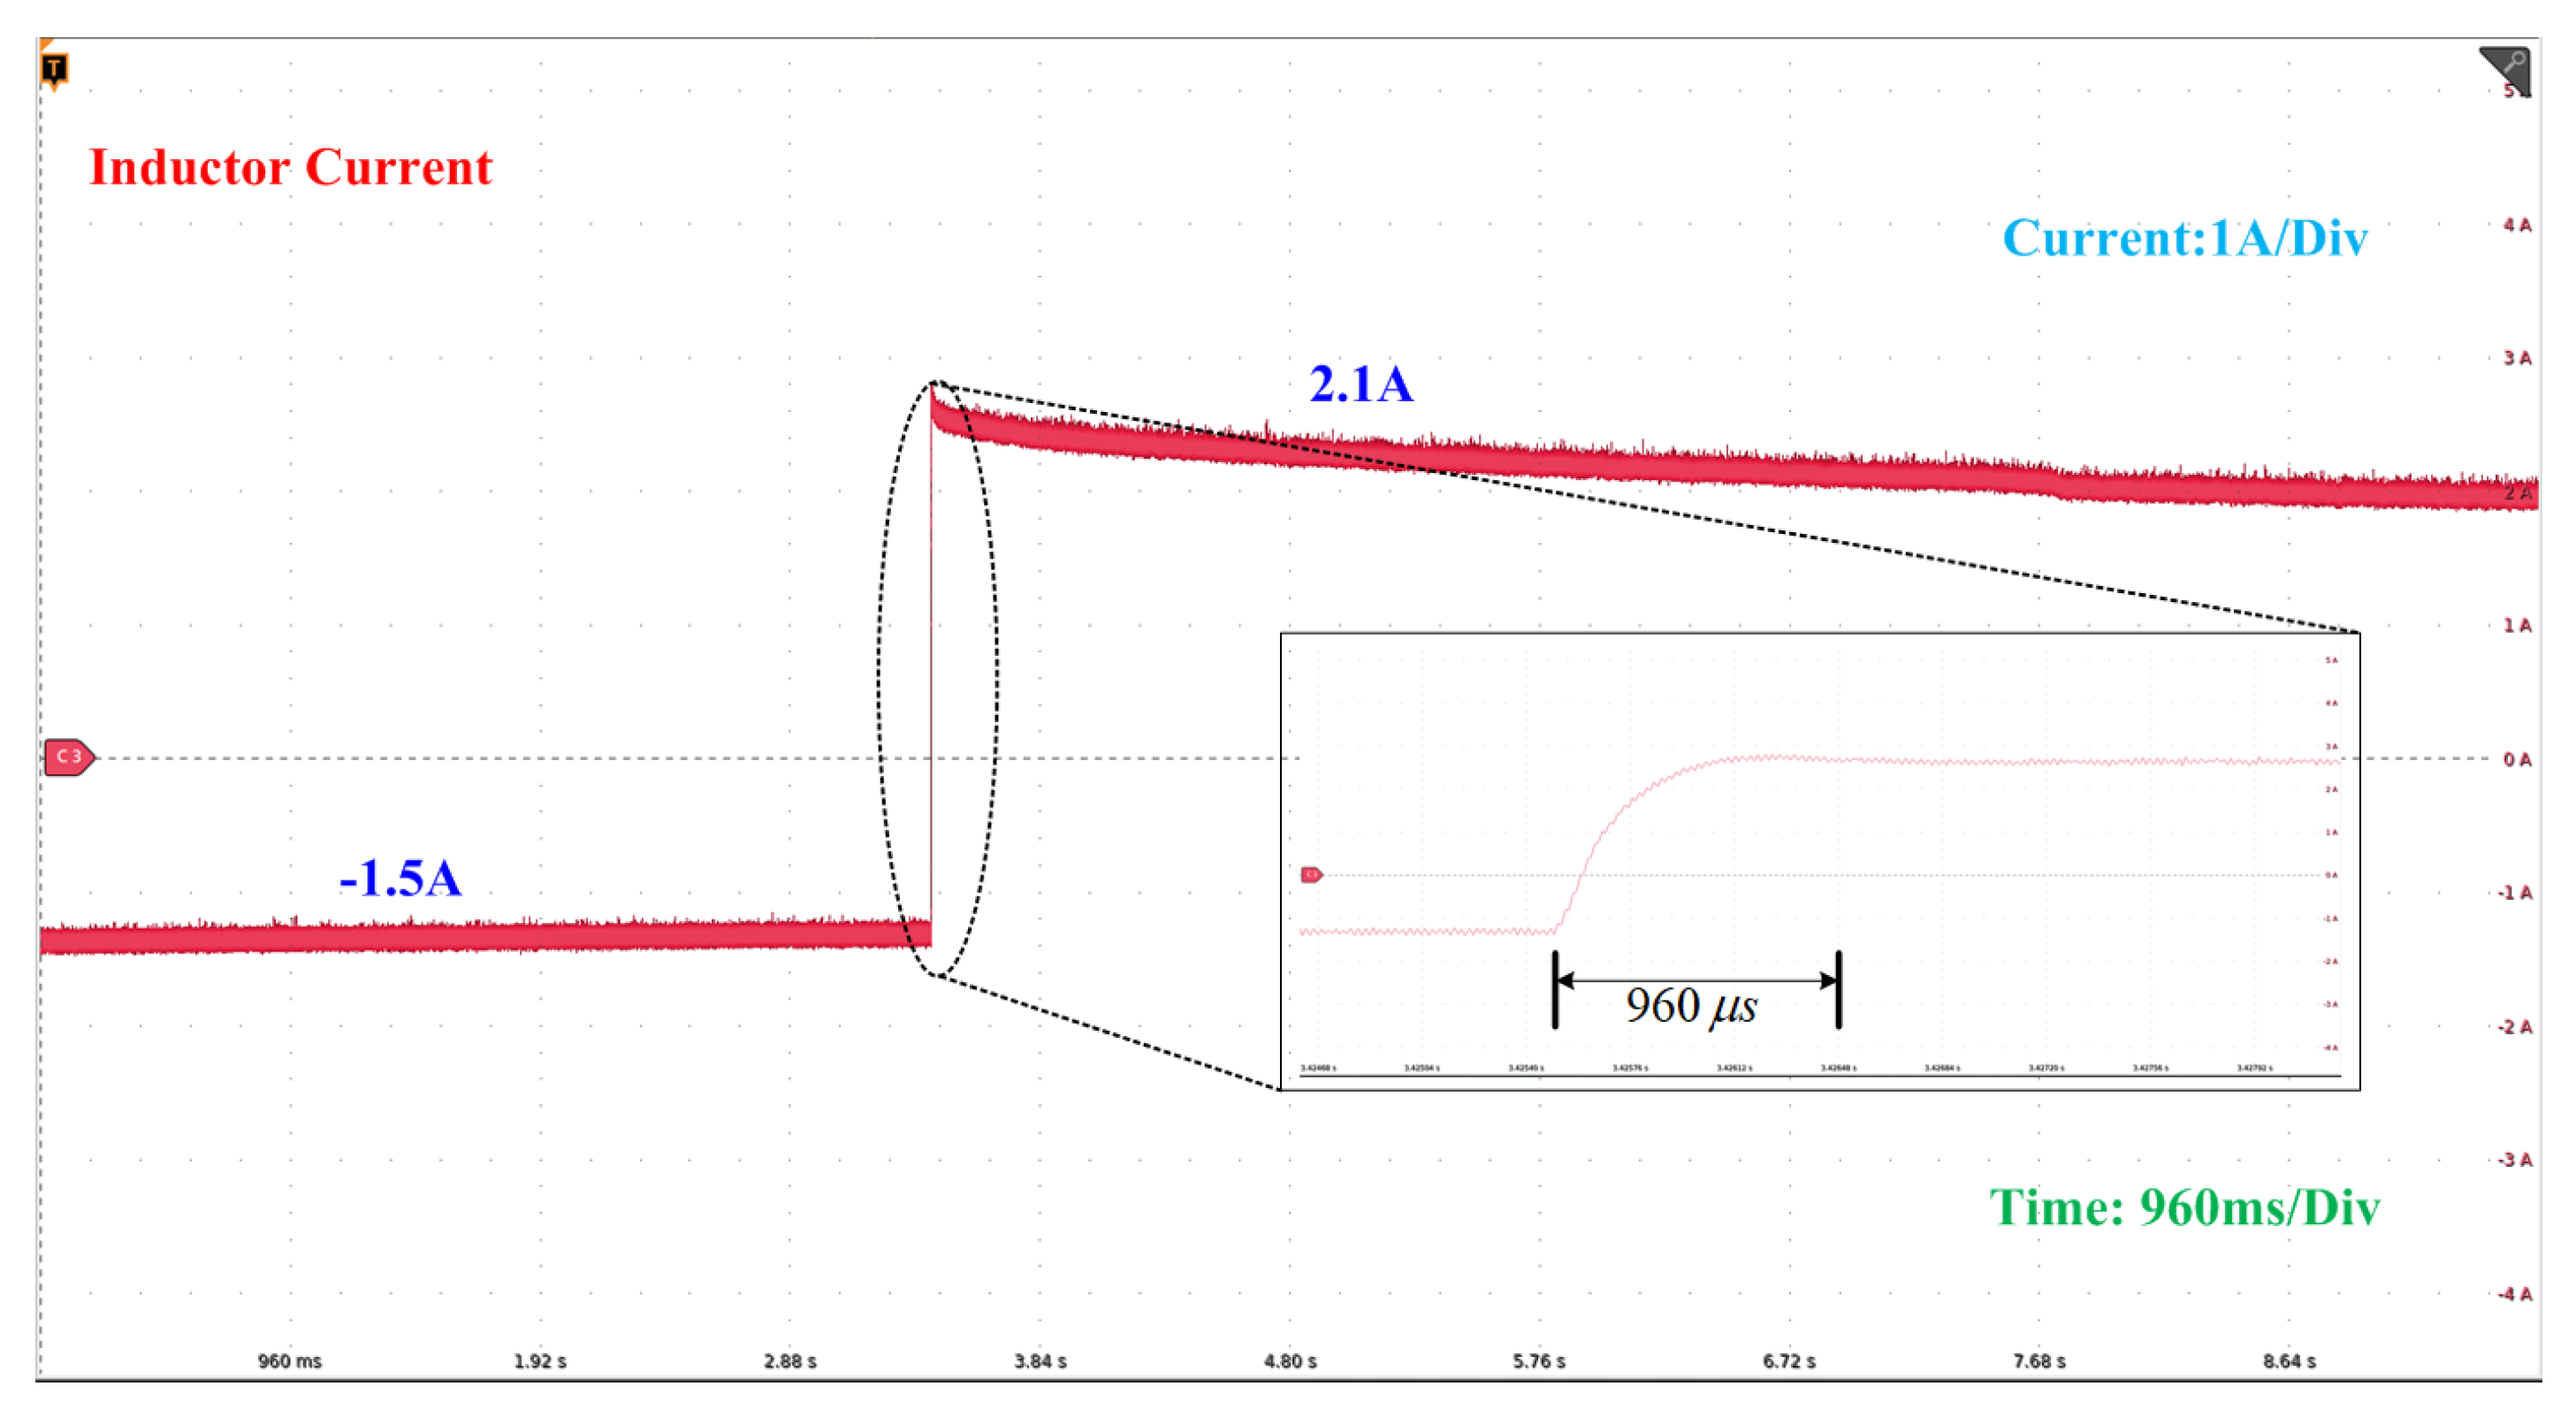
In this case, we conducted a mode transition from discharging to charging in a bi-directional converter. We achieved this by changing the current reference from -1.5A to 2.1A.
Figure 13 illustrates the waveform of the inductor current during the transition. Impressively, the inductor current reached the new reference value in roughly 960us, which is considerably quicker than what the PID controller accomplished. This outcome highlights the DNN controller’s superior performance over the PID controller in achieving a new reference value for the inductor current.
HV Battery () :
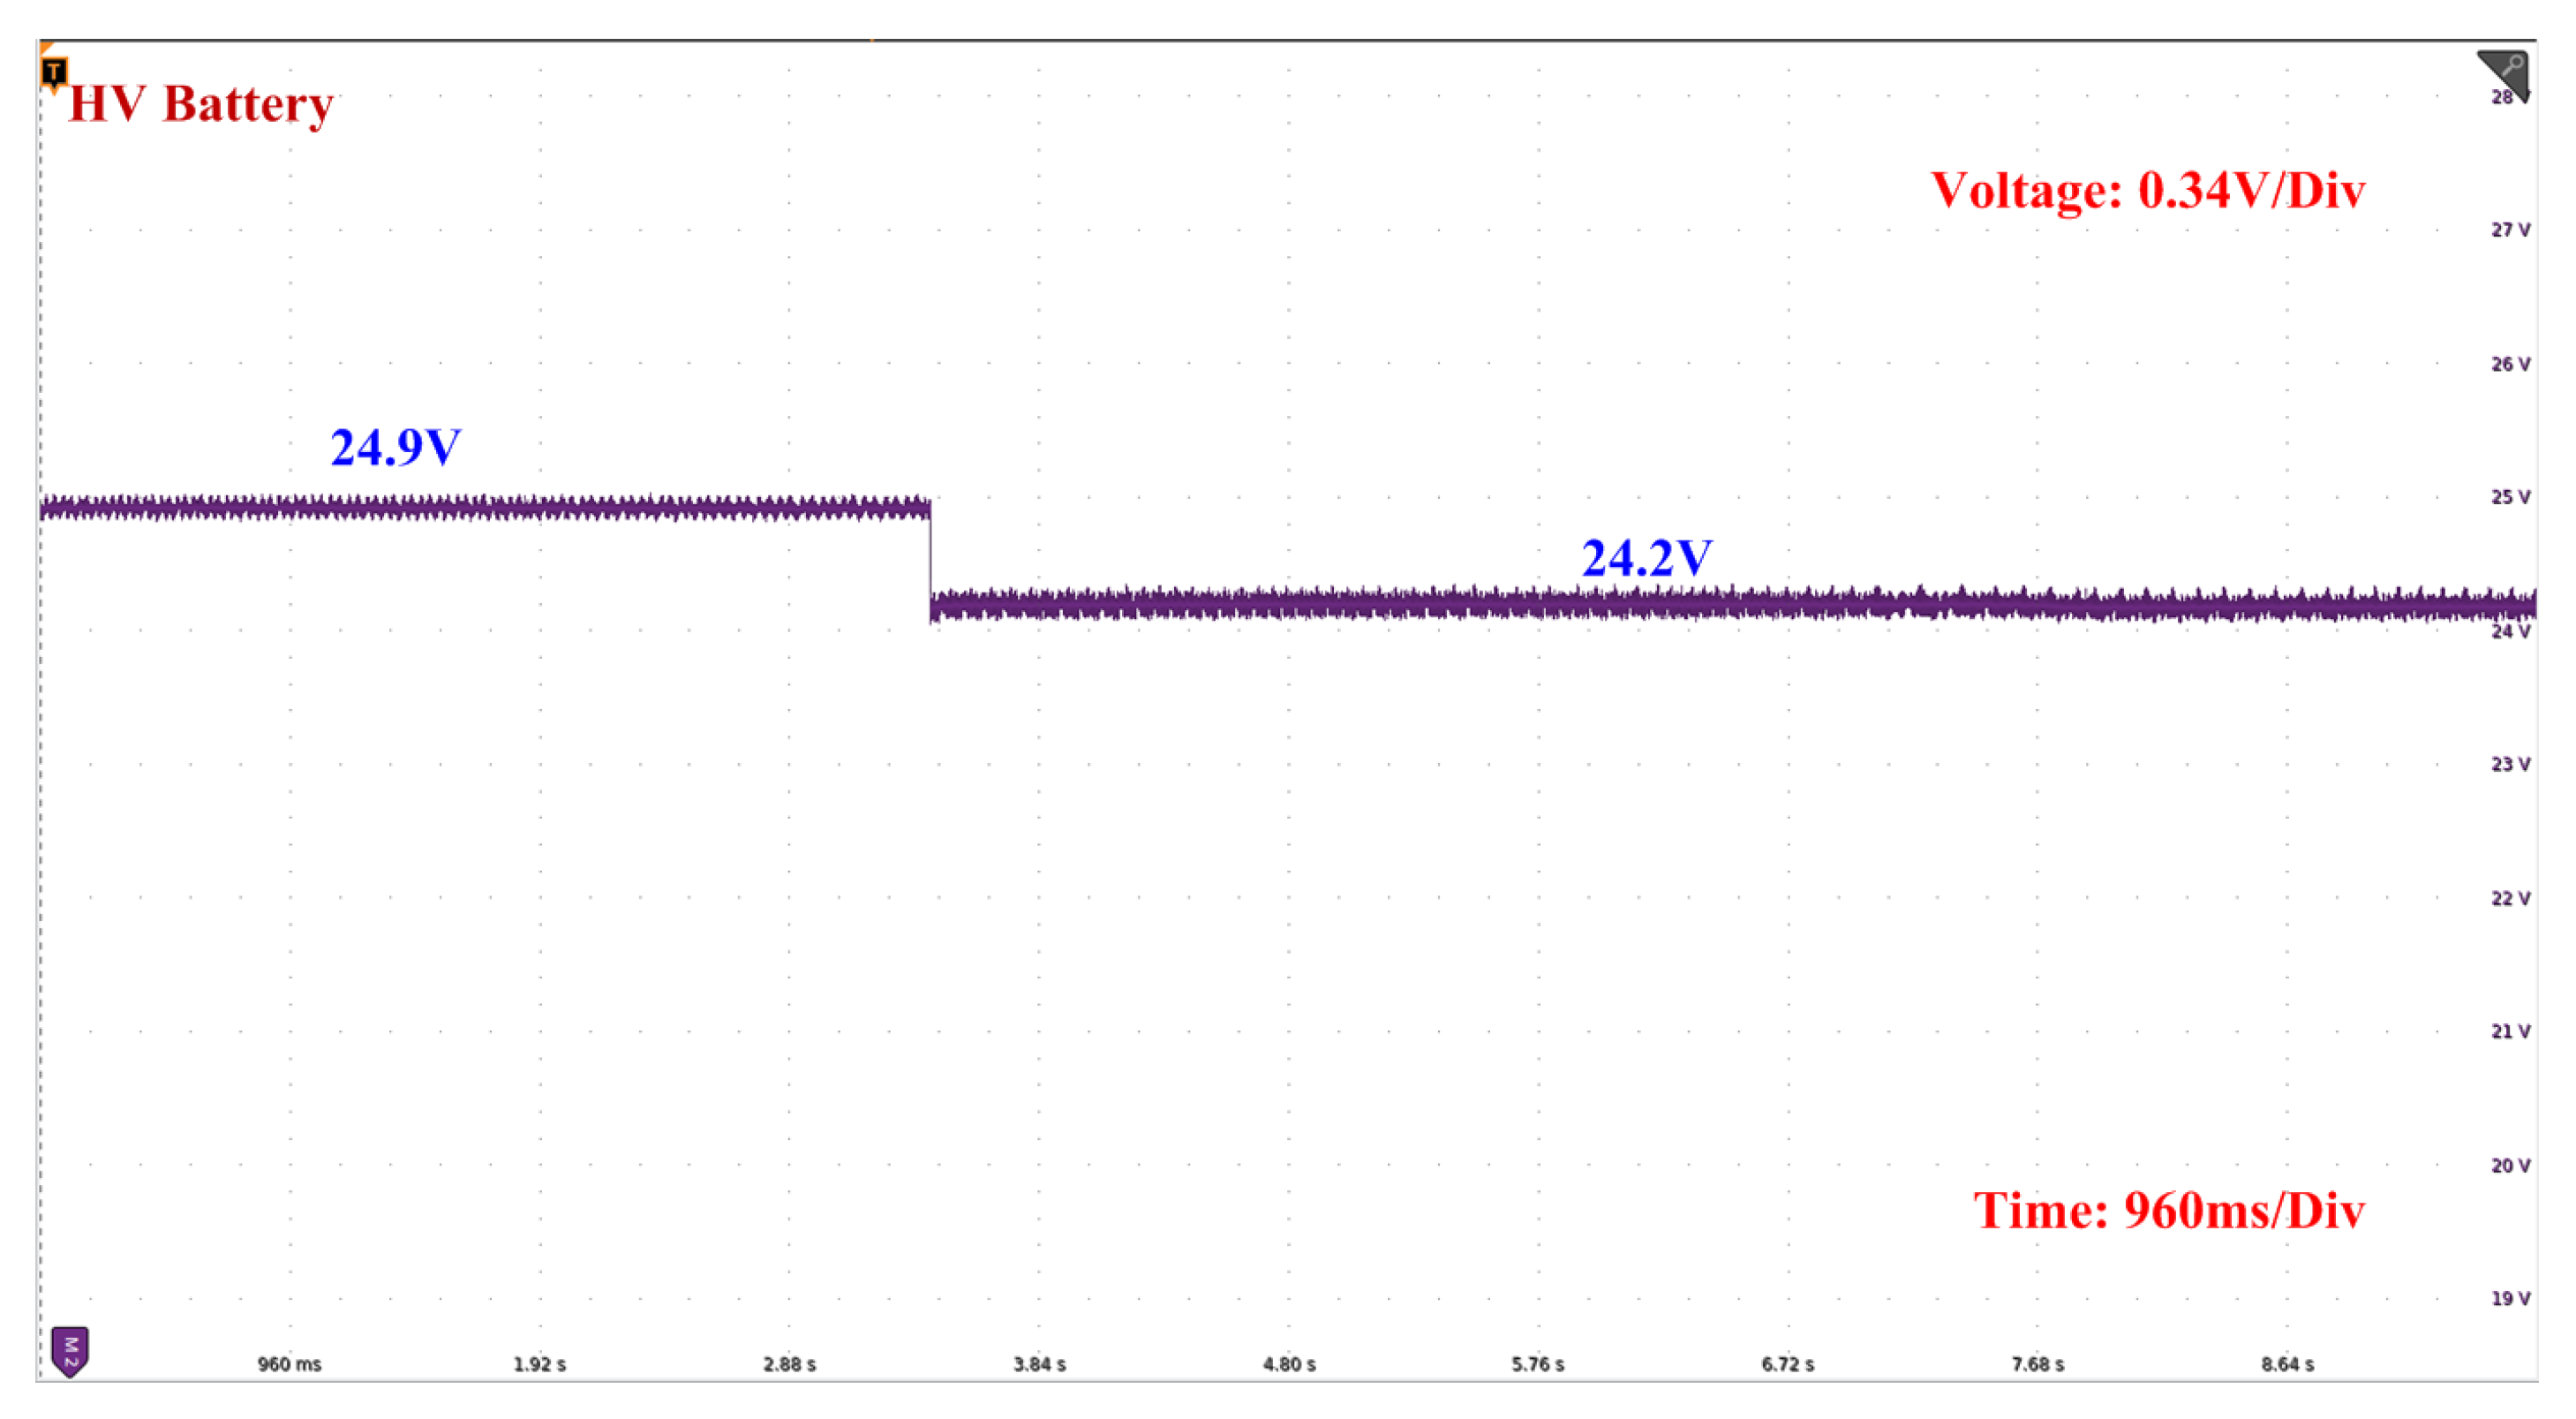
In this case, we will discuss the voltage behavior of an HV side battery during the mode transition from discharging to charging operations. When the converter is in discharging mode, the HV side battery charges by the LV side battery. The voltage across the HV side battery in this mode is around 24.9V. However, when the converter switches from discharging to charging operation, the HV side battery discharges and charges the LV side battery, causing a slight decrease in voltage to around 24.2V. To accurately depict these slight changes in voltage, we used a voltage scale of 0.34/Div, as shown in
Figure 14.
LV Battery () :
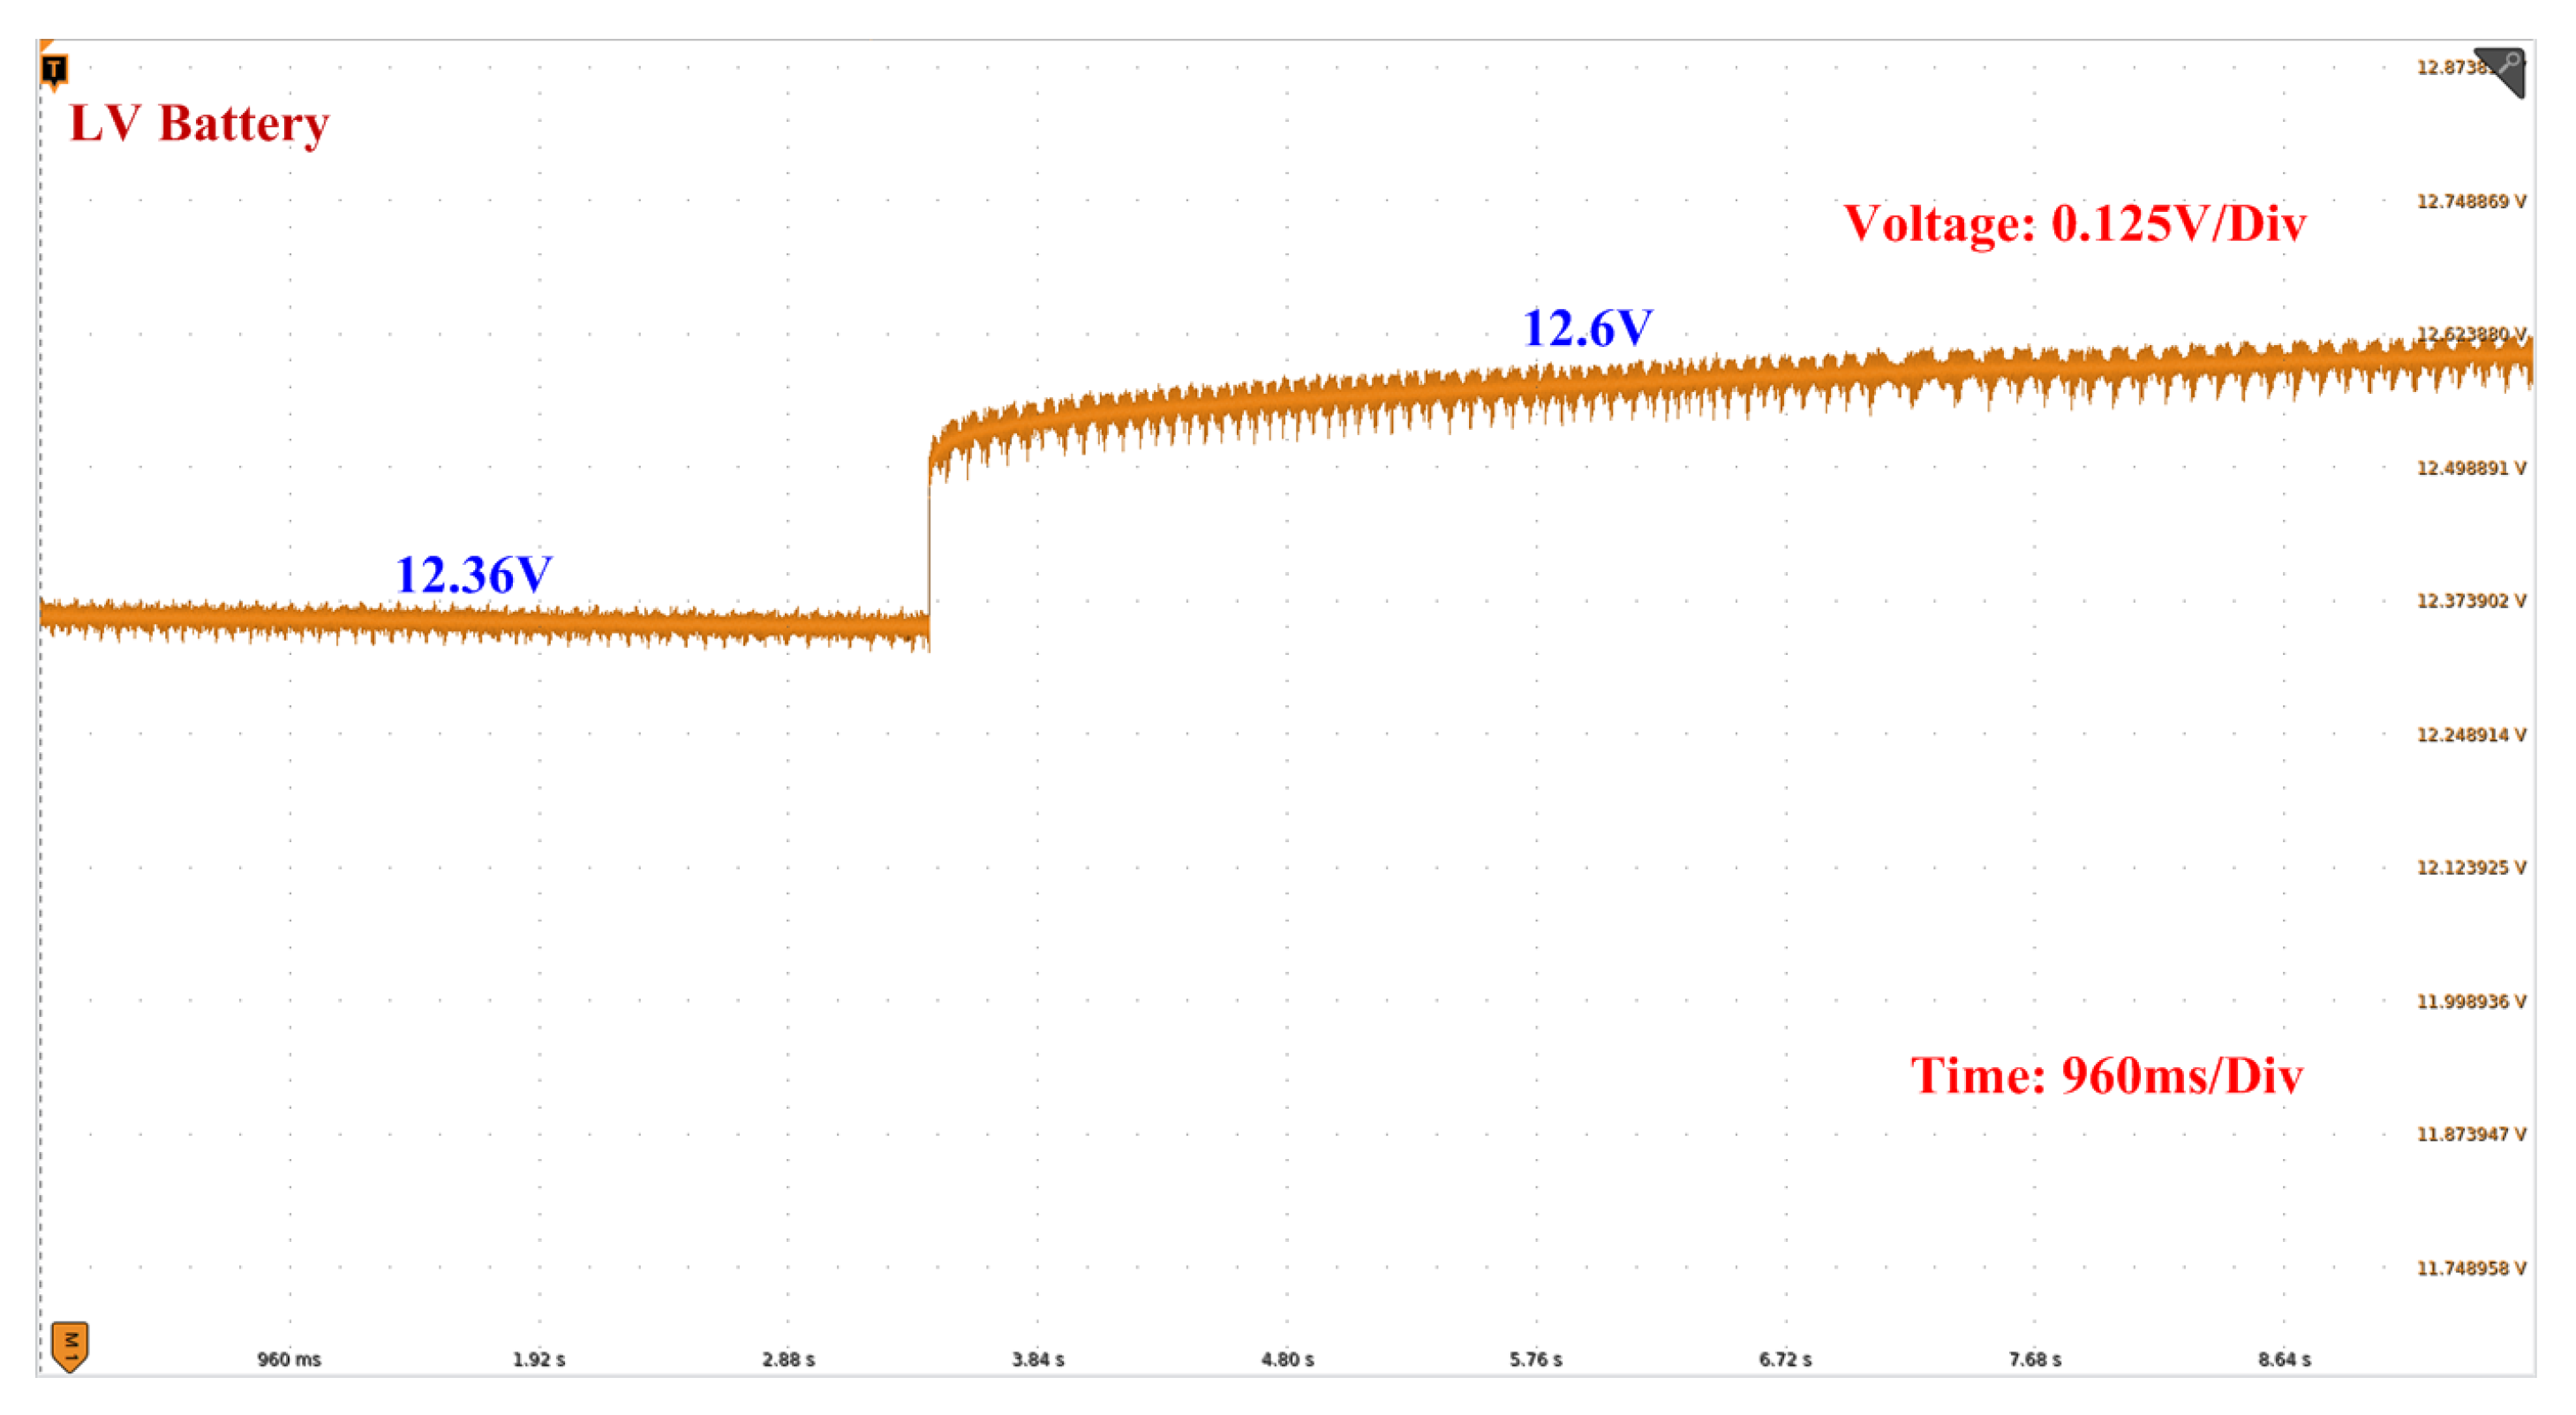
In this case, we will be discussing the voltage behavior of the LV side battery during the transition from discharging to charging operations in a bi-directional converter. While the converter is in discharging mode, the LV side battery discharges and charges the HV side battery. During which, the voltage across the LV side battery is around 12.36V. However, when the converter switches from discharging to charging operation, the LV side battery will be charged by the HV side battery, resulting in a slight increase in the voltage of the LV side battery to around 12.6V. To accurately display these slight voltage changes, we used a voltage scale of 0.125V/Div, as shown in
Figure 15.
5. Conclusion
This paper presents the significance of V2V and V2G charging and proposes a novel approach that employs a DNN-based non-isolated bi-directional converter. We conducted a hardware experiment of our proposed controller and compared the transition time of inductor current with a traditional PID controller using MATLAB Simulink software. The results demonstrate that the DNN controller yields a faster response time than the PI controller. Additionally, we analyzed the behavior of HV and LV side battery voltages during the transition from charging to discharging and vice versa. The results show that the DNN-based controller outperforms conventional PID controllers in terms of performance. These findings demonstrate the potential benefits of using DNN-based controllers for V2V and V2G charging systems.
References
- Mai, T.; Hand, M.M.; Baldwin, S.F.; Wiser, R.H.; Brinkman, G.L.; Denholm, P.; Arent, D.J.; Porro, G.; Sandor, D.; Hostick, D.J.; et al. Renewable electricity futures for the United States. IEEE Transactions on Sustainable Energy 2013, 5, 372–378. [Google Scholar] [CrossRef]
- Zhang, Y.; Gatsis, N.; Giannakis, G.B. Robust Energy Management for Microgrids With High-Penetration Renewables. IEEE Transactions on Sustainable Energy 2013, 4, 944–953. [Google Scholar] [CrossRef]
- Haegel, N.M.; Kurtz, S.R. Global Progress Toward Renewable Electricity: Tracking the Role of Solar. IEEE Journal of Photovoltaics 2021, 11, 1335–1342. [Google Scholar] [CrossRef]
- Li, W.; Yang, M.; Sandu, S. Electric vehicles in China: A review of current policies. Energy & Environment 2018, 29, 1512–1524. [Google Scholar] [CrossRef]
- A review of energy sources and energy management system in electric vehicles. Renewable and Sustainable Energy Reviews 2013, 20, 82–102. [CrossRef]
- Omahne, V.; Knez, M.; Obrecht, M. Social Aspects of Electric Vehicles Research—Trends and Relations to Sustainable Development Goals. World Electric Vehicle Journal 2021, 12. [Google Scholar] [CrossRef]
- Yang, K.; Huang, Y.; Qin, Y.; Hu, C.; Tang, X. Potential and challenges to improve vehicle energy efficiency via V2X: Literature review. International Journal of Vehicle Performance 2021, 7, 244–265. [Google Scholar] [CrossRef]
- Chaitanya, M.; Vinayak, A.; Pavan, B.G.; Lakshmi, N.; Sandeep, K. A Review of Bidirectional DC-DC,DC-AC Converters for V2G and G2V Applications. In Proceedings of the 2023 International Conference on Power, Instrumentation, Energy and Control (PIECON), 2023, pp. 1–6. [CrossRef]
- Technical investigation on V2G, S2V, and V2I for next generation smart city planning. Journal of Electronic Science and Technology 2019, 17, 100010. [CrossRef]
- Mummadi, V.; Mohan, B.K. Robust digital voltage-mode controller for fifth-order boost converter. IEEE Transactions on Industrial Electronics 2010, 58, 263–277. [Google Scholar] [CrossRef]
- Chattopadhyay, S.; Das, S. A Digital Current-Mode Control Technique for DC–DC Converters. IEEE Transactions on Power Electronics 2006, 21, 1718–1726. [Google Scholar] [CrossRef]
- Sliding mode control of DC/DC converters. Journal of the Franklin Institute 2013, 350, 2146–2165. [CrossRef]
- Wu, H.; Su, W.; Liu, Z. PID controllers: Design and tuning methods. 2014 9th IEEE Conference on Industrial Electronics and Applications, 2014; 808–813. [Google Scholar]
- Mattavelli, P.; Rossetto, L.; Spiazzi, G.; Tenti, P. General-purpose fuzzy controller for DC-DC converters. IEEE Transactions on Power Electronics 1997, 12, 79–86. [Google Scholar] [CrossRef]
- Machina, V.S.P.; Koduru, S.S.; Madichetty, S.; Mishra, S. Design of ANN Based Controller for Cyberattack Detection in DC-DC Buck Converter. In Proceedings of the 2022 22nd National Power Systems Conference (NPSC), 2022, pp. 460–464. [CrossRef]
- Srikanth, R.; Venkatesan, M.; Subba Rao, M. Design and performance evaluation of PID, Fuzzy logic and ANN controllers based MPPTs for hybrid electric vehicle applications. International Journal of Ambient Energy 2022, 43, 3661–3675. [Google Scholar] [CrossRef]
- Banda, M.K.; Koduru, S.S.; Machina, V.S.P.; Madichetty, S. A Deep Learning Based Cyber Attack Detection and Mitigation Scheme in Synchronous Buck Converter. In Proceedings of the 2022 IEEE International Conference on Power Electronics, Drives and Energy Systems (PEDES). IEEE, 2022, pp. 1–6.
|
Disclaimer/Publisher’s Note: The statements, opinions and data contained in all publications are solely those of the individual author(s) and contributor(s) and not of MDPI and/or the editor(s). MDPI and/or the editor(s) disclaim responsibility for any injury to people or property resulting from any ideas, methods, instructions or products referred to in the content. |
© 2023 by the authors. Licensee MDPI, Basel, Switzerland. This article is an open access article distributed under the terms and conditions of the Creative Commons Attribution (CC BY) license (http://creativecommons.org/licenses/by/4.0/).
