Preprint
Article

Coupled miR-155 Deficiency and Hypoxia Lead to the Upregulation of SLC2A3 (GLUT3) and VEGFA in the Leukemic B-cells

Altmetrics

Downloads

137

Views

47

Comments

0

Submitted:

28 April 2023

Posted:

29 April 2023

You are already at the latest version

Alerts
Abstract
Hypoxia represents one of the key factors that stimulate the growth of leukemic cells in their niche. Leukemic cells in hypoxia are forced to reprogram their original transcriptome, miRNome, and metabolome. How the coupling of miRNAs/mRNAs helps to maintain or progress the leukemic status is still not fully described. MicroRNAs (miRNAs) regulate practically all biological processes within cells and play a crucial role in leukemia development/progression. Here we worked with the human cell line MEC-1 (human chronic lymphocytic leukemia (CLL)) where we deleted mature miR-155 by CRISPR/Cas9. MEC-1 cells in hypoxia showed a higher proliferation rate with a relatively low level of apoptosis. Interestingly, miR-155 deficiency decreased the proliferation rate in both, normoxia and hypoxia. Besides common hypoxia-related genes (HIF1α, EGLN1, VHL, HK1, and HK2), we also measured, genes for glucose transporters SLC2A1 (GLUT1) and SLC2A3 (GLUT3). Surprisingly, only SLC2A3 (GLUT3) showed significant overexpression in hypoxia conditions in miR-155 deficient MEC-1cells which points to the possible novel target of miR-155 in CLL. Increased glucose uptake and decreased lactate support our hypothesis that miR-155 deficiency and hypoxia transform cell metabolism. To conclude, miR-155 deficiency and hypoxia-impaired glucose metabolism stimulate GLUT3 in CLL cells.
Keywords: 
Subject: Biology and Life Sciences  -   Biology and Biotechnology

1. Introduction

Leukemic cells due to their high-energy demand are forced to balance the oxygen deprivation in their original microenvironment by altered metabolism [1]. One of the main manifestations of hypoxia at the cellular level is the modulation of cell proliferation. In general, cells adapt to hypoxia mainly by expression of hypoxia-inducible factor (HIF) proteins. This HIF family is highly sensitive to intra-tissue pO2 and regulate more than 200 genes [2]. The key molecule of this pathway represents Hypoxia induced factor 1α (HIF-1α) that is often up regulated in tumors due to intratumoral hypoxia or by activation of oncogenic pathways as TP53, PI3K, TGFβ, MYC, and NOTCH. HIF-1α is overexpressed and associated with aggressive behavior of leukemic cells and with low survival of patients [3]. Beside HIF-1α also the hypoxia-related genes (EGLN1, VHL, HK1, HK2, LDHA, VEGFA, PTEN, PI3KCA) participate on modulation of cell proliferation, metabolism and thus maintain the leukemic status [4]. CLL cells can get used to hypoxia conditions by metabolic adaptation that is connected with HIF-1α activity and changes in pyruvate uptake as a protection against hypoxia-associated oxidative stress [5]. In hypoxia, malignant cells increase their proliferation and glucose uptake through glycolysis [6]. The key sensors of glycolysis are glucose transporters (GLUT1, GLUT2 and GLUT3). There are only few papers describing the role of miR-155 in relation to the glucose metabolism but any in relation to miR-155 in CLL. Kim and colleagues find out that deletion of miR-155 in breast cancer cells abolish the glucose uptake [7]. Hypoxic cells produce lactate, signaling molecule and metabolic substrate that is involved in the glucose metabolism, fatty acid synthesis and redox homeostasis [8].
Beside the key molecules (HIF-related family proteins) that react on hypoxia very sensitively belong also microRNAs (small non-coding RNAs that negatively regulates gene expression) which react on hypoxia by extreme overexpression. This hypoxamiRNAs (highly expressed in hypoxia) significantly modulate gene expression through their targets thus improve adaptation of leukemic cells to hypoxia [9]. Among the most studied hypoxamiRNAs belongs miR-210 that is extremely overexpressed in hypoxia in several cancer cells and its overexpression is associated with poor prognosis [10]. Here we focus on the oncogenic and possible hypoxamiRNA, miR-155. MiR-155 is a vital regulatory molecule involved in multiple physiological processes, including hematopoietic lineage differentiation, immune response, and inflammation [11,12]. Moreover, expression of miR-155 is directly associated with leukemia or cancer progression and disease aggressiveness, CLL included [13,14,15]. As miR-155 is expressed ubiquitously in a wide range of cells and therefore any new information about the function of miR-155 will be very valuable in any aspect of cell biology.
In CLL, under conditions of hypoxia, miR-155 activity is closely related to HIF1α and VHL, which are the targets of this miRNA. MiR-155 act as inhibitor of tumor-suppressor pVHL that control degradation of HIF1α protein. Overexpression of miR-155 leads to HIF-1α protein stability in CLL cells [16]. Griggio et al. reported that different aberration in tumor-suppressor gene TP53 also associated with higher level of HIF-1α expression [17] and with unfavorable prognosis of CLL patients [18].
In this study, we tracked the role of oncogenic and hypoxic miR-155 in CLL MEC-1 cells. We aimed to answer the question whether miR-155 deficiency affects the cell proliferation, cell cycle dynamics and gene expression profile under hypoxic vs normoxic conditions. Hypoxia leads to modulation of miR-155 expression in CLL-cells that drives cell proliferation, switches glucose and lactate metabolism.

2. Materials and Methods

2.1. Cell line and working model

We acquired the original MEC-1 cell line as a kind gift from Marek Mraz, M.D., Ph.D. We modified the original MEC-1 cells by CRISPR/Cas9 tool. CRISPR/Cas9 plasmid (U6gRNA-Cas9-2A-GFP MiR155) was introduced into MEC-1 cells by nucleofection by Amaxa Nucleofector II (Lonza) with use of B-cell nucleofection kit (#VPA1001, Lonza) and U-015 program. CRISPR/Cas9 plasmid we ordered by Sigma and targeted mature hsa-miR-155-5p sequence was designed at home laboratory. MEC-1 cell line was cultured in IMDM medium (#LM-I1090, Biosera) supplemented with 10 % of fetal bovine serum (#FB-1090, Biosera), 1 % of P/S (#P4333, Sigma Aldrich) at 37°C in 5 % CO2 incubator. We followed the recommended protocol for cell culturing from DSMZ for MEC-1 cells (ACC-497). In case of hypoxia MEC-1 cell line was incubated in hypoxic chamber (Coy O2 Controlled InVitro Glove-Box - Hypoxia Chamber, Genetica) in IMDM medium supplemented with 10 % of fetal bovine, 1 % of P/S at 37°C, 1 % O2 (for optimizing experiments we used 0.2 %, 1 % and 5 % O2) and 5 % CO2 for 24, and 48 hours (for optimizing experiments also 72, 96 and 120 h). After cells were collected for RNA isolation, proliferation (WST-1 assay), cell viability (AnnexinV/PI staining), and cell cycle (BrdU staining) tests.

2.2. Chemically induced hypoxia

For chemically induced hypoxia in vitro by Deferoxamine mesylate salt – DFO (#D9533, Sigma-Aldrich) and Dimethyloxalylglycine, N-(Methoxyoxoacetyl)-glycine methyl ester – DMOG (#D3695, Sigma-Aldrich) were used 2×10⁶ cells/well cultured in IMDM medium (LM-I1090, Biosera) supplemented with 10 % of fetal bovine serum (#FB-1090, Biosera), 1 % of P/S (#P4333, Sigma Aldrich). Cells were incubated for 3, 6, and 24 hours at 37°C in 5 % CO2 with DFO (final concentration 200 uM) and DMOG (final concentration 1 mM). After each abovementioned, time points of incubation with DFO or DMOG, cells were collected, and total RNA was extracted for further gene expression detection. In parallel cells were collected for flow cytometry measurement of apoptosis (AnnexinV/PI staining).

2.3. Proliferation and cell viability tests

WST-1 assay a nonradioactive, spectrophotometric quantification of the cell proliferation and viability was performed by following manufacturer’s protocol (ROCHE, #11 644 807 001). MEC-1 cells seeded 5×10⁴ cells per well (used 96 well plate, flat bottom) in culture medium. Cells were then incubated with 10 µL of cell proliferation reagent WST-1 solution for 3 hours (in normoxia and hypoxia conditions (1 % O2). After 3 hours, the substrate reaction absorbance was determined at 440 nm wavelength (for blank the wavelength 600 nm was used) by using Spark® multimode microplate reader (TECAN) spectrophotometer (Tecan i-control, 1.10.4.0, infinite 200Pro). The absorbance of blank was subtracted from measured samples wavelength. Data are from 3 independent experiments. Statistics: t-test, two-tailed, paired was used.
Cell growth curve was created by cell count determined by hemocytometer (counting-chamber). Cells were counted daily for one week (in parallel normoxia vs hypoxia conditions 1 % O2). Seeding density of cells at day 0 was 10 000. Data are from 3 independent experiments (samples were done in quadruplicate). Statistics: t-test, two-tailed, paired was used.
Annexin V/PI staining was performed for evaluation of apoptotic and dead cells. Briefly, MEC-1 cells (1x10⁶ cells) were washed with 1×PBS and resuspended in 1× Annexin V binding buffer. After cells were stained by 5 µL of Annexin V (FITC, # BMS500FI-300, Invitrogen) and incubated for 15 min at RT. After cells were washed once with 1×PBS and kept on ice until measurement on flow cytometer. Shortly before measurement 5 µL of PI (# BMS500FI-300, Invitrogen) was added. Data were evaluated by Diva software and the measurement was performed with the use of the FACS Canto II BD flow cytometer (30 000 events).

2.4. Cell cycle measurement by BrdU flow kit (# 552598, BD)

For BrdU staining 2×10⁶ cells/well was used. To MEC-1 cells culture were added 30 uL of BrdU (final concentration 1 uM) and stained for 20 min at 37°C in 5 % CO2 and 21 % O2 under normoxic and under hypoxic (1 % O2) conditions. Followed by the manufacturer’s protocol of BrdU kit. Before flow cytometry measurement cells were stained with 7AAD (provided by BrdU kit, 20 uL/tube) for 10 min on ice. Measurement was performed on cytometer FACS Canto BD (50 000 events). For data visualization, the software FlowJo was used.

2.5. RNA isolation and qRT-PCR

Total RNA including microRNA was extracted from MEC-1 cells (2×10⁶) by TRI reagent (#TR118, MRC) and 100 ng reverse-transcribed by High-Capacity cDNA Reverse Transcription Kit with RNase Inhibitor (#4374966, ThermoFisherScientific) with slight modification as o.n. precipitation with isopropanol at -20°C, followed by manufacturer’s protocol. TaqMan-based PCR with specific probes (Universal Probe Library, ROCHE and ThermoFisherScientific primers designed with probes) was performed on QS7Pro instruments (ThermoFisherScientific, former ABI). As reference genes, GAPDH and RNU44 were used. The miRNA/mRNA expression was calculated by 2ddCT algorithm from target and reference CT values (specific (s) and control (c) amplicons calculated by 2−(CTc-CTs) equation) [19]. Statistics t-test, two tailed, paired was used (* p<0.05; ** p<0.01; *** p<0.001; ****p<0.0001).

2.6. Western Blot

Cells were lysed (2 × 10⁶) in RIPA buffer and sonicated (1 cycle, 10” at 40 % power). Four micrograms of proteins were separated by 1-D polyacrylamide gel electrophoresis (Mini-PROTEAN® TGX™ Precast Gels, Bio-Rad). Proteins were transferred to Immuno-Blot® PVDF Membrane (#1620174, Bio-Rad) using Trans-Blot® Turbo™ Transfer System (Bio-Rad) and probed with primary antibody overnight at 4 °C (anti-HIF-1α, sc-10790; anti-GAPDH sc-51907, Santa Cruz Biotechnology). Next day membrane was washed with 1×TBS and probed with secondary anti-rabbit antibody (Sigma-Aldrich), conjugated with horseradish peroxidase and detected using detection kit (#1705060, Clarity™ Western ECL Substrate, Bio-Rad). Signal was detected using ChemiDoc MP Imaging System (Bio-Rad).

2.7. Metabolic assays

Mitochondria isolation was followed by protocol referred in [20]. Mitochondria protein content was measured by BCA kit (#BCA1-1KT, Sigma-Aldrich) on Biotek Synergy HT Microplate Reader at 562 nm wavelength, concentration of protein was calculated using standard curve prepared using the BSA protein standards.
Electron transport chain form complex I to complex III was followed protocol in [20]. Absorbance (reduction from succinate to cytochrome C) was red at 550 nm wavelength for 6 minute (1 read/15 seconds) on Biotek Synergy HT Microplate Reader. Results were calculated according to Lambert-Beer equation.
Glucose Uptake-GloTM Assay (#J1341, Promega) were used according to the manufacturer´s manuals. The MEC-1 cells were cultured in normoxia and hypoxia (1 % O2, 24, and 48 hours), then counted and 5×10⁴ cells transfer to a non-translucent 96 well cell culture plate. The reaction solution from the kit was added and cell luminescence was recorded at 570 nm wavelength on Spark® multimode microplate reader (Tecan i-control, 1.10.4.0, infinite 200Pro).
Lactate Assay (#MAK064, Sigma-Aldrich) were used according to the manufacturer´s manual. The MEC-1 cells were cultured in normoxia and hypoxia (1 % O2, 24, and 48 hours), then cells were centrifuge (350´ g, RT, 5 min.) and 10 uL of supernatant were aspirate for assay and transfer to 96-well plate in duplicates. Each sample was brought to final volume of 50 mL/well with Lactate Assay Buffer. The reaction solution from the kit was mixed and 50 uL of Master Reaction Mix was added to each sample. 96-well were incubate for 30 minutes at RT protected from light. Colorometric absorbance was measured on Biotek Synergy HT Microplate Reader at 570 nm wavelength. Concentration of lactate was calculated using standard curve.

3. Results

3.1. Optimization of oxygen level and time points for in vitro culturing of MEC-1 cells in hypoxia chamber.

From the literature is known that oxygen level in the tissue, blood, bone marrow is very heterogeneous and especially in circulating cells by crossing barriers of tissues. Researchers described relatively wide interval of oxygen level, between 1 - 11 % in the normal tissues and in the tumor below 2 % [21]. Available experimental data with hypoxia conditions are inconsistent, therefore, our first aim was to optimize the oxygen level and time points for further planned hypoxia experiments in this study. First, we cultured MEC-1 cells (ctrl and miR-155-/-) in different oxygen level (0.2 %, 1 % and 5 %) in the hypoxic flow box. The criteria for selection the most suitable oxygen level for our CLL model - the MEC-1 cells were high expression level of hypoxia related genes (HIF1α, EGLN1, VEGFA, GLUT1, GLUT3, HK1, and HK2) and low level of apoptosis (TP53INP1). Based on the highest expression level of HIF1α, LDHA, HK1, and GLUT3 in the setting of 1 % O2 in the hypoxic box, we set, as this concentration is the most suitable for our further experiments (Figure 1A). Although the HIF1α showed the highest expression level in 5 % O2 but we decided for the most suitable concentration 1 % because in 5 % O2 MEC-1 cells showed the highest expression TP53INP1 (Tumor Protein P53 Inducible Nuclear Protein 1), the anti-proliferative and pro-apoptotic protein. Next, we optimized the best time point for incubation of MEC-1 cells in 1 % O2 concentration. With prolonged incubation in hypoxia the level of apoptosis increased, so the best time point where cells were viable based on the expression level of TP53INP1, we set 24 h and 48 h the most suitable for further experiments (Figure 1B). Panel C in the Figure 1 contains final selection of gene expression profile detected under 1 % hypoxia within 24 and 48 h time points. This gene expression data points on the extremely elevated levels of hypoxamiRNA, the miR-210 in ctrl and miR-155 -/- MEC-1 cells in 1 % hypoxia. Among the hypoxia related genes, the highest level showed EGLN1, VEGFA and GLUT3 mRNAs. The absence of miR-155 in MEC-1 cells probably disadvantages the leukemic cells adaptation to hypoxia condition (Figure 1C). The general low expression level of HIF1α (also at the protein level Supplemental Figure 1) could be caused by high level of EGLN1 (as its primary function is to degrade HIF1α) or another secondary effect of miRNAs regulatory pathway.

3.2. Higher proliferation rate of MEC-1 cells in hypoxia is miR-155 dependent.
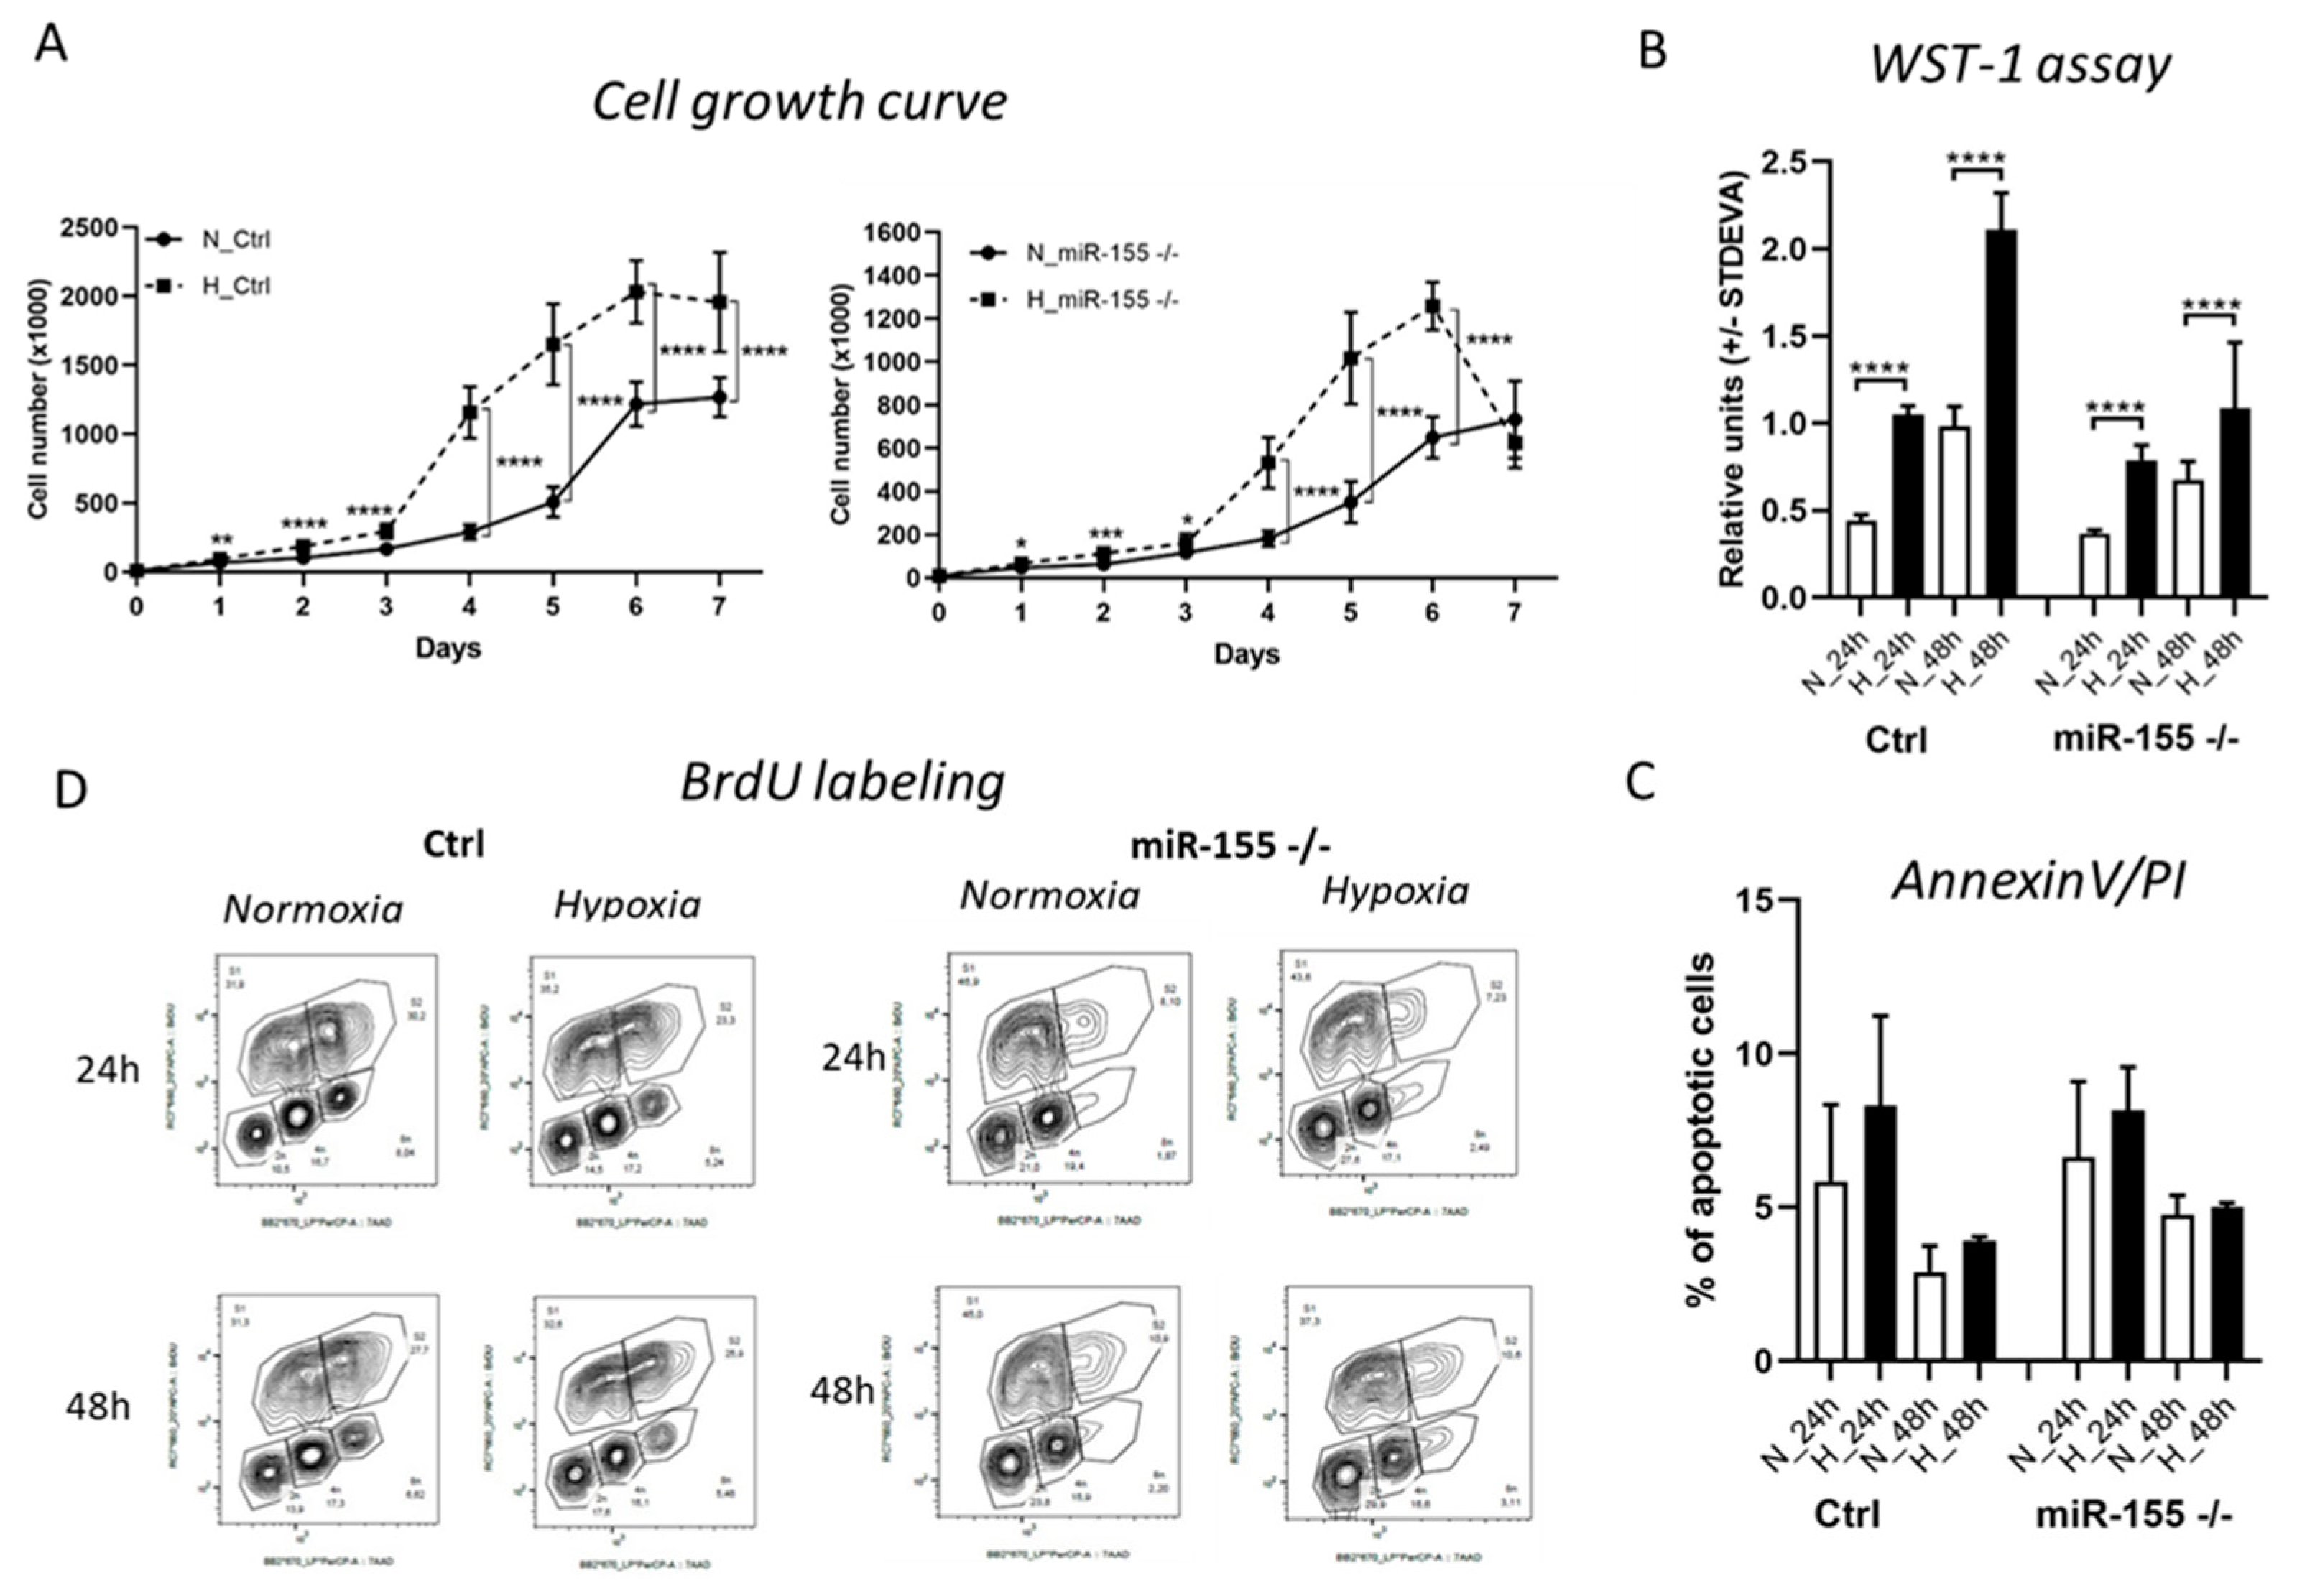
Hypoxia in general stimulates leukemic and cancer cells proliferation. Here we asked if the deletion of oncogenic and probably hypoxamiRNA, miR-155 in MEC-1 cells shows effect on the proliferation rate in the hypoxia conditions. In concordance with our hypothesis, miR-155 deficiency (miR-155 -/-) significantly decreased proliferation rate not only in normoxia but also in hypoxia (Figure 1A,B). Cell growth curve supports this notion, miR-155 deficiency decreased cell proliferation and cell number in half in comparison to MEC-1 cells with high miR-155 expression in hypoxia (Figure 1A). Similarly, significant depletion of proliferative cells caused by miR-155 deletion was observed by WST-1 proliferation assay (Figure 1B). This decreased proliferation rate was not caused by increased apoptosis in absence of miR-155, as it might seem (Figure 1C). For detection of the cell cycle dynamics, we labelled MEC-1 cells by BrdU. Interestingly, hypoxia does not influence the cell cycle kinetics of MEC-1 cells (ctrl, miR-155 deficient). However, we observed changes in G0/G1 and S phases depending on the presence of miR-155 in MEC-1 cells. MiR-155 deficiency shifts cells for more time in the G0/G1 phase and for a shorter time in the S phase of cell cycle (Figure 1D). To conclude this part, hypoxia significantly stimulates proliferation rate of MEC-1 cells without increased apoptosis. MiR-155 is important for cell growth, its absence even in hypoxia results to lower proliferation rate of MEC-1 cells.
Figure 2. Proliferation rate and cell viability of MEC-1 cells during hypoxia. A The cell growth curve of MEC-1 cells (ctrl and miR-155 -/-) in normoxia (N) vs hypoxia (H). Cells were counted within 7 days in hemocytometer chamber. Data are from three independent experiments and for statistics t-test, two tailed, paired was used (* p<0.05; ** p<0.01; *** p<0.001; ****p<0.0001). B Cell viability was measured by WST-1 assay in both normoxia vs hypoxia in 24 h and 48 h time points. Data are from three independent experiments and for statistics t-test, two tailed, paired was used (* p<0.05; ** p<0.01; *** p<0.001; ****p<0.0001). C Percentage of apoptotic cells measured by flow cytometry after Annexin V / PI staining. Cells were stained in parallel in normoxia and hypoxia conditions in 24 h and 48 h time points. Data are from two independent experiments. Statistics t-test, two tailed, paired was used. D Detection of the cell cycle kinetics by BrdU labelling in normoxia vs hypoxia in 24 h and 48 h. Data are from two independent experiments.
Preprints 72181 g002

3.3. Chemically induced hypoxia stimulates hypoxia genes and hypoxamiR-210 in MEC-1 cells.

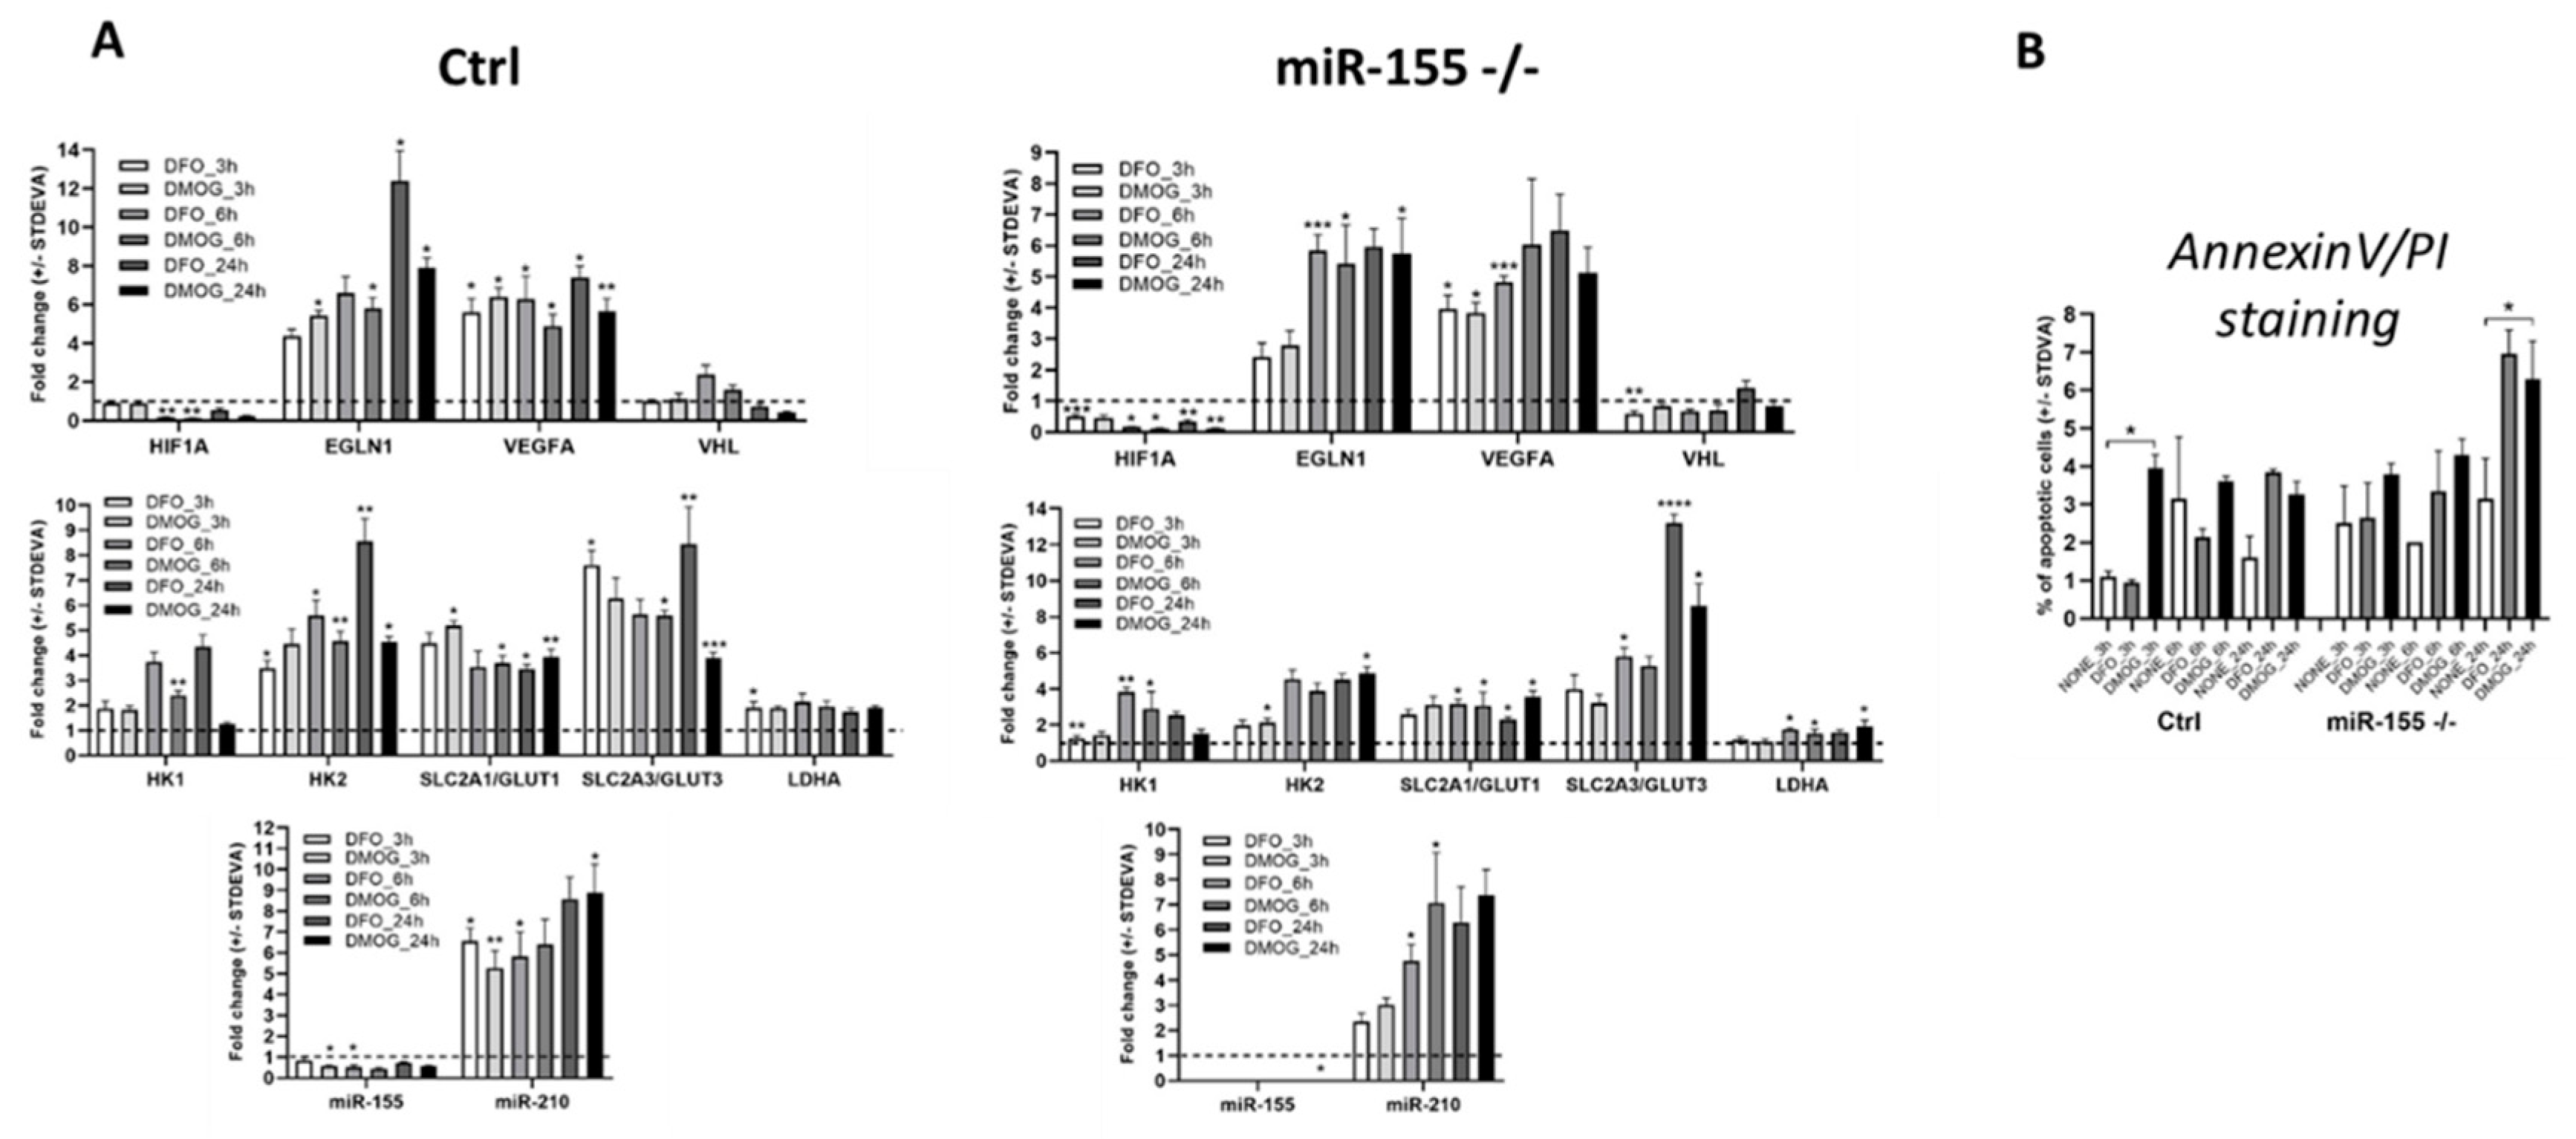
We induced hypoxia chemically by DFO and DMOG in MEC-1 cells to validate the data from hypoxia performed in hypoxia flow box. Chemical inducers of hypoxia DFO and DMOG operate very fast thus, we select short time points as 3 h, 6 h and 24 h (Figure 3A). Elevated expression of hypoxia-related genes especially EGLN1, VEGFA, GLUT3 and hypoxamiRNA-210 showed higher fold change in comparison to expression level in MEC-1 cells in hypoxia flow box (Figure 3A and Figure 1C). Interestingly, expression of miR-155 in hypoxia does not increased as we expected. This could be due to of secondary effect of some miR-155 target. Both chemical inducers of hypoxia showed similar trend in gene expression. As these chemicals induce total hypoxia in cells, we measured level of apoptosis in all time points and both chemicals in MEC-1 cells. Based on the flow cytometry data from measurement of Annexin V/PI we could conclude that in abovementioned conditions the chemically induced hypoxia does not cause apoptosis in MEC-1 cells. In the later time point, 24 h we detected higher level of apoptotic cells (~ 6 - 7 %) but this range is still normal level detected in the culturing cells (Figure 3B). To sum up this part, chemically induced hypoxia confirmed the gene expression profile of MEC-1 cells detected in hypoxia in hypoxia flow box. Level of apoptotic cells after chemically induced hypoxia does not increased.

3.4. Cellular metabolism of leukemic cells during hypoxia significantly depends on the presence of miR-155.

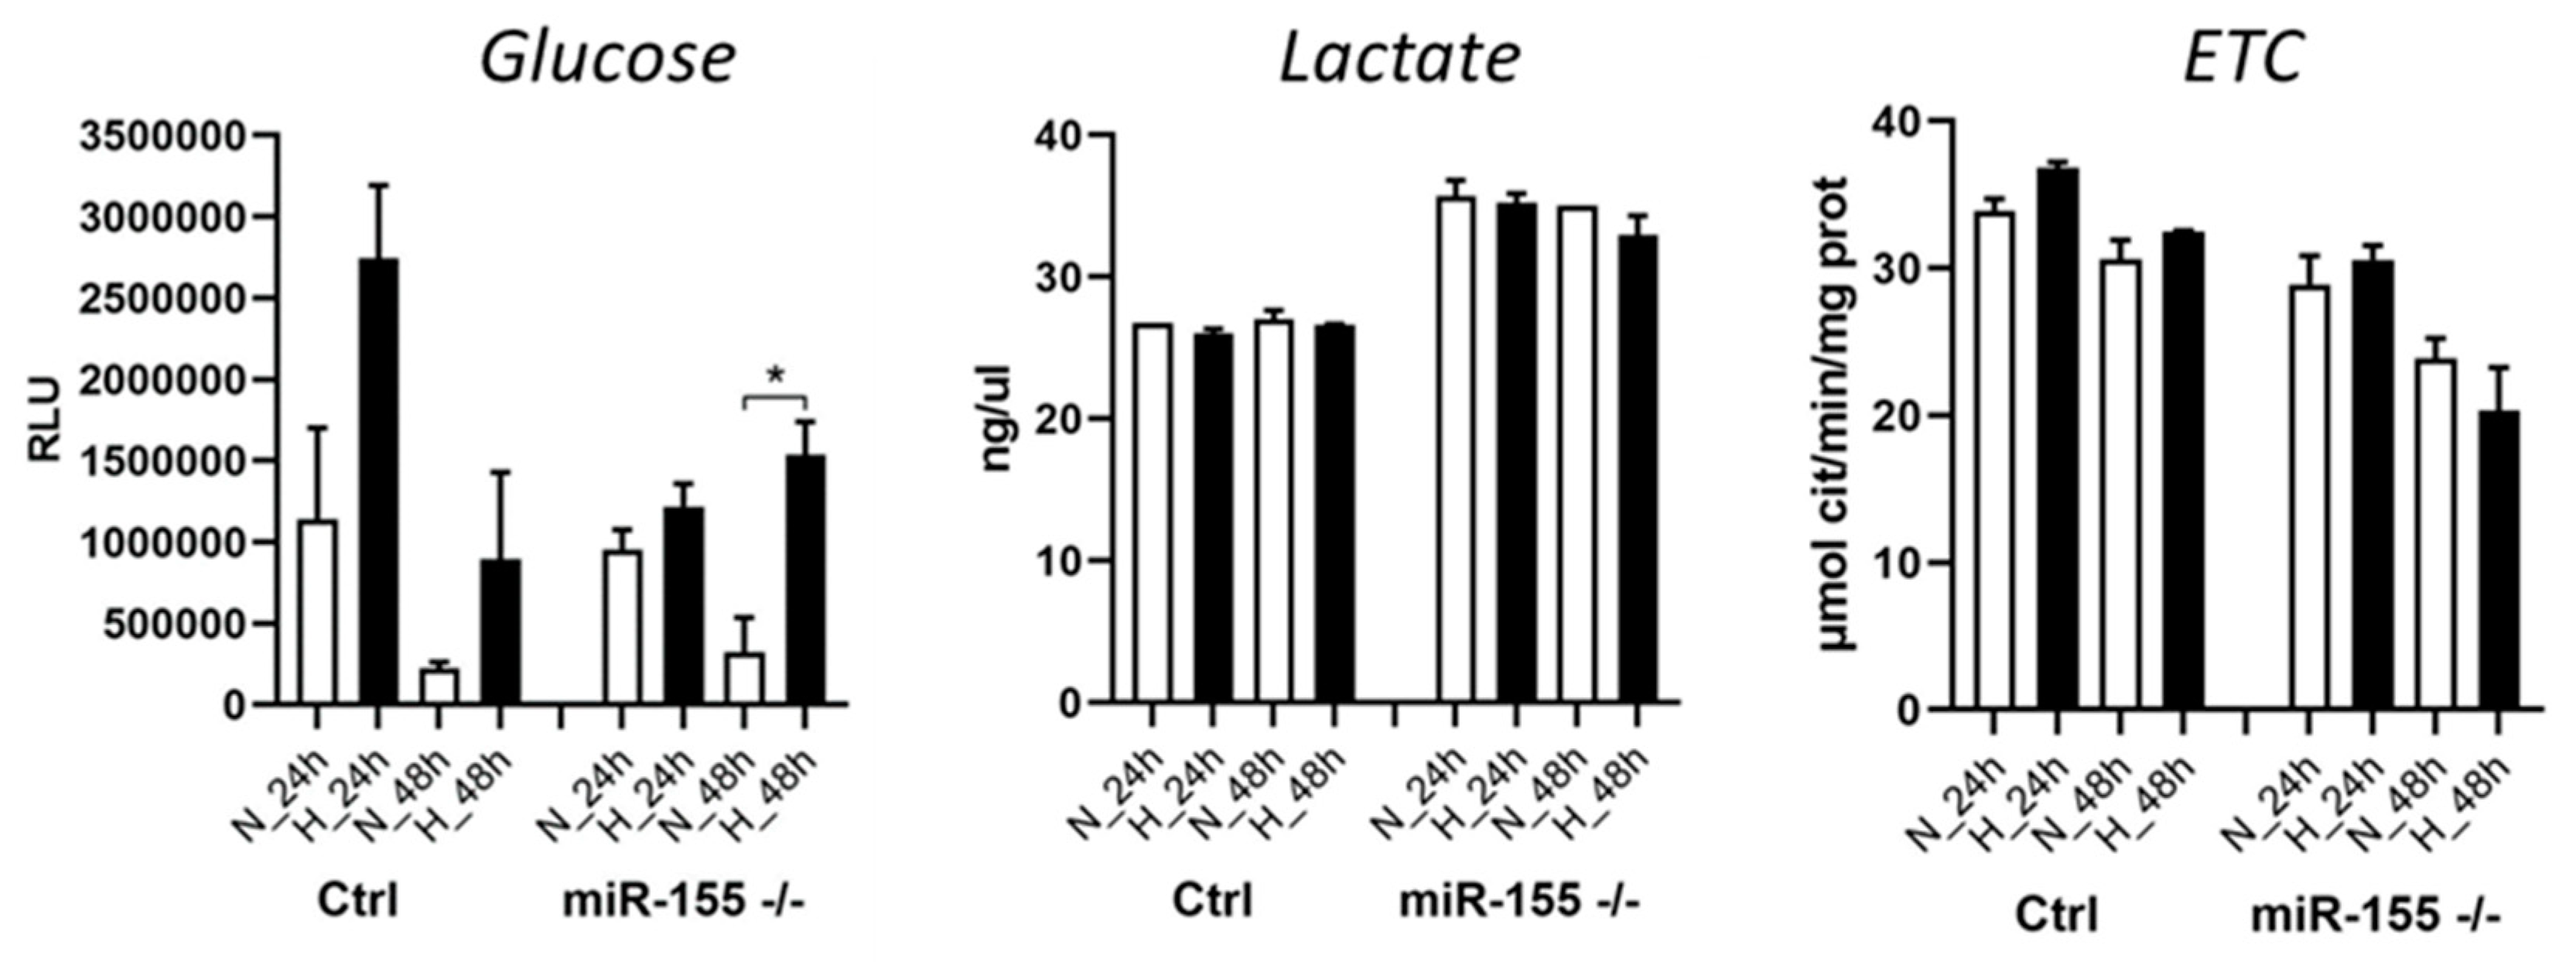
In the cancer/leukemia cells, when cells are in oxygen-deprivation conditions (hypoxia), this hypoxic conditions shift their cellular metabolism from oxidative phosphorylation to glycolysis. This results in an increased glucose uptake. Here we asked whether absence of miR-155 in MEC-1 cells during hypoxia also result in higher glucose uptake. Interestingly, miR-155 deficiency led to increased glucose uptake in hypoxia but in lesser extend in comparison to cells with high miR-155 (Figure 4). From our previous experiments (mRNA-seq), we know that miR-155 deficiency results in LDHA overexpression, so we decided to perform measurement of lactate by Lactate-GLO assay in hypoxia too. Data showed that hypoxia induces the production of lactate in cells, more rapidly in miR-155 deficient MEC-1 cells (Figure 4). Mitochondria represents key organelle of cellular metabolisms, so we measured also the activity of cytochrome C complex in mitochondria in MEC-1 cells under hypoxia. It seems that absence of miR-155 inhibits ETC in MEC-1 cells in hypoxia (Figure 4). This all points to the rapid changes in the cellular metabolism of MEC-1 cells under hypoxia significantly depending on the presence of miR-155.

4. Discussion

Hypoxia is a hallmark of cancer and hematopoietic niche that maintains proliferation of cells. Hypoxia modulates cell cycle, transcriptome and cellular metabolism. The metabolic response to hypoxia results in shift of ATP production to glycolysis and lactic acid fermentation at the expense of oxidative phosphorylation [22]. In this study, we aimed to describe how oncogenic miR-155 influences CLL cells in hypoxia in the term of transcriptome, miRNOme and metabolom. In general, there is not a uniform and exact opinion among researchers on the oxygen level (percentage) in the leukemic niche and its application for in vitro conditions in laboratory. From literature is known that oxygen level in normal tissues varies between 1 and 11 % and in tumor is below 2 % [21]. The B-cells are characterized by intensive migration and circulation in our body, from blood stream with kvasi normoxia into tissues (spleen, lymph nodes) with different hypoxia level [23]. In line with this Koczula KM et al, 2016 performed detailed analysis of oxygen level in CLL cells in vivo by NMR technique [5]. Further, they find out that CLL cells are very flexible to oxygen level and could rapidly adapt by modulating their transcriptome and metabolome [5]. The main message of this great work with primary CLL cells points on very heterogeneous oxygen level in our body and extreme plasticity of CLL cells. CLL cells migrate (blood stream, lymph nodes, spleen, bone marrow) from almost normoxia in the circulating blood into lymph nodes where is above 3 % of O2. In order to determine the best range of oxygen level concentrations to be used in further experiments, we optimized the oxygen levels (0.2 %, 1 % and 5 %) and time points (24 h - 120 h) (Figure 1A,B). Based on the highest expression level of hypoxia-related genes as LDHA, EGLN1 and GLUT1, GLUT3 and the lowest expression of pro-apoptotic gene TP53INP1 we find out as the best in vitro hypoxia condition at 1 % oxygen and in the period of 24 and 48 h (Figure 1C). Similarly, Koczula KM et al, 2016 confirmed hypoxia by overexpression of mRNAs of LDHA, VEGF and GLUT1 in primary CLL cells [5]. In the blood stream, the CLL cells are used to hypoxia and characterized by high HIF-1α expression when entering into lymphoid tissues [5]. In lymphoid tissues the CLL cells by its interaction with accessory cells, usually stromal cells, are constantly supplied by essential signals for their survival and proliferation that contribute to drug resistance and apoptosis [24]. The HIF-1α expression is induced also by PI3K and ERK mitogen-activated protein kinase (MAPK) signaling in stromal cells [25]. Surprisingly, we were not able to detect increased level of HIF1α at mRNA (Figure 1C) and at the protein level (Supplemental Figure S1). We assume that it could be due to the increased level of EGLN1, PI3K3CA and low level of VHL as this are the key regulators of HIF1α and direct targets of miR-155. Hypoxia modulates besides transcription factors and other molecules also microRNAs, which react by their extreme expression. Among the well-described hypoxamiRNAs belongs miR-210 [10]. MEC-1 cells react on hypoxia with elevated level of miR-210 that is in concordance with others ([10] and reviewed in [26]). Another reason why we were not able to detect HIF1α could be its replacement by HIF-2 signaling after longer exposure of cells to hypoxia [10]. Hypoxia condition could be induced experimentally by using different methods and molecules [27]. To validate the in vitro hypoxia accomplished in the hypoxic flow box we induced hypoxia in CLL (MEC-1) cells chemically. Thus, MEC-1 cells were treated with 2-OG analogue, dimethyloxalylglycine (DMOG), a competitive inhibitor of prolyl hydroxylase domain-containing proteins and with deferoxamine mesylate salt (DFO), an iron-chelating agent, both for 3, 6 h and 24 h (Figure 3). Both chemicals significantly induced hypoxia in vitro in similar actions. Surprisingly chemically induced hypoxia results in stronger expression of hypoxia-related genes as EGLN1, VEGF, HK2 and GLUT3 (Figure 3A) with relatively low level of apoptosis (Figure 3B). This is in accordance with others as mentioned in [28]. Low level of apoptosis is likely caused by pro-apoptotic and anti-apoptotic biphasic effects that appear during hypoxia and seems to be dependent upon cell types and their microenvironment. Increased cell proliferation in hypoxia especially cancer cells is common hallmark. Under normal conditions, cell proliferation decreases by low oxygen level or stress. In addition, overexpression of HIF-1α results in cell cycle arrest in normal cells (lymphocytes, keratinocytes, embryonic stem cells, and hematopoietic stem cells) [29]. However, the opposite situation happens in the malignant cells. In general, malignant cells proliferate in high rate and express high levels of HIF-1α not only due to hypoxia but also due to deregulated signaling pathways that increase their survival [9]. Here we detected significantly higher proliferation rate of MEC-1 cells in hypoxia depending on the presence of miR-155 (Figure 2A,B) and accompanied by relatively low apoptosis (Figure 2C). One of the potential explanation could be deregulation of HIF-dependent miRNA regulatory network. Overexpression of HIF-1α induces the expression of oncomiRNAs in malignant cells [9]. Sawai and colleagues selected 17 hypoxia related miRNAs (hypoxamiRNAs) in solid tumors, among them also miR-155 and miR-210. Similarly, these miRNAs were significantly changed in our MEC-1 cells (Figure 1C and Figure 3A). MiR-155 represents the key oncomiRNA and with its several combined roles in preventing apoptosis, modulated gene expression, blocking the phosphorylation of glucose, promotes many cancers and leukemia’s [11]. There is evidence that miR-155 actively involves in the glucose metabolism in breast cancer, concretely deletion of miR-155 abolishes the glucose uptake [7]. This is in line with our data, as MEC-1 cells reacts on the hypoxia by increased glucose uptake, more intensively in the presence of miR-155 (Figure 4). Next, direct target of miR-155 is HK2 (hexokinase 2; by current MiRTarBase) which phosphorylates glucose, thereby committing it to the glycolytic pathway. This is another evidence that glucose metabolism is controlled by miR-155. We detected increased level of HK2 in miR-155 deficient MEC-1 cells (Figure 1C and Figure 3A). On the contrary to glucose metabolism, absence of miR-155 increased lactate production in MEC-1 cells in hypoxia (Figure 4). This notion is in accordance with experiments performed on primary CLL cells, where the production of lactate was inversely correlated with glucose consumption [5].
To conclude, CLL cells dispose with high flexibility to adapt on the different oxygen levels by using coordinated changes in the transcriptome and metabolome. One possible mechanism of this adaptation could be through upregulation of glucose transporters (e.g. GLUT3) mediated by miR-155 downregulation

5. Conclusions

In the present study, we aimed to answer questions regarding the role of miR-155 (in term of proliferation and metabolism) on miRNA/mRNA profile in CLL cells under hypoxia. We confirmed the coupled effect of hypoxia and presence of miR-155 on the proliferation rate of CLL cells, where deletion of miR-155 inhibits cell growth in normoxia and in hypoxia. Hypoxia-related genes such as EGLN1, VEGFA, HK2, and especially GLUT3 were upregulated in hypoxia. We detected extreme expression of hypoxamiR-210 in CLL cells under hypoxia. We confirmed the effect of miR-155 presence on glucose metabolism by qRT-PCR and by metabolic assays. Interestingly, the downregulation of miR-155 in CLL cells stimulates the expression level of GLUT3 and VEGFA as a possible adaptation mechanism to hypoxia. Effective inhibition of key metabolites in the leukemic cells could be added to the current treatment options.

Supplementary Materials

The following supporting information can be downloaded at the website of this paper posted on Preprints.org, Figure S1: Immunoblot.

Author Contributions

Conceptualization, K.S.V.; methodology, E.G., L.D., T.H., M.B.; formal analysis, E.G., T.H., L.D, M.B.; investigation, E.G., L.D., T.H., M.B..; writing-original draft preparation, E.G., K.S.V.; writing-review and editing, E.G., L.D., T.H.; visualization, E.G., L.D., T.H.; supervision, K.S.V.; project administration, E.G, K.S.V.; funding acquisition, K.S.V., E.G. All authors have read and agreed to the published version of the manuscript.

Funding

This research was supported by the Charles University, Czech Republic grants PRIMUS/17/MED/16 (concretely researchers E.G. and K.S.V) and START/MED/089 (concretely researchers E.G., L.D., T.H and K.S.V), and by Youth and Sports grant of the Czech Republic PROGRES Q26/LF1 (concretely researchers E.G., L.D., T.H, M.B. and K.S.V).

Data Availability Statement

We encourage all authors of articles published in MDPI journals to share their research data. In this section, please provide details regarding where data supporting reported results can be found, including links to publicly archived datasets analyzed or generated during the study. Where no new data were created, or where data is unavailable due to privacy or ethical restrictions, a statement is still required. Suggested Data Availability Statements are available in section “MDPI Research Data Policies” at https://www.mdpi.com/ethics.

Acknowledgments

We thank to research groups led by Marta Coscia (Oncological Pharmacology Laboratory Department of Oncology, University of Torino, Italy) and by Chiara Riganti for their help with WB and metabolic assays (Department of Molecular Biotechnology and Health Sciences, University of Torino, Italy) and for critical comments. Authors also thank to Martin Vokurka (Head of The Institute of Pathological Physiology, First Faculty of Medicine, Charles University, Prague) for the institutional support.

Conflicts of Interest

The authors declare no conflict of interest.

References

  1. Infantino, V.; Santarsiero, A.; Convertini, P.; Todisco, S.; Iacobazzi, V. Cancer Cell Metabolism in Hypoxia: Role of HIF-1 as Key Regulator and Therapeutic Target. Int. J. Mol. Sci. 2021, 22. [Google Scholar] [CrossRef]
  2. Gacche, R.N.; Assaraf, Y.G. Redundant angiogenic signaling and tumor drug resistance. Drug Resist. Updat. 2018, 36, 47–76. [Google Scholar] [CrossRef]
  3. Singh, D.; Arora, R.; Kaur, P.; Singh, B.; Mannan, R.; Arora, S. Overexpression of hypoxia-inducible factor and metabolic pathways: possible targets of cancer. Cell Biosci. 2017, 7, 62. [Google Scholar] [CrossRef] [PubMed]
  4. Godet, I.; Shin, Y.J.; Ju, J.A.; Ye, I.C.; Wang, G.; Gilkes, D.M. Fate-mapping post-hypoxic tumor cells reveals a ROS-resistant phenotype that promotes metastasis. Nat. Commun. 2019, 10, 4862. [Google Scholar] [CrossRef] [PubMed]
  5. Koczula, K.M.; Ludwig, C.; Hayden, R.; Cronin, L.; Pratt, G.; Parry, H.; Tennant, D.; Drayson, M.; Bunce, C.M.; Khanim, F.L.; et al. Metabolic plasticity in CLL: adaptation to the hypoxic niche. Leukemia 2016, 30, 65–73. [Google Scholar] [CrossRef] [PubMed]
  6. Xie, H.; Simon, M.C. Oxygen availability and metabolic reprogramming in cancer. J. Biol. Chem. 2017, 292, 16825–16832. [Google Scholar] [CrossRef] [PubMed]
  7. Kim, S.; Lee, E.; Jung, J.; Lee, J.W.; Kim, H.J.; Kim, J.; Yoo, H.J.; Lee, H.J.; Chae, S.Y.; Jeon, S.M.; et al. microRNA-155 positively regulates glucose metabolism via PIK3R1-FOXO3a-cMYC axis in breast cancer. Oncogene 2018, 37, 2982–2991. [Google Scholar] [CrossRef] [PubMed]
  8. Li, X.; Yang, Y.; Zhang, B.; Lin, X.; Fu, X.; An, Y.; Zou, Y.; Wang, J.-X.; Wang, Z.; Yu, T. Lactate metabolism in human health and disease. Signal Transduct. Target. Ther. 2022, 7, 305. [Google Scholar] [CrossRef] [PubMed]
  9. Sawai, S.; Wong, P.-F.; Ramasamy, T.S. Hypoxia-regulated microRNAs: the molecular drivers of tumor progression. Crit. Rev. Biochem. Mol. Biol. 2022, 57, 351–376. [Google Scholar] [CrossRef] [PubMed]
  10. Moszyńska, A.; Jaśkiewicz, M.; Serocki, M.; Cabaj, A.; Crossman, D.K.; Bartoszewska, S.; Gebert, M.; Dąbrowski, M.; Collawn, J.F.; Bartoszewski, R. The hypoxia-induced changes in miRNA-mRNA in RNA-induced silencing complexes and HIF-2 induced miRNAs in human endothelial cells. FASEB J. 2022, 36, e22412. [Google Scholar] [CrossRef]
  11. Elton, T.S.; Selemon, H.; Elton, S.M.; Parinandi, N.L. Regulation of the MIR155 host gene in physiological and pathological processes. Gene 2013, 532, 1–12. [Google Scholar] [CrossRef] [PubMed]
  12. Faraoni, I.; Antonetti, F.R.; Cardone, J.; Bonmassar, E. miR-155 gene: a typical multifunctional microRNA. Biochim. Biophys. Acta 2009, 1792, 497–505. [Google Scholar] [CrossRef] [PubMed]
  13. Tang, L.; Peng, Y.-Z.; Li, C.-G.; Jiang, H.-W.; Mei, H.; Hu, Y. Prognostic and Clinicopathological Significance of MiR-155 in Hematologic Malignancies: A Systematic Review and Meta-analysis. J. Cancer 2019, 10, 654–664. [Google Scholar] [CrossRef] [PubMed]
  14. Vargova, K.; Pesta, M.; Obrtlikova, P.; Dusilkova, N.; Minarik, L.; Vargova, J.; Berkova, A.; Zemanova, Z.; Michalova, K.; Spacek, M.; et al. MiR-155/miR-150 network regulates progression through the disease phases of chronic lymphocytic leukemia. Blood Cancer J. 2017, 7, e585. [Google Scholar] [CrossRef] [PubMed]
  15. Ferrajoli, A.; Shanafelt, T.D.; Ivan, C.; Shimizu, M.; Rabe, K.G.; Nouraee, N.; Ikuo, M.; Ghosh, A.K.; Lerner, S.; Rassenti, L.Z.; et al. Prognostic value of miR-155 in individuals with monoclonal B-cell lymphocytosis and patients with B chronic lymphocytic leukemia. Blood 2013, 122, 1891–1899. [Google Scholar] [CrossRef] [PubMed]
  16. Ghosh, A.K.; Shanafelt, T.D.; Cimmino, A.; Taccioli, C.; Volinia, S.; Liu, C.; Calin, G.A.; Croce, C.M.; Chan, D.A.; Giaccia, A.J.; et al. Aberrant regulation of pVHL levels by microRNA promotes the HIF/VEGF axis in CLL B cells. Blood 2009, 113, 5568–5574. [Google Scholar] [CrossRef]
  17. Griggio, V.; Vitale, C.; Todaro, M.; Riganti, C.; Kopecka, J.; Salvetti, C.; Bomben, R.; Bo, M.D.; Magliulo, D.; Rossi, D.; et al. HIF-1α is over-expressed in leukemic cells from TP53-disrupted patients and is a promising therapeutic target in chronic lymphocytic leukemia. Haematologica 2020, 105, 1042–1054. [Google Scholar] [CrossRef]
  18. Kontos, C.K.; Papageorgiou, S.G.; Diamantopoulos, M.A.; Scorilas, A.; Bazani, E.; Vasilatou, D.; Gkontopoulos, K.; Glezou, E.; Stavroulaki, G.; Dimitriadis, G.; et al. mRNA overexpression of the hypoxia inducible factor 1 alpha subunit gene (HIF1A): An independent predictor of poor overall survival in chronic lymphocytic leukemia. Leuk. Res. 2017, 53, 65–73. [Google Scholar] [CrossRef]
  19. Livak, K.J.; Schmittgen, T.D. Analysis of relative gene expression data using real-time quantitative PCR and the 2(-Delta Delta C(T)) Method. Methods 2001, 25, 402–408. [Google Scholar] [CrossRef]
  20. Wibom, R.; Hagenfeldt, L.; Döbeln, U. von. Measurement of ATP production and respiratory chain enzyme activities in mitochondria isolated from small muscle biopsy samples. Anal. Biochem. 2002, 311, 139–151. [Google Scholar] [CrossRef]
  21. Lee, P.; Chandel, N.S.; Simon, M.C. Cellular adaptation to hypoxia through hypoxia inducible factors and beyond. Nat. Rev. Mol. Cell Biol. 2020, 21, 268–283. [Google Scholar] [CrossRef] [PubMed]
  22. Sebestyén, A.; Kopper, L.; Dankó, T.; Tímár, J. Hypoxia Signaling in Cancer: From Basics to Clinical Practice. Pathol. Oncol. Res. 2021, 27, 1609802. [Google Scholar] [CrossRef] [PubMed]
  23. Burrows, N.; Maxwell, P.H. Hypoxia and B cells. Exp. Cell Res. 2017, 356, 197–203. [Google Scholar] [CrossRef]
  24. Hanna, B.S.; Öztürk, S.; Seiffert, M. Beyond bystanders: Myeloid cells in chronic lymphocytic leukemia. Mol. Immunol. 2019, 110, 77–87. [Google Scholar] [CrossRef]
  25. Seiffert, M. HIF-1α: a potential treatment target in chronic lymphocytic leukemia. Haematologica 2020, 105, 856–858. [Google Scholar] [CrossRef] [PubMed]
  26. Adhi Pangarsa, E.; Rizky, D.; Setiawan, B.; Santosa, D.; Mubarika Haryana, S.; Suharti, C. Crosstalk between hypoxia and inflammation in non-Hodgkin lymphoma. Bali Med J. 2022, 11, 1063–1073. [Google Scholar] [CrossRef]
  27. Rinderknecht, H.; Ehnert, S.; Braun, B.; Histing, T.; Nussler, A.K.; Linnemann, C. The Art of Inducing Hypoxia. Oxygen 2021, 1, 46–61. [Google Scholar] [CrossRef]
  28. Guo, M.; Song, L.-P.; Jiang, Y.; Liu, W.; Yu, Y.; Chen, G.-Q. Hypoxia-mimetic agents desferrioxamine and cobalt chloride induce leukemic cell apoptosis through different hypoxia-inducible factor-1alpha independent mechanisms. Apoptosis 2006, 11, 67–77. [Google Scholar] [CrossRef]
  29. Hubbi, M.E.; Gilkes, D.M.; Hu, H.; Kshitiz; Ahmed, I. ; Semenza, G.L. Cyclin-dependent kinases regulate lysosomal degradation of hypoxia-inducible factor 1α to promote cell-cycle progression. Proc. Natl. Acad. Sci. U. S. A. 2014, 111, E3325–34. [Google Scholar] [CrossRef]
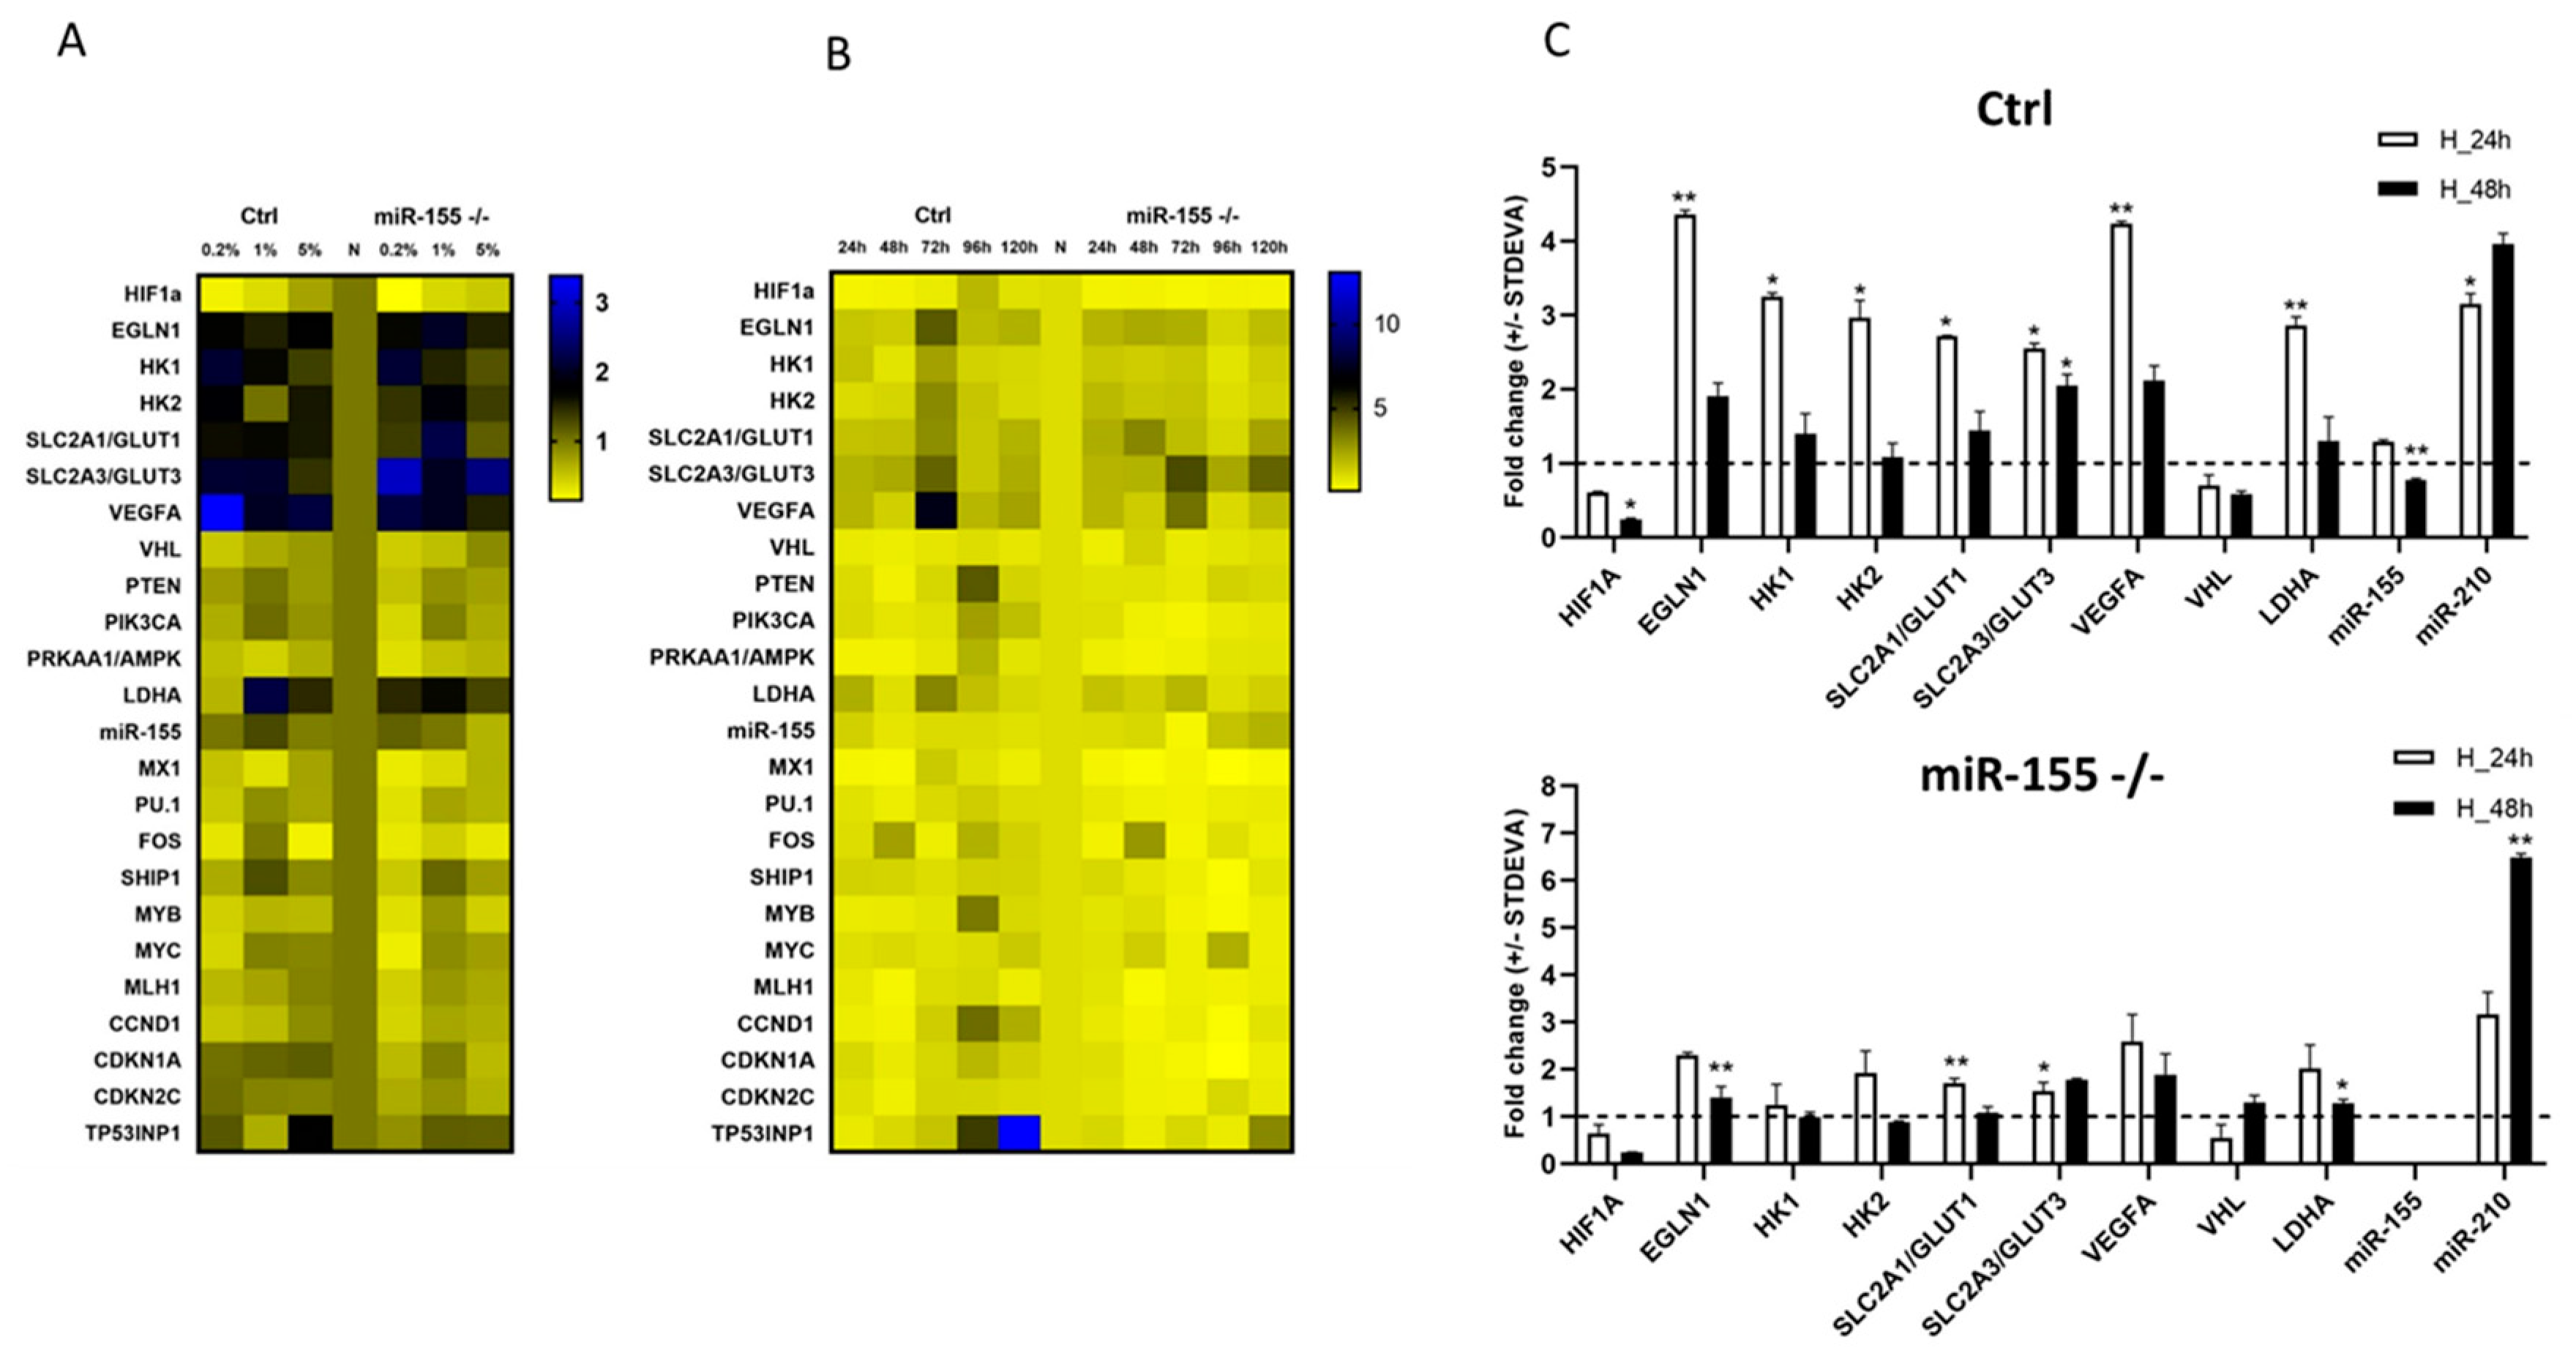
Figure 1. Optimization of oxygen level in in vitro culturing of MEC-1 cells based on the gene expression profiling. Graphs show the gene expression (TaqMan based qRT-PCR) profiles of MEC-1 cells (ctrl and miR-155 deficient clone #48 (miR-155-/-)) in normoxia vs hypoxia. A Heat map shows changes in the mRNA/miRNA expression level in hypoxia in MEC-1 Ctrl and miR-155 -/- cells. Hypoxia conditions were set as follows: 0.2 %, 1% and 5 % O2 for a period of 24 hrs. B Heat map shows changes in the in the mRNA/miRNA expression level in 1 % O2 (hypoxia) in MEC-1 Ctrl and miR-155 -/- cells in different time-points (24 h – 120 h). C Bar graphs show the expression level of selected hypoxia-related genes measured in the final hypoxia and time-point settings in MEC-1 cells, 1 % and 24 h - 48 h, respectively. In all graphs, expression data were normalized to expression level in normoxia and set as 1. As reference gene for mRNA the GAPDH was used and for miRNA the level the RNU44. Data are from three independent experiments and for statistics t-test, two tailed, paired was used (* p<0.05; ** p<0.01; *** p<0.001; ****p<0.0001).
Preprints 72181 g001
Figure 3. Chemically induced hypoxia in vitro in MEC-1 cells. A MEC-1 cells (ctrl left part of panel A; miR-155 deficient right part of the panel A) were treated with chemicals DFO and DMOG for 3, 6 and 24 h that induce total hypoxia in cells in vitro. Gene expression profile contains the same set up of genes as in hypoxia experiments performed in hypoxia flow box. In all graphs, expression data were normalized to expression level in normoxia and set as 1. As reference gene for mRNA the GAPDH was used and for miRNA the level the RNU44. Data are from two independent experiments and for statistics t-test, two tailed, paired was used (* p<0.05; ** p<0.01; *** p<0.001; ****p<0.0001). B Cell viability of MEC-1 cells after chemically induced hypoxia was assessed by flow cytometry measurement of Annexin V/PI. Cells were stained in parallel in normoxia (NONE) and chemically induced hypoxia in 3 h, 6 h and 24 h time points. Data are from two independent experiments. Statistics t-test, two tailed, paired was used.
Preprints 72181 g003
Figure 4. Measurement of glucose, lactate, and ETC by metabolic assays. For the assessment of glucose uptake in MEC-1 cells (ctrl and miR-155 -/-) in normoxia vs hypoxia we performed the analysis of glucose uptake by following the manufacturer's protocol from Glucose GLO kit. Similarly, was assessed the concentration of Lactate. The electron transport chain form complex I to complex III (ETC) was measured by following protocol in [20]. All experiments with different metabolites were repeated twice in 1 % hypoxia at 24 h and 48 h time points. Statistics t-test, two-tailed, paired was used.
Preprints 72181 g004
Disclaimer/Publisher’s Note: The statements, opinions and data contained in all publications are solely those of the individual author(s) and contributor(s) and not of MDPI and/or the editor(s). MDPI and/or the editor(s) disclaim responsibility for any injury to people or property resulting from any ideas, methods, instructions or products referred to in the content.
Copyright: This open access article is published under a Creative Commons CC BY 4.0 license, which permit the free download, distribution, and reuse, provided that the author and preprint are cited in any reuse.
Prerpints.org logo

Preprints.org is a free preprint server supported by MDPI in Basel, Switzerland.

Subscribe

© 2024 MDPI (Basel, Switzerland) unless otherwise stated