1. Introduction
Walnut, as a characteristic dried fruit in Xinjiang, is favored by consumers worldwide because of its outstanding taste and high nutritional value. With consumer demand for processed walnut products growing, the internal quality of walnuts with shells plays a decisive role in purchases. After picking, internal defects such as protein deterioration, flavor loss, shriveled seed kernel and empty shell, and external mechanical damage in walnuts can occur during transportation, processing and storage [
1]. These seriously declined in the grade and commodity rate of walnuts and greatly weakened the market competitiveness. At present, detection method used to identify the internal quality of walnuts is manual detection, physical means or stoichiometry. However, the methods are time-consuming, labor-intensive and inherently destructive. Therefore, a quick, effective and non-destructive method for the internal defects of walnuts is highly desirable.
Among the non-destructive detection technology, X-ray radiography is especially interesting in the field of internal quality inspection for the agricultural produce, because it has good depths of X-rays and can be easily implemented inline [
2]. Recently, it has been widely used in research to detect internal disorders in fruit or nuts. Shahin et al. [
3]utilized the X-ray image technology to inspect the watercore disorder in apple with a higher accuracy of 88%. Van et al. [
4] and Tim et al. [
5]reported the internal defects detection of apple and ‘Conference’ pears, achieving the accuracy rates of 90% and 90.2%, respectively. Gao et al. [
6]and Zhang et al. [
7] also has successfully applied to detect whether the hard-shelled walnuts has became hollow and the size of the walnut kernel. Such X-ray image technology has shown promising in real-time, nondestructive testing of internal defects in intact walnuts with shells.
Over the past decade, deep learning has played a very vital role in the pattern recognition tasks, mainly because it does not require sophisticated image processing pipelines and can automatically learn the hierarchical features from the data [
8]. Nowadays, the convolutional neural network (CNN) has delivered great and impressive results in the pattern recognition tasks related to different fields. Based on the faster regions with CNN features (Faster R-CNN), Ren et al. [
9] initially proposed the region proposal network (FPN), a high-precision two-stage detection network, to improve the speed and precision for real-time object detection. Recently, various CNN-based Faster R-CNN have been effectively used in industrial field. Zeng et al. [
10] introduced FPN into the Fast R-CNN model to inspect the cotton packaging defects with the mAP value increased by 9.08% compared with the original network. On the basis of Faster RCNN-FPN, Xia et al. [
11] replaced ROI Pooling with ROI Align to surface defect detection of polarizer, achieving an accuracy of up to 95%. Similar the suggested model has been successfully applied for aircraft target detection [
12]. Additionally, it is noted that the Faster R-CNN algorithm have been proved to effectively used in the pattern recognition tasks of food and agriculture. Li et al. [
13] optimized the anchor frame parameters in the Faster R-CNN model for apples in natural environment with the average recognition rate of 97.6%. Chen et al. [
14] utilized this model for the detection and recognition of Camellia oleifera fruit on trees to obtain superior results. Yan et al. [
15] applied the improved Faster R-CNN model to classify 11 kinds of Rosa roxburghii fruits with 92.01% accuracy. So far, there are no known studies that use the CNN-based Faster R-CNN for identifying the pattern recognition tasks in nuts yet. Thus, it is reasonable to expect using X-ray image combined with deep learning technology to detect the internal defects in intact walnuts with shells.
The specific objectives of this study were to: (1) examine the ability to inspect the internal defects in walnuts based on X-ray image technology associated with the improved Faster R-CNN model; (2) compare the performance of the object detection algorithms based on deep learning and select the best algorithm to build a model; (3) visually demonstrate the effectiveness of the improved Faster R-CNN model for identifying the internal defects in the in-shell walnuts.
2. Materials and Methods
2.1. Sample preparation
"Wen 185" walnut, a widely planted and characteristic variety, was hand-harvested in September 2021 from an orchard at Ye city in Xinjiang, China (36o35’ N, 76o12’ E). Walnut samples with no visible external damage in appearance were randomly selected as experimental objects. Then, the remaining nuts were immediately stored in cold storage (2-5 ◦C) for further testing.
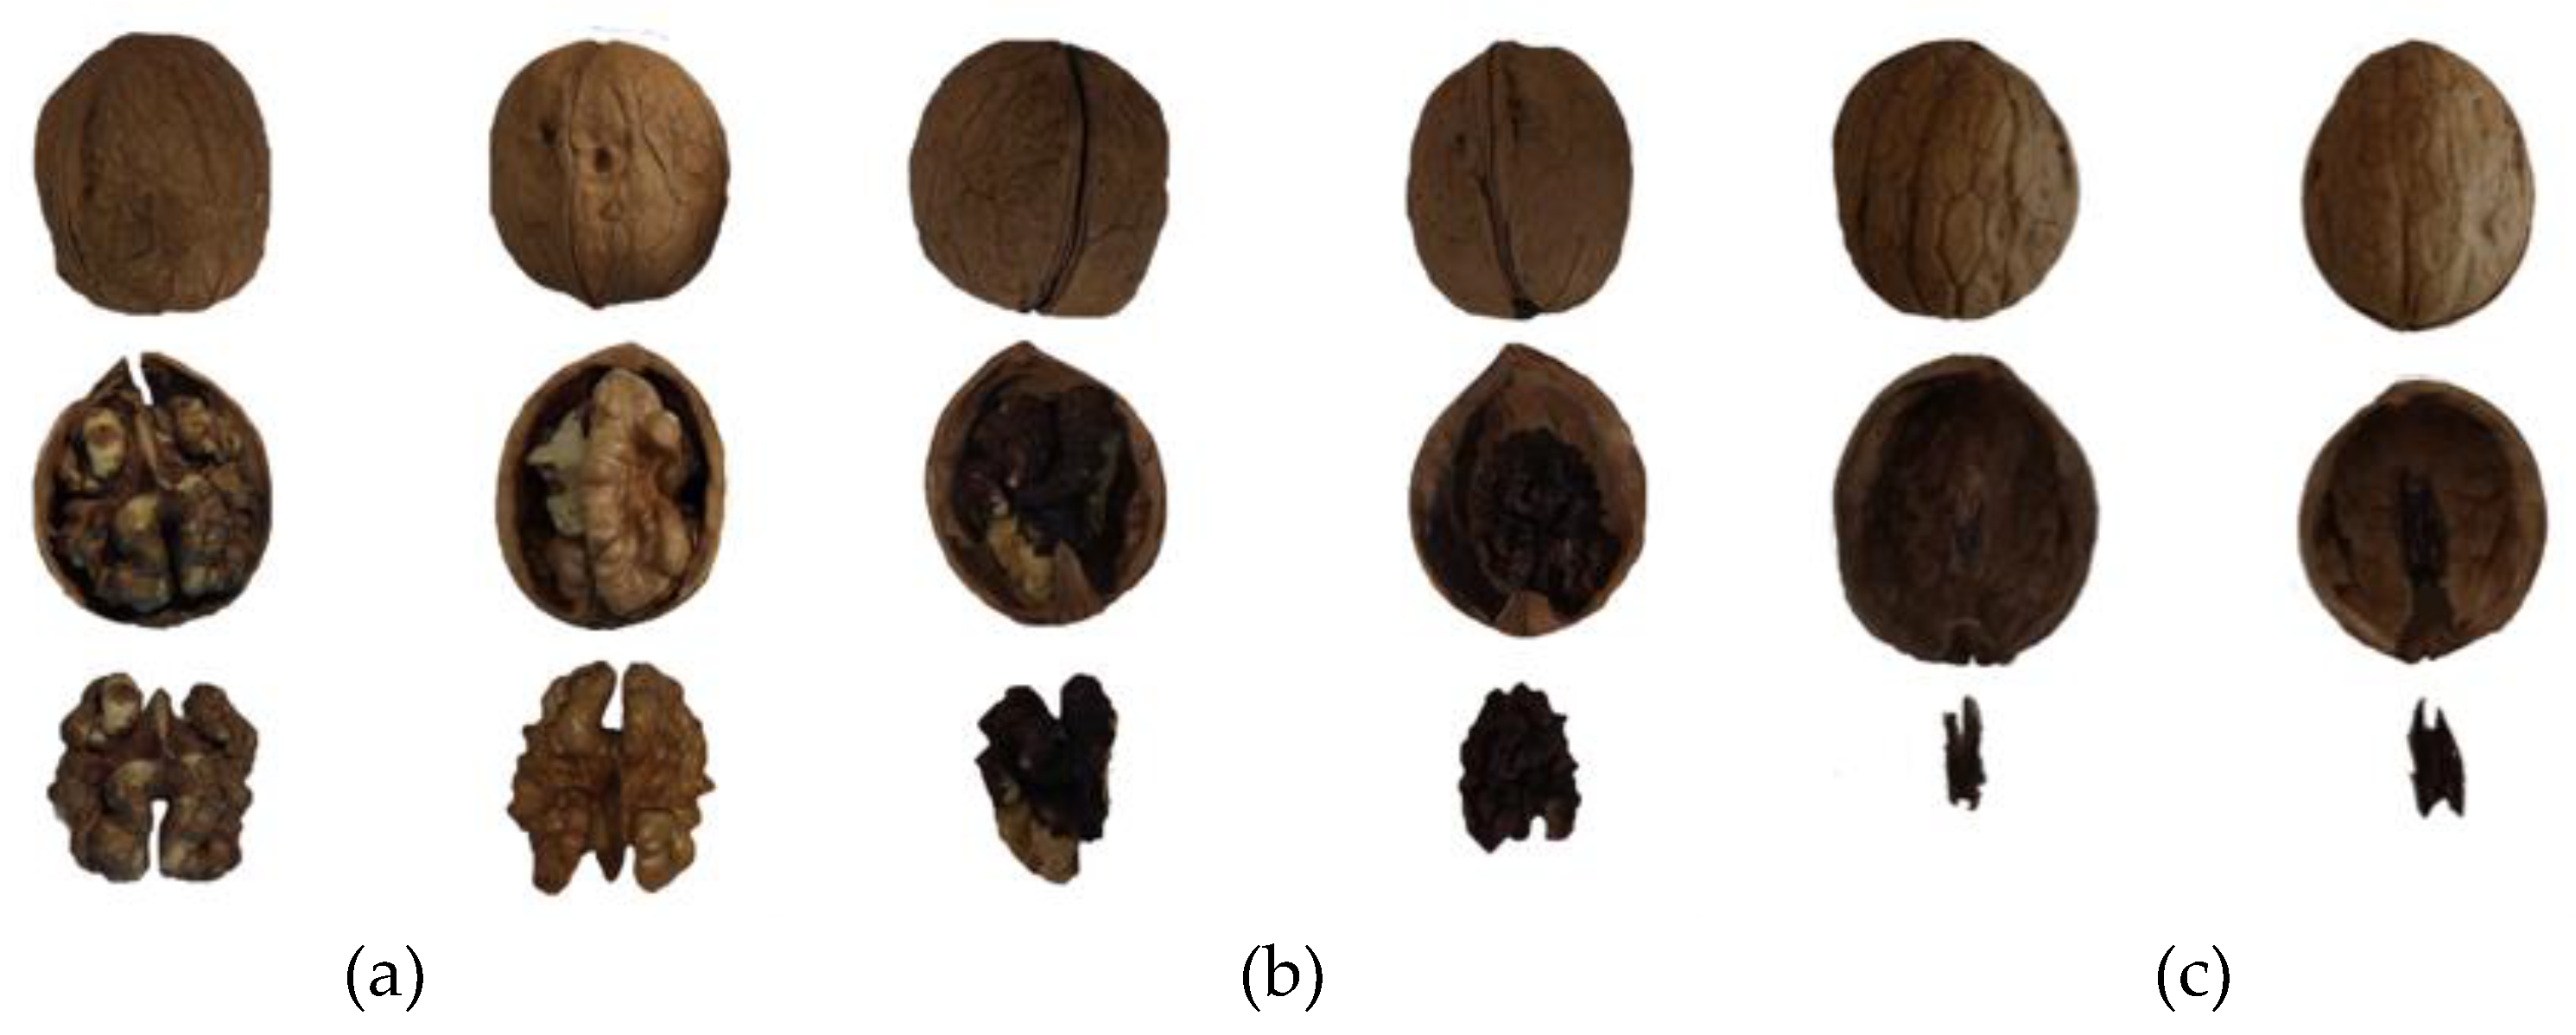
Referred to the national standard of "Quality Grade of Walnut", the samples were broken and classified by the same experienced fruit grower based on visual inspection. Then, a batch of walnuts were divided into three types, including normal walnuts, shriveled walnuts and empty-shell walnuts. As shown in
Figure 1a, the proportion of walnut kernel area in normal walnut samples is large and the gap between walnut shell and kernel is small. The area of dried walnut kernel is relatively small and there is an obvious gap between walnut shell and kernel for the shriveled walnuts (
Figure 1b). However, the difference between the empty-shell walnut and the other two groups of images is significant, and the nucleolar shape can hardly seen in the X-ray diagram (
Figure 1c).
2.2. Walnut x-ray images acquisition
X-ray images of the walnut samples were obtained using a X-ray radiography setup system (Techik Instrument Co., Ltd., Shanghai, China), mainly contains HVC80804 X-ray source, TK2-B-410-G04 linear array detector and a personal computer. In preliminary testing, it was determined that the tube voltage was set as 50kV and the tube current was set as 6mA, walnut X-ray images with the best effect can be obtained. Accordingly, 1000 walnut X-ray images including 1327 normal walnuts, 1283 shriveled walnuts and 1235 empty-shell walnuts were acquired. In order to improve the model’s capacity for generalization using deep learning algorithms, data augmentation techniques are frequently employed. In this research, the operations such as flip (up-down and left-right), mirror and brightness for walnut images were performed to improve the performance values of the proposed model. Then, the number of X-ray images was increased 4000 images. Of these, 2800 walnut X-ray images (70%) were selected as the training set for establishing discrimination model, and the other 1200 images (30%) were set as the testing set for evaluating the discrimination effect of the constructed model.
2.3. Basic framework of Faster R-CNN network
The Faster R-CNN model consists of four parts: main feature extraction network (backbone), region proposal network (RPN), pooling layer and detector (classification and regression layer). First, the image features were extracted by backbone and then the extracted feature maps were inputted to generate a series of candidate boxes using RPN. By combining feature maps and candidate boxes, the feature candidate boxes from images were extracted. Finally, the category of candidate boxes was identified by the classification and regression layers, and specific position of the prediction box was obtained.
Although Faster R-CNN has the advantages of high detection accuracy and strong robustness, it also has some shortcomings. Faster R-CNN network only uses the last layer of the feature extraction network for prediction, and when extracting features from the original walnut image requires multiple convolutions and pooling. These can easily cause the loss of target defect information in the image, which resulting in missed and false detection. Additionally, two quantitative rounding of ROI Pooling will also lead to the loss of target information in the feature maps, which decreases the classification accuracy of in-shell walnuts with internal defects. In order to solve the problem of lower discrimination accuracy resulted from the loss of image information during the object detection process, an improved Faster R-CNN network was proposed as follows.
2.4. Optimization method of Fast R-CNN model
2.4.1. Feature fusion based on FPN structure
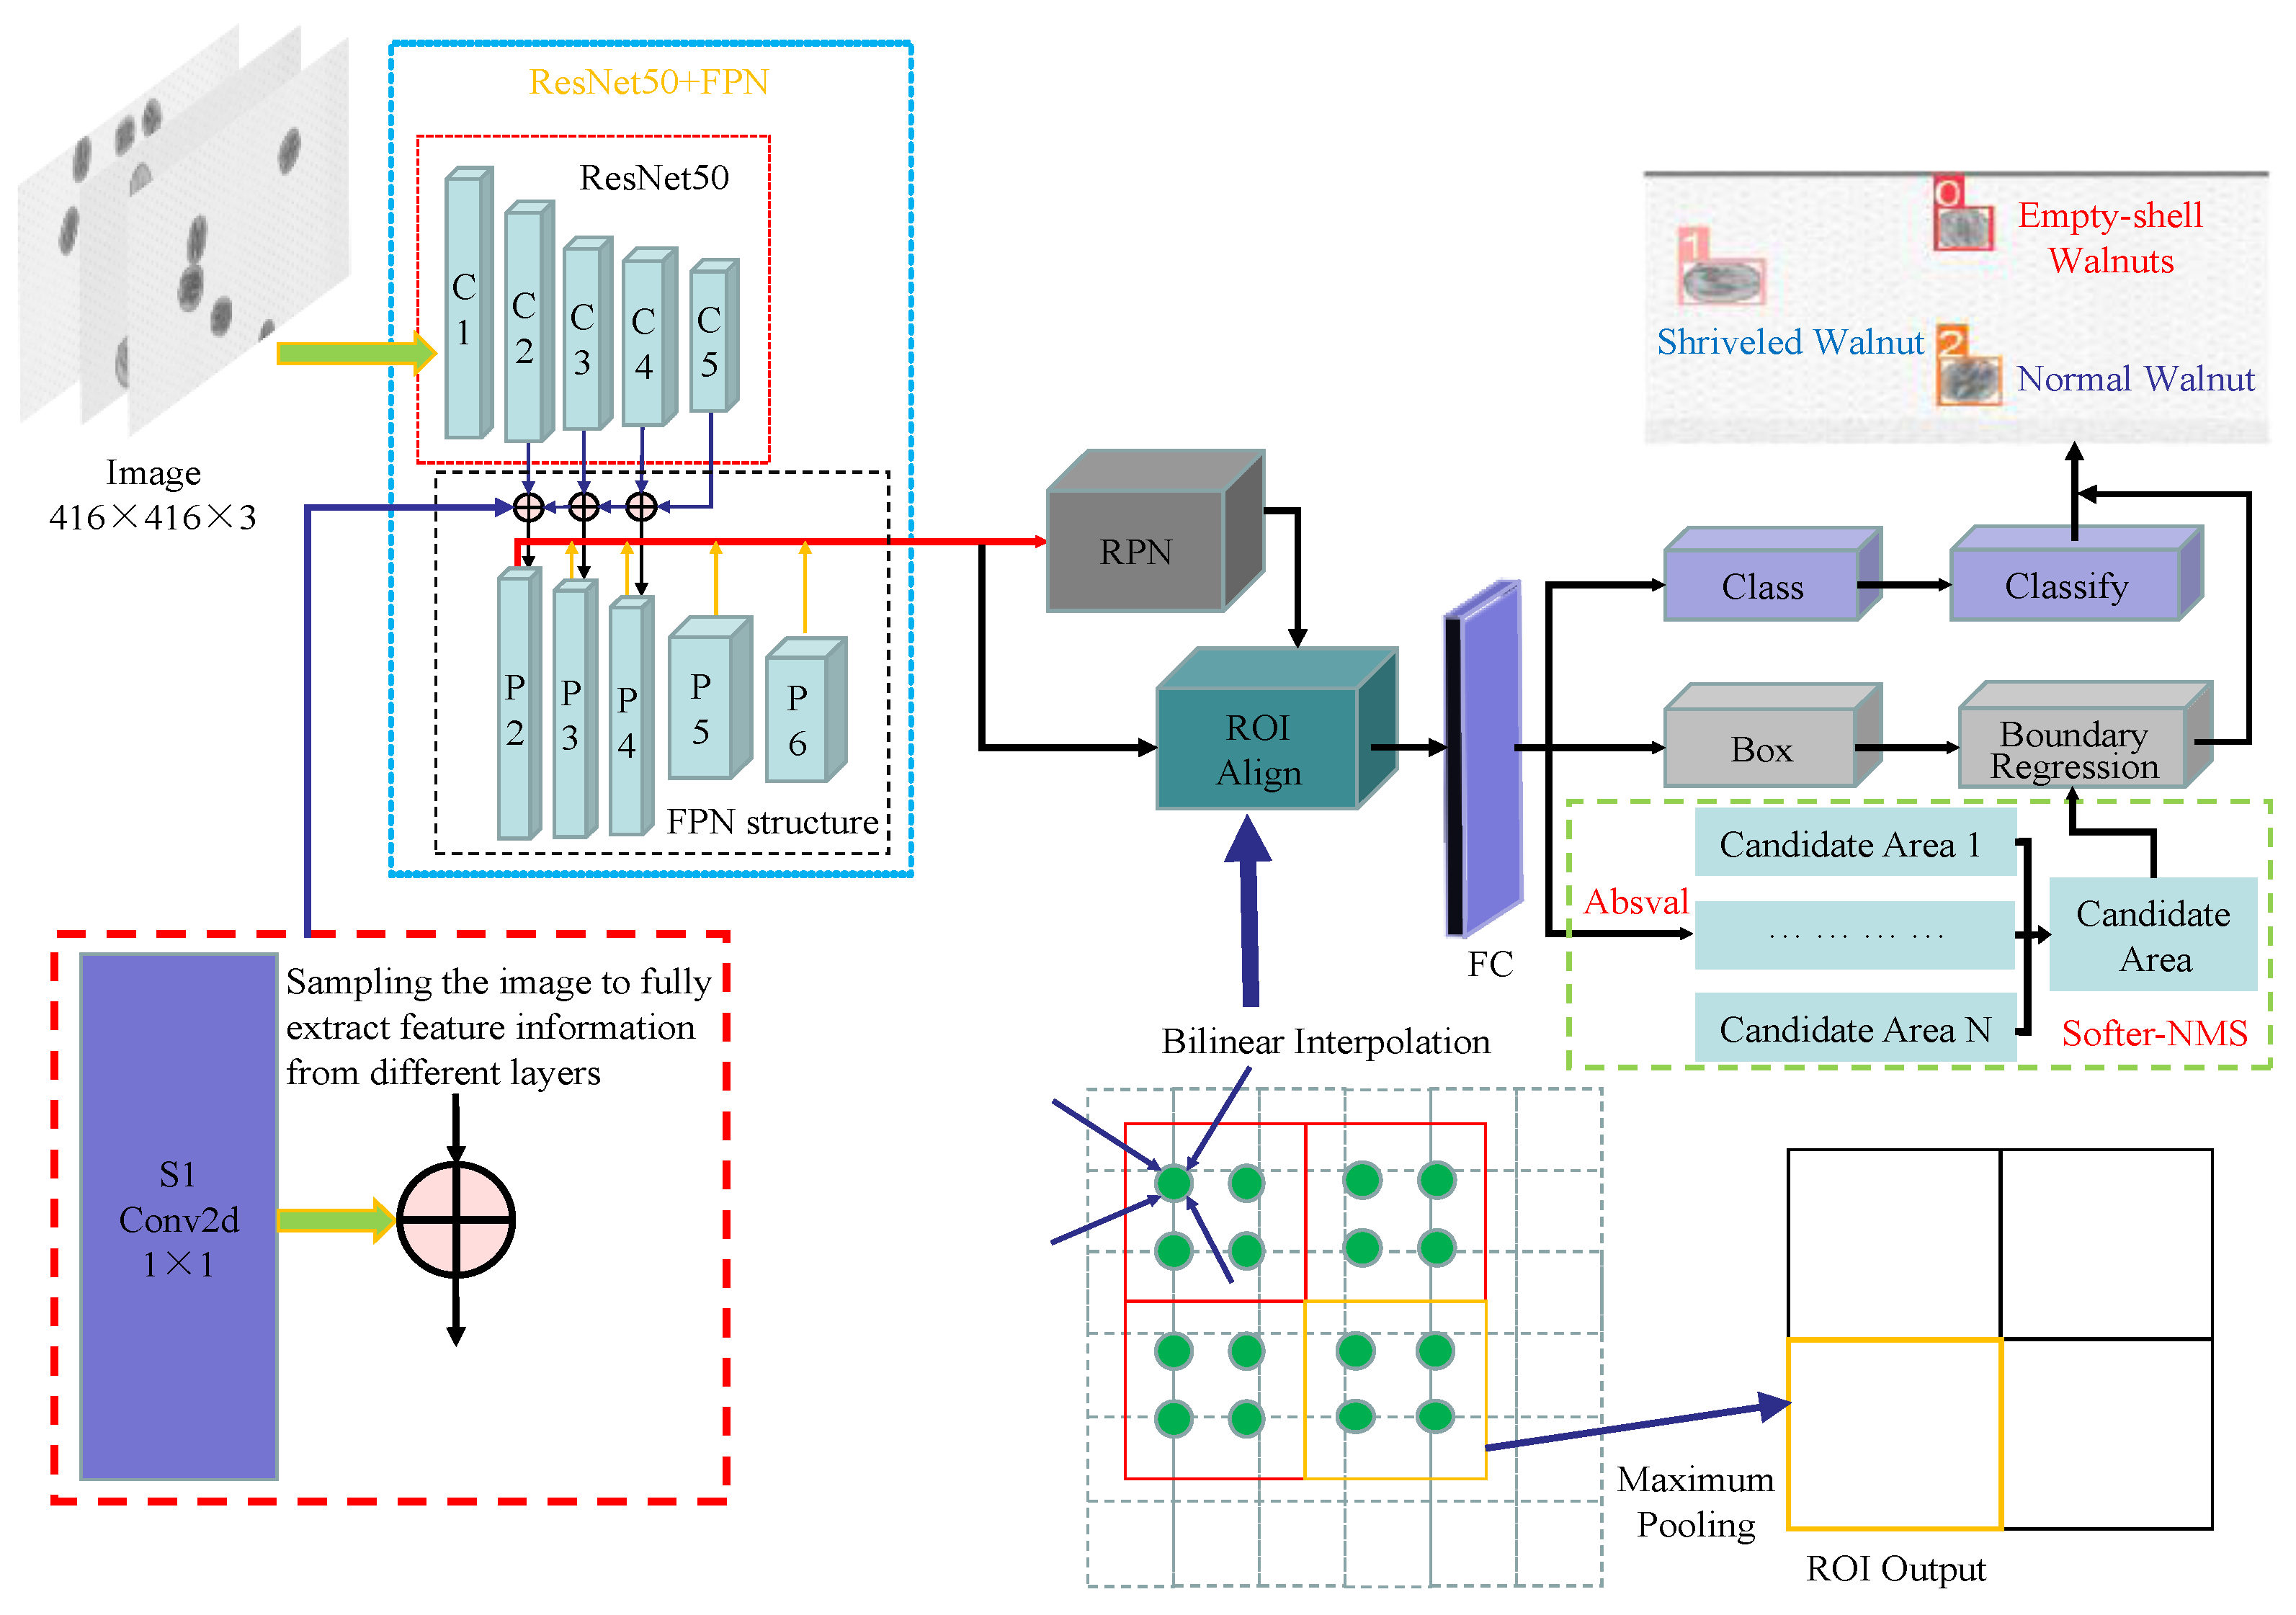
As shown in
Figure 2, FPN structure was used to perform feature fusion in three forms, i.e. bottom-up, top-down and lateral connection, in the feature extraction layer. Among these, bottom-up represented the feed-forward process of the ResNet50 network in the backbone. It divided the extracted feature maps into five levels C1-C5 according to the specified size and channel numbers. In the top-down process, the spatial size of the deep feature maps was expanded by utilizing the bilinear interpolation up-sampling method to obtain a feature map with the same size as the previous level. The horizontal connection included two steps: (1) The feature maps of C2-C5 level adopted 1x1 convolution operation to change the channel numbers of the feature maps and increase the nonlinear features of the image, while the spatial size of the feature maps will not change; (2) Two levels with the same dimension at the corresponding pixel positions was added to obtain the fused feature maps. 3x3 convolution operation was applied for removing the aliasing effect caused by up-sampling and then the enhanced feature maps p2-p5 was obtained. Considering that feature maps with high-resolution can reduce detection speed, the C1 layer would not be fused.
In the original Faster R-CNN model, the input of RPN is the last layer in the backbone feature map, which only a single scale candidate frame can be obtained. In this study, FPN structure was used to input feature map p6 obtained from the enhanced feature map p2-p5 and feature map in the C5 level after maximum pooling into the RPN. Accordingly, in the RPN a series of anchor boxes with different sizes and aspect ratio was created by the feature maps p2-p6. For p2-p6, the corresponding anchor areas were 32×32, 64×64, 128×128, 256×256 and 512×512, respectively. To cover the detection target of any size in the images, each feature map had three scales at each pixel position, that is 1:2, 1:1 and 2:1. Because the feature map inputted from the original RPN had only one scale, the method of combining shallow and deep features in the feature extraction stage was proposed. This can more accurately obtain the information of internal defects in walnuts, improving the precision and accuracy of target recognition.
2.4.2. ROI Align
In the original Faster R-CNN model, ROI Pooling was employed to map the ROI area of the input image to the corresponding position of the feature maps. ROI was generated by the offset correction and selection process of area schemes with different sizes and proportions. They are different in size and contain floating point numbers. Hence, it is necessary to carry out quantitative rounding operation to remove floating point numbers. In addition, when inputting feature maps into the fully connected layer, it need to adjust the feature maps for a uniform size. So, when mapping the ROI to the corresponding position of the feature maps, the quantified feature maps need to be scaled to a fixed size. There are two quantization rounding operations in the process of ROI pooling operation. However, there is a certain loss of information in ROI after two quantization rounding operations, causing information did not match between ROI and extracted features, and then affected the detection accuracy.
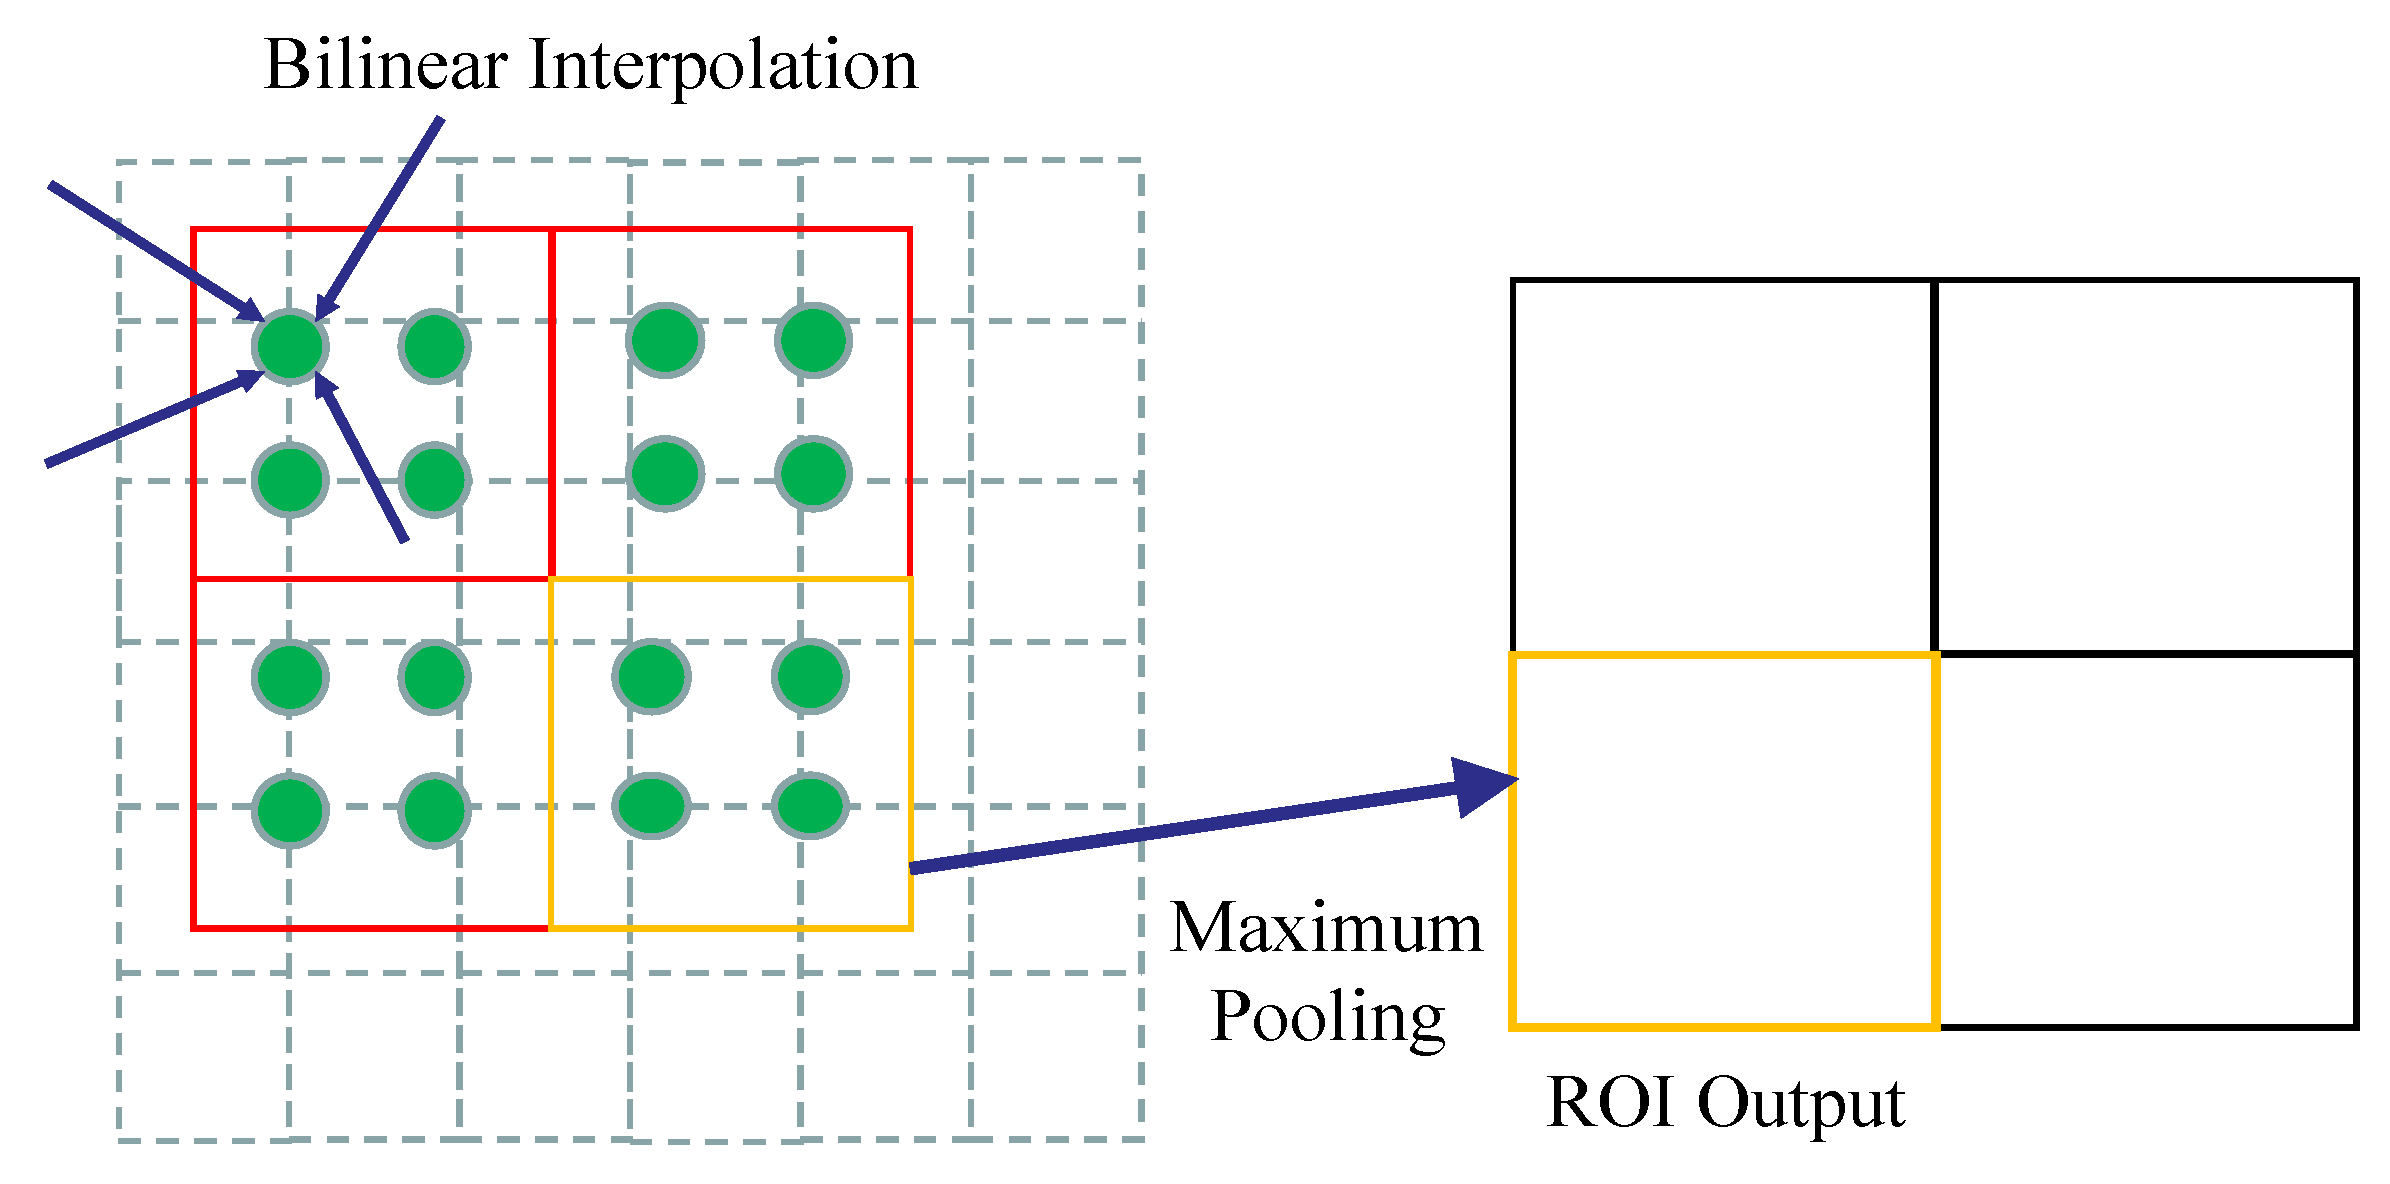
In order to improve the recognition accuracy of the model, ROI Pooling in the original Faster R-CNN model was replaced by ROI Align. The principle of ROI Align was shown in
Figure 3. Compared with ROI Pooling, ROI Align not only eliminated the quantization operation and kept all floating-point numbers, but also calculated the exact values of multiple sampling points by using the method of bilinear interpolation. By doing this, the final value can be obtained by gathering the maximum or average values of multiple sampling points. In this process, the image information would not be lost, and the image characteristics of the original area would be preserved as much as possible, which improved the detection accuracy of the whole network.
2.4.3. Softer-NMS
In target detection process, the traditional non-maximum suppression algorithm (NMS) was used to extract candidate boxes with the highest confidence and suppress candidate boxes with low confidence. For Faster R-CNN network, a large number of predicted candidate boxes were generated in the RPN network, many of which would be duplicated and located on the same target. In order to remove these duplicate candidate boxes, NMS was applied to obtain true candidate boxes. However, if an object appeared in the overlapping area of another object, that is, when two candidate boxes were close and then the candidate frame with lower score would be deleted. That caused the failure of detecting the object and reduce the average detection accuracy of the algorithm. Surprisingly, the application of Softer-NMS can select the candidate boxes more accurately by ranking it according to the confidence score of prediction candidates. In addition, Softer-NMS can perform weighted average for the candidate boxes within the predicted labeled variance range, which made the boundary boxes with high position reliability have higher prediction confidence. Hereto, the architecture of the improved Faster R-CNN for in-shell walnuts with internal defects was shown in
Figure 4.
2.5. Training Platform
Based on the personal computer with some specific parameters consisted of Intel Core i5-8500 CPU, 3.5Ghz, 16GB video memory and running memory, and ASUS RTX2026 GPU. The deep learning framework PyTorch was used to built for training and testing under the Windows 10 operating system. Python3.8, cuda11.1 and cudnn10.2 and other required libraries were utilized to train and test the target recognition model for walnut samples.
In the training stage, the batch size was set to 4 and the momentum factor was set to 0.9 for avoiding the memory limitation of GPU. The number of training epochs was set to 300. With the stochastic gradient descent (SGD) adopted, the learning rate was set to 0.01 and the weight of model was updated every 4 epochs with the attenuation coefficient of 0.0001. The the confidence threshold and intersection over union (IOU) threshold were all set to 0.5. After training, the weight file of the constructed model was saved, and the testing set was utilized to evaluate the discrimination effect of the model. The final output of the network is the prediction boxes of the three classes of walnut samples location and the probability of belonging to a specific category.
2.6. Evaluation indicators of model
In this study, the discrimination performance of the constructed model was evaluated by the confusion matrix including precision, recall, F
1-value and mean average precision (mAP), which were calculated as follows [
16]:
Where TP and FN are the number of positive samples that are classified as positive and negative, respectively; TN and FP are the number of negative samples that are classified as negative and positive, respectively; N represents the number of walnut sample categories; n represents the number of IOU thresholds, K represents the IOU threshold. If one kind of sample was determined as positive, the other two kind of samples were symbolized as negative. For example, when the empty-shell walnut sample was positive, the shriveled and sound walnut samples were defined as negative. In order to comprehensively evaluate the stability and accuracy of the model, 10-fold cross-validation method was applied [
17]. That is the data were divided into equal 10 parts and one part was used for validation in each iteration, while remaining 9 parts was used for training model. In this way, we calculated the average value of 10 recording for confusion matrix results to represent the discrimination performance of the constructed model.
3. Results and Discussion
3.1. Construction of fast R-CNN model
Nowadays, target detection algorithms based on deep learning mainly consists of a single-stage target detection algorithm represented by YOLOv3 and YOLOv5, and a two-stage target detection algorithm represented by Faster R-CNN. In this study, three discrimination models based on the YOLOv3, YOLOv5 and Faster R-CNN algorithms were respectively established to analyze and compare the recognition performance for walnut samples with different internal defects.
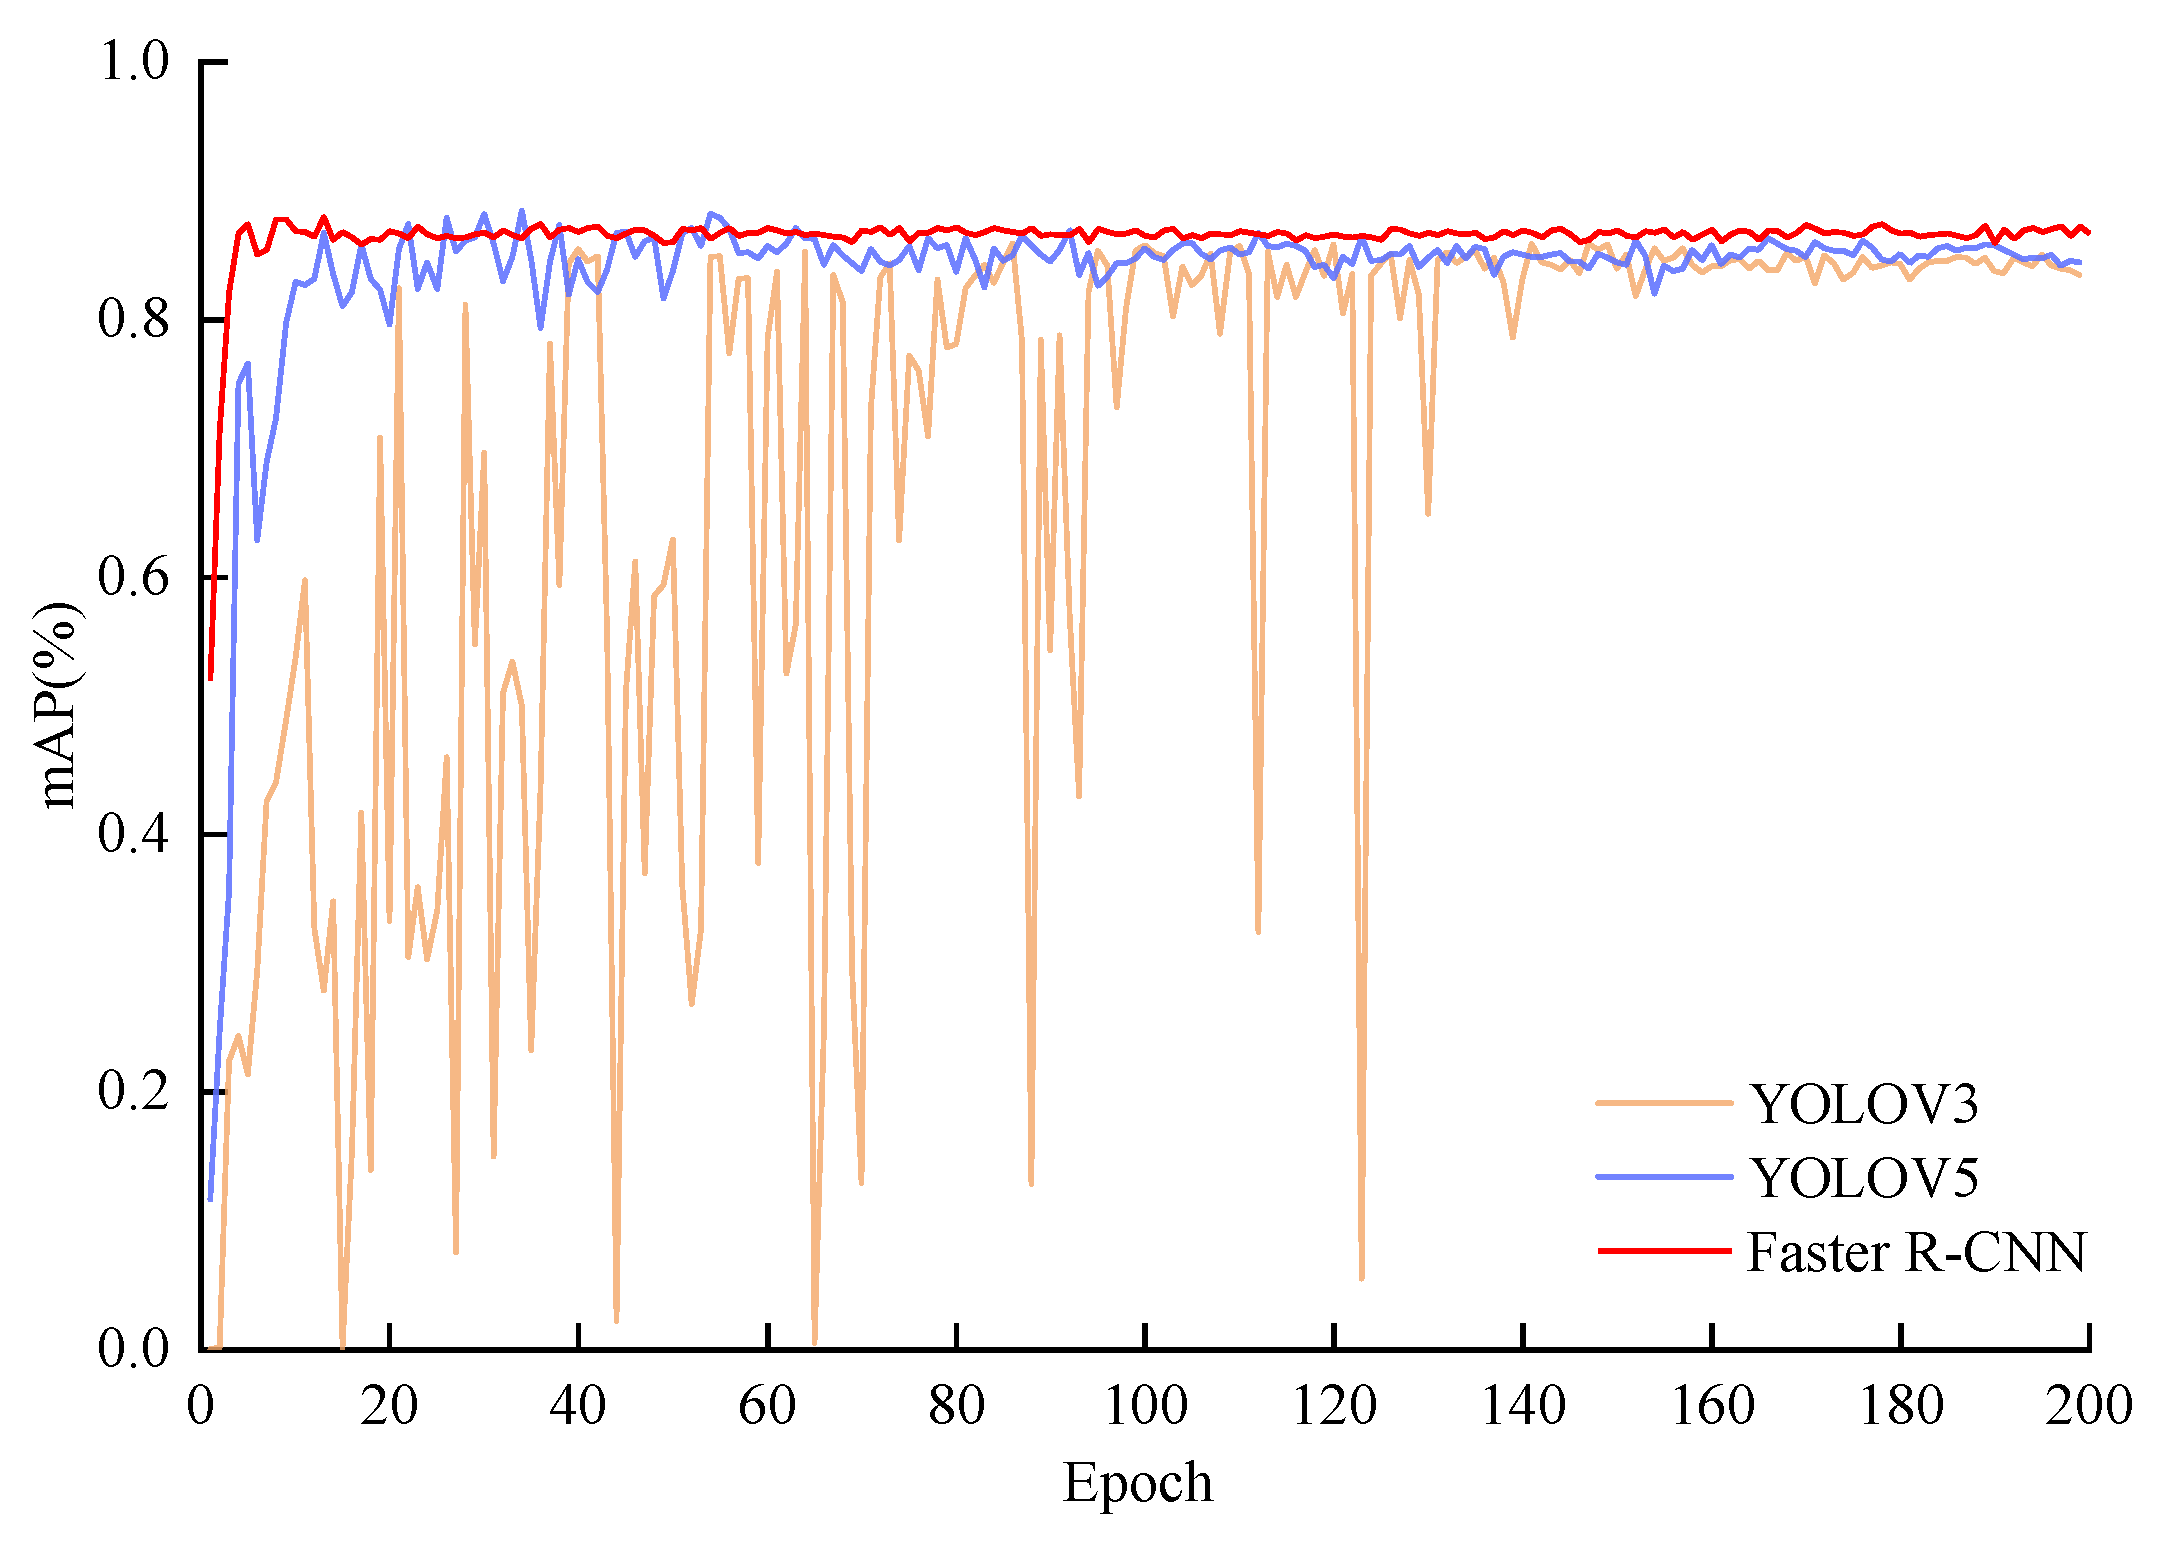
The mAP curves of three models were pictured together in
Figure 5. Among which, YOLOV5 model fitted rapidly in the first 20 epochs, but there were still small fluctuations in the model fitting before 60 epochs and basically tends to be stable after 140 epochs of training. The YOLOv3 model had the worst fitting performance resulted from that it gradually stable after 140 epochs and there were significant fluctuations within 140 epochs. In contrast, Faster R-CNN model quickly tended to fit within 10 epochs and subsequently remained stable always, indicating that Faster R-CNN model had fast fitting speed and strong robustness.
After training, the specific discrimination results of YOLOv3, YOLOv5 and Faster R-CNN models for walnut samples were shown in
Table 1. As can be seen, Faster R-CNN model had better discrimination performance and outperformed the other two models. The overall identification precision, recall, mAP and F
1-value were 89.47%, 86.47%, 87.94% and 89.71%, respectively. In the aspect of training time, Faster R-CNN model required a slightly longer time because of affecting by the size of the model framework. Nevertheless, Faster R-CNN model had the advantages of fast fitting speed, strong robustness, and well classification performance. Given that the discrimination accuracy for walnut quality was less than 90%, further improvement of Faster R-CNN was desirable.
3.2. Training results of the improved Faster R-CNN Model
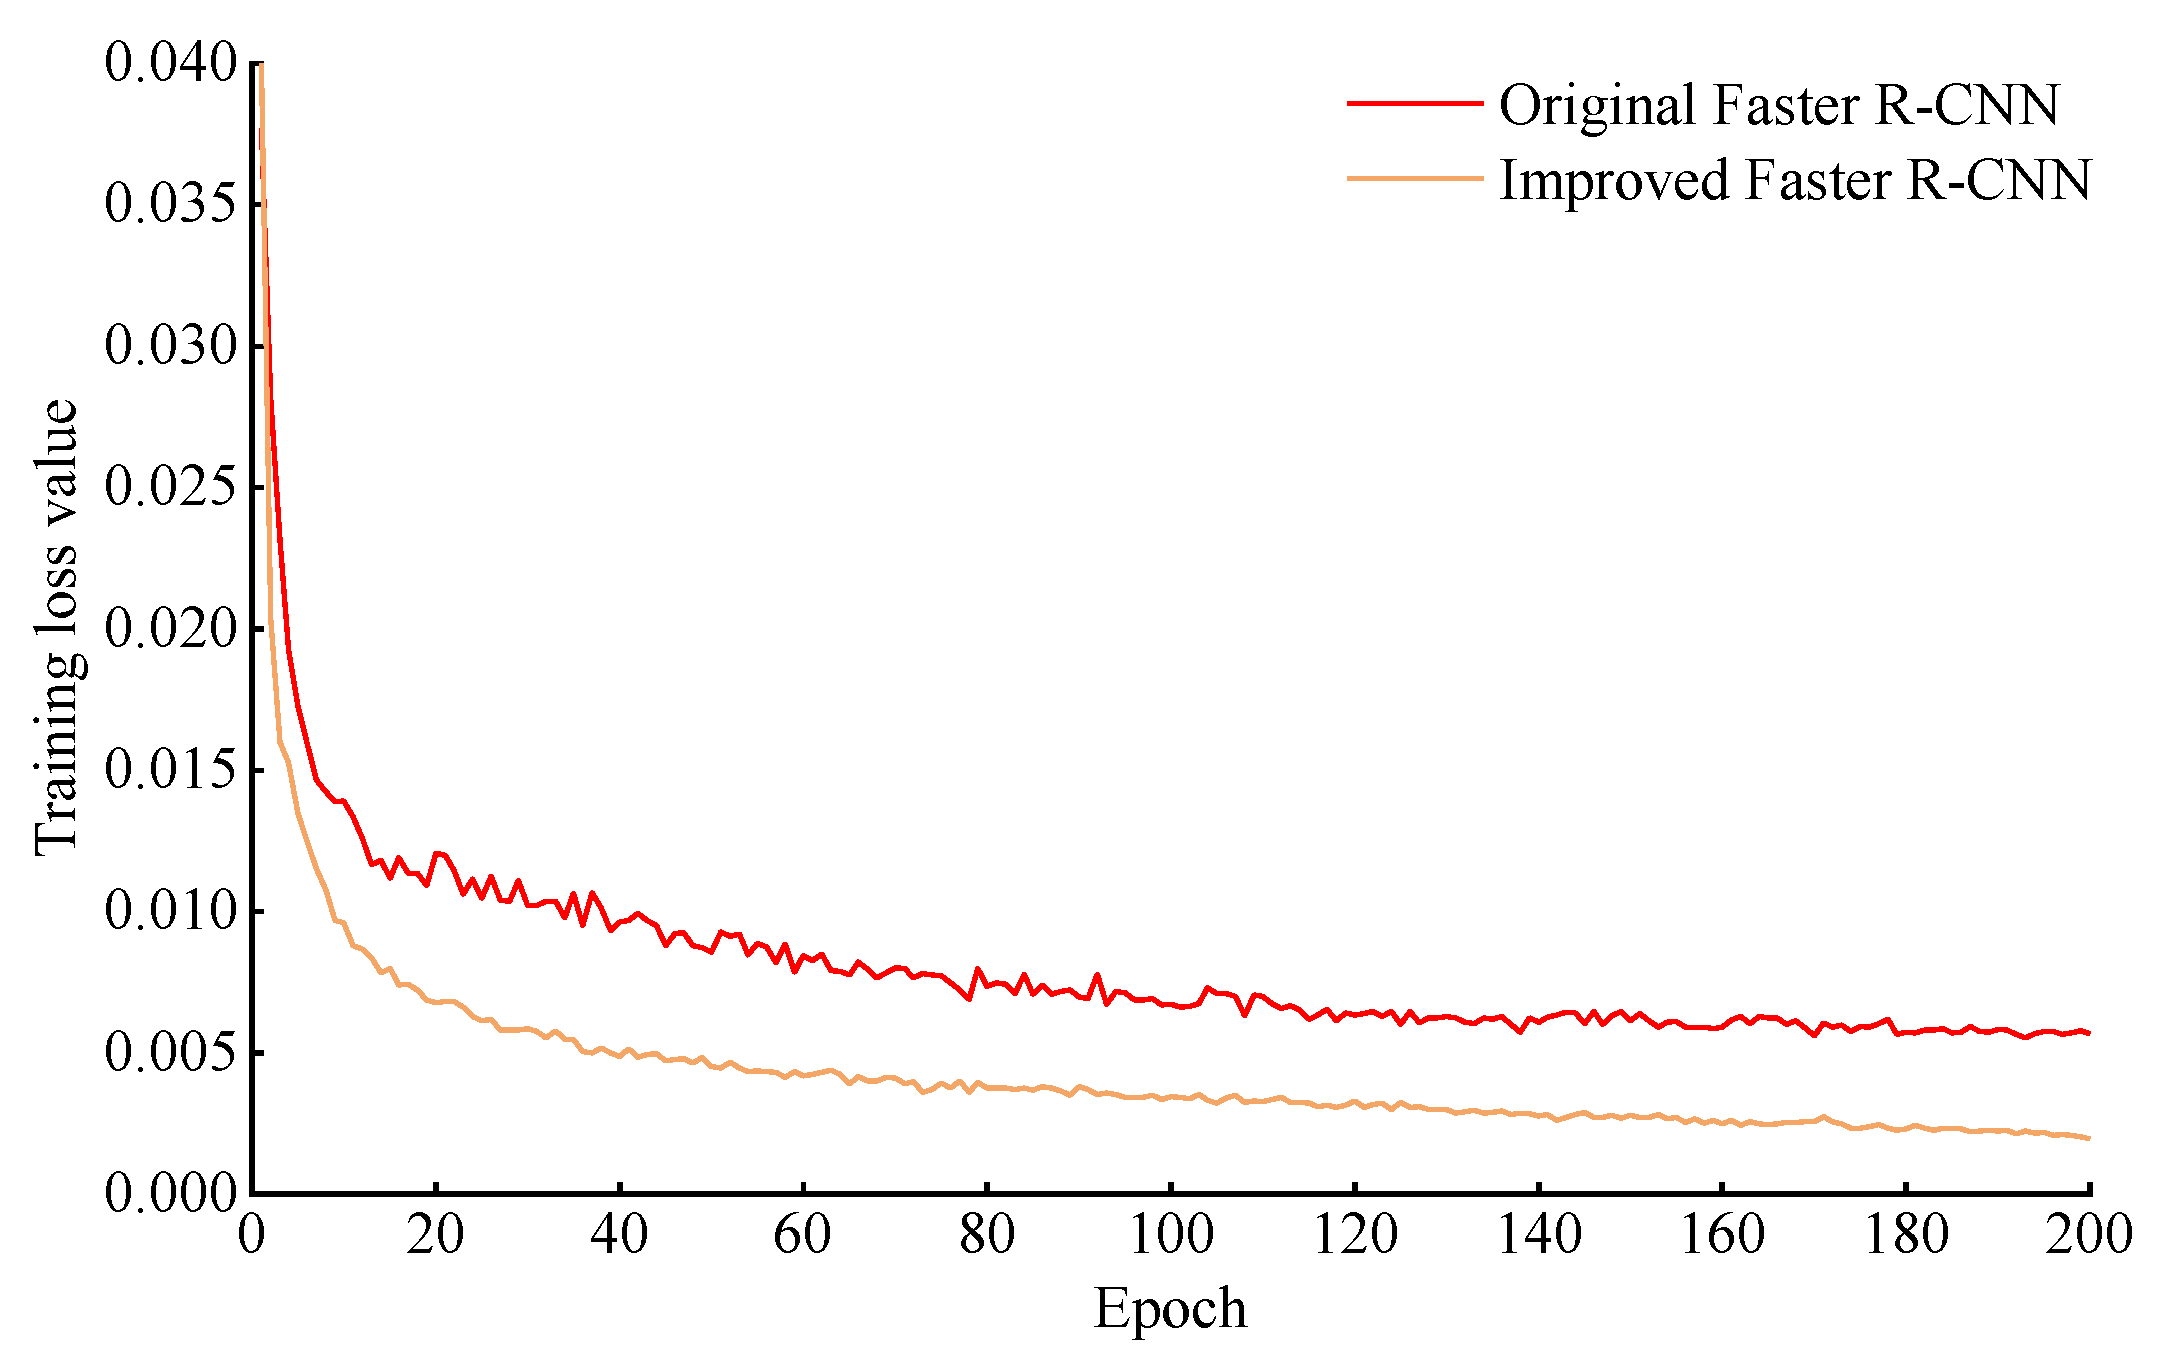
The training loss curves of original and improved Faster R-CNN model were shown in
Figure 6. For the improved Faster R-CNN model, the training loss value rapidly decreased to around 0.0075 in the first 20 epochs, then gradually decreased and ultimately stabilized with a value of 0.001. While the original Faster R-CNN model still kept an increase on loss values in the first 20 epochs, and there was a clearly increasing during the later iteration process. The result indicated that the improved Faster R-CNN has faster fitting speed and better robustness was trained well without over-fitting.
Based on the method of Gao et al (2022), the impact of each improvement point on discrimination performance of the improved Faster R-CNN model has been compared. As shown in
Table 2, the mAP of the improved Faster R-CNN model was increased by 1.62% after adding the FPN structure for image feature fusion compared with the original model. Subsequently, by replacing ROI pooling with ROI Align to eliminate the quantitative rounding operation, the mAP was increased by 1.73%. On this basis, the Softer-NMS was conducted to perform weighted averaging on candidate regions in the predicted layer, the mAP was further improved by 2.51%. By doing this, the mAP and F1-value of the improved Faster R-CNN model reached up to 95.57% and 93.59%, respectively. It demonstrated that the discrimination capability of the improved Faster R-CNN model compared to the original Faster R-CNN model had significantly enhanced for the in-shell walnuts with different internal defects.
3.3. Performance analysis of the improved Faster R-CNN model
In order to evaluate the recognition capability of the improved Faster R-CNN model for internal defects in walnuts more intuitively, the discrimination effect of the model on 155 images of the testing set were further analyzed with a confusion matrix. There are a total of 525 walnut samples in test image set, among which the number of sound walnuts are 207, the number of shriveled walnuts are 145 and the number of empty-shell walnuts are 173. As shown in
Table 3, the discrimination accuracy of constructed model for shriveled walnuts is the lowest (91.72%). There are 12 misjudgments among 145 shriveled walnut samples, of which 8 shriveled walnuts are misjudged as empty-shell samples, and 4 shriveled walnuts are misjudged as sound samples. For the empty-shell walnuts, 9 samples are wrongly discriminated with an error rate of 5.2%, obtaining a slightly higher discrimination accuracy of 94.8%. This may be because the feature information of sample images is not complete caused by various shooting angles using X-ray radiography. Additionally, there is different shriveled degrees occurred in in-shell walnuts, it is likely that this is also the reason why the shriveled walnuts and empty-shell walnuts are wrongly discriminated each other. Significantly, it is found that the improved Faster R-CNN model obtains a discrimination accuracy of 96.14% for sound walnut samples, and only 8 sound walnuts are wrongly discriminated with an error rate of 3.9 %. In general, 496 walnuts of 525 discrimination samples are correctly recognized and the overall discrimination accuracy reaches 94.22%. It is believed that the improved Faster R-CNN model proposed by this work can effectively discriminate the internal defects in intact walnuts with shells.
Examples of the recognition results of the improved Faster R-CNN model for sound, shriveled and empty-shell walnut samples are depicted in
Figure 7. The red, purple and yellow boxes were used for labeling the empty-shell, shriveled and sound walnuts. As shown, the confidence levels for individual walnuts with complete image information are between 92% and 95%, and the overall confidence level is relatively close to the mAP value from the testing set. Although the confidence level of a single empty-shell walnut sample with incomplete information is lower than that of the other two types of walnut samples, there are not wrong detection or missed detection caused by incomplete information of walnut image.
4. Conclusions
In this study, X-ray radiography technology was employed for the non-destruction detection of the in-shell walnuts with shriveled and empty-shell defects. After comparison of three target detection algorithms, Faster R-CNN model was more appropriate than the YOLOv3 model and YOLOv5 model for the identification of the internal defects in hard-shell walnuts. In the improved Faster R-CNN network architecture, the FPN structure used for feature fusion was firstly introduced to enrich the feature map information of internal defects in walnuts. To solve the the problems of false and missed detection caused by quantization operation, ROI Pooling module was replaced with ROI Align module. To increase the prediction confidence of the bounding boxes and thereby improve the discrimination accuracy of the network, the Softer-NMS structure was inputted into the final regression layer with the predicted bounding box. The detection results of the testing set showed that the proposed improved Faster R-CNN model can effectively realize the recognition of the internal defects of in-shell walnuts. The discrimination accuracy of the in-shell sound, shriveled and empty-shell walnuts were 96.14%, 91.72% and 94.80% respectively, and the highest overall accuracy can reach 94.22 %. These results indicated that X-ray image technology associated with the improved Faster R-CNN model can be effectively applied the recognition tasks of the in-shell walnuts with shriveled and empty-shell defects. Also, the method proposed by this study can provide a research strategy for nondestructive detection of the internal quality of other nuts.
Author Contributions
Conceptualization, Methodology, Data curation, Writing-review & editing, Funding acquisition, H.Z.; Conceptualization, Supervision, Writing-review & editing, S.J.; Investigation, Validation, M.S.; Software, Visualization, H.P.; Methodology, Data curation, Funding acquisition, L.Z. All authors have read and agreed to the published version of the manuscript.
Funding
This research was funded by the Start Fund of scientific and research in Xinjiang University (grant number 620320039) and the Key R&D Special Project of Xinjiang Uygur Autonomous Region (grant number 2022B02028-4).
Institutional Review Board Statement
Not applicable.
Informed Consent Statement
Not applicable.
Data Availability Statement
Not applicable.
Acknowledgments
The authors are very grateful for all constructive comments that helped us improve the original version of the manuscript.
Conflicts of Interest
The authors declare that we have no known competing financial interests or personal relationships that could have appeared to influence the work reported in this paper.
References
- Dong, C.L. Thoughts on high-quality development of walnut industry in Chuxiong. Green Science and Technology 2021, 23, 110–112. [Google Scholar] [CrossRef]
- Kotwaliwale, N.; Singh, K.; Kalne, A.; Jha, S.N.; Seth, N.; Kar, A. X-ray imaging methods for internal quality evaluation of agricultural produce. J Food Sci Technol 2014, 51, 1–15. [Google Scholar] [CrossRef] [PubMed]
- Shahin, M.A.; Tollner, E.W.; McClendon, R.W. AE—Automation and Emerging Technologies. Journal of Agricultural Engineering Research 2001, 79, 265–274. [Google Scholar] [CrossRef]
- Van Dael, M.; Verboven, P.; Zanella, A.; Sijbers, J.; Nicolai, B. Combination of shape and X-ray inspection for apple internal quality control: in silico analysis of the methodology based on X-ray computed tomography. Postharvest Biology and Technology 2019, 148, 218–227. [Google Scholar] [CrossRef]
- Van de Looverbosch, T.; Raeymaekers, E.; Verboven, P.; Sijbers, J.; Nicolai, B. Non-destructive internal disorder detection of Conference pears by semantic segmentation of X-ray CT scans using deep learning. Expert Systems with Applications 2021, 176, 114925. [Google Scholar] [CrossRef]
- Gao, T.Y.; Zhang, S.J.; Sun, P.; Zhao, H.M.; Sun, H.X.; Niu, R.M. Variety Classification of walnut based on X-ray image. Food Science and Technology 2020, 45, 284–288. [Google Scholar] [CrossRef]
- Zhang, S.; Gao, T.; Ren, R.; Sun, H. Detection of Walnut Internal Quality Based on X-ray Imaging Technology and Convolution Neural Network. Trans. Chin. Soc. Agric. Mach 2022, 53, 383–388. [Google Scholar]
- LeCun, Y.; Bengio, Y.; Hinton, G. Deep learning. Nature 2015, 521, 436–444. [Google Scholar] [CrossRef] [PubMed]
- Ren, S.Q.; He, K.M.; Girshick, R.; Sun, J. Faster R-CNN: Towards Real-Time Object Detection with Region Proposal Networks. Ieee T Pattern Anal 2017, 39, 1137–1149. [Google Scholar] [CrossRef] [PubMed]
- Zeng, Y.X.; Lu, H.C.; Lv, H.F. Research on cotton packaging defect detection method based on improved Faster R-CNN. Electronic Measurement and Instrumentation 2022, 36, 179–186. [Google Scholar] [CrossRef]
- Xia, Y.; Xiao, J.Q.; Weng, Y.S. Surface defect detection of polarizer based on improved Faster R-CNN. Optical Technique 2021, 47, 695–702. [Google Scholar] [CrossRef]
- Zhu, W.T.; Lan, X.C.; Luo, H.L.; Yue, B.; Wang, Y. Remote sensing aircraft target detection based on improved Fasterr-CNN. Computer Science 2022, 49, 378–383. [Google Scholar]
- Li, L.S.; Zeng, P.P. Apple target detection based on improved Faster-RCNN framework of deep learning. Machine Design and Research 2019, 35, 24–27. [Google Scholar] [CrossRef]
- Chen, B.; Rao, H.H.; Wang, Y.L.; Li, Q.S.; Wang, B.Y.; Liu, M.H. Study on detection of camellia fruit in natural environment based on Faster-RCNN. Acta Agriculturae Jiangxi 2021, 33, 67–70. [Google Scholar] [CrossRef]
- Yan, J.W.; Zhao, Y.; Zhang, L.W.; Su, X.D.; Liu, H.Y.; Zhang, F.G.; Fan, W.G.; He, L. Recognition of Rosa roxbunghii in natural environment based on improved Faster-RCNN. Transactions of the Chinese Society of Agricultural Engineering 2019, 35, 143–150. [Google Scholar]
- Wei, R.; Pei, Y.K.; Jiang, Y.C.; Zhou, P.Z.; Zhang, Y.F. Detection of cherry defects based on improved Faster R-CNN model. Food&Machinery 2021, 37, 98–105. [Google Scholar] [CrossRef]
- Saidi, L.; Ben Ali, J.; Fnaiech, F. Application of higher order spectral features and support vector machines for bearing faults classification. ISA Trans 2015, 54, 193–206. [Google Scholar] [CrossRef] [PubMed]
|
Disclaimer/Publisher’s Note: The statements, opinions and data contained in all publications are solely those of the individual author(s) and contributor(s) and not of MDPI and/or the editor(s). MDPI and/or the editor(s) disclaim responsibility for any injury to people or property resulting from any ideas, methods, instructions or products referred to in the content. |
© 2023 by the author. Licensee MDPI, Basel, Switzerland. This article is an open access article distributed under the terms and conditions of the Creative Commons Attribution (CC BY) license (https://creativecommons.org/licenses/by/4.0/).
