1. Introduction
The combustion of mixtures of fossil fuel with hydrogen showed firstly that harmful emissions, respectively CO and NOx, are directly proportional to the hydrogen mole fraction in the mixed fuel, and are larger as larger the flame temperature, i.e. low excess oxygen and/or high preheating of the air before combustion. Therefore, the actual theoretical/experimental researches are developing means to reduce these emissions through new design of combustion zone (e.g. MILD combustion, combustion inside a porous material), new methods to mix different fossil fuels with hydrogen (e.g. dual fueling in diesel engines), new ideas regarding the pre and post combustion processing of working fluids (e.g. mixing blended fuel with hydrogen, post combustion catalytic treatment). The combustion of the fossil fuel and hydrogen mixtures in spark ignition engines had activated basic researches regarding adaptation of actual spark ignition engines. More of them are tackling specific research targets.
[
1] used a predictive model for lean hydrogen combustion in an Otto engine; the modeling put together a quasi-dimensional multi-zone combustion zone with a combustion model; knowing the unburned fuel it was evaluated the laminar flame speed and additionally an improved flame geometry was adopted.
[
2] developed a methanol-syngas prototype engine which used gasoline and dissociated methanol gas as dual fuel, and they was found that the presence of hydrogen obtained by dissociation improved the efficiency, increased the maximum pressure on the cycle and the released heat in the recycling exhaust heat.
[
3] simulated by AVL Boost the combustion of pure H
2 and compared with combustion of H
2O micro-emulsion fuel and pure gasoline fuel organized inside a single-cylinder stationary spark ignition engine; this simulation comparatively revealed the characteristics regarding the pollutants, energy efficiency for all three chosen fuels.
[
4] experimentally explored the combustion of hydrous ethanol/hydrogen in spark ingnition engine; the classical injection of the hydrous ethanol during the intake process was combined with the hydrogen injection into the cylinder during the compression stroke; hydrogen addition increases the maximum pressure and temperature on the cycle, reduce CO and HC emissions, but rises NOx emissions.
[
5] based on AVL Boost program and on some selected experiments concluded that changing the liquid fuel with the gaseous one it is assuring complete combustion, reductions of HC and CO emissions, modification of the brake power, improved efficiency with lean mixtures, but increase of NOx.
[
6] searched the effect of ethanol-gasoline-hydrogen in a lean-burn SI engine for an optimized blend ethanol-gasoline combined with hydrogen; it was found that hydrogen presence shows a significant improvement of brake power and thermal efficiency and improves the combustion and reduces hydrocarbon emissions.
[
7] studied the impact of dual fuel mixtures; they examined the effects of combustion of mixed secondary fuels (hydrogen, methane, butane, propane) with primary fuels (gasoline, iso-octane, benzene, toluene, hexane, ethanol, methanol) on the theoretical performance of a SI engine; the results showed that the ratios of hydrogen, methane, butane, propane considerably modifies the energy and exergy performances of the engine.
[
8] researched optimal fuel compositions and the control parameters of the spark ignition engine fueled with a mixture of syngas-biogas-hydrogen and it was setting up a flexible electronic control unit for the engine included in a solar-biomass hybrid renewable energy system, controlling the relation engine load - fuel flow – air/fuel mixture flow.
[
9] investigated the effects of hydrogen addition on engine performance using spark ignition gasoline with a compression ratio of 15; the best hydrogen fraction was found to be a balance between improvement in burning efficiency and increase in heat loss.
Because all actual researches following the use of hydrogen in reciprocating engines were organized for limited experiments with imposed operational restrictive conditions such as constant revolution per minute, constant power, specific cooling, accurate instrumentation, the research results are at this time somewhat poor and sometimes contradictory. This paper develops a chemical model for a closed constant volume combustion of gaseous mixtures of methane and hydrogen used in Otto cycles for adopted simplifying hypotheses, respectively actual volumetric compression ratio, isentropic compression and expansion processes, closed constant volume combustion developed by two successive steps obeying to the energy and mass conservation laws and, flue gases exhaust described also by two steps, i.e. an isentropic expansion through the flow section of exhaust valves followed by a constant pressure stagnation (this succession is corresponding in fact to a throttling direct process). These simulation restrictive conditions allowed the generalized evaluation of all state parameters along the cycle, i.e. temperatures, pressures, and working fluid composition/pollutants.
2. The Approach of the Closed Constant Volume Combustion in Otto Engine Cycles
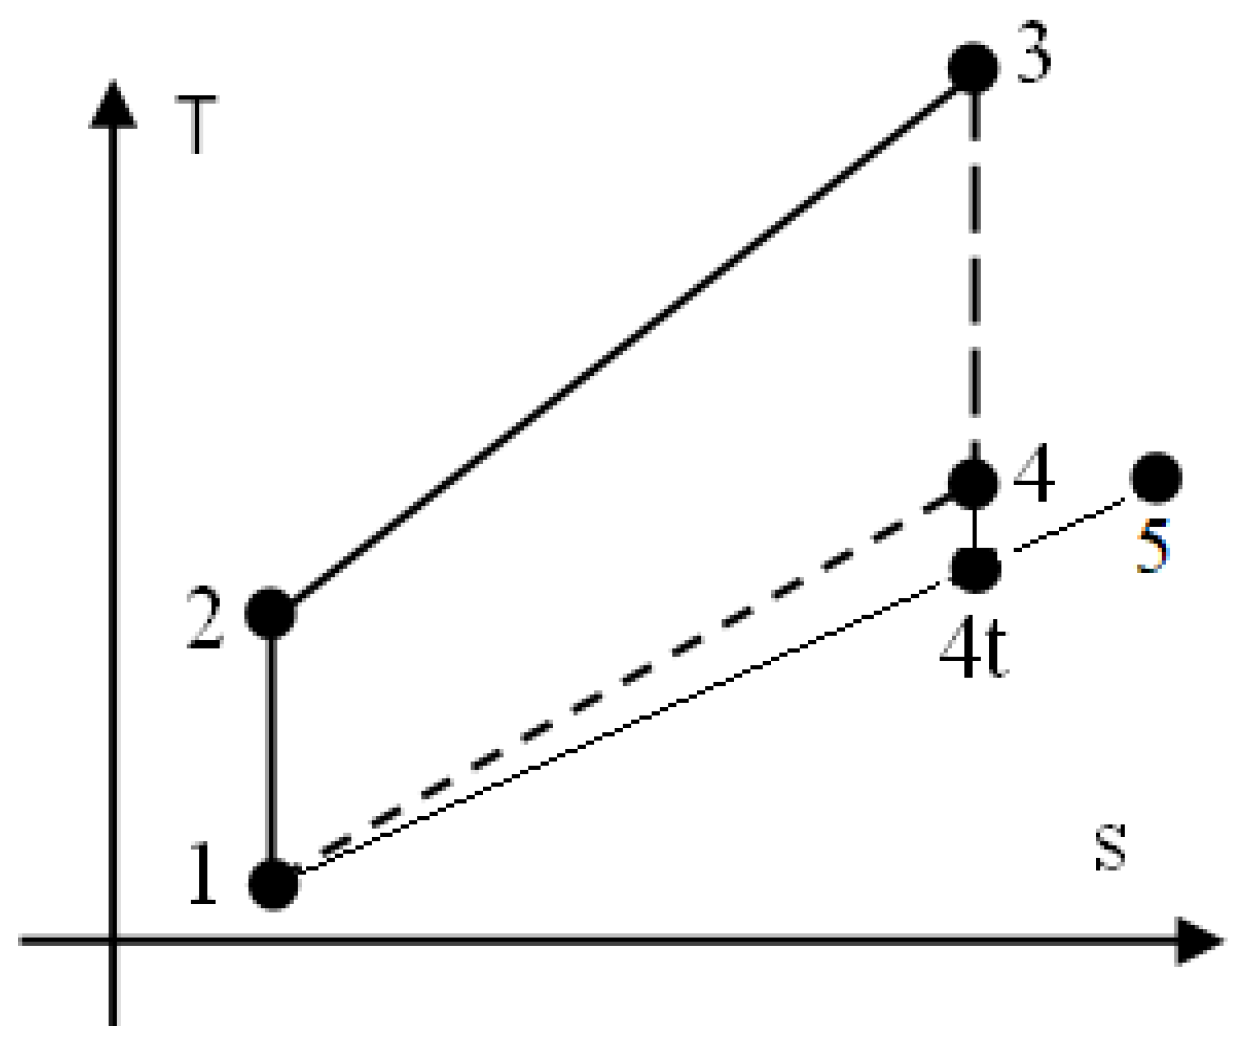
2.1. The Assumptions for the Otto Cycle, See Figure 1
Let’s suppose the general basic Otto cycle interrelating with the environment by heat, mass and power transfers, see
Figure 1. The engine cycle used to describe truthfully the constant volume combustion of a homogeneous mixture of CH
4 and H
2 and to evaluate the flue gases composition and harmful emissions, is consisting of below processes:
1 – 2 isentropic compression of a mixture CH4/H2/air prepared by a carburetor technique;
2 – 3 closed constant volume combustion:
3 – 4 isentropic expansion of flue gases and,
4 – 5 exhaust of flue gases, assimilated to a throttling process (succession of 4 – 4t isentropic expansion through flow section of exhaust valves and 4t – 5 constant pressure stagnation);
5 – 1 final constant pressure exhaust of flue gases.
Figure 1.
The basic Otto cycle.
Figure 1.
The basic Otto cycle.
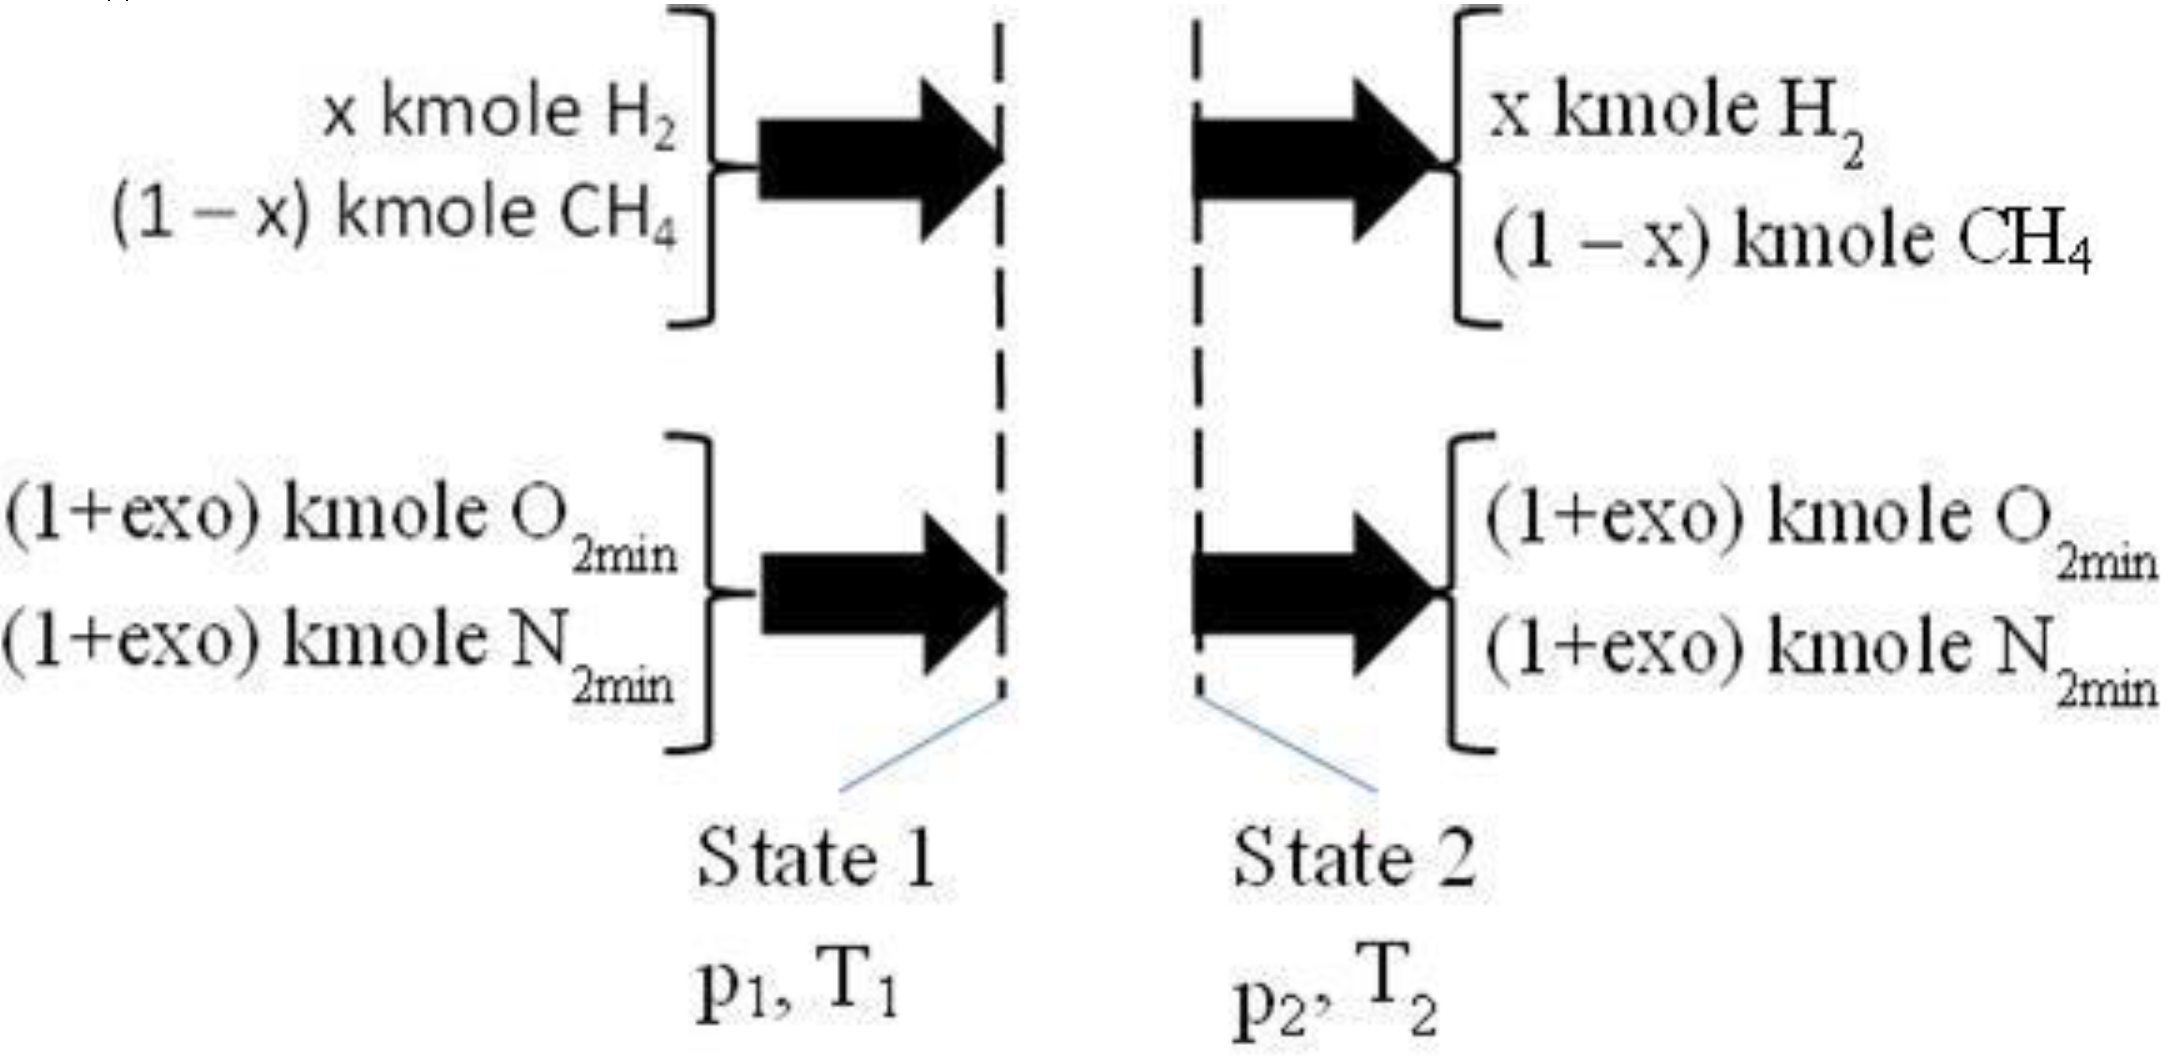
2.2. The Isentropic Compression of a Mixture of CH4/H2/Air, Prepared by a Carburetor, See Figure 2
The assumptions were related to 1 kmole fuel with different mole composition and mixed with air having different values of excess oxygen:
- −
they were considered 1 kmole fuel with x kmole H2 and (1 – x) kmole CH4;
- −
the needed air for combustion was evaluated by the imposed excess oxygen, exo, respectively (1 + exo)(2 – 1.5x) kmole O2 and 3.7619(1 + exo)(2 – 1.5x) kmole N2;
- −
the imposed x and exo, x = (0, 0.25, 0.5, 0.75); exo = (0, 0.25, 0.5, 0.75, 1, 1.5, 2);
- −
the volumetric compression ratio, π12 = V2/V1 = 10.
Figure 2.
The isentropic compression 1 – 2. O2min and N2min correspond to stoichiometric combustion.
Figure 2.
The isentropic compression 1 – 2. O2min and N2min correspond to stoichiometric combustion.
The parameters for the state 2 were evaluated through equations 1, 2 and 3
where
are the mole composition of wholly mixture CH
4/H
2/air [kmole/kmole], and the relative physical enthalpies and internal energies [kJ/kmole] that were interpolated by 5
th order polynomials function of temperatures, see
Table 1, R= 8.3145 kJ/kmole.K is the universal constant of ideal gas;
2.3. The Closed Constant Volume Combustion, See Figure 3
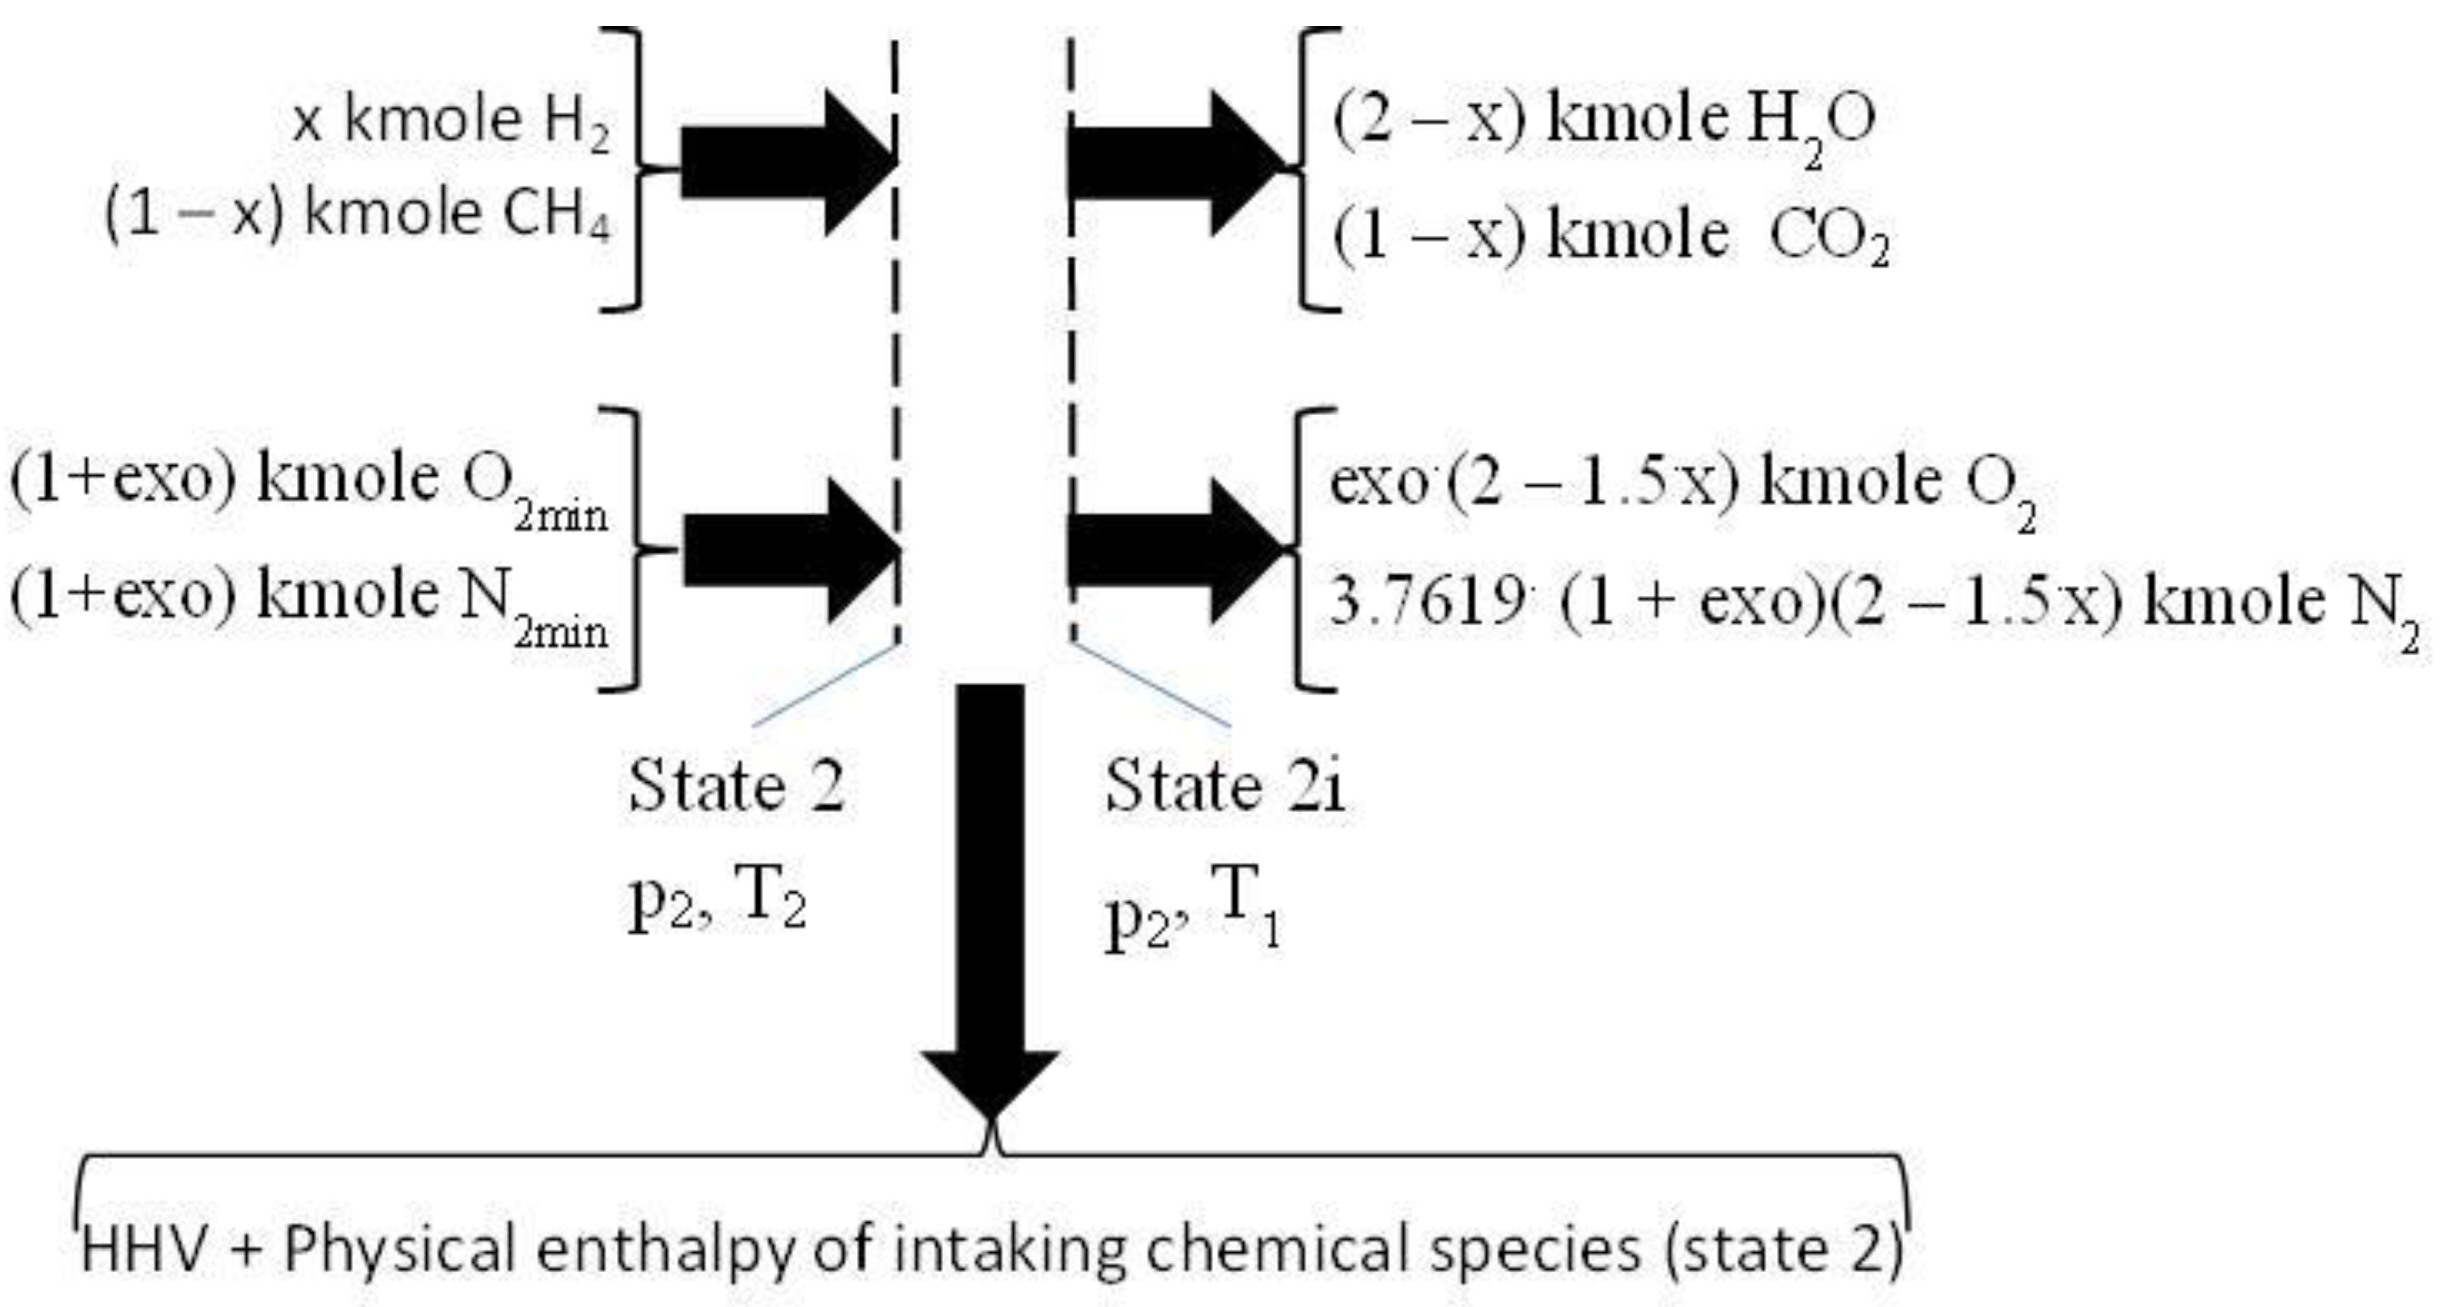
The closed constant volume combustion was designed in two successive steps. The first step gives the energy input for the second one, respectively the higher heating value, HHV, and the physical enthalpy of intaking chemical species, see
Figure 3. This first step develops a fictitious combustion without dissociation, and performed at the constant pressure p
2 and the constant temperature T
1. The chemical reactions pertaining to this first step are those of direct oxidation of the fuel:
Figure 3.
The first step of combustion giving the heat input for the second one. HHV is higher heating value, O2min and N2min values for stoichiometric combustion.
Figure 3.
The first step of combustion giving the heat input for the second one. HHV is higher heating value, O2min and N2min values for stoichiometric combustion.
The HHV was evaluated by the enthalpies of formation of involved chemical species, h
f0, see
Table 2.
The physical enthalpy of intaking chemical species were given by a fictitious constant pressure cooling of the intaking gases.
where the physical enthalpies of intaking gases correspond to T
2.
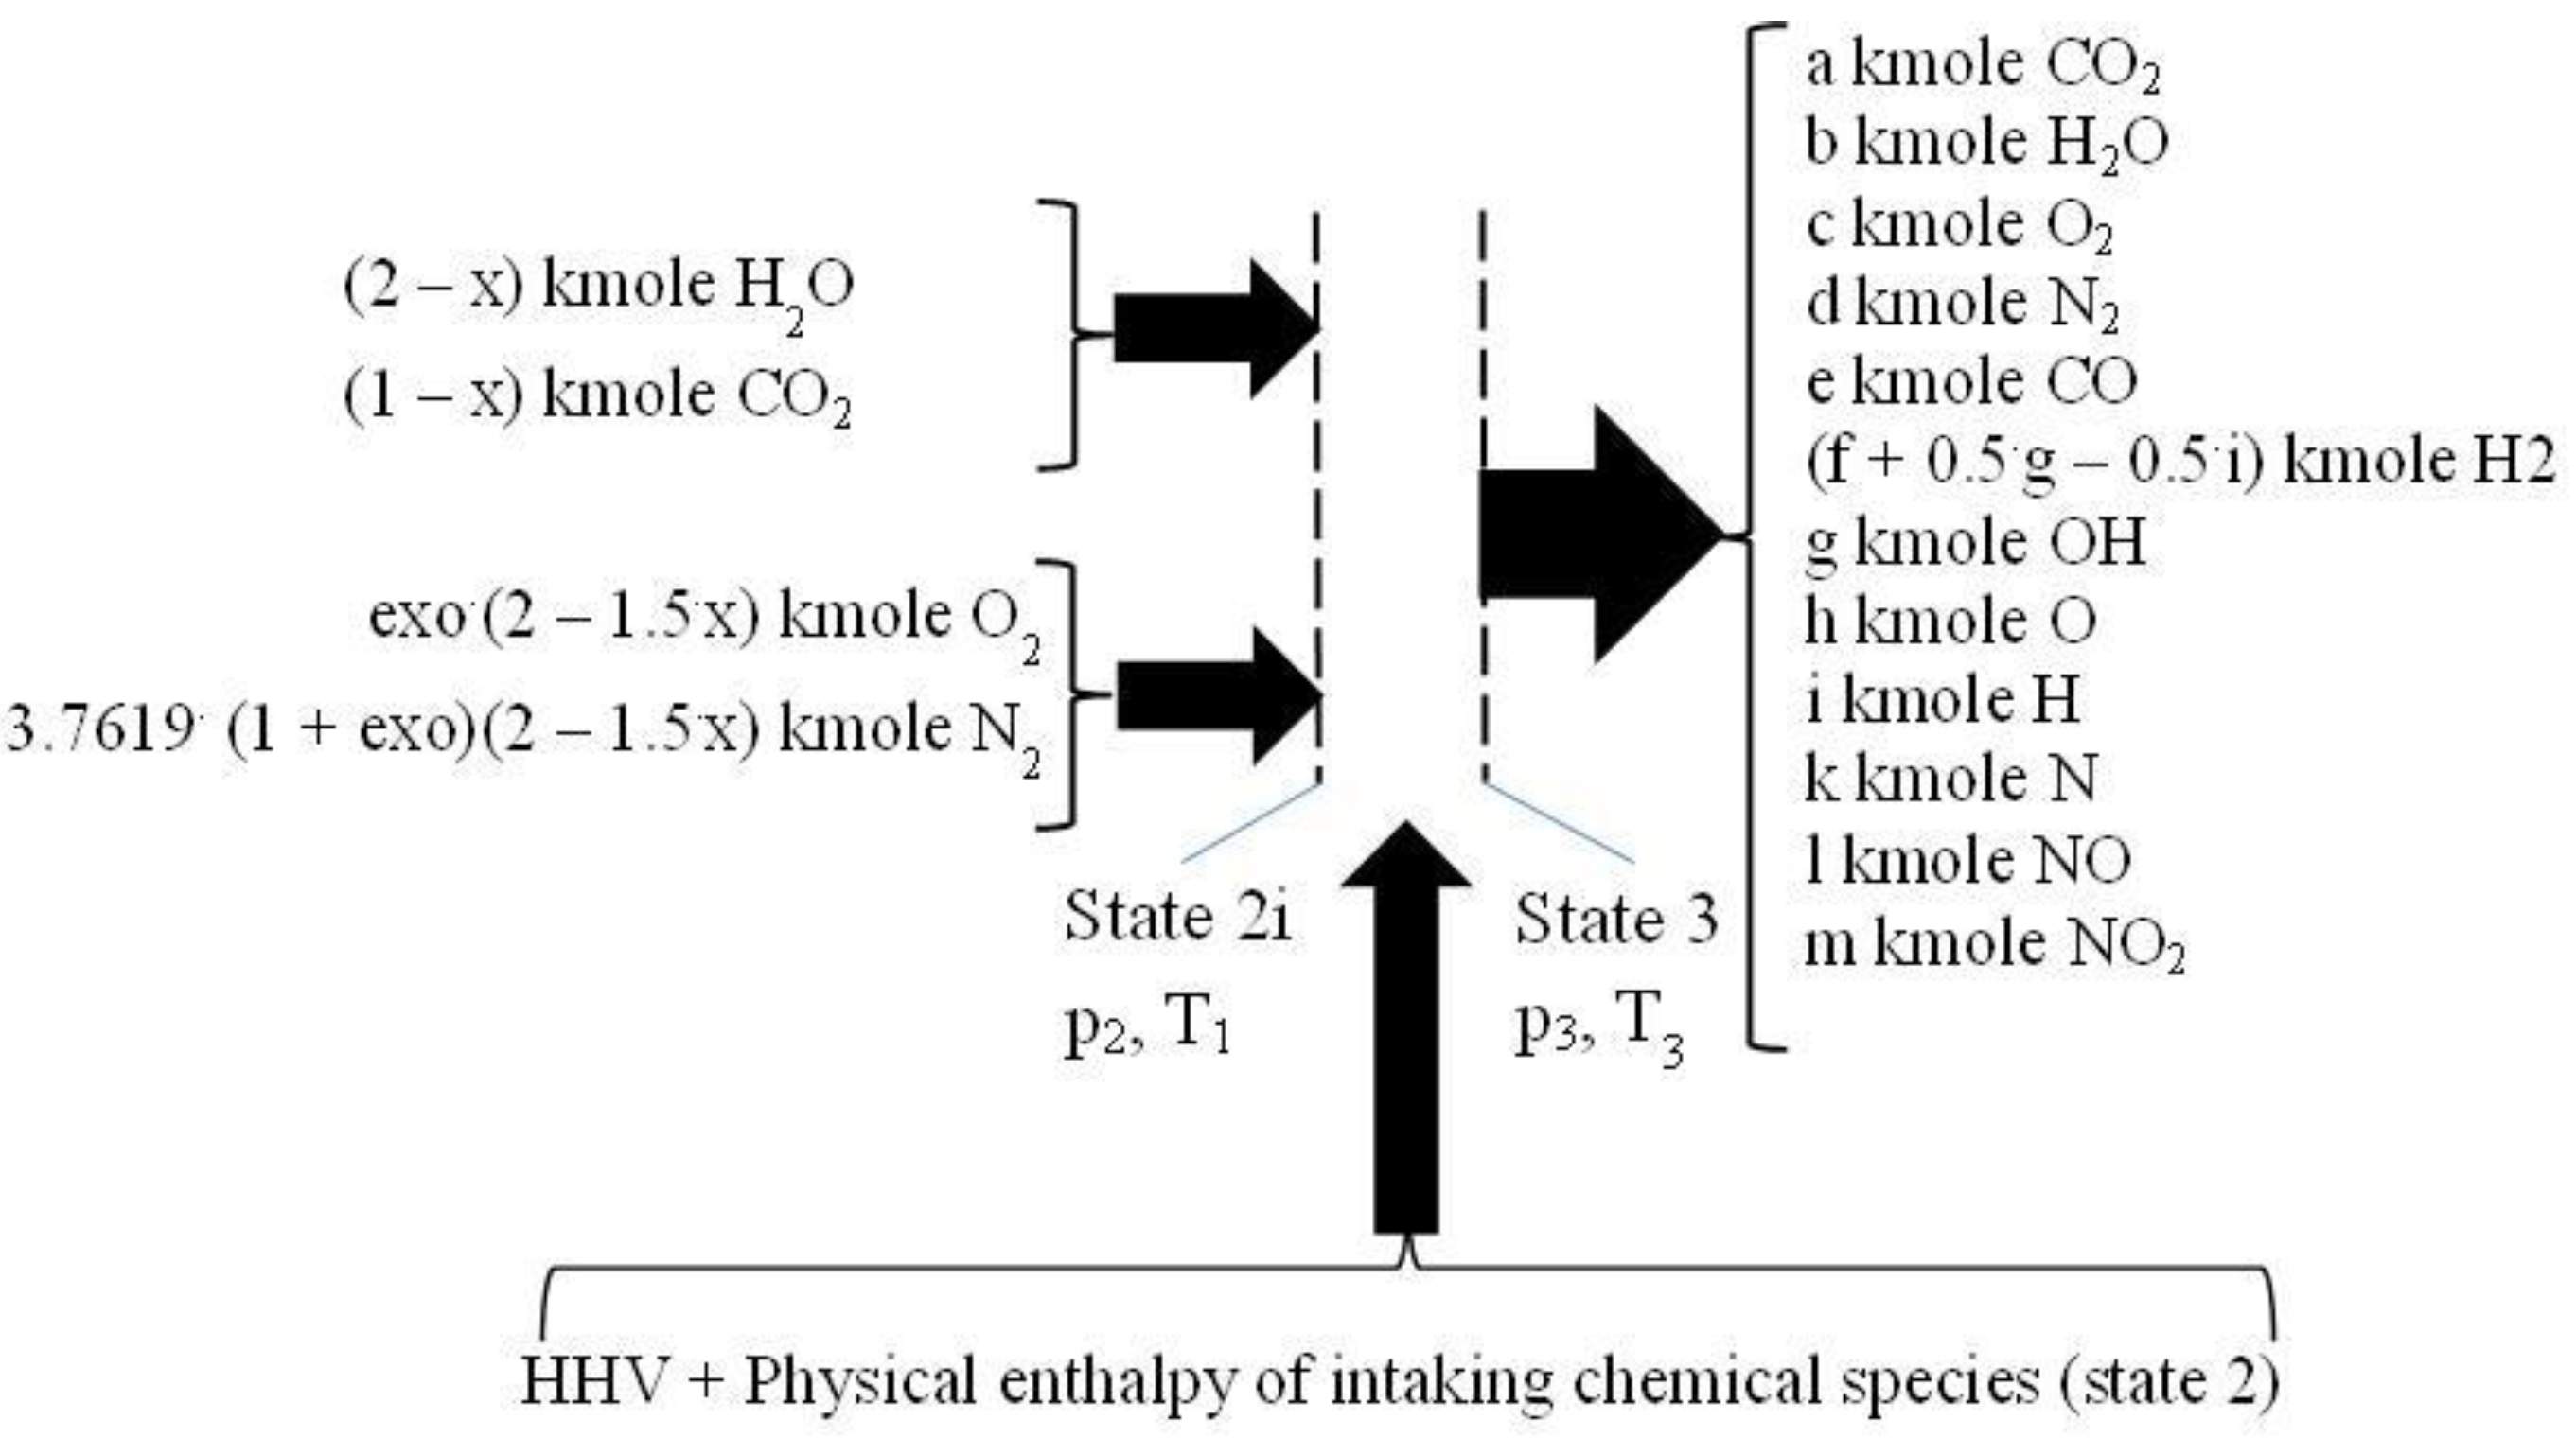
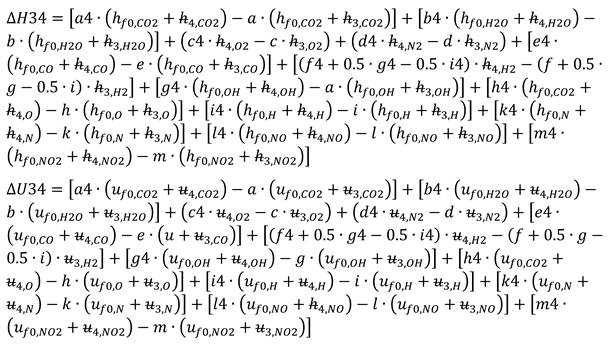
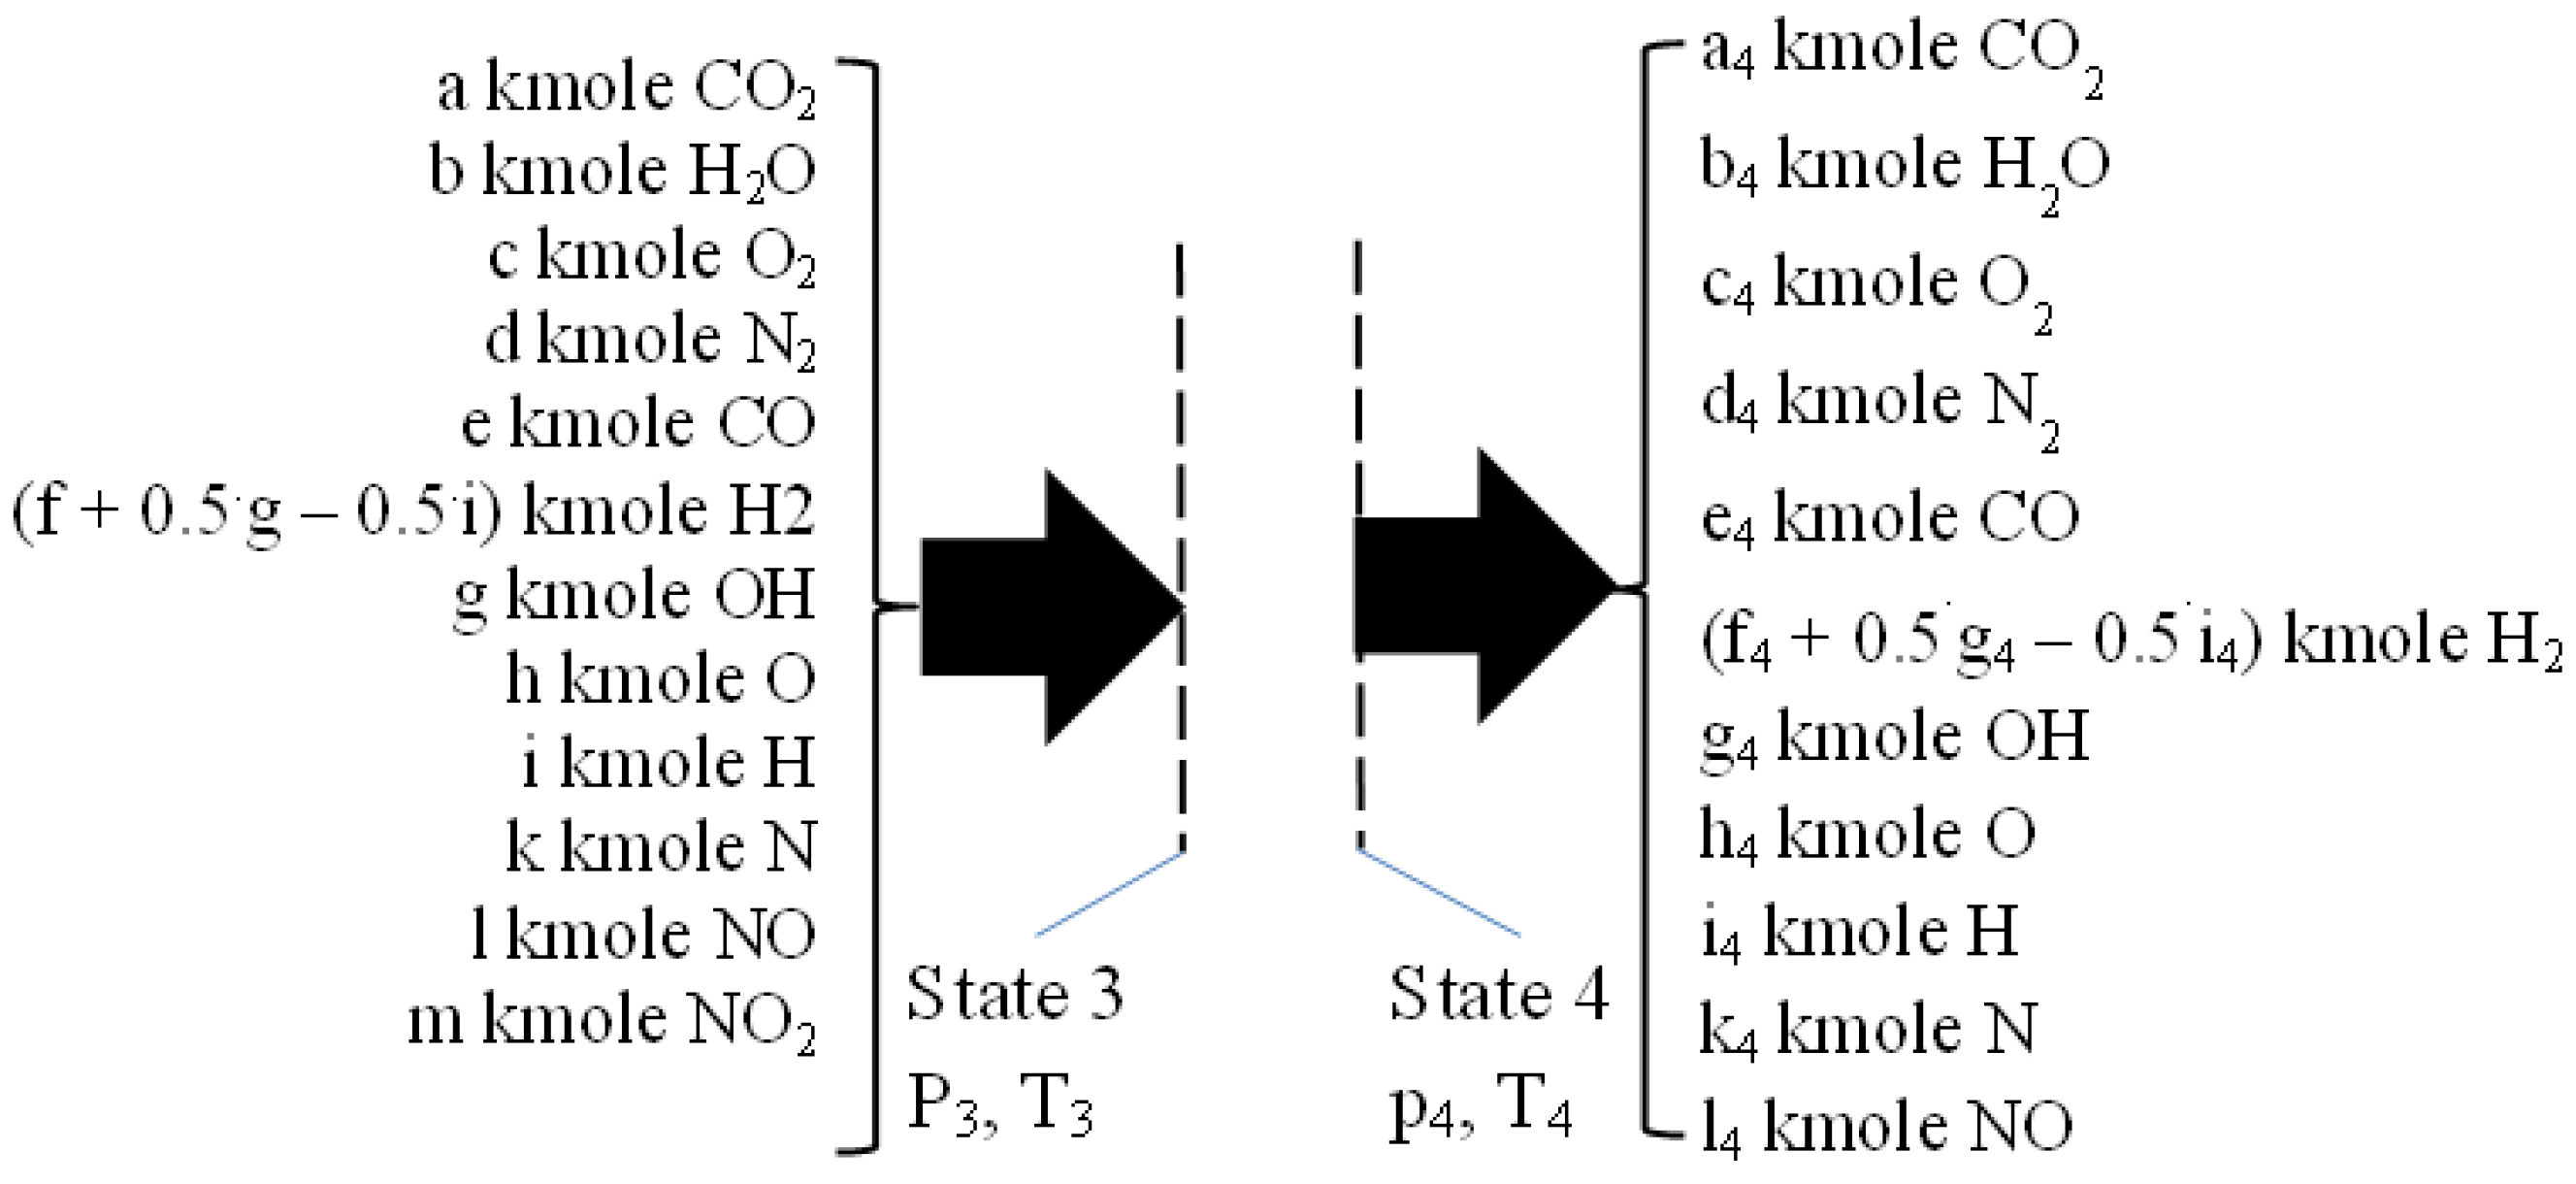
The second step of constant volume combustion, 2i – 3, is conceived as a heating with dissociation of flue gases and consuming the heat released in the first step, i.e. HHV and physical enthalpy of intaking chemical species (state 2), see
Figure 4. The inlet chemical species have the temperature T
1 and pressure p
2. The outlet temperature and pressure, T
3 and p
3, were computed using the mass and energy conservation law and the Mendeleev – Clapeyron state equation.
Figure 4.
The second step of combustion consuming the heat released in the first one.
Figure 4.
The second step of combustion consuming the heat released in the first one.
The second step of combustion has counted the following chemical reactions, of dissociation and of recombination:
The mass balance equations are stated by:
- −
four equations related to the balance of kmoles number of major chemical species, CO2 and H2O and O2 and N2,
- −
eight equations interrelating all chemical species through chemical equilibrium relations and,
- −
one mass balance for the whole process 2i – 3.
The balance of kmoles number of major chemical species:
For a chemical reaction ν
AA + ν
BB → ν
CC + ν
DD the equilibrium constant is
where
The natural logarithms of chemical equilibrium constants, for P = 1, were interpolated by polynomials of 7
th order, see
Table 3, using values from [
10] (p.773).
The equations interrelating all chemical species through chemical equilibrium relations:
The mass balance for the whole process 2i – 3
The energy balance equation:
The Mendeleev - Clapeyron state equation for gaseous mixtures:
2.4. The Isentropic Expansion 3 - 4, See Figure 5
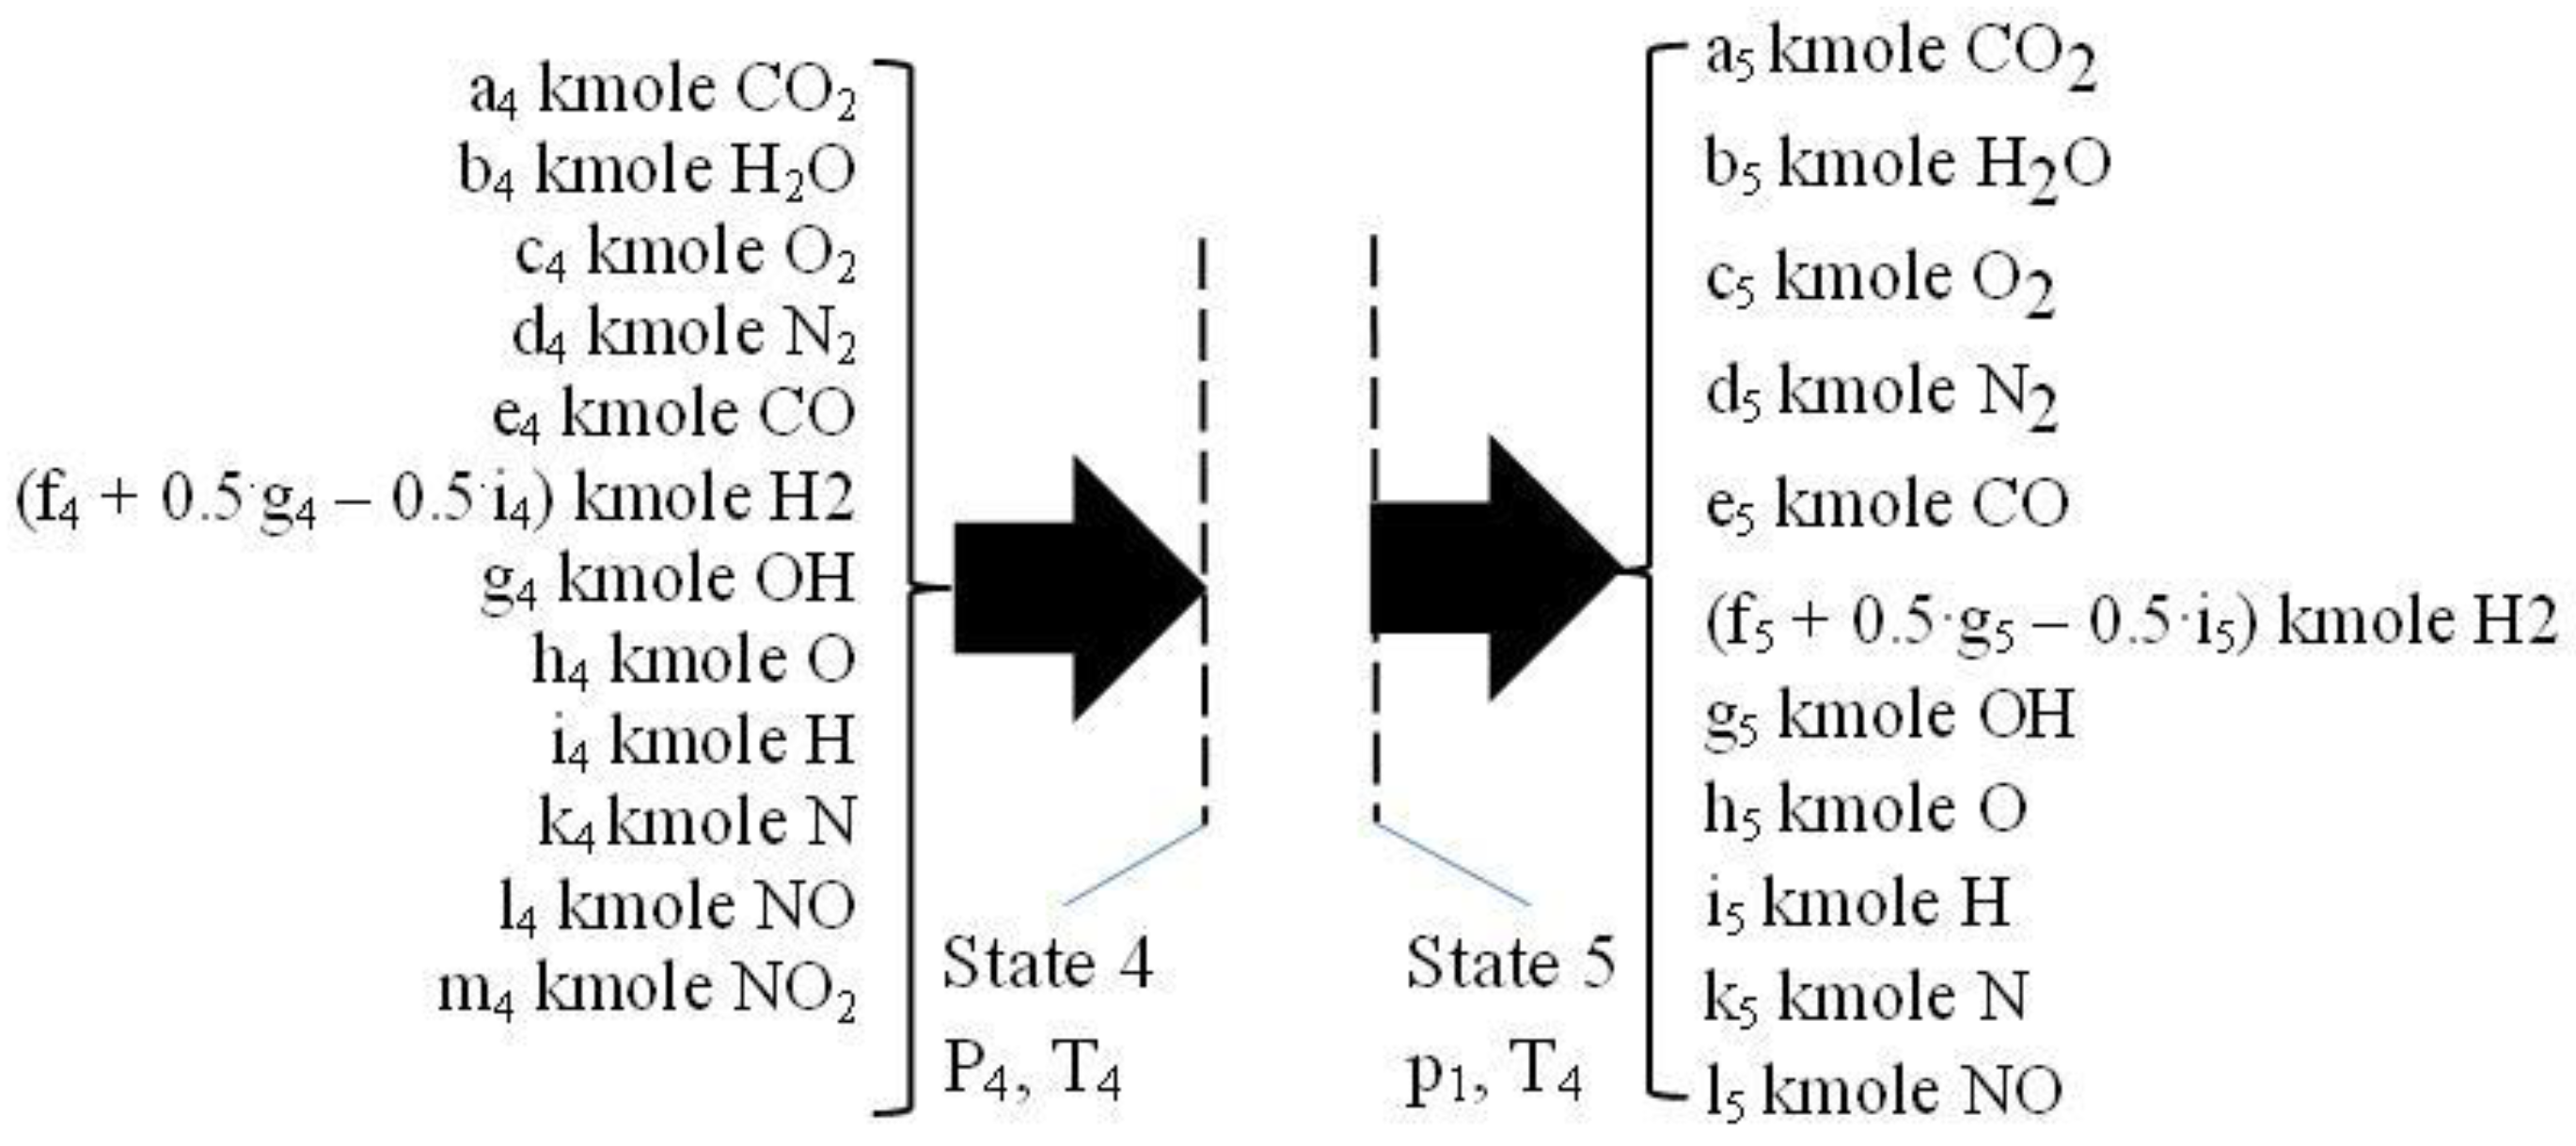
During the isentropic expansion, the chemistry of flue gases is also prevailing due to high temperatures and pressures, and therefore the composition of flue gases is changing by variable temperature and pressure. This process was solved defining a proper isentropic exponent quantifying the variable chemical composition of flue gases. The equations defining a reactive isentropic expansion allowed the evaluation of parameters of state 4. The parameters for the state 4 were evaluated through equations 30, 31 and 32, evaluating the flue gases composition through two computational loops regarding relationship composition – temperature and pressure, similar as in the case of constant volume combustion.
2.5. The Flue Exhaust Process 4 - 5, See Figure 6
This process is considered as a throttling one, described by constant enthalpy. They were used the ideal gas model and thus they were supposed that the temperature is almost constant because the composition variation of flue gases is not significant.
This simplified approach allowed the evaluation of final composition of the state 5 only on the basis of mass conservation law given by known values of chemical equilibrium constants for T5 = T4 and p5 = 1 bar.
3. The Numerical Solving and Results
The isentropic compression and expansion can be solved through a proper mathematical procedure, the most simple is an iterative trial and error method. The compression is very easily to be solved because the cylinder intaking fluid has a constant composition. During expansion, the composition is changing but, we know the state 3 composition previously computed and the state 4 composition evaluated through eqs. 31 to 33.
The closed constant volume combustion must use two iterative loops, one for flue gases composition, and the next one for final temperature and pressure. The first step consider a constant volume heating of flue gases without dissociation in order to preliminary determine the temperature and pressure of state 3 through energy conservation law and Mendeleev – Clapeyron state relation. These parameters permitted the evaluation of a first computational composition of flue gases, in state 3, by mass conservation law. This new flue gases composition, in state 3, allowed the re-evaluation of temperature and pressure of state 3 by energy conservation law and Mendelev-Clapeyron state equation. The iterative loops end when the difference between two successive steps submit to an imposed error of computed parameters.
The numerical results emphasized the behavior of variations of pollutants emissions (CO and NOx) in a good qualitative agreement with the experiments performed elsewhere.
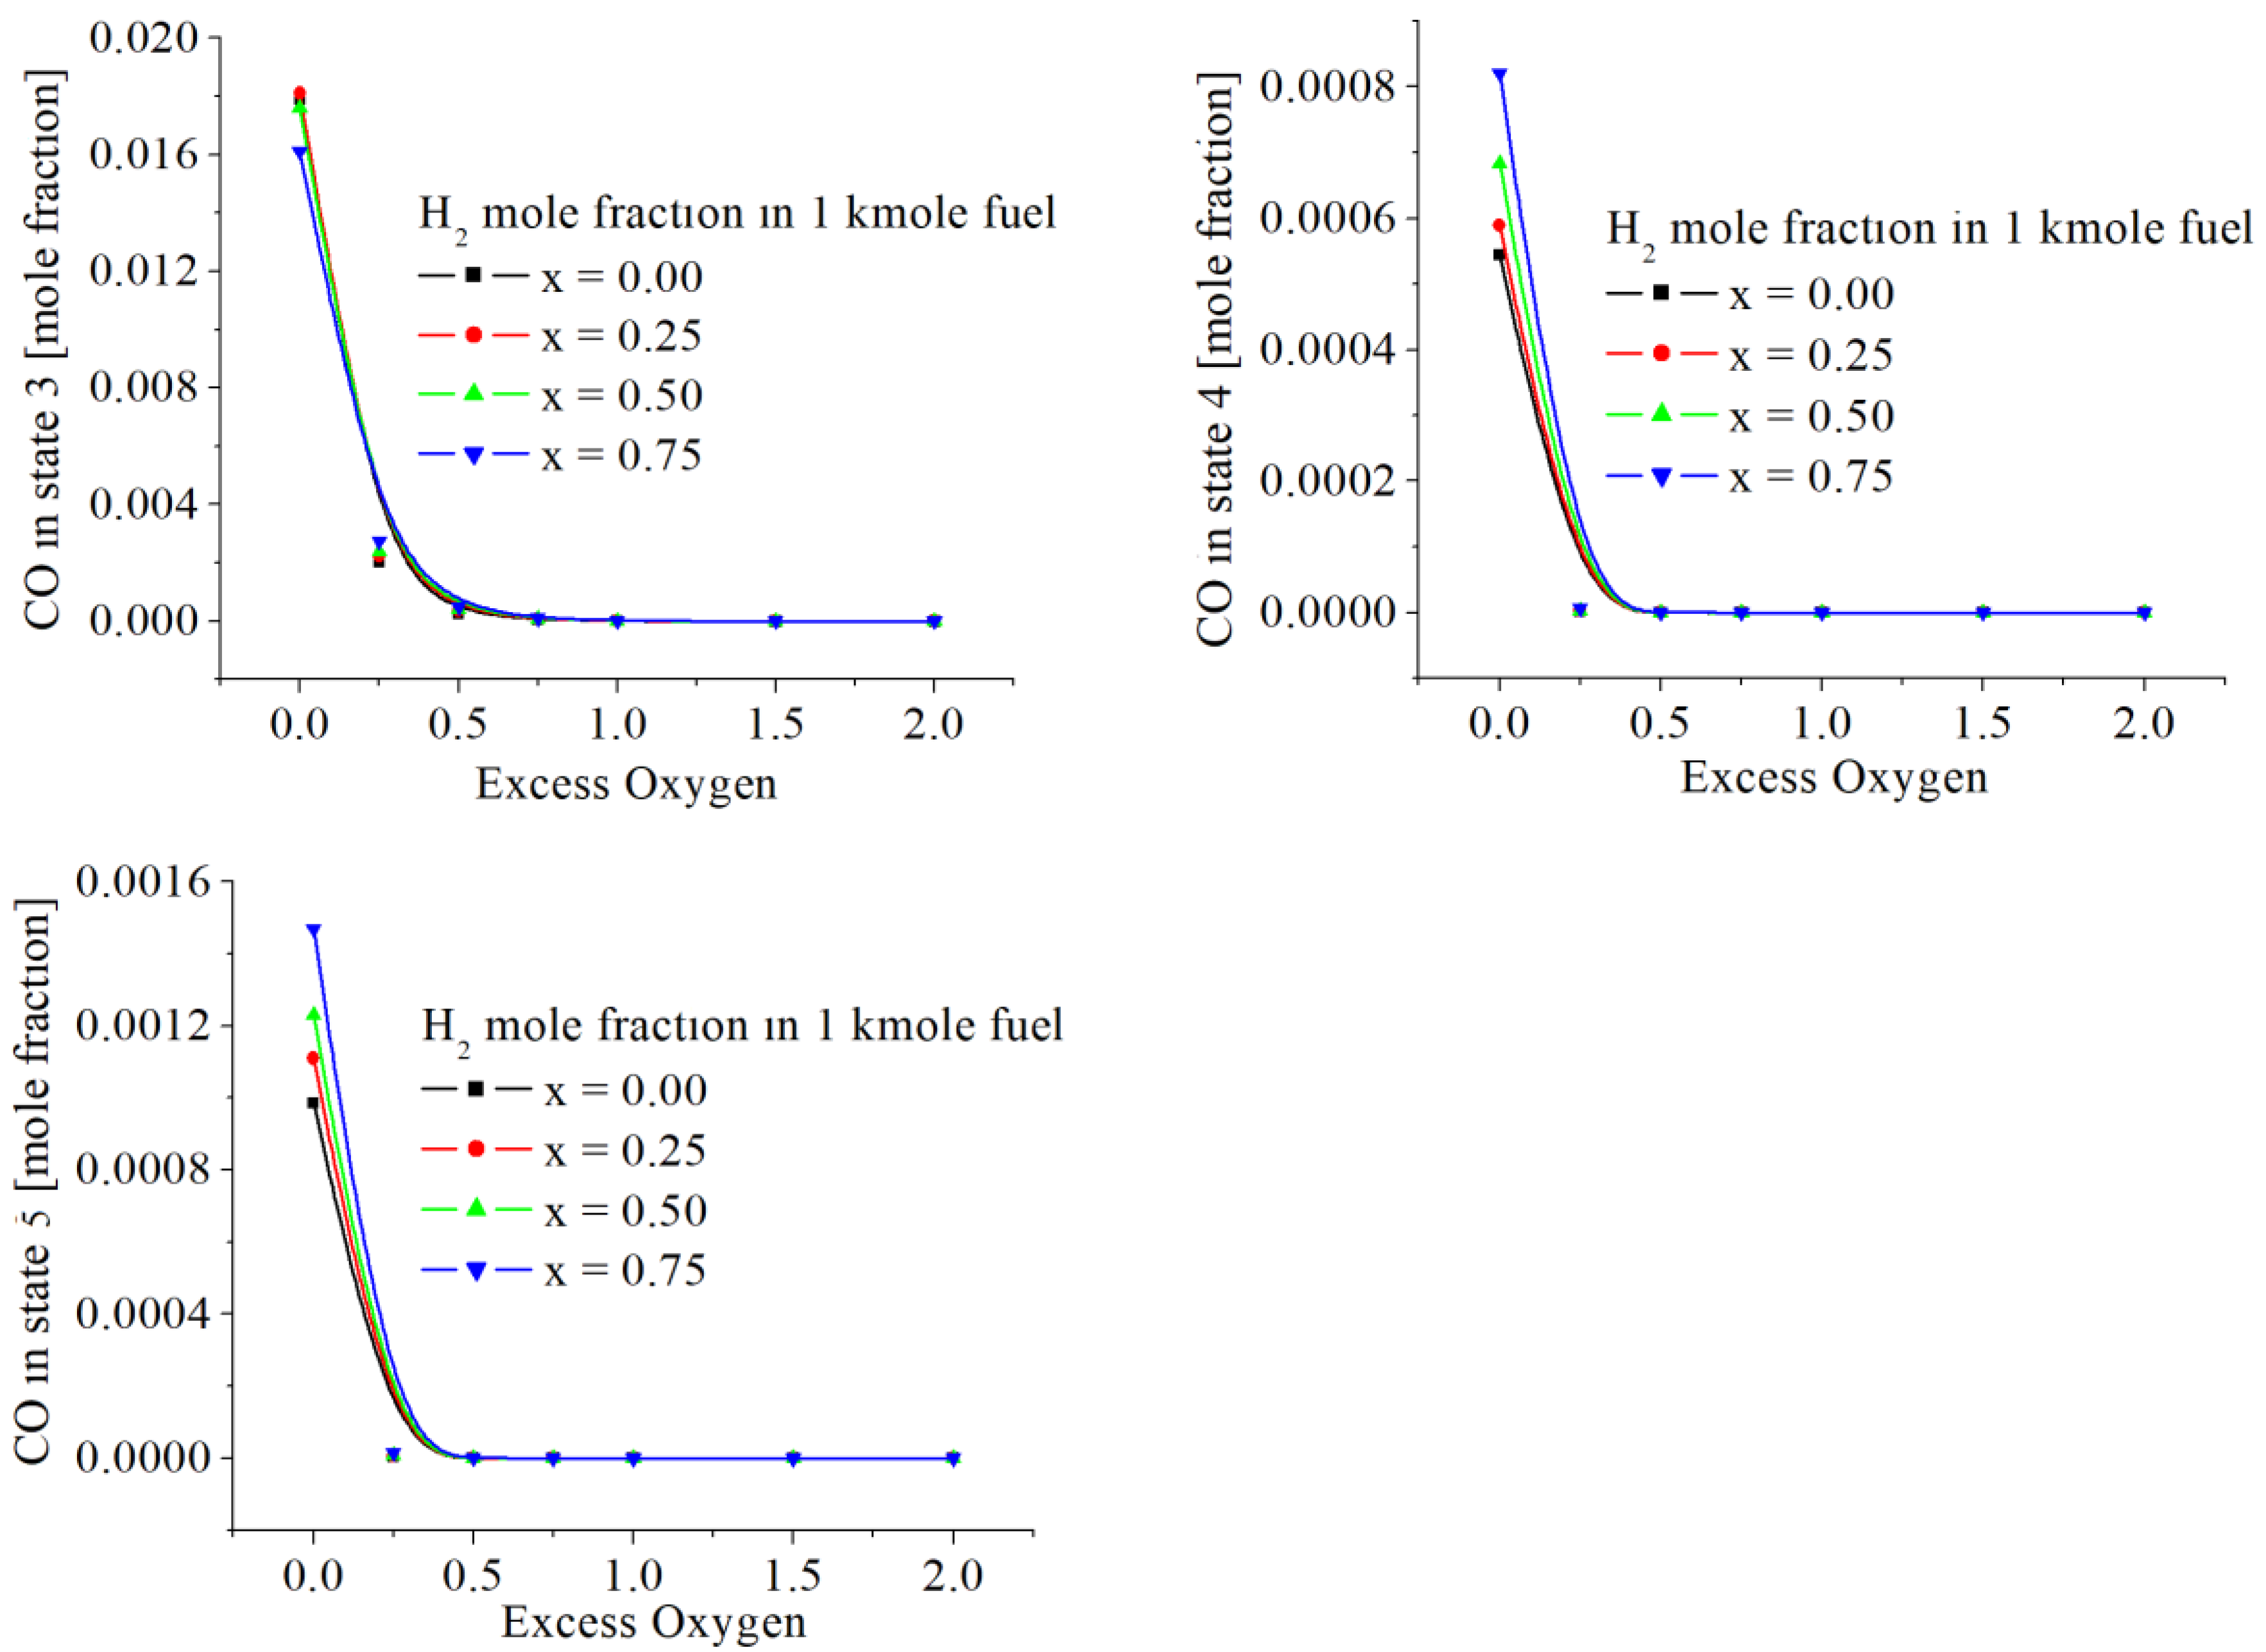
The values of CO mole fractions in flue gases are included in
Figure 7 and
Table 4. The maximum mass ppm, found in state 5, is around 170 ppm [mg CO/kg flue gases], for exo = 0 and x = 0.75. The throttling, decreasing the pressure, gives CO emissions almost twice larger for a stoichiometric combustion (exo = 0). All numerical results showed that the presence of hydrogen increases very slightly the CO emissions.
Figure 7.
The CO mole fractions in states 3, 4 and 5, function of excess of oxygen and x.
Figure 7.
The CO mole fractions in states 3, 4 and 5, function of excess of oxygen and x.
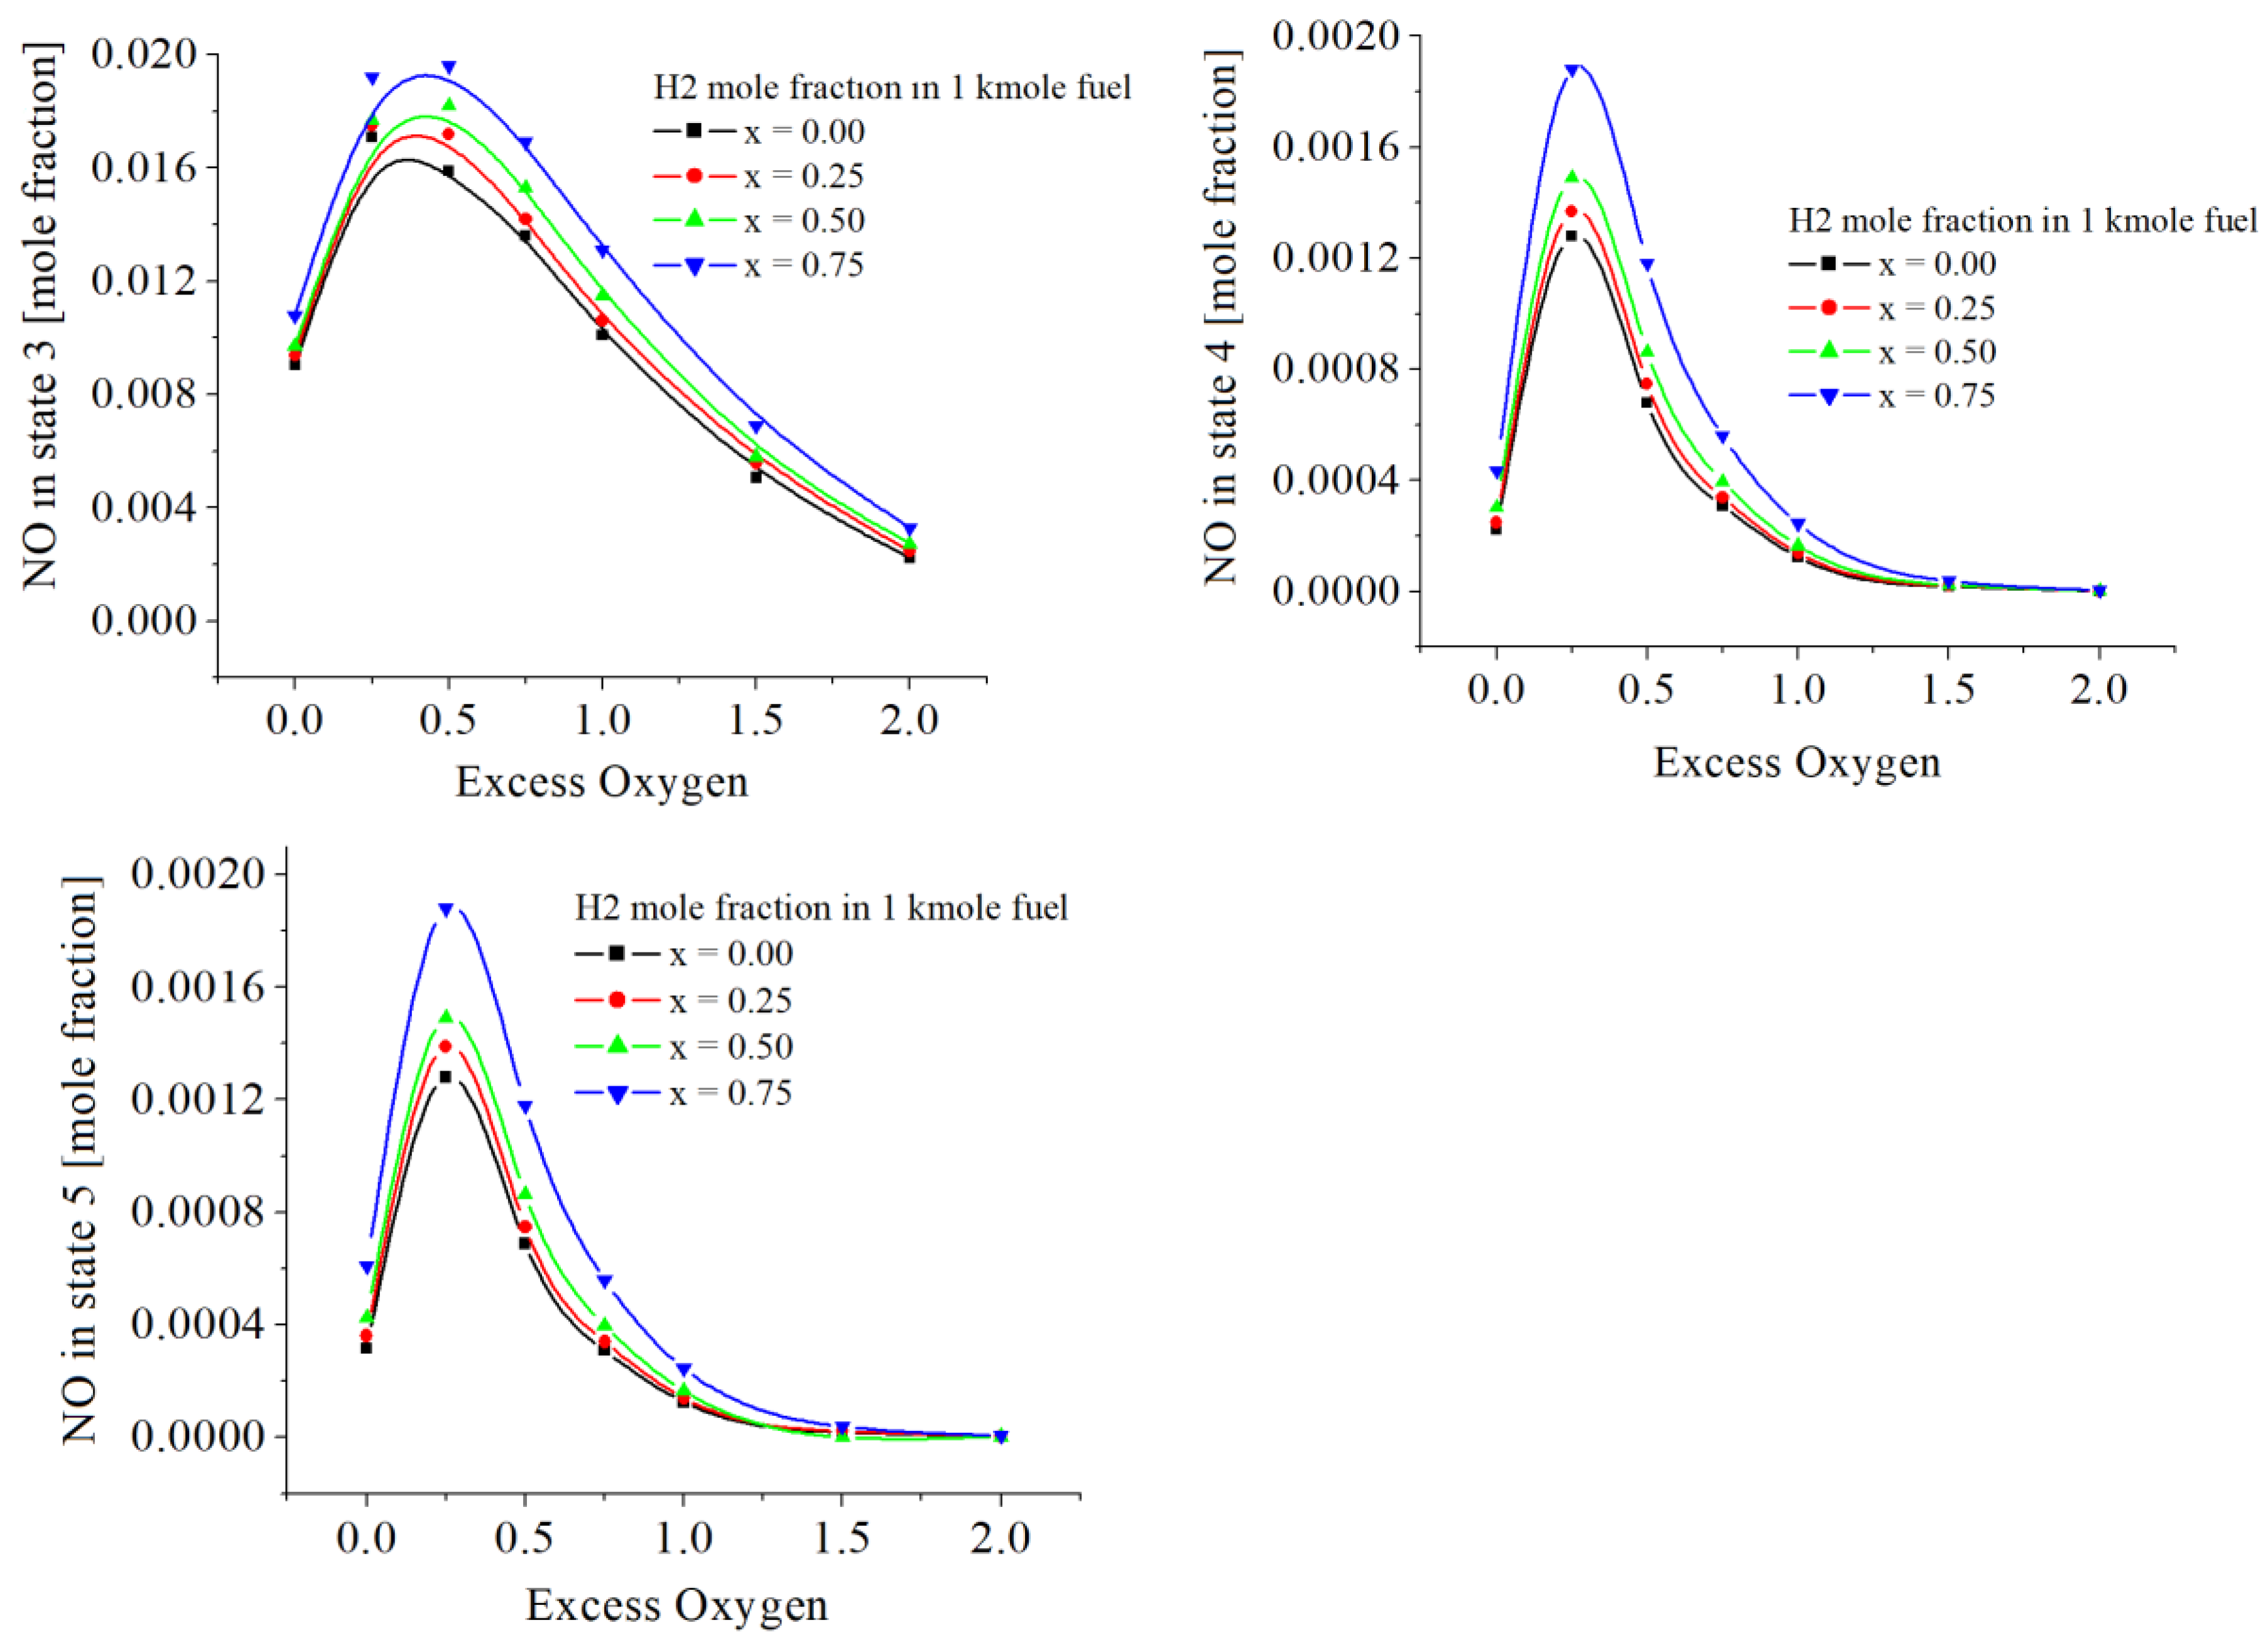
The values of NO are in
Figure 8 and
Table 5. The numerical results showed two influences of hydrogen. The first influence gives NO mole fractions proportional to the mole ratio of hydrogen in fuel and larger than in the case of combustion without hydrogen. The second influence highlighted a maximum of these emissions for 0<exo<0.5.
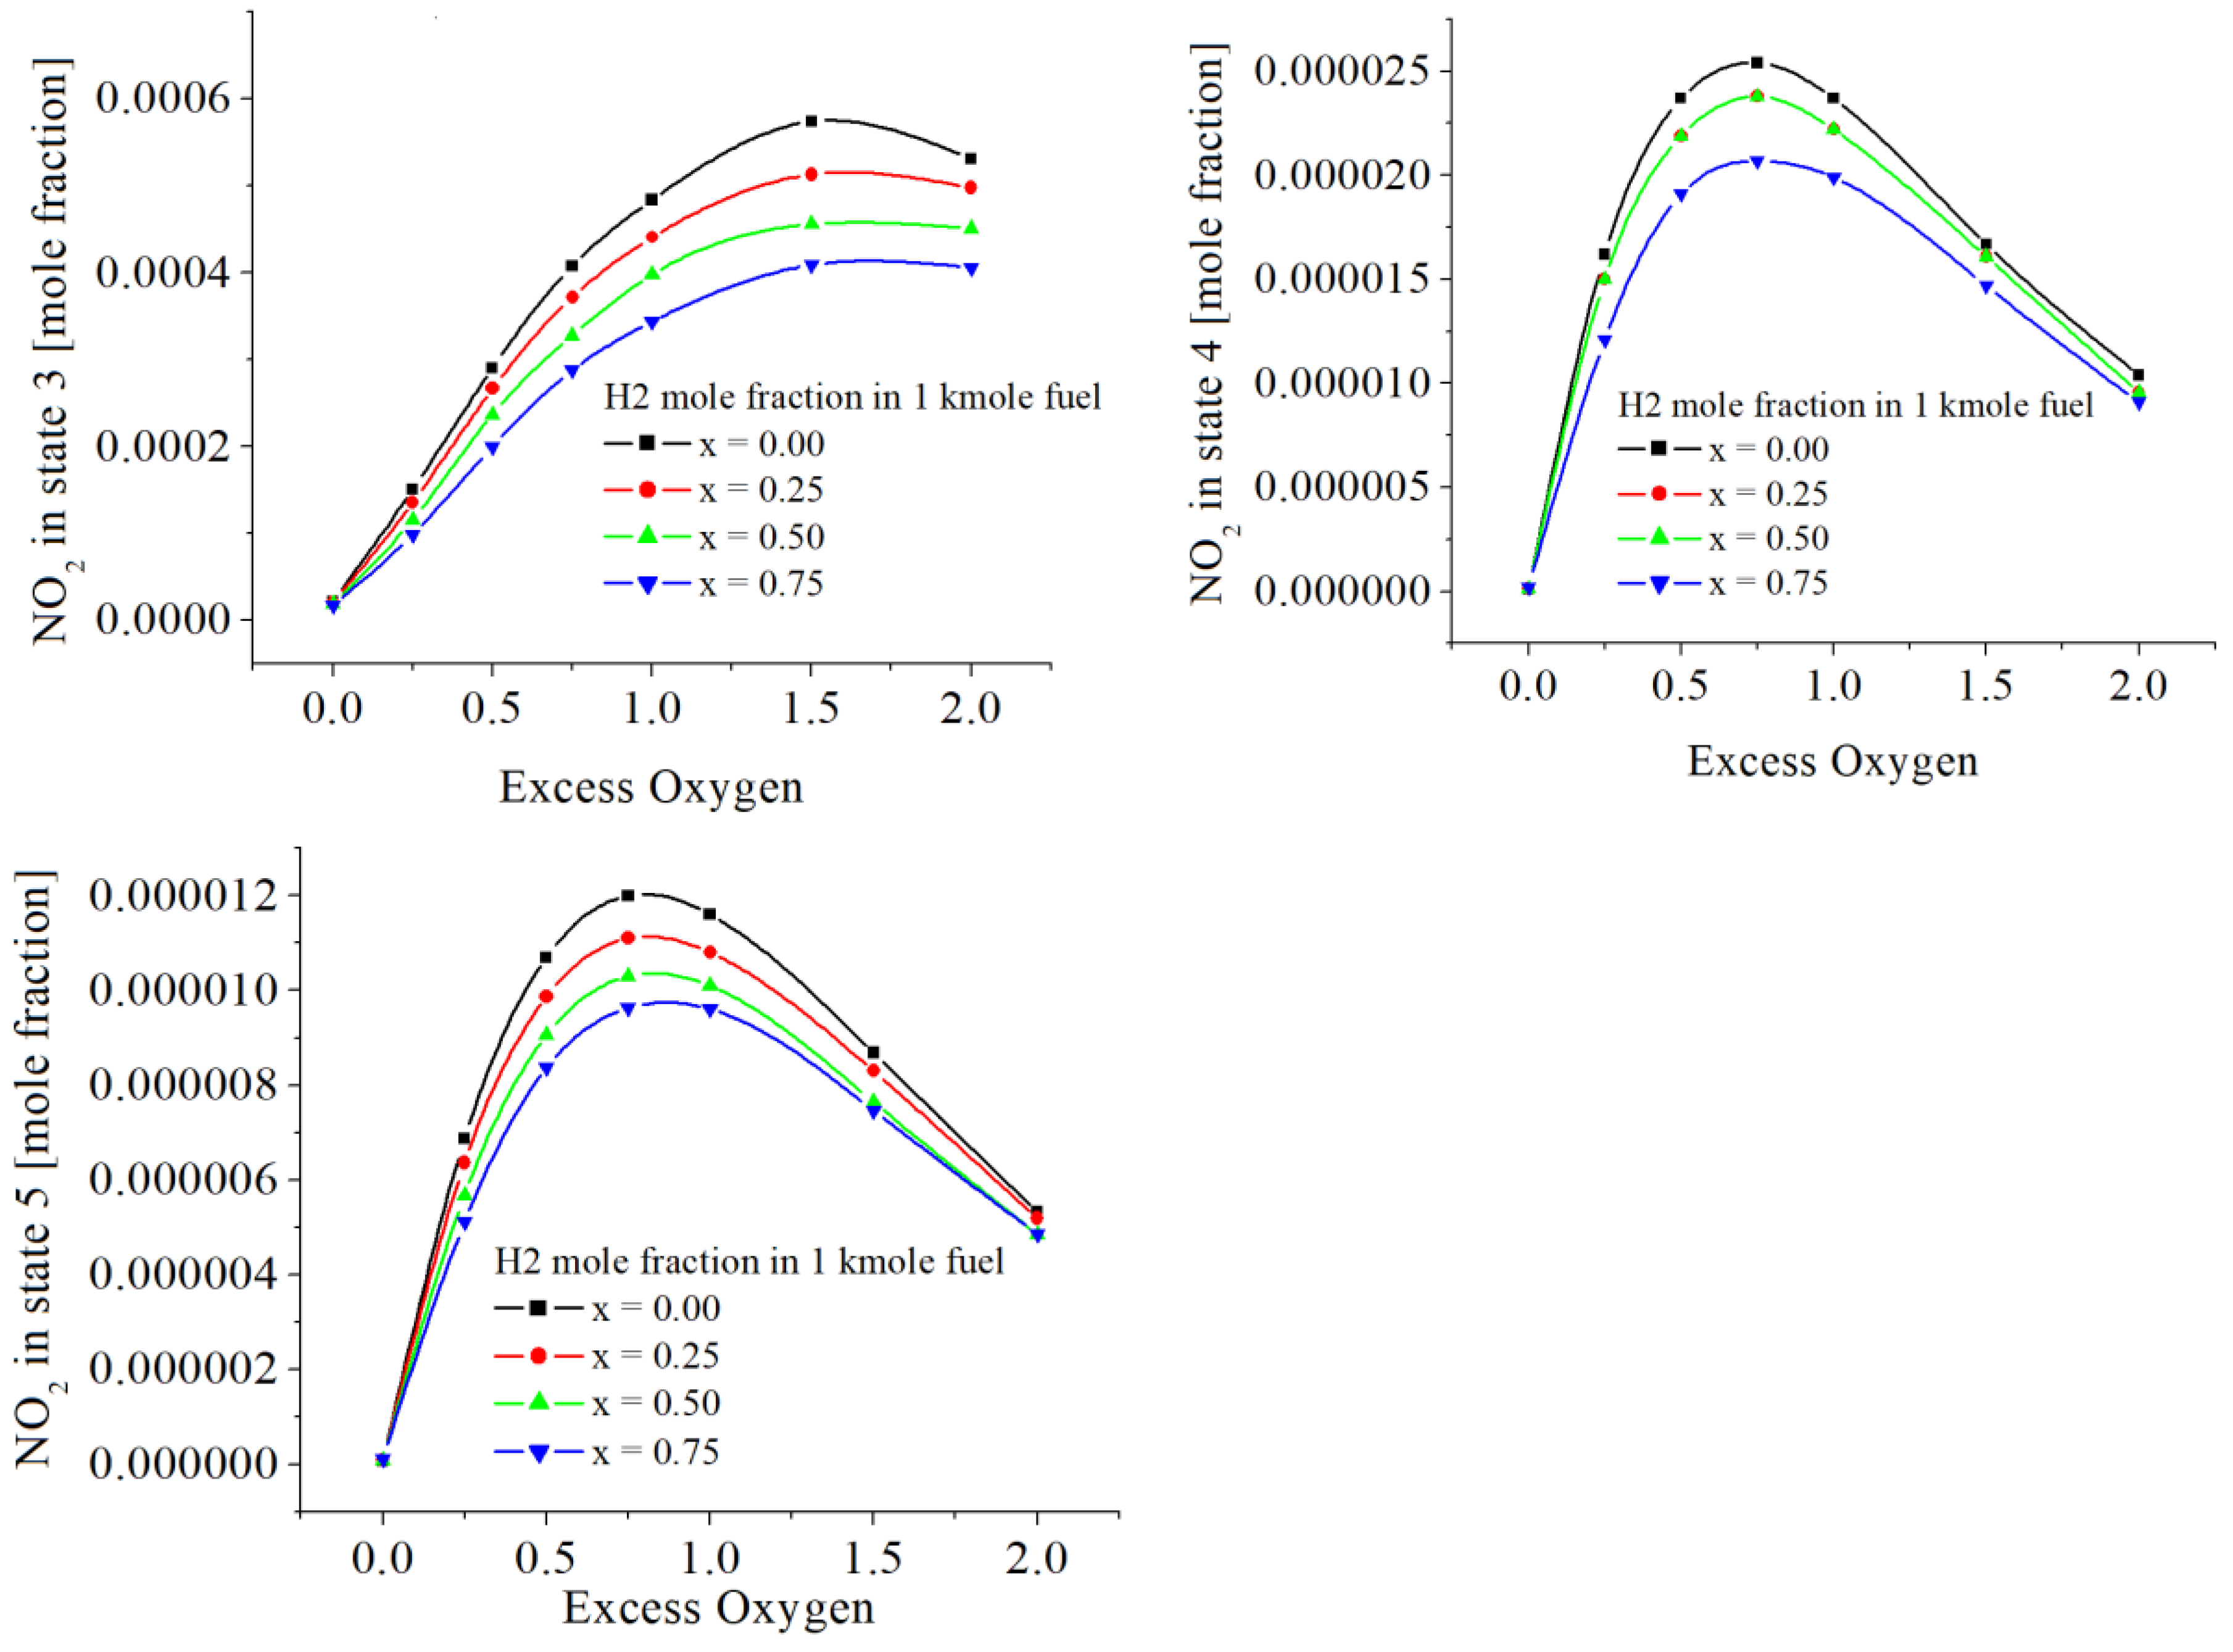
The values of NO
2 are given in
Table 6 and
Figure 9. NO
2 emissions are smaller as larger the hydrogen mole fraction in the fuel. This is contrasting to the emissions of NO. Similarly, NO
2 emissions have a maximum depending on the oxygen excess.
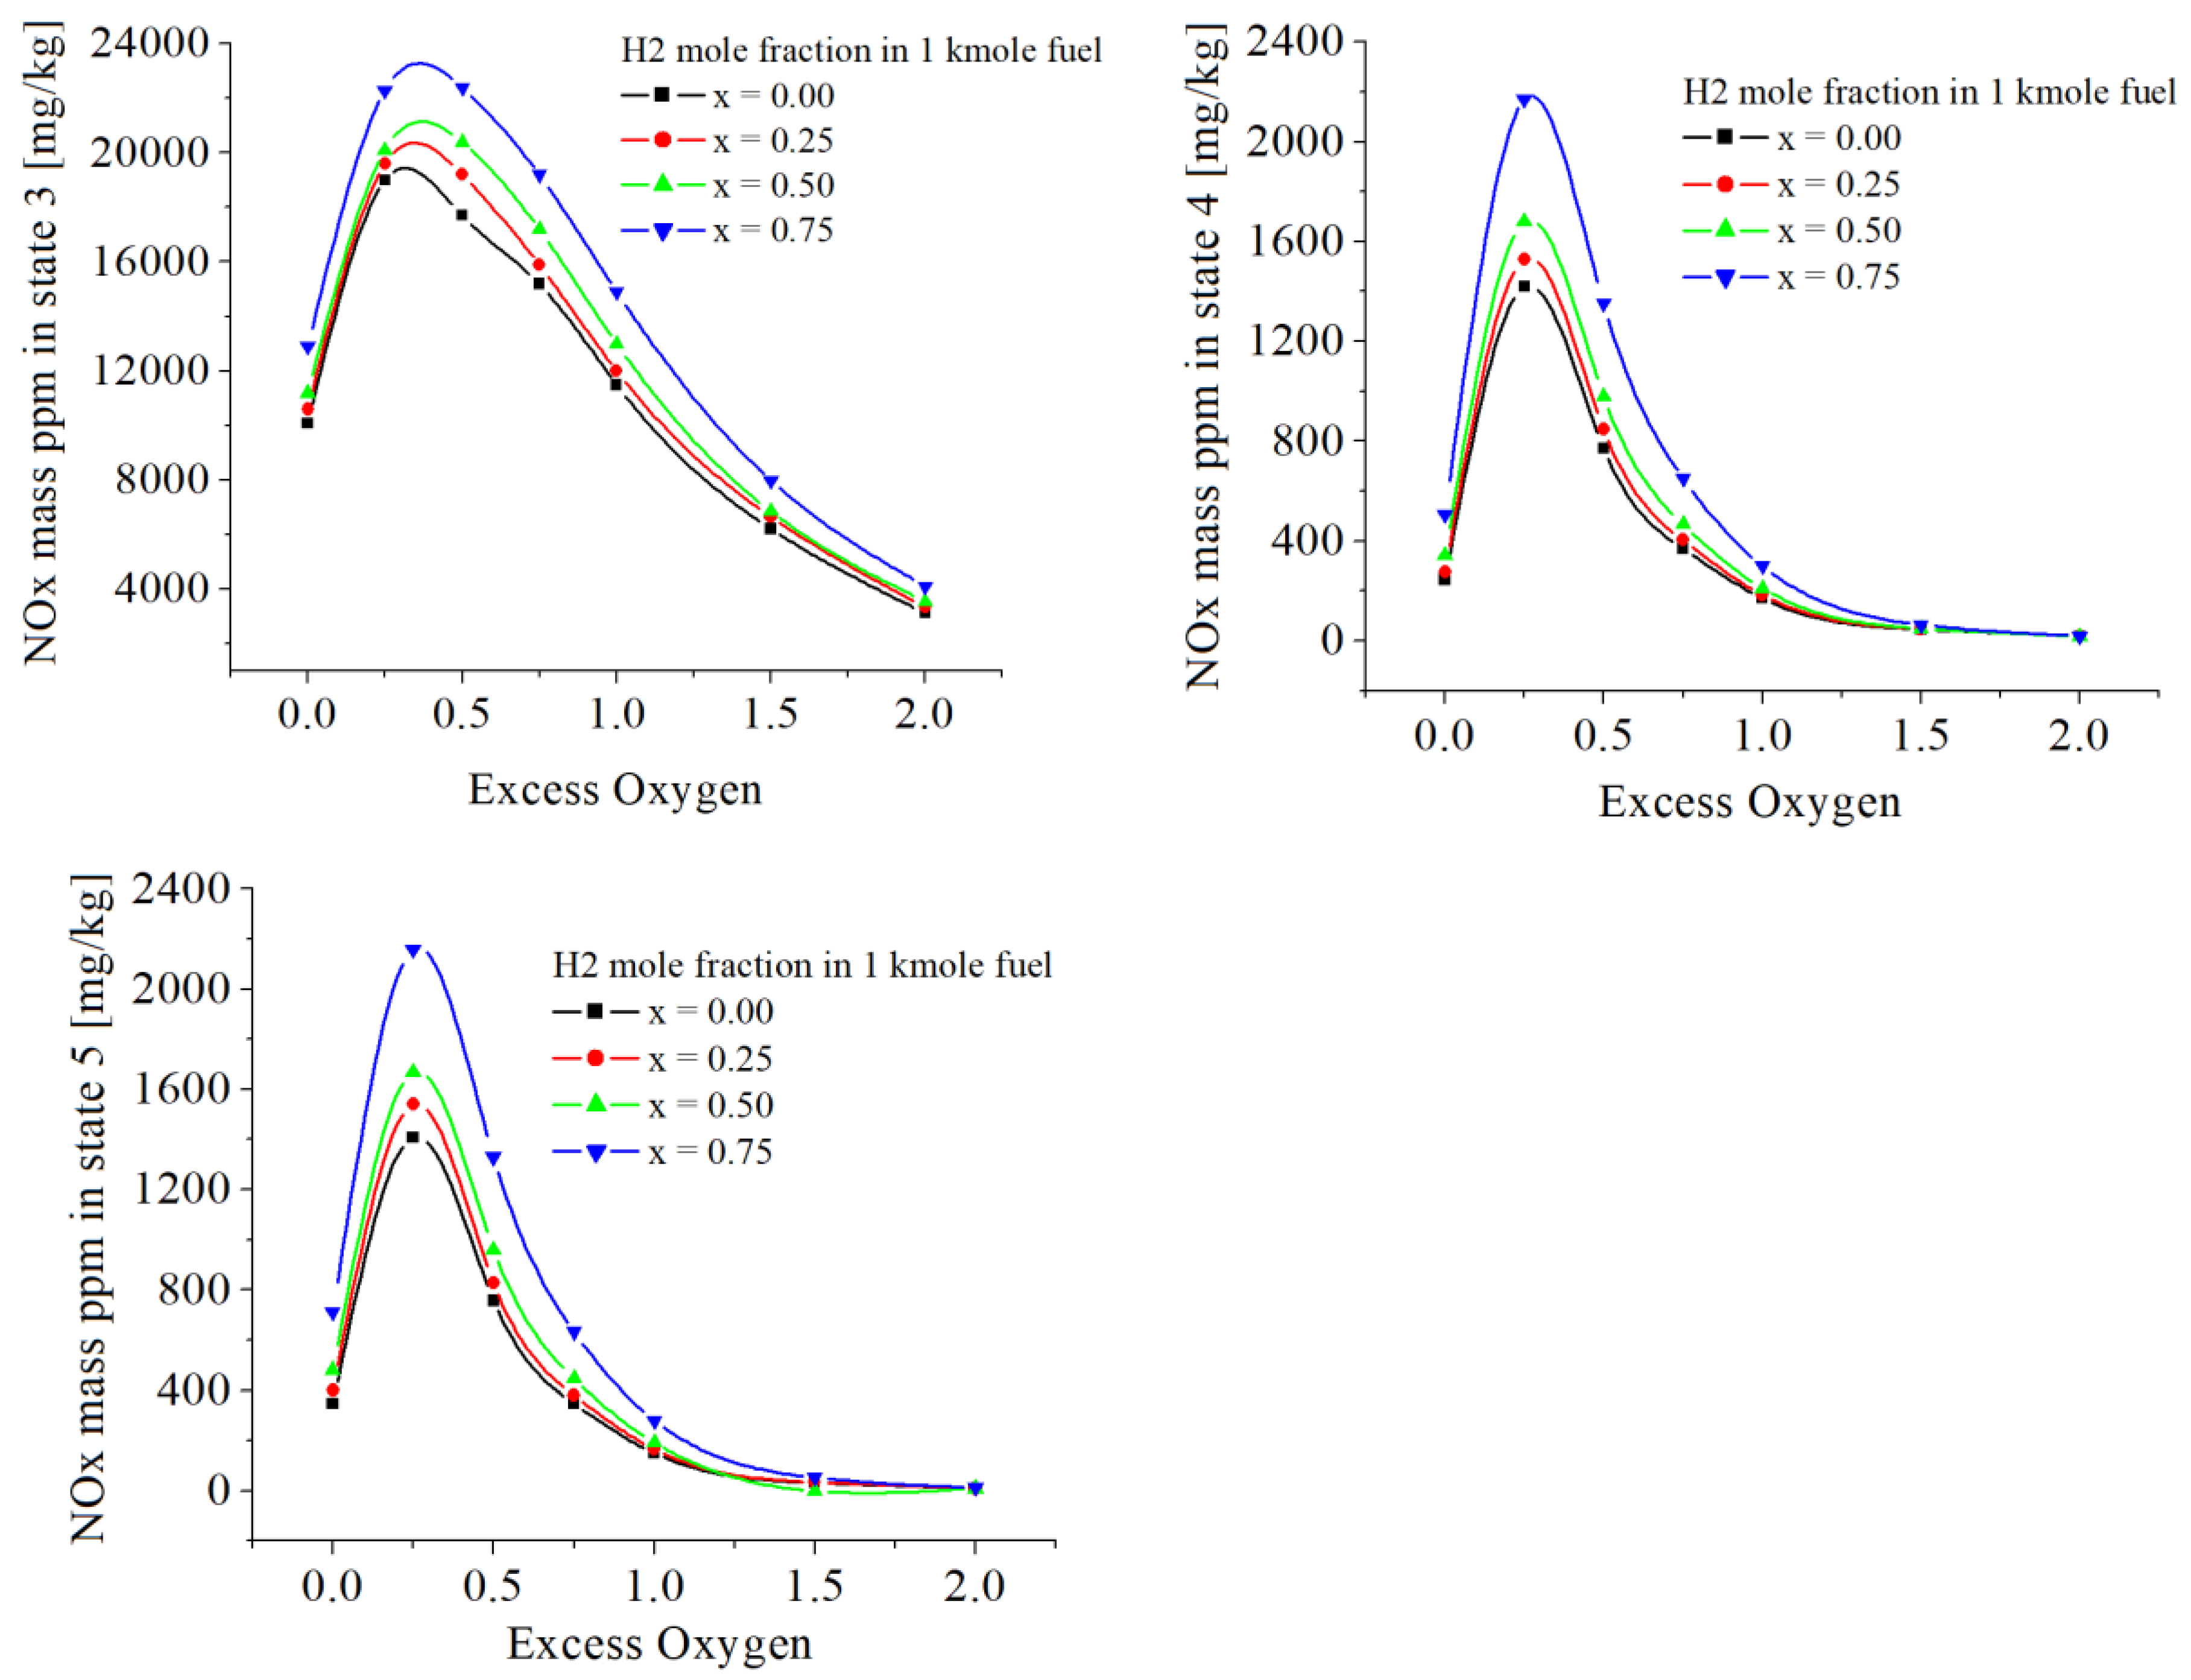
The cumulative values of NOx are given in
Table 7 and
Figure 10. The numerical results showed similar influences of hydrogen as in the case of NO emissions because the values of NO are more larger than those of NO
2.
Figure 10.
The NOx mass ppm [mg/kg] in states 3, 4 and 5, function of excess of oxygen and x.
Figure 10.
The NOx mass ppm [mg/kg] in states 3, 4 and 5, function of excess of oxygen and x.
The chemical modeling revealed that all interrelated parameters have variable values depending on the hydrogen mole fraction in the fuel and on the excess oxygen imposed for a certain combustion process, e.g. the temperatures and pressures in states 2, 3, 4, 5 and extra, the mole flue gases composition regarding the so called minor chemical species as H
2, OH, H, O, N.
Table 8 and
Table 9 display selected numerical results for x = 0 and x = 0.75. The presence of hydrogen very slightly modified the temperatures and pressures of states 2, 3 and 4. However the values of x and exo modified notably the flue gases composition, see
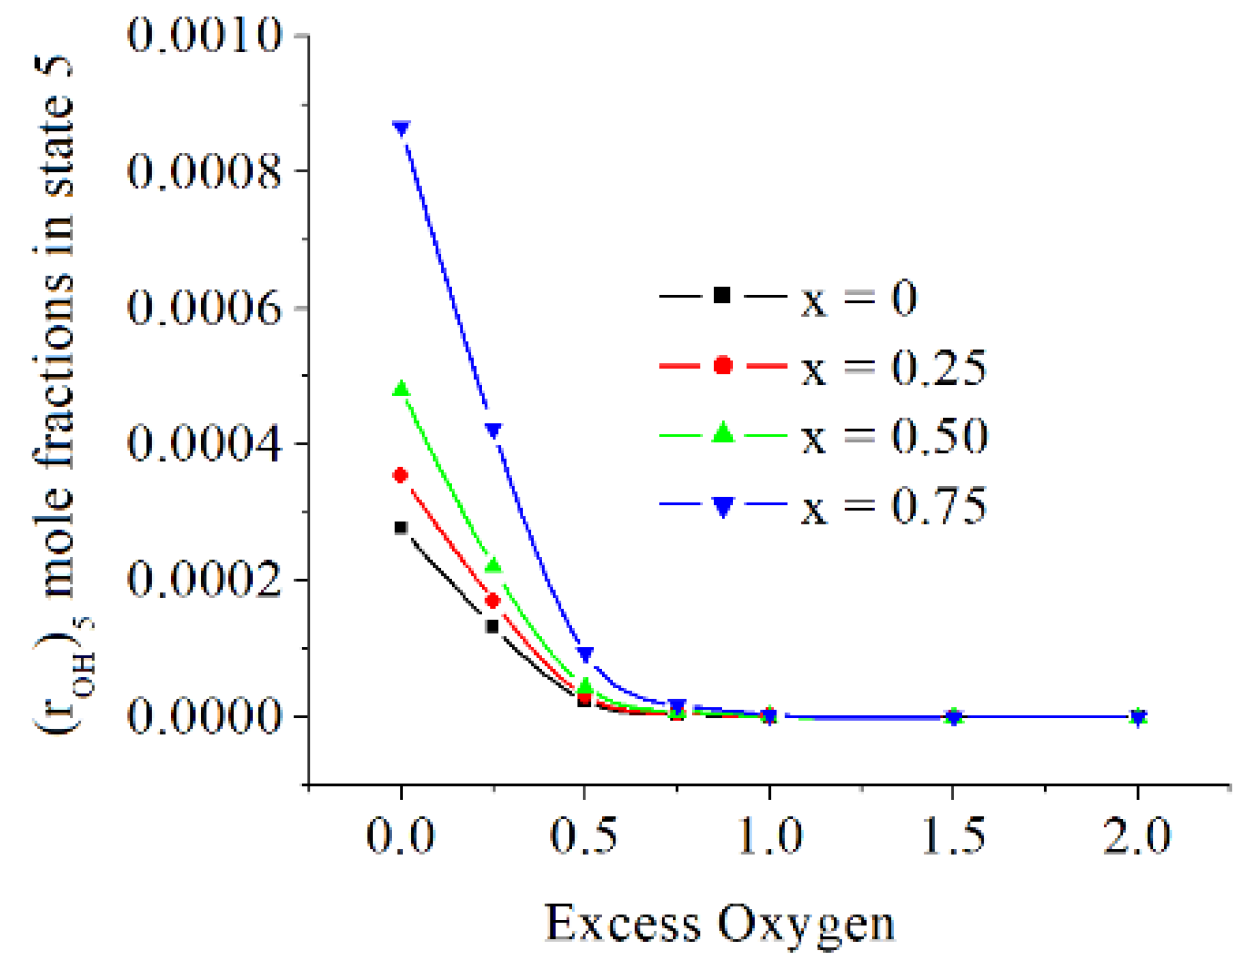
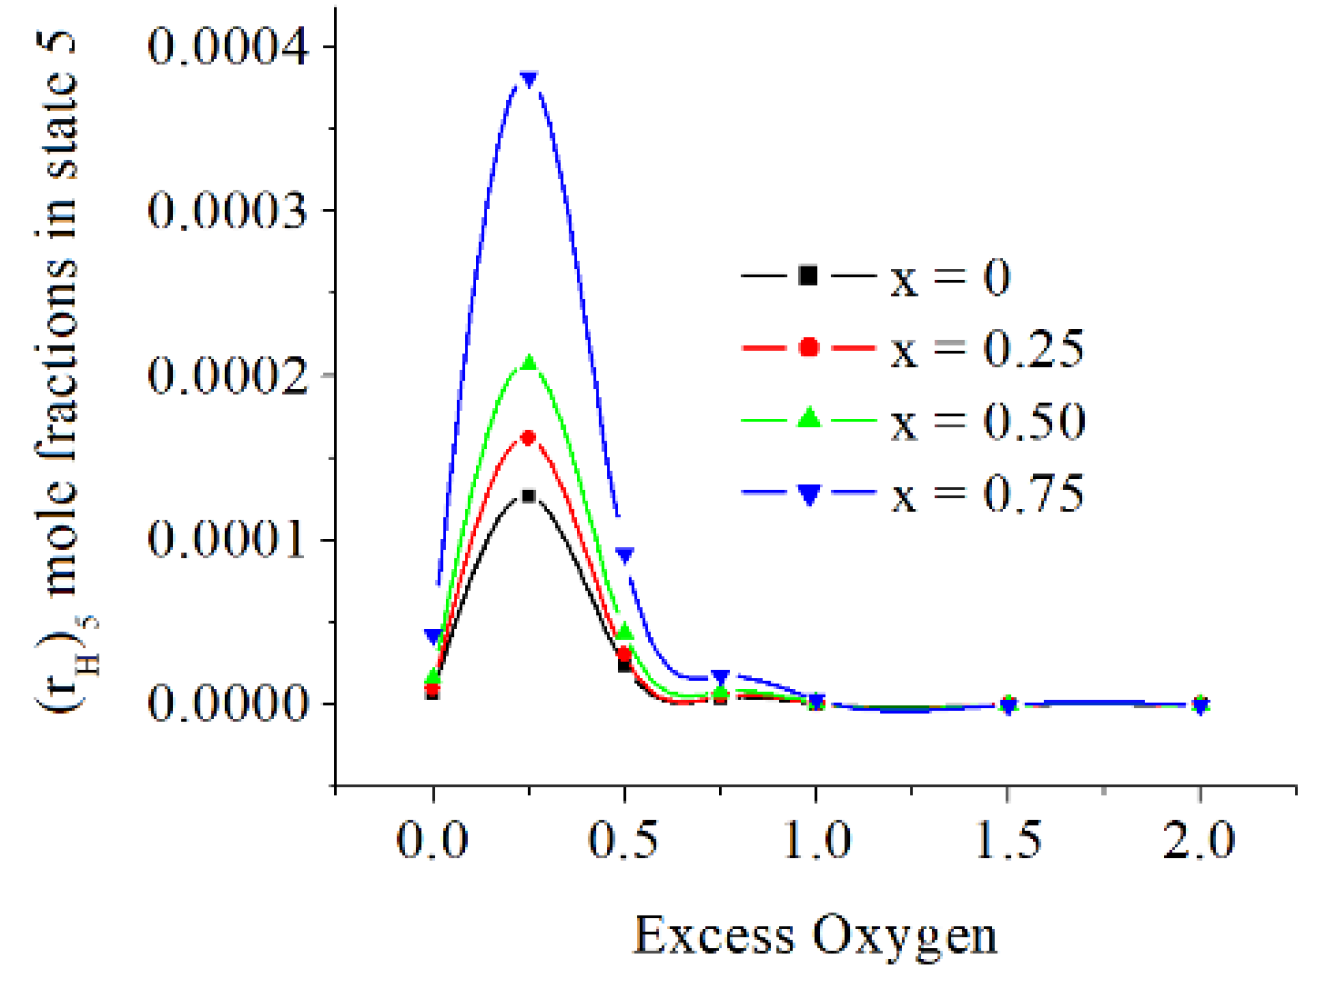
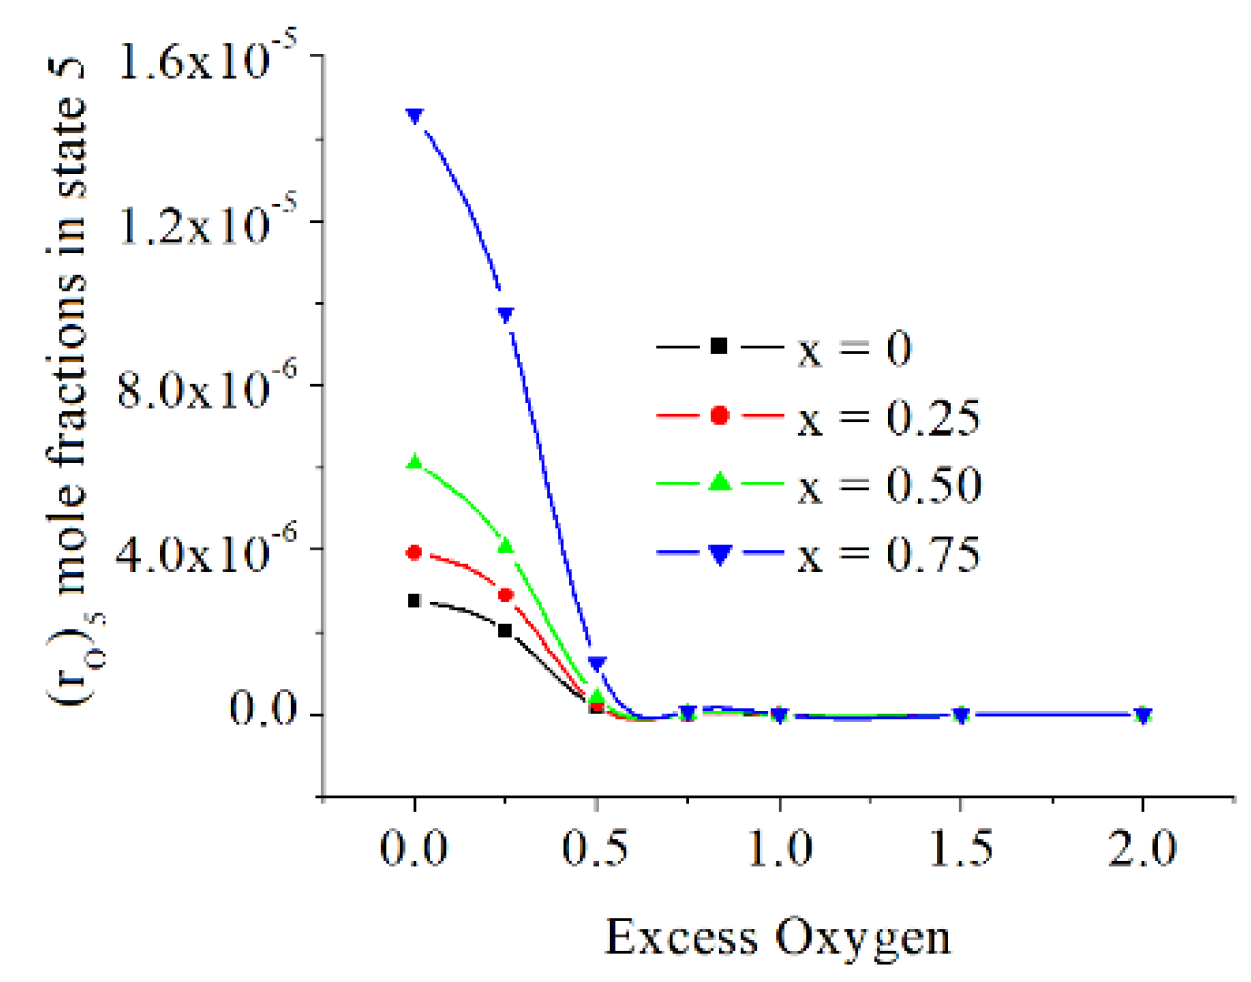
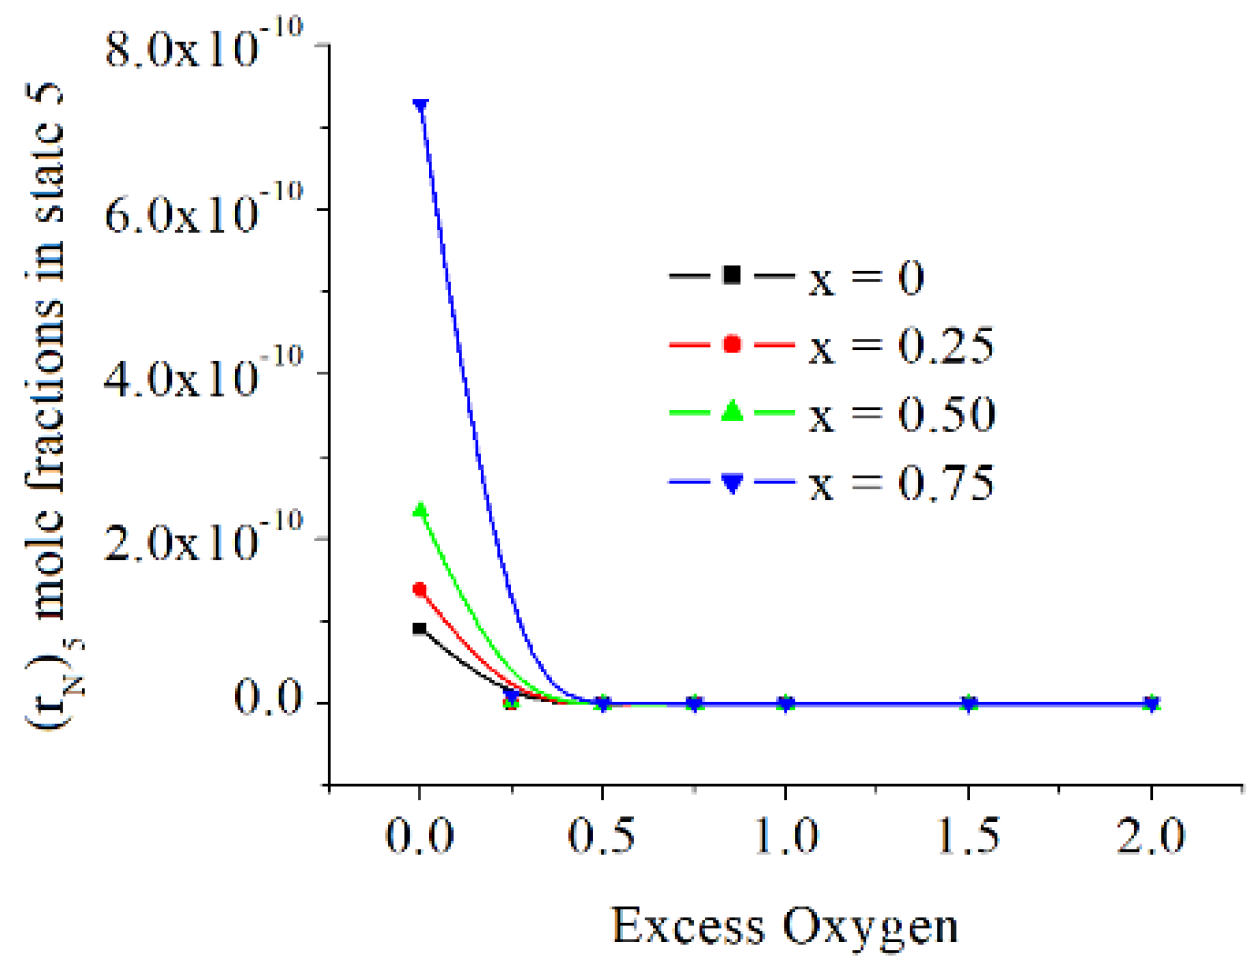
Figure 11,
Figure 12,
Figure 13,
Figure 14 and
Figure 15.
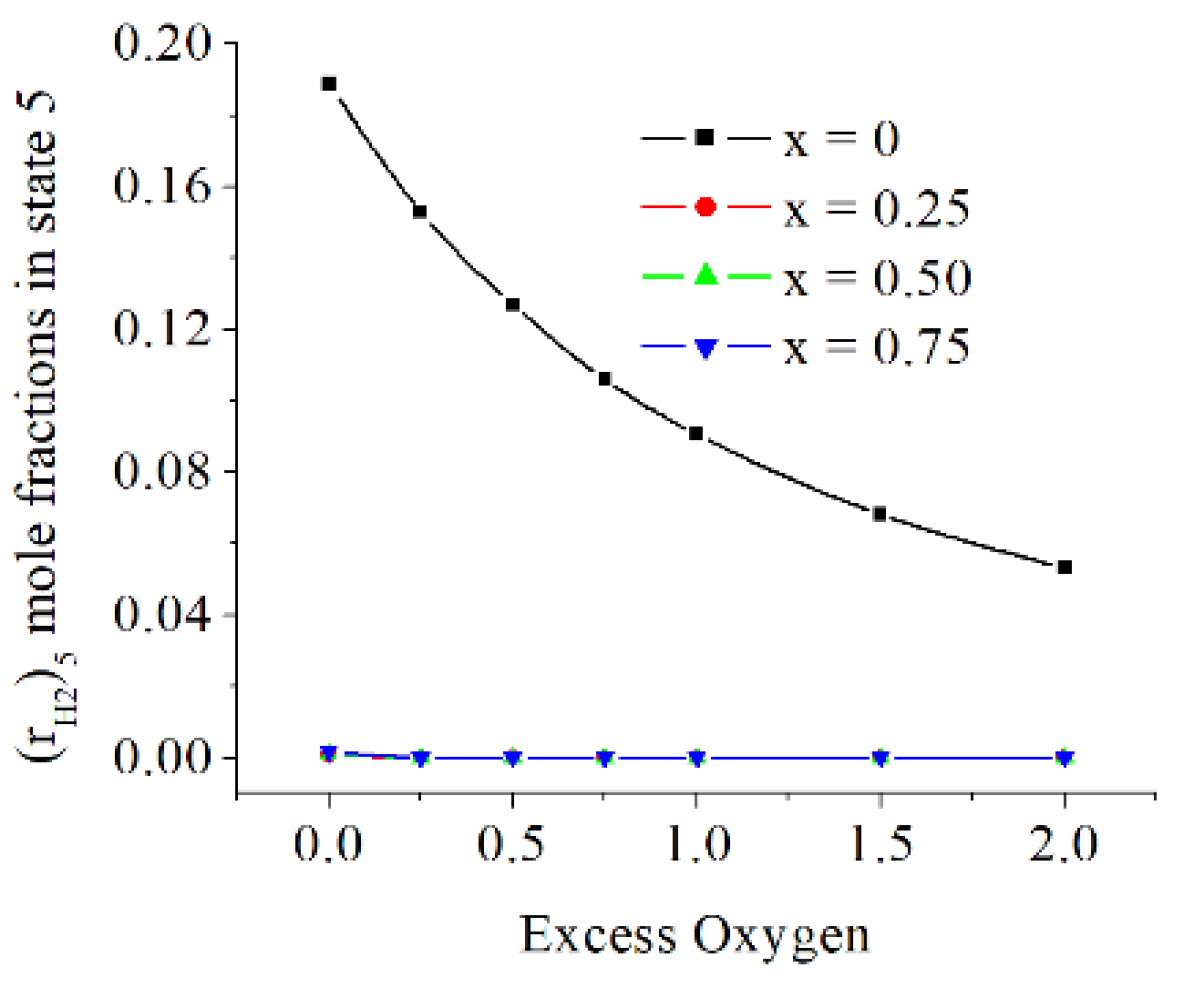
The mole fractions of H
2 in state 5 are significant for x = 0 and more diminished when the fuel is containing hydrogen and for larger oxygen excess, x > 0, and exo < 0, see
Figure 11.
The mole fractions of OH in state 5 are relatively small and they are increasing when x is increasing, and they are decreasing when exo is rising, see
Figure 12.
The mole fractions of H is directly proportional to x and inversely proportional to exo, and have a maximum for 0 ≤ exo ≤ 0.5, see
Figure 13.
The mole fractions of O and N are directly proportional to x and inversely proportional to exo. The O mole fraction are at the level of mass ppm, but those of N are below mass ppb (parts per billion), see
Figure 14 and
Figure 15.
4. Discussions
Chemical modeling of constant volume combustion of mixture of methane and hydrogen used in spark ignition Otto cycles revealed all features regarding flue gases parameters, temperatures, pressures, composition and the magnitude of pollutants function of the excess oxygen quantifying the engine load and of the hydrogen contents in the fuel.
The chemical model used the mass and energy balance equations applied to some cycles delivering different cyclic power, specified indirectly by oxygen excess, in order to find trustworthy numerical results. The gaseous chemical species were considered ideal gases with variable heat capacities depending on the temperature and with enthalpies depending also on the gaseous mixture composition function of temperature and pressure.
The different power was simulated through the oxygen excess, as it is actually proceeding when it is changing the cyclic fuel consume. The temperature ratio, T3/T2, on the closed constant volume combustion was in the range 4.65 to 2.26 corresponding to an exo from 0 to 2.
The inlet temperature of reactants, T
2 around 700 K ± 14 K, was approximately constant imposed by adopted volumetric compression ratio and methane/hydrogen/air mixture composition, see
Table 8 and
Table 9. This temperature was assimilated to a pre-heating and was quantified in the energy balance equation of combustion.
The numerical results have qualitatively and quantitatively similarities with experimental researches regarding pollutants, i.e. CO and NOx, Therefore, the reduction of these pollutants asks very probably post combustion devices/processes in order to diminish them. Besides, they were found new features related to a large domains of x and exo, see below comments.
The numerical results emphasized the behavior of variations of pollutants emissions (CO and NOx) in a good qualitative agreement with the experiments performed elsewhere. The values of CO mole fractions in flue gases are included in
Table 4 and
Figure 7. The maximum mass ppm found in state 5 is around 170 ppm [mg CO/kg flue gases], for exo = 0 and x = 0.75.
The throttling 4 – 5, decreasing the pressure, gives CO emissions almost twice larger for a stoichiometric combustion (exo = 0). All numerical results showed that the presence of hydrogen increases imperceptibly the CO emissions.
The numerical results showed two influences of hydrogen on the NO mole fractions, the first showed values directly proportional to the mole ratio of hydrogen in the fuel and larger than in the case of combustion without hydrogen. The second influence highlighted a maximum of these emissions for 0 < exo <0.5.
NO2 emissions are smaller as larger the hydrogen mole fraction in the fuel. This is unlike the emissions of NO. But similarly, NO2 emissions have a maximum depending on oxygen excess.
The cumulative NOx showed similar influences of hydrogen as in the case of NO emissions because the values of NO are more larger than those of NO2.
The presence of hydrogen very slightly modified the temperatures and pressures of states 2, 3 and 4.
The values of x and exo modified impressively the flue gases mole fractions of minor chemical species, the mole fractions of H2 in state 5 are significant for x = 0 and more diminished when the fuel is containing hydrogen, x > 0, and for increased exo.
The mole fractions of OH in state 5 are relatively small and they are increasing when x is increasing, and they are decreasing when exo is rising.
The mole fractions of H are directly proportional to x and inversely proportional to exo, and have a maximum for 0 ≤ exo ≤ 0.5.
The mole fractions of O and N are directly proportional to x and inversely proportional to exo, the O mole fractions are at the level of mass ppm, but those of N are below mass ppb (parts per billion).
The numerical modeling showed that the chemical reaction 10 is redundant when x > 0, respectively it was giving values either complex or below zero for chemical species H2 resulting from this dissociation reaction. This indicates that the main chemical reaction producing H2 by dissociation is given by eq. 9. Instead of eq. 10 it was involved the mass balance eq. 28 to verify our presumption.
5. Conclusions
The paper presents a chemical model for a closed constant volume combustion of gaseous mixtures of methane and hydrogen considering the spark ignition reciprocating engines in order to evaluate the combustion parameters and exhaust flue gases composition. The chemical model avoided the unknown influences in order to explain accurately the influence of hydrogen upon the constant volume combustion and flue gases composition. The model adopted simplifying hypotheses, respectively isentropic compression and expansion processes, closed constant volume combustion developed by two successive steps obeying to the energy and mass conservation laws and, flue gases exhaust described also by two steps, i.e. an isentropic expansion through the flow section of exhaust valves followed by a constant pressure stagnation (this succession is corresponding in fact to a throttling direct process). The chemical model supposed the homogeneous mixtures of gases with variable heat capacities function of temperatures, the Mendeleev - Clapeyron ideal gas state equation and, the variable chemical equilibrium constants for chosen chemical reactions. It was assumed that the flue gases chemistry is prevailing during the isentropic expansion and flue gases exhaust. The chemical model allowed evaluation of flue gasses composition and noxious emissions. for all states after combustion, 3, 4, 5.
References
- Krebs S, Biet C., Predictive model of a premixed, lean hydrogen combustion for internal combustion engines, Transport Eng., 2021; 5. [CrossRef]
- Yankun Jiang, Yexin Chen, Ruixin Wang, Wei Lu, Wangbin Liu, Yuchao Zhang, Investigation on the effects of blending hydrogen-rich gas in the spark-ignition engine, Energy Reports, 8, 2022, 797–803.
- Ufaith Qadiri, Akram AlFantazi, Numerical 1-D simulations on Single-Cylinder stationary spark ignition engine using Micro-Emulsions, gasoline, and hydrogen in dual fuel mode, Cleaner Chemical Engineering, 2, 2022, 100009 . [CrossRef]
- Xiumin Yu, Zhipeng Hu, Zezhou Guo, Decheng Li, Tianqi Wang, Yinan Li, Jufang Zhang, Tianyang Gong, Yanwei Li, Research on combustion and emission characteristics of a hydrous ethanol/hydrogen combined injection spark ignition engine under lean-burn conditions, International Journal of Hydrogen Energy, 47, 2022, 27223, e27236 . [CrossRef]
- Marius Cătălin Barbu, Adrian Birta, Radu Chiriac, On the improvement of performance and pollutant emissions of a spark ignition engine fuelled by compressed natural gas and hydrogen, Energy Reports, 8, 2022, 978–991.
- Devunuri Suresh, Ekambaram Porpatham, Influence of high compression ratio and hydrogen addition on the performance and emissions of a lean burn spark ignition engine fueled by ethanolgasoline, International Journal of Hydrogen Energy, 48, 2023, 14433, e14448 . [CrossRef]
- Guven Gonca, Bahri Sahin, Mehmet Fatih Hocaoglu, Influences of hydrogen and various gas fuel addition to different liquid fuels on the performance characteristics of a spark ignition engine, International Journal of Hydrogen Energy, 47, Issue 24, 2022, 12421-12431 . [CrossRef]
- Van Ga Bui, Thi Minh Tu Bui, Van Nam Tran, Zuohua Huang, Anh Tuan Hoang, Wieslaw Tarelko, Van Hung Bui, Xuan Mai Pham, Phuoc Quy Phong Nguyen, Flexible syngas-biogas-hydrogen fueling spark-ignition engine behaviors with optimized fuel compositions and control parameters, International Journal of Hydrogen Energy, 48, 18, 2023, 6722-6737 . [CrossRef]
- Masaki Naruke, Kohei Morie, Satoshi Sakaida, Kotaro Tanaka, Mitsuru Konno, Effects of hydrogen addition on engine performance in a spark ignition engine with a high compression ratio under lean burn conditions, International Journal of Hydrogen Energy, 7, 2019, 15565-15574 . [CrossRef]
- Claus Borgnakke, Richard E. Sonntag, Fundamentals of Thermodynamics, 8th edition, Wiley, www.engbookspdf.com, 2012, ISBN 10: 1118131991, ISBN 13: 978-1118131992.
Figure 5.
The isentropic reactive expansion 3–4.
Figure 5.
The isentropic reactive expansion 3–4.
Figure 6.
The flue gases exhaust process 4 – 5.
Figure 6.
The flue gases exhaust process 4 – 5.
Figure 8.
The NO mole fractions in states 3, 4 and 5, function of excess of oxygen and x.
Figure 8.
The NO mole fractions in states 3, 4 and 5, function of excess of oxygen and x.
Figure 9.
The NO2 mole fractions in states 3, 4 and 5, function of excess of oxygen and x.
Figure 9.
The NO2 mole fractions in states 3, 4 and 5, function of excess of oxygen and x.
Figure 11.
The H2 mole fractions in state 5 [kmole/kmole].
Figure 11.
The H2 mole fractions in state 5 [kmole/kmole].
Figure 12.
The OH mole fractions in state 5 [kmole/kmole].
Figure 12.
The OH mole fractions in state 5 [kmole/kmole].
Figure 13.
The H mole fractions in state 5 [kmole/kmole].
Figure 13.
The H mole fractions in state 5 [kmole/kmole].
Figure 14.
The O mole fractions in state 5 [kmole/kmole].
Figure 14.
The O mole fractions in state 5 [kmole/kmole].
Figure 15.
The N mole fractions in state 5 [kmole/kmole].
Figure 15.
The N mole fractions in state 5 [kmole/kmole].
Table 1.
Polynomials of physical enthalpy of chemical species participating in the constant volume combustion.
Table 1.
Polynomials of physical enthalpy of chemical species participating in the constant volume combustion.
| |
h = h – h298, h is the relative physical enthalpy of gaseous chemical species, h298 = h(298K) , [kJ/kmole]
h = c0 + c1*T + c2*T2 + c3*T3 + c4*T4 + c5*T5 [kJ/kmole], for 298 K ≤ T ≤ 5200 K
hCH4 for 298 K ≤ T ≤ 1500 K |
| c0 |
c1 |
c2 |
c3 |
c4 |
c5 |
hCO2
|
-10295.73122 |
+29.18222805 |
+0.01976308361 |
-0.000006164587807 |
+9.718495272E-10 |
-5.984216612E-14 |
hH2O
|
-7820.523838 |
+24.56140839 |
+0.006095193576 |
-0.000001576697822 |
+2.155196747E-10 |
-1.189998347E-14 |
hO2
|
-8310.810038 |
+26.11440421 |
+0.006486554878 |
-0.000001879231979 |
+3.125634850E-10 |
-2.048055699E-14 |
hN2
|
-7820.523838 |
+24.56140839 |
+0.006095193576 |
-0.000001576607822 |
+2.155196747E-10 |
-1.189998347E-14 |
hCO
|
-77895.91761 |
24.23615845 |
+0.006957194766 |
-0.000002000452191 |
+3.006868933E-10 |
-1.79961500E-14 |
hH2
|
-8523.602676 |
+28.58874847 |
-0.0002520099380 |
+0.000001072813673 |
-2.405013187E-10 |
+1.755178738E-14 |
hOH
|
-8479.625232 |
+28.19400310 |
+0.0006776079283 |
+7.234592056E-7 |
-1.956721062E-10 |
+1.522710549E-14 |
hO
|
-6430.497036 |
+21.74597694 |
-0.0006119709133 |
+1.784585133E-7 |
-2.341992360E-11 |
+1.452421376E-15 |
hH
|
-6191.086828 |
+20.77251773 |
+0.00001104663432 |
-4.160102635E-9 |
+7.310338752E-13 |
+4.846517103E-17 |
hN
|
-6167.889202 |
+20.64973571 |
+0.0001887590700 |
-9.970607532E-8 |
+1.832411454E-11 |
-2.236164634E-16 |
hNO
|
-8047.826762 |
+25.12271666 |
+0.006900181303 |
-0.000002036851415 |
+3.093429512E-10 |
-1.856273997E-14 |
hNO2
|
10209.25264 |
+29.28985710 |
+0.01839187998 |
-0.000006044547788 |
+9.772891559E-10 |
-6.122580161E-14 |
hCH4
|
-8143.263322 |
+21.07695175 |
+0.01570851794 |
+0.00002221853471 |
-1.604634302E-8 |
+3.367601937E-12 |
Table 2.
Enthalpy of formation of chemical species involved in the constant volume combustion.
Table 2.
Enthalpy of formation of chemical species involved in the constant volume combustion.
| |
CH4
|
CO2
|
H2O |
H2
|
O2
|
N2
|
CO |
H |
O |
N |
OH |
NO |
NO2
|
| hf0 [kJ/kmole] |
-74873 |
-393522 |
-285830 |
0 |
0 |
0 |
-110527 |
+217999 |
+249170 |
+472680 |
+38897 |
+90921 |
+33100 |
Table 3.
Polynomials of natural logarithms of chemical equilibrium constants.
Table 3.
Polynomials of natural logarithms of chemical equilibrium constants.
| |
ln(K) = a0 + a1*T + a2*T2 + a3*T3 + a4*T4 + a5*T5 + a6^T6 +a7^T7 for 500 K ≤ T ≤ 3400 K, P = 1 |
| ln(K1) |
ln(K2) |
ln(K3) |
ln(K4) |
ln(K5) |
ln(K6) |
ln(K7) |
ln(K8) |
| a7 |
+9.2326311289E-22 |
+1.136595616E-21 |
+7.643759089E-22 |
+8.166909930E-22 |
+1.543529198E-21 |
+7.070194312E-22 |
+2.948541681E-22 |
+1.070424351E-22 |
| a6 |
-1.469466515E-17 |
-1.77695367E-17 |
-1.219664280E-17 |
-1.298258556E-17 |
-2.454651317E-17 |
-1.125159755E-17 |
-4.688934093E-18 |
-1.700672496E-18 |
| a5 |
+9.908436246E-14 |
+1.173485363E-13 |
+8.256023802E-14 |
+8.743314794E-14 |
+1.653766691E-13 |
+7.586041432E-14 |
+3.159040657E-14 |
+1.144079969E-14 |
| a4 |
-3.683648801E-10 |
-4.258599458E-10 |
-3.081726001E-10 |
-3.246702476E-10 |
-6.143247539E-10 |
-2.2820123437E-10 |
-1.173468673E-10 |
-4.240167126E-11 |
| a3 |
+8.221477783E-7 |
+9.246236875E-7 |
+6.907189777E-7 |
+7.238919496E-7 |
+0.000001370114593 |
+6.294886934E-7 |
+2.616956936E-7 |
+9.424074844E-8 |
| a2 |
-0.001121518545 |
-0.001223384239 |
-0.0009467177073 |
-0.0009868881509 |
-0.001868142287 |
-0.0008592308402 |
-0.0003567351418 |
-0.0001278633183 |
| a1 |
+0.9056894246 |
+0.9575982855 |
+0.7698066320 |
+0.7977691487 |
+1.509735517 |
+0.695832294 |
+0.2880804502 |
+0.1027180385 |
| a0 |
-370.3187386 |
-385.6441663 |
-323.0833734 |
-330.5159532 |
-638.9027541 |
-289.1945752 |
-121.5994613 |
-59.57996704 |
Table 4.
CO mole fractions in states 3, 4 and 5.
Table 4.
CO mole fractions in states 3, 4 and 5.
| |
x = 0.00 |
x = 0.25 |
x = 0.50 |
x = 0.75 |
x = 0.00 |
x = 0.25 |
x = 0.50 |
x = 0.75 |
x = 0.00 |
x = 0.25 |
x = 0.50 |
x = 0.75 |
| excess oxygen |
State 3 |
State 4 |
State 5 |
| 0 |
0.0179 |
0.0181 |
0.0176 |
0.0161 |
5.44E-4 |
5.9E-4 |
6.84E-4 |
8.21E-4 |
9.86E-4 |
0.00111 |
0.00123 |
0.00147 |
| 0.25 |
0.00201 |
0.00224 |
0.0024 |
0.00273 |
2.06E-6 |
2.66E-6 |
3.52E-6 |
6.4E-6 |
4.96E-6 |
6.66E-6 |
8.29E-6 |
1.52E-5 |
| 0.50 |
2.73E-4 |
3.6E-4 |
4.34E-4 |
4.92E-4 |
5.7E-8 |
8.01E-8 |
1.24E-7 |
2.82E-7 |
1.32E-7 |
1.78E-7 |
2.78E-7 |
6.43E-7 |
| 0.75 |
5.83E-5 |
6.91E-5 |
8.93E-5 |
1.05E-4 |
1.85E-9 |
2.56E-9 |
4.19E-9 |
1.06E-8 |
3.91E-9 |
5.46E-9 |
8.94E-9 |
2.28E-8 |
| 1.00 |
1.09E-5 |
1.34E-5 |
1.73E-5 |
2.26E-5 |
5.49E-11 |
7.94E-11 |
1.34E-10 |
3.98E-10 |
1.12E-10 |
1.63E-10 |
2.77E-10 |
8.27E-10 |
| 1.50 |
4.53E-7 |
6.48E-7 |
7.34E-7 |
1.06E-6 |
4.94E-14 |
8.53E-14 |
1.35E-13 |
4.6E-13 |
9.5E-14 |
1.65E-13 |
1.01E-13 |
9.04E-13 |
| 2.00 |
1.83E-8 |
2.58E-8 |
3.45E-8 |
5.35E-8 |
2.73E-17 |
5.97E-17 |
1.05E-16 |
6.99E-15 |
5.33E-17 |
1.1E-16 |
1.94E-16 |
8.39E-16 |
Table 5.
NO mole fractions in states 3, 4 and 5.
Table 5.
NO mole fractions in states 3, 4 and 5.
| |
x = 0.00 |
x = 0.25 |
x = 0.50 |
x = 0.75 |
x = 0.00 |
x = 0.25 |
x = 0.50 |
x = 0.75 |
x = 0.00 |
x = 0.25 |
x = 0.50 |
x = 0.75 |
| excess oxygen |
State 3 |
State 4 |
State 5 |
| 0 |
9.04E-03 |
9.37E-03 |
9.71E-03 |
1.08E-02 |
1.16E-07 |
2.48E-04 |
3.03E-04 |
4.35E-04 |
3.15E-04 |
3.61E-04 |
4.25E-04 |
6.09E-04 |
| 0.25 |
1.71E-02 |
1.75E-02 |
1.77E-02 |
1.92E-02 |
1.62E-05 |
1.37E-03 |
1.49E-03 |
1.88E-03 |
1.28E-03 |
1.39E-03 |
1.49E-03 |
1.88E-03 |
Table 5.
NO mole fractions in states 3, 4 and 5 (continuation).
Table 5.
NO mole fractions in states 3, 4 and 5 (continuation).
| |
x = 0.00 |
x = 0.25 |
x = 0.50 |
x = 0.75 |
x = 0.00 |
x = 0.25 |
x = 0.50 |
x = 0.75 |
x = 0.00 |
x = 0.25 |
x = 0.50 |
x = 0.75 |
| excess oxygen |
State 3 |
State 4 |
State 5 |
| 0.50 |
1.59E-02 |
1.72E-02 |
1.82E-02 |
1.96E-02 |
2.37E-05 |
7.48E-04 |
8.63E-04 |
1.18E-03 |
6.88E-04 |
7.48E-04 |
8.63E-04 |
1.18E-03 |
| 0.75 |
1.36E-02 |
1.42E-02 |
1.53E-02 |
1.69E-02 |
2.54E-05 |
3.39E-04 |
3.97E-04 |
5.60E-04 |
3.08E-04 |
3.39E-04 |
3.98E-04 |
5.60E-04 |
| 1.00 |
1.01E-02 |
1.06E-02 |
1.15E-02 |
1.31E-02 |
2.37E-05 |
1.39E-04 |
1.65E-04 |
2.45E-04 |
1.25E-04 |
1.39E-04 |
1.65E-04 |
2.45E-04 |
| 1.50 |
5.07E-03 |
5.57E-03 |
5.81E-03 |
6.88E-03 |
1.67E-05 |
2.14E-05 |
2.48E-05 |
3.85E-05 |
1.81E-05 |
2.14E-05 |
1.43E-15 |
3.86E-05 |
| 2.00 |
2.23E-03 |
2.47E-03 |
2.73E-03 |
3.29E-03 |
1.04E-05 |
2.61E-06 |
3.13E-06 |
5.23E-06 |
2.09E-06 |
2.61E-06 |
3.13E-06 |
5.23E-06 |
Table 6.
NO2 mole fractions in states 3, 4 and 5.
Table 6.
NO2 mole fractions in states 3, 4 and 5.
| |
x = 0.00 |
x = 0.25 |
x = 0.50 |
x = 0.75 |
x = 0.00 |
x = 0.25 |
x = 0.50 |
x = 0.75 |
x = 0.00 |
x = 0.25 |
x = 0.50 |
x = 0.75 |
| excess oxygen |
State 3 |
State 4 |
State 5 |
| 0 |
2.21E-05 |
2.09E-05 |
1.93E-05 |
1.78E-05 |
1.16E-07 |
1.21E-07 |
1.21E-07 |
1.79E-07 |
9.01E-08 |
9.73E-08 |
1.06E-07 |
1.38E-07 |
| 0.25 |
1.51E-04 |
1.36E-04 |
1.16E-04 |
9.89E-05 |
1.62E-05 |
1.50E-05 |
1.50E-05 |
1.21E-05 |
6.87E-06 |
6.36E-06 |
5.68E-06 |
5.11E-06 |
| 0.50 |
2.91E-04 |
2.67E-04 |
2.37E-04 |
2.00E-04 |
2.37E-05 |
2.19E-05 |
2.19E-05 |
1.91E-05 |
1.07E-05 |
9.87E-06 |
9.06E-06 |
8.37E-06 |
| 0.75 |
4.08E-04 |
3.72E-04 |
3.28E-04 |
2.88E-04 |
2.54E-05 |
2.38E-05 |
2.38E-05 |
2.07E-05 |
1.20E-05 |
1.11E-05 |
1.03E-05 |
9.63E-06 |
| 1.00 |
4.84E-04 |
4.41E-04 |
3.98E-04 |
3.44E-04 |
2.37E-05 |
2.22E-05 |
2.22E-05 |
1.99E-05 |
1.16E-05 |
1.08E-05 |
1.01E-05 |
9.61E-06 |
| 1.50 |
5.74E-04 |
5.13E-04 |
4.56E-04 |
4.09E-04 |
1.67E-05 |
1.61E-05 |
1.61E-05 |
1.47E-05 |
8.69E-06 |
8.30E-06 |
7.65E-06 |
7.47E-06 |
| 2.00 |
5.31E-04 |
4.98E-04 |
4.51E-04 |
4.06E-04 |
1.04E-05 |
9.57E-06 |
9.57E-06 |
9.09E-06 |
5.33E-06 |
5.19E-06 |
4.85E-06 |
4.86E-06 |
Table 7.
NOx mass ppm.
| |
x = 0.00 |
x = 0.25 |
x = 0.50 |
x = 0.75 |
x = 0.00 |
x = 0.25 |
x = 0.50 |
x = 0.75 |
x = 0.00 |
x = 0.25 |
x = 0.50 |
x = 0.75 |
| excess oxygen |
State 3 |
State 4 |
State 5 |
| 0 |
1.01E+04 |
1.06E+04 |
1.12E+04 |
1.29E+04 |
2.46E+02 |
2.76E+02 |
3.44E+02 |
5.08E+02 |
3.47E+02 |
4.02E+02 |
4.82E+02 |
7.12E+02 |
| 0.25 |
1.90E+04 |
1.96E+04 |
2.01E+04 |
2.23E+04 |
1.42E+03 |
1.53E+03 |
1.68E+03 |
2.17E+03 |
1.41E+03 |
1.54E+03 |
1.67E+03 |
2.16E+03 |
| 0.50 |
1.77E+04 |
1.92E+04 |
2.04E+04 |
2.24E+04 |
7.70E+02 |
8.47E+02 |
9.80E+02 |
1.35E+03 |
7.58E+02 |
8.27E+02 |
9.61E+02 |
1.33E+03 |
| 0.75 |
1.52E+04 |
1.59E+04 |
1.72E+04 |
1.92E+04 |
3.70E+02 |
4.03E+02 |
4.67E+02 |
6.51E+02 |
3.48E+02 |
3.82E+02 |
4.48E+02 |
6.33E+02 |
| 1.00 |
1.15E+04 |
1.20E+04 |
1.30E+04 |
1.49E+04 |
1.70E+02 |
1.84E+02 |
2.11E+02 |
3.00E+02 |
1.51E+02 |
1.66E+02 |
1.93E+02 |
2.82E+02 |
| 1.50 |
6.22E+03 |
6.66E+03 |
6.86E+03 |
8.00E+03 |
4.56E+01 |
4.82E+01 |
5.01E+01 |
6.50E+01 |
3.28E+01 |
3.57E+01 |
3.53E-03 |
5.33E+01 |
| 2.00 |
3.14E+03 |
3.35E+03 |
3.56E+03 |
4.11E+03 |
1.86E+01 |
1.79E+01 |
1.76E+01 |
2.01E+01 |
1.06E+01 |
1.09E+01 |
1.10E+01 |
1.33E+01 |
Table 8.
Selected numerical results for x = 0.
Table 8.
Selected numerical results for x = 0.
| exo |
0.00 |
0.25 |
0.50 |
0.75 |
1.00 |
1.50 |
2.00 |
| T2/p2 [K/bar] |
683.96/22.95 |
690.13/23.16 |
694.55/23.31 |
697.87/23.42 |
700.45/23.51 |
704.22/23.63 |
706.83/23.72 |
| T3/p3 [K/bar] |
3163/106 |
2859/96 |
2587/88 |
2350/83 |
2152/79 |
1843/73 |
1603/68 |
| T4 = T5 [K] |
1948.00 |
1670.00 |
1455.00 |
1288.32 |
1148.67 |
943.44 |
794.49 |
| p4 |
6.50 |
5.60 |
4.98 |
4.50 |
4.19 |
3.70 |
3.80 |
Table 8.
Selected numerical results for x = 0 (continuation).
Table 8.
Selected numerical results for x = 0 (continuation).
| exo |
0.00 |
0.25 |
0.50 |
0.75 |
1.00 |
1.50 |
2.00 |
| (rH2)5 [kmole/kmole] |
1.89E-01 |
1.53E-01 |
1.27E-01 |
1.06E-01 |
9.07E-02 |
6.82E-02 |
5.32E-02 |
| (rOH)5 [kmole/kmole] |
2.78E-04 |
1.33E-04 |
2.41E-05 |
4.12E-06 |
6.42E-07 |
1.34E-08 |
2.04E-10 |
| (rH)5 [kmole/kmole] |
6.91E-06 |
1.27E-04 |
2.39E-05 |
4.11E-06 |
6.41E-07 |
1.34E-08 |
2.04E-10 |
| (rO)5 [kmole/kmole] |
2.78E-06 |
2.05E-06 |
1.75E-07 |
1.22E-08 |
7.35E-10 |
2.31E-12 |
4.46E-15 |
| (rN)5 [kmole/kmole] |
9.12E-11 |
7.84E-13 |
4.29E-15 |
2.11E-17 |
8.79E-20 |
1.33E-24 |
8.81E-30 |
Table 9.
Selected numerical results for x = 0.75.
Table 9.
Selected numerical results for x = 0.75.
| x |
0.75 |
0.75 |
0.75 |
0.75 |
0.75 |
0.75 |
0.75 |
| exo |
0.00 |
0.25 |
0.50 |
0.75 |
1.00 |
1.50 |
2.00 |
| T2/p2 [K/bar] |
703.97/23.62 |
706.75/23.72 |
708.75/23.78 |
710.27/23.83 |
711.46/23.87 |
713.21/23.93 |
714.423.973 |
| T3/p3 [K/bar] |
3278/102 |
2993/94 |
2714/88 |
2485/83 |
2283/80 |
1954/74 |
1704/70 |
| T4 = T5 [K] |
2075.00 |
1790.00 |
1575.00 |
1390.00 |
1240.00 |
1010.00 |
850.00 |
| p4 |
6.50 |
5.65 |
5.20 |
4.60 |
4.30 |
3.85 |
3.50 |
| (rH2)5 [kmole/kmole] |
1.60E-03 |
2.02E-05 |
1.11E-06 |
5.36E-08 |
2.72E-09 |
6.25E-12 |
1.31E-14 |
| (rOH)5 [kmole/kmole] |
8.66E-04 |
4.23E-04 |
9.42E-05 |
1.76E-05 |
3.17E-06 |
7.89E-08 |
1.60E-09 |
| (rH)5 [kmole/kmole] |
4.27E-05 |
3.82E-04 |
9.20E-05 |
1.75E-05 |
3.16E-06 |
7.89E-08 |
1.60E-09 |
| (rO)5 [kmole/kmole] |
1.46E-05 |
9.77E-06 |
1.26E-06 |
1.03E-07 |
7.62E-09 |
2.97E-11 |
8.91E-14 |
| (rN)5 [kmole/kmole] |
7.29E-10 |
1.06E-11 |
1.26E-13 |
8.30E-16 |
5.08E-18 |
0.00E+00 |
0.00E+00 |
|
Disclaimer/Publisher’s Note: The statements, opinions and data contained in all publications are solely those of the individual author(s) and contributor(s) and not of MDPI and/or the editor(s). MDPI and/or the editor(s) disclaim responsibility for any injury to people or property resulting from any ideas, methods, instructions or products referred to in the content. |
© 2023 by the authors. Licensee MDPI, Basel, Switzerland. This article is an open access article distributed under the terms and conditions of the Creative Commons Attribution (CC BY) license (http://creativecommons.org/licenses/by/4.0/).
