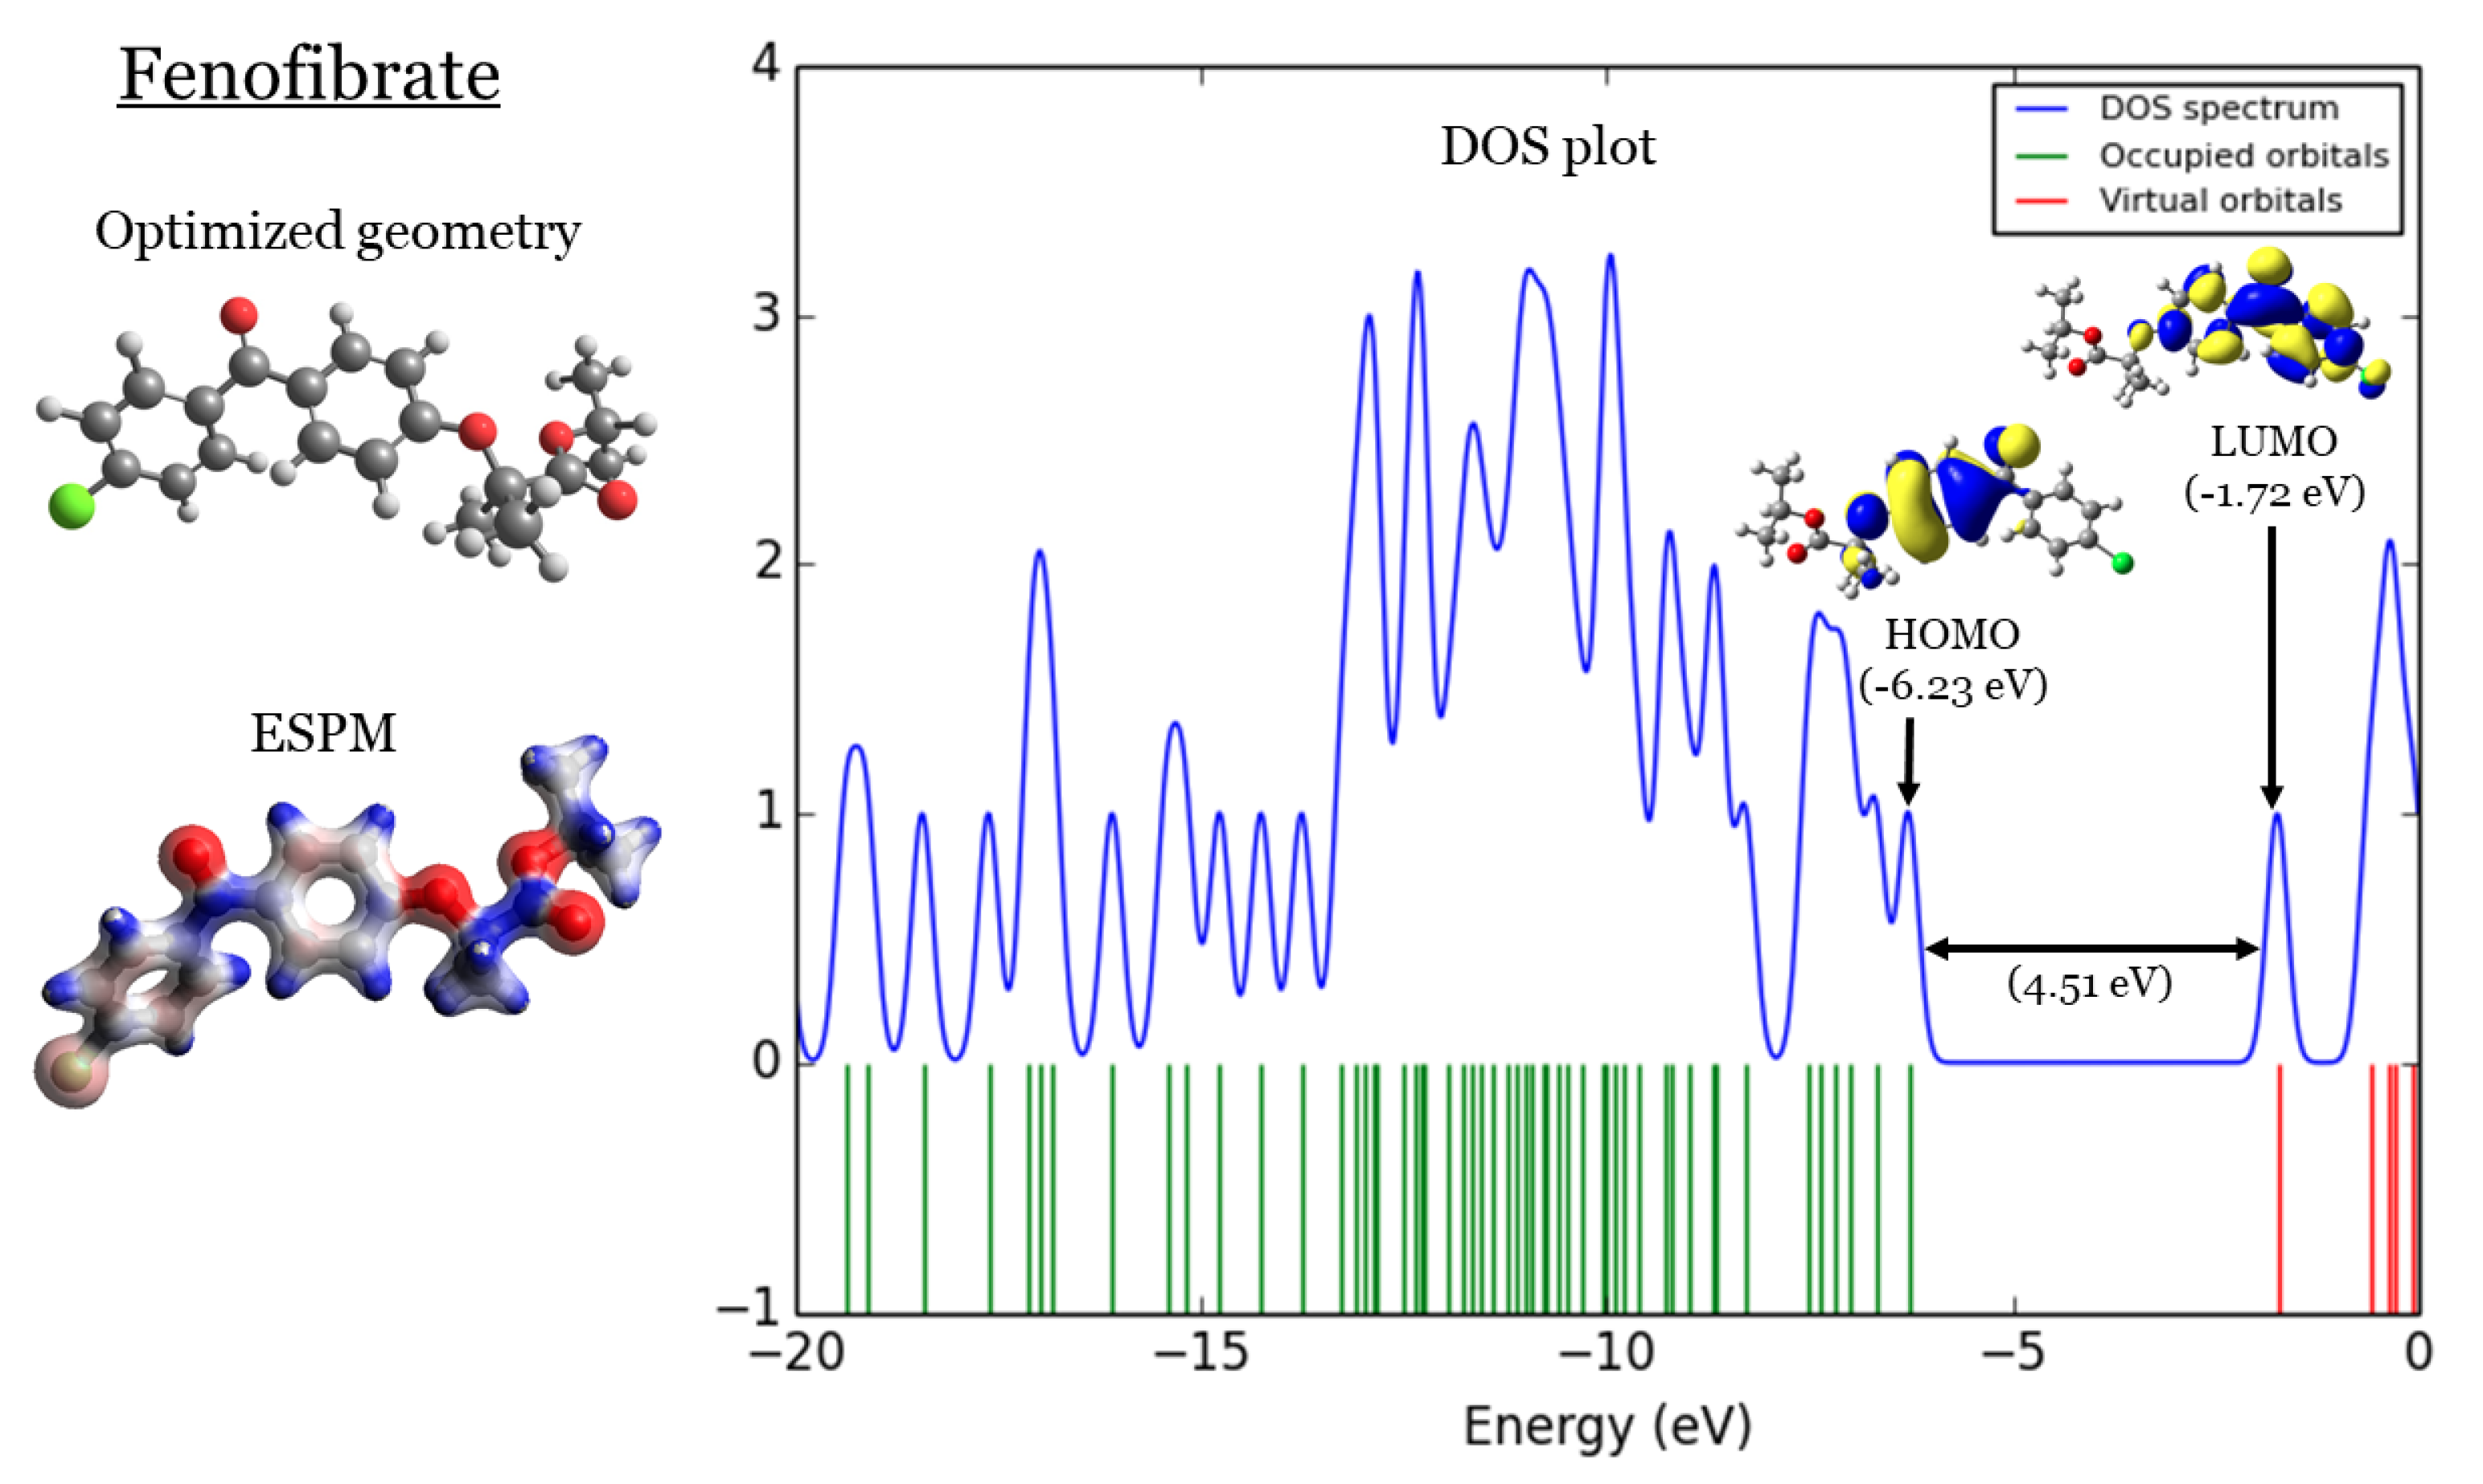
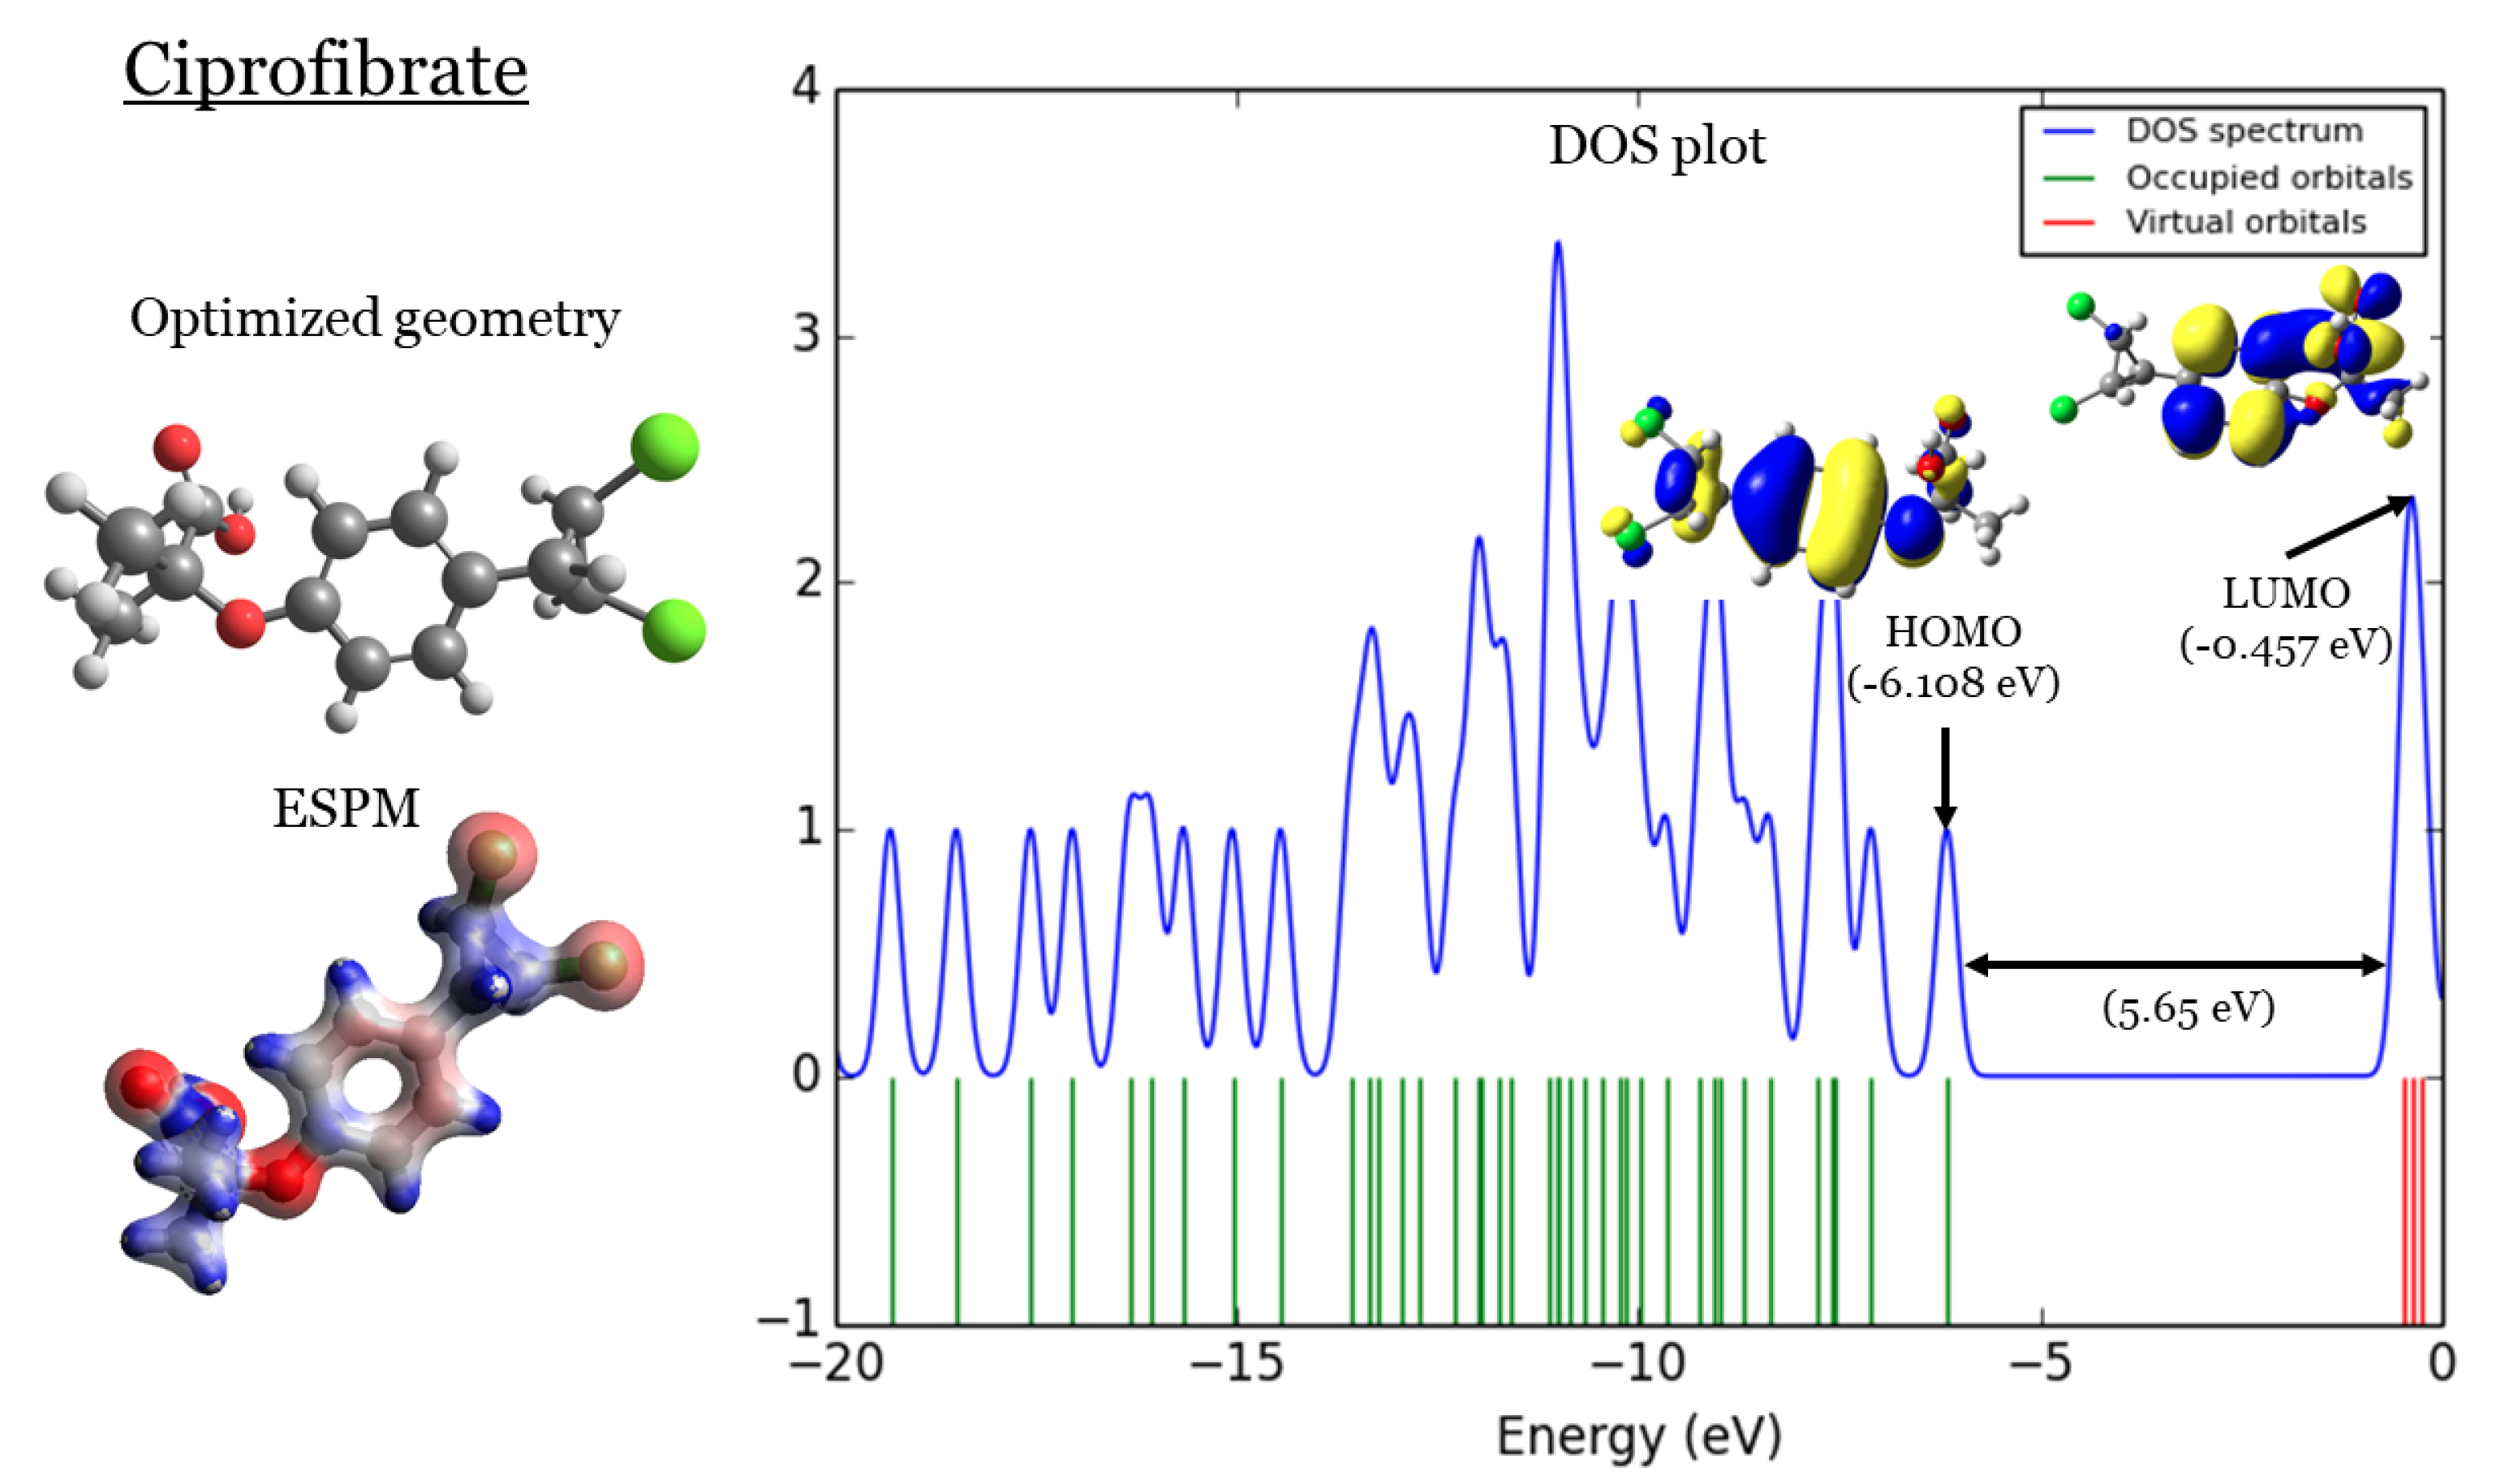
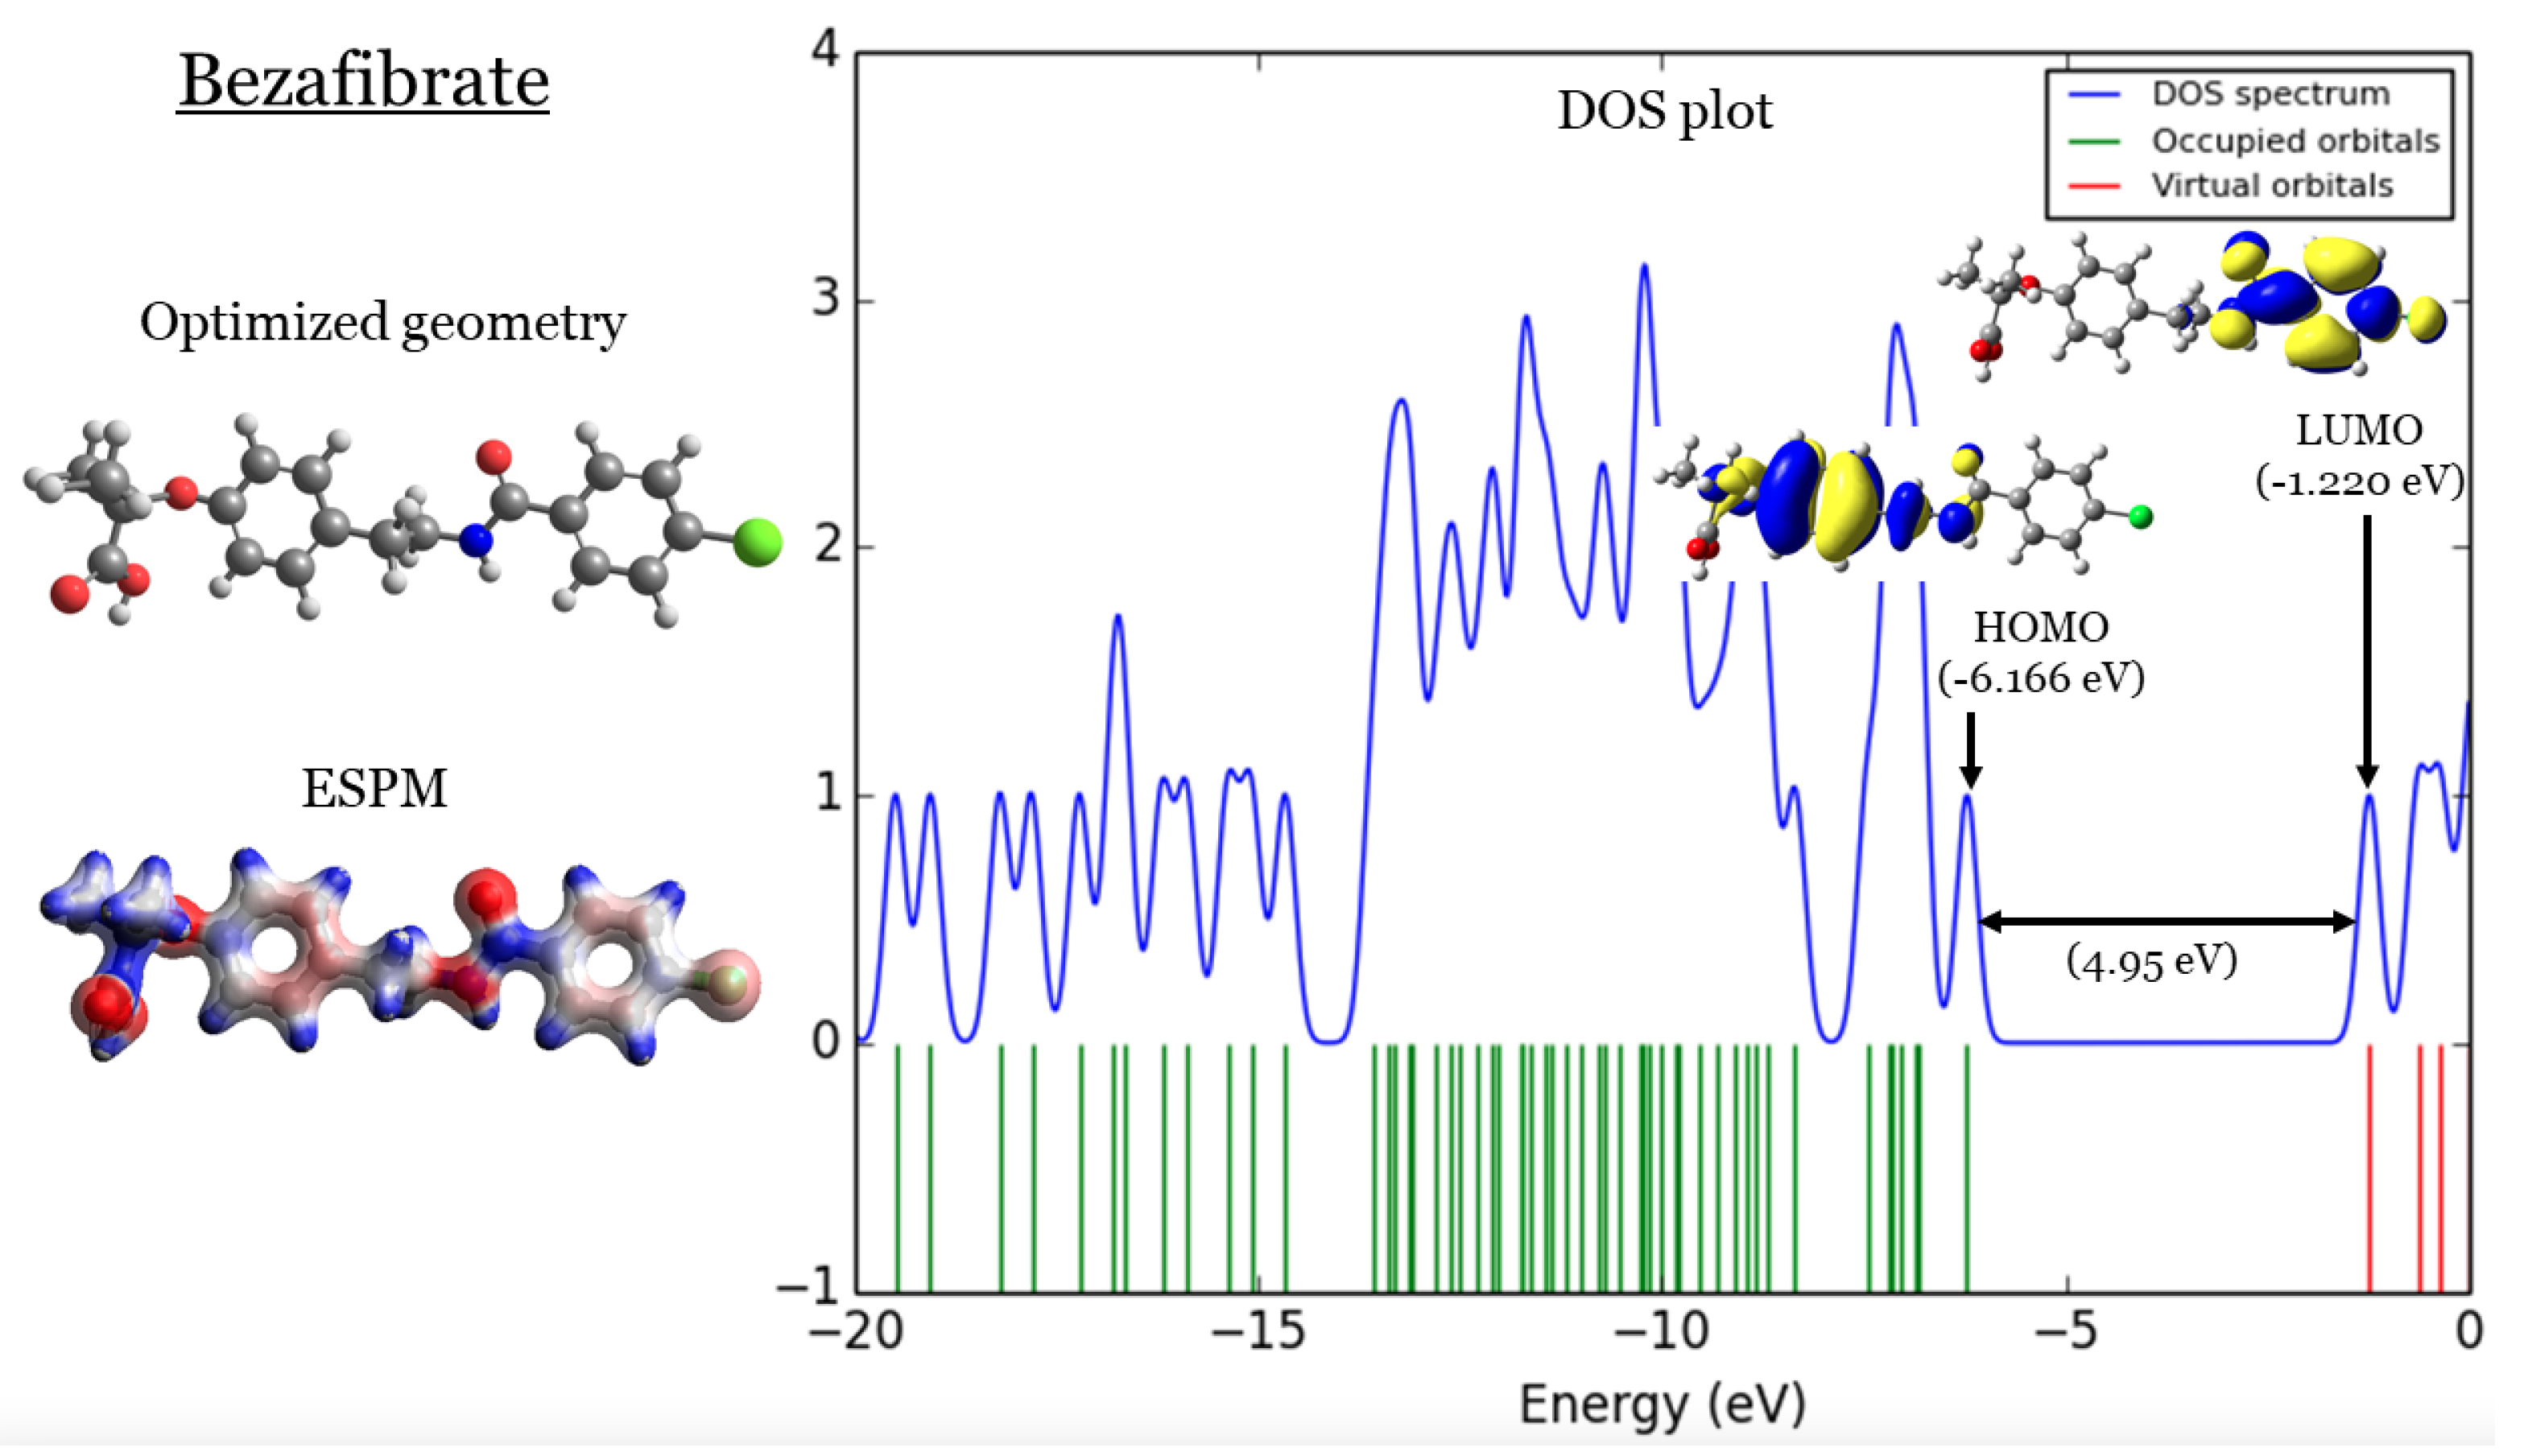
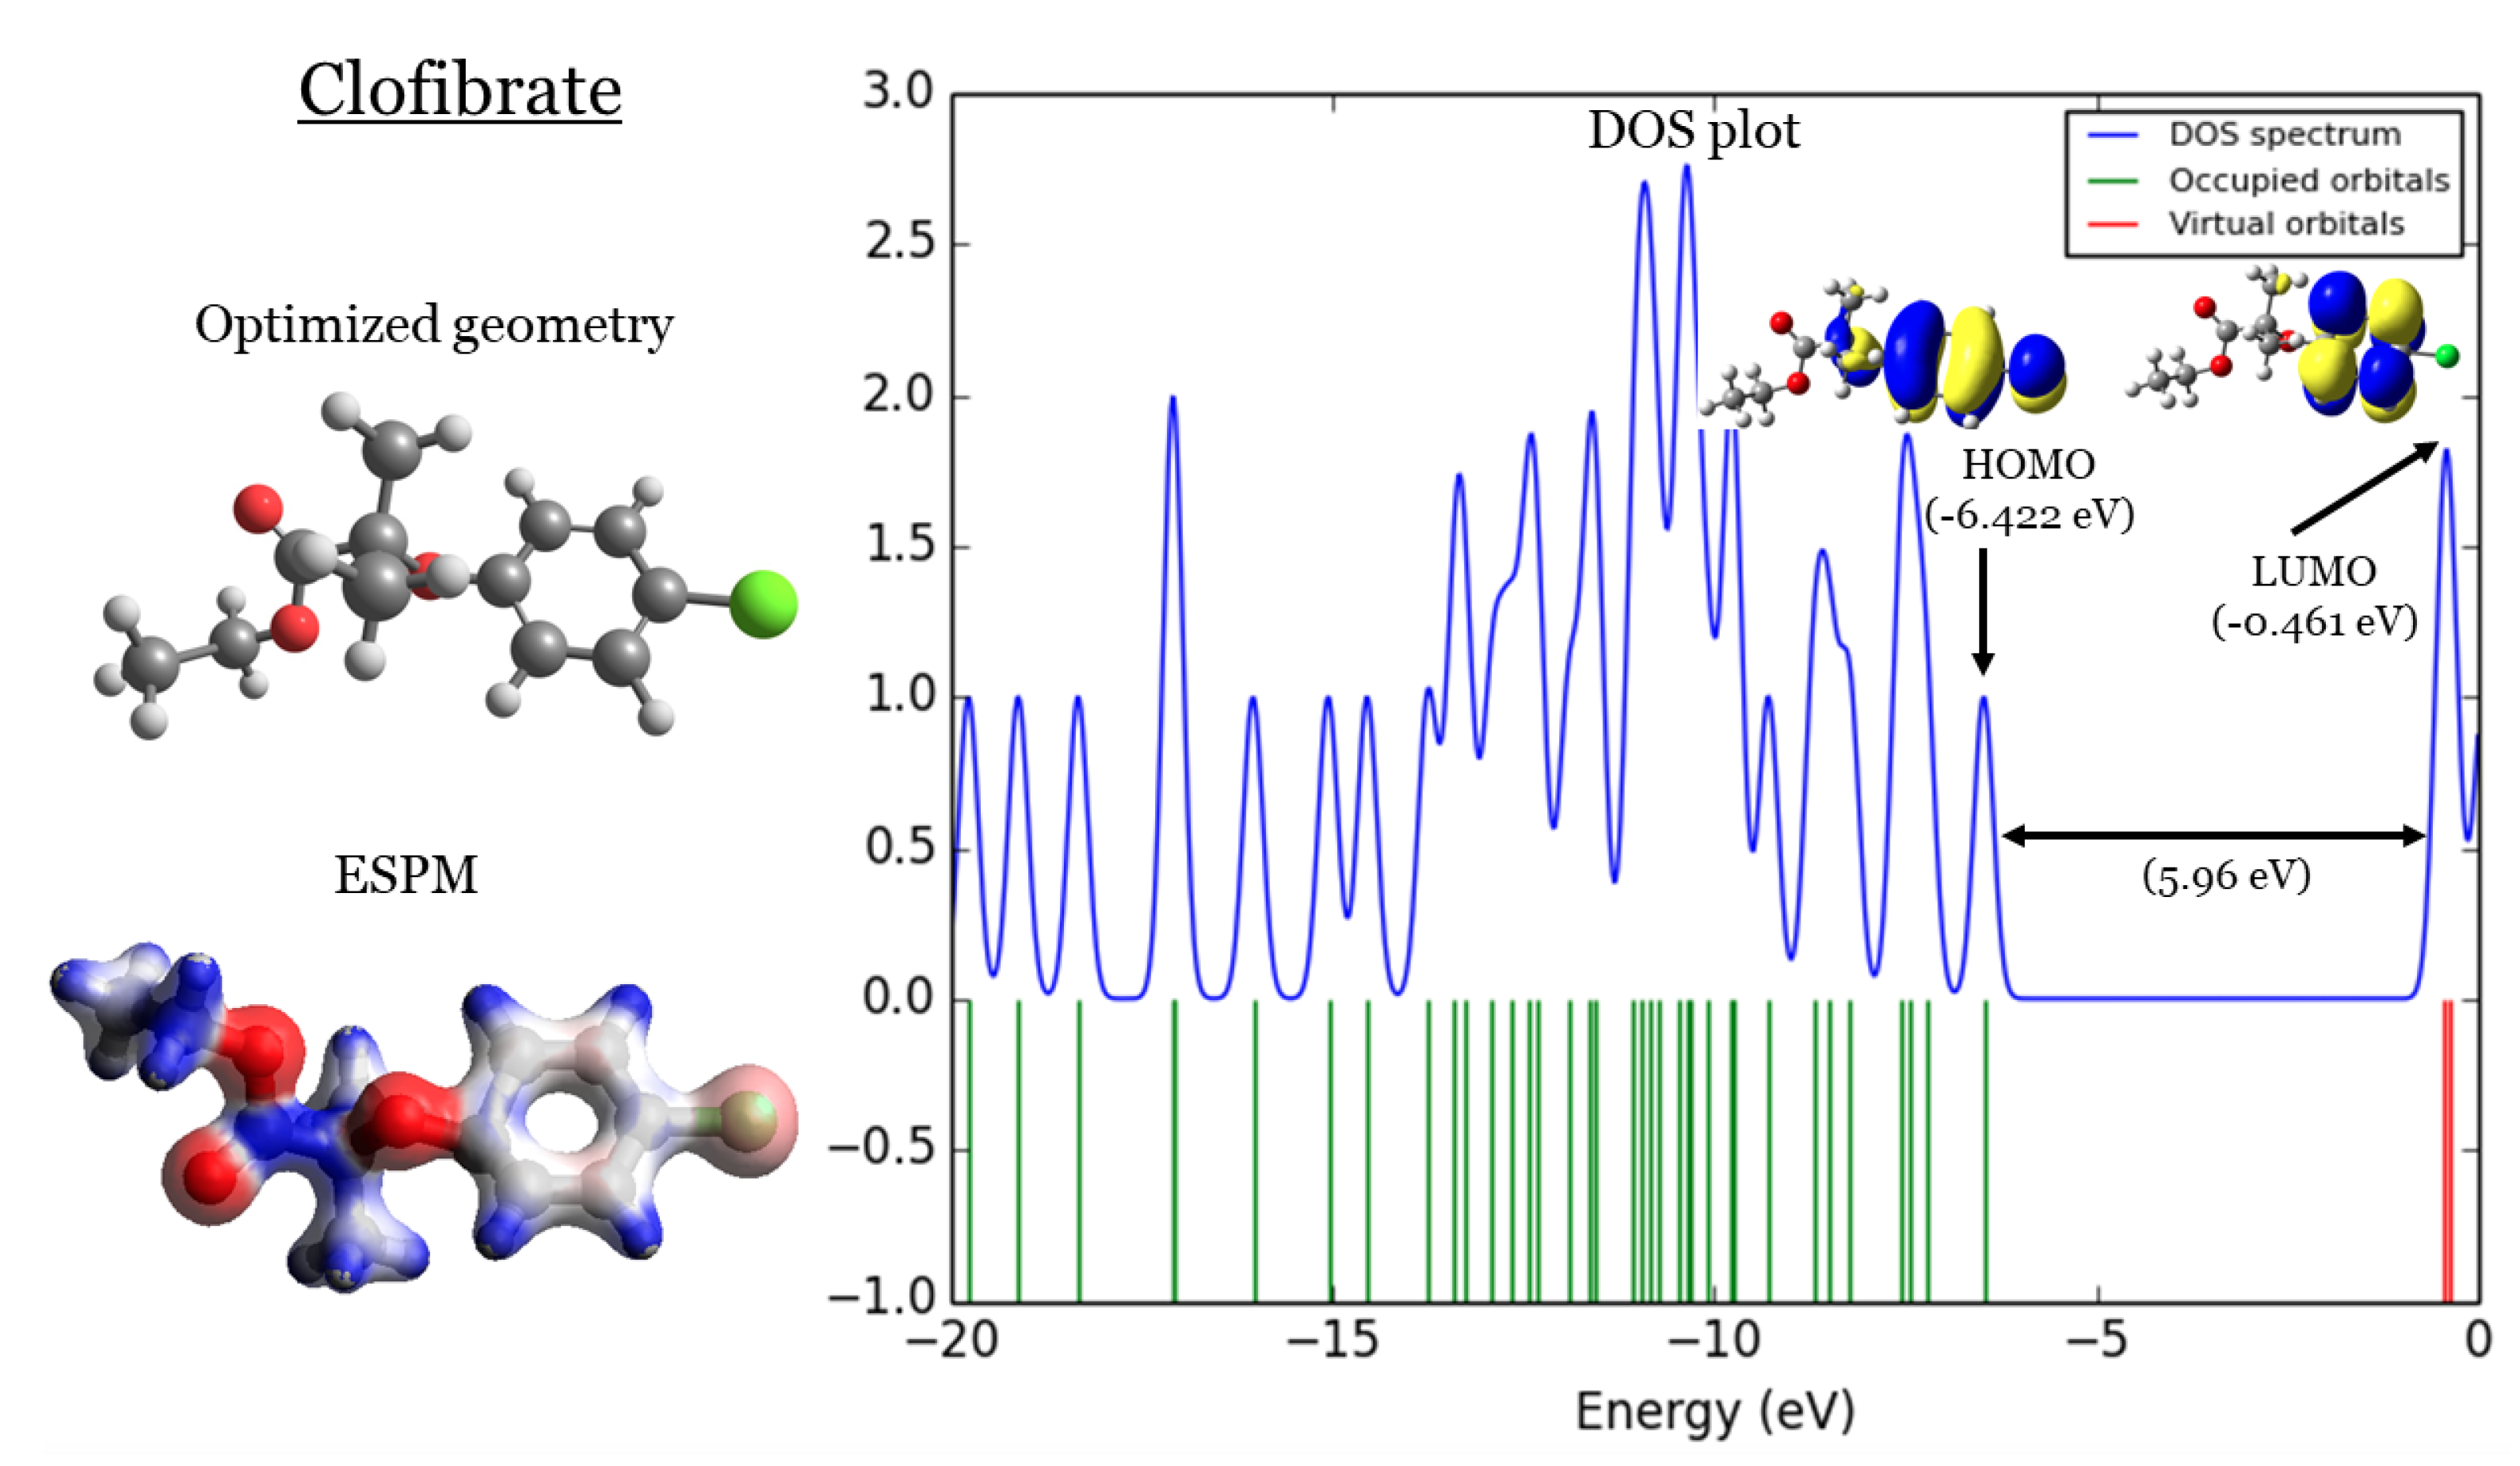
In this section, the overall objective is to establish a quantitative structure-property-activity (QSPR) relationship between the various topological indices and some physicochemical properties/activity of the Fibrates drugs under study in order to assess the effectiveness of these drugs. Eleven degree-based and four distance topological indices were used for modeling antiviral activity. Based on DMol3-optimized geometries for Fibrates drugs investigated. The version
of Material Studio from BIOVIA was used to perform DFT calculations, which are as follows: Polarizability
, Sum of electronic and zero-point Energies
, Sum of electronic and thermal Energies
, Sum of electronic and thermal Enthalpies
, Sum of electronic and thermal Free Energies
, Zero-point vibrational energy
, Complexity
, Topological polar area
, Dipole moment
, Heat capacity
, Molar entropy
, and Octanol-water partition coefficients
of several drugs currently being investigated for the treatment of high cholesterol which includes Fenofibrate, Ciprofibrate, Bezafibrate, Clofibrate drugs. It is possible to use curvilinear regression analysis to fit curves instead of straight lines, SPSS statistical software is used to analyze curvilinear regressions. As described below, the independent variables in the curvilinear regression models are topological indices. Indicators derived from cholesterol-lowering drugs. Based on the equations below, tests are conducted.
In this context,
y represents the response or dependent variable, while a denotes the regression model constant, and
refers to the coefficients for each individual descriptor. The independent variable is represented by
x, and
n signifies the number of samples used in building the regression equation.
denotes the coefficient of determination,
R signifies the correlation coefficient,
F represents the calculated value of the Fischer
values test,
denotes the standard error of estimate, and
stands for
significance. It should be noted that when the experimental and theoretical results are in close proximity to each other, the correlation coefficient approaches 1. To gauge the predictability of a model, it is necessary to compare the observed values and the model predictions, for which the Root Mean Square Error
metric is used. The predictive quality of a model is higher when the error or
is lower, which is calculated as follows:
where
is the observed value of the independent variable in the test set,
is the predicted value of the independent variables in the test set,
n is the number of samples in the test topological indices serve as independent variables. To evaluate our initial model, we used the
metric and then normalized the data to enhance our predictions’ accuracy. We measured the difference between predicted and actual values using the
score, which revealed that our model needed improvement. To address issues such as outliers and varying scales of measurement that could negatively affect model performance, we applied normalization techniques to our data. The normalization step was essential in improving the model’s accuracy, as it scaled variables to a common range, reduced the impact of outliers, and ensured that all variables were weighted equally. After normalization, we re-evaluated the model using the
metric, and the updated score showed a significant improvement in our predictions’ accuracy. Computed topological indices values are shown in
Table 2. We compute the values using combinatorial computations and edge partitioning as follows: the molecular graph of Fenofibrate has 25 vertices and 26 edges. Its edges can be partitioned as
and
The molecular graph of Ciprofibrate has 18 vertices and 19 edges. Its edges can be partitioned as
and
The molecular graph of Bezafibrate has 25 vertices and 26 edges. Its edges can be partitioned as
and
The molecular graph of Fenofibrate has 16 vertices and 16 edges. Its edges can be partitioned as
and
Using MATLAB, it is possible to efficiently compute degree-based and distance-based topological indices, as explained in Algorithm 1 and Algorithm 2. To calculate the topological indices of molecules based on distance and degree, MATLAB utilizes various mathematical expressions. The Fibrates family and the drugs under consideration, namely Fenofibrate, Ciprofibrate, Bezafibrate, and Clofibrate, have been studied and are presented in
Table 3, including their experimental data [
52] and optimized geometries obtained through DFT calculations using the DMol3 module of Version 8.0 of Material Studio from BIOVIA.
Table 4 shows the correlation coefficient
between degree-based topological indices and some physicochemical properties, computed using a linear regression model. Quadratic regression model is used in
Table 6 to calculate the correlation coefficient
between these indices and some physicochemical properties. The cubic model is employed for this purpose in
Table 8. Similarly, for the distance-based topological indices, linear, quadratic, and cubic regression models are utilized, and the results are presented in
Table 10. Once the correlation coefficient for a physicochemical property is obtained, the model with the maximum
R becomes the most accurate predictor of the regression model. This indicated in
Table 5,
Table 7,
Table 9 and
Table 11. By leveraging the power of MATLAB, it is possible to efficiently and accurately compute topological indices and use them to predict the physicochemical properties of molecules, which can be incredibly useful in various fields, including drug discovery and materials science.
|
Algorithm 1 Computational Procedure of calculation of degree-based indices |
|
Input: Edges and nodes of molecule
Output: Topological indices vector
Step 1. Start
Step 2. Graph of undirected edges
Step 3. Adjacency matrix of G
Step 4. Distances of G
Step 5. Vertex degree of G
Step 6. Calculate size of matrix d
Step 4. Construct
for to number of columns do
for to number of rows do
if then
elseif then
First Zagerb index
Second Zagerb index
Hyper Zagerb index
Atom Bond Connectivity index
Randic index
min-max rodeg index
max-min rodeg index
Alberston index
Sigma index Inverse symmetric deg index
Inverse sum deg index
end if
end for
end for
Step 5. (summation of
|
3.1. Results and Discussion
Fibrates drugs are predicted by numerous topological indices. In QSPR, linear, quadratic, and cubic regression models are examined. Several topological indices are calculated for Fibrates drugs, including vertex degree, and distance between vertices. The models are analyzed using twelve descriptors and thirteen topological indices. Using linear regression model a correlation coefficient
between these indices and some physicochemical properties can be seen in
Table 4. In
Table 6 using quadratic regression model a correlation coefficient
between these indices and some physicochemical properties is computed. When a correlation coefficient is obtained for a physicochemical property, the model that has maximum
R is the most accurate predictor of the regression model. In
Table 4, we display
for each physicochemical property, based upon the analysis of the data (linear and quadratic). We have excluded values less than
from the
Table 4, and
Table 6, out of convenience.
Table 4.
The correlation coefficient (R) obtained by linear regression model between topological indices and physicochemical properties of various drugs of Fibrates.
Table 4.
The correlation coefficient (R) obtained by linear regression model between topological indices and physicochemical properties of various drugs of Fibrates.
| T.I. |
|
|
|
|
|
|
|
|
|
|
|
|
|
|
|
|
|
|
|
|
|
|
|
|
|
|
|
|
|
|
|
|
|
|
|
|
|
|
|
|
|
|
|
− |
|
|
|
|
|
|
|
|
|
|
|
|
|
|
|
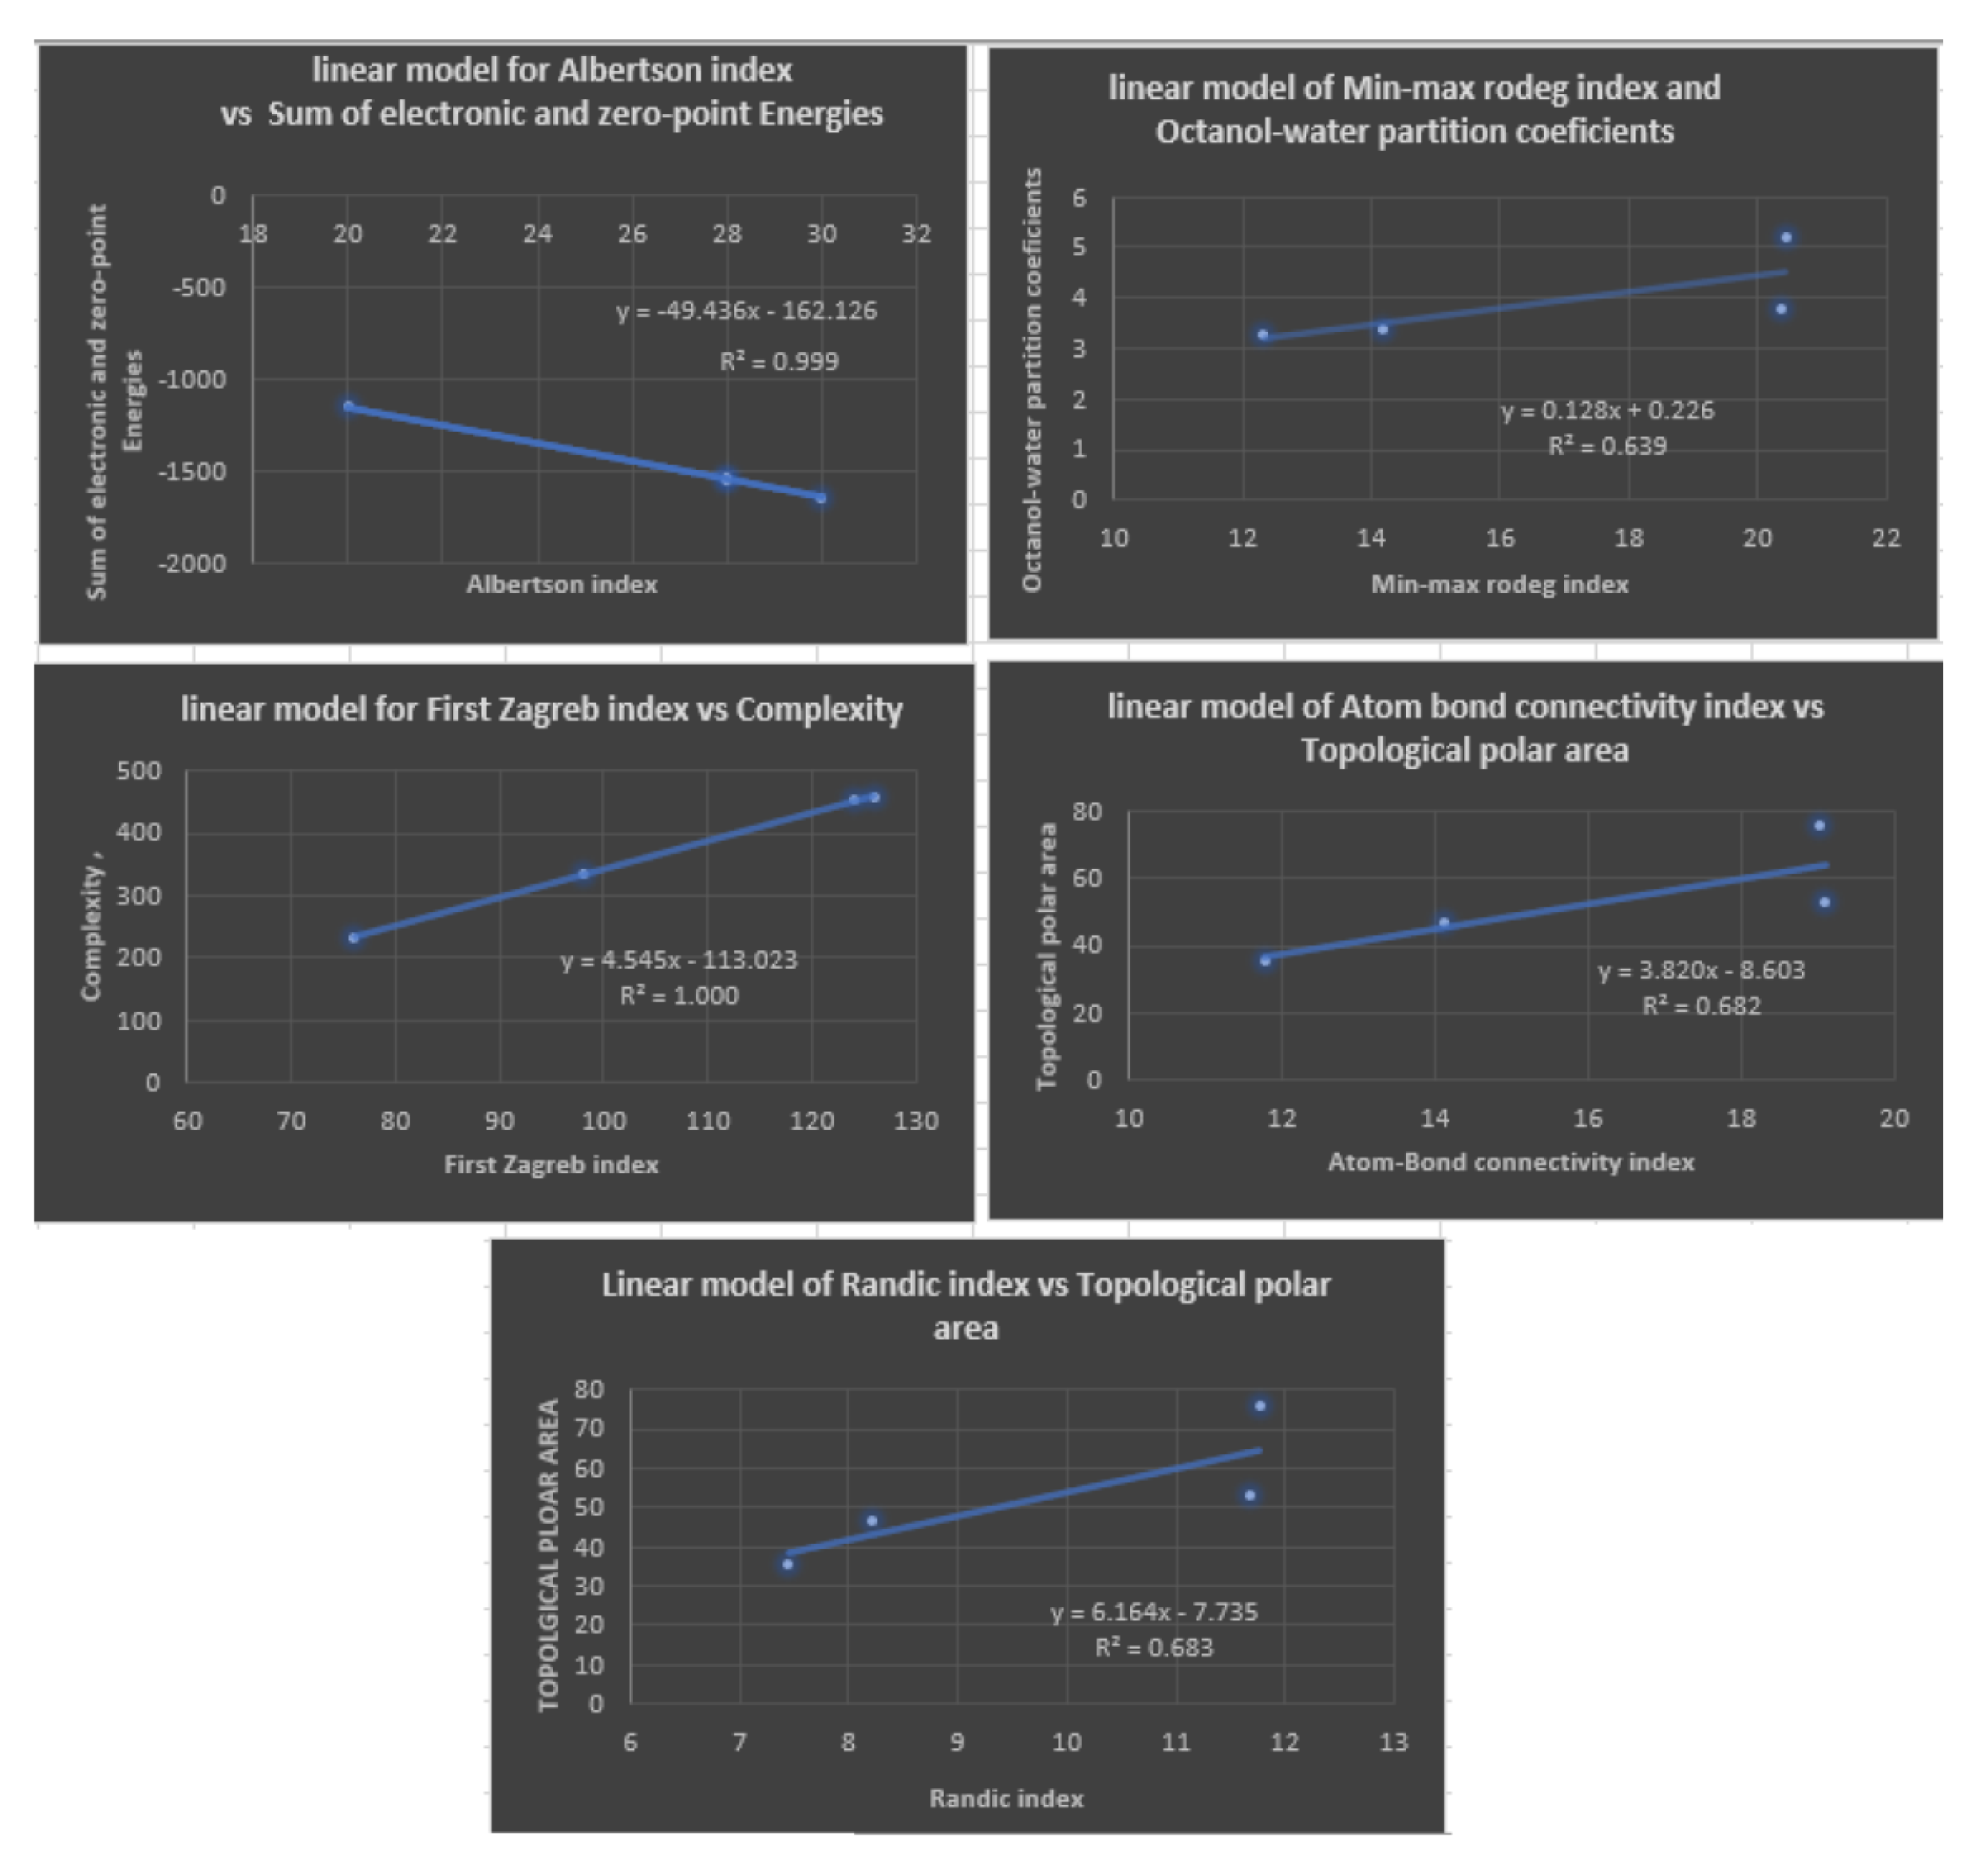
With linear regression models, the following
Table 5 illustrates the most appropriate topological index for estimating physicochemical properties. A diagram depicting this is shown in
Figure 5.
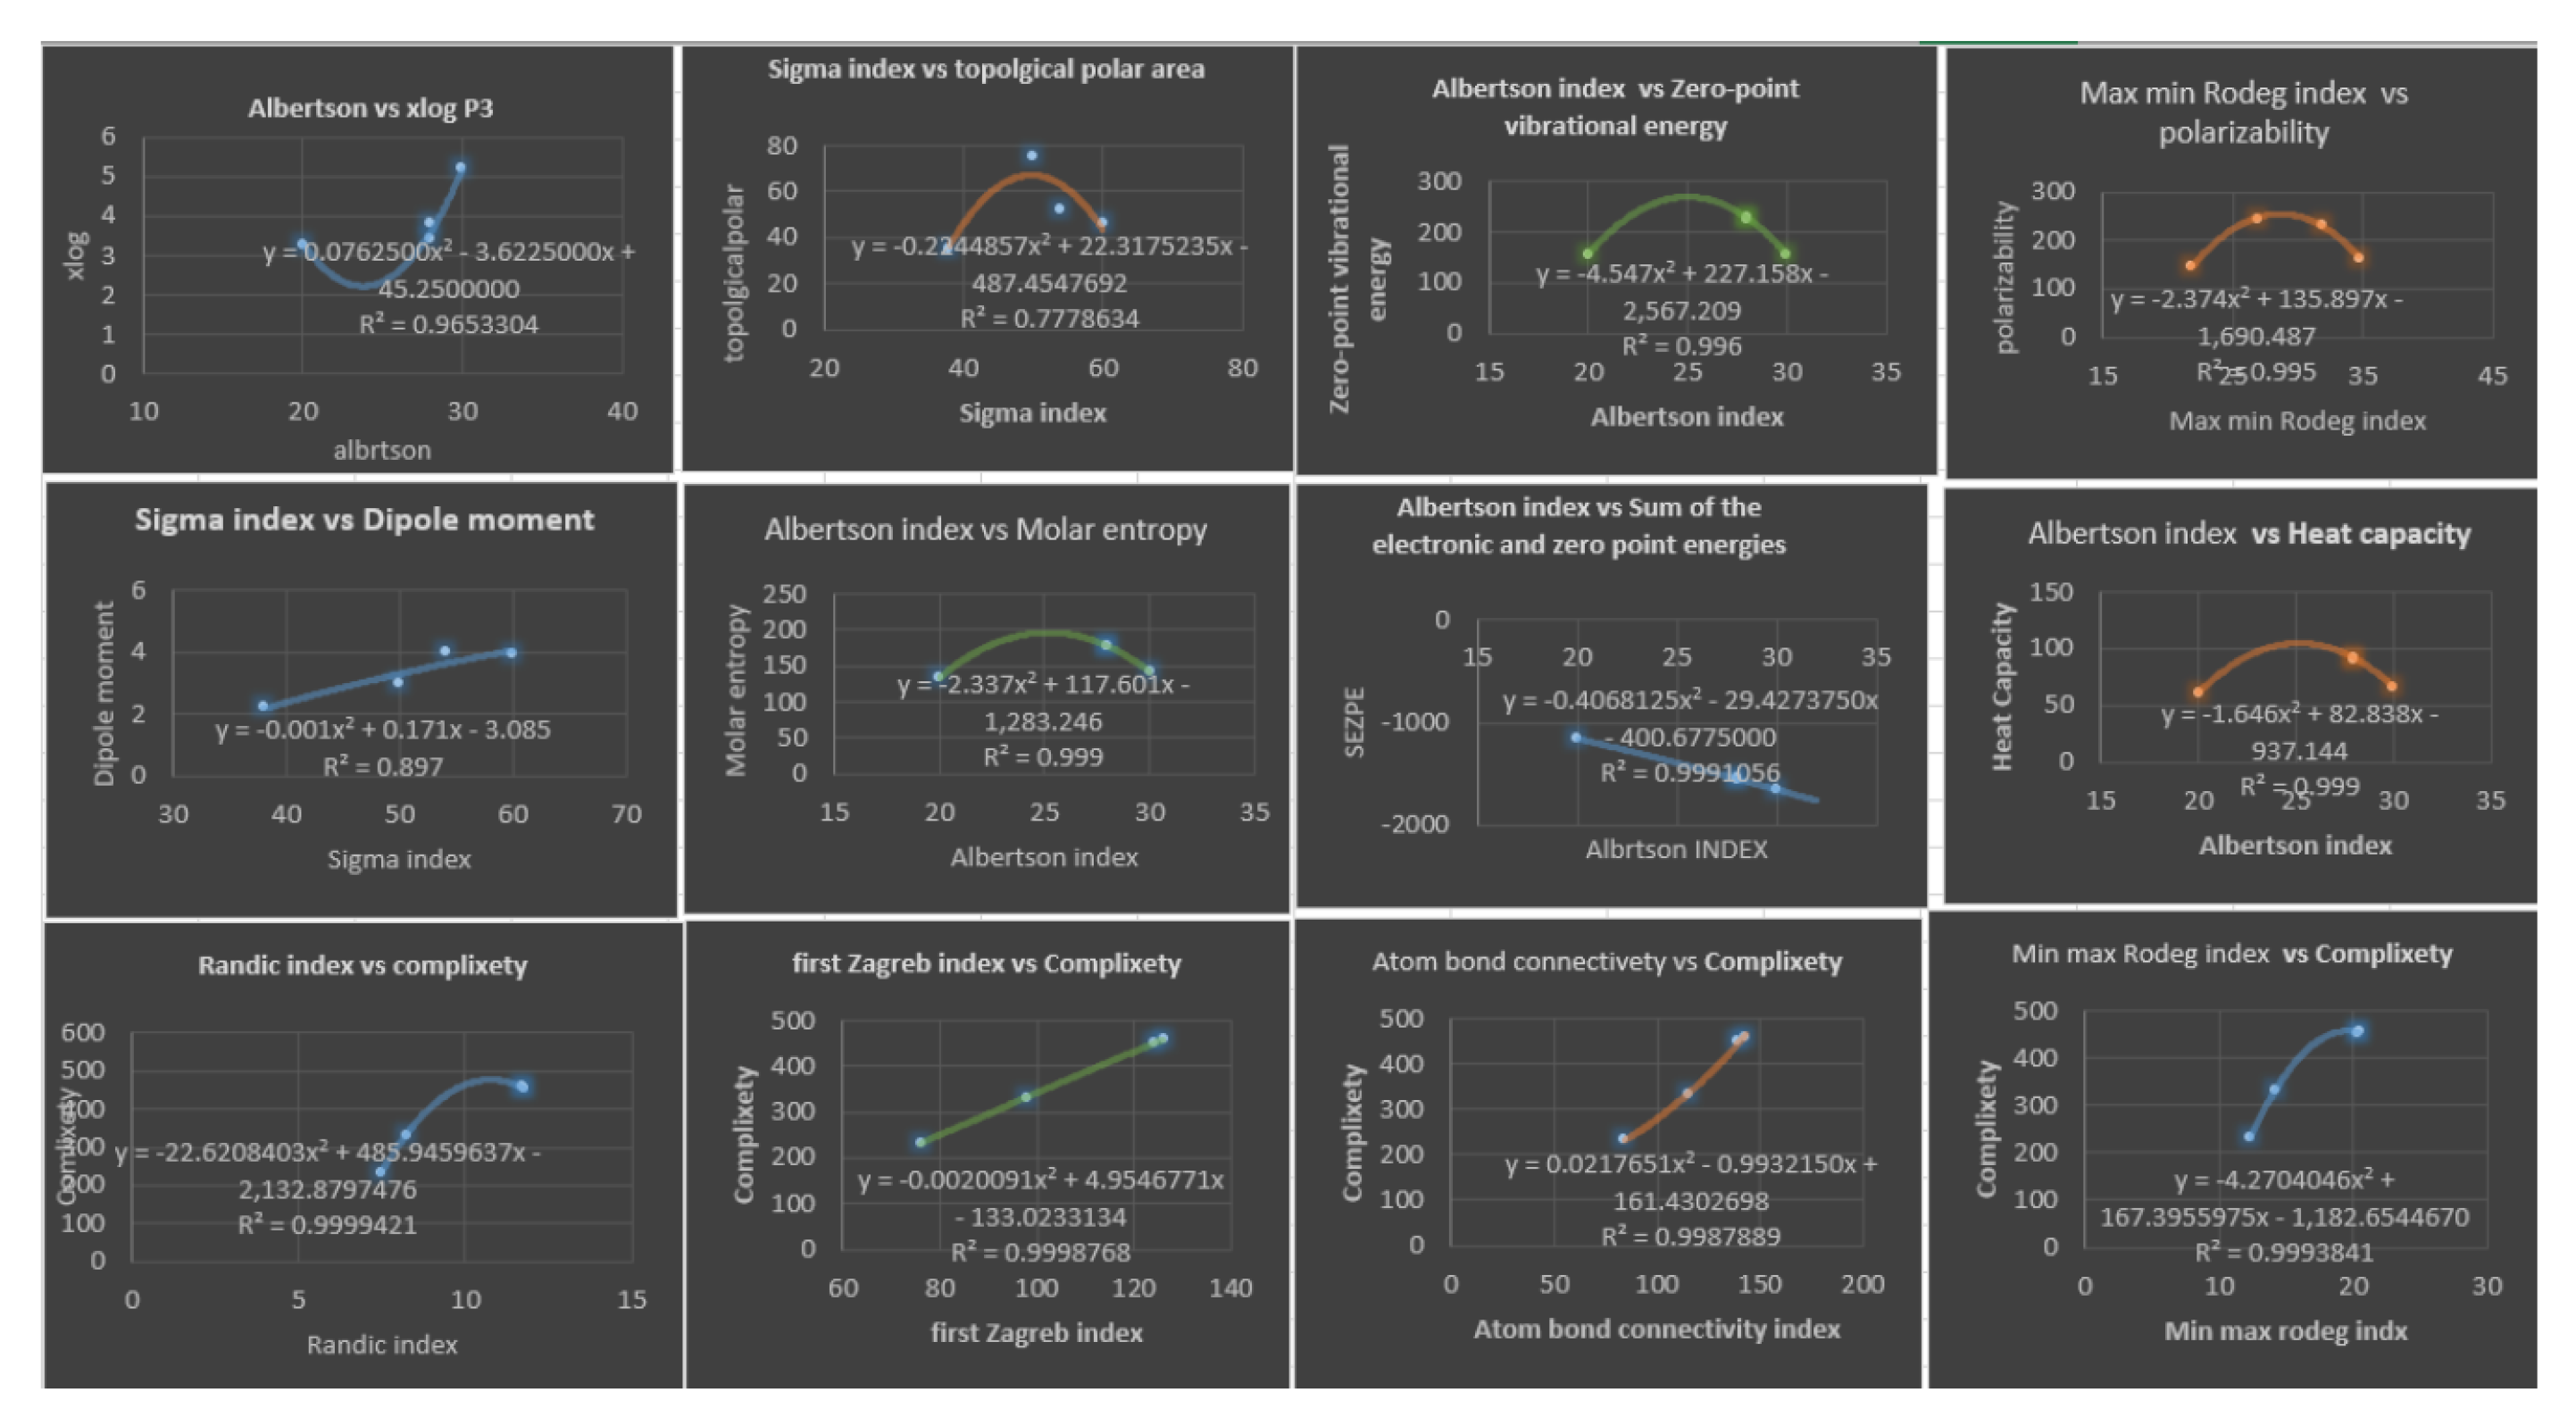
Table 7 illustrate the best topological index which gives the best estimate for physicochemical properties using quadratic regression models, we only consider topological index with
. A diagram depicting this is shown in
Figure 6.
Table 5.
Linear regression models that give the best estimate for physicochemical
Table 5.
Linear regression models that give the best estimate for physicochemical
| Linear regression model |
|
F |
|
|
|
|
|
|
|
|
|
|
|
|
|
|
|
|
1 |
|
|
|
|
|
|
|
|
|
|
|
|
|
|
|
|
Table 6.
The correlation coefficient (R) obtained by quadratic regression model between topological indices and physicochemical properties of various drugs of Fibrates.
Table 6.
The correlation coefficient (R) obtained by quadratic regression model between topological indices and physicochemical properties of various drugs of Fibrates.
| T.I. |
|
P |
|
|
S |
|
C |
|
|
|
|
|
|
|
|
|
|
|
|
|
|
|
|
|
|
|
|
|
|
| H |
|
|
|
|
|
|
|
|
|
|
|
|
|
|
|
|
|
|
|
| R |
|
|
|
|
|
|
|
|
|
|
|
|
|
|
|
|
|
|
|
|
|
|
|
|
|
|
|
|
|
|
|
|
|
|
|
|
|
|
|
|
|
|
|
|
|
|
|
|
|
|
|
|
|
|
|
|
|
|
|
|
|
|
|
|
|
|
|
|
|
Remark 1. Initially, linear regression was attempted on all physicochemical properties using degree-based topological indices. Correlation coefficients were calculated for 7 out of 12 properties that showed satisfactory results, as presented in Table 4. For the remaining properties with correlation coefficients less than 0.64, Table 6 explored alternative models. Five additional properties were tested, and if their correlation coefficients exceeded , the quadratic regression model was used. Note that some properties, such as Sum of the electronic and zero-point energies , Sum of the electronic and thermal energies , Sum of the electronic and thermal enthalpies , Sum of the electronic and thermal free energies , have identical correlation coefficients, and only is listed in Table 5 and Table 7.
Table 7.
Quadratic regression model that give the best estimate for physicochemical.
Table 7.
Quadratic regression model that give the best estimate for physicochemical.
| Quadratic regression model |
|
F |
|
|
|
|
|
|
|
|
|
|
|
|
|
|
|
|
|
|
|
|
|
|
|
|
|
|
|
|
|
|
|
|
|
|
|
|
|
|
|
|
|
|
|
|
|
|
|
|
|
|
|
|
|
|
|
|
|
|
|
|
|
|
|
|
|
|
|
|
|
|
|
|
|
|
|
|
|
|
|
|
|
|
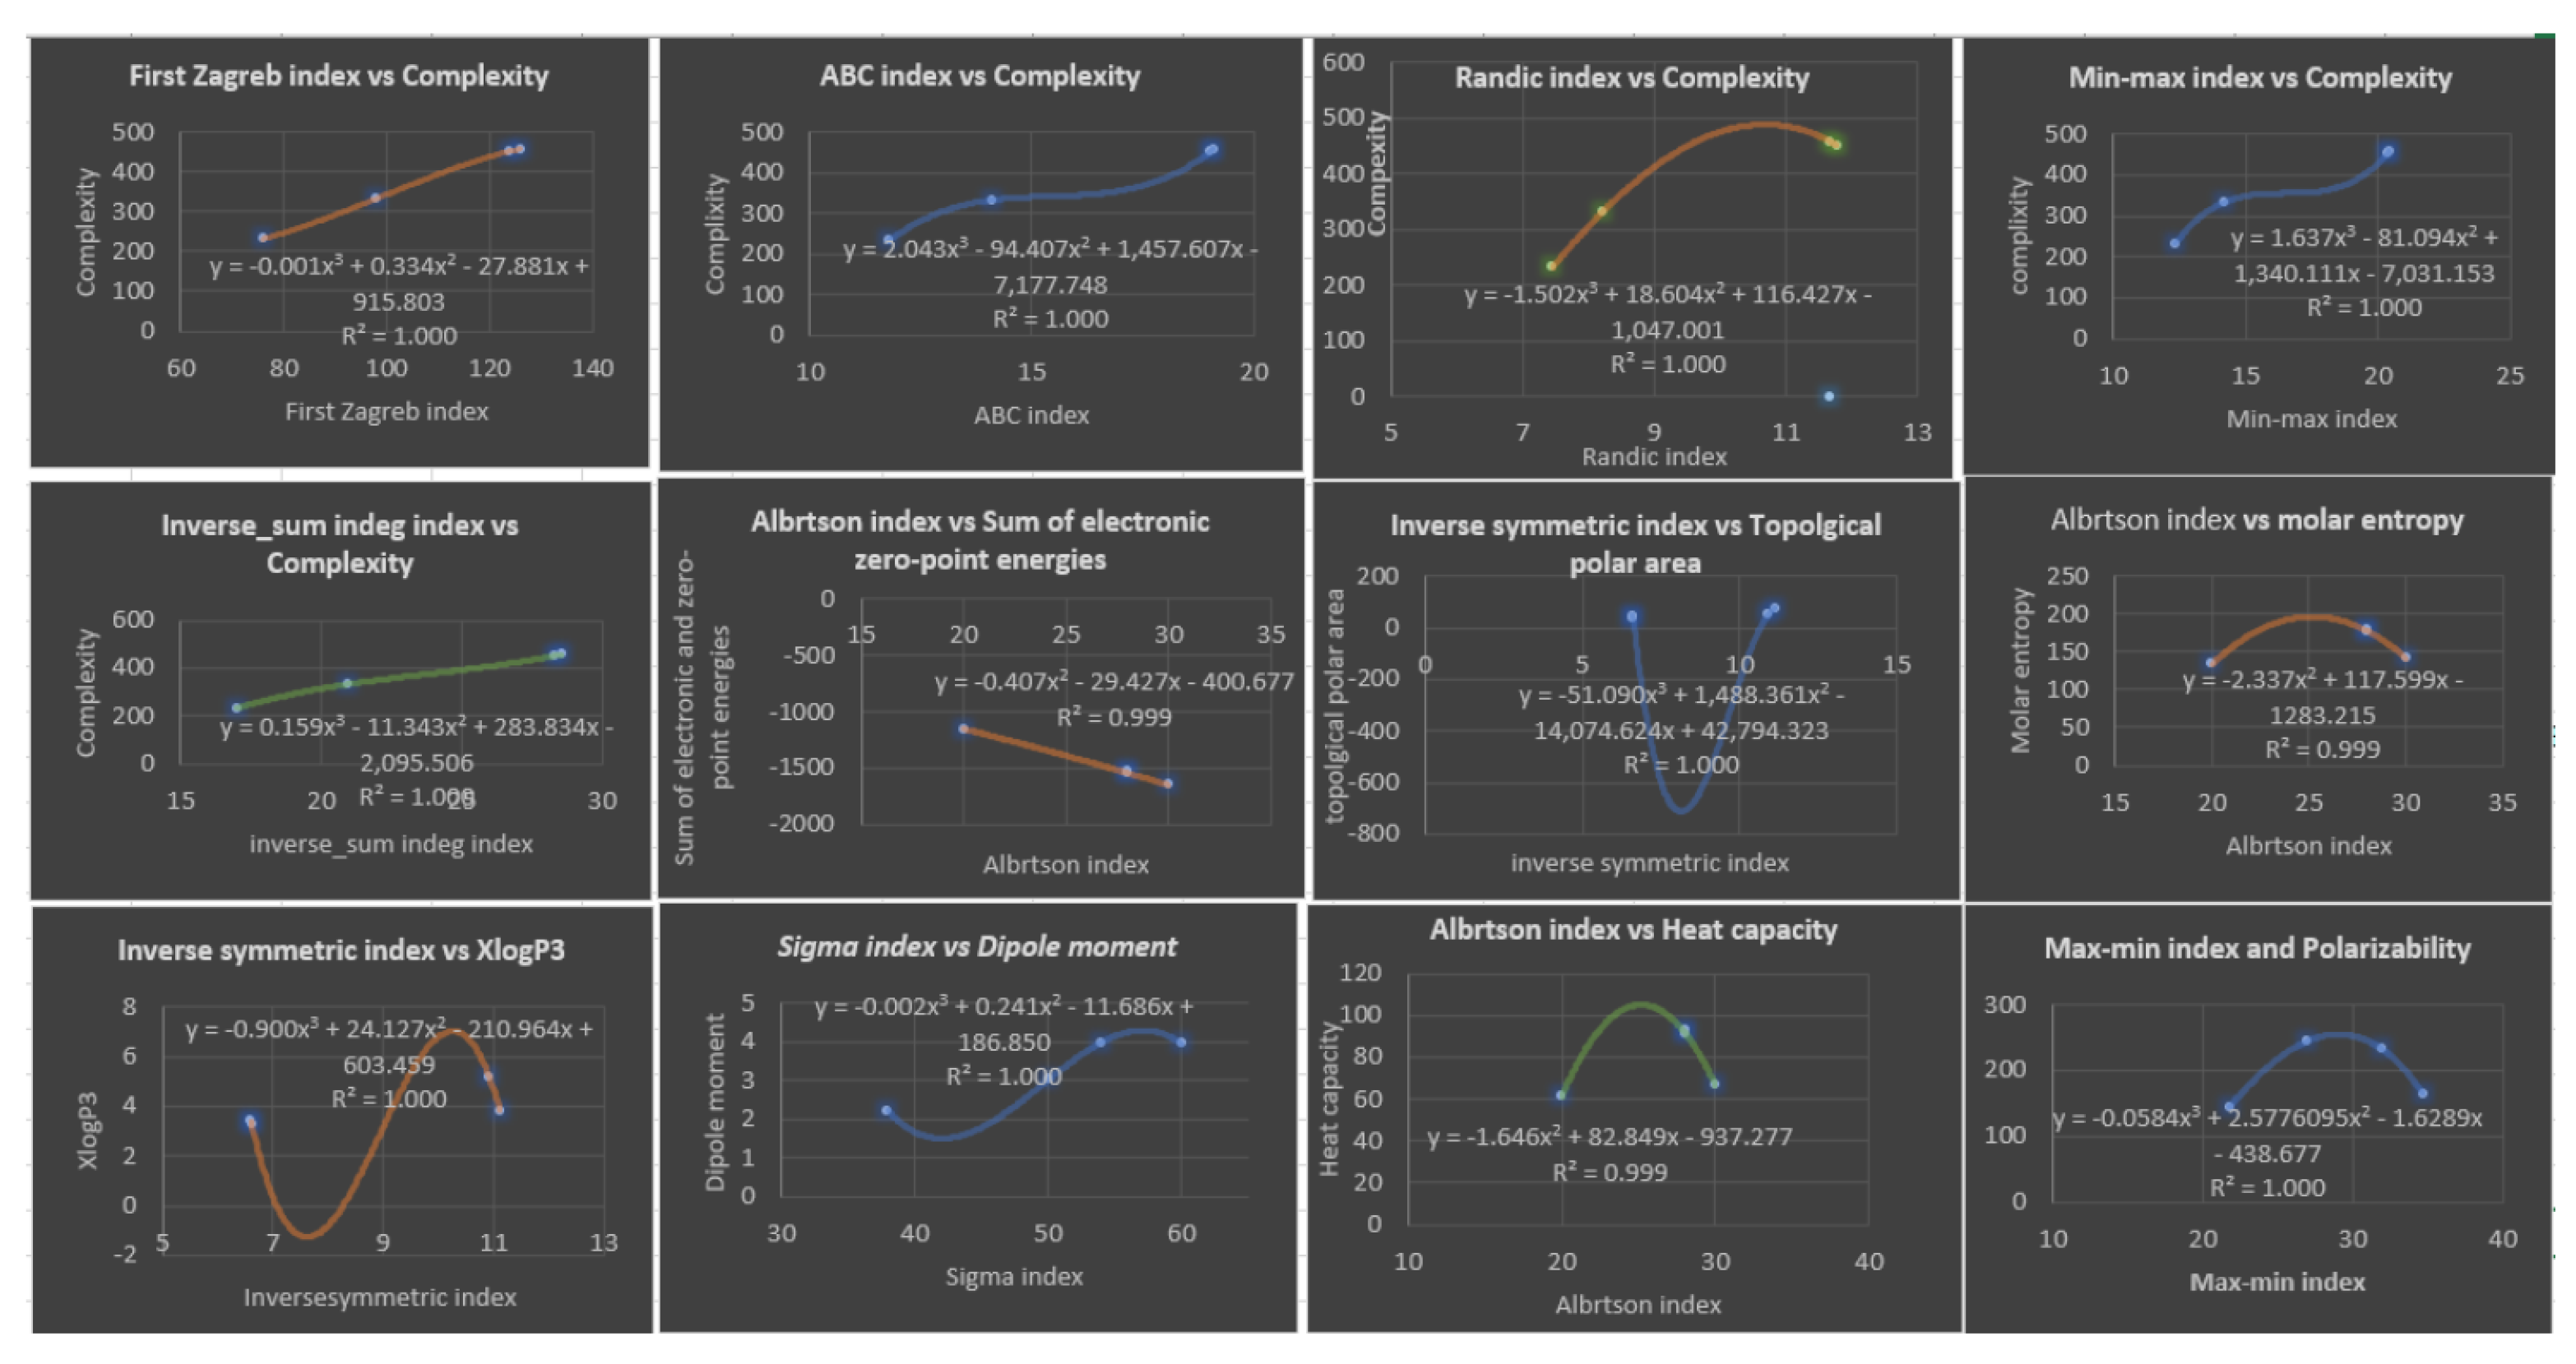
The cubic model is used for all the physicochemical properties and degree-based topological indices in order to provide a comprehensive analysis.
Table 8 presents the correlation coefficients, which are high as anticipated.
Table 9 and
Figure 7 display the best predictions of the properties.
Table 8.
The correlation coefficient (R) obtained by cubic regression model between topological indices and physicochemical properties of various drugs of Fibrates.
Table 8.
The correlation coefficient (R) obtained by cubic regression model between topological indices and physicochemical properties of various drugs of Fibrates.
| T.I. |
|
P |
C |
|
|
S |
|
|
|
|
|
|
|
|
|
|
|
|
|
|
|
|
|
|
|
|
| H |
|
|
|
|
|
|
|
|
|
|
|
|
|
|
|
|
|
| R |
|
|
|
|
|
|
|
|
|
|
|
|
|
|
|
|
|
|
|
|
|
|
|
|
|
|
|
|
|
|
|
|
|
|
|
|
|
|
|
|
|
|
|
|
|
|
|
|
|
|
|
|
|
|
|
|
|
|
|
|
|
|
Table 9.
Cubic regression model that give the best estimate for physicochemical.
Table 9.
Cubic regression model that give the best estimate for physicochemical.
| Cubic regression model |
|
F |
|
|
|
|
|
|
|
|
|
|
|
|
|
|
|
|
|
|
|
|
|
|
|
|
|
|
|
|
|
|
|
|
|
|
|
|
|
|
|
|
|
|
|
|
|
|
|
|
|
|
|
|
|
|
|
|
|
|
|
|
|
|
|
|
|
|
|
|
|
|
|
|
|
|
|
|
|
|
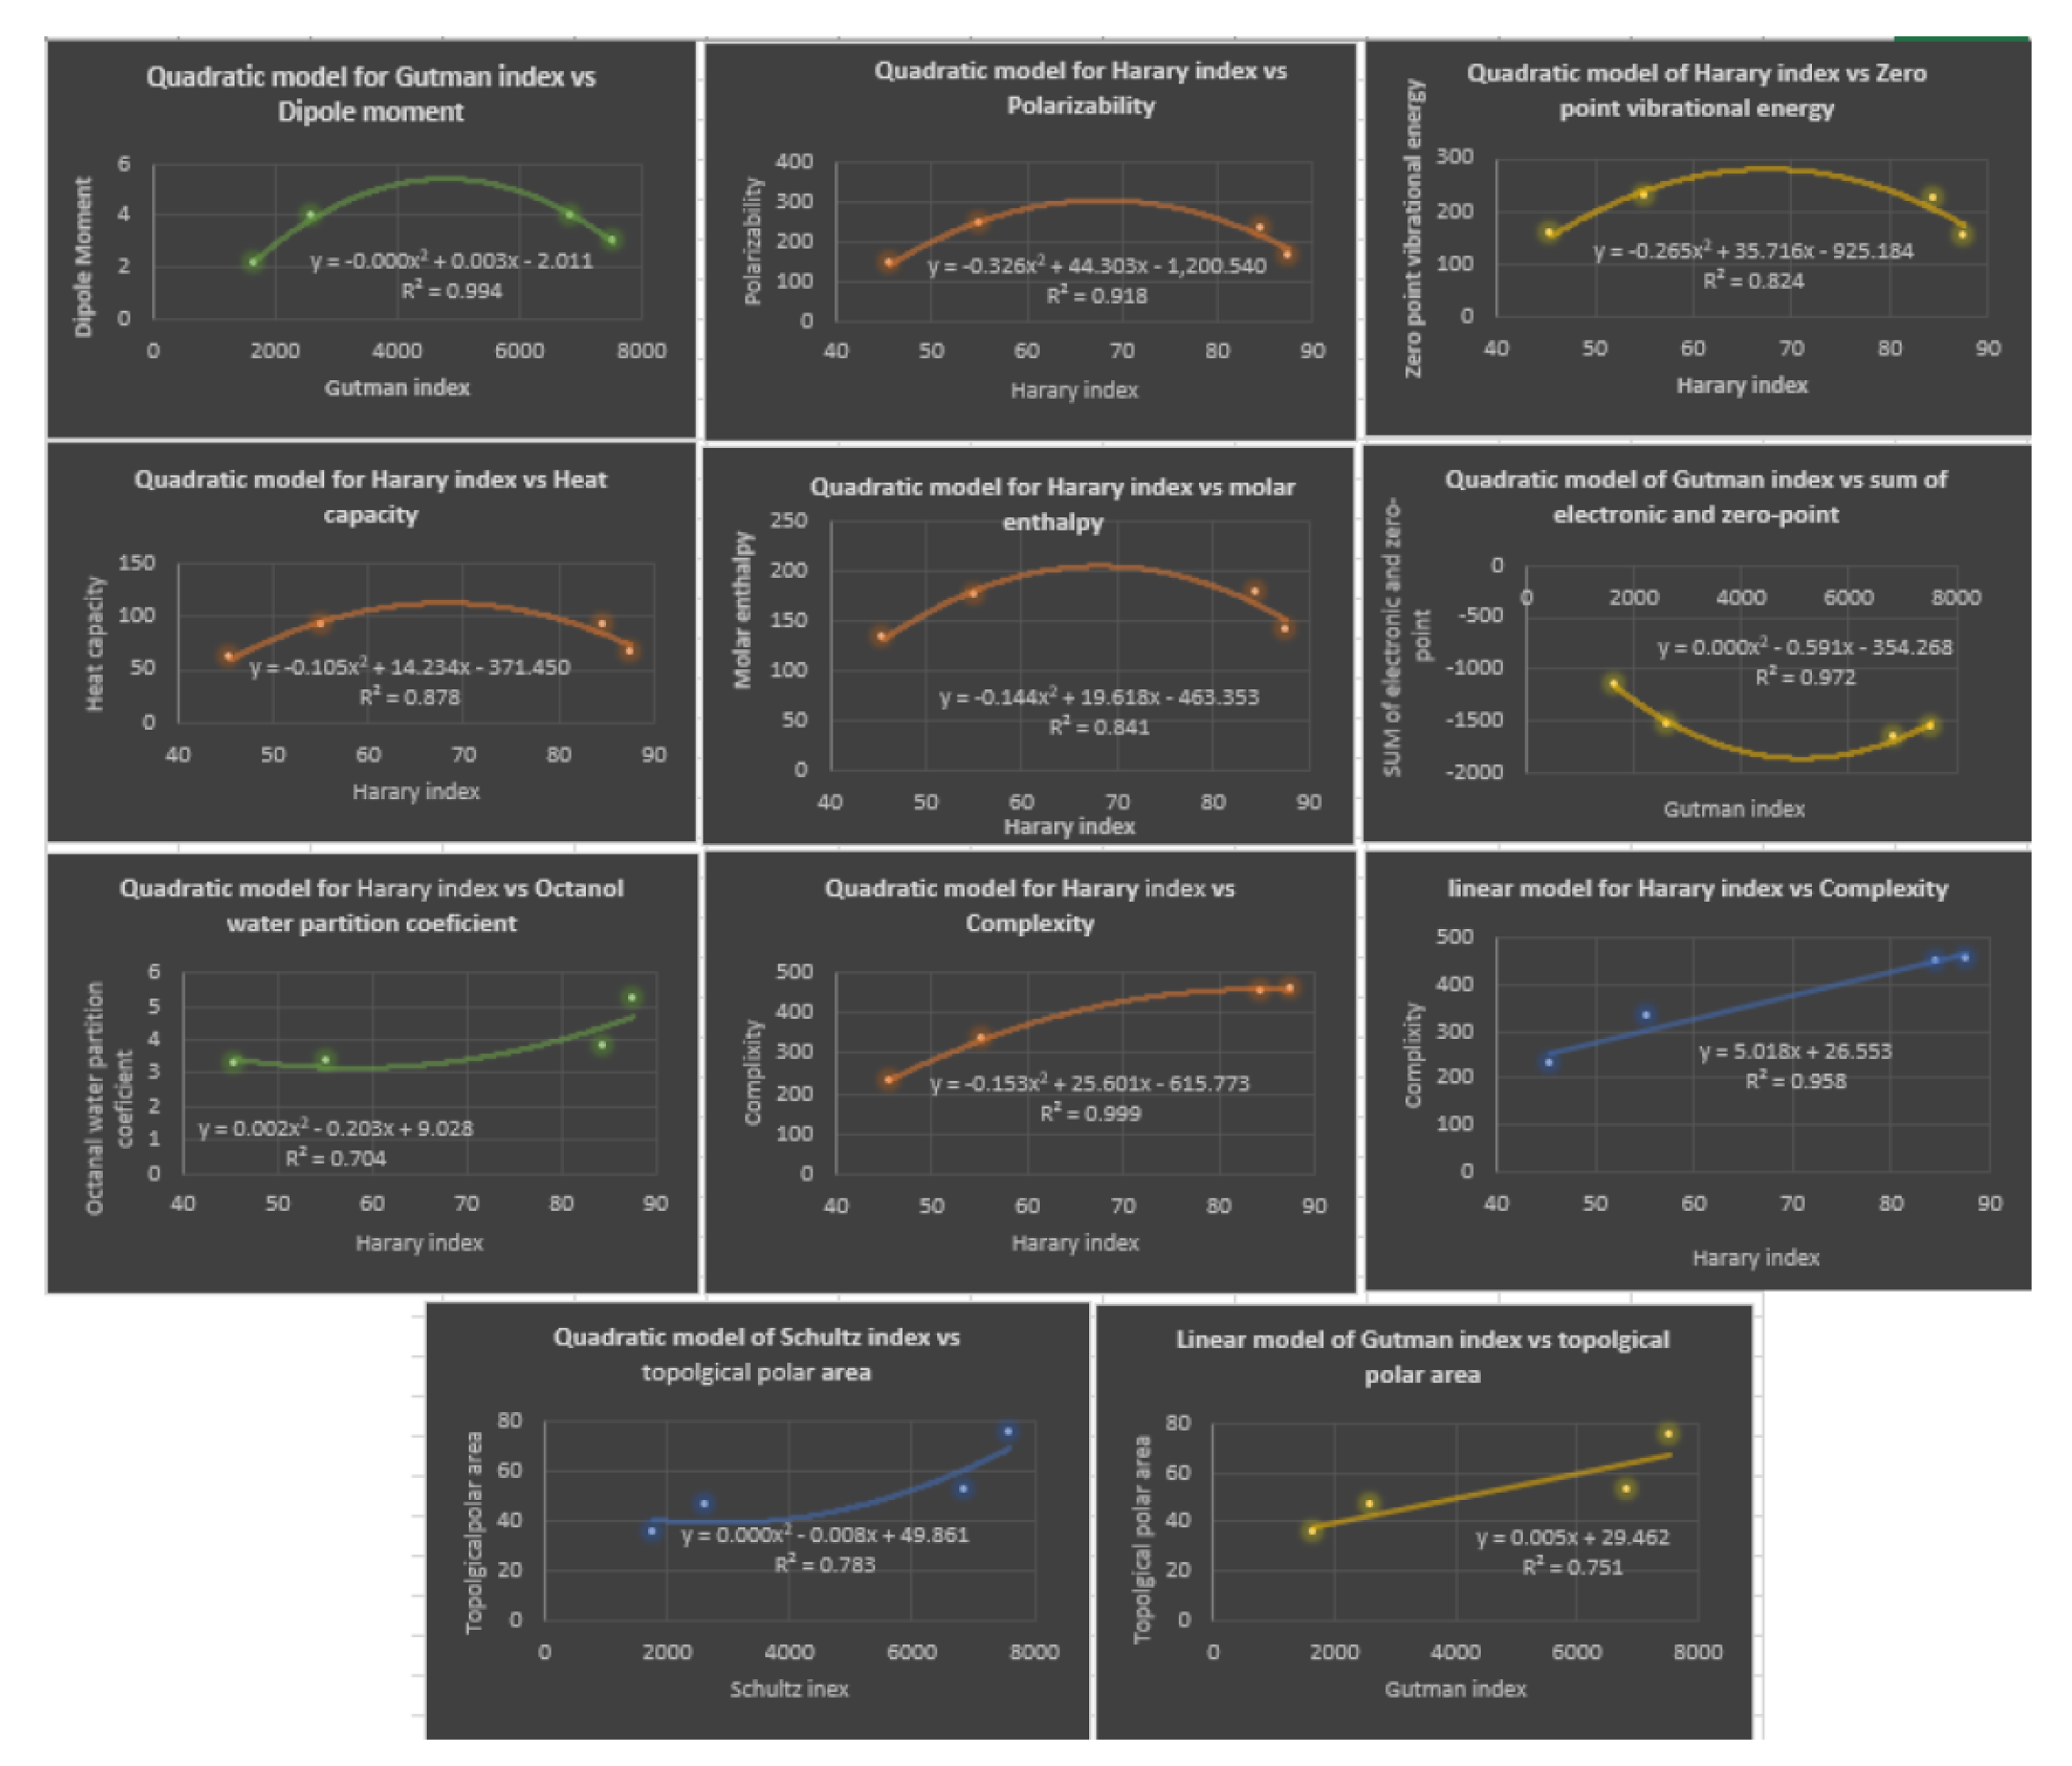
Based on three curvilinear models, linear, quadratic, and cubic, the following
Table 10, illustrates the correlation coefficient
R for the four distance topological indices. The next Table shows the most accurate prediction of the physicochemical properties based on linear or quadratic models. It should be noted that the physicochemical properties: Sum of the electronic and zero-point energies
, Sum of the electronic and thermal energies
, Sum of the electronic and thermal enthalpies
, Sum of the electronic and thermal free energies
have the same correlation coefficients, which is why the
is the only one listed in
Table 10. It is evident that the cubic model is the optimal model to predict all physicochemical properties of Fibrates. Notice that, we displayed the correlation coefficient in bold for the cubic model.
Table 11 and
Figure 8 illustrated the best linear and quadratic model of distance-based topological indices with the properties.
Table 10.
The curvilinear models, along with the linear, quadratic, and cubic regression models, were used to determine the correlation coefficient (R) between the physicochemical properties of various Fibrates drugs and their distance topological indices..
Table 10.
The curvilinear models, along with the linear, quadratic, and cubic regression models, were used to determine the correlation coefficient (R) between the physicochemical properties of various Fibrates drugs and their distance topological indices..
| P.P. |
|
|
|
|
|
|
|
|
|
| P |
|
|
|
|
|
|
|
|
|
|
|
|
|
|
| S |
|
|
,
|
|
|
|
|
|
|
|
|
|
|
|
| C |
|
|
|
|
|
|
|
|
|
Table 11.
The linear and quadratic regression models provide the most accurate predictions for the physicochemical properties.
Table 11.
The linear and quadratic regression models provide the most accurate predictions for the physicochemical properties.
|
|
F |
|
|
|
|
|
|
|
|
|
|
|
|
|
|
|
|
|
|
|
|
|
|
|
|
|
|
|
|
|
|
|
|
|
|
|
|
|
|
|
|
|
|
|
|
|
|
|
|
|
|
|
|
|
|
|
|
|
|
|
|
|
|
|
|
|
|
|
|
|
The physicochemical properties of Fibrates drugs and their corresponding degree-based and distance-based topological indices were analyzed using three curvilinear models: linear, quadratic, and cubic. The aim was to determine the most accurate correlation coefficient for the properties studied.
Table 4 shows the correlation coefficients (
R) obtained by a linear regression model between various topological indices and physicochemical properties of Fibrates drugs. The topological indices include degree-based topological indices. The results show that the correlation coefficients vary across the different topological indices and physicochemical properties. Positive correlation indicates two variables that tend to move strongly in opposite directions, while negative correlation indicates two variables that move strongly in opposite directions. In particular, for the first Zagreb index
the correlation coefficient lies between
and 1, with the best prediction for complexity
being 1. For the second Zagreb index
the range of the correlation coefficient is
which indicates high prediction of all physicochemical properties under study. The highest correlation coefficient values were observed for the
property with values ranging from
to
, followed by the
index with values ranging from
to
. The other topological indices showed weaker correlations with the physicochemical properties, with correlation coefficients ranging from
to
for the remaining indices.
Table 5 provided lists five linear regression models and their corresponding
and
values.
, or coefficient of determination, is a measure of how well the independent variables in a linear regression model explain the variation in the dependent variable. It ranges from 0 to 1, with 1 indicating a perfect fit.
, or root mean squared error, is a measure of how well the regression model’s predictions match the actual values. It represents the average distance between the predicted and actual values, and lower values indicate better accuracy. All five models have relatively high
values, indicating that they explain a significant amount of the variation in the dependent variable. The lowest
value is
, which is still considered a relatively good fit. However, the models have different levels of prediction accuracy as measured by
. The
with Min-max rodeg index
index model has the lowest
value of
, which suggests that it has the most accurate predictions among the five models. The
C model with first Zagreb index
has the second lowest
value of
, followed by the
model with an
of
. The
index) and
index) models have the highest
values of
and
, respectively, indicating that their predictions are the least accurate among the five models. In summary, while all five models have relatively high
values indicating good fit to the data, the
model is the most accurate based on its low
value, followed by the
C and
models, and then the
(
index) and
(
R index) models, which have the highest
values.
Table 6 presents the correlation coefficients
obtained by a quadratic regression model between topological indices and physicochemical properties of various drugs of Fibrates. Upon analyzing the data in
Table 6, several noteworthy findings can be observed. Firstly, many of the correlation coefficients
are relatively high, indicating a strong linear relationship between the topological indices and physicochemical properties of the Fibrates drugs. For instance,
has a high correlation coefficient of
with
, indicating a strong positive linear relationship between these two variables. Similarly,
has a high correlation coefficient of
with
, suggesting a strong positive linear relationship between these variables as well. Furthermore, some of the correlation coefficients are close to 1, indicating a perfect positive linear relationship between the variables. For example,
and
indices have a correlation coefficient of
with
, suggesting a perfect positive linear relationship between these two variables. Similarly,
index has a correlation coefficient of
with
,
,
, and
, indicating a perfect positive linear relationship between these variables. On the other hand, some correlation coefficients are relatively low, indicating a weak linear relationship between the variables. For instance,
index has a correlation coefficient less than 0.64 for most of the properties exept for
and
, suggesting a weak positive linear relationship between these two variables. It is also interesting to note that we don’t have any negative values which would indicating an inverse relationship between the variables. In addition, some of the correlation coefficients are moderate, suggesting a moderate linear relationship between the variables. For instance,
has a correlation coefficient of
, indicating a moderate positive linear relationship between these variables. Overall, the findings from
Table 6 suggest that there are varying degrees of linear relationships between the topological indices and physicochemical properties of Fibrates drugs. Some of the relationships are strong, while others are weak or moderate. Looking at
Table 7, we see that all five models for Complexity property
have high
values, with the lowest being
and the highest being
. This suggests that all five models are good at explaining the variation in the physicochemical property they are modeling. The second thing to consider is the
value, a lower
value indicates that the model has a better fit. In this table, we can see that the
values range from
to
. The model with the lowest
value is the second model:
for the Randic index. This indicates that this model has the best fit for estimating the physicochemical property. However, it is important to note that all five models have high
values, suggesting that they all provide good estimates for the physicochemical property. After analyzing the table, we found that there are five quadratic regression models with both high
values and low
values. The quadratic regression model for
S has a high
value of
and a low
value of
, making it one of the best models in terms of accurately predicting the target variable. The other models are for
,
,
, and
. The model for
has an
value of
and an
of
, the model for
has an
value of
and an
of
, the model for
has an
value of
and an
of
, and the model for
has an
value of
and an
of
. These models can be considered the best in terms of their ability to fit the data and accurately predict the target variable.
Table 8 presents the correlation coefficient
obtained by cubic regression models between topological indices and physicochemical properties of various drugs of fibrates. Looking at the table, we can see that the range of correlation coefficient varies for each row. For instance, the correlation coefficient for the row of the first Zagreb index
ranges from
to
, while for the row Inverse symmetric deg index
, the correlation coefficient ranges from
to
. Overall, most of the correlation coefficients are relatively high, with many of them being close to
. This suggests a strong correlation between the topological indices and the physicochemical properties of the drugs of fibrates. The high correlation coefficients could indicate that the topological indices could be used to predict the physicochemical properties of the drugs with high accuracy. Based on the
Table 9, it appears that the cubic regression model provides the highest correlation coefficients for most of the topological indices and physicochemical properties of Fibrates drugs. The range of correlation coefficients for each row varies, but in general, they are relatively high, indicating a strong relationship between the topological indices and physicochemical properties. Furthermore, the high correlation coefficients suggest that the cubic regression model is an effective tool for predicting physicochemical properties based on the topological indices of Fibrates drugs. Overall, the results of the table suggest that the cubic regression model is the best choice for analyzing the relationship between topological indices and physicochemical properties in Fibrates drugs. based on
Table 9, we can analyze the four topological indices with respect to high
and minimum
.
(
,
) indicating a strong correlation between the physicochemical properties and this index. Additionally, its
value of
is also very low, suggesting that the predicted values using this index are very close to the actual values.
(
,
) indicating a perfect correlation with the physicochemical properties.
By deep looking at Table 10, considering only the distance-based topological indices, we can notice that the model which gives the highest correlations with all the investigated physicochemical properties of Fibrate drugs is the cubic model. Since the correlation coefficients range from
to
. In the second place is the quadratic model, since it gives good correlations with most of these properties, the correlation coefficients range from
to
. While the linear model comes in the third place, shows good correlation but with the least number of properties, the correlation coefficients range
to
. An important note, in most cases, that the linear and quadratic models give comparable correlation coefficients, while there is a significant improvement in the correlation coefficients when the cubic model is used for most of properties. For instance, for the polarizability
property estimated using wiener index, correlations are comparable,
and
for the linear and quadratic models, respectively, and it improves to 1 with the cubic model. As a result, we should consider our model type when dealing with such properties. Generally speaking, the four properties at the end of
Table 10 are estimated very well with the three models compared to the first five properties in the table. The complexity
property can be best estimated using the various models, since the correlations with each model reach
. The topological polar area
can be nominated as the second-best estimated property by the three models, followed by Sum of electronic and zero-point Energies
property. Conversely, the zero-point vibrational energy
and heat capacity
properties seems to be the least properties which can be estimated correctly using the two models (linear and quadratic), the correlations not exceeded
, the exception is the quadratic model of the hyper Zagreb index
,
and
, respectively. Based on the
values given in
Table 11, the three best predictors with the lowest
values are: Linear Regression
with
Quadratic Regression
with
and Curvilinear Regression
with
These three regression models exhibit the lowest
values, indicating higher accuracy and better predictive performance compared to the other regression models. Therefore, these three regression models, namely linear, quadratic, and curvilinear, can be considered as the best predictors for enhancing the analysis of fibrates drug activity through molecular descriptors in this study. Therefore, based on the results obtained, it can be concluded that the cubic and quadratic regression models are the top predictors for the physicochemical properties analyzed in this investigation, as they exhibit both high
values and minimum
values simultaneously. These findings highlight the effectiveness of these regression models in enhancing the analysis of fibrates drug activity through molecular descriptors and provide valuable insights for future research in this area.
