Submitted:
02 May 2023
Posted:
03 May 2023
You are already at the latest version
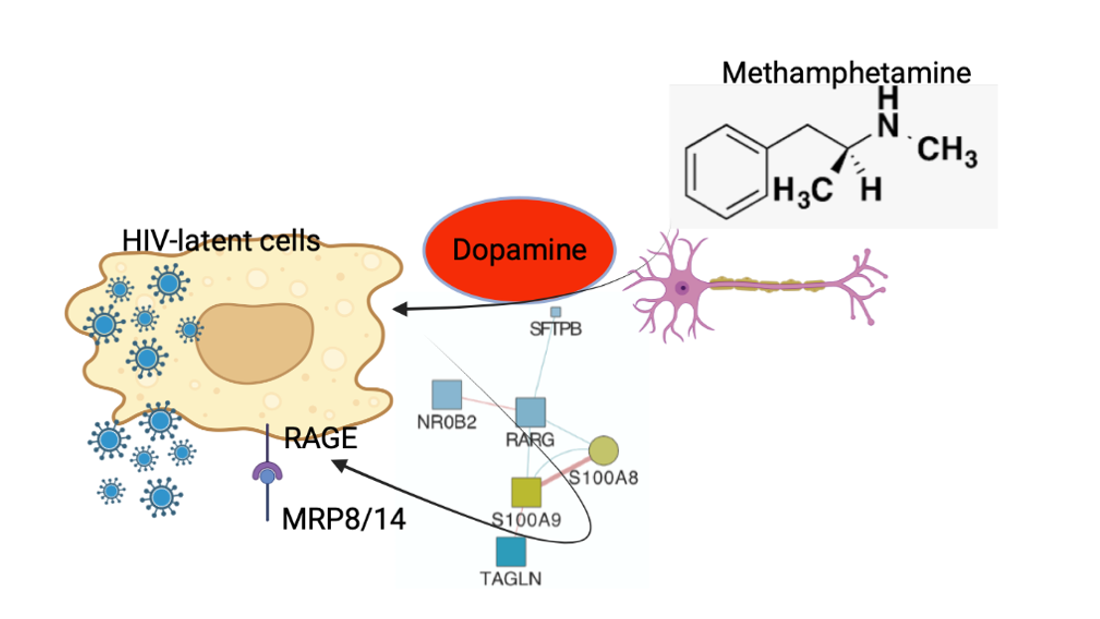
Abstract
Keywords:
Introduction
Materials and Methods
| HIV-/METH- | HIV+/METH- | HIV-/METH+ | HIV+/METH+ | ANOVA p values |
|||||
|---|---|---|---|---|---|---|---|---|---|
| N | 27 | 25 | 25 | 25 | |||||
| Mean | STD | Mean | STD | Mean | STD | Mean | STD | ||
| Age | 37.68 | 9.17 | 38.8 | 6.94 | 36.16 | 9.26 | 36.32 | 6.44 | 0.4980 |
| Education | 13.68 | 2.37 | 13.24 | 2.61 | 12.7 | 2.45 | 12.08 | 2.81 | 0.0882 |
| Global T score | 49.70 | 6.64 | 46.19 | 5.66 | 45.94 | 5.7 | 46.17 | 6.77 | 0.0524 |
| CD4 Nadir | 815 | 205 | 287 | 219 | 918 | 184 | 311 | .23 | <0.0001 |
| CD4/CD8 Ratio | 1.84 | 1.29 | 0.53 | 0.37 | 2.48 | 1.28 | 0.56 | 0.26 | <0.0001 |
| Duration of infection (yrs) | NA | NA | 7.26 | 5.73 | NA | NA | 6.18 | 6.98 | 0.4431 |
| % Black | 7 | 3 | 3 | 0 | |||||
| % Hispanic | 5 | 6 | 2 | 5 | |||||
| % Asian | 1 | 1 | 1 | 2 | |||||
| % White | 14 | 15 | 19 | 18 | |||||
| Detectable Plasma VL (% of total) | NA | 60 | NA | 56 | 0.0774* | ||||
| Detectable CSF VL (% of total) | NA | 48 | NA | 58 | 0.0293* | ||||
| LT Alcohol dep (% of total) | 60 | 45 | 68 | 52 | 0.0407 | ||||
| LT Cocaine dep (% of total) | 20 | 32 | 36 | 24 | |||||
| LT Opioid dep (% of total) | 4 | 4.5 | 24 | 12 | <0.0001 | ||||
| LT MDD (% of total) | 16 | 72 | 48 | 52 | |||||
Results
- 1.
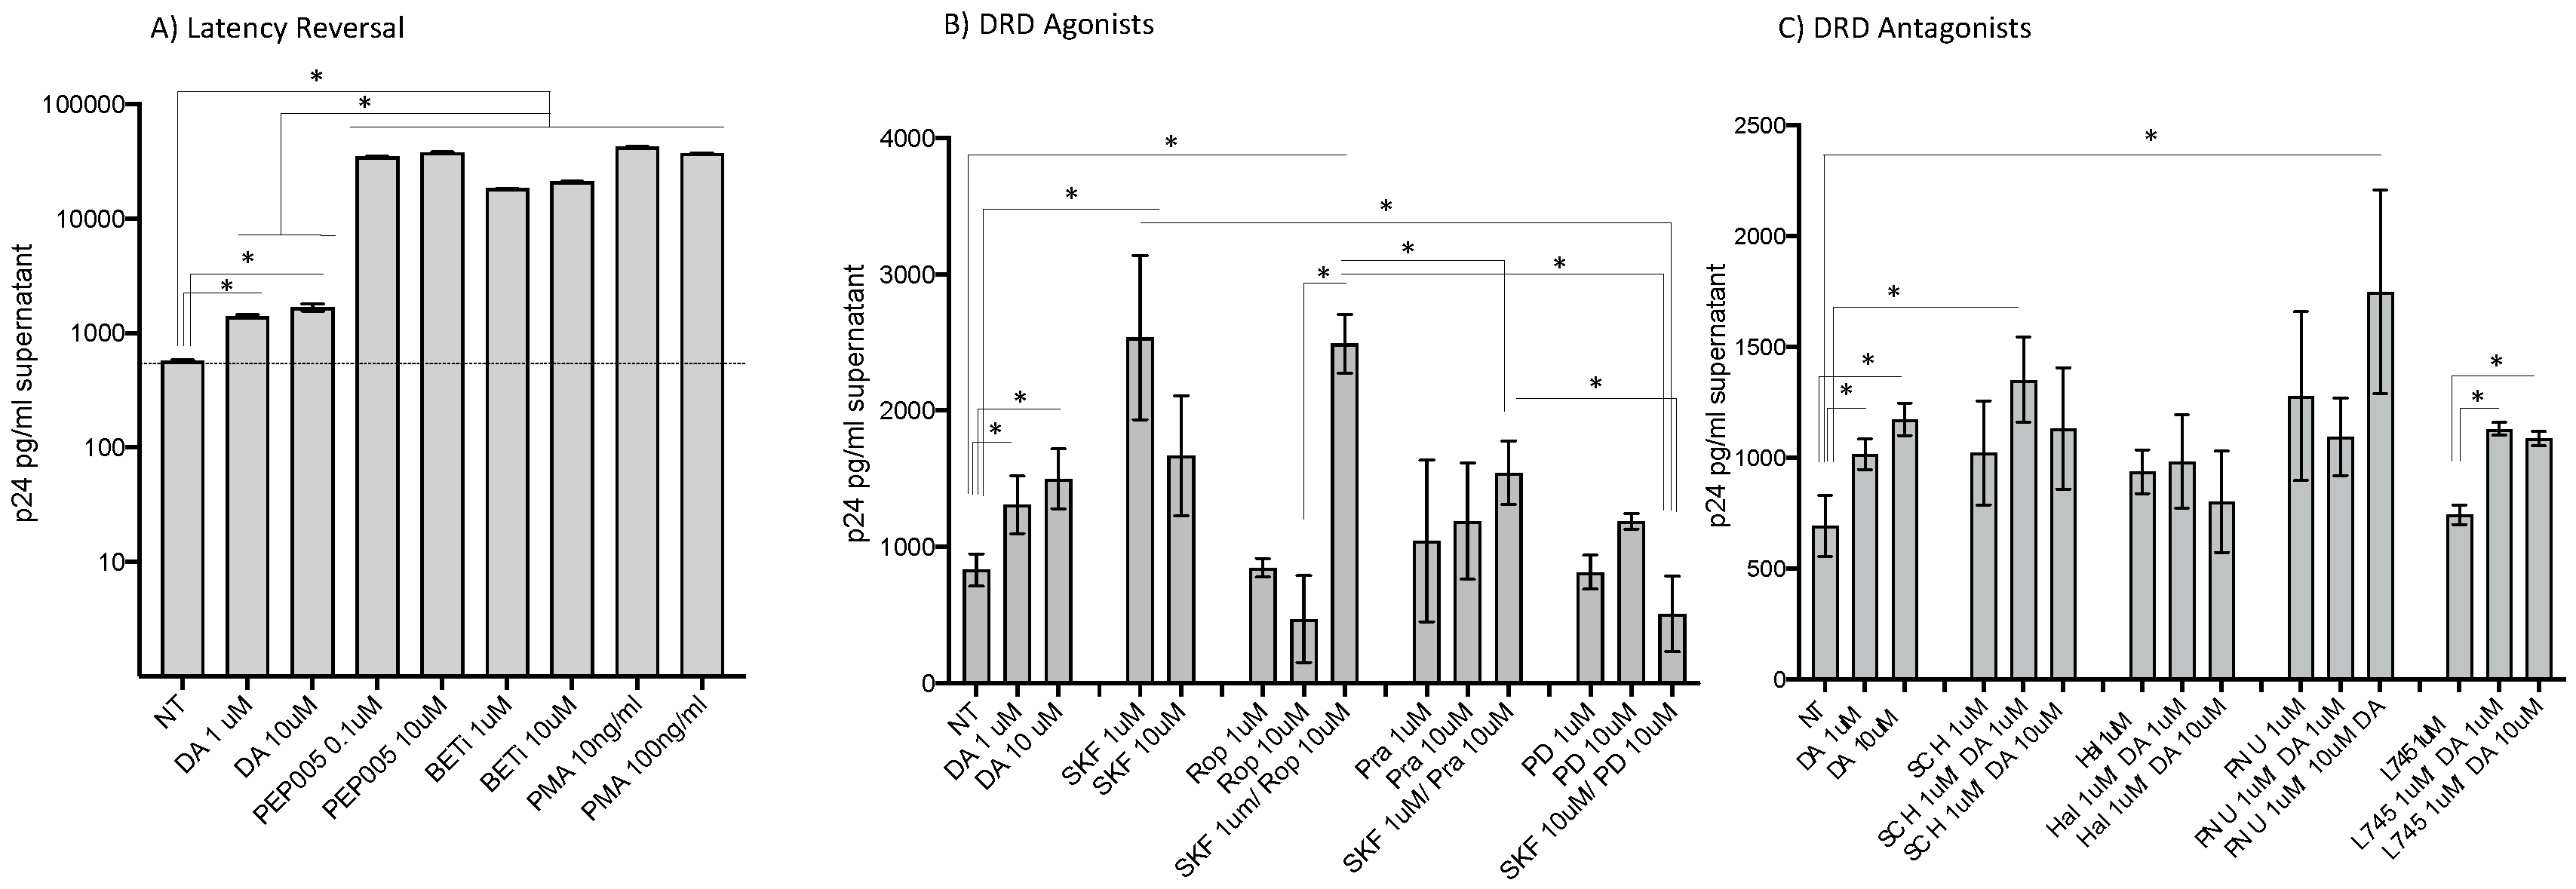
- HIV latency in myeloid cells is partially reverted by DA stimulation via DRD1.
- 2.
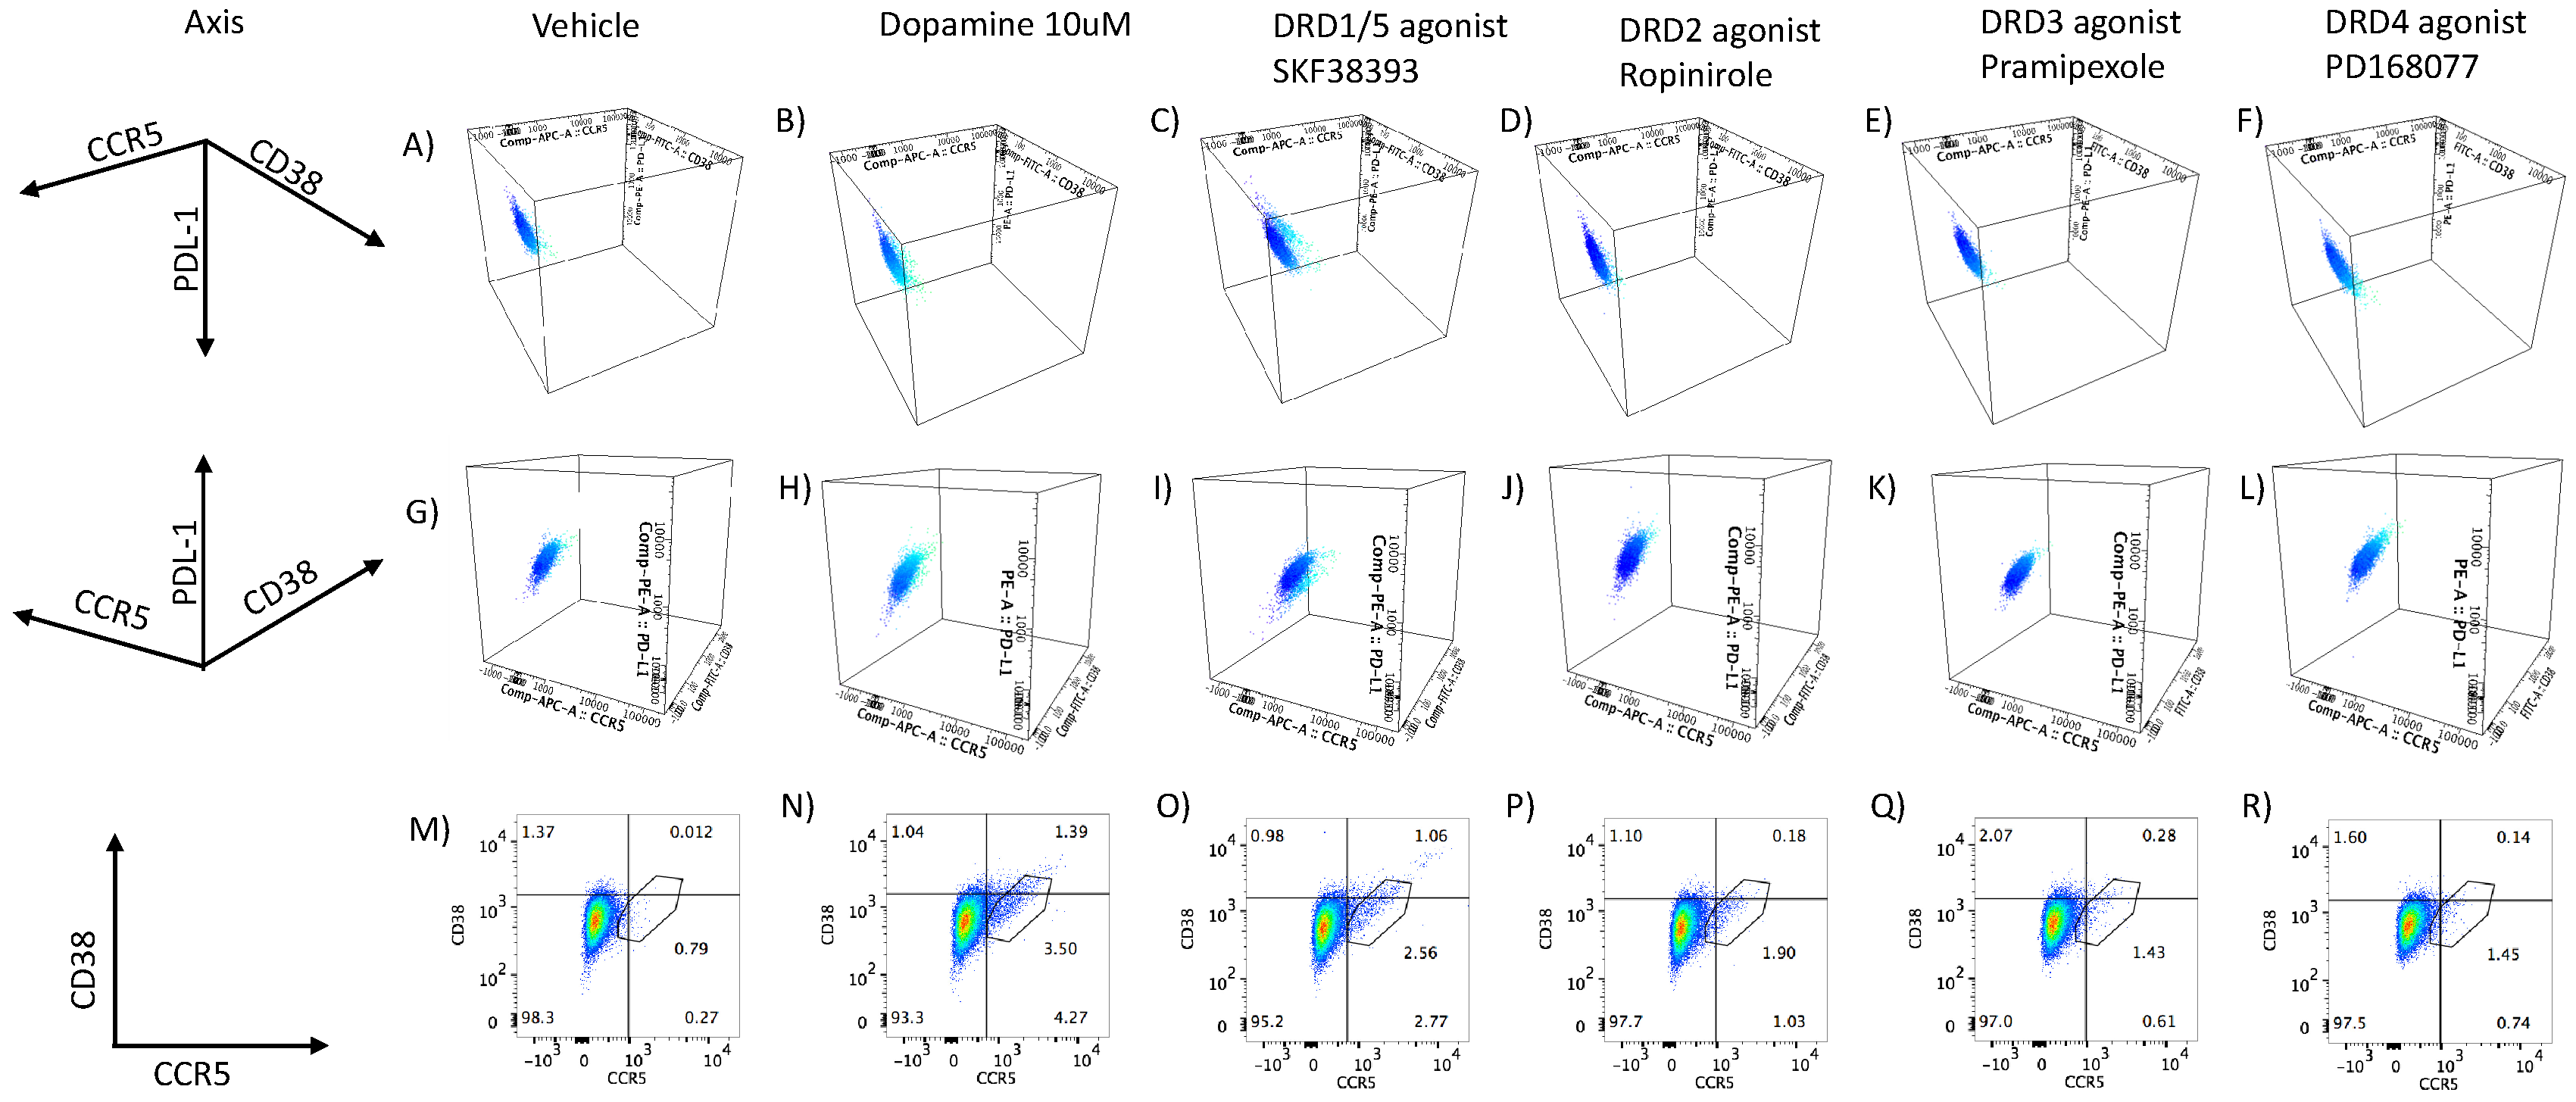
- DA stimulation via DRD1 triggers a novel CD16hi subset and novel transcriptional signatures.

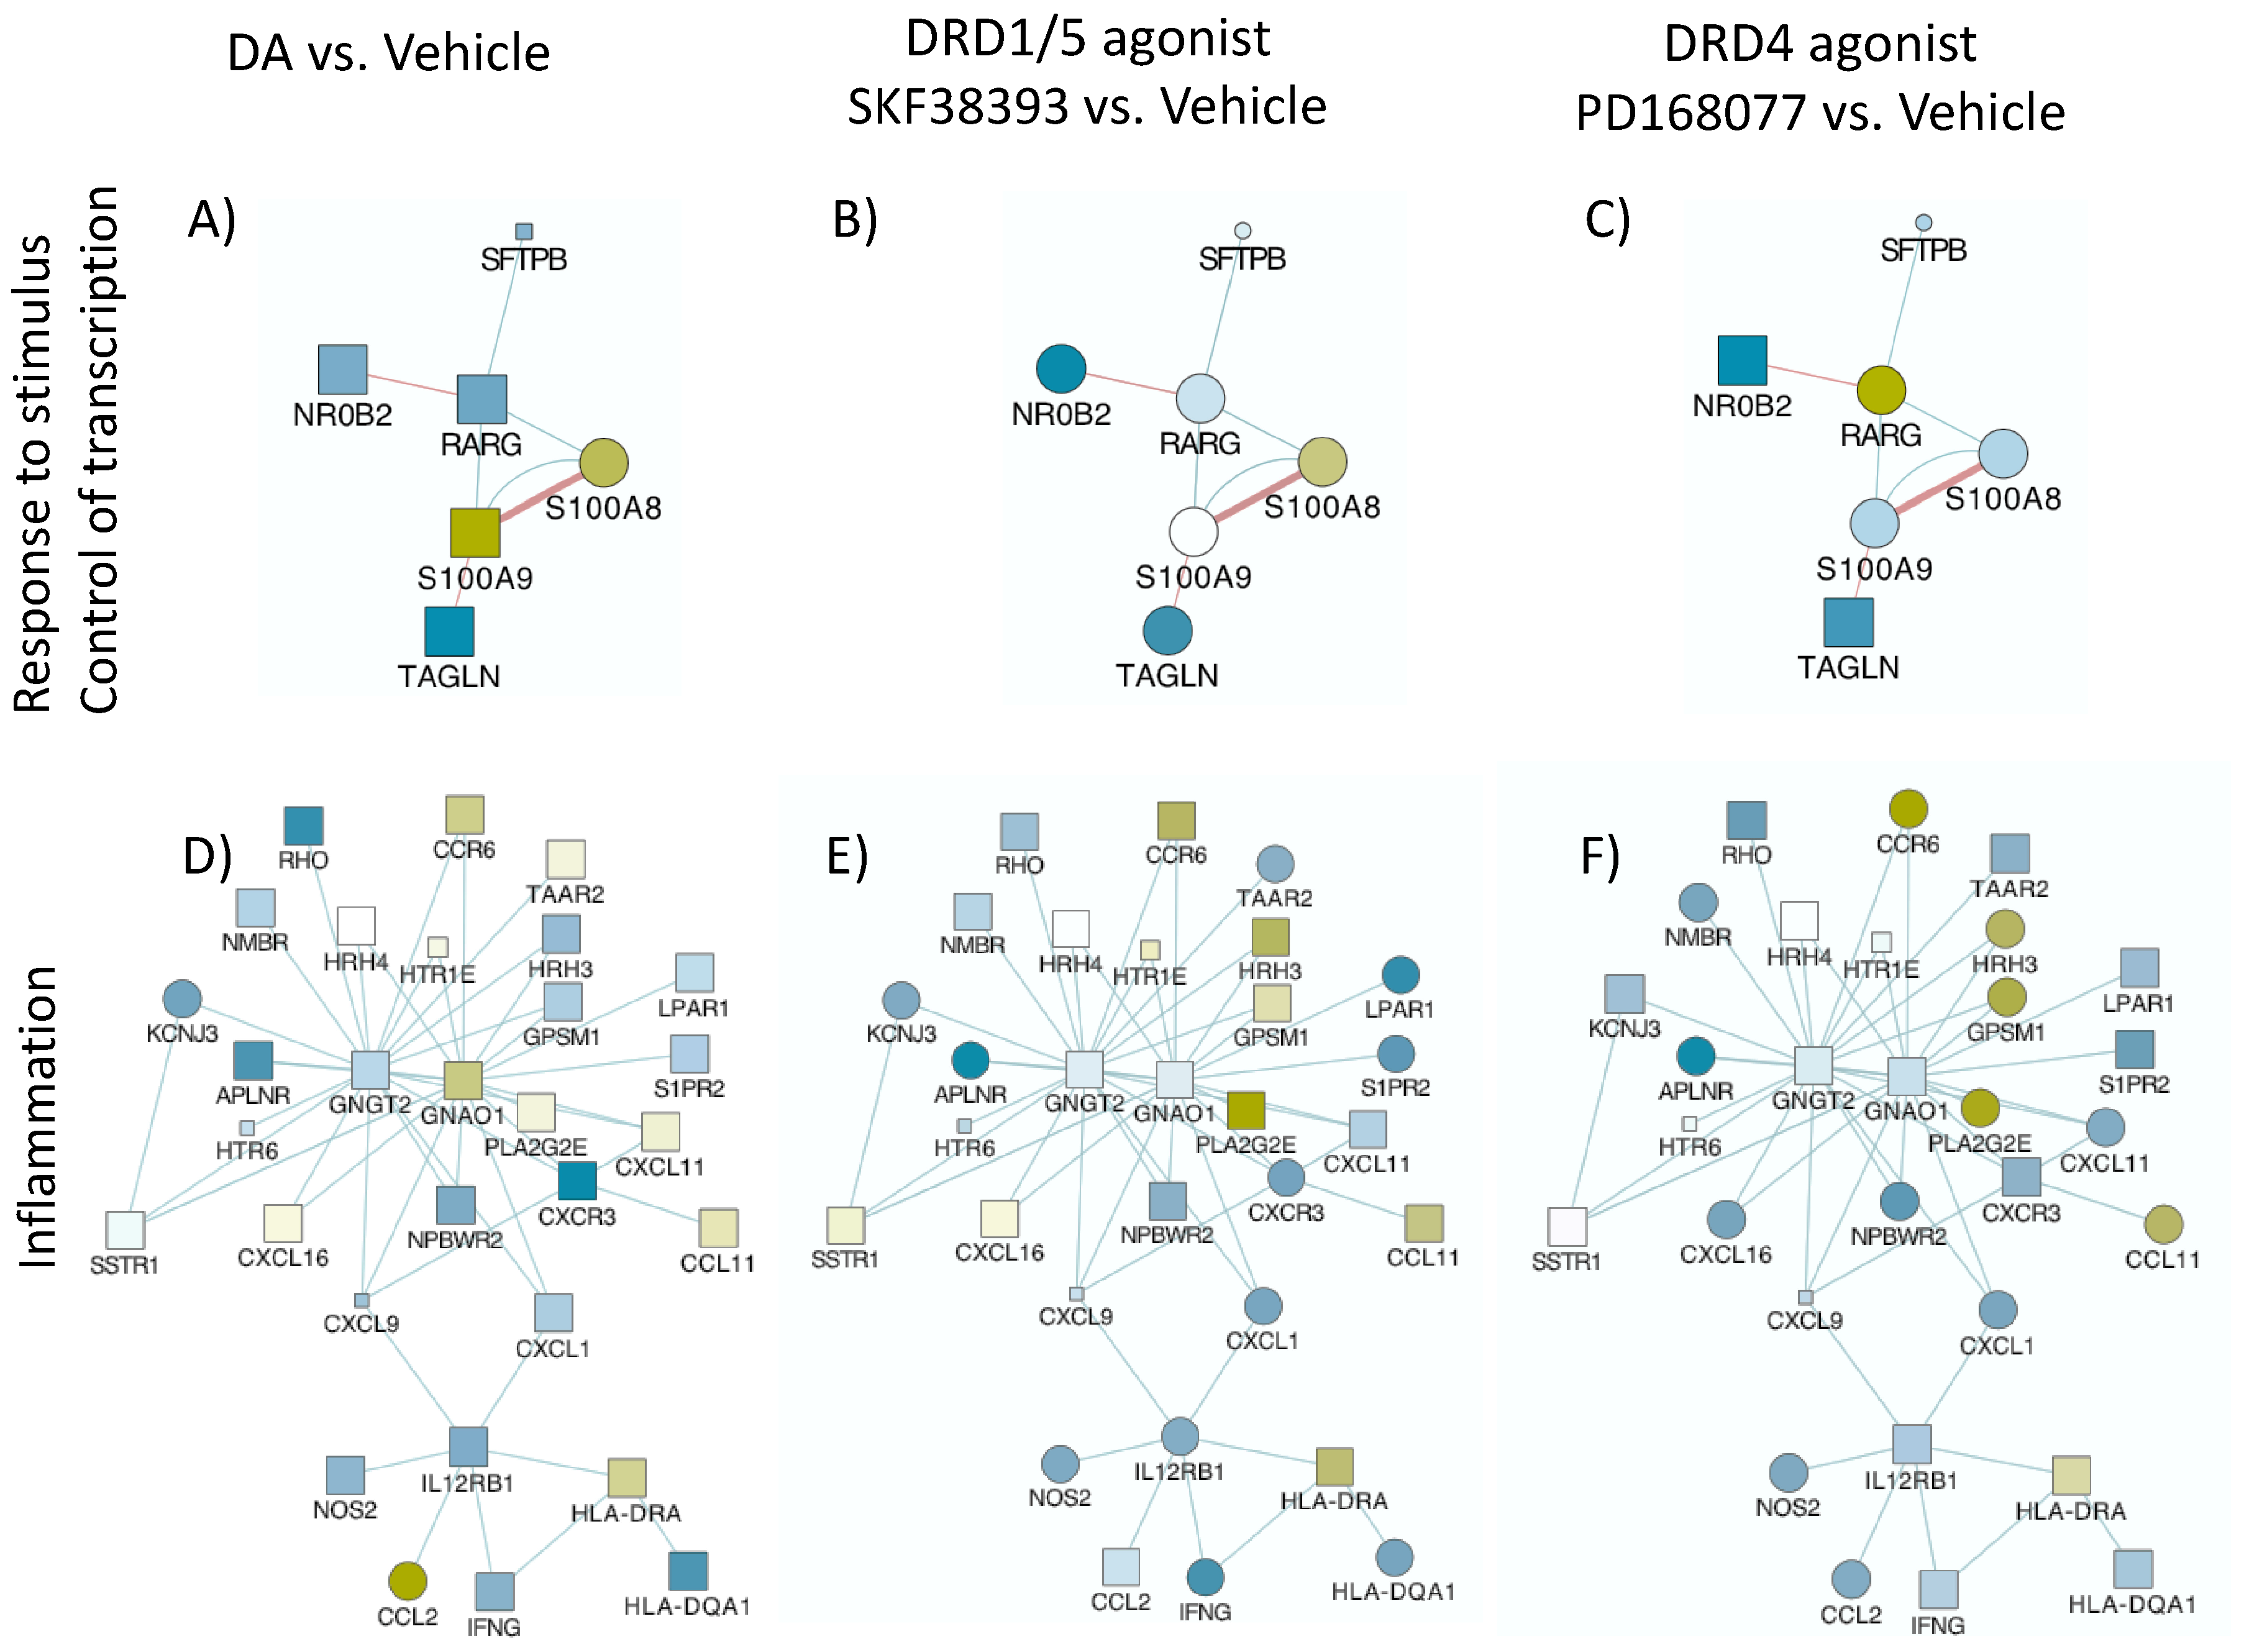
- 3.
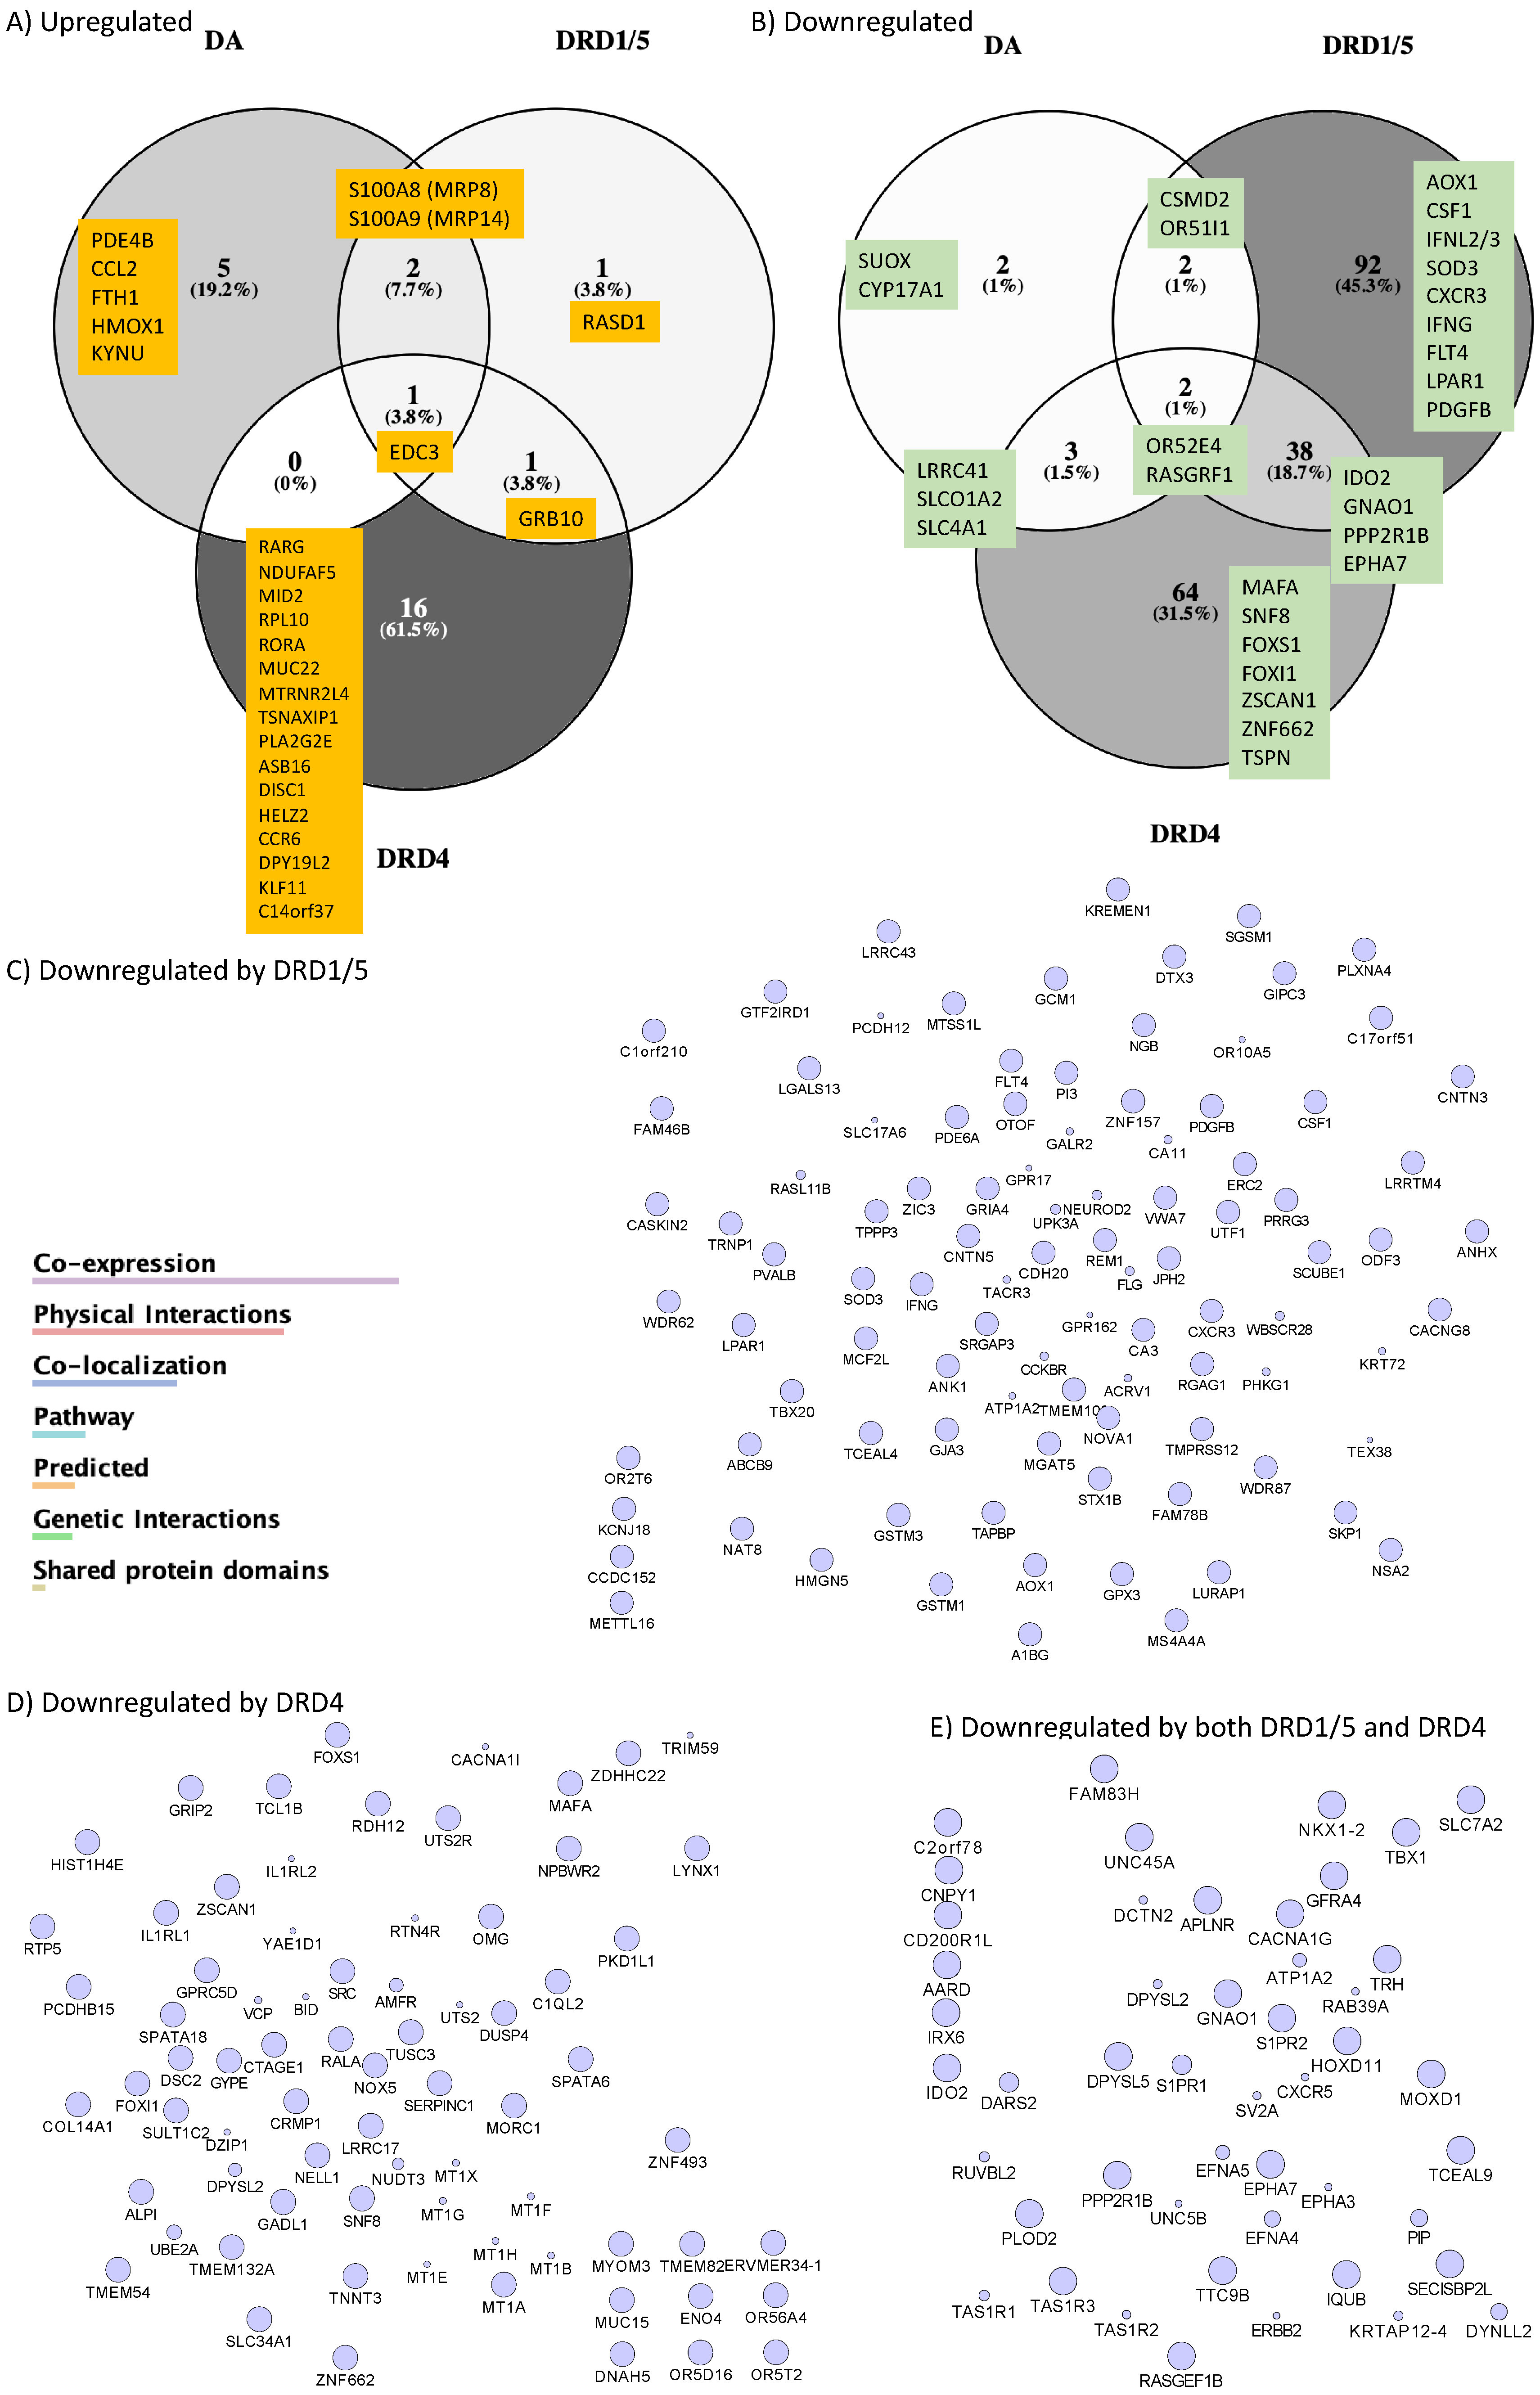
- MRP8 and MRP14 are DA signatures that reverses HIV latency via RAGE
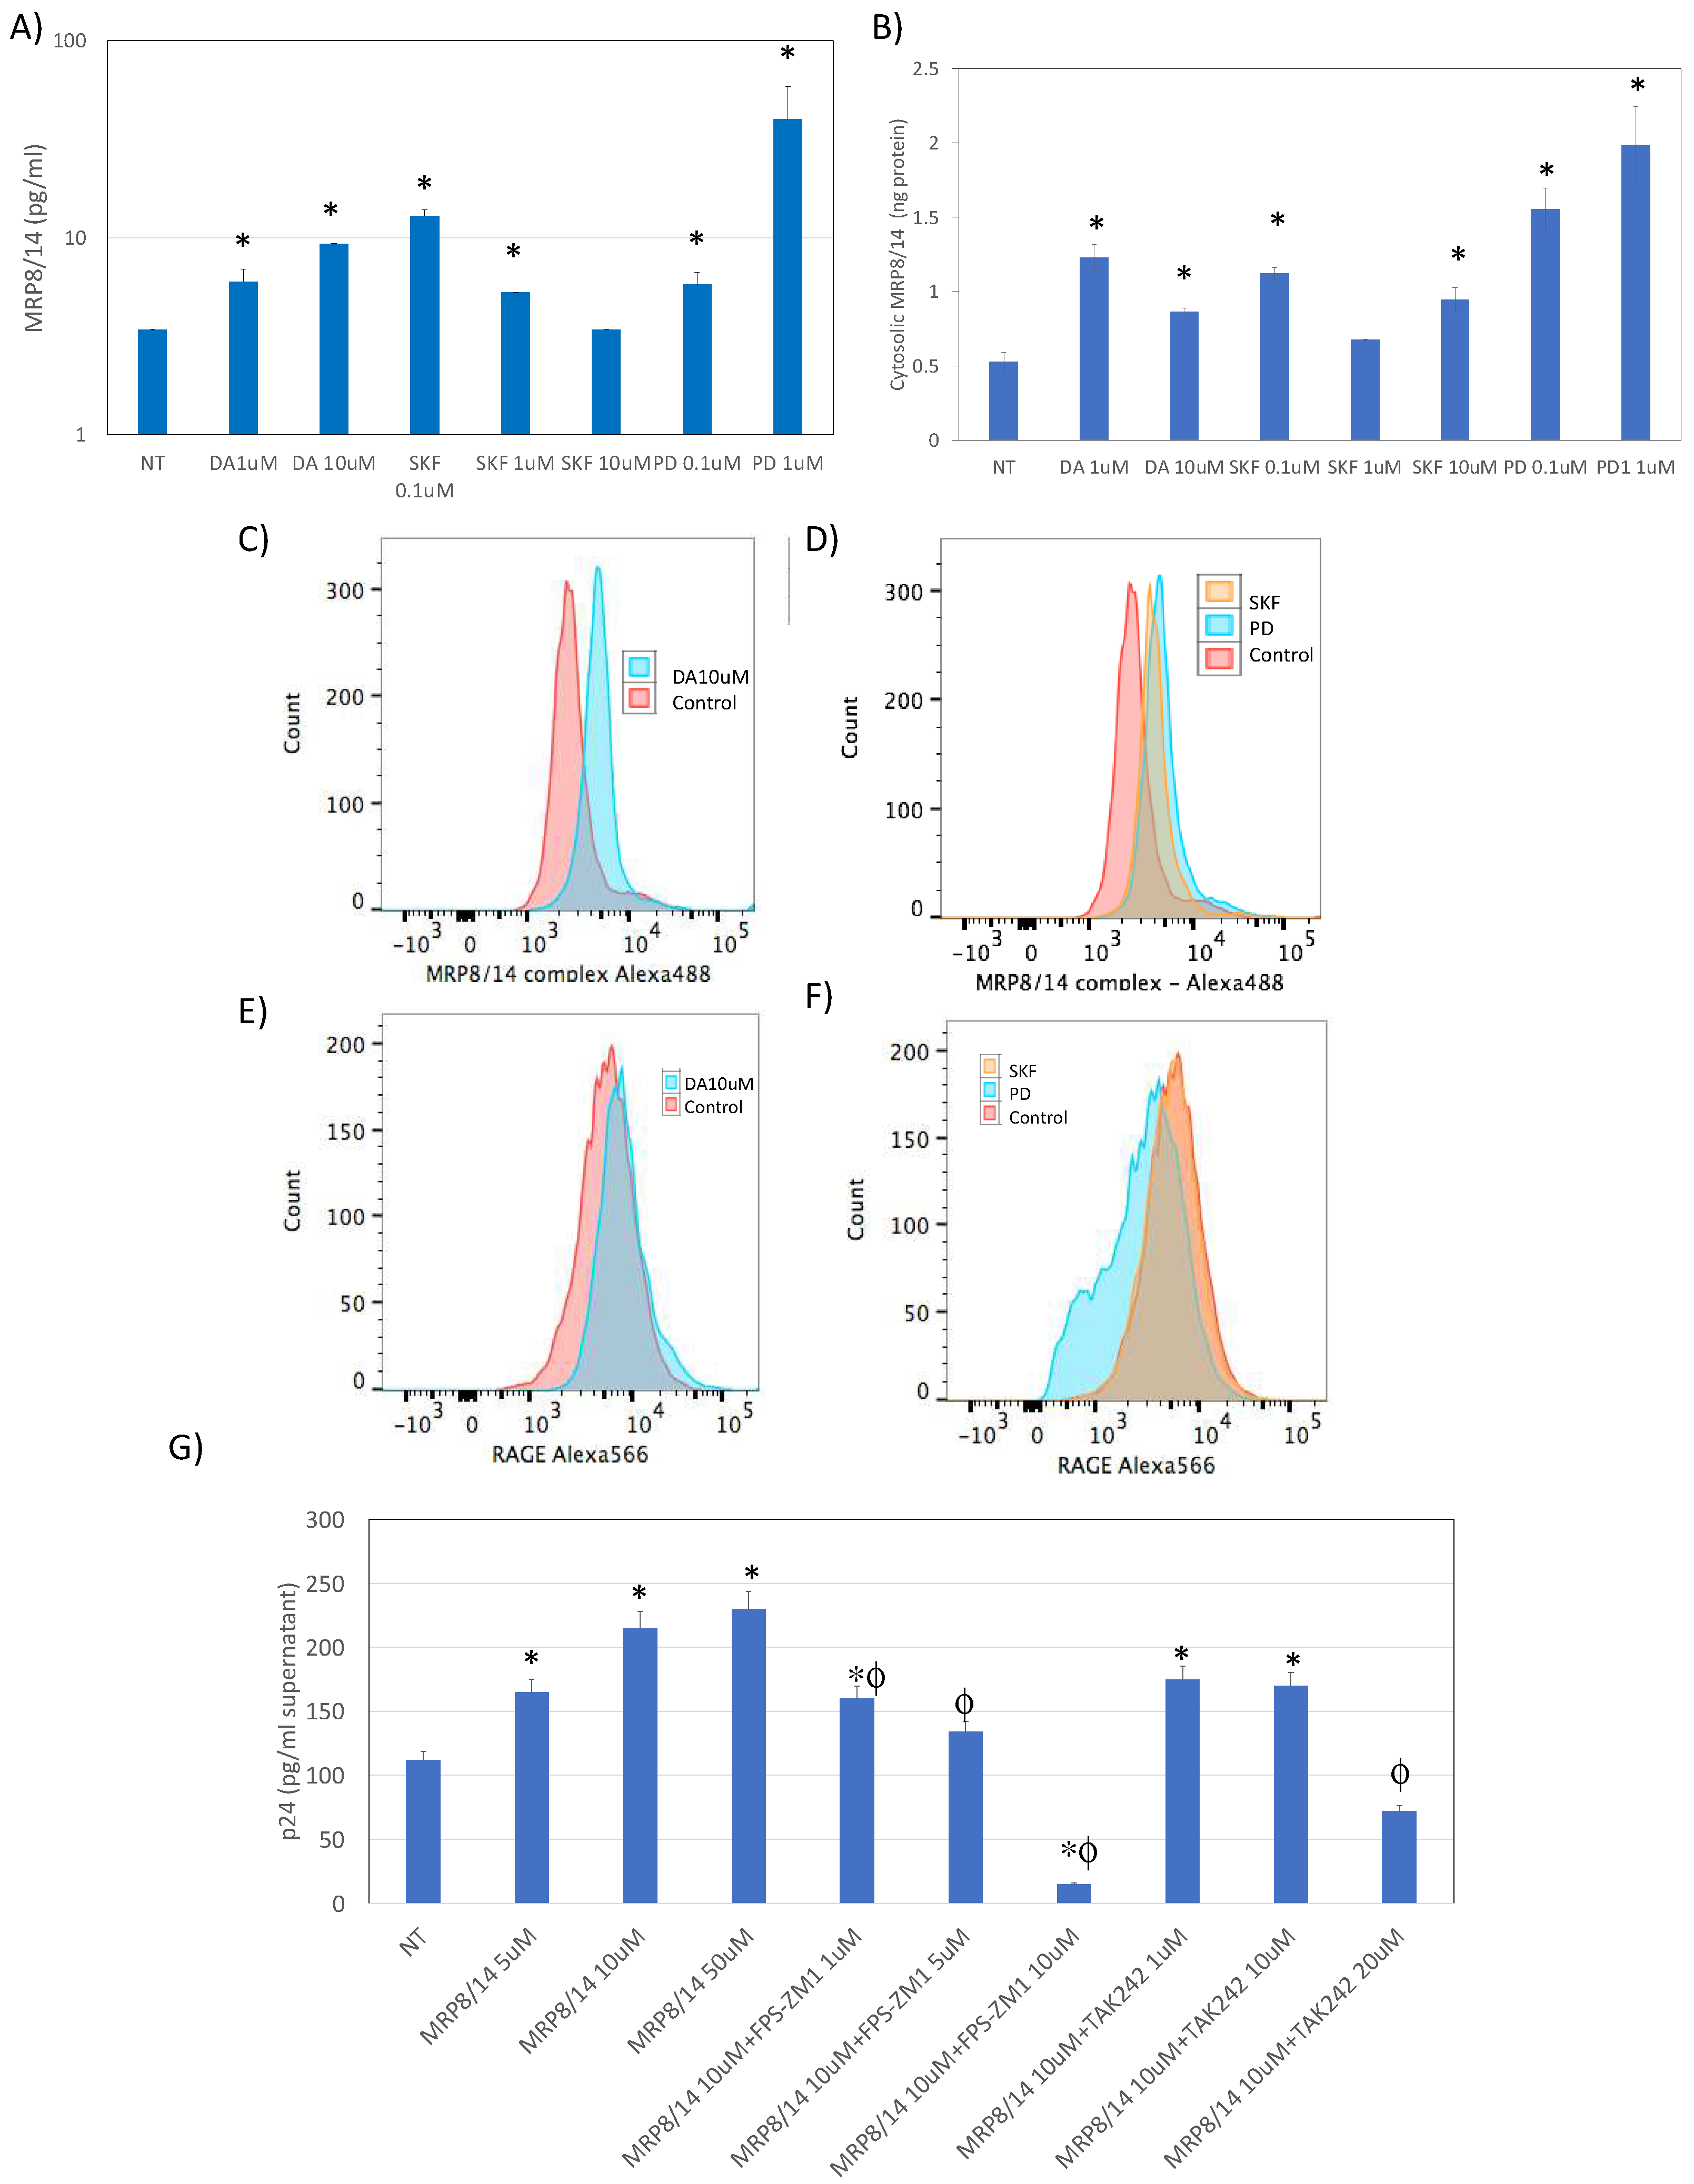
- 4.
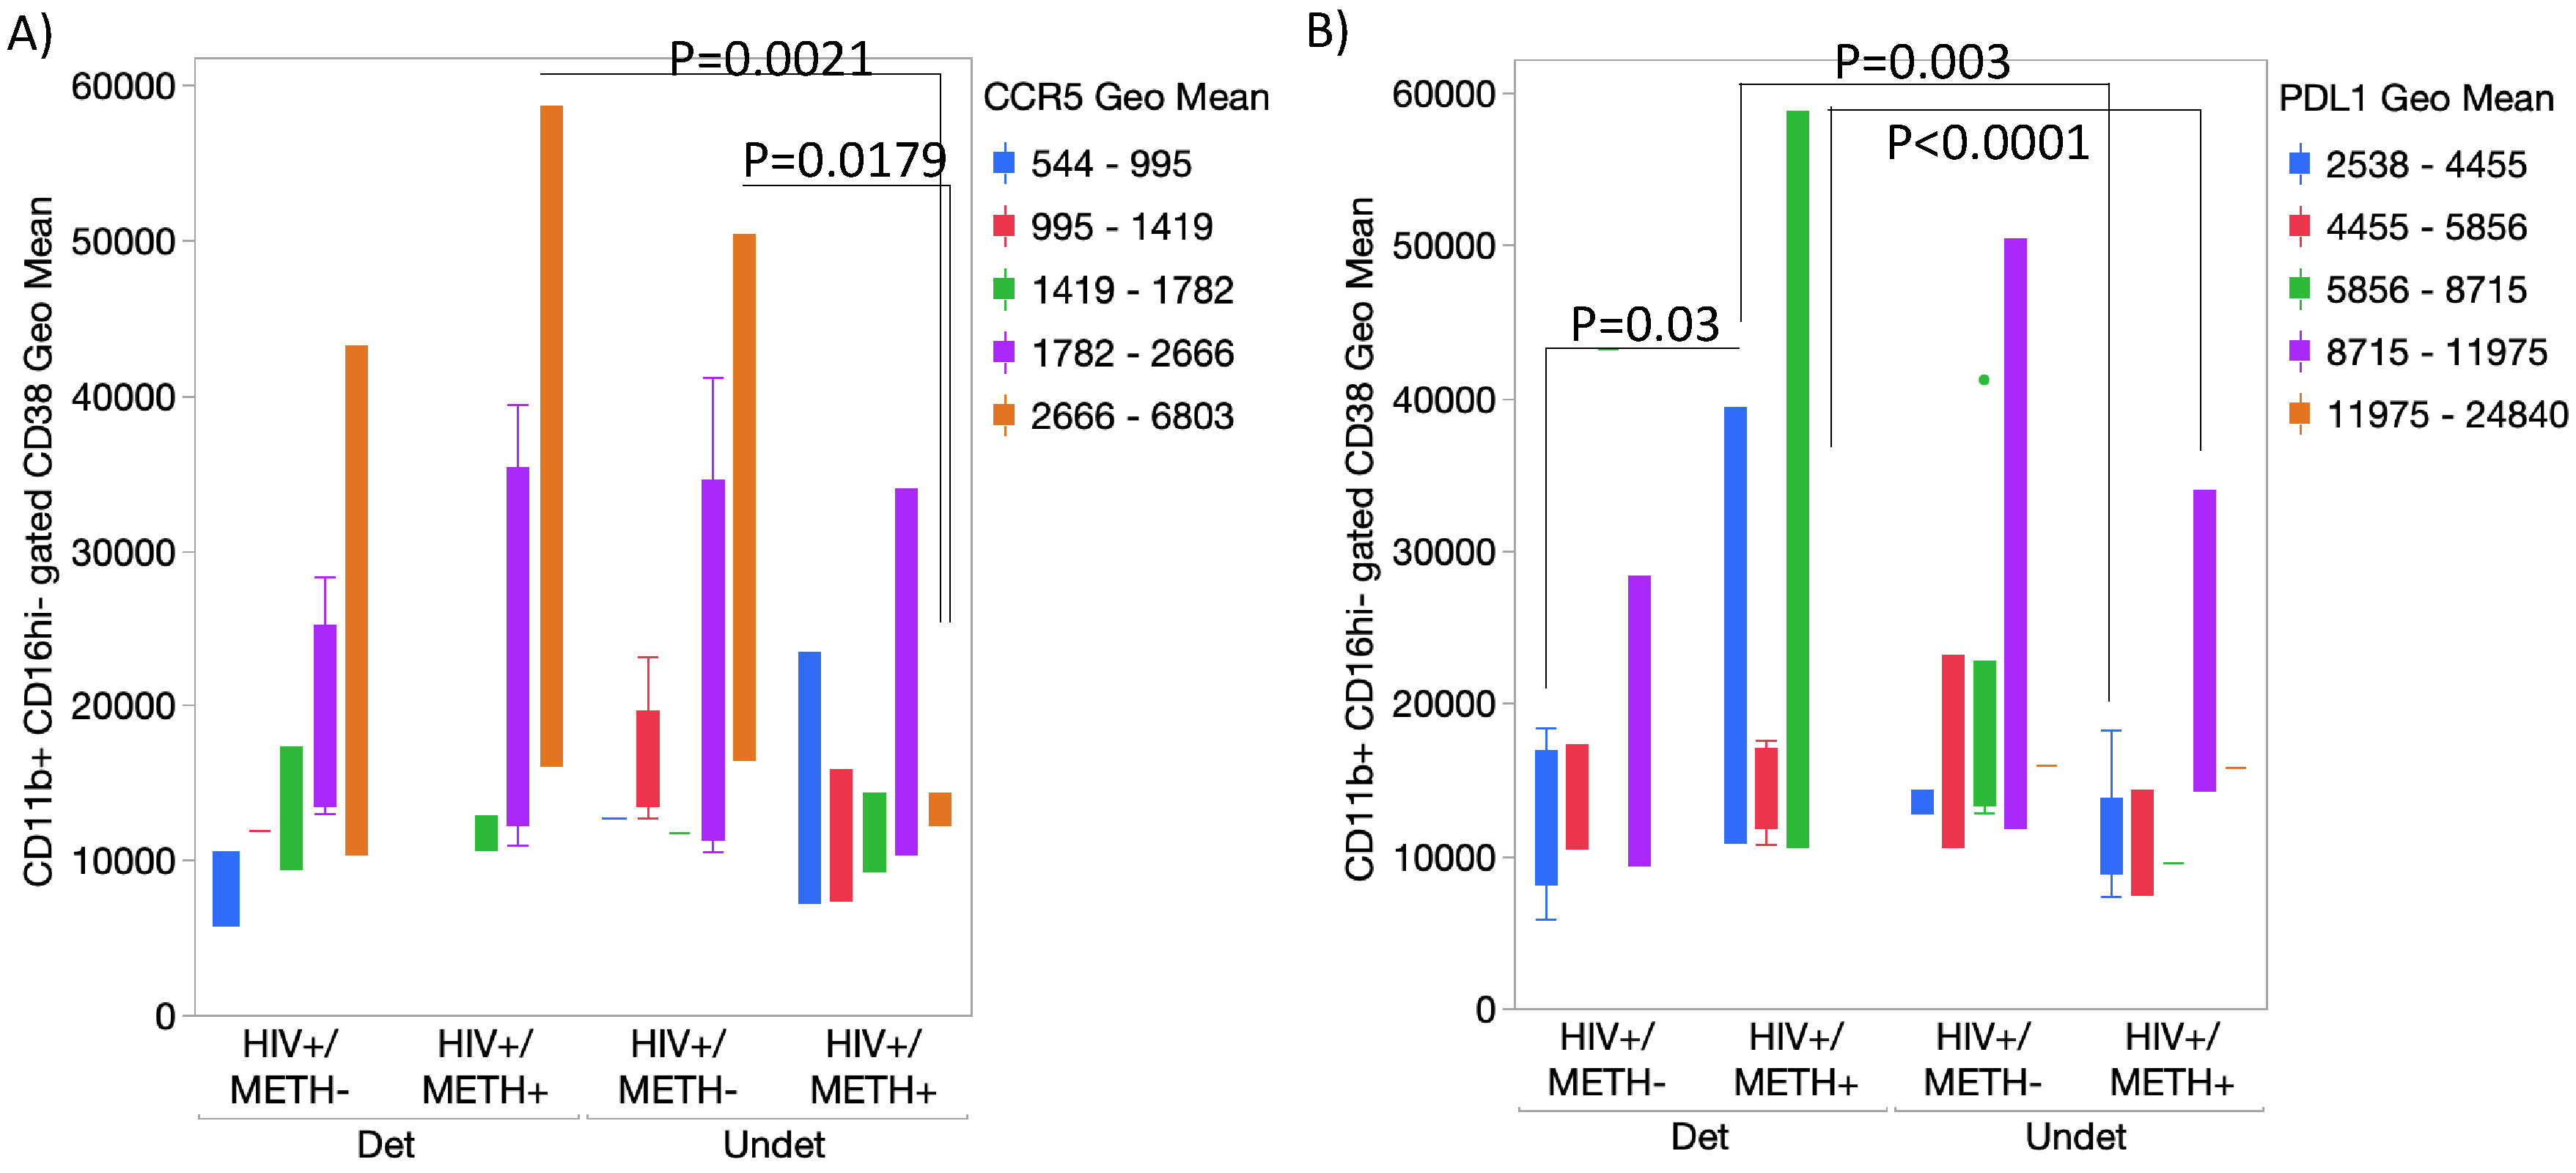
- DA signatures expressed on peripheral innate immune cell surface are biomarkers of HIV infection and detectable CSF viral load in the context of Meth use
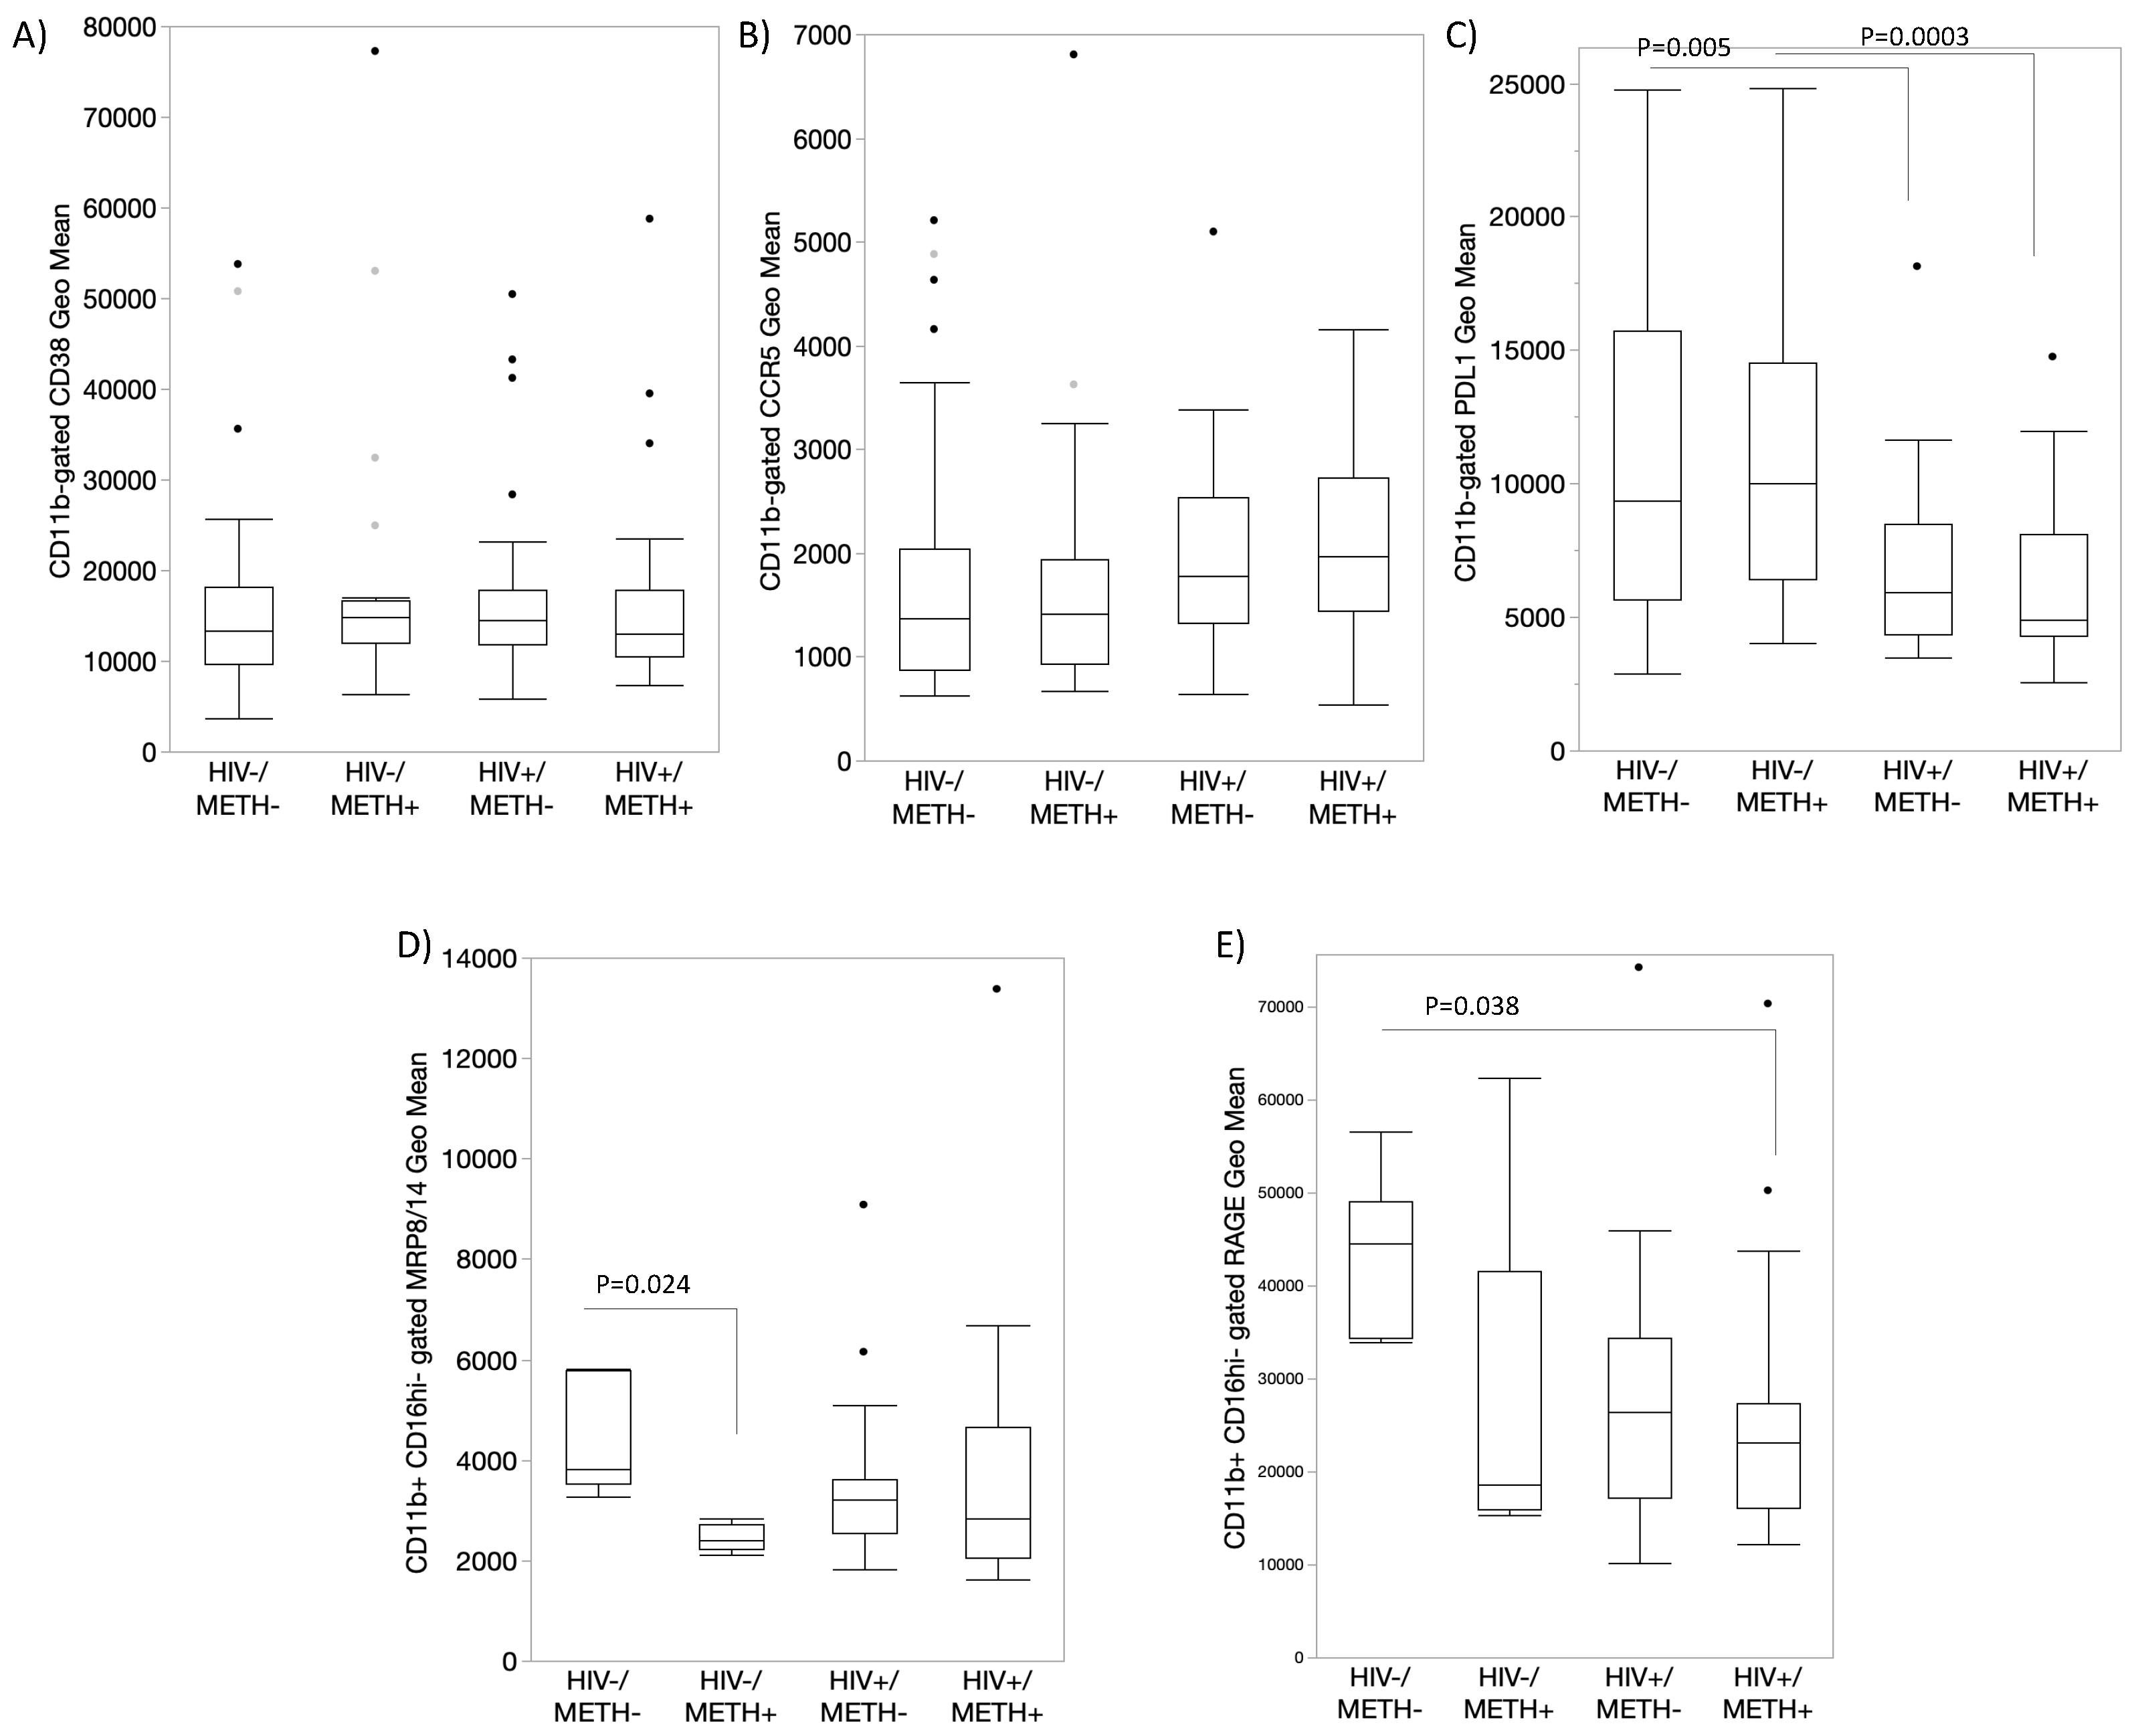
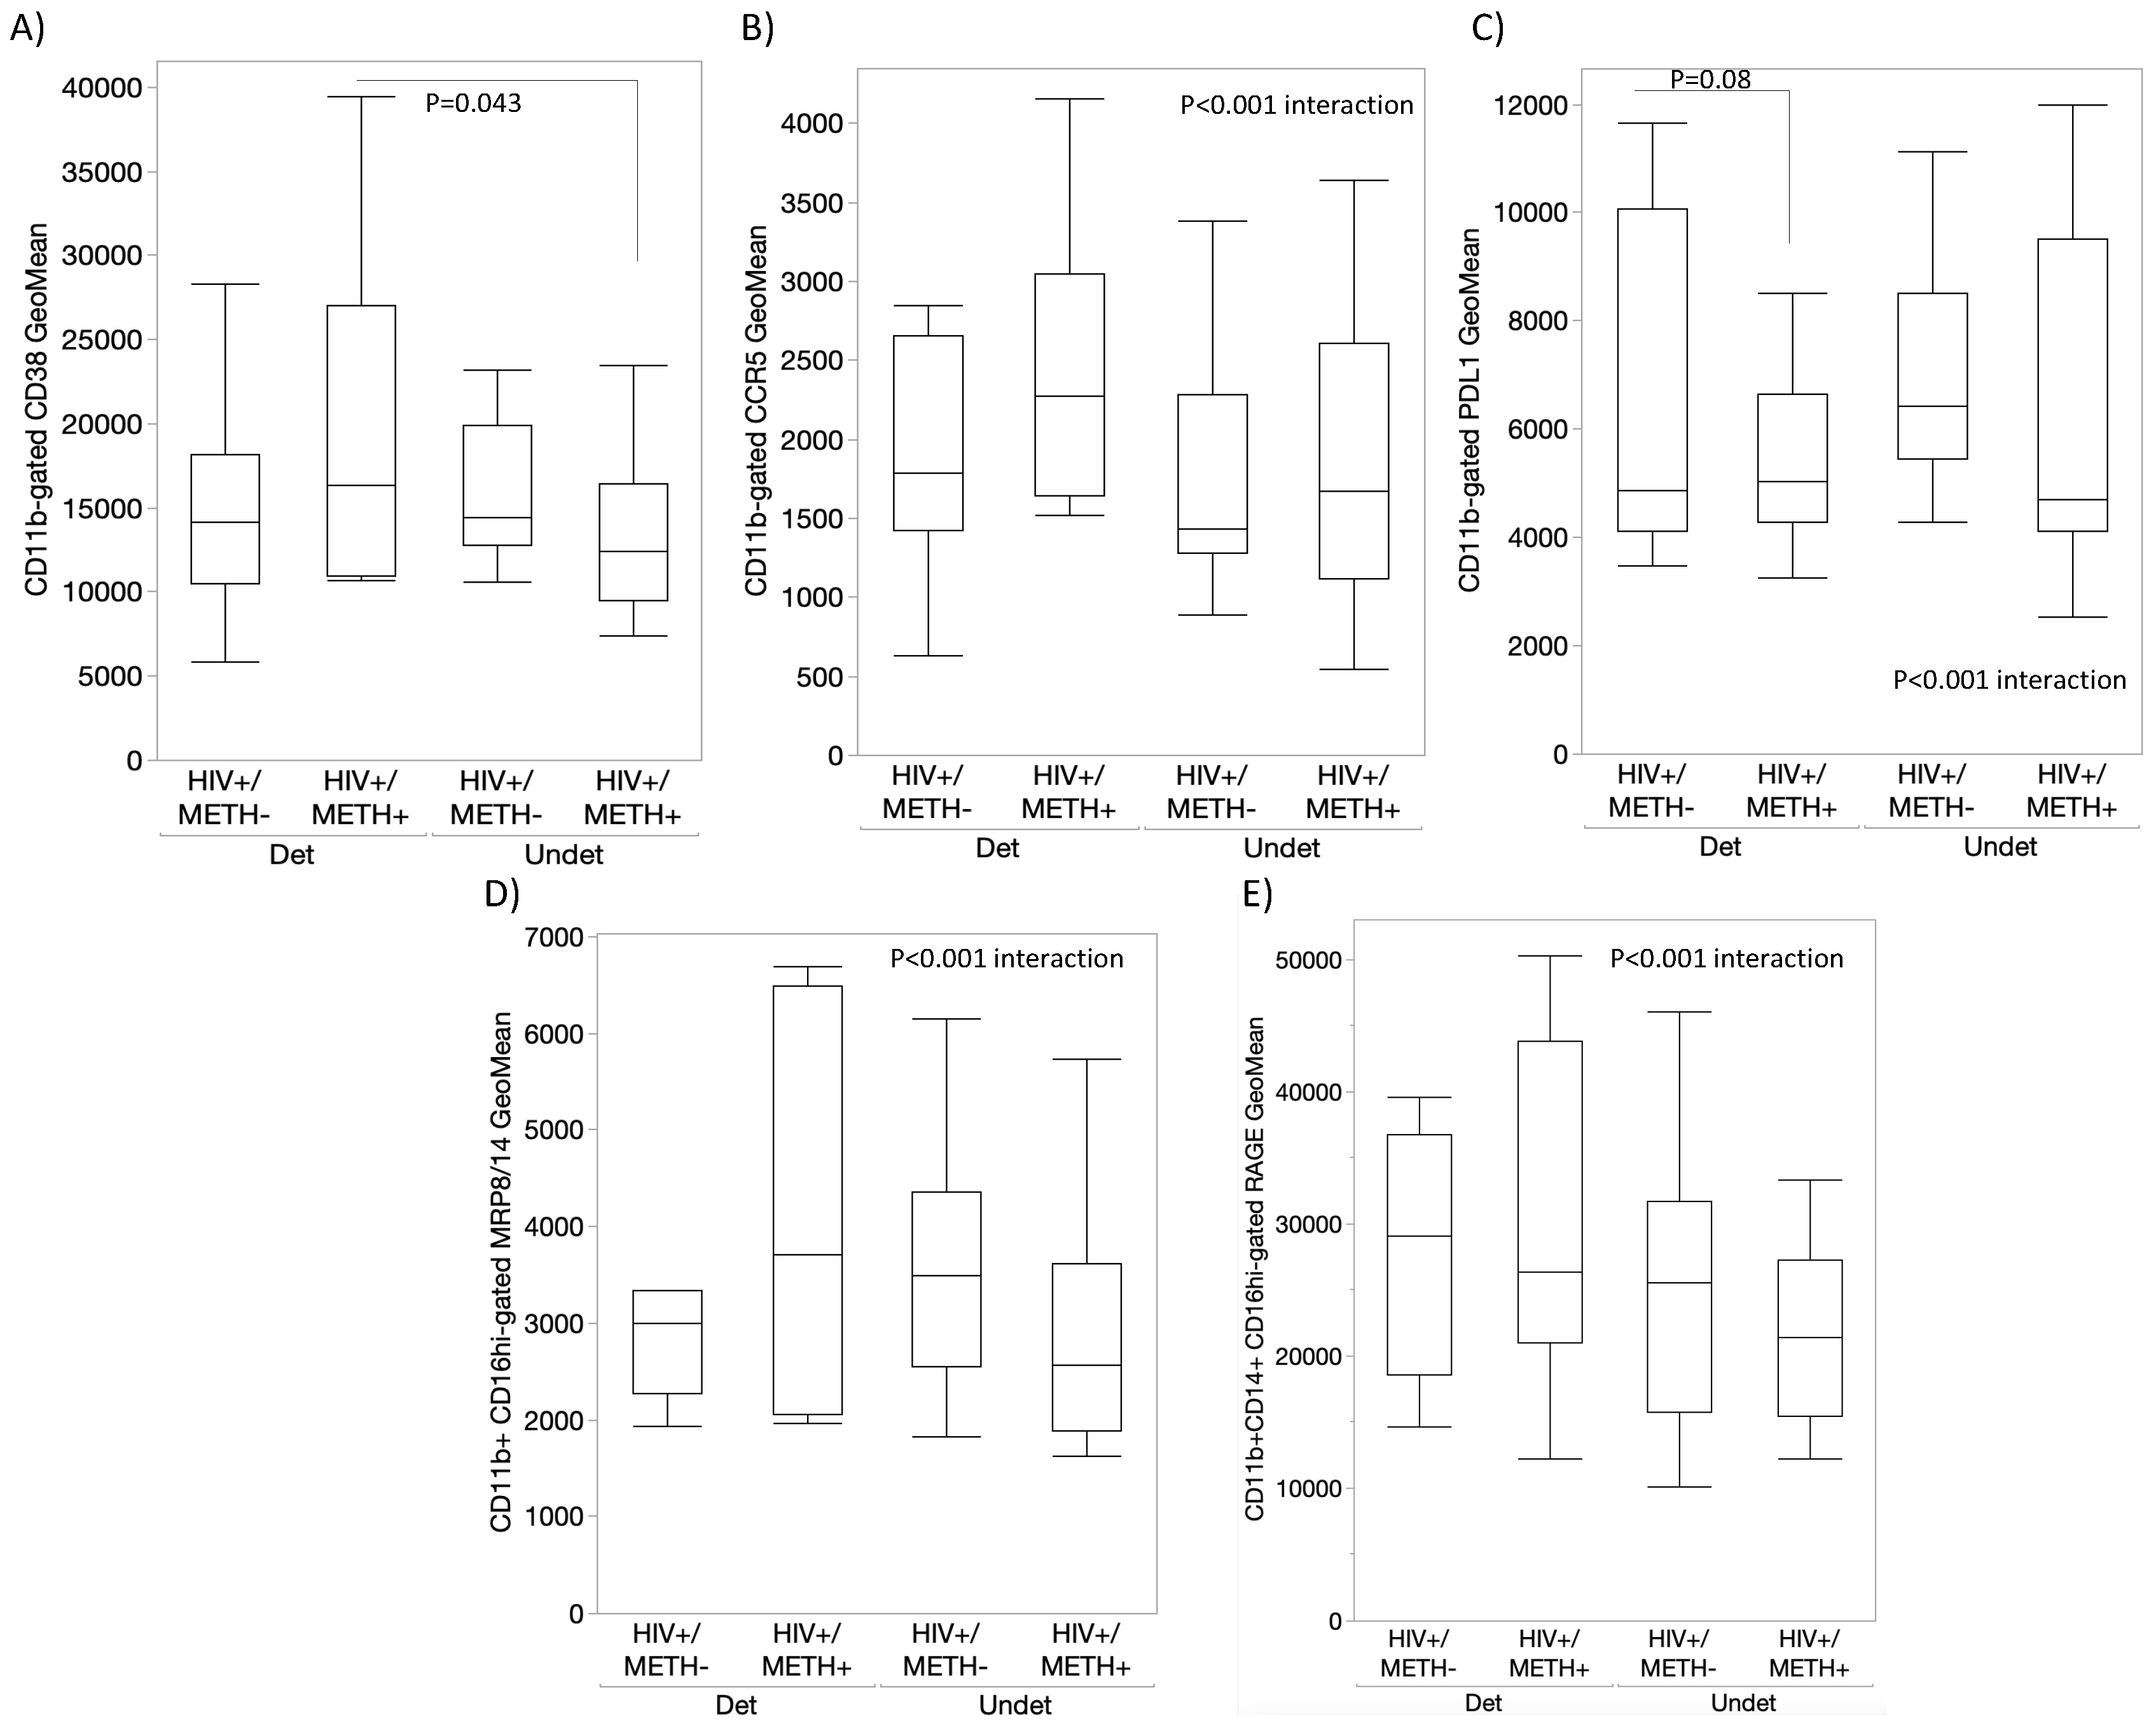
- 5.
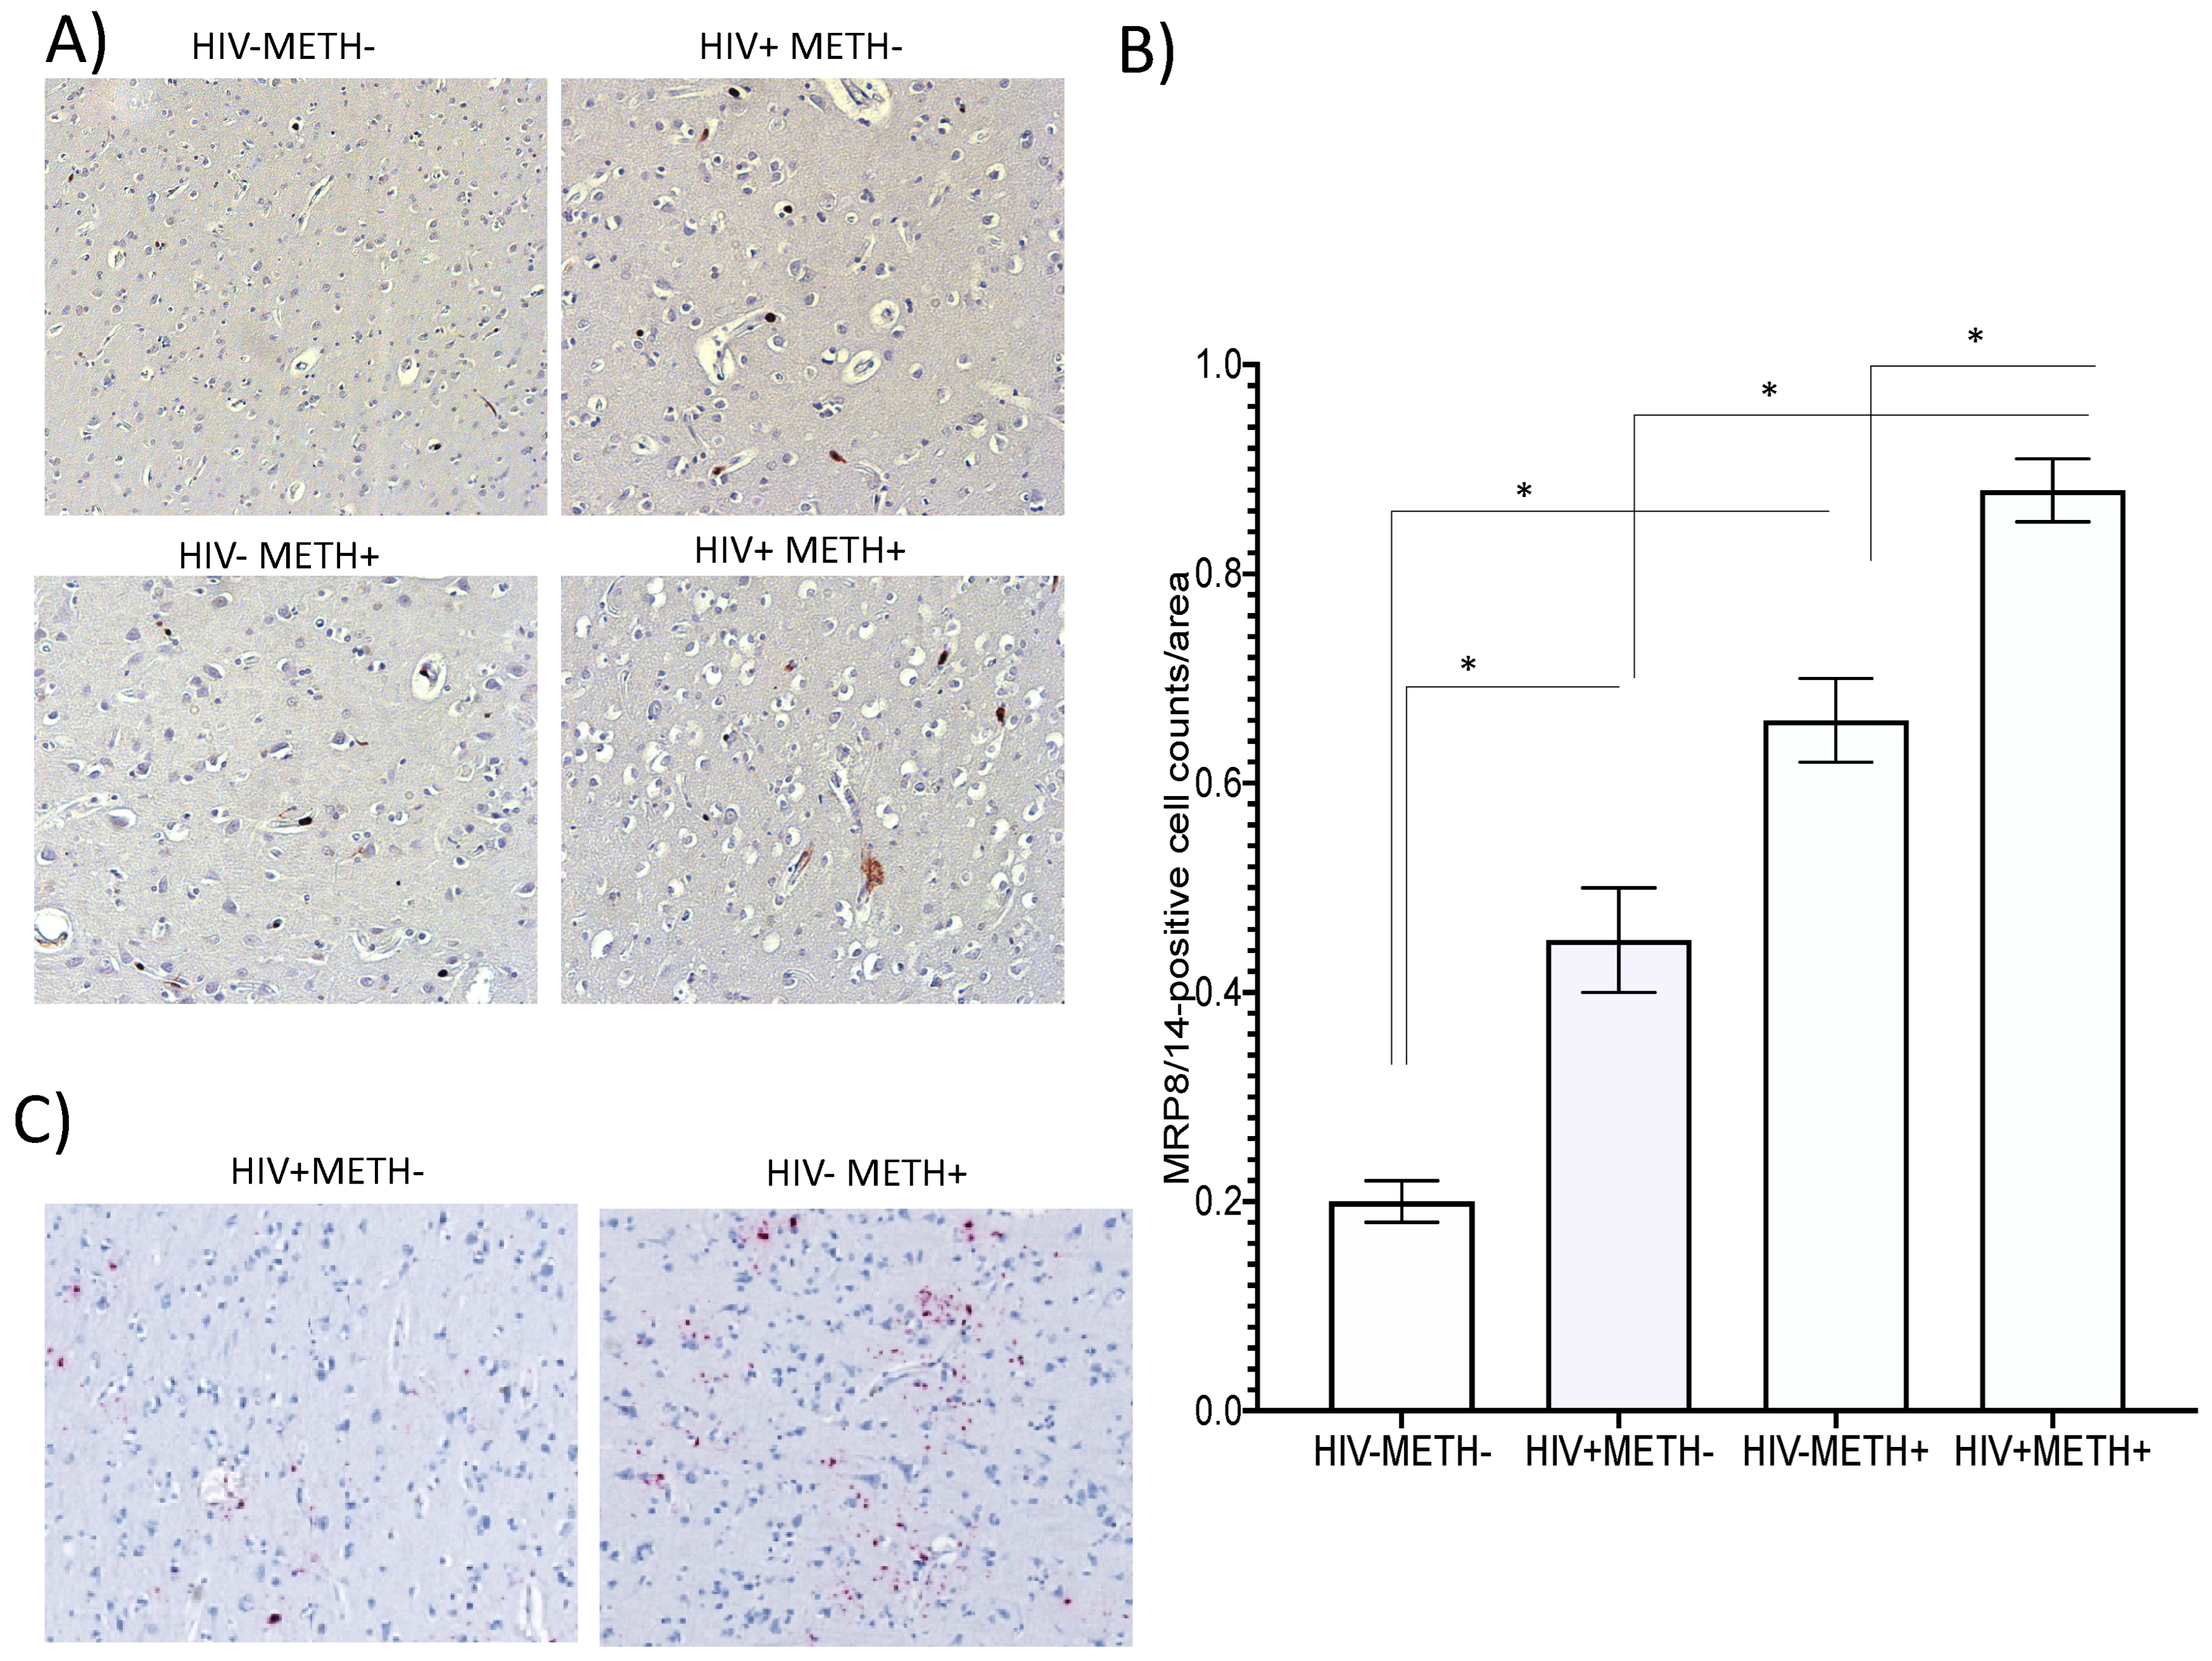
- MRP8/14 and HIV RNA are increased in HIV-infected post-mortem brain specimens in association with Meth use
Discussion
Supplementary Materials
Acknowledgements
References
- Cohn, L. B. et al. HIV-1 integration landscape during latent and active infection. Cell 160, 420-432, doi:10.1016/j.cell.2015.01.020 (2015). [CrossRef]
- Siliciano, J. D. & Siliciano, R. F. The latent reservoir for HIV-1 in resting CD4+ T cells: a barrier to cure. Curr Opin HIV AIDS 1, 121-128, doi:10.1097/01.COH.0000209582.82328.b8 (2006). [CrossRef]
- Siliciano, J. D. et al. Long-term follow-up studies confirm the stability of the latent reservoir for HIV-1 in resting CD4+ T cells. Nat Med 9, 727-728, doi:10.1038/nm880 (2003). [CrossRef]
- Marcondes, M. C., Flynn, C., Watry, D. D., Zandonatti, M. & Fox, H. S. Methamphetamine increases brain viral load and activates natural killer cells in simian immunodeficiency virus-infected monkeys. Am J Pathol 177, 355-361, doi:10.2353/ajpath.2010.090953 (2010). [CrossRef]
- Moore, D. J. et al. Methamphetamine use and neuropsychiatric factors are associated with antiretroviral non-adherence. AIDS Care 24, 1504-1513, doi:10.1080/09540121.2012.672718 (2012). [CrossRef]
- Barton, K., Winckelmann, A. & Palmer, S. HIV-1 Reservoirs During Suppressive Therapy. Trends Microbiol 24, 345-355, doi:10.1016/j.tim.2016.01.006 (2016). [CrossRef]
- Dahl, V. et al. Low levels of HIV-1 RNA detected in the cerebrospinal fluid after up to 10 years of suppressive therapy are associated with local immune activation. AIDS 28, 2251-2258, doi:10.1097/QAD.0000000000000400 (2014). [CrossRef]
- Palmer, S. et al. Low-level viremia persists for at least 7 years in patients on suppressive antiretroviral therapy. Proc Natl Acad Sci U S A 105, 3879-3884, doi:10.1073/pnas.0800050105 (2008). [CrossRef]
- Chun, T. W. et al. Relationship between residual plasma viremia and the size of HIV proviral DNA reservoirs in infected individuals receiving effective antiretroviral therapy. J Infect Dis 204, 135-138, doi:10.1093/infdis/jir208 (2011). [CrossRef]
- Chun, T. W. et al. Relationship between pre-existing viral reservoirs and the re-emergence of plasma viremia after discontinuation of highly active anti-retroviral therapy. Nat Med 6, 757-761, doi:10.1038/77481 (2000). [CrossRef]
- Papasavvas, E. et al. Randomized, controlled trial of therapy interruption in chronic HIV-1 infection. PLoS Med 1, e64, doi:10.1371/journal.pmed.0010064 (2004). [CrossRef]
- Orenstein, J. M. et al. Rapid activation of lymph nodes and mononuclear cell HIV expression upon interrupting highly active antiretroviral therapy in patients after prolonged viral suppression. AIDS 14, 1709-1715, doi:10.1097/00002030-200008180-00004 (2000). [CrossRef]
- Churchill, M. J. et al. Use of laser capture microdissection to detect integrated HIV-1 DNA in macrophages and astrocytes from autopsy brain tissues. J Neurovirol 12, 146-152, doi:10.1080/13550280600748946 (2006). [CrossRef]
- Barber, S. A. et al. Mechanism for the establishment of transcriptional HIV latency in the brain in a simian immunodeficiency virus-macaque model. J Infect Dis 193, 963-970, doi:10.1086/500983 (2006). [CrossRef]
- Cosenza, M. A., Zhao, M. L., Si, Q. & Lee, S. C. Human brain parenchymal microglia express CD14 and CD45 and are productively infected by HIV-1 in HIV-1 encephalitis. Brain Pathol 12, 442-455, doi:10.1111/j.1750-3639.2002.tb00461.x (2002). [CrossRef]
- Crowe, S., Zhu, T. & Muller, W. A. The contribution of monocyte infection and trafficking to viral persistence, and maintenance of the viral reservoir in HIV infection. J Leukoc Biol 74, 635-641, doi:10.1189/jlb.0503204 (2003). [CrossRef]
- Dubois-Dalcq, M. E., Jordan, C. A., Kelly, W. B. & Watkins, B. A. Understanding HIV-1 infection of the brain: a challenge for neurobiologists. AIDS 4 Suppl 1, S67-76 (1990).
- Watkins, B. A. et al. Specific tropism of HIV-1 for microglial cells in primary human brain cultures. Science 249, 549-553, doi:10.1126/science.2200125 (1990). [CrossRef]
- Wiley, C. A., Schrier, R. D., Nelson, J. A., Lampert, P. W. & Oldstone, M. B. Cellular localization of human immunodeficiency virus infection within the brains of acquired immune deficiency syndrome patients. Proc Natl Acad Sci U S A 83, 7089-7093, doi:10.1073/pnas.83.18.7089 (1986). [CrossRef]
- Zink, M. C. et al. Simian immunodeficiency virus-infected macaques treated with highly active antiretroviral therapy have reduced central nervous system viral replication and inflammation but persistence of viral DNA. J Infect Dis 202, 161-170, doi:10.1086/653213 (2010). [CrossRef]
- McFadden, L. M., Cordie, R., Livermont, T. & Johansen, A. Behavioral and Serotonergic Changes in the Frontal Cortex Following Methamphetamine Self-Administration. Int J Neuropsychopharmacol 21, 758-763, doi:10.1093/ijnp/pyy044 (2018). [CrossRef]
- McFadden, L. M. & Vieira-Brock, P. L. The Persistent Neurotoxic Effects of Methamphetamine on Dopaminergic and Serotonergic Markers in Male and Female Rats. Toxicol Open Access 2, doi:10.4172/2476-2067.1000116 (2016). [CrossRef]
- McFadden, L. M., Vieira-Brock, P. L., Hanson, G. R. & Fleckenstein, A. E. Prior methamphetamine self-administration attenuates the dopaminergic deficits caused by a subsequent methamphetamine exposure. Neuropharmacology 93, 146-154, doi:10.1016/j.neuropharm.2015.01.013 (2015). [CrossRef]
- Calipari, E. S., Ferris, M. J., Siciliano, C. A. & Jones, S. R. Differential influence of dopamine transport rate on the potencies of cocaine, amphetamine, and methylphenidate. ACS Chem Neurosci 6, 155-162, doi:10.1021/cn500262x (2015). [CrossRef]
- Siciliano, C. A., Calipari, E. S., Ferris, M. J. & Jones, S. R. Adaptations of presynaptic dopamine terminals induced by psychostimulant self-administration. ACS Chem Neurosci 6, 27-36, doi:10.1021/cn5002705 (2015). [CrossRef]
- Chu, P. W. et al. Differential regional effects of methamphetamine on dopamine transport. Eur J Pharmacol 590, 105-110, doi:10.1016/j.ejphar.2008.05.028 (2008). [CrossRef]
- Hanson, J. E. et al. Methamphetamine-induced dopaminergic deficits and refractoriness to subsequent treatment. Eur J Pharmacol 607, 68-73, doi:10.1016/j.ejphar.2009.01.037 (2009). [CrossRef]
- Eshleman, A. J., Henningsen, R. A., Neve, K. A. & Janowsky, A. Release of dopamine via the human transporter. Mol Pharmacol 45, 312-316 (1994).
- Han, D. D. & Gu, H. H. Comparison of the monoamine transporters from human and mouse in their sensitivities to psychostimulant drugs. BMC Pharmacol 6, 6, doi:10.1186/1471-2210-6-6 (2006). [CrossRef]
- Jones, S. R. et al. Profound neuronal plasticity in response to inactivation of the dopamine transporter. Proc Natl Acad Sci U S A 95, 4029-4034, doi:10.1073/pnas.95.7.4029 (1998). [CrossRef]
- Jones, S. R., Gainetdinov, R. R., Wightman, R. M. & Caron, M. G. Mechanisms of amphetamine action revealed in mice lacking the dopamine transporter. J Neurosci 18, 1979-1986 (1998). [CrossRef]
- Hedges, D. M. et al. Methamphetamine Induces Dopamine Release in the Nucleus Accumbens Through a Sigma Receptor-Mediated Pathway. Neuropsychopharmacology 43, 1405-1414, doi:10.1038/npp.2017.291 (2018). [CrossRef]
- Yorgason, J. T. et al. Methamphetamine increases dopamine release in the nucleus accumbens through calcium-dependent processes. Psychopharmacology (Berl) 237, 1317-1330, doi:10.1007/s00213-020-05459-2 (2020). [CrossRef]
- Kesby, J. P. et al. HIV-1 TAT protein enhances sensitization to methamphetamine by affecting dopaminergic function. Brain Behav Immun 65, 210-221, doi:10.1016/j.bbi.2017.05.004 (2017). [CrossRef]
- Mediouni, S., Marcondes, M. C., Miller, C., McLaughlin, J. P. & Valente, S. T. The cross-talk of HIV-1 Tat and methamphetamine in HIV-associated neurocognitive disorders. Front Microbiol 6, 1164, doi:10.3389/fmicb.2015.01164 (2015). [CrossRef]
- Kesby, J. P., Chang, A., Markou, A. & Semenova, S. Modeling human methamphetamine use patterns in mice: chronic and binge methamphetamine exposure, reward function and neurochemistry. Addict Biol, doi:10.1111/adb.12502 (2017). [CrossRef]
- Soontornniyomkij, V. et al. Effects of HIV and Methamphetamine on Brain and Behavior: Evidence from Human Studies and Animal Models. J Neuroimmune Pharmacol 11, 495-510, doi:10.1007/s11481-016-9699-0 (2016). [CrossRef]
- McKenna, B. S. et al. Microstructural changes to the brain of mice after methamphetamine exposure as identified with diffusion tensor imaging. Psychiatry Res 249, 27-37, doi:10.1016/j.pscychresns.2016.02.009 (2016). [CrossRef]
- Volkow, N. D., Wang, G. J., Fowler, J. S., Tomasi, D. & Telang, F. Addiction: beyond dopamine reward circuitry. Proc Natl Acad Sci U S A 108, 15037-15042, doi:10.1073/pnas.1010654108 (2011). [CrossRef]
- Calderon, T. M. et al. Dopamine Increases CD14(+)CD16(+) Monocyte Transmigration across the Blood Brain Barrier: Implications for Substance Abuse and HIV Neuropathogenesis. J Neuroimmune Pharmacol 12, 353-370, doi:10.1007/s11481-017-9726-9 (2017). [CrossRef]
- Coley, J. S., Calderon, T. M., Gaskill, P. J., Eugenin, E. A. & Berman, J. W. Dopamine increases CD14+CD16+ monocyte migration and adhesion in the context of substance abuse and HIV neuropathogenesis. PLoS One 10, e0117450, doi:10.1371/journal.pone.0117450 (2015). [CrossRef]
- Gaskill, P. J., Yano, H. H., Kalpana, G. V., Javitch, J. A. & Berman, J. W. Dopamine receptor activation increases HIV entry into primary human macrophages. PLoS One 9, e108232, doi:10.1371/journal.pone.0108232 (2014). [CrossRef]
- Gaskill, P. J., Calderon, T. M., Coley, J. S. & Berman, J. W. Drug induced increases in CNS dopamine alter monocyte, macrophage and T cell functions: implications for HAND. J Neuroimmune Pharmacol 8, 621-642, doi:10.1007/s11481-013-9443-y (2013). [CrossRef]
- Basova, L. et al. Dopamine and its receptors play a role in the modulation of CCR5 expression in innate immune cells following exposure to Methamphetamine: Implications to HIV infection. PLoS One 13, e0199861, doi:10.1371/journal.pone.0199861 (2018). [CrossRef]
- Gaskill, P. J., Carvallo, L., Eugenin, E. A. & Berman, J. W. Characterization and function of the human macrophage dopaminergic system: implications for CNS disease and drug abuse. J Neuroinflammation 9, 203, doi:10.1186/1742-2094-9-203 (2012). [CrossRef]
- Cosentino, M. et al. Unravelling dopamine (and catecholamine) physiopharmacology in lymphocytes: open questions. Trends Immunol 24, 581-582; author reply 582-583 (2003). [CrossRef]
- Cosentino, M. et al. Dopaminergic receptors and adrenoceptors in circulating lymphocytes as putative biomarkers for the early onset and progression of multiple sclerosis. J Neuroimmunol 298, 82-89, doi:10.1016/j.jneuroim.2016.07.008 (2016). [CrossRef]
- Marino, F. & Cosentino, M. Multiple sclerosis: Repurposing dopaminergic drugs for MS--the evidence mounts. Nat Rev Neurol 12, 191-192, doi:10.1038/nrneurol.2016.33 (2016). [CrossRef]
- Leite, F., Lima, M., Marino, F., Cosentino, M. & Ribeiro, L. Dopaminergic Receptors and Tyrosine Hydroxylase Expression in Peripheral Blood Mononuclear Cells: A Distinct Pattern in Central Obesity. PLoS One 11, e0147483, doi:10.1371/journal.pone.0147483 (2016). [CrossRef]
- Gaskill, P. J., Miller, D. R., Gamble-George, J., Yano, H. & Khoshbouei, H. HIV, Tat and dopamine transmission. Neurobiol Dis 105, 51-73, doi:10.1016/j.nbd.2017.04.015 (2017). [CrossRef]
- Folks, T. M., Justement, J., Kinter, A., Dinarello, C. A. & Fauci, A. S. Cytokine-induced expression of HIV-1 in a chronically infected promonocyte cell line. Science 238, 800-802, doi:10.1126/science.3313729 (1987). [CrossRef]
- Krishhan, V. V., Khan, I. H. & Luciw, P. A. Multiplexed microbead immunoassays by flow cytometry for molecular profiling: Basic concepts and proteomics applications. Crit Rev Biotechnol 29, 29-43, doi:10.1080/07388550802688847 (2009). [CrossRef]
- Lehmann, J. S., Rughwani, P., Kolenovic, M., Ji, S. & Sun, B. LEGENDplex: Bead-assisted multiplex cytokine profiling by flow cytometry. Methods Enzymol 629, 151-176, doi:10.1016/bs.mie.2019.06.001 (2019). [CrossRef]
- Lehmann, J. S., Zhao, A., Sun, B., Jiang, W. & Ji, S. Multiplex Cytokine Profiling of Stimulated Mouse Splenocytes Using a Cytometric Bead-based Immunoassay Platform. J Vis Exp, doi:10.3791/56440 (2017). [CrossRef]
- Montojo, J. et al. GeneMANIA Cytoscape plugin: fast gene function predictions on the desktop. Bioinformatics 26, 2927-2928, doi:10.1093/bioinformatics/btq562 (2010). [CrossRef]
- Warde-Farley, D. et al. The GeneMANIA prediction server: biological network integration for gene prioritization and predicting gene function. Nucleic Acids Res 38, W214-220, doi:10.1093/nar/gkq537 (2010). [CrossRef]
- Cline, M. S. et al. Integration of biological networks and gene expression data using Cytoscape. Nat Protoc 2, 2366-2382, doi:10.1038/nprot.2007.324 (2007). [CrossRef]
- Shannon, P. et al. Cytoscape: a software environment for integrated models of biomolecular interaction networks. Genome Res 13, 2498-2504, doi:10.1101/gr.1239303 (2003). [CrossRef]
- Carey, C. L. et al. Predictive validity of global deficit scores in detecting neuropsychological impairment in HIV infection. J Clin Exp Neuropsychol 26, 307-319, doi:10.1080/13803390490510031 (2004). [CrossRef]
- Roberts, E. S. et al. Induction of Pathogenic Sets of Genes in Macrophages and Neurons in NeuroAIDS. Am J Pathol 162, 2041-2057 (2003). [CrossRef]
- Gorczyca, W. et al. Immunophenotypic pattern of myeloid populations by flow cytometry analysis. Methods Cell Biol 103, 221-266, doi:10.1016/B978-0-12-385493-3.00010-3 (2011). [CrossRef]
- Rodriguez-Alba, J. C. et al. HIV Disease Progression: Overexpression of the Ectoenzyme CD38 as a Contributory Factor? Bioessays 41, e1800128, doi:10.1002/bies.201800128 (2019). [CrossRef]
- Amici, S. A. et al. CD38 Is Robustly Induced in Human Macrophages and Monocytes in Inflammatory Conditions. Front Immunol 9, 1593, doi:10.3389/fimmu.2018.01593 (2018). [CrossRef]
- Savarino, A. et al. Effects of the human CD38 glycoprotein on the early stages of the HIV-1 replication cycle. FASEB J 13, 2265-2276, doi:10.1096/fasebj.13.15.2265 (1999). [CrossRef]
- Meier, A. et al. Upregulation of PD-L1 on monocytes and dendritic cells by HIV-1 derived TLR ligands. AIDS 22, 655-658, doi:10.1097/QAD.0b013e3282f4de23 (2008). [CrossRef]
- Strasser, F., Gowland, P. L. & Ruef, C. Elevated serum macrophage inhibitory factor-related protein (MRP) 8/14 levels in advanced HIV infection and during disease exacerbation. J Acquir Immune Defic Syndr Hum Retrovirol 16, 230-238, doi:10.1097/00042560-199712010-00002 (1997). [CrossRef]
- Wache, C. et al. Myeloid-related protein 14 promotes inflammation and injury in meningitis. J Infect Dis 212, 247-257, doi:10.1093/infdis/jiv028 (2015). [CrossRef]
- Gong, H. et al. Hippocampal Mrp8/14 signaling plays a critical role in the manifestation of depressive-like behaviors in mice. J Neuroinflammation 15, 252, doi:10.1186/s12974-018-1296-0 (2018). [CrossRef]
- Ehlermann, P. et al. Increased proinflammatory endothelial response to S100A8/A9 after preactivation through advanced glycation end products. Cardiovasc Diabetol 5, 6, doi:10.1186/1475-2840-5-6 (2006). [CrossRef]
- Basova, L., Lindsey, A., McGovern, A. M., Ellis, R. J. & Marcondes, M. C. G. Detection of H3K4me3 Identifies NeuroHIV Signatures, Genomic Effects of Methamphetamine and Addiction Pathways in Postmortem HIV+ Brain Specimens that Are Not Amenable to Transcriptome Analysis. Viruses 13, doi:10.3390/v13040544 (2021). [CrossRef]
- Ashburner, M. et al. Gene ontology: tool for the unification of biology. The Gene Ontology Consortium. Nat Genet 25, 25-29, doi:10.1038/75556 (2000). [CrossRef]
- Kerkhoff, C., Eue, I. & Sorg, C. The regulatory role of MRP8 (S100A8) and MRP14 (S100A9) in the transendothelial migration of human leukocytes. Pathobiology 67, 230-232, doi:10.1159/000028098 (1999). [CrossRef]
- Kerkhoff, C., Klempt, M. & Sorg, C. Novel insights into structure and function of MRP8 (S100A8) and MRP14 (S100A9). Biochim Biophys Acta 1448, 200-211, doi:10.1016/s0167-4889(98)00144-x (1998). [CrossRef]
- Chen, Y. S., Yan, W., Geczy, C. L., Brown, M. A. & Thomas, R. Serum levels of soluble receptor for advanced glycation end products and of S100 proteins are associated with inflammatory, autoantibody, and classical risk markers of joint and vascular damage in rheumatoid arthritis. Arthritis Res Ther 11, R39, doi:10.1186/ar2645 (2009). [CrossRef]
- Fassl, S. K. et al. Transcriptome assessment reveals a dominant role for TLR4 in the activation of human monocytes by the alarmin MRP8. J Immunol 194, 575-583, doi:10.4049/jimmunol.1401085 (2015). [CrossRef]
- Vogl, T. et al. Mrp8 and Mrp14 are endogenous activators of Toll-like receptor 4, promoting lethal, endotoxin-induced shock. Nat Med 13, 1042-1049, doi:10.1038/nm1638 (2007). [CrossRef]
- Deane, R. et al. A multimodal RAGE-specific inhibitor reduces amyloid beta-mediated brain disorder in a mouse model of Alzheimer disease. J Clin Invest 122, 1377-1392, doi:10.1172/JCI58642 (2012). [CrossRef]
- Bortell, N., Morsey, B., Basova, L., Fox, H. S. & Marcondes, M. C. Phenotypic changes in the brain of SIV-infected macaques exposed to methamphetamine parallel macrophage activation patterns induced by the common gamma-chain cytokine system. Front Microbiol 6, 900, doi:10.3389/fmicb.2015.00900 (2015). [CrossRef]
- Najera, J. A. et al. Methamphetamine abuse affects gene expression in brain-derived microglia of SIV-infected macaques to enhance inflammation and promote virus targets. BMC Immunol 17, 7, doi:10.1186/s12865-016-0145-0 (2016). [CrossRef]
- Aksoy, P. et al. Regulation of SIRT 1 mediated NAD dependent deacetylation: a novel role for the multifunctional enzyme CD38. Biochem Biophys Res Commun 349, 353-359, doi:10.1016/j.bbrc.2006.08.066 (2006). [CrossRef]
- Aksoy, P., White, T. A., Thompson, M. & Chini, E. N. Regulation of intracellular levels of NAD: a novel role for CD38. Biochem Biophys Res Commun 345, 1386-1392, doi:10.1016/j.bbrc.2006.05.042 (2006). [CrossRef]
- Onorati, A. et al. Upregulation of PD-L1 in Senescence and Aging. Mol Cell Biol 42, e0017122, doi:10.1128/mcb.00171-22 (2022). [CrossRef]
- Basova, L. V., Kesby, J. P., Kaul, M., Semenova, S. & Marcondes, M. C. G. Systems Biology Analysis of the Antagonizing Effects of HIV-1 Tat Expression in the Brain over Transcriptional Changes Caused by Methamphetamine Sensitization. Viruses 12, doi:10.3390/v12040426 (2020). [CrossRef]
- Soulas, C. et al. Recently infiltrating MAC387(+) monocytes/macrophages a third macrophage population involved in SIV and HIV encephalitic lesion formation. Am J Pathol 178, 2121-2135, doi:10.1016/j.ajpath.2011.01.023 (2011). [CrossRef]
- Lugering, N. et al. Serum 27E10 antigen: a new potential marker for staging HIV disease. Clin Exp Immunol 101, 249-253, doi:10.1111/j.1365-2249.1995.tb08346.x (1995). [CrossRef]
- Ryckman, C. et al. HIV-1 transcription and virus production are both accentuated by the proinflammatory myeloid-related proteins in human CD4+ T lymphocytes. J Immunol 169, 3307-3313, doi:10.4049/jimmunol.169.6.3307 (2002). [CrossRef]
- Real, F. et al. S100A8-mediated metabolic adaptation controls HIV-1 persistence in macrophages in vivo. Nat Commun 13, 5956, doi:10.1038/s41467-022-33401-x (2022). [CrossRef]
- Hashemi, F. B. et al. Myeloid-related protein (MRP)-8 from cervico-vaginal secretions activates HIV replication. AIDS 15, 441-449, doi:10.1097/00002030-200103090-00002 (2001). [CrossRef]
- Cummins, J. E. et al. Mucosal innate immune factors in the female genital tract are associated with vaginal HIV-1 shedding independent of plasma viral load. AIDS Res Hum Retroviruses 22, 788-795, doi:10.1089/aid.2006.22.788 (2006). [CrossRef]
- Oguariri, R. M. et al. Short Communication: S100A8 and S100A9, Biomarkers of SARS-CoV-2 Infection and Other Diseases, Suppress HIV Replication in Primary Macrophages. AIDS Res Hum Retroviruses 38, 401-405, doi:10.1089/AID.2021.0193 (2022). [CrossRef]
- Dunlop, O., Bruun, J. N., Myrvang, B. & Fagerhol, M. K. Calprotectin in cerebrospinal fluid of the HIV infected: a diagnostic marker of opportunistic central nervous system infection? Scand J Infect Dis 23, 687-689, doi:10.3109/00365549109024294 (1991). [CrossRef]
- Leclerc, E., Fritz, G., Vetter, S. W. & Heizmann, C. W. Binding of S100 proteins to RAGE: an update. Biochim Biophys Acta 1793, 993-1007, doi:10.1016/j.bbamcr.2008.11.016 (2009). [CrossRef]
- Turovskaya, O. et al. RAGE, carboxylated glycans and S100A8/A9 play essential roles in colitis-associated carcinogenesis. Carcinogenesis 29, 2035-2043, doi:10.1093/carcin/bgn188 (2008). [CrossRef]
- Cai, W. et al. AGE-receptor-1 counteracts cellular oxidant stress induced by AGEs via negative regulation of p66shc-dependent FKHRL1 phosphorylation. Am J Physiol Cell Physiol 294, C145-152, doi:10.1152/ajpcell.00350.2007 (2008). [CrossRef]
- Villegas-Rodriguez, M. E. et al. The AGE-RAGE Axis and Its Relationship to Markers of Cardiovascular Disease in Newly Diagnosed Diabetic Patients. PLoS One 11, e0159175, doi:10.1371/journal.pone.0159175 (2016). [CrossRef]
- Kim, O. Y. & Song, J. The importance of BDNF and RAGE in diabetes-induced dementia. Pharmacol Res 160, 105083, doi:10.1016/j.phrs.2020.105083 (2020). [CrossRef]
- Sturchler, E., Galichet, A., Weibel, M., Leclerc, E. & Heizmann, C. W. Site-specific blockade of RAGE-Vd prevents amyloid-beta oligomer neurotoxicity. J Neurosci 28, 5149-5158, doi:10.1523/JNEUROSCI.4878-07.2008 (2008). [CrossRef]
- Carnevale, D. et al. Hypertension induces brain beta-amyloid accumulation, cognitive impairment, and memory deterioration through activation of receptor for advanced glycation end products in brain vasculature. Hypertension 60, 188-197, doi:10.1161/HYPERTENSIONAHA.112.195511 (2012). [CrossRef]
- Lue, L. F. et al. Involvement of microglial receptor for advanced glycation endproducts (RAGE) in Alzheimer’s disease: identification of a cellular activation mechanism. Exp Neurol 171, 29-45, doi:10.1006/exnr.2001.7732 (2001). [CrossRef]
- Lue, L. F., Walker, D. G., Jacobson, S. & Sabbagh, M. Receptor for advanced glycation end products: its role in Alzheimer’s disease and other neurological diseases. Future Neurol 4, 167-177, doi:10.2217/14796708.4.2.167 (2009). [CrossRef]
- Lue, L. F., Yan, S. D., Stern, D. M. & Walker, D. G. Preventing activation of receptor for advanced glycation endproducts in Alzheimer’s disease. Curr Drug Targets CNS Neurol Disord 4, 249-266, doi:10.2174/1568007054038210 (2005). [CrossRef]
- Walker, D., Lue, L. F., Paul, G., Patel, A. & Sabbagh, M. N. Receptor for advanced glycation endproduct modulators: a new therapeutic target in Alzheimer’s disease. Expert Opin Investig Drugs 24, 393-399, doi:10.1517/13543784.2015.1001490 (2015). [CrossRef]
- Li, M. et al. Amyloid beta interaction with receptor for advanced glycation end products up-regulates brain endothelial CCR5 expression and promotes T cells crossing the blood-brain barrier. J Immunol 182, 5778-5788, doi:10.4049/jimmunol.0803013 (2009). [CrossRef]
- Jeong, S. J. et al. Low plasma levels of the soluble receptor for advanced glycation end products in HIV-infected patients with subclinical carotid atherosclerosis receiving combined antiretroviral therapy. Atherosclerosis 219, 778-783, doi:10.1016/j.atherosclerosis.2011.08.003 (2011). [CrossRef]
- Nasreddine, N. et al. Advanced glycation end products inhibit both infection and transmission in trans of HIV-1 from monocyte-derived dendritic cells to autologous T cells. J Immunol 186, 5687-5695, doi:10.4049/jimmunol.0902517 (2011). [CrossRef]
- Jacobson, J. et al. Biomarkers of aging in Drosophila. Aging Cell 9, 466-477, doi:10.1111/j.1474-9726.2010.00573.x (2010). [CrossRef]
- Oudes, A. J., Herr, C. M., Olsen, Y. & Fleming, J. E. Age-dependent accumulation of advanced glycation end-products in adult Drosophila melanogaster. Mech Ageing Dev 100, 221-229, doi:10.1016/s0047-6374(97)00146-2 (1998). [CrossRef]
- Rowan, S., Bejarano, E. & Taylor, A. Mechanistic targeting of advanced glycation end-products in age-related diseases. Biochim Biophys Acta Mol Basis Dis 1864, 3631-3643, doi:10.1016/j.bbadis.2018.08.036 (2018). [CrossRef]
- Sharma, A. et al. Advanced glycation end products and protein carbonyl levels in plasma reveal sex-specific differences in Parkinson’s and Alzheimer’s disease. Redox Biol 34, 101546, doi:10.1016/j.redox.2020.101546 (2020). [CrossRef]
- Traverso, N. et al. Mutual interaction between glycation and oxidation during non-enzymatic protein modification. Biochim Biophys Acta 1336, 409-418, doi:10.1016/s0304-4165(97)00052-4 (1997). [CrossRef]
- Filosevic Vujnovic, A., Jovic, K., Pistan, E. & Andretic Waldowski, R. Influence of Dopamine on Fluorescent Advanced Glycation End Products Formation Using Drosophila melanogaster. Biomolecules 11, doi:10.3390/biom11030453 (2021). [CrossRef]
- Schluesener, H. J., Kremsner, P. G. & Meyermann, R. Widespread expression of MRP8 and MRP14 in human cerebral malaria by microglial cells. Acta Neuropathol 96, 575-580, doi:10.1007/s004010050938 (1998). [CrossRef]
- Wittkowski, H. et al. MRP8 and MRP14, phagocyte-specific danger signals, are sensitive biomarkers of disease activity in cryopyrin-associated periodic syndromes. Ann Rheum Dis 70, 2075-2081, doi:10.1136/ard.2011.152496 (2011). [CrossRef]
- Floris, S. et al. Monocyte activation and disease activity in multiple sclerosis. A longitudinal analysis of serum MRP8/14 levels. J Neuroimmunol 148, 172-177, doi:10.1016/j.jneuroim.2003.11.005 (2004). [CrossRef]
- Ma, L., Sun, P., Zhang, J. C., Zhang, Q. & Yao, S. L. Proinflammatory effects of S100A8/A9 via TLR4 and RAGE signaling pathways in BV-2 microglial cells. Int J Mol Med 40, 31-38, doi:10.3892/ijmm.2017.2987 (2017). [CrossRef]
- Austermann, J. et al. Alarmins MRP8 and MRP14 induce stress tolerance in phagocytes under sterile inflammatory conditions. Cell Rep 9, 2112-2123, doi:10.1016/j.celrep.2014.11.020 (2014). [CrossRef]
- Petersen, B. et al. The alarmin Mrp8/14 as regulator of the adaptive immune response during allergic contact dermatitis. EMBO J 32, 100-111, doi:10.1038/emboj.2012.309 (2013). [CrossRef]
- Liu, P., Sun, Z., Zhang, Y. & Guo, W. Myeloid related protein 8/14 is a new candidate biomarker and therapeutic target for abdominal aortic aneurysm. Biomed Pharmacother 118, 109229, doi:10.1016/j.biopha.2019.109229 (2019). [CrossRef]
- Nair, S. C. et al. A Personalized Approach to Biological Therapy Using Prediction of Clinical Response Based on MRP8/14 Serum Complex Levels in Rheumatoid Arthritis Patients. PLoS One 11, e0152362, doi:10.1371/journal.pone.0152362 (2016). [CrossRef]
- Chang, F. M., Kidd, J. R., Livak, K. J., Pakstis, A. J. & Kidd, K. K. The world-wide distribution of allele frequencies at the human dopamine D4 receptor locus. Hum Genet 98, 91-101, doi:10.1007/s004390050166 (1996). [CrossRef]
- Chen, D. et al. Association between polymorphisms of DRD2 and DRD4 and opioid dependence: evidence from the current studies. Am J Med Genet B Neuropsychiatr Genet 156B, 661-670, doi:10.1002/ajmg.b.31208 (2011). [CrossRef]
- Ding, Y. C. et al. Evidence of positive selection acting at the human dopamine receptor D4 gene locus. Proc Natl Acad Sci U S A 99, 309-314, doi:10.1073/pnas.012464099 (2002). [CrossRef]
- Van Tol, H. H. et al. Multiple dopamine D4 receptor variants in the human population. Nature 358, 149-152, doi:10.1038/358149a0 (1992). [CrossRef]
- Wang, W. et al. Age-Related Dopaminergic Innervation Augments T Helper 2-Type Allergic Inflammation in the Postnatal Lung. Immunity 51, 1102-1118 e1107, doi:10.1016/j.immuni.2019.10.002 (2019). [CrossRef]
- Farber, K., Pannasch, U. & Kettenmann, H. Dopamine and noradrenaline control distinct functions in rodent microglial cells. Mol Cell Neurosci 29, 128-138, doi:10.1016/j.mcn.2005.01.003 (2005). [CrossRef]
- Fan, Y., Chen, Z., Pathak, J. L., Carneiro, A. M. D. & Chung, C. Y. Differential Regulation of Adhesion and Phagocytosis of Resting and Activated Microglia by Dopamine. Front Cell Neurosci 12, 309, doi:10.3389/fncel.2018.00309 (2018). [CrossRef]
- Dominguez-Meijide, A., Rodriguez-Perez, A. I., Diaz-Ruiz, C., Guerra, M. J. & Labandeira-Garcia, J. L. Dopamine modulates astroglial and microglial activity via glial renin-angiotensin system in cultures. Brain Behav Immun 62, 277-290, doi:10.1016/j.bbi.2017.02.013 (2017). [CrossRef]
- Yan, Y. et al. Dopamine controls systemic inflammation through inhibition of NLRP3 inflammasome. Cell 160, 62-73, doi:10.1016/j.cell.2014.11.047 (2015). [CrossRef]
- Jones, C. M., Han, B., Seth, P., Baldwin, G. & Compton, W. M. Increases in methamphetamine injection among treatment admissions in the U.S. Addict Behav 136, 107492, doi:10.1016/j.addbeh.2022.107492 (2023). [CrossRef]
- Chana, G. et al. Cognitive deficits and degeneration of interneurons in HIV+ methamphetamine users. Neurology 67, 1486-1489, doi:10.1212/01.wnl.0000240066.02404.e6 (2006). [CrossRef]
- Chang, L., Ernst, T., Speck, O. & Grob, C. S. Additive effects of HIV and chronic methamphetamine use on brain metabolite abnormalities. Am J Psychiatry 162, 361-369, doi:10.1176/appi.ajp.162.2.361 (2005). [CrossRef]
- Cadet, J. L. & Krasnova, I. N. Interactions of HIV and methamphetamine: cellular and molecular mechanisms of toxicity potentiation. Neurotox Res 12, 181-204 (2007). [CrossRef]
Disclaimer/Publisher’s Note: The statements, opinions and data contained in all publications are solely those of the individual author(s) and contributor(s) and not of MDPI and/or the editor(s). MDPI and/or the editor(s) disclaim responsibility for any injury to people or property resulting from any ideas, methods, instructions or products referred to in the content. |
© 2023 by the authors. Licensee MDPI, Basel, Switzerland. This article is an open access article distributed under the terms and conditions of the Creative Commons Attribution (CC BY) license (http://creativecommons.org/licenses/by/4.0/).


