Preprint
Article

Using Drifters Equipped with Acoustic Tags to Verify the Efficacy of an Array of Acoustic Receivers for Estimating Probability of Fish-Turbine Encounter

Altmetrics

Downloads

147

Views

41

Comments

0

Submitted:

26 April 2023

Posted:

03 May 2023

You are already at the latest version

Alerts
Abstract
An area has been designated for demonstrating the utility of marine hydrokinetic turbines in Minas Passage, Bay of Fundy. Marine renewable energy may be useful for the transition from carbon-based energy sources but there is concern for the safety of fish that might encounter turbines. Acoustic receivers that detect signals from acoustically tagged fish that pass through the tidal demonstration area and detection efficiency of tag signals might be used to estimate the likelihood of fish encountering marine hydrokinetic turbines. The method requires that tagged fish passing through the development area will be reliably detected by a receiver array. The present research tests the reliability with which passing tags are detected by suspending tags beneath GPS-tracked drifters. Drifters carrying high residency Innovasea tags that transmitted every 2 seconds were usually detected by the receiver array even in fast currents during spring tides but pulse position modulation tags were inadequate. Sometimes very few high residency tag signals were detected when fast tidal currents swept a drifter through the receiver array, so increasing the transmission interval degrades performance at the tidal energy development area. High residency tags suspended close to the sea surface were slightly less likely to be detected if they passed by during calm conditions. Previously measured detection efficiencies were found to slightly overestimate the chances of a high residency tag carried by a drifter being detected as it passed by a receiver. This works elucidates the effectiveness with which acoustically tagged fish are detected in fast, highly turbulent tidal currents and informs the application of detection efficiency measurements to calculate the probability that fish encounter a marine hydrokinetic turbine.
Keywords: 
Subject: Environmental and Earth Sciences  -   Ecology

1. Introduction

There has been, and continues to be, a substantial effort to develop marine renewable energy (MRE) in order to address the effects of climate change and ensure a transition from carbon-based energy sources that is both sustainable and environmentally benign [1]. In Minas Passage, Bay of Fundy, tidal currents can exceed 5 ms 1 and raises the possibility that marine hydrokinetic (MHK) turbines [2,3] might be used to generate electricity from the kinetic energy of the tides, thereby, offseting Canadian carbon emissions [4,5]. An area has been designated and equipped for tidal energy demonstration (TED) adjacent to the northern shore of Minas Passage, Bay of Fundy, Canada (Figure 1). Installation of MHK turbines is subject to assessing and mitigating potential harm to marine animals; Canadian Environmental Assessment Act, Fisheries Act, and Species at Risk Act [6]. There is particular concern for local populations of various fish species that are found in the region [7,8,9]. For example, a local population of striped bass (Morone saxatilis) that spawns in the Shubenacadie River [10], Atlantic sturgeon (Acipenser oxyrhinchus) from the Saint John River stock [11], and inner Bay of Fundy Atlantic salmon (Salmo salar) that were once abundant but are now supported by local hatchery stocking programs [12].
Acoustic telemetry provides a means to tag individuals belonging to a specific population and measure how frequently they pass through the TED area. If an acoustic receiver is placed within the TED area and it detects an acoustically tagged fish then there is a distribution of positions about the receiver where the fish might be, and that distribution can be estimated if we know the detection efficiency of a signal from the acoustic tag. Detection efficiency ρ has been measured in the TED area and enables detections of tagged fish to be converted into an estimate of abundance [13]. When current is fast, tagged fish move with the water to a first approximation [14] so the flux of tagged fish can be estimated. Thinking of the receiver as a proxy for where a MHK turbine might later be deployed, this flux yields the probability that a tagged fish might pass through the area swept by MHK turbine blades. We call this an Eulerian formulation [15] for the probability of fish-turbine encounter.
Probability of encounter is only an upper limit on probability of harm. A fish that encounters a MHK turbine might avoid dangerous interaction or may even be struck by a turbine blade but not be harmed [16,17] but presently there is little prospect of measuring avoidance behaviour and strike survivability at the TED area in Minas Passage [18].
Detection efficiency ρ ( r , s ) has been measured in the TED area as a function of range r from tag to receiver and signed current speed s (± on flood/ebb tides) [13]. Those measurements were made using Innovasea high residency (HR) tags and Innovasea HR2 receivers that were moored near the seafloor and there were indications that signal paths were sometimes blocked by variable bathymetry. In Minas Passage MHK turbines have been deployed, and are expected to be deployed, well clear of the seafloor and many of the fish species of concern are known to also swim well clear of the seafloor at the TED area [10,11,19]. There is, therefore, a pressing need to verify the extent to which the previously measured detection efficiency [13] is applicable to the detection of tags that are located higher in the water column. Also, tagged fish move more like drifters than moored tags [14] and whether a signal is detected during the time interval in which a tagged fish passes by a receiver may differ from that estimated from detection efficiency [13]. There is a need for comparison with direct measurement.
To be more representative of a tagged fish, the following work deployed HR tags suspended beneath drifters to test whether they were detected by near seafloor receivers in a way that was consistent with previously measured detection efficiency [13]. Two measurement strategies were used. First, short term drifts (STD) where the tagged drifter was repeatedly released upstream and collected downstream of HR2 receivers at the TED area (section 2.2). Second, long term drifts (LTD) where drifters were released on a quasi-stable trajectory [14] and not recovered until many days later. The quasi-stable trajectory [14] resulted in the tagged drifter frequently passing over HR2 receivers moored to the south of the TED area and sometimes over HR2 receivers at the TED area (section 2.3).
Conventionally, detection efficiency has been measured using acoustic tags that are fixed to one position and a receiver that is fixed to another position [13,20,21]. Although seldom stated, such measurements give a strictly Eulerian formulation for detection efficiency. Such measurements of detection efficiency are related to the problem of detecting a tagged fish. The presently obtained measurements enable a demonstration of a Lagrangian formulation [15] for directly obtaining the probability of detecting an individual tagged fish as it passes by.

2. Materials and Methods

The volcanic plateau of the TED area in Minas Passage (Figure 1) is presently favoured for future installations of both gravity-based MHK turbines and also for MHK turbines mounted to a floating platform [2]. The field program was designed to minimize the possibility of equipment, particularly drifters, becoming entangled with a non-operational OpenHydro turbine at the position marked by a circled cross in Figure 1a.

2.1. Moorings

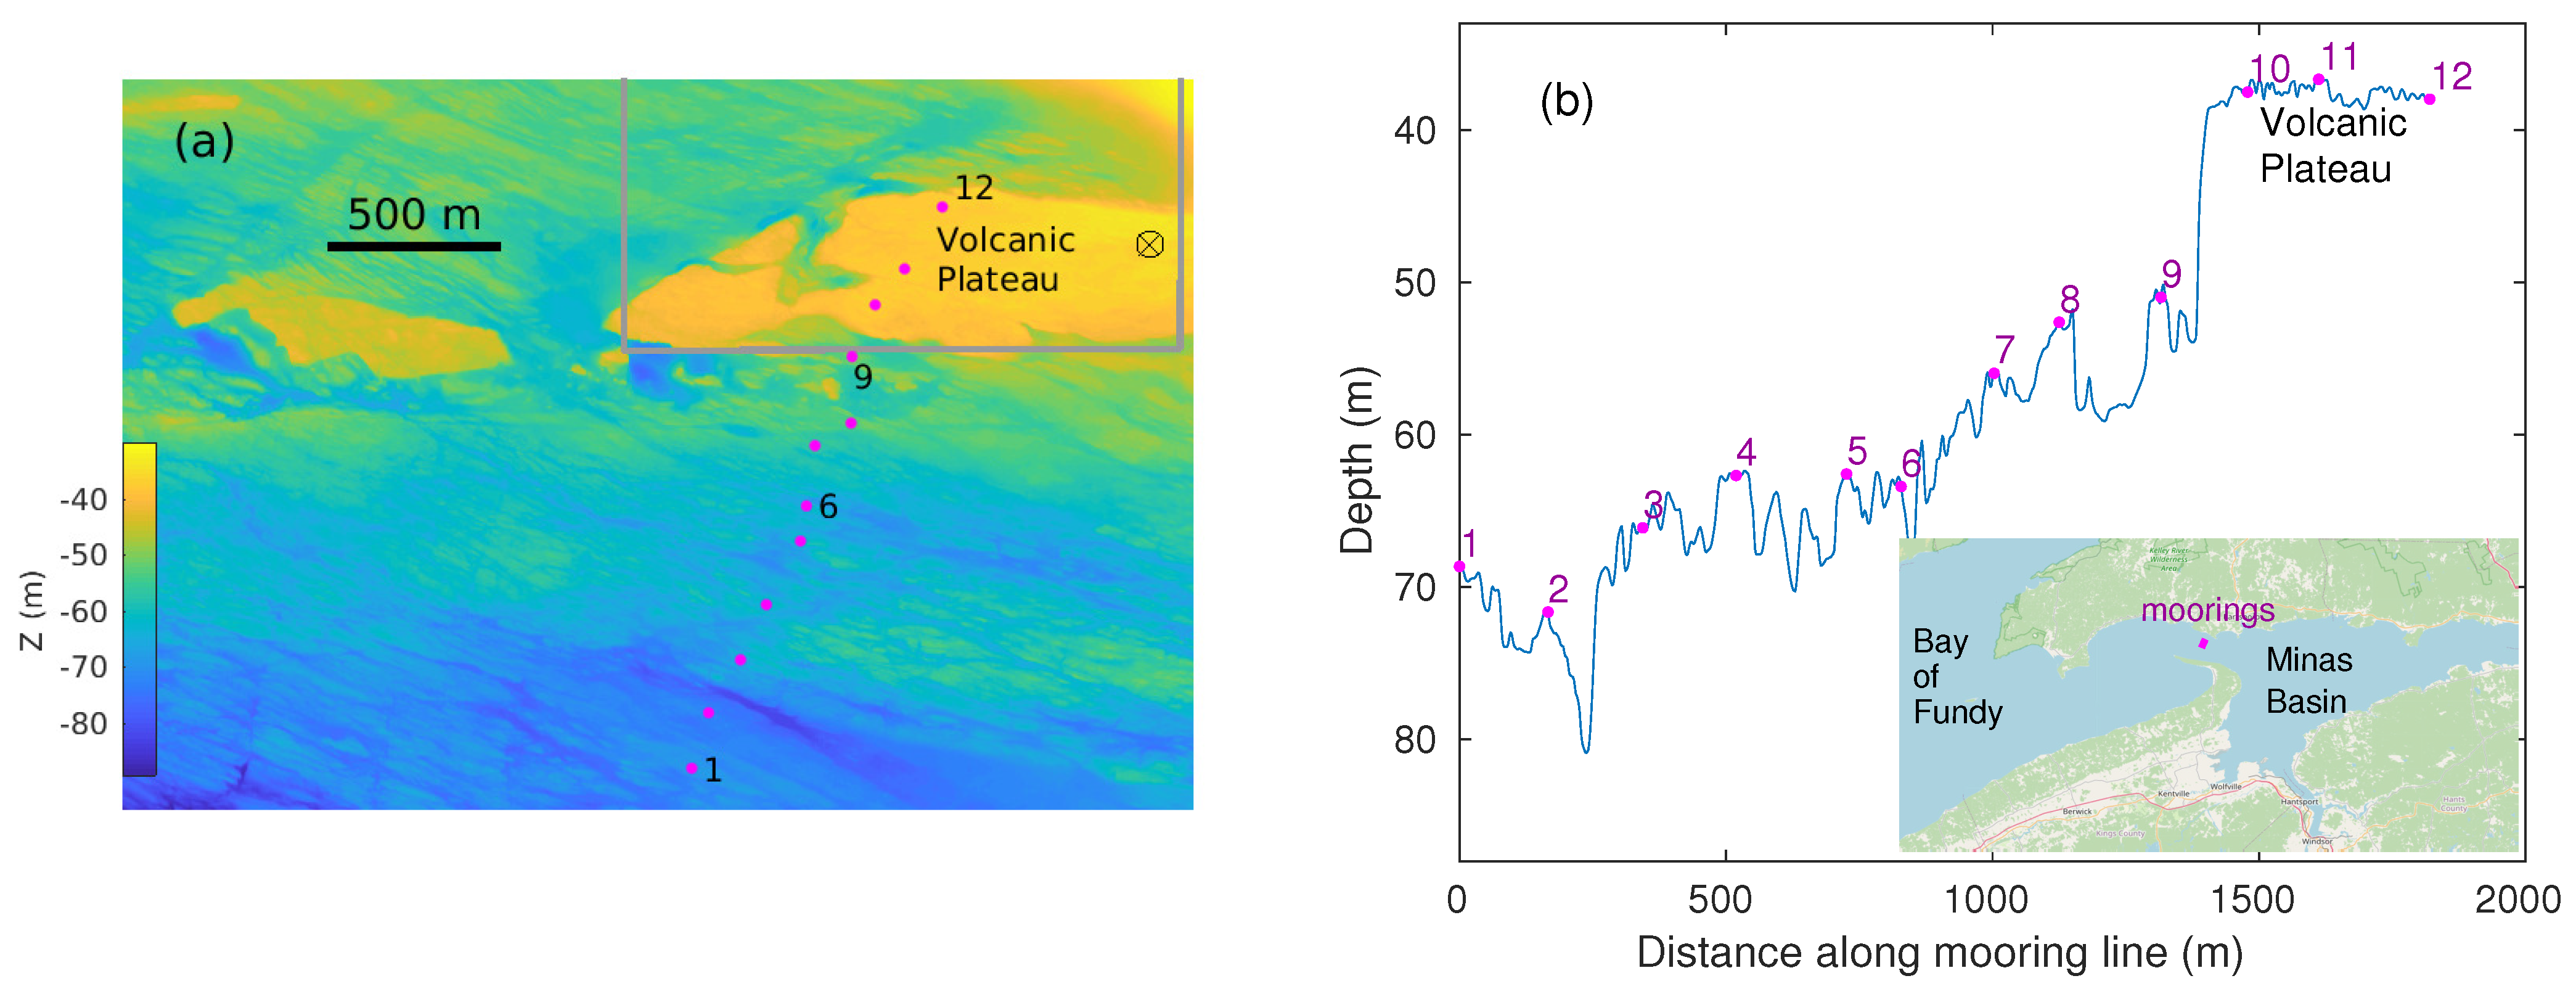
Twelve mooring sites were chosen so as to deploy an array of acoustic receivers on high ground along a line that was oriented approximately orthogonal to the flood tide (Figure 1). Mooring sites 1-8 monitored tagged drifters that crossed a line to the south of the TED area. Sites 10-12 were on the volcanic plateau and site 9 was in deeper water off the edge of the plateau. Jointly, sites 9-12 are considered to monitor the TED area. Whereas the volcanic plateau is relatively flat, the area to its south is characterized by highly variable bathymetry Figure 1b.
All moorings consisted of a 240 kg chain link that served as an anchor to which a SUBS-Model A2 (Open Seas Instrumentation Inc.) float was tethered by a 3 m riser chain. Each SUBS carried an acoustic release and a HR2 receiver within its streamlined hull and a Innovasea VR2W-69kHz receiver mounted symmetrically behind its tail fin. The HR2 receivers were set to transmit 143 dB HR signals every 25-35 s and record tilt and water temperature every 10 minutes. At moorings 9-12, a V9 tag was mounted to the top of the SUBS tail fin and it transmitted a 170 kHz HR signal with manufacturer-specified transmission interval 1.8-2.2 s. Actual transmission intervals for the V9 tags were 1.800-2.1750 s with an average of 1.9875 s. V9 tags at moorings 9 and 10 operated throughout the deployment period but the tags at moorings 11 and 12 failed on 16 July 2022 and 1 August 2022 respectively.
Moorings were deployed during 5-6 May 2022. The SUBS at mooring 3 re-surfaced immediately following deployment. The hull of the SUBS was deformed and scuffed and the attachment for its mooring assembly (anchor and riser chain) had sheared from the fibreglass strong-back that held the acoustic release. The most likely explanation was that the anchor of mooring 3 had fallen into a deep crevasse that was too narrow for the SUBS to follow.
An initial estimate of each mooring deployment position was obtained from the deployment vessel’s GPS at the time that the mooring was released overboard from the stern. This estimate of mooring position had uncertainty due to the vessel’s GPS being located 10.4 m forward of the stern and vessel heading being variable and uncertain when the mooring was released. Three Columbus V990 GPS loggers recorded position every second and were used to refine the deployment position. A Columbus GPS logger was placed each side of the stern deck and the third Columbus GPS logger was used to mark the time at which a mooring was released overboard.
Of the 11 moorings successfully deployed, 10 were recovered on 6 September 2022 with receivers in good working order. The acoustic release at mooring 5 did not respond to the deck unit and could not be `ranged’, suggesting that the SUBS had previously detached from its anchor weight and had drifted elsewhere. On 18 September 2022 the SUBS from mooring 5 washed ashore near Harbourville, Nova Scotia, and was promptly recovered with its chain riser still attached to the acoustic release. The VR2W receiver had broken off the SUBS and was lost, but the HR2 was still attached and its data were successfully downloaded. The last time the HR2 at mooring 5 detected HR signals from neighbouring moorings was 13-August-2022 00:55:41, so it must have become detached from its anchor weight at about that time.
HR2 clocks were set relative to UTC shortly before mooring deployment and shortly after mooring recovery when data were downloaded. Those clock sets enable linear clock skew to be corrected by Innovasea software as a part of the data download. Over the deployment period for the 11 HR2 receivers that were recovered, linear time offsets ranged from -172 s to 161 s with mean -80 s and root mean square 132 s. Providing a pair of HR2 receivers could detect each other’s HR transmissions, their separation range was calculated and their clocks were synchronized to each other [13].

2.2. Short-term drifts (STD)

Short term drifts (STD) comprised many (n=62) brief drifts during spring flood tides in order to determine how well HR tags could be detected as they passed over the array of HR2 receivers deployed in the TED area. A pole-float was convenient for quick and easy handling during drifter deployment and recovery.
A Columbus V-990 GPS logger was fixed to the top of the pole float and logged GPS position every second. Beneath the sea surface, the pole-float drifter was configured with four V9 170 kHz HR tags placed at 3 m, 8 m, 16 m, and 26 m subsurface depths. The V9 tags transmitted a HR signal every 1.8-2.2 s. A HR2 receiver was suspended at 21 m depth with its hydrophone sensor pointing downwards and configured to record temperature and instrument tilt every 60 s. A V16 69 kHz PPM tag was attached at 27 m subsurface and transmitted every 10 s. A 4.7 kg lead weight was attached 28.5 m subsurface to vertically align equipment within the water column.
The STD were conducted using a 6 m rigid-hull inflatable boat (RHIB) that was fitted with a 110 hp outboard engine. Experiments were conducted during relatively calm weather and timed to coincide with large spring tides so tests could be conducted during elevated tidal current speeds. Although the pole-float drifter was not drogued, the fast tides and light winds ensured that drifter movement was a good approximation to that of the the top 28 m of the water column. Most measurements were made on and about peak flood tide because those were the conditions for which we had least confidence in the reliability of the previously measured detection efficiency [13].
The operating procedure was to deploy the drifters about 800-1000 m upstream of the moored receivers and begin recovering them after they had drifted 600 m past the receivers. Deployment was swift and easy, so drifters were almost always safely set and the research vessel’s engine turned off before the drifter had approached within 500 m of the moorings. Recovery was laborious and time consuming which limited how many drift tracks could be achieved in a day. Onset of wind or fog shortened some working days. Drifts were conducted on 13 June (n=16), 15 June (n=15), 16 June (n=6) 17 July (n=16) and 18 July (n=9).
The HR2 suspended beneath the STD operated over short time periods and clock sets gave linear time offsets of -5.5 s over the June experiments and -3.9 s over the July experiments. When signals from the drifting HR2 were detected by moored HR2 receivers, it was possible to synchronize clocks between the moorings and drifter.

2.3. Long-term drifts (LTD)

The long-term drifters were designed so they could be tracked remotely using either a web browser or an application (app) on a smart phone or tablet. Drifters suspended HR tags and were usually deployed so that they would settle onto quasi-stable trajectories that passed over the moored HR2 receivers [14]. When drifters went off track, they could be located using the app and recovered or redeployed. Field operations used the 6 m RHIB employed for the STD experiments.
Three long term drifters were constructed. Each drifter consisted of a surface float, a 1.8 m by 2.45 m window shade drogue centered at 6.3 m depth, and a long trailing line that held instruments and terminated at a 7 kg steel weight. The surface float was constructed from 38 mm ABS pipe and standard plumbing fittings with flotation fashioned from 50 mm boards of extruded polystyrene foam. Batteries and electronics were assembled on a length of ABS and slid into the ABS pipe.
The electronics package consisted of a Tractive® GPS LTE dog tracker, a Columbus V-990 GPS logger, and a buck converter that supplied 5V DC via USB connectors. The Tractive® enabled remote tracking but provided position measurements at irregular intervals, ranging from a few minutes to many hours depending upon the cellular network. The Columbus V-990 logged GPS positions every second but had to be physically recovered to download data. The buck converter could provide 5V-USB to instruments from a 8-24V D-cell stack.
The Columbus GPS logger prematurely stopped logging during some early LTD drifts because an inappropriate USB cable was used to connect with the buck converter. This problem was solved by using the USB cable that was sold with the Columbus GPS logger.

2.4. Tidal current and surface elevation

Using drifters that carry both acoustic tags and GPS loggers has the advantage of providing current information that coincides with detection of tags by moored receivers. Nevertheless, the detection efficiency which we aimed to test was formulated as a function of current speeds that were calculated by the FVCOM hydrodynamic model [4,13,22]. Tidal currents and sea surface elevation have been simulated for the Bay of Fundy and the present work utilizes values saved at 10-minute intervals at each of the mooring positions. Modelled tidal elevation was used to obtain the vertical part of tag-receiver separation so that slant-range could be calculated.

3. Results

3.1. STD tracks and FVCOM current

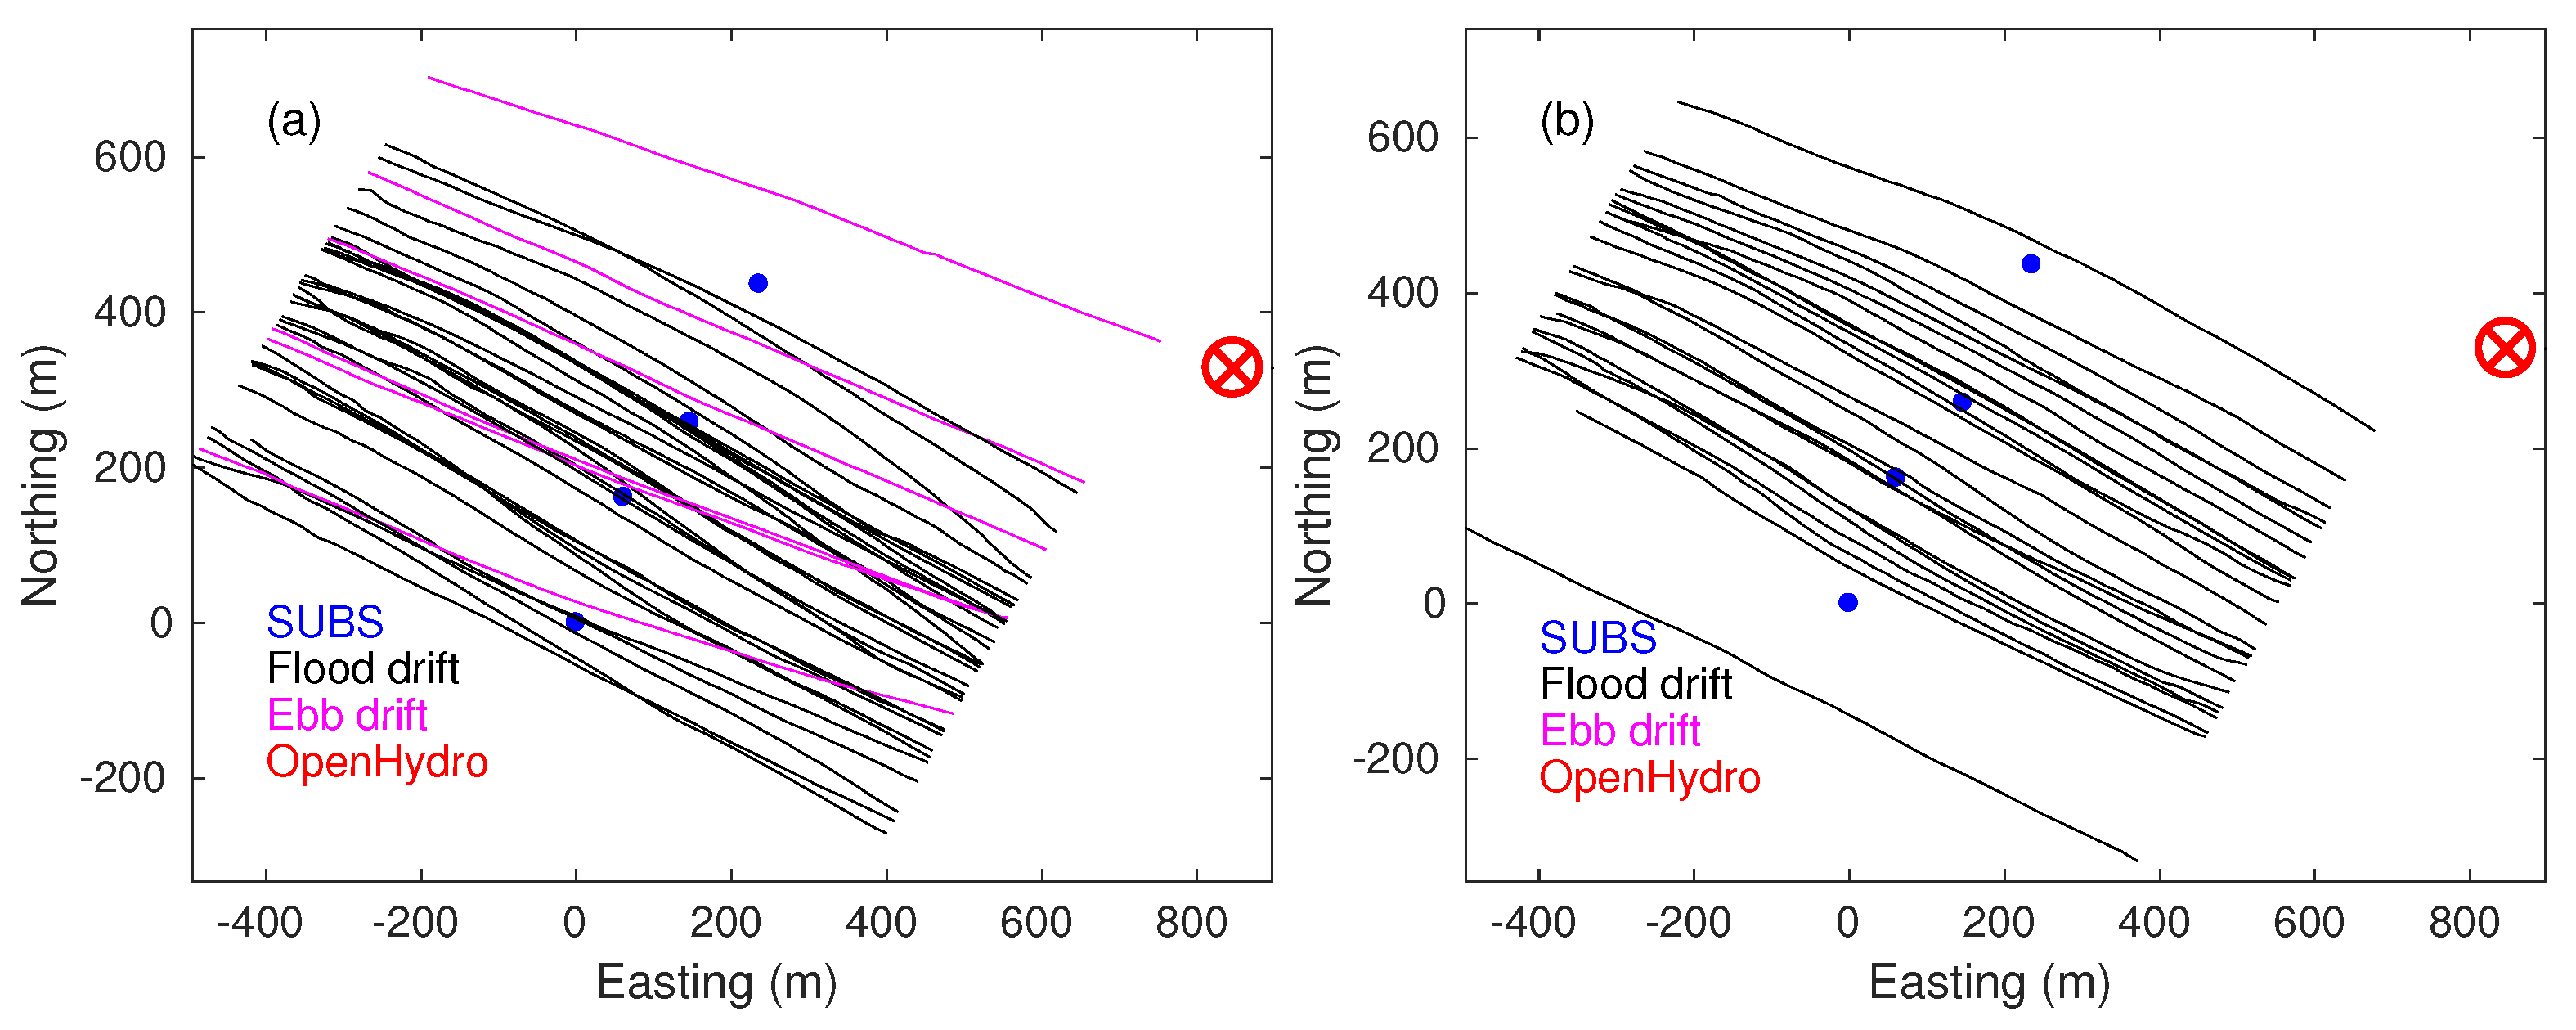
A total of 62 drift tracks were made during large spring tides: 37 during June and 25 during July flood tides. Figure 2 shows the portion of each track that was kept for analysis. Six tracks were measured on the 15 June ebb tide, the remainder were measured during flood tides. Ebb tide tracks are more zonal than flood tracks, consistent with centrifugal effects as the flood tide enters Minas Passage [14]. Except near the turn of the tide, drifter tracks take a fairly straight path across the line of moorings. Smaller scale variability in the track is probably associated with flow over variable bathymetry (Figure 1) and turbulent “boils” which intensify with tidal current speed.
HR signals are only expected to be detected in the mid portion of the plotted tracks, near where they most closely approach a moored HR2 receiver (Figure 2). With that in mind, each track can be characterized relative to a mooring by time of closest approach t ca , slant range of closest approach r ca and signed drifter speed s ca at the time of closest approach. Signed drifter speed is defined herein as positive on the flood tide and negative on the ebb tide. Drifter velocity was computed from drifter positions 10 s before and after t ca .
Previously measured detection efficiency [13] was expressed as a function of signed current speed at the position of the detecting mooring, so it is germane to compare drifter current with FVCOM simulated current. For each of the 62 drifts, the signed current speed s FV was obtained from FVCOM simulated current at the mooring m ca most closely approached and at the time of closest approach. Regressing s FV against the corresponding s ca gives:
s FV = a s ca + b ,
where a = 0 . 87 (95%CI 0.84-0.89), b = 0 . 14 ms 1 (95%CI 0.04-0.25) and R-square is 0.99. Caution is warranted because few ebb tides were measured, but it is quite clear that drifters move faster than FVCOM simulations would suggest during flood tide at the TED area. FVCOM currents were vertically averaged over the water column and the pole-float drifter extended from about 1.5 m above sea surface to a depth of about 29 m.

3.2. Mooring separation, synchronization, and depth

Figure 1 plots estimated deployment positions for moorings and shows depths at those positions. There is a possibility that moorings may move during the experiment due to drag and lift forces exerted on the SUBS. A change in the separation of moorings can indicate the extent of mooring movement, as can a change of depth or a change in HR signals reflected from a nearby object [13].
When two HR2 receivers can detect each others transmissions then it is straightforward to calculate their separation and synchronize their clocks [13]. Similarly, a HR2 can be treated as an inverted echosounder in order to measure distance below the sea surface which must then be detided to find depth [13]. HR2 separation ranges were essentially constant with respect to time for each of the following pairs of moorings: 1–2, 4–5, 5–6, 6–7, 9–10 (Table 1). Also, HR2 depths at sites 1, 2, 4, 5, 6, 7, 9, 10 did not substantially change with time so it is safe to conclude that those moorings did not move to any meaningful extent (except for mooring 5 breaking free on 13 August). Moorings at sites 8, 11 and 12 moved but depth changes were not great.
Innovasea software automatically removes linear clock skew providing the HR2 receiver is connected to the internet when a new study is started and when measurements are downloaded. Time stamps of measurement records will still have nonlinear departures from each other and from UTC. The method for calculating separation between a pair of HR2 receivers also obtains the time offset that is required to synchronize those receivers with each other [13].
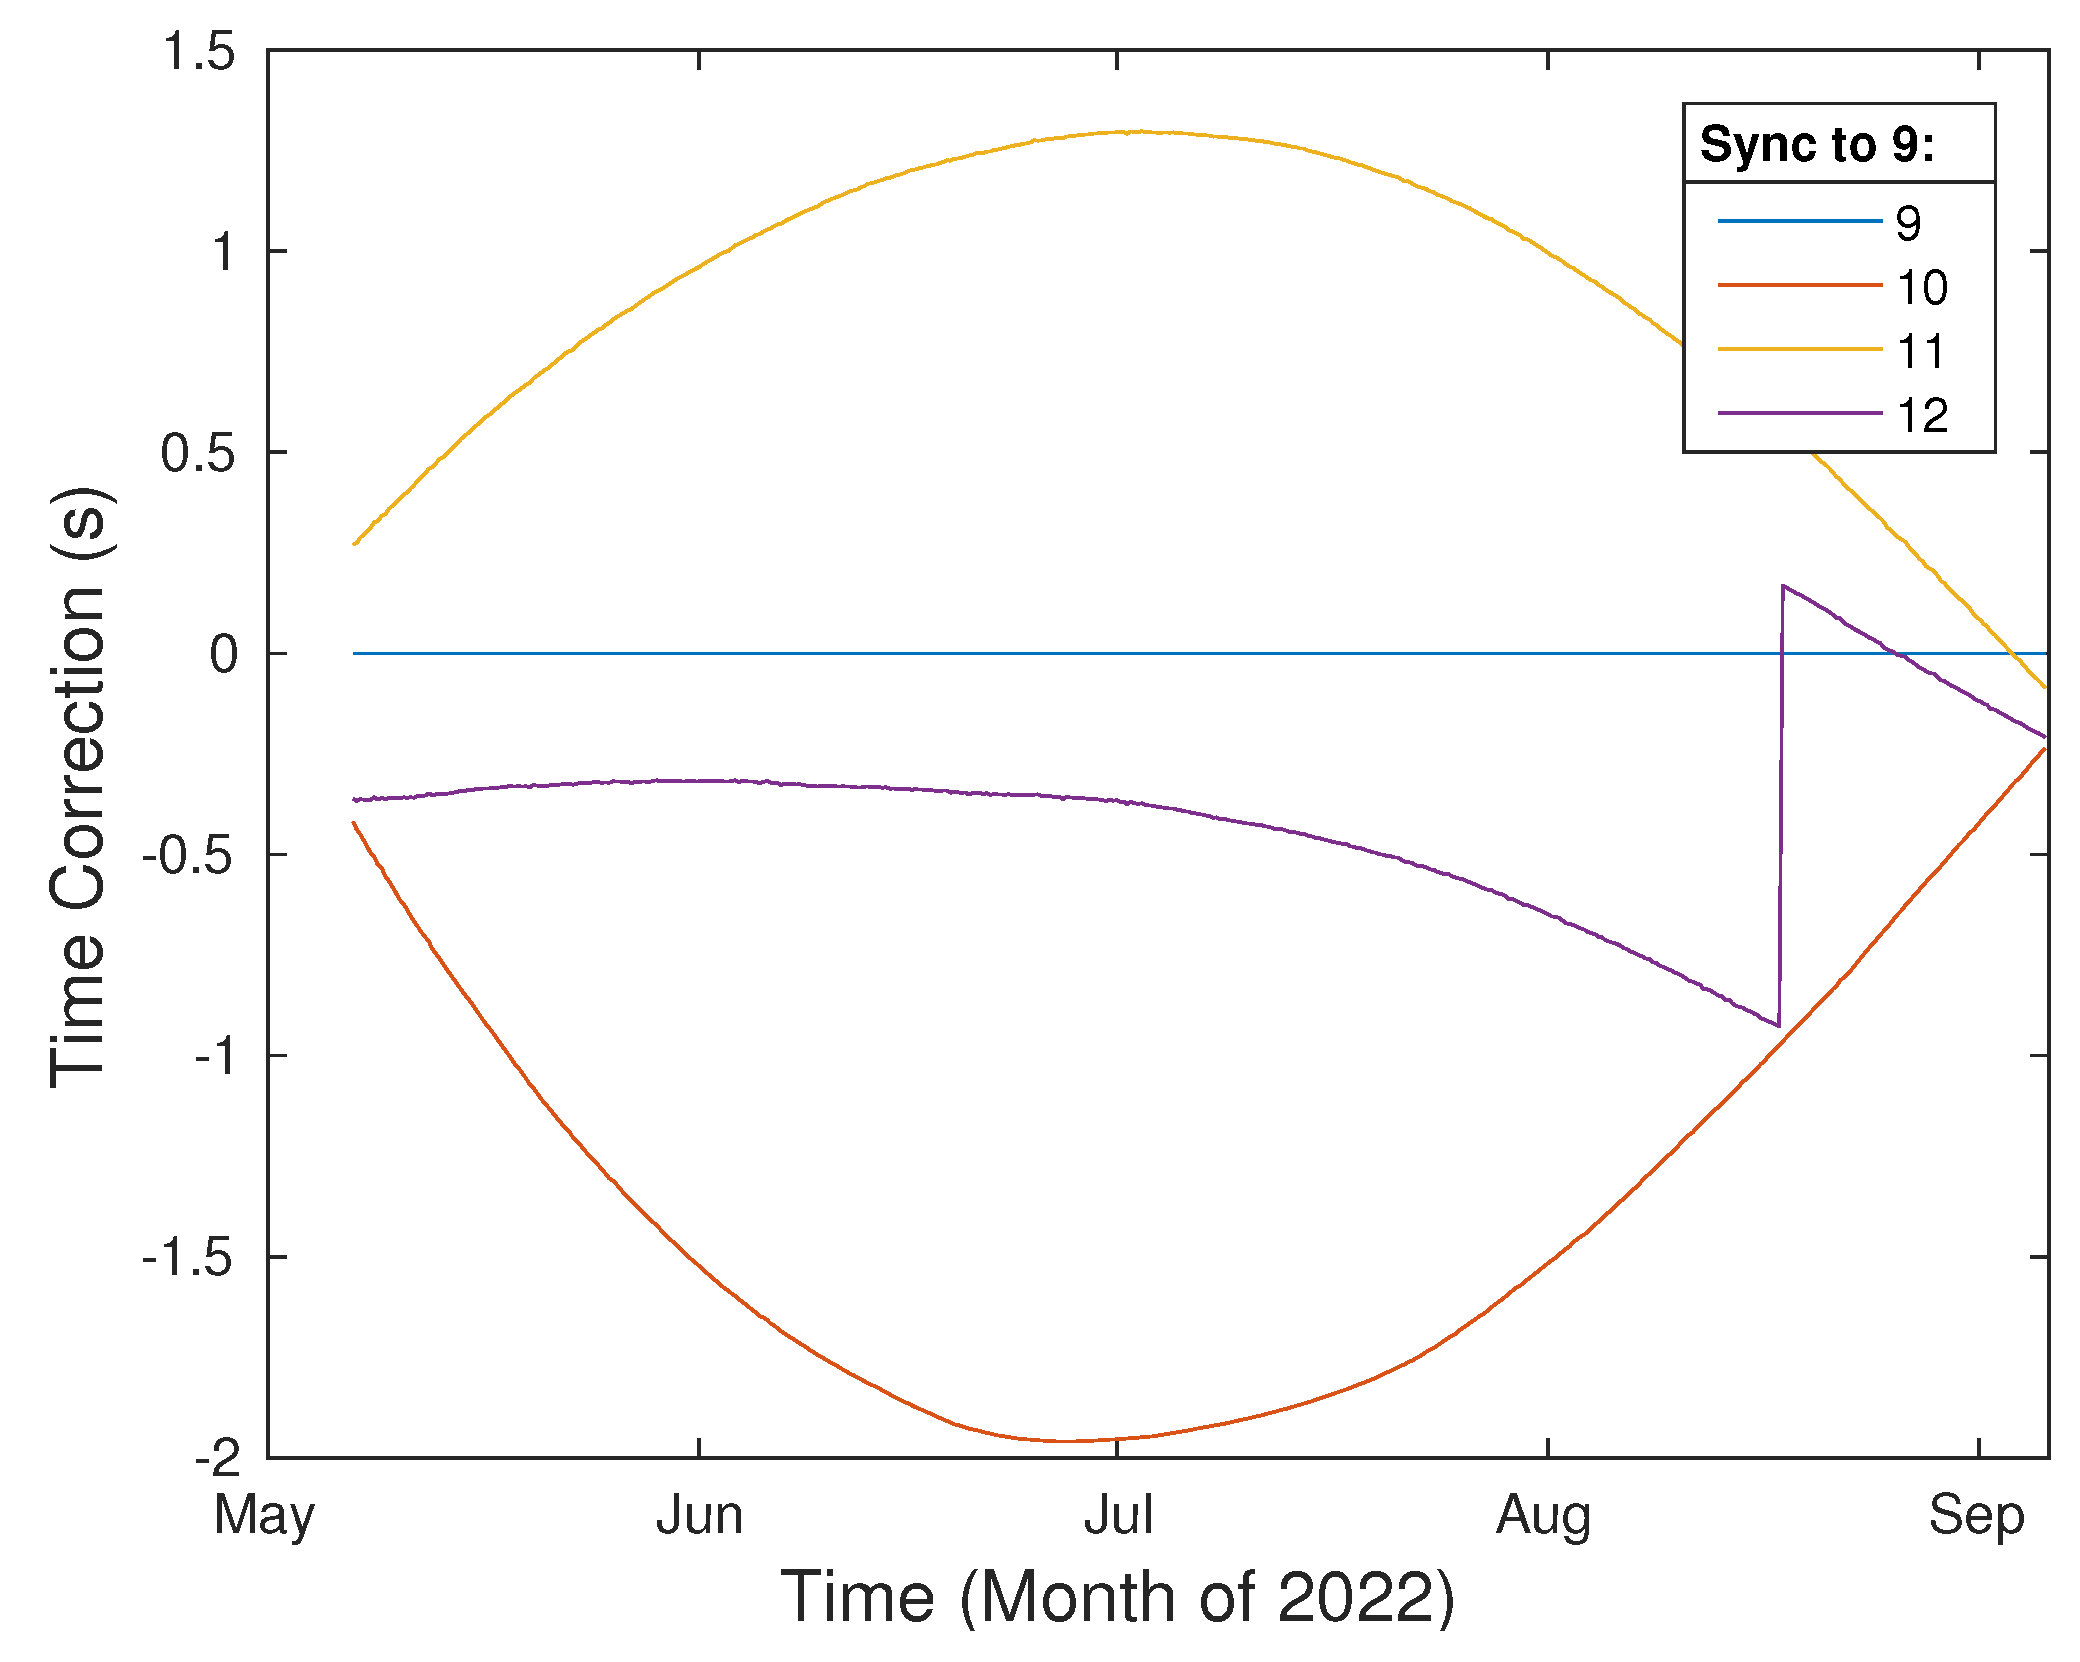
Pairs of HR2 receivers (sites 9-10, 10-11, and 11-12) were synchronized. Given that all adjacent pairs could be synchronized, it is straightforward to obtain the time corrections that will synchronize HR2 receivers at sites 10, 11 and 12 with the HR2 at site 9 (Figure 3). Usually the dominant term for the nonlinear time correction is quadratic so we were surprised to observe an abrupt 1 s jump for the HR2 clock at site 12. Site 12 is nearest to a highly turbulent area associated with Black Rock; a small island close to the northeast corner of the TED area. It is possible that the SUB at site 12 became unstable and crashed into the seafloor, perhaps causing an interruption of the power supply. Alternatively, Innovasea suggested that infrequent 1 s clock jumps were a feature of some early HR2 models but changes to firmware are thought to have eliminated that problem. Regardless, this clock jump cannot be dismissed as `a bad data point’ because all the following estimates of time correction are consistent and they are all calculated from independent measurements.
The time corrections in Figure 3 are two orders of magnitude smaller than the linear clock skew that Innovasea software automatically corrects for when data are downloaded. Synchronizing an array of HR2 receivers is useful if that array were to be used for localizing the position of a passing tag, but that is not sufficient to relate HR signals detected by moored HR2 receivers to the concurrent position of the STD.

3.3. Synchronizing moored HR2 receivers to the STD

The requirement is to use time as a parametric variable in order to match a detected signal to the concurrent position of a drifter. Drifter positions are synchronized to UTC, so the task is to synchronize the array of HR2 receivers (at moorings 9–12) to UTC. Our method requires an assumption which will turn out to be justified by the outcome.
Short term drifts were conducted for a few days in June and a few days in July. The HR2 carried by the drifter operated over short periods between clock sets and the corrections for linear clock skew were only -5.5 s and -3.9 s for the June and July experiments, respectively. Assume for a moment that the uncorrected nonlinear drift would have been much smaller than linear clock skew so that the HR2 suspended beneath the drifter records detected HR signals to within a fraction of a second of UTC. The suspended HR2 detects the HR tag suspended 5 m below it very well. Drifts 11 and 31 occurred within the first pair of time sets (i.e., June experiments) and during those drifts the HR2 at mooring 9 also detected the suspended tag. The intervals between the tag transmissions are variable so — by lining up the pattern of detection times measured by the HR2 on the drifter with the pattern of detection times measured by the HR2 at mooring 9 — we can synchronize the HR2 at mooring 9 to the HR2 suspended by the pole float. In this way all clocks become synchronized to UTC within a fraction of a second. (Signal time of travel is small enough to be ignored for present purposes.) Drifts 54 and 55 can similarly be used to synchronize HR2 receivers for the July experiments.
Table 2 shows how much the HR2 at mooring 9 needed its time advanced in order to match the times of the HR2 attached to the pole-float/UTC. The time advance is small compared with linear clock skew (root mean square 132 s) over the duration of HR2 moorings so it was fair to assume that data downloaded from the HR2 suspended on the drifter would have matched UTC to within a fraction of a second. It is noteworthy that Table 2 indicates nonlinear time drift that is common to the four HR2 receivers and that that is large when compared with the differences between receivers (Figure 3). More relevant for our present purpose, not accounting for the time increment in Table 2 would correspond to a 4 ms 1 current causing about 60 m error when aligning drifter position with times that signals are detected.
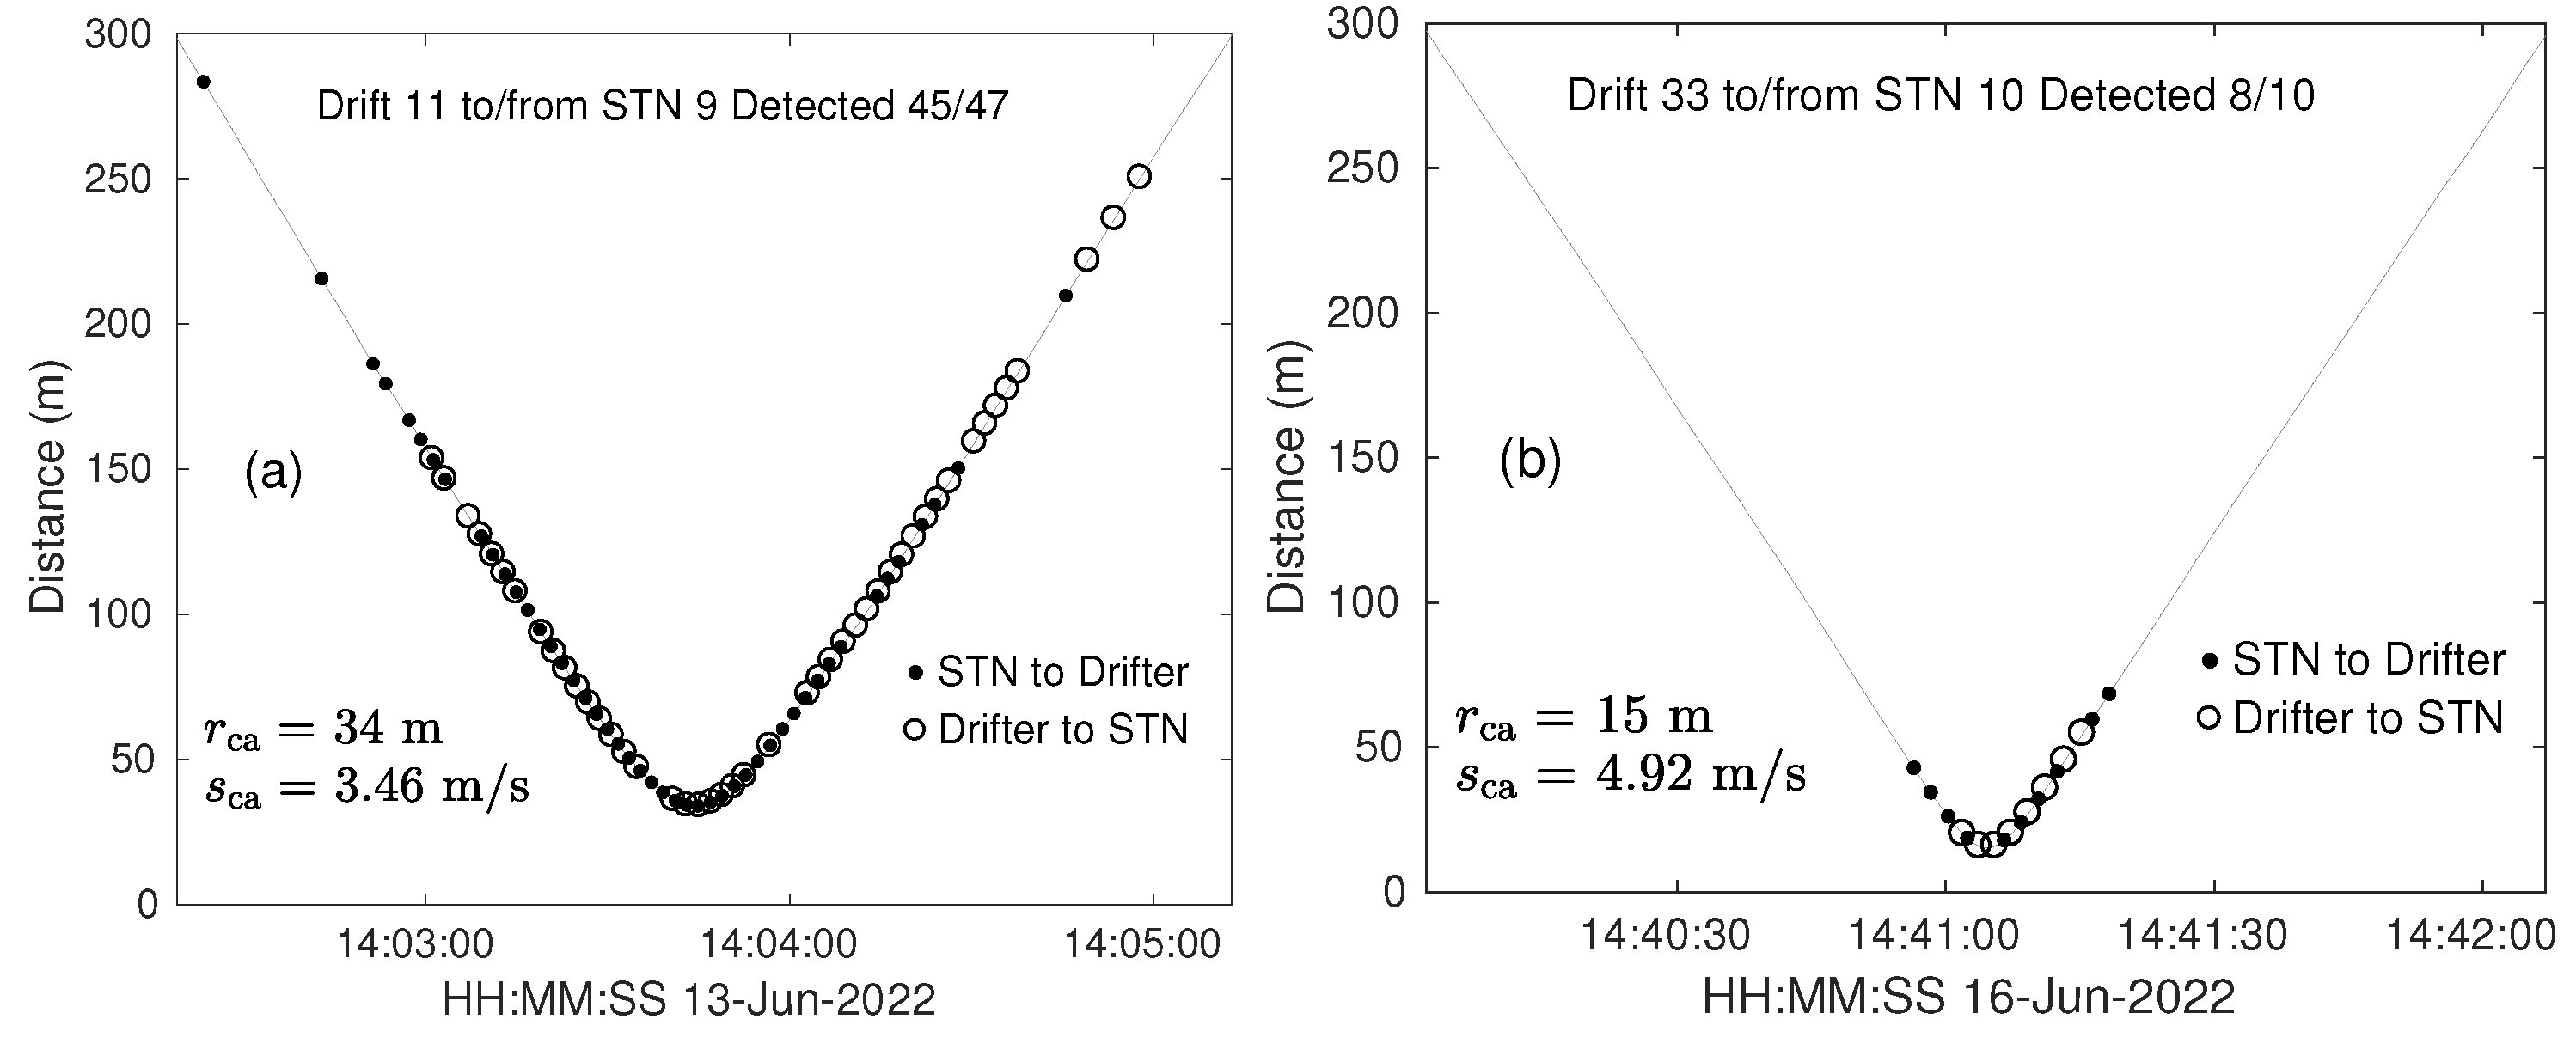
Figure 4 shows HR signals detected at various ranges along drift tracks. Upwards propagating signals travel from the moored tag to the drifting HR2 and downwards signals from the 25 m tag on the drifter to the moored HR2. With a 3.46 ms 1 flood current, both upwards and downwards HR signals are detected over many ranges. When flood current is 4.92 ms 1 the signals are detected at relatively small ranges (up to 69 m in Figure 4b). Using (1), corresponding FVCOM speeds would be 3.15 ms 1 and 4.42 ms 1 for which interpolating from earlier work [13] gives detection efficiencies 0.75 and 0.09 at 75 m range respectively. Consistent with low detection efficiency and reasonably accurate synchronization to UTC, most detected signals are clustered near the range of closest approach in Figure 4b.

3.4. Number of STD tracks detected by the receiver array

Of the tagged fish that pass through the TED area, it is of particular interest to know how many are detected by the moored receiver array. This question can be addressed by asking how many of the tagged STD drifts were detected. Given that the STD carried HR tags at four subsurface depths, we can also address the question as to whether or not swimming depth of a tagged fish matters for signal detection.
Tracks were always detected when current speed was low, so let us select the 45 fast tracks that had | s ca | > 3 . 5 ms 1 for more detailed analysis. For each drift we counted the number of times, N D A , that each tag was detected by the array of moored HR2 receivers. Thus, for a given tag we construct a I = 45 element vector N D A = ( N D A 1 , N D A 2 , , N D A 45 ) containing the number of times the tag was detected during each of its 45 drifts. Counting the number of drifts for which the array detected a specific tag at least once gives the number, N PEDA , of passing events detected by the array
N PEDA = i = 1 I min ( N D A i , 1 ) ,
as recorded for each tag in the first row of Table 3. Of the 45 fast drifts that passed the HR2 array, 44 were on the flood tide.
Fewer drifts were detected by a tag nearer the sea surface (Table 3). In part this may be because the HR2 receivers were on the seafloor so a tag is a little further away if it is near the sea surface. The other mechanism is the possibility that a HR signal taking a direct path might interfere with its reflection from the sea surface. The time lag between direct and reflected paths is
δ t = 1 c ( H 2 + ( D X + D R ) 2 H 2 + ( D X D R ) 2 )
where H is the horizontal distance from a transmitter at depth D X to a receiver at depth D R . Considering typical values for the tag closest to the sea surface ( H = 50 , D X = 3 , D R = 34 ) gives a 2 . 2 × 10 3 s time lag which is likely to cause interference, given the 6 × 10 3 s duration of a HR signal.
Each of the four tags had an average transmission interval of τ = 2 s. If the tags had been programmed for a T s transmission interval then the number of transmitted signals would be reduced by a factor of τ / T so the expected number of detected signals e N D A i during the ith drift (past the array) would be reduced by the same factor
e N D A i = τ T N D A i
and the expected number of the I drifts detected would be
e N P E D A = nint i = 1 I min ( e N D A i , 1 ) .
As the transmission interval is increased, successive rows in Table 3 show that fewer drifts will be detected by the receiver array. Reliable performance at the TED location requires tags with HR transmission intervals 2 s.
The STD experiments included a 27 m subsurface V16 69 kHz PPM tag that transmitted every 10 s. Due to mistakes in the field, that tag was only turned on for 55 of the 62 drifts. Although the V16 tag was powerful (158 dB), it was only detected for 29 of the 55 tracks and those tracks were usually slow 1 . 6 < | s ca | < 4 . 3 ms 1 (mean 3.3 ms 1 ). The 69 kHz PPM tag was not detected for 26 fast tracks where current speeds were 4 . 3 < | s ca | < 5 . 1 ms 1 (mean 4.6 ms 1 ). For the two STD tracks with | s ca | < 2 ms 1 , the 69 kHz PPM tag was detected by VR2W receivers at 8 and 9 of the 11 mooring locations, respectively. Detection at great range was expected when current speed was low [23], but it strongly contrasts with the performance 69 kHz PPM tags when current speeds increases. Usually, the interval between PPM signals is much larger than 10 s, for fear of interference when more than one tag is present. A transmission interval of 60 s would be more typical and in that case it should be expected that only 21 of the 55 passing tracks would have been detected. For measuring probability of fish-turbine encounter, PPM tags are deemed inadequate in the TED area.

3.5. Comparison of detection efficiencies at the TED area

The present line of moored HR2 receivers and tags can be used to obtain estimates of detection efficiency which can be compared with those previously reported [13]. Previous measurements were sometimes called into question because there were good physical grounds for the possibility that variable bathymetry blocked signals, even though bathymetry and signal paths could not be sufficiently resolved to determine where the signal was blocked [13].
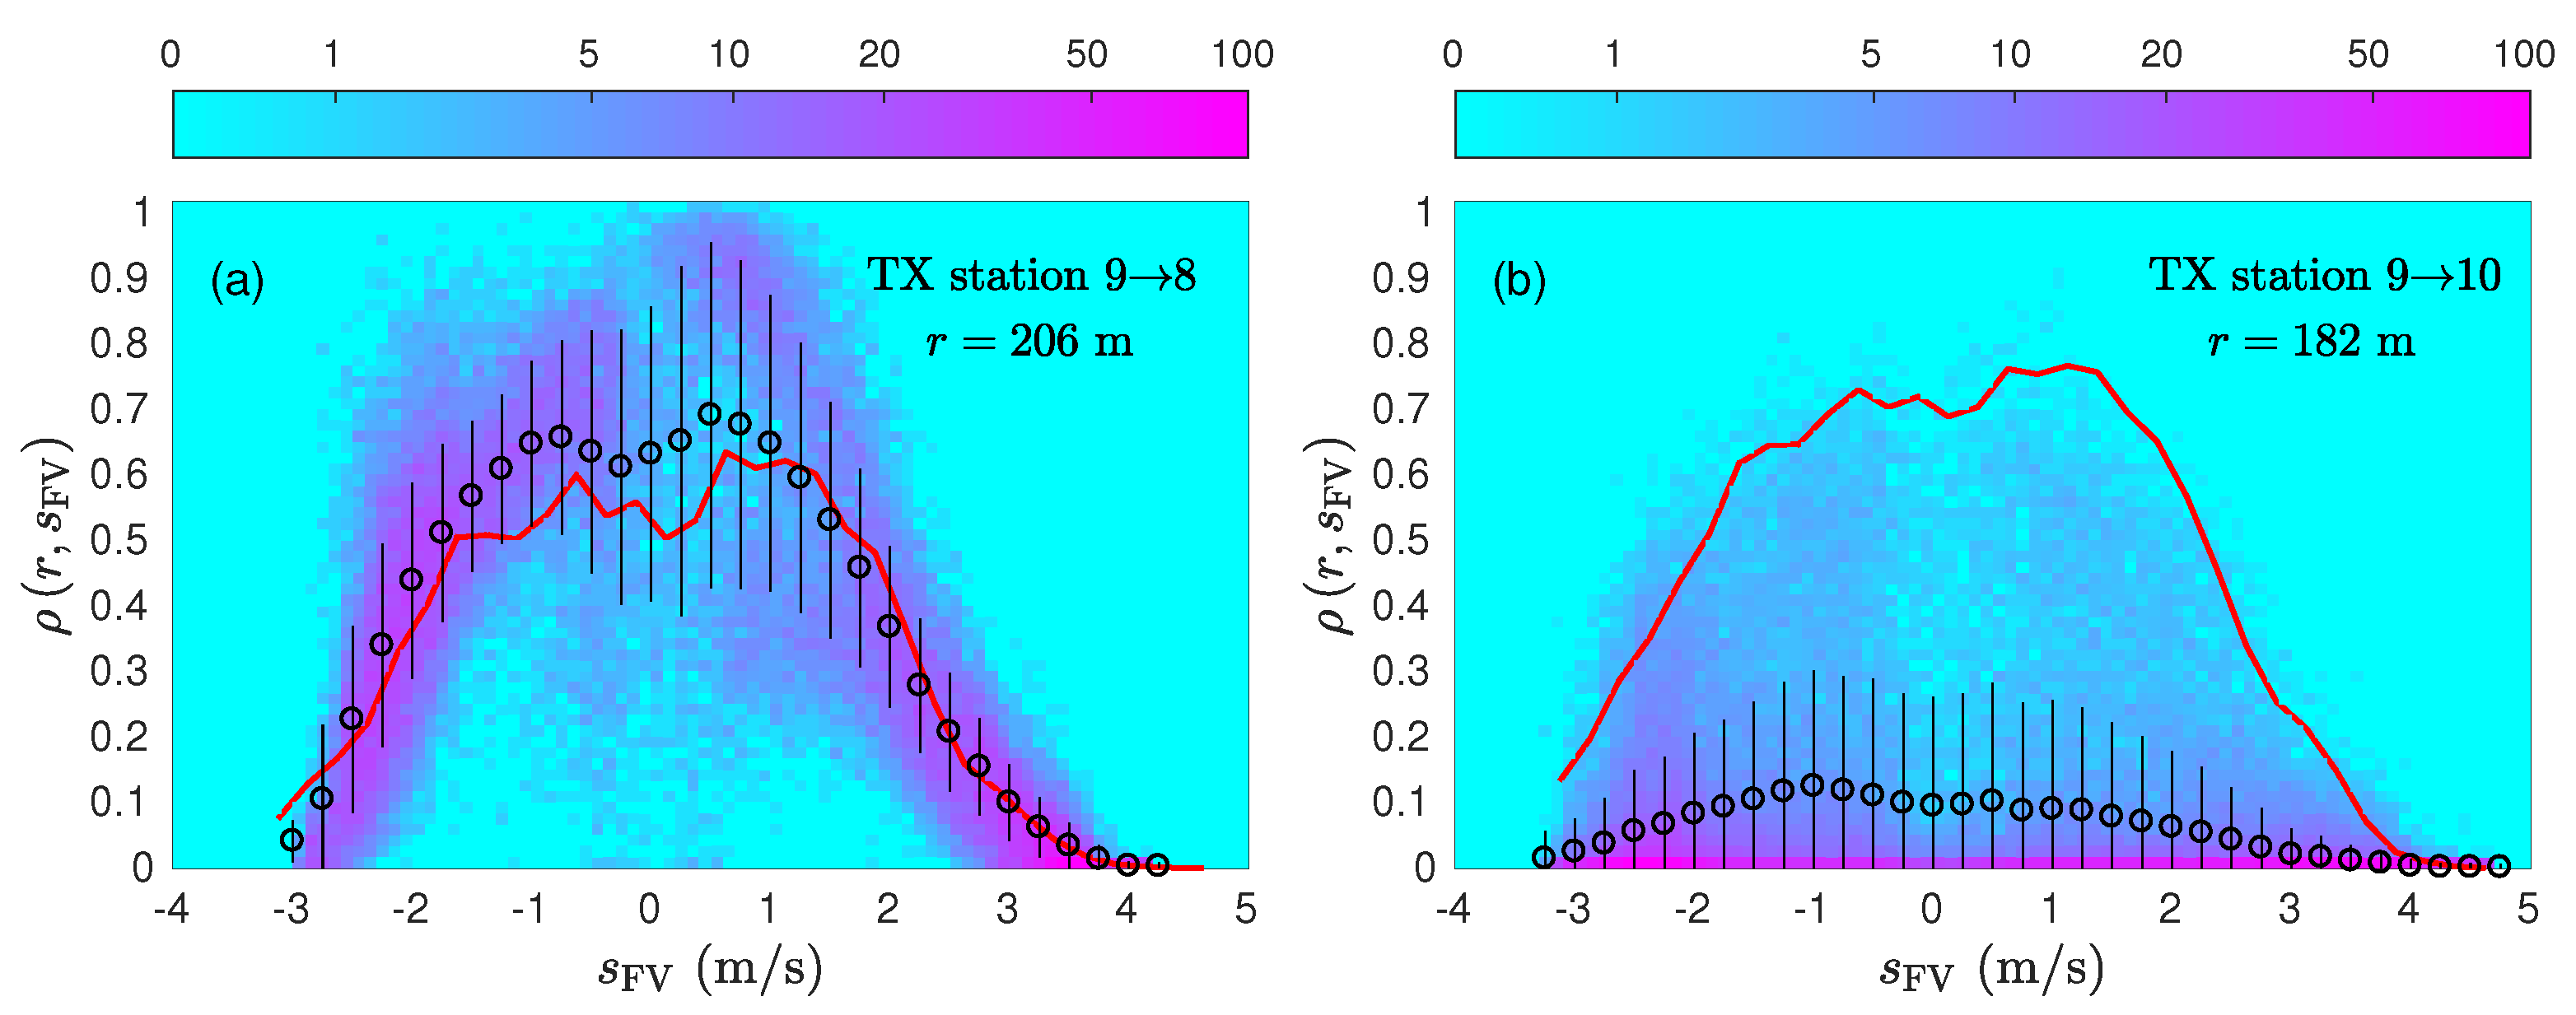
Figure 1b shows that moorings 8 and 9 are on high ground relative to the path between them. On the other hand, the path from mooring 9 to 10 is most certainly blocked by the edge of the volcanic plateau. To make a comparison between these paths, we consider how the HR tag at mooring 9 is detected by HR2 receivers at moorings 8 and 10. Figure 5a shows that from 19 July to 6 September the detection efficiency along the 9–8 path was very similar to that previously obtained [13] by eliminating measurements that were thought to be blocked. There was some mooring movement at site 8 but similar results were obtained during other time intervals when separation between moorings 8 and 9 was stable (Table 1). If anything, when currents are slow the signal detection is more efficient than had previously been measured. On the other hand, the obvious blockage caused by the edge of the volcanic plateau causes detection efficiency to be extremely poor for signals propagating from mooring 9 to mooring 10 (Figure 5b). These results provide a little more confidence in the detection efficiencies obtained by [13] and also indicate that they apply immediately to the south of the TED area.
The 4 SUBS used to monitor the TED area (i.e., moorings 9-12) carried a HR tag on the tail fin and a HR2 mounted inside the streamlined hull, so that enabled detection efficiency to be estimated as a function of FVCOM current s FV when the range is about 1 m. Detection efficiency varied from 0.997 to 1.000 and so can be considered to be effectively 1 for all current speeds observed at the TED area. This confirms the previous result [13] which was based upon more tenuous evidence (a HR signal with a fake identity) and a complicated line of reasoning.

3.6. Number of HR signals expected to be detected during a passing event at the TED area

Define a passing event as a tagged drifter (or tagged fish) passing a moored HR2 receiver. For present purposes, passing events of interest result from the drifter (or fish) being advected by fast tidal current. Tagged drifter measurements enable direct measurement of the number, N D , of HR signals detected by a specific HR2 receiver during a passing event. In our study the drifter tracks follow a straight line to a reasonable approximation (Figure 2) so N D r ca , s ca , τ .
We expect that an estimate N E for N D could be calculated from detection efficiency [13]. Let the position of the drifter relative to a HR2 be a function of time ( x ( t ) , y ( t ) , z ) such that range from drifter to HR2 is also a function of time r ( t ) = x 2 + y 2 + z 2 . Then the number of HR signals that are expected to be detected during a passing event is found by integrating along the passing track as follows
N E r ca , s ca , s FV , τ = 1 τ ρ r ( t ) , s FV d t
A comparison of N E with N D requires that the position of the moored HR2 receiver be accurately known. At the TED area, recall that only moorings 9 and 10 did not move (Table 1). For each of the tag passing events, begin by comparing the number of HR signals detected by the array N D A comprised of receivers at moorings 9 and 10 with the number expected to be detected N E A . Summing over the 44 tracks that had s ca > 3 . 5 ms 1 , the number of HR signals detected from each tag N D A it is evident that near surface tags are detected much less frequently than the deeper tags (Table 4). However, tag depth has only a small effect on the number of signals expected to be detected N E A by the array. The above calculation of N E , and thence N E A , does not take into account the possibility of interference due to the signal being reflected from the sea surface. These three facts indicate that interference by reflected HR signals (3) can reduce the chances that a near surface tag will be detected (e.g., Table 3).
It is notable that the expected number of detected signals is greater than the number actually detected (Table 4). Such overestimation might happen because the range testing [13] obtained few measurements during the fastest currents and because errors in FVCOM modelling can sometimes assign detected signals to a fast current when they were were actually detected in slow currents for which detection efficiency is higher. Also, some signal paths to the HR2 at mooring 9 may have been blocked by the edge of the volcanic plateau (Figure 1b and Figure 5b).
Of the 44 passing events, we can use (2) to determine the number of passing events that were detected by the array ( N PEDA ) and similarly the number of passing events that were expected to be detected by the array
N PEEA = i = 1 45 min ( N E A i , 1 ) .
Comparing N P E D A with N P E E A (Table 4) shows that fewer tracks were detected than expected. Rescaling N E A by a factor of 0.78 (consistency with the 28 m tag) did not bring the expected number of detected tracks into alignment with the measured number. Even a factor of 0.48 (consistency with the 2.25 m tag) was of little help.
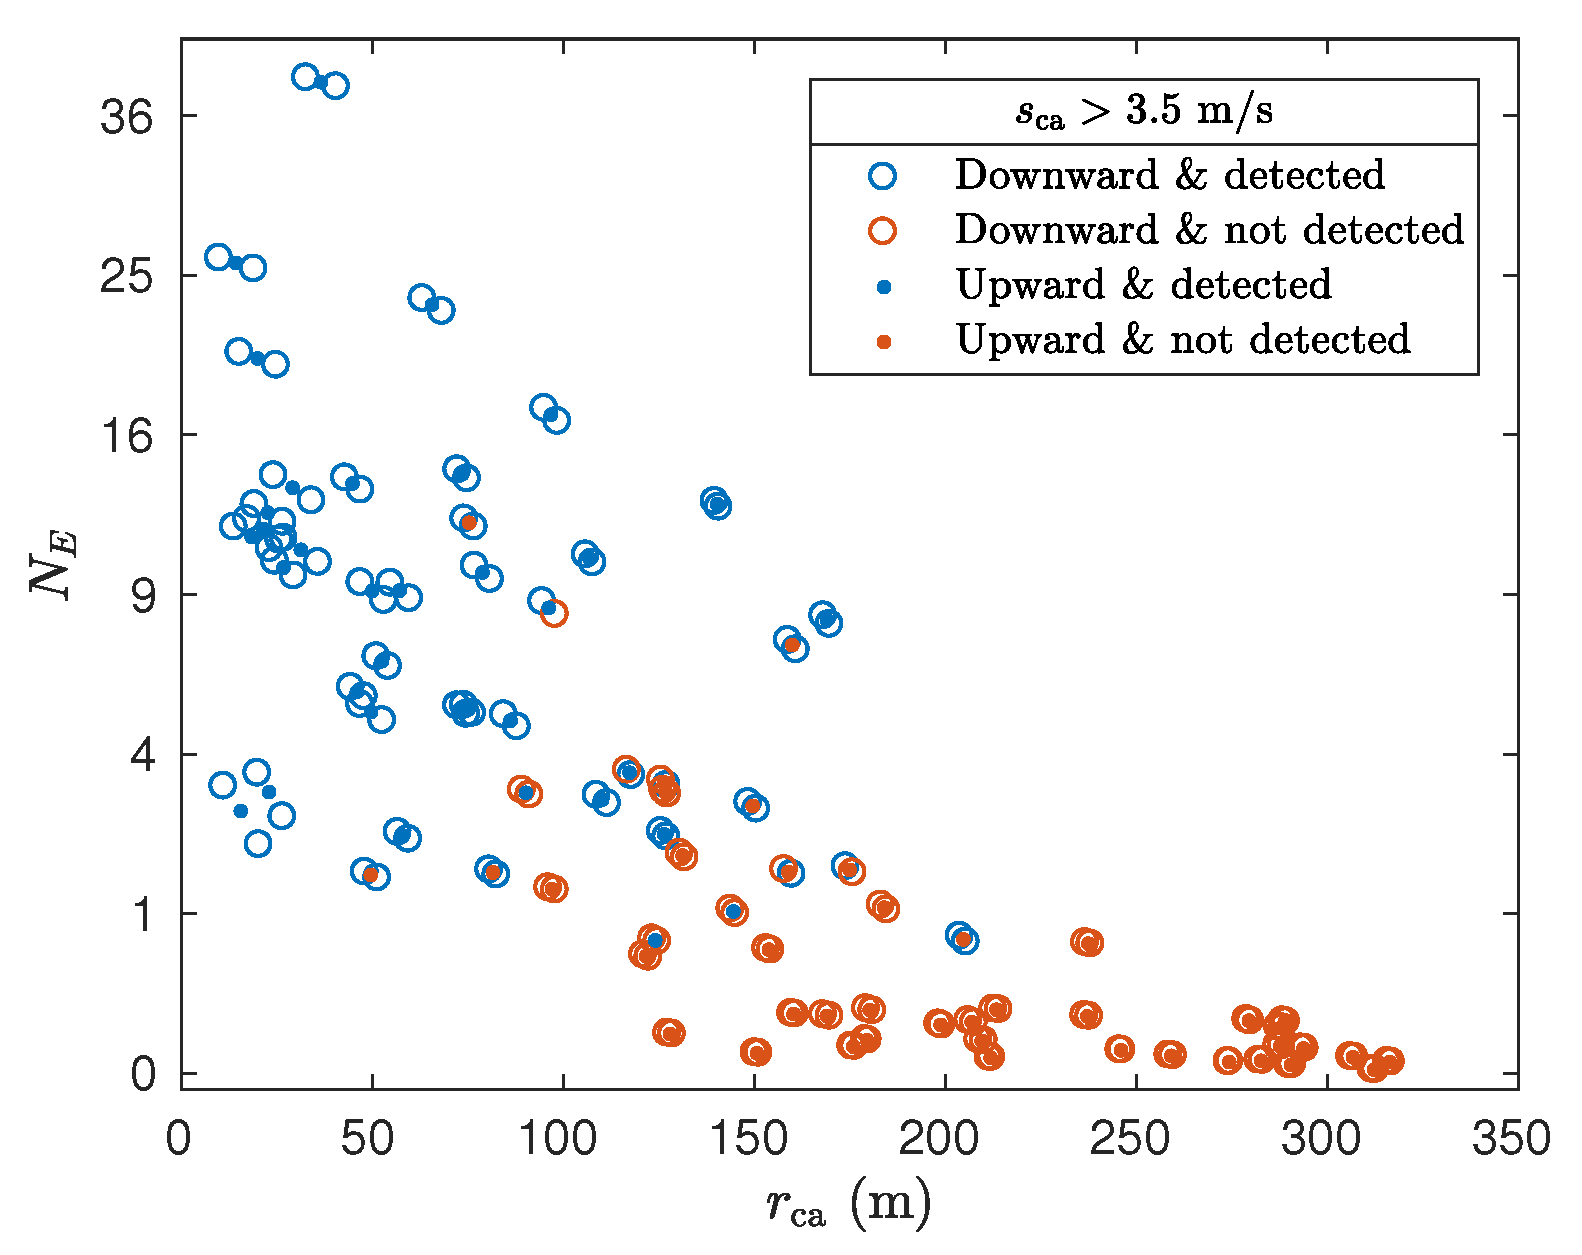
In addition to “downwards” paths from the drifting tags to the moored HR2 receivers, there were also “upwards” paths from the moored tags to the HR2 receiver that was suspended at 21 m depth (5 m above the lowest tag suspended by the drifter). Let us now consider the upwards paths from moorings 9 and 10 along with downwards paths from the two lowest tags on the drifter to moorings 9 and 10. Selecting the 44 passing events with s ca > 3 . 5 ms 1 , it is confirmed that N E generally declines with increasing r ca (Figure 6) although there is a good deal of scatter, some of which might be associated with s ca varying from track to track. Each downward path had a similar upward path.
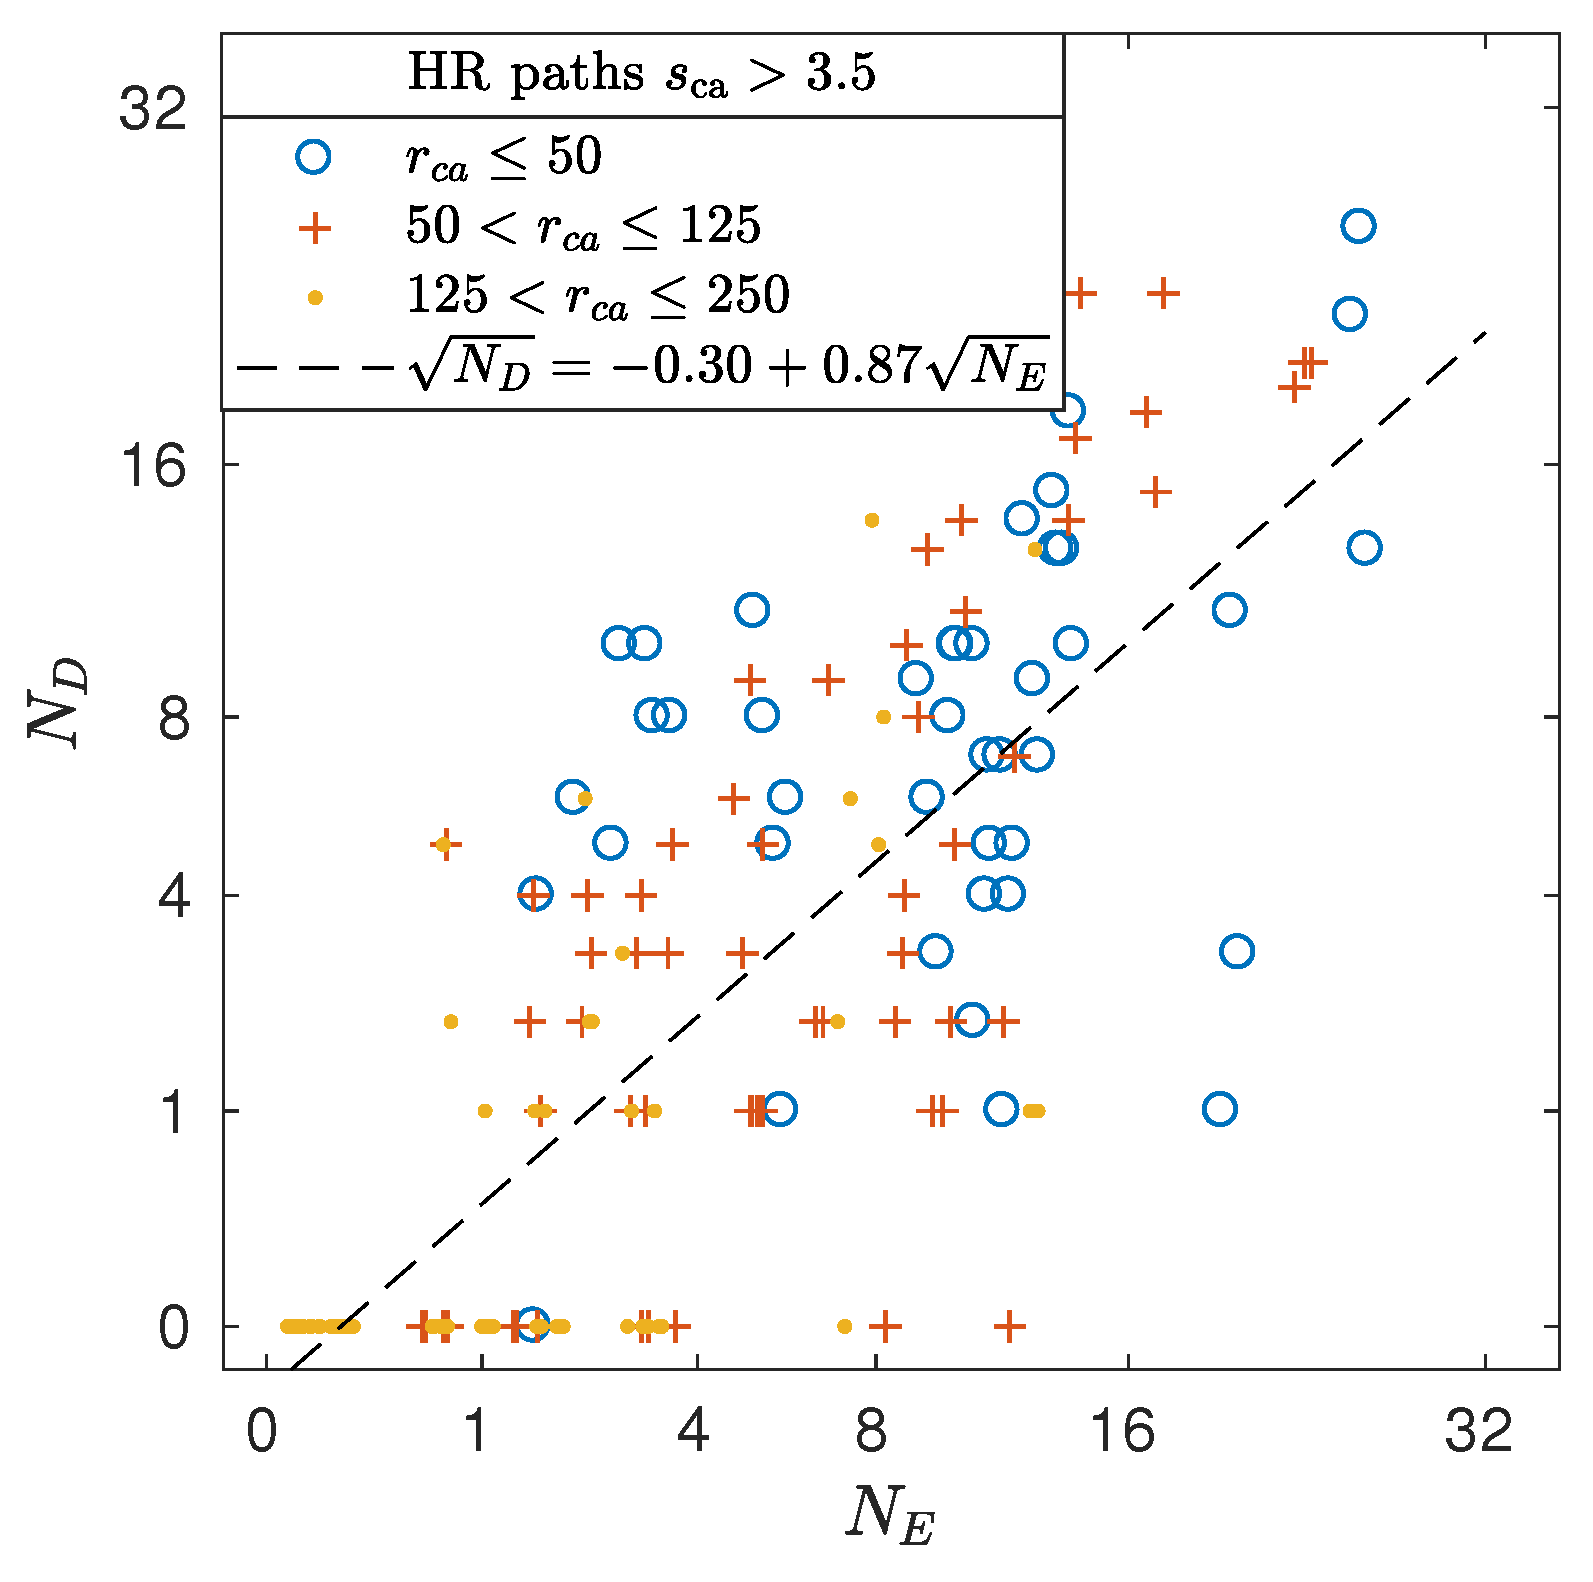
Figure 6 stratifies N E into those for which the corresponding measurement obtained N D > 0 (blue) and those for which N D = 0 (red). HR2 receivers did not detect HR signals when nint N E = 0 but there are a problematic number of occasions when nint N E is considerably greater than 1 and yet no signals were detected by the HR2 receiver. (The operator nint ( x ) gives the nearest integer to x.) To see the issue more clearly, Figure 7 plots the number of detected signals N D as a function of the number expected nint N E . Clearly, sometimes more signals are detected than expected and sometimes fewer. One might expect that sometimes no signals are detected when several are expected, but it is very odd that it never happens that a few signals are detected against an expectation that none are expected. Rescaling N E so that N E = N D (e.g., Table 4) made no difference. This unexpected asymmetry of Figure 7 points to something being wrong about the calculation made using (6).
Equation (6) uses an empirical functional form ρ ( r , s FV ) for detection efficiency in the sense that each black circle in Figure 5 represents an average of a cloud of many detection efficiencies calculated from many 2-minute time intervals. Rather than plot each 2-minute detection efficiency, Figure 5 uses colour to represent their distribution on the ρ s FV plane. Clearly, detection efficiency is a fluctuating variable relative to its long term average. Representing the fluctuations of detection efficiency as ρ ( t ) gives
N E + N E = 1 τ ρ r ( t ) , s FV + ρ t d t
Both ρ and N E average to zero for a sufficiently large ensemble, but tag signals may only be detected for 30 s (or less) during a passing event (Figure 4). A fluctuation ρ ( t ) cannot be expected to be totally independent of the fluctuation ρ ( t δ t ) shortly before. Such correlation has implications for detection passing events. Fluctuations about ρ r , s FV will not change the total number of signals detected over a large number of passing events but correlations will distribute those detections differently among passing events. Where correlations cause a drifter track to be detected more often than for uncorrelated fluctuations, it will still be counted as detection of a single passing event. Where correlations cause a drifter track to be detected fewer times, a passing event might be shifted from being detected to not being detected. Mathematically speaking, if N E , i signals are expected to be detected along the ith drift track then calculation of the number of passing events (tracks) that are detected N PED involves a highly nonlinear operator
N PED = nint i min ( N E , i )
so including fluctuations N E , i will change the outcome. Thus ρ ( r , s ca ) is not sufficient in and of itself to calculate whether or not a passing event is expected to be detected and will tend to overestimate the number of passing events that are detected.

3.7. LTD tracks and FVCOM current

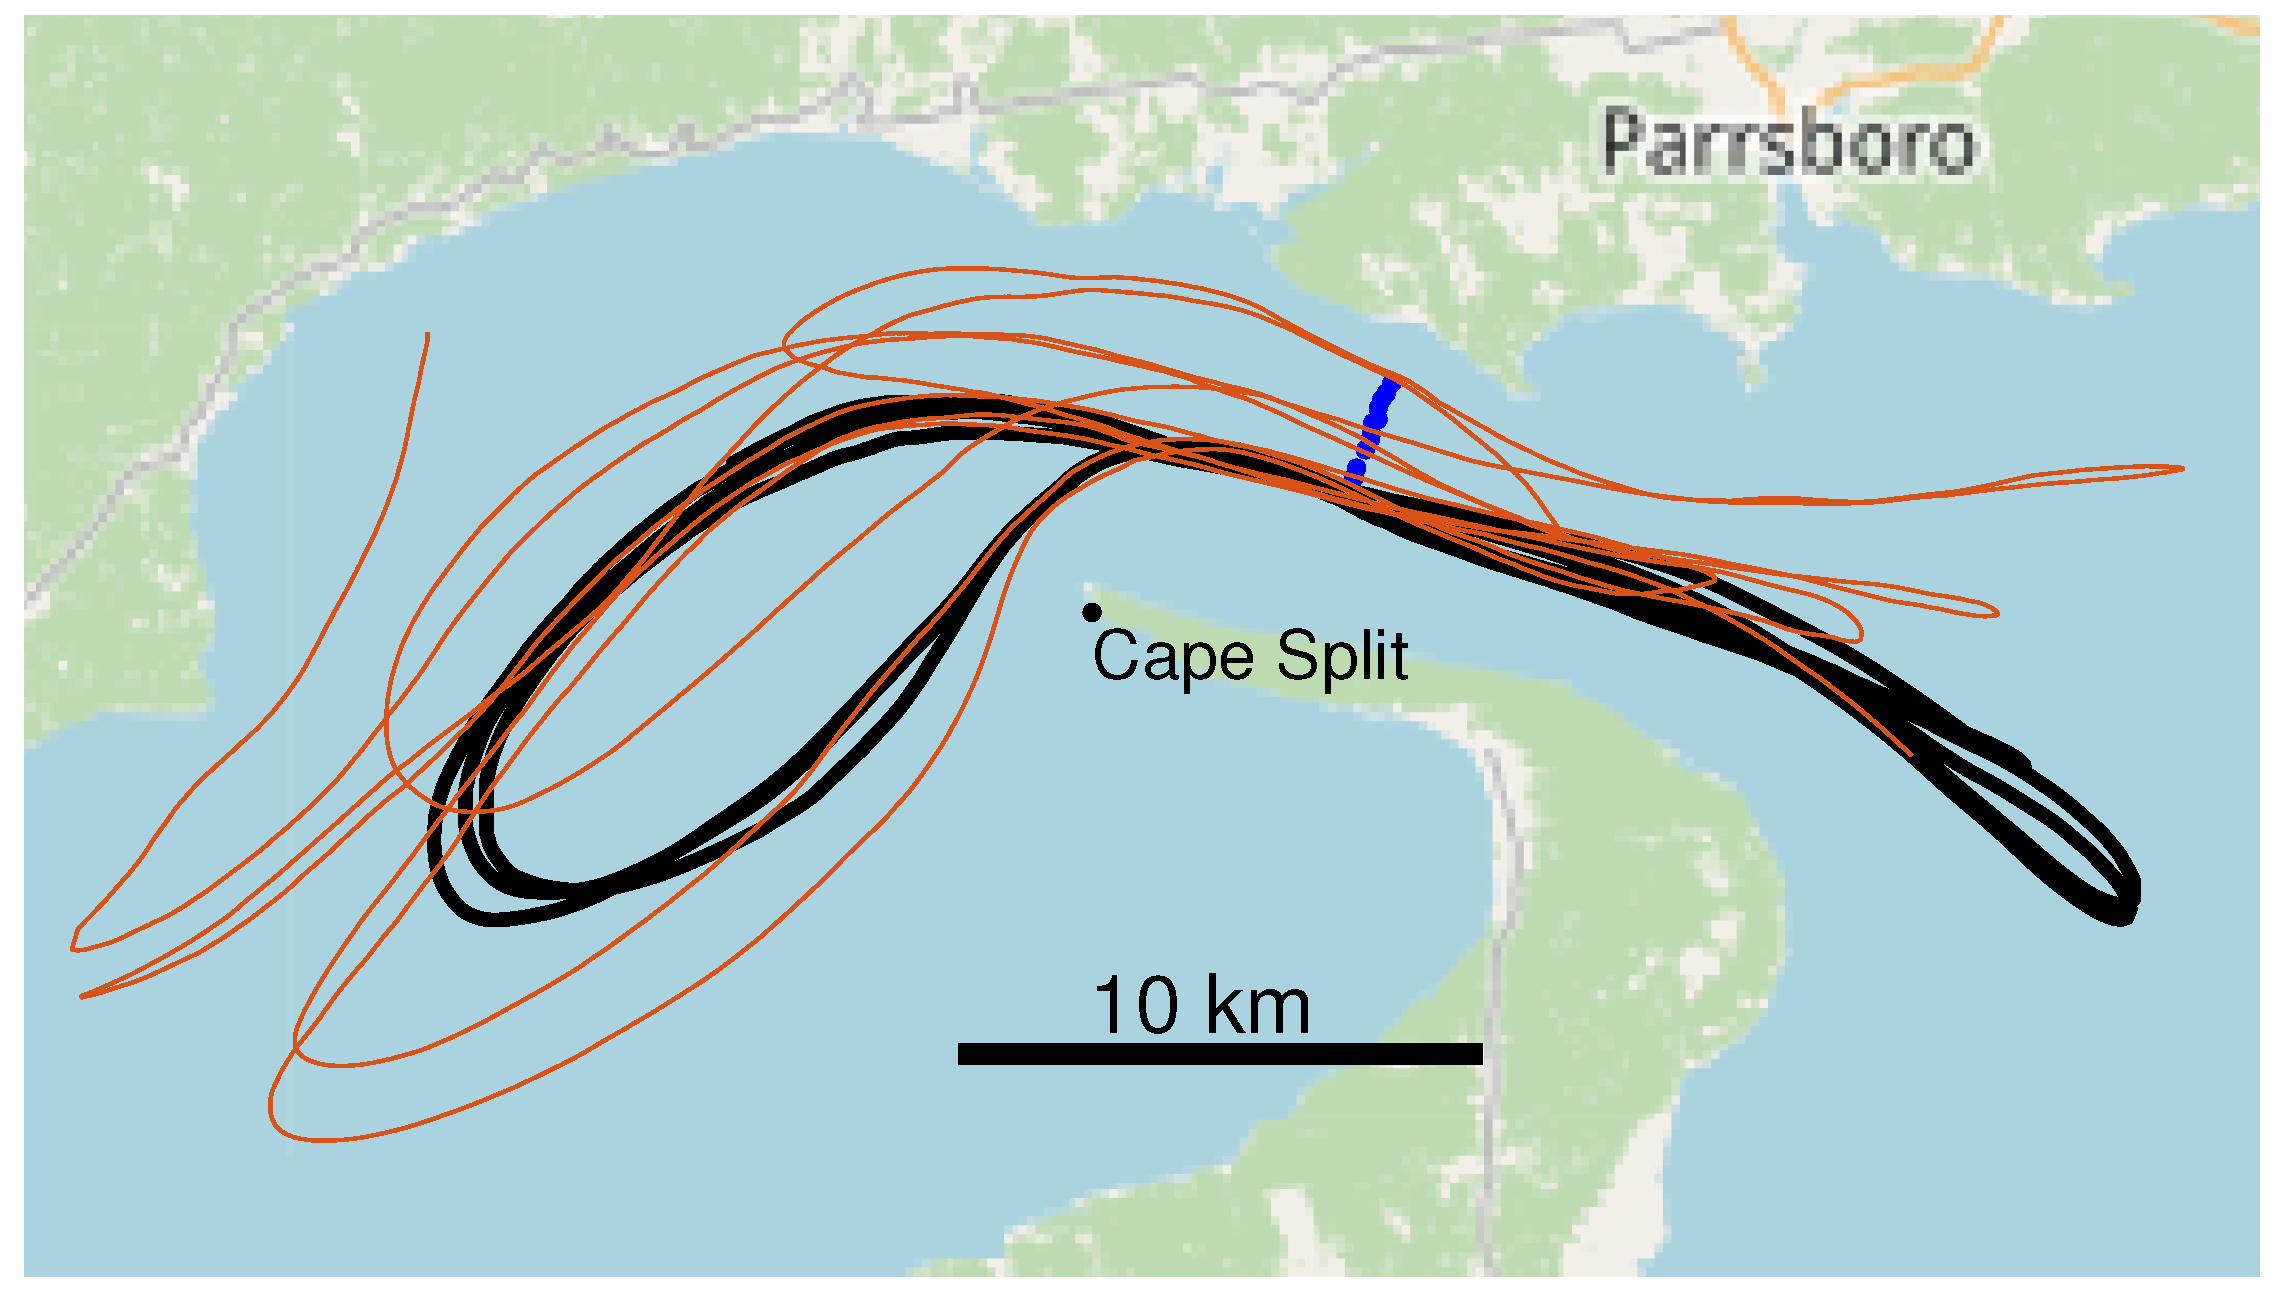
LTD tracks mostly pass near the middle of Minas Passage. Figure 8 shows a quasi-stready track (black) that passes repeatedly through mid-channel of Minas Passage when tides are running fast. Other quasi-steady trajectories have been identified [14] but they are of less interest for the present project because either they do not enter Minas Passage or they arrive at the study site near the low-water slack-tide. Tracks that pass through the TED area have more variable trajectories over subsequent tidal cycles, as shown by the orange trajectory in Figure 8 and as reported for other trajectories [14]. As a result, the LTD are mostly suited for measuring how well passing events are detected to the south of the TED area.
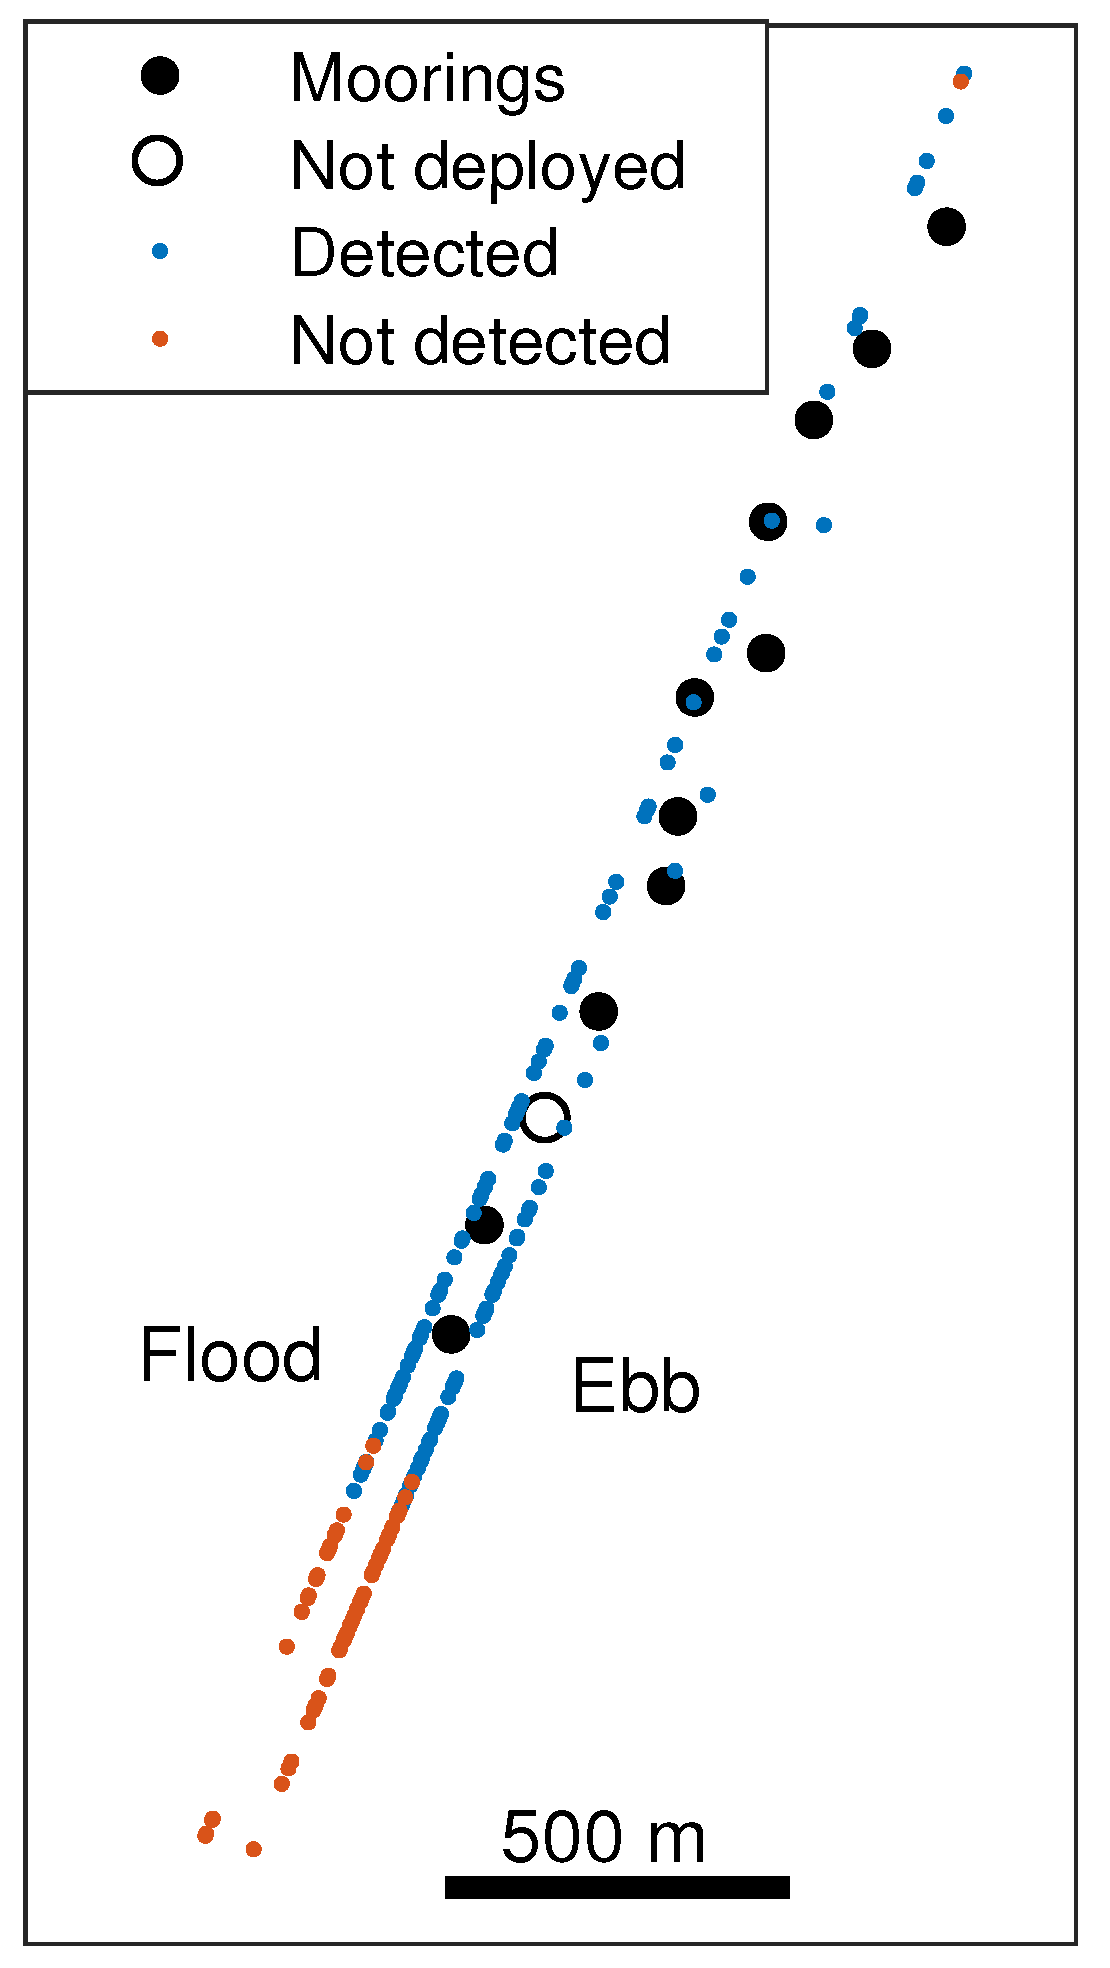
For the present analysis we will only be concerned with those LTD passing events that crossed an extended line through the array of HR2 receivers. Sometimes an LTD crossed the line but GPS position measurements were too infrequent for accurate analysis. Of the remaining LTD passing events, 103 were measured on the flood tide and 114 on the ebb tide (Figure 9). Each LTD carried 4 tags and the receiver array detected at least one of those tags for 81 passing events on the flood tide and 57 on the ebb tide. These detected passing events are coloured blue in Figure 9. On the flood tide, centrifugal effects associated with inflow around Cape Split [14] tend to cause passing events to be distributed more to the north than during ebb tides (Figure 9).
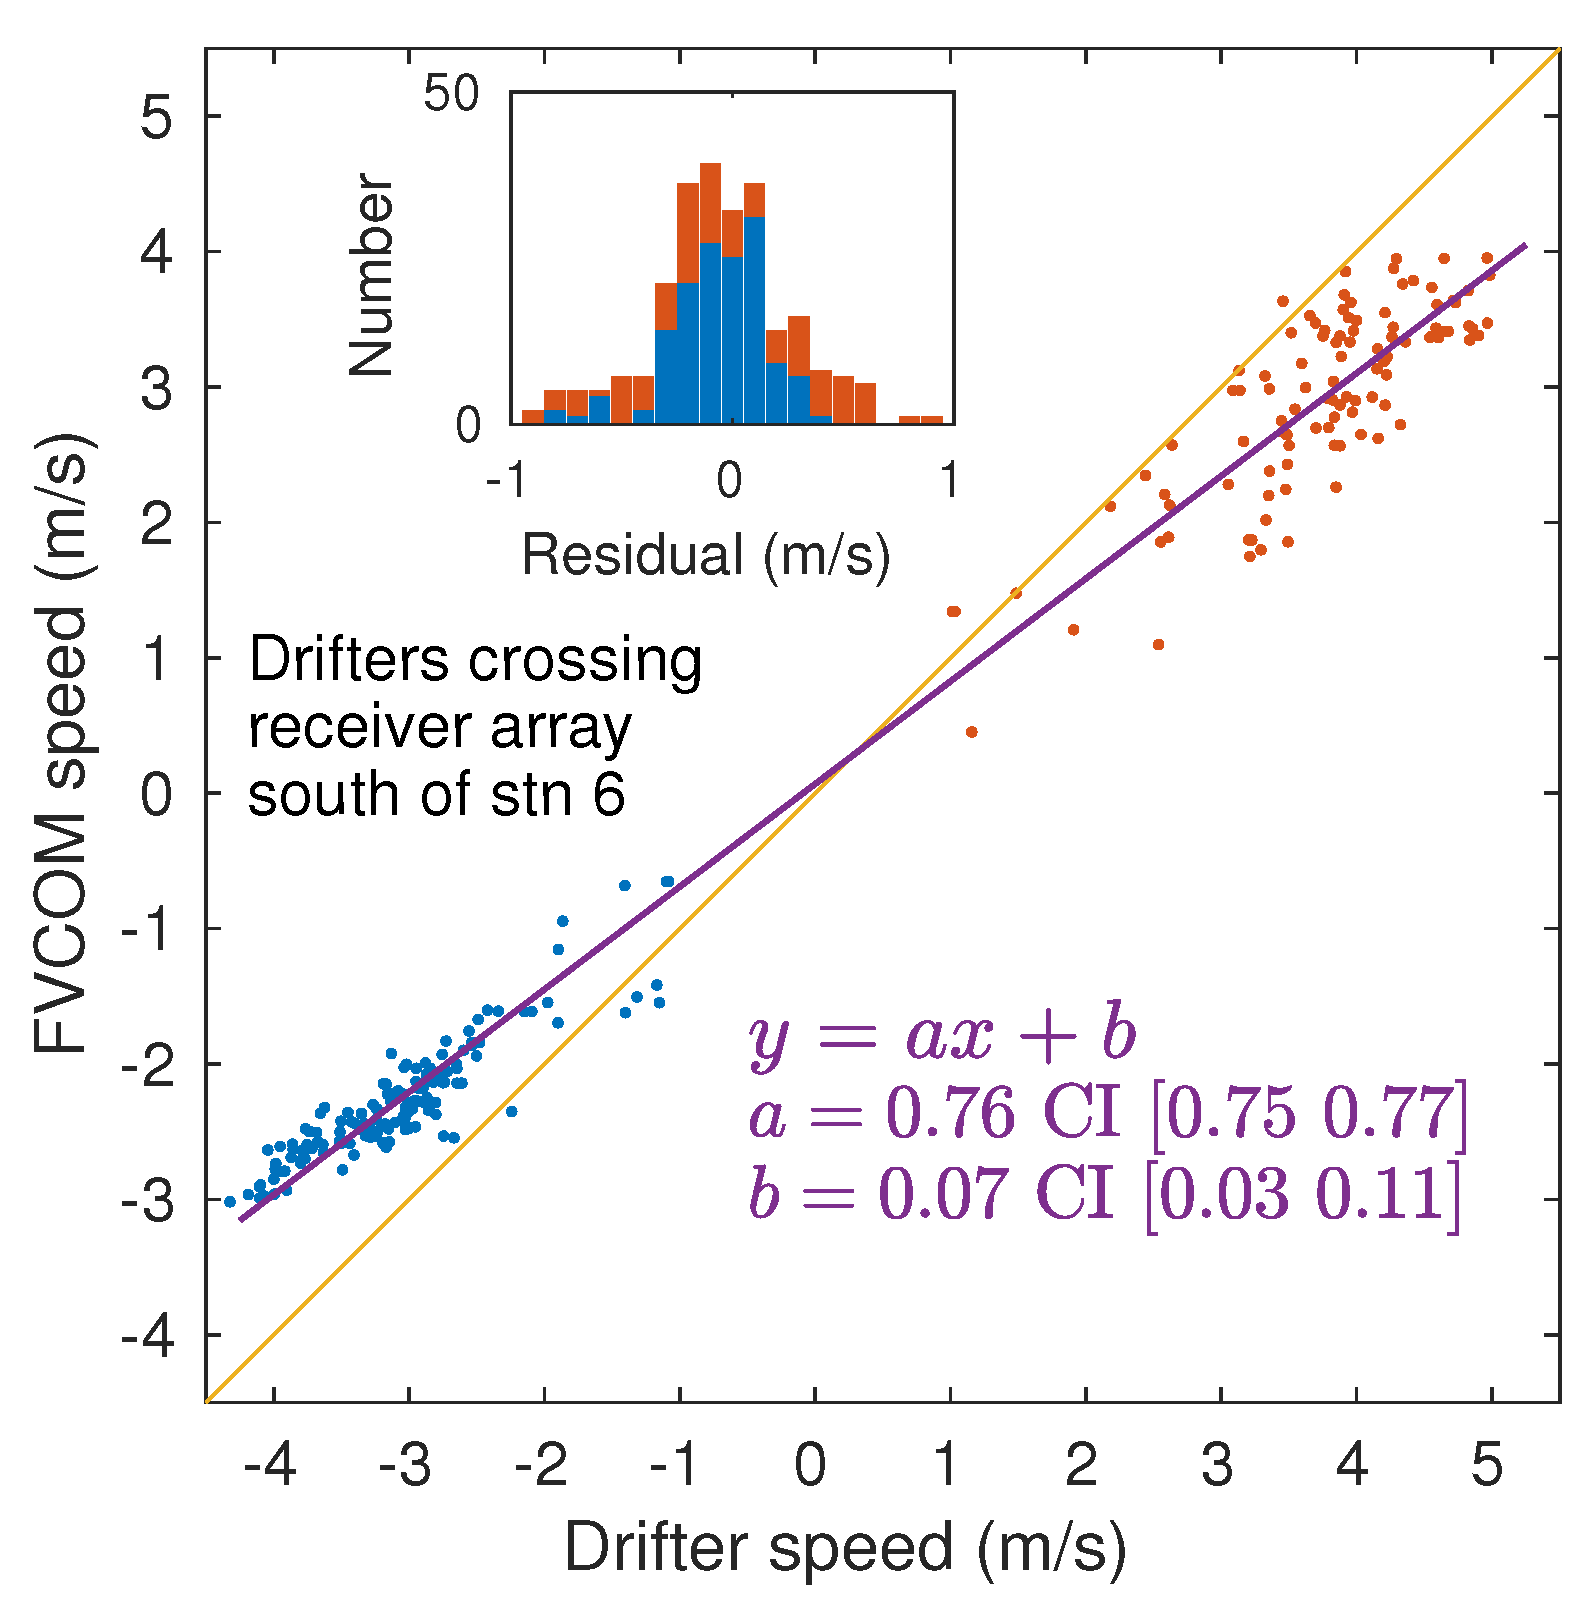
Figure 10 compares signed current speeds s ca obtained at LTD passing events south of mooring 6 with corresponding values of s FV obtained from the FVCOM simulation. In the TED area, FVCOM underestimated STD current speed by about 13% (1), whereas in deeper waters to the south, FVCOM underestimates LTD current speed by about 24%. Some of this difference may be attributable to the LTD being drogued at about 6.3 m depth. It is particularly noticeable that residuals show much more scatter about the fitted line on the flood tide than on the ebb tide (Figure 10). On the ebb tide the mid-channel current is well collimated whereas on the flood tide there is substantial cross-channel movement associated with strongly rotational flow around Cape Split (Figure 8).

3.8. Number of LTD passing events detected by the receiver array

When a tagged fish is detected we know that it has passed by our receivers but we have no way to know how many times it passed by without being detected. The blue dots in Figure 9 show 138 LTD tracks had at least one tag detected while passing within (or nearby) the HR2 array.
Of course, each LTD carried four HR tags at different depths so the 4 × 138 tag passing events should be examined before drawing quantitative conclusions about how well a tagged fish might have been detected by such an array. Analysis for this question begins by excluding those passing events that were undetected (orange dots in Figure 9) because these were simply beyond the area over which the array can monitor. It is generally understood that passing events are more likely to be detected when current speed is slow and it should not be assumed that detection of passing events on a flood tide will be the same as on an ebb tide. That suggests four categories to investigate; slow flood, slow ebb, fast flood and fast ebb.
The LTD passed the array 45 times on a fast flood tide s ca > 3 . 5 ms 1 . Counting the number of passing events for which the array detected a specified tag at least once gives the number of detected passing events for that tag, as shown in the top row of Table 5. None of the tags were detected on all 45 passing events, but 92% of the 4 × 45 tag-passing events were detected and tags at different depths were detected similarly. Doubling the interval between transmissions (i.e., τ = 4 s) did not change the number of detected passing events. Greater increases of τ reduced the number of detected passing events and that reduction was always a little more for the near surface (2.25 m) tag.
Each tag was detected during 35 of the 36 slow flood passing events (Table 6). Clearly if a tag was detected during a passing event then it was typically detected many times because greatly increasing the interval between transmissions only caused a modest decline in the number of detected passing events. This is generally consistent with Figure 4 which shows many more detected signals for a lower speed passing event than for a faster passing event, even though the faster event more closely approached a moored receiver.
Ebb tide passing events (Table 7 and Table 8) show similar trends to those of the flood tide (Table 5 and Table 6). Generally most tag passing events were detected and when compared to the STD passing events they were also detected relatively well for moderately increased τ . Also, it seems that signals reflected from the sea surface did not disrupt detection of near-surface tags for the LTD, although they did for the STD (Table Figure 3). Many of the LTD were detected by receivers moored at greater depth than those that detected the STD (Figure 1). All else being equal, (3) shows that time lag between the direct signal and its reflection will be greater for a receiver at greater depth but that is partly offset by the top tag being nearer the sea surface during the LTD and the overall effect is not so great as to avoid interference. Previous work found that reflected signals were more likely to be detected in shallow than in deep water [13] so that might reduce interference for the near surface tags of the LTD. Reflected signals are also less likely to be detected as significant wave height increases [13] and we note that calm conditions were selected for the STD whereas LTD spanned a range of weather conditions.

3.9. Number of HR signals detected by a receiver during a LTD passing event

In order to use the telemetry measurements to calculate probability of fish-turbine encounter we could consider a moored HR2 receiver as a proxy for a MHK turbine and obtain the probability that a tagged fish would pass within a distance of the receiver that is commensurate with the projected frontal area A MHK that the blades of a MHK turbine would sweep. Before studying tagged fish, we use tags on drifters to evaluate whether or not a receiver detects a tag as it passes by at some range r ca and speed s ca at closest approach. HR2 receivers at moorings 1, 2, 4-7 and 9-10 showed no evidence of being moved and mooring 8 did not move much. Let us therefore consider how receivers 1, 2, and 4-10 detected tags at 19 m and 28 m depth on the LTD.
In the TED area, Eulerian measurements of detection efficiency ρ did not have flood-ebb symmetry with respect to modelled tidal current so ρ was represented as a function of signed speed s FV . The LTD provides an accurate current measurement s ca at the time of a passing event whereas currents from FVCOM simulations differ in various ways (Figure 10). For the LTD measurements, we found that N D had flood-ebb symmetry with respect to measured currents and could be represented as a function of | s ca | . It is unclear how well this symmetry in N D applies to the TED area because the LTD mostly crossed the mooring line to the south of the TED area.
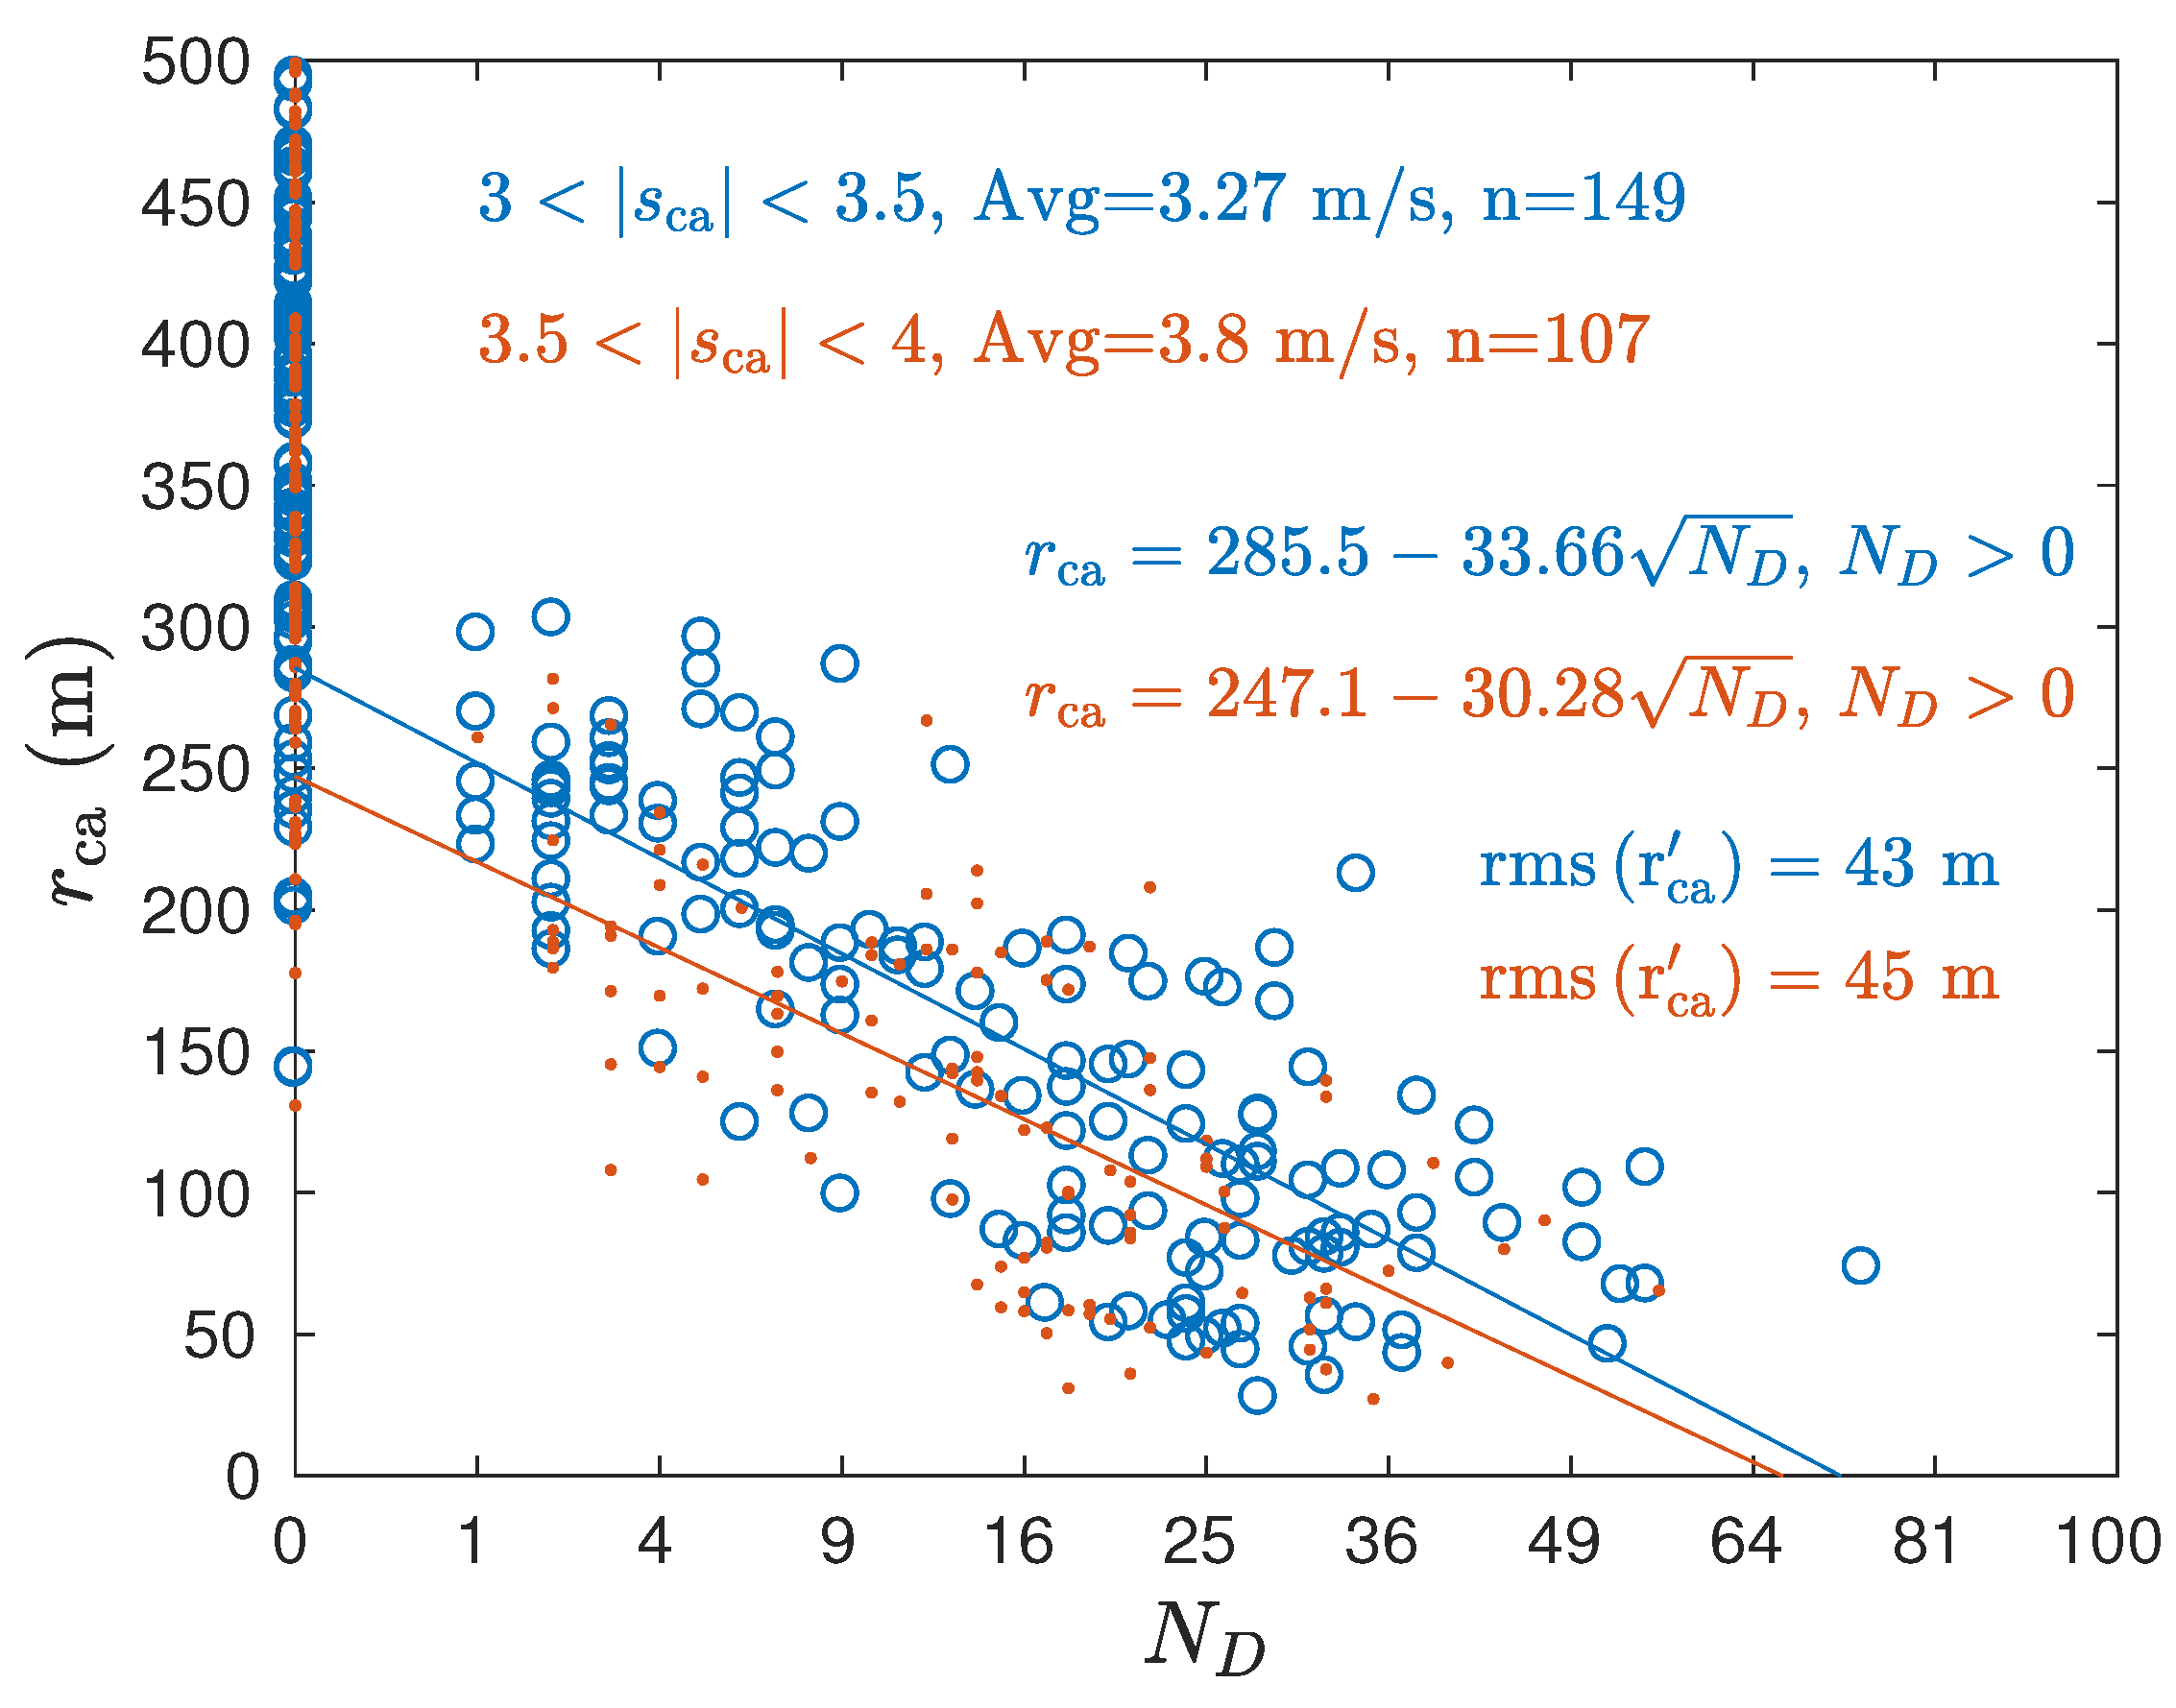
Given flood/ebb symmetry, Figure 11 groups measurements according to current speed | s ca | and N D is plotted as a function of r ca . For N D > 0 , r ca declines linearly with respect to N D . A best linear fit of N D to r ca was obtained for each speed group as documented in the figure. Having measured a value of N D from a tag on a LTD that passes by at a time when current is within one of the plotted speed groups, the fitted equations in Figure 11 enable an estimate of its range of closest approach and the variation about that range. Similarly, evaluating r ca for N D = 1 / 2 gives a typical minimum range λ LTD for the transition from a tag on a passing LTD being detected or not detected. λ is a key metric for calculating probability of encounter [25].
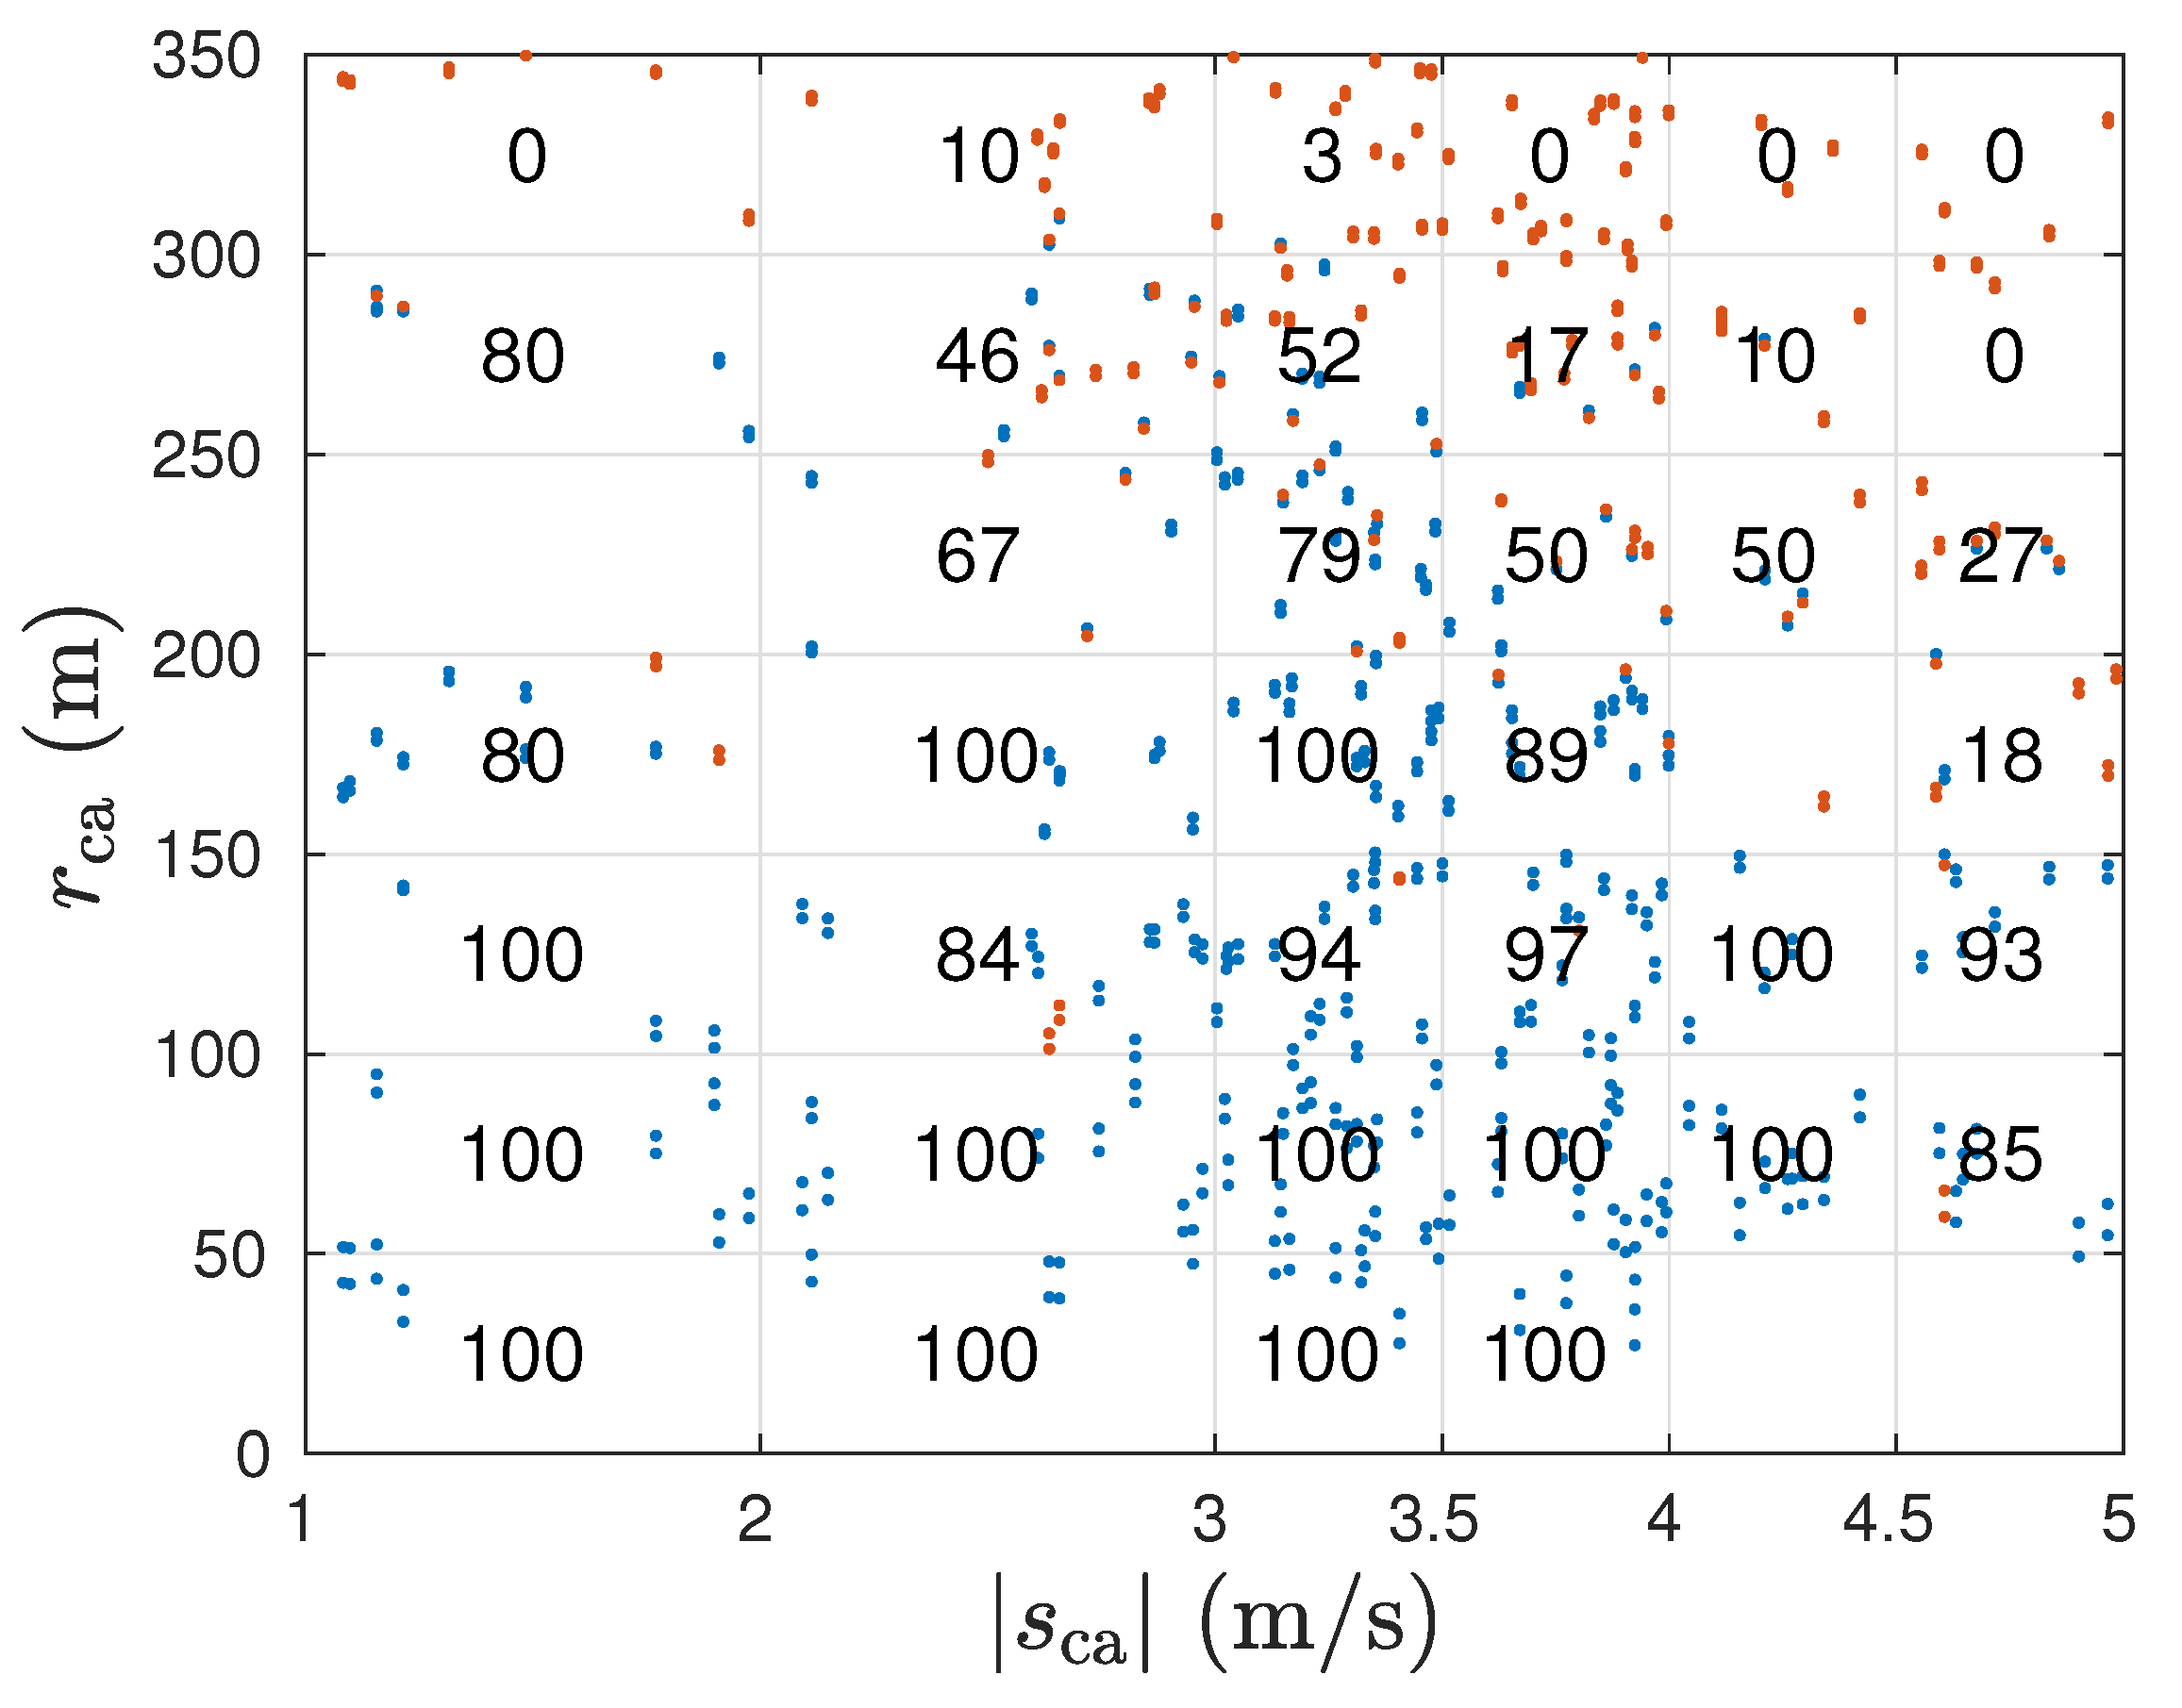
The LTD measurements can be used to obtain the probability p PED that a passing event will be detected by identifying which of the tag-LTD passing events were detected by a HR2 receiver at r ca and | s ca | . Each tag passing event is marked by a dot in Figure 12, with blue dots indicating a tag passing event that is detected (i.e., N D 1 ) and red dots indicating an undetected tag passing event. For each r ca , | s ca | bin, p PED is the ratio of the number of blue dots to the number of red and blue dots. Thus for each range-speed bin, we enumerate the percentage of tag passing events ( 100 × p PED ) that were detected in each speed-range bin of Figure 12. Repeating this exercise for the tags at 2.25 m and 9 m depth gave a similar result. For all current speeds measured by the LTD, there is a high probability that a LTD track will be detected providing it comes within r ca < 150 m of a moored HR2 receiver.
Figure 12 was obtained using HR tags that transmit every τ = 2 s. The ith dot in Figure 12 will have a corresponding number of detected signals N D i which can be transformed following (4) to estimate how well tags are detected when fish carry tags with some larger transmission interval T. Note, tagged-drifter experiments should use tags with small τ because (4) requires T τ .

3.10. LTD comparison of HR and 69 kHz PPM

Two of the LTD suspended a 69 kHz PPM tag (transmission interval 20 to 30 s) that was 0.5 m below the bottom HR tag (i.e., 28.5 m). For those two LTD, we identified all tracks in which any of the 5 tags (4 HR tags and a PPM tag) were detected. Table 9 compares the number of tracks for which the bottom HR tag was detected with the number of tracks for which the 69 kHz PPM tag was detected. Both tags were well detected at low current speed with the 69 kHz PPM tag being detected on a few of the tracks where the distance to a receiver was beyond the range of HR tags (Figure 9). At higher current speeds the HR tag was much more reliable for detecting passing events.

4. Discussion

Using efficient MHK turbines [24] to harvest tidal energy at locations with high power density [4] is a state-of-the-art undertaking but less intensive use of tidal energy is not a new thing. Humans have exploited energy of the turning tide ever since they began to use fishing weirs and marine craft [26]. Recently an intertidal fishing weir in Minas Basin was used to quantify fish species found in Minas Basin [9]. The basic principle of a fishing weir is to collect fish that would otherwise pass by with the tide, and that is a conceptual starting point for quantifying an upper bound on the number of fish that might interact with an operating MHK turbine in Minas Passage.
To extract tidal energy, MHK turbines can be mounted to some stationary platform [2]. If one were to replace the MHK turbine with a net that spans the same cross-current area A MHK swept by the turbine blades then the fish caught could be considered to approximate the number of individuals (belonging to captured species) that might pass through the operating turbine. Such measurements of the flux of fish through A MHK are in the Eulerian frame [15]. Ecologists have similarly attempted to use active hydroacoustic devices to monitor backscatter from targets in a water volume similar to that which fluxes through A MHK but it has not proven possible to enumerate individuals or identify species from the backscatter observed in Minas Passage [18]. Optical cameras provide much higher resolution [28] and visibility may be sufficient in Minas Passage for cameras to identify a subset of those fish that an active hydroacoustic device detected upstream as backscatter.
It would be most useful if the above Eulerian methods successfully measured the number of individuals (for some species) that might encounter a MHK turbine, but that would still leave outstanding issues. From a population point of view, what matters is not so much the number that encounter a MHK turbine, but rather the proportion of a local population that encounters a MHK turbine. That proportion is difficult to calculate from catch/backscatter numbers because the local population number is not known for any of the species captured by [9]. Also, sometimes two fish belonging to the same species may belong to different populations [11]. Such difficulties can be resolved by using acoustic tags [10,11] to track individuals belonging to a known population, which amounts to measuring in the Lagrangian frame [15]. Tagging studies have been published for striped bass of Shubenacadie River origin [10], Atlantic sturgeon that mostly originate from the Saint John River, New Brunswick [11], and alewife of the Gaspereau River stock [29]. Inner Bay of Fundy Atlantic salmon have also been acoustically tagged and released into tributaries of Minas Basin [30]. Acoustically tagging fish subsampled from some population enables a Lagrangian estimate of the probability that individuals might encounter a MHK tidal turbine. Lagrangian methods provide population-specific information that augments the previously discussed Eulerian methods which attempt to count all fish that pass through A MHK .
It was hoped that probabilities of fish-turbine encounter could be calculated from measurements of striped bass [10] and Atlantic sturgeon [11] which carried 69 kHz PPM tags. Such calculations require estimates of detection efficiency in order to transform detected signals into estimates of abundance or a probability distribution of distance from the detecting receiver [13]. Detection range testing in Minas Passage [23] showed poor detection efficiency for 69 kHz PPM tags when current speed was fast. Another study [31] found that sturgeon carrying 69 kHz PPM tags were seldom detected in Minas Passage when current was fast. The present results confirm that fish carrying 69 kHz PPM tags are unlikely to be detected by the receiver array in fast currents and yet will be detected by many receivers in the array when current is slow. For estimating probability of encounter, being detected over too wide an area causes uncertainty and not being detected biases values low in fast currents for which the possibility of harmful fish-turbine encounters might be anticipated to be more likely.
Those shortcomings of PPM tags motivated the use of HR tags to track fish passing through the TED area in Minas Passage. Alewives carrying HR tags were detected at the TED area during a range of flood and ebb current conditions [29] which supported further consideration of HR tags. Detection range measurements [13] show that the HR signals are better detected than PPM signals in fast currents. A single PPM signal is extends over an interval > 2 s whereas a HR signal takes only 6 ms so it is possible to transmit a great many more HR signals which gives more chances for a HR tag to be detected (6). The present work quantifies how a higher transmission rate makes it more likely that a drifter carrying a HR tag (a proxy for a tagged fish) will be detected by fixed receivers (Table 3).
When a PPM signal is reflected from the sea surface [13] it can cause close proximity detection interference [21] and prevent a nearby PPM tag from being detected. We observe that there are also geometric configurations of tag and receiver for which a HR signal overlaps with its reflection from the sea surface (3) but that only happens for a narrow set of circumstances, mostly when the tag is very near the sea surface and the sea surface is calm (Table 3). Under slightly different geometric circumstances, the reflected signal will not overlap with that taking a direct path and so the HR2 receiver has a second opportunity to detect the one HR transmission. Reflected signals are less likely to be observed, and less likely to cause interference, when the sea surface is rougher ([13], Table 5).
Another concern about both HR and PPM signal propagation was that previous detection range experiments [13,23] placed both receiver and acoustic tag close to the seafloor so that signals might sometimes be blocked by variable bathymetry. Those previous experiments could not unambiguously identify where signal paths were blocked. The present mooring layout (Figure 1b) affords one obviously blocked path (mooring 9 to 10) plus a matching clear path (mooring 9 to 8) and results demonstrate that detection efficiency is profoundly diminished for the blocked signal path (Figure 5). This justifies a decision to reject paths along which signal detection was poor in order to obtain an estimate for detection efficiency ρ that applies to tagged fish that swim well clear of the seafloor [13].
Detection efficiency ρ is usually measured in the Eulerian frame with both acoustic tag and receiver being at fixed coordinates relative to the seafloor [13,20,23]. On the other hand, a tagged fish is naturally described in Lagrangian frame [15] as defined by its position at some initial time and subsequent trajectory due to movement by tidal current and swimming behaviour. To achieve a robust estimate for probability of fish-turbine encounter, we need to quantify that a fish carrying a HR tag will be detected as it passes over an array of HR2 receivers that monitor the TED area. Equation (6) relates the Eulerian detection efficiency ρ [13] to the number of times a HR signal is expected to be detected from a tagged fish (Lagrangian) as it passes a moored receiver. Given that ρ tended to overestimate the number of detection-positive intervals [13], the presently reported experiments were deemed necessary to directly measure how many times a fixed receiver detects a drifting tag as it passes by. Equation (6) was found to overestimate the number of passing trajectories for which there was at least one detected signal and that overestimation can be attributed to autocorrelation of variability about the general functional form of ρ . Nevertheless, most of the HR tags that drifters carried through the HR2 receiver array were detected, even during spring flood-tides when current speeds were near their greatest extent in the TED area. Sometimes a passing tag was detected only a small number of times, so there was little margin for error. Indeed, the HR tags transmitted every 1.8 to 2.2 s and if they had transmitted at longer intervals then more tags would have passed by without being detected. A tagged fish that actively swims in the same sense as the tidal current may be somewhat less likely to be detected than a tagged fish drifting with the current [14].
The issue of tagged fish passing through a receiver array without being detected is also central to studies that use a sequence of receiver arrays to measure migration and mortality/loss of tagged fish [29,32,33]. When fish are migrating, it is often possible to utilize detections of the tagged fish to roughly estimate detection efficiencies of most receiver arrays along the migration route, except for the last array [29,33]. It is very desirable, therefore, that the last array be designed so that it will detected all migrating fish as they pass by. The above work shows that detection range measurements are useful for obtaining a first estimate of the probability that the migrating fish will be detected by an array but that estimate will be biased a little high.
A total of four HR2 receivers were used to monitor the TED area during this experiment. Although this was sufficient to detect the majority of HR tags passing by on drifters, the number of signals detected during a passing event was often small when tidal currents were greatest. It would be better to have had more HR2 receivers monitoring the TED area in order to (1) provide some redundancy in case of instrument failure, (2) better ensure that every tagged fish would be detected as it passed by, and (3) increase the possibility of localizing the position of a passing tag when several receivers detect the same HR signal. Localization does not have to be perfect, but it would be very helpful to know if tagged fish passed directly over the TED area or a little to the north or south.
Additionally, it would be advantageous to have a mooring system that enables HR2 receivers to be held sufficiently off the seafloor so as to prevent signals from one HR2 from being blocked before they reached a neighbouring HR2. If this could be achieved then HR detection efficiency could be accurately monitored as a function of time throughout the period when tagged fish are also being monitored. Rather than only relying on a fitted function for detection efficiency ρ ( r , s FV ) , it would be advantageous to also have a direct measurement of detection efficiency for the minute before and after a tagged fish is actually detected.
In conclusion, we were fortunate not to have had HR2 failures in the TED area and it is now possible to demonstrate how ρ ( r , s FV ) can be used to calculate probability of fish-turbine encounter when the array detects tagged fish as they pass through the TED area [25].

Author Contributions

Conceptualization, B.S. and D.H.; methodology, B.S. and D.H.; software, B.S.; validation, B.S.; formal analysis, B.S. and R.K.; investigation, B.S. and D.H.; resources, D.H. and B.S.; data curation, B.S.; writing—original draft preparation, B.S.; writing—review and editing, B.S., R.K. and D.H.; visualization, B.S.; supervision, B.S. and D.H.; project administration, D.H. and B.S.; funding acquisition, D.H. and B.S. All authors have read and agreed to the published version of the manuscript.

Funding

This research was funded by Natural Resources Canada grant number ERPP-RA-07.

Data Availability Statement

The data sets analyzed during the current study are available from the corresponding author on reasonable request.

Acknowledgments

Acadia Centre for Estuarine Research helped fund drifter experiments and provided laboratory space and equipment. Randy Corcoran assisted with deployment and recovery of drifters. Shaun Allain improved the instrument configuration for moorings and prepared moorings. Moorings were deployed and recovered by Shaun Allain with the assistance of Mike Huntley and the crew of the Nova Endeavour.

Conflicts of Interest

he authors declare no conflict of interest. The funders had no role in the design of the study; in the collection, analyses, or interpretation of data; in the writing of the manuscript; or in the decision to publish the results.

Abbreviations

The following abbreviations are used in this manuscript:
FORCE Fundy Ocean Research Centre for Energy
MHK Marine hydrokinetic
TED Tidal Energy Development
PPM Pulse position modulation
HR High residency
HR2 High residence receiver
CI Confidence interval
UTC Coordinated Universal Time
FVCOM Finite-Volume Coastal Ocean Model
ABS Acrylonitrile Butadiene Styrene
LTE Long Term Evolution
DC Direct Current
USB Universal Serial Bus
STD Short term drifts
LTD Long term drifts
GPS Global Positioning System

References

  1. Copping, A.; Hemery, L. editors. 2020. OES-Environmental 2020 State of the Science Report: Environmental Effects of Marine Renewable Energy Development Around the World. Report for Ocean Energy Systems (OES). [CrossRef]
  2. Jeffcoate, P.; McDowell, J. Performance of PLAT-I, a floating tidal energy platform for inshore applications. In Proceedings of the 12th European Wave and Tidal Energy Conference 27th Aug -1st Sept 2017, Cork, Ireland.
  3. Murray, J. Evolution of a solution for low cost tidal stream energy. Journal of Ocean Technology. 2021 16(1), 1–8.
  4. Karsten, R.; McMillan, J.; Lickley, M.; Haynes, R. Assessment of tidal current energy in the Minas Passage, Bay of Fundy. Journal of Power and Energy 2008, 222(A3), 289–297. [CrossRef]
  5. Karsten, R. An assessment of the potential of tidal power from Minas Passage, Bay of Fundy, using three-dimensional models. In Proceedings of the ASME 2001 30th International Conference on Ocean, Offshore and Arctic Engineering, OMEA2011-49249, Rotterdam, Netherlands, 2011.
  6. Bangley, C.W.; Hasselman, D.J.; Flemming, J.M.; Whoriskey, F.G.; Culina, J.; Enders, L.; Bradford, R.G. (2022) Modeling the Probability of Overlap Between Marine Fish Distributions and Marine Renewable Energy Infrastructure Using Acoustic Telemetry Data. Front. Mar. Sci. 2022. 9. 851757. [CrossRef]
  7. Dadswell, M.J.; Wehrell S.A.; Spares A.D.; Mclean M.F.; Beardsall J.W.; Logan-Chesney L.M.; Nau G.S; Ceapa C.; Redden A.M.; Stokesbury M.J. The annual marine feeding aggregation of Atlantic sturgeon Acipenser oxyrinchus in the inner Bay of Fundy: population characteristics and movement. J Fish Biol. 2016, 89(4), 2107–2132.
  8. Dadswell, M J; Spares, A D; McLean, M.F.; Harris, P.J.; Rulifon, R.A. Long-term effect of a tidal, hydroelectric propeller turbine on the populations of three anadromous fish species. J Fish Biol. 2018, 93(2), 192–206. [CrossRef]
  9. Dadswell, M J; Spares, A D; Porter, E; Porter, D. Diversity, abundance and size structure of fishes and invertebreates captured by an intertidal fishing weir at Bramber, Minas Basin, Nove Scotia. In Proceedings of the Nova Scotia Institute of Science, Volume 50, Number 2, 2020, 283-318.
  10. Keyser, F.; Redden, A.M.; Sanderson, B.G. Winter presence and temperature-related diel vertical migration of Striped Bass Morone saxatilis in an extreme high flow passage in the inner Bay of Fundy. Canadian Journal of Fisheries and Aquatic Sciences, 2016, 73(12), 1777–1786. [CrossRef]
  11. Stokesbury, M.J.W.; Logan-Chesney, L.M.; McLean, M.F.; Buhariwalla, F.F.; Redden, A.M.; Beardsall, J.W.; Broome, J.; Dadswell, M.J. Atlantic sturgeon spatial and temporal distribution in Minas Passage, Nova Scotia: a region of future tidal power extraction. PLoS One, 2016, 11(7). [CrossRef]
  12. DFO. 2008. Recovery Potential Assessment for Inner Bay of Fundy Atlantic Salmon. DFO Can. Sci. Advis. Sec. Sci. Advis. Rep. 2008/050.
  13. Sanderson, B.G.; Bangley, C.W.; McGarry, L.P.; Hasselman, D.J. Measuring detection efficiency of 170 kHz high-residency acoustic signals in a fast-flowing tidal passage. J. Mar. Sci. Eng. Submitted.
  14. Sanderson, B.G.; Stokesbury, M.J.W.; Redden, A.M. Using trajectories through a tidal energy development site in the Bay of Fundy to study interaction of renewable energy with fish. Journal of Ocean Technology 2021, 16(1), 50–70.
  15. Neumann, G.; Pierson, W. Principles of Physical Oceanography; Prentice-Hall Inc.: Englewood Cliffs, N.J., USA, 1966; pp. 1-545.
  16. Viehman, H.A.; Zydlewski, G.B. Fish Interactions with a Commercial-Scale Tidal Energy Device in the Natural Environment. Estuaries and Coasts, 2015, 38(Suppl 1), S214-S252. [CrossRef]
  17. Amaral, S.V.; Bevelhimer, M.S.; Cada, G.F.; Giza, D.J.; Jacobson, P.T.; McMahon, B.J.; Pracheil, B.M. Evaluation of behavior and survival of fish exposed to an axial-flow hydrokinetic turbine. North American Journal of Fisheries Management, 2015, 35, 97–113. [CrossRef]
  18. Viehman, H.A.; Hasselman, D.J.; Douglas, J.; Boucher, T. The ups and downs of using active acoustic technologies to study fish at tidal energy sites. Frontiers of Marine Science, 2022, 9. [CrossRef]
  19. Renkawitz, M.D.; Sheehan, T.F.; Goulette, G.S. Swimming depth, behavior, and survival of Atlantic salmon postsmolts in Penobscot Bay, Maine. Transactions of the American Fisheries Society, 2012, 141, 1219-1229. [CrossRef]
  20. Kessel, S.T.; Cooke, S.T.; Heupel, M.R.; Hussey, N.E.; Simpfendor, C.A.; Vagle, S.; Fisk, A.T. A review of detection range testing in aquatic passive acoustic telemetry studies, Rev Fish Biol Fisheries, 2014, 24, 199–218. [CrossRef]
  21. Kessel, S.T.; Hussey, N.E.; Webber, D.M.; Gruber, S.H.; Young, J.M.; Smale, M.J.; Fisk, A.T. Close proximity detection interference with acoustic telemetry: the importance of considering tag power output in low ambient noise environments. Animal Biotelemetry, 2015, 3(5). [CrossRef]
  22. Chen, C.; Beardsley, R.C.; and Cowles, G. An Unstructured-Grid, Finite-Volume Coastal Ocean Model (FVCOM) System. Oceanography, 2006, 19, 78–89. [CrossRef]
  23. Sanderson, B.G.; Buhariwalla, C.; Adams, M.; Broome, J.; Stokesbury, M.; Redden, A.M. 2017. Quantifying detection range of acoustic tags for probability of fish encountering MHK devices. In Proceedings of the 12th European Wave and Tidal Energy Conference, Cork, Ireland, 27 Aug-1st Sept 2017.
  24. Betz, A. 1966. Introduction to the Theory of Flow Machines, (D. G. Randall, Trans.) Oxford: Pergamon Press.
  25. Sanderson, B.G.; Karsten, R.; Solda, C.; Hardie, D.C.; Hasselman, D.J. Probability of Atlantic salmon post-smolts encountering a tidal turbine installation in Minas Passage, BAY of Fundy. J. Mar. Sci. Eng. Submitted. [CrossRef]
  26. Pederson, L. 7000 years of fishing; stationary fishing structures in the Mesolithic and afterwards. In Man and sea in the Mesolithic; Fisher A., Ed.; Oxbow Books, Oxford, 1995; pp. 75–86.
  27. Shen, H.; Zydlewski, G.; Viehman, H.; Staines, G. 2016. Estimating the probability of fish encountering a marine hydrokinetic device. Renewable Energy, 2016, 97, 746–756. [CrossRef]
  28. Hammar, L.; Andersson, S.; Eggertsen, L.; Haglund, J.; Gullstrom, M.; Ehnberg, J.; Molander, S. Hydrokinetic Turbine Effects on Fish Swimming Behaviour. PLoS ONE, 2013, 8(12) e84141. [CrossRef]
  29. Tsitrin, E.; Sanderson, B.G.; McLean, M.F.; Gibson, A.J.F.; Hardie, D.C.; Stokesbury, M.J.W. Migration and apparent survival of postspawning alewife (Alosa pseudoharengus) in Minas Basin, Bay of Fundy. Animal Biotelemetry, 2022, 10(11). [CrossRef]
  30. Solda, C. Migration ecology of Inner Bay of Fundy Atlantic Salmon (Salmo Salar) smolt, and the relationship between improvements in tagging technology and surgical procedures and estimates of post surgery survival, M.Sc., Acadia University, Wolfville, Nova Scotia, in preparation.
  31. Lilly, J.; Dadswell, M.J.; Mclean, M.f.; Avery, T.S.; Comolli, P.D.; Stokesbury, M.J.W. Atlantic sturgeon presence in a designated marine hydrokinetic test site prior to turbine deployment: A baseline study. Journal of Applied Ichthyology, 2021, 37(6), 826–834. [CrossRef]
  32. Kocik, J.F.; Hawkes, J.P.; Sheehan, T.F.; Music, P.A.; Beland, K.F. Assessing Estuarine and Coastal Migration and Survival of Wild Atlantic Salmon Smolts from the Narraguagus River, Maine Using Ultrasonic Telemetry. American Fisheries Society Symposium, 2009, 69, 293–310, American Fisheries Society.
  33. Halfyard, E.A.; Gibson, A.J.; Ruzzante, D.E.; Stokesbury, M.J.; Whoriskey, F.G. Estuarine survival and migratory behaviour of Atlantic salmon Salmo salar smolts. J. Fish. Biol., 2012, 81(5), 1626–45.
Figure 1. Mooring layout in Minas Passage. (a) Plan view shows moorings 1 through 12 and the TED area (gray box). (b) Depth profile along the mooring line. Inset shows location of the moorings within Minas Passage, Bay of Fundy.
Preprints 71974 g001
Figure 2. STD tracks. Positions of moorings 9-12 are marked with blue dots. Black lines show flood tracks. Ebb tracks are magenta. Tracks were measured on: (a) 13, 15 and 16 June 2022 (n=37). (b) 17 and 18 July 2022 (n=25).
Preprints 71974 g002
Figure 3. Nonlinear offset to synchronize receivers at stations 9 through 12 to the receiver at station 9.
Preprints 71974 g003
Figure 4. Signals detected as a function of distance and range along STD tracks. (a) Many signals are detected at moderately high current speed. (b) Fewer signals are detected at very high current speed.
Preprints 71974 g004
Figure 5. Average detection efficiencies are plotted as functions of s FV with black circles and lines indicating ± S D . Signals from the HR tag at mooring 9 are detected by: (a) the HR2 at mooring 8, (b) the HR2 at mooring 10. For corresponding ranges, the red lines shows detection efficiencies measured in 2022. The distribution of detection efficiencies calculated from 2-minute intervals is shown using a logarithmic color scale. The distribution was normalized to a maximum value of 100 per ρ - s FV bin.
Preprints 71974 g005
Figure 6. The expected number of detected signals N E declines with increasing slant range of closest approach r ca . Only the 44 STD tracks with s ca > 3 . 5 ms 1 are included.
Preprints 71974 g006
Figure 7. Number of detected signals for STD passing events plotted as a function of the number expected.
Preprints 71974 g007
Figure 8. Two LTD tracks. A quasi-steady track (black) frequently passes near the southern end of the line of moored receivers (blue). A highly variable track (orange) sometimes passes through the northern end of the receiver line.
Preprints 71974 g008
Figure 9. Dots indicate where LTD tracks crossed the mooring line, with flood crossings displaced to the left and ebb crossings displaced to the right. Blue dots indicate passing events that were detected by the array of HR2 receivers and orange dots indicate passing events that were not detected.
Preprints 71974 g009
Figure 10. For each crossing that is south of mooring 6, the signed speed of the drifter s ca is compared with the value obtained from the FVCOM model A best-fit linear regression is plotted (purple).
Preprints 71974 g010
Figure 11. Relating the number of HR signals detected during a LTD passing event N D to the range at closest approach r ca for measurements grouped according to the speed at closest approach | s ca | . Each HR tag transmitted every τ = 2 s.
Preprints 71974 g011
Figure 12. Percentage of tag passing events that are detected by a moored HR2 receiver as a function of speed | s ca | and range r ca at closest approach. Here we consider LTD of the two deepest HR tags (19 m and 28 m). Each tag transmitted every τ = 2 s.
Preprints 71974 g012
Table 1. Separations between moorings.
Mooring Pair Separation (m) Dates Depths (m)
1–2 166 07-May 06-Sep-2022 66.3, 69.2
4–5 209.5 07-May 14-May-2022 59.3, 59.9
4–5 209.4 14-May 13-Aug-2022 60.0, 59.9
5–6 106 07-May 13-Aug-2022 — , —
6–7 206 07-May 06-Sep-2022 61.1, 52.8
7–8 123 07-May 14-Jun-2022 — , 49.7
7–8 132 18-Jun 17-Jul-2022 — , 49.6
7–8 135 19-Jul 12-Aug-2022 — , 50.4
7–8 137 13-Aug 06-Sep-2022 — , 50.7
8–9 190 07-May 12-May-2022 50.0, —
8–9 193 14-May 14-Jun-2022 50.0, —
8–9 200 19-Jun 17-Jul-2022 49.6, —
8–9 206 19-Jul 06-Sep-2022 50.5, —
9–10 182 07-May 06-Sep-2022 48.4, 34.8
10–11 133 07-May 15-May-2022 — , 34.1
10–11 152 19-May 14-Jul-2022 — , 34.9
10–11 174 17-Jul 06-Sep-2022 — , 35.7
11–12 211 07-May 15-May-2022 34.1, 34.9
11–12 232 21-May 14-Jul-2022 34.9, 34.8
11–12 230 17-Jul 06-Sep-2022 35.7, 34.9
Table 2. Time corrections to add to the HR2 at mooring 9 in order for it to match the HR2 receiver suspended below the pole-float drifter.
Drift number Date Time correction (s)
11 13 Jun 2022 16.75
31 15 Jun 2022 16.45
54 18 Jul 2022 15.5
55 18 Jul 15.5
Table 3. Out of the 45 fast ( | s ca | > 3 . 5 ms 1 ) STD passing events, we tabulate the number of passing events ( N PEDA ) for which a tag at a given depth was detected by the HR2 array.
τ (s) 3 m tag 8 m tag 16 m tag 26 m tag
2 39 38 42 44
4 36 37 40 42
8 31 34 34 39
16 22 25 26 34
32 14 17 17 21
64 7 10 10 13
Table 4. Comparison of number of signals detected by an array N D A with number expected N E A at each tag depth. Measurements from 44 fast flood drifts at the TED area.
2.25 m tag 9 m tag 19 m tag 28 m tag
N D A 127 185 214 270
N E A 295 308 325 344
N P E D A 26 28 28 26
N P E E A 33 33 33 33
0.78 N P E E A 32 32 33 33
0.43 N P E E A 31 32 32 32
Table 5. Out of 45 fast flood-tide ( s ca > 3 . 5 ms 1 ) LTD passing events, we tabulated the number of passing events for which tags at different depths were detected by the HR2 array. Dependence on increasing transmission interval τ was calculated.
τ (s) 2.25 m tag 9 m tag 19 m tag 28 m tag
2 41 42 40 42
4 41 42 40 42
8 40 41 39 40
16 35 39 37 37
32 28 34 34 31
64 18 26 27 21
Table 6. Out of 36 slow flood-tide ( 0 < s ca 3 . 5 ms 1 ) LTD passing events, we tabulated the number of passing events for which tag at different depths were detected by the HR2 array. Dependence on increasing transmission interval τ was calculated.
τ (s) 2.25 m tag 9 m tag 19 m tag 28 m tag
2 35 35 35 35
4 35 35 35 35
8 34 34 35 34
16 33 33 34 34
32 32 32 33 33
64 28 31 31 31
Table 7. Out of 13 fast ebb-tide ( s ca < 3 . 5 ms 1 ) LTD passing events, we tabulated the number of passing events for which tag at different depths were detected by the HR2 array. Dependence on increasing transmission interval τ was calculated.
τ (s) 2.25 m tag 9 m tag 19 m tag 28 m tag
2 9 11 12 13
4 9 11 12 13
8 9 10 12 12
16 8 10 11 11
32 8 9 10 9
64 5 7 7 7
Table 8. Out of 44 slow ebb-tide ( 0 > s ca 3 . 5 ms 1 ) LTD passing events, we tabulated the number of passing events for which tag at different depths were detected by the HR2 array. Dependence on increasing transmission interval τ was calculated.
τ (s) 2.25 m tag 9 m tag 19 m tag 28 m tag
2 38 39 44 39
4 38 39 43 39
8 37 38 40 37
16 34 36 38 36
32 30 33 35 35
64 25 30 31 30
Table 9. Number of LTD tracks for which the bottom HR and 69 kHz PPM tag were detected. Tracks are categorized according to whether current is fast or slow on the ebb or flood tide.
# tracks HR tag PPM tag Current (ms 1 ) Mean current (ms 1 )
28 27 28 0 < s ca < 3.5 2.84
35 25 29 0 > s ca > 3.5 -2.8
35 34 19 s ca > 3.5 4.17
11 11 1 s ca < 3.5 -3.8
Disclaimer/Publisher’s Note: The statements, opinions and data contained in all publications are solely those of the individual author(s) and contributor(s) and not of MDPI and/or the editor(s). MDPI and/or the editor(s) disclaim responsibility for any injury to people or property resulting from any ideas, methods, instructions or products referred to in the content.
Copyright: This open access article is published under a Creative Commons CC BY 4.0 license, which permit the free download, distribution, and reuse, provided that the author and preprint are cited in any reuse.
Prerpints.org logo

Preprints.org is a free preprint server supported by MDPI in Basel, Switzerland.

Subscribe

© 2024 MDPI (Basel, Switzerland) unless otherwise stated