Submitted:
27 April 2023
Posted:
03 May 2023
You are already at the latest version
Abstract
Keywords:
1. Introduction
2. Experimental design, Materials and Methods
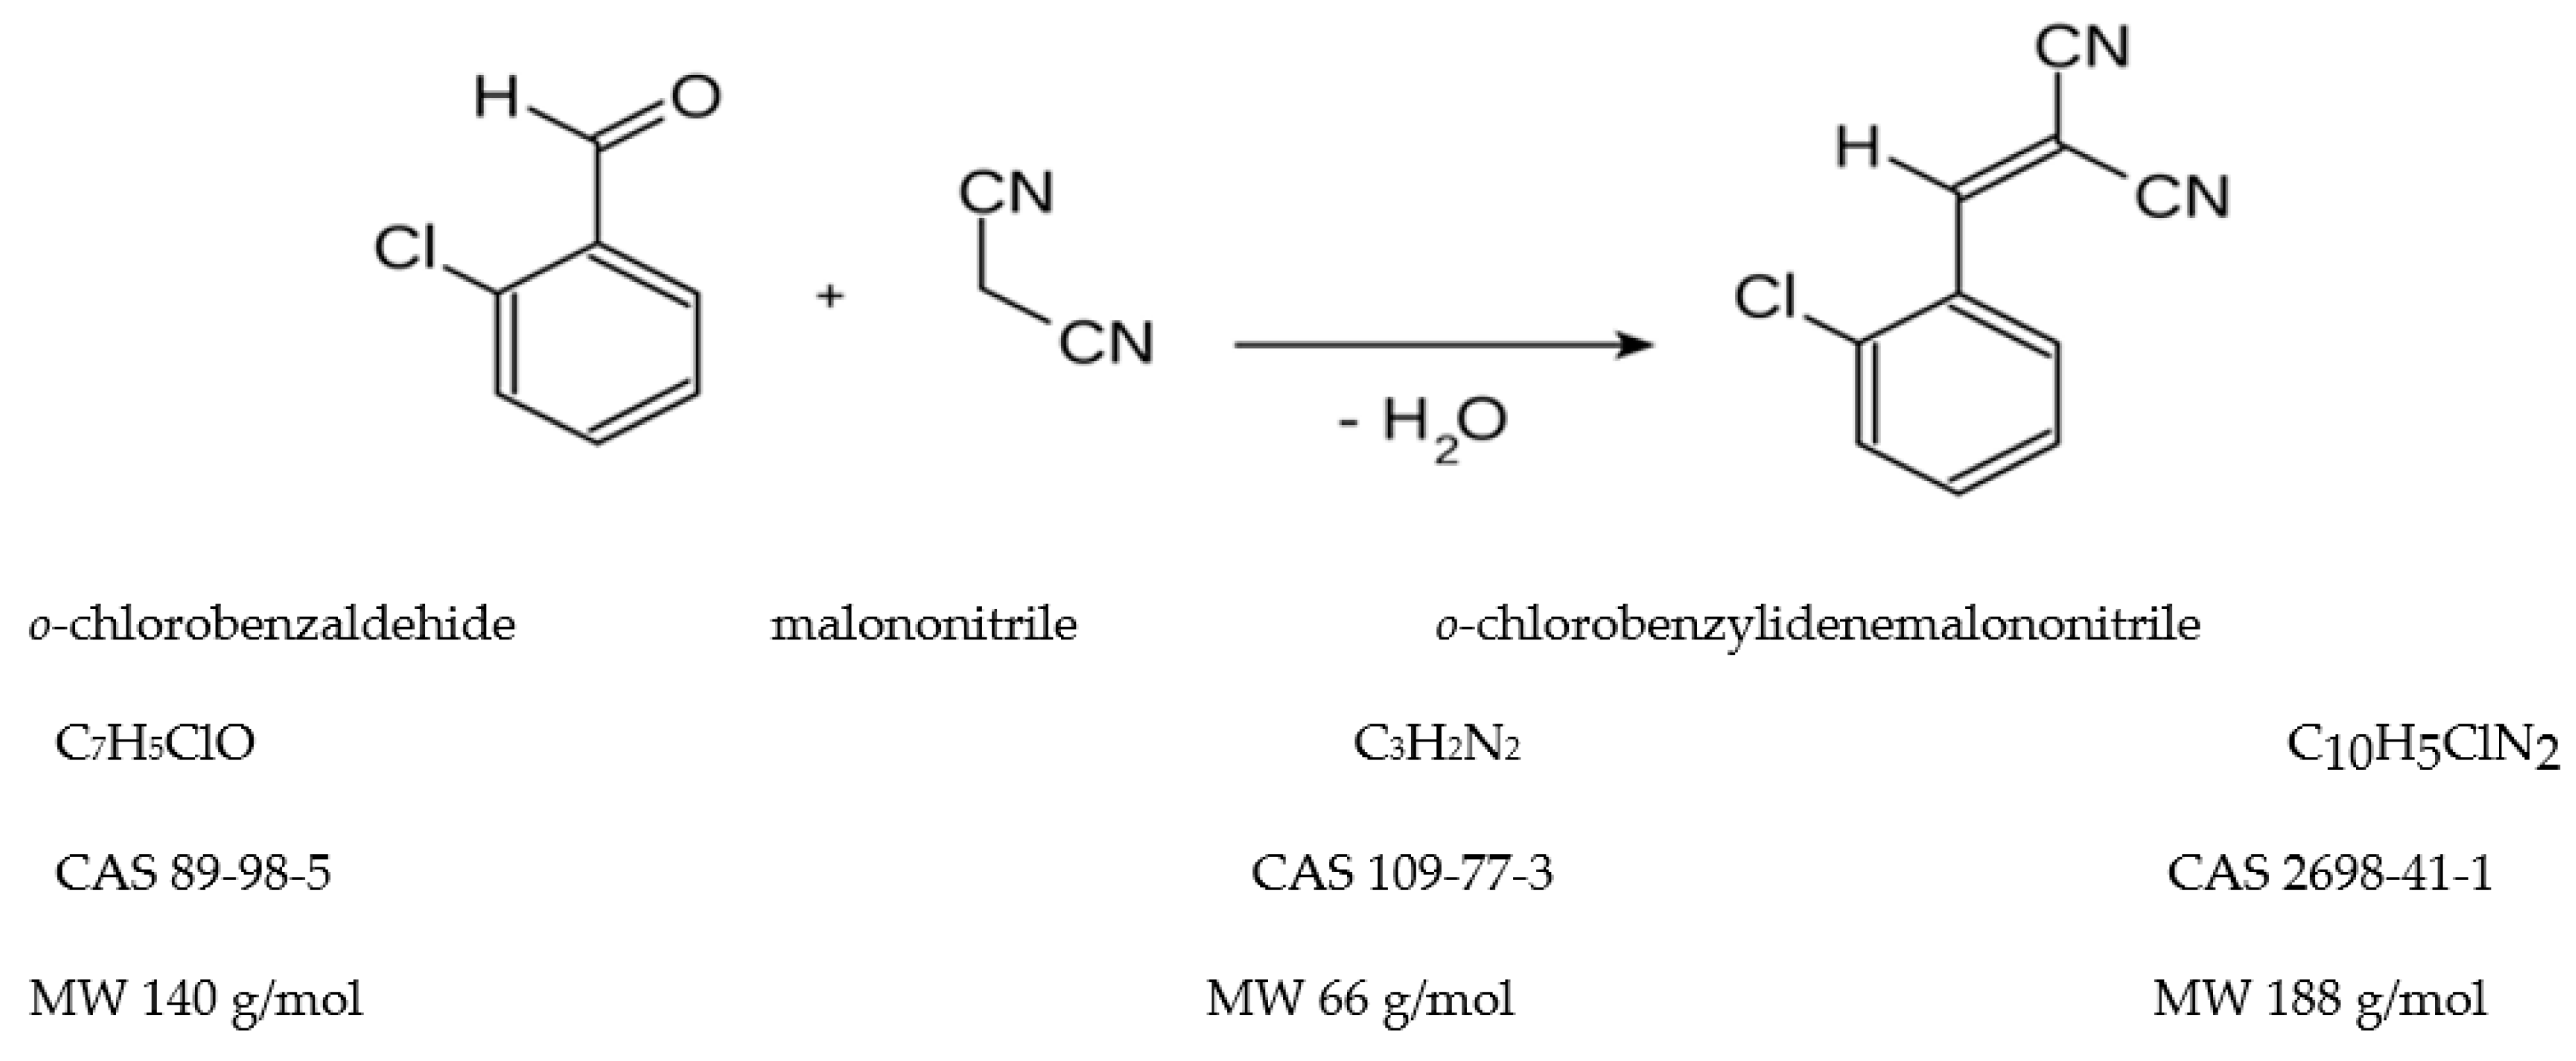
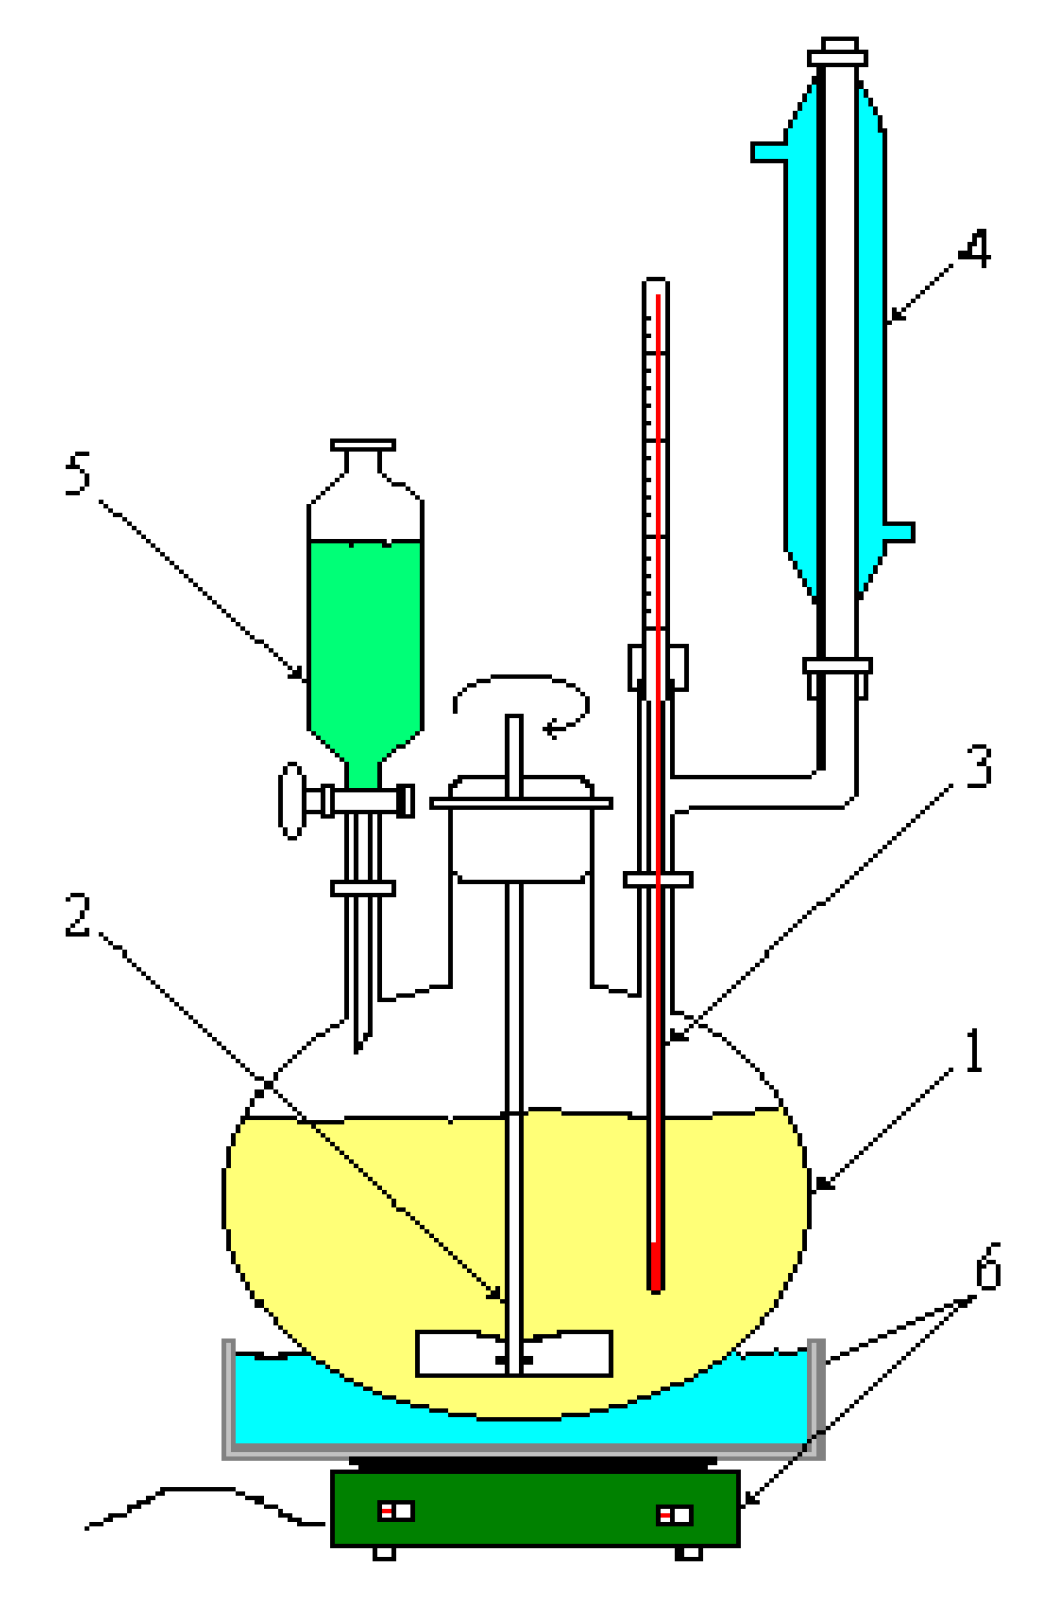
2.1. Aspects on the synthesis reaction of the o-chlorobenzylidene malononitrile
2.2. Preparation of biological material
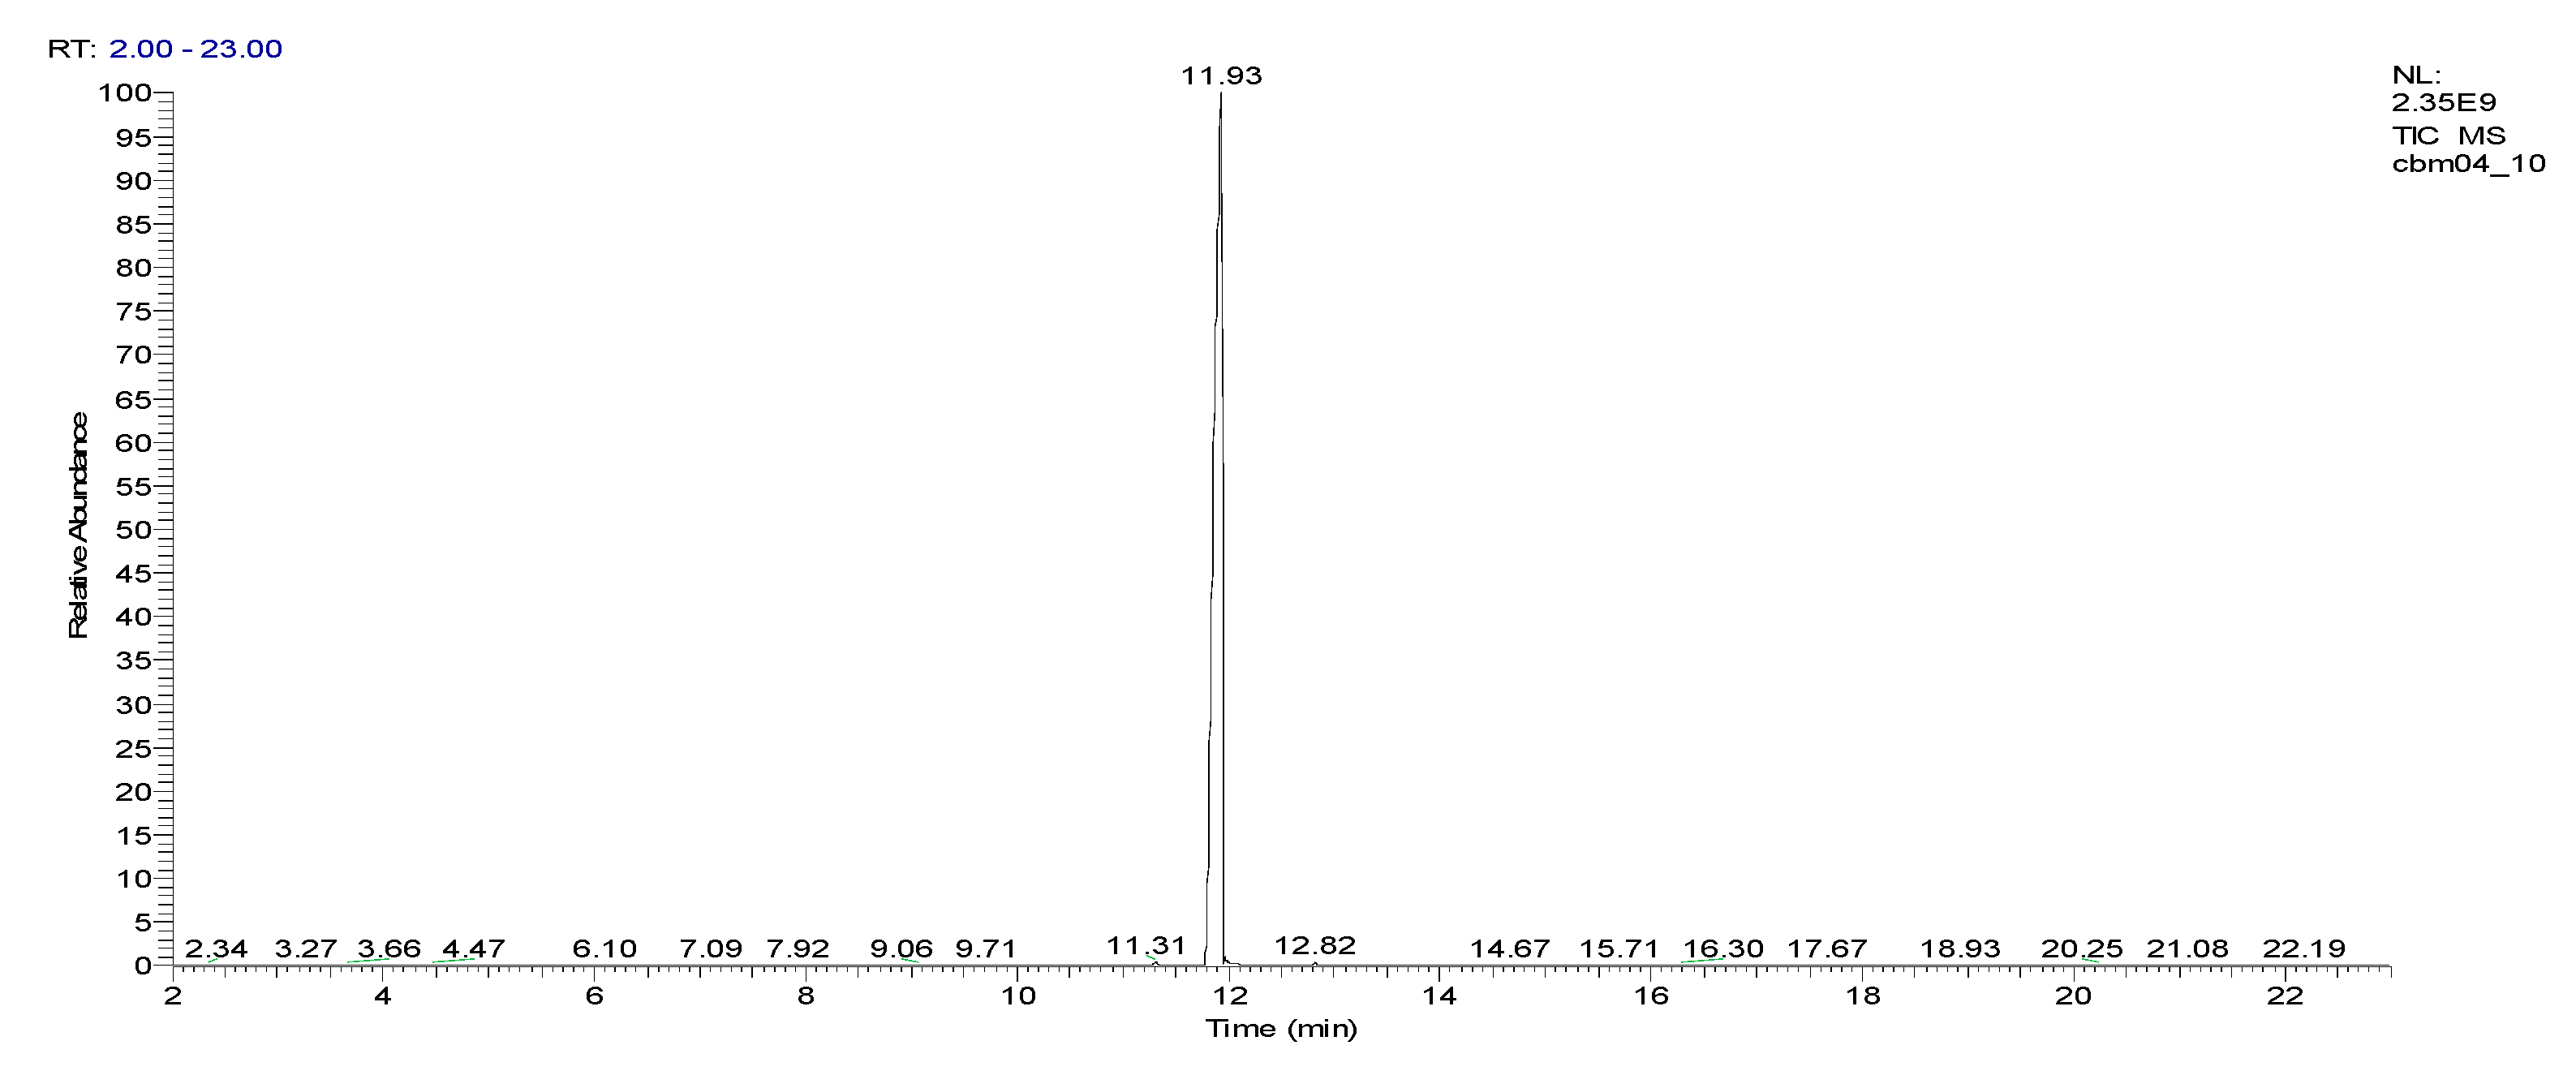
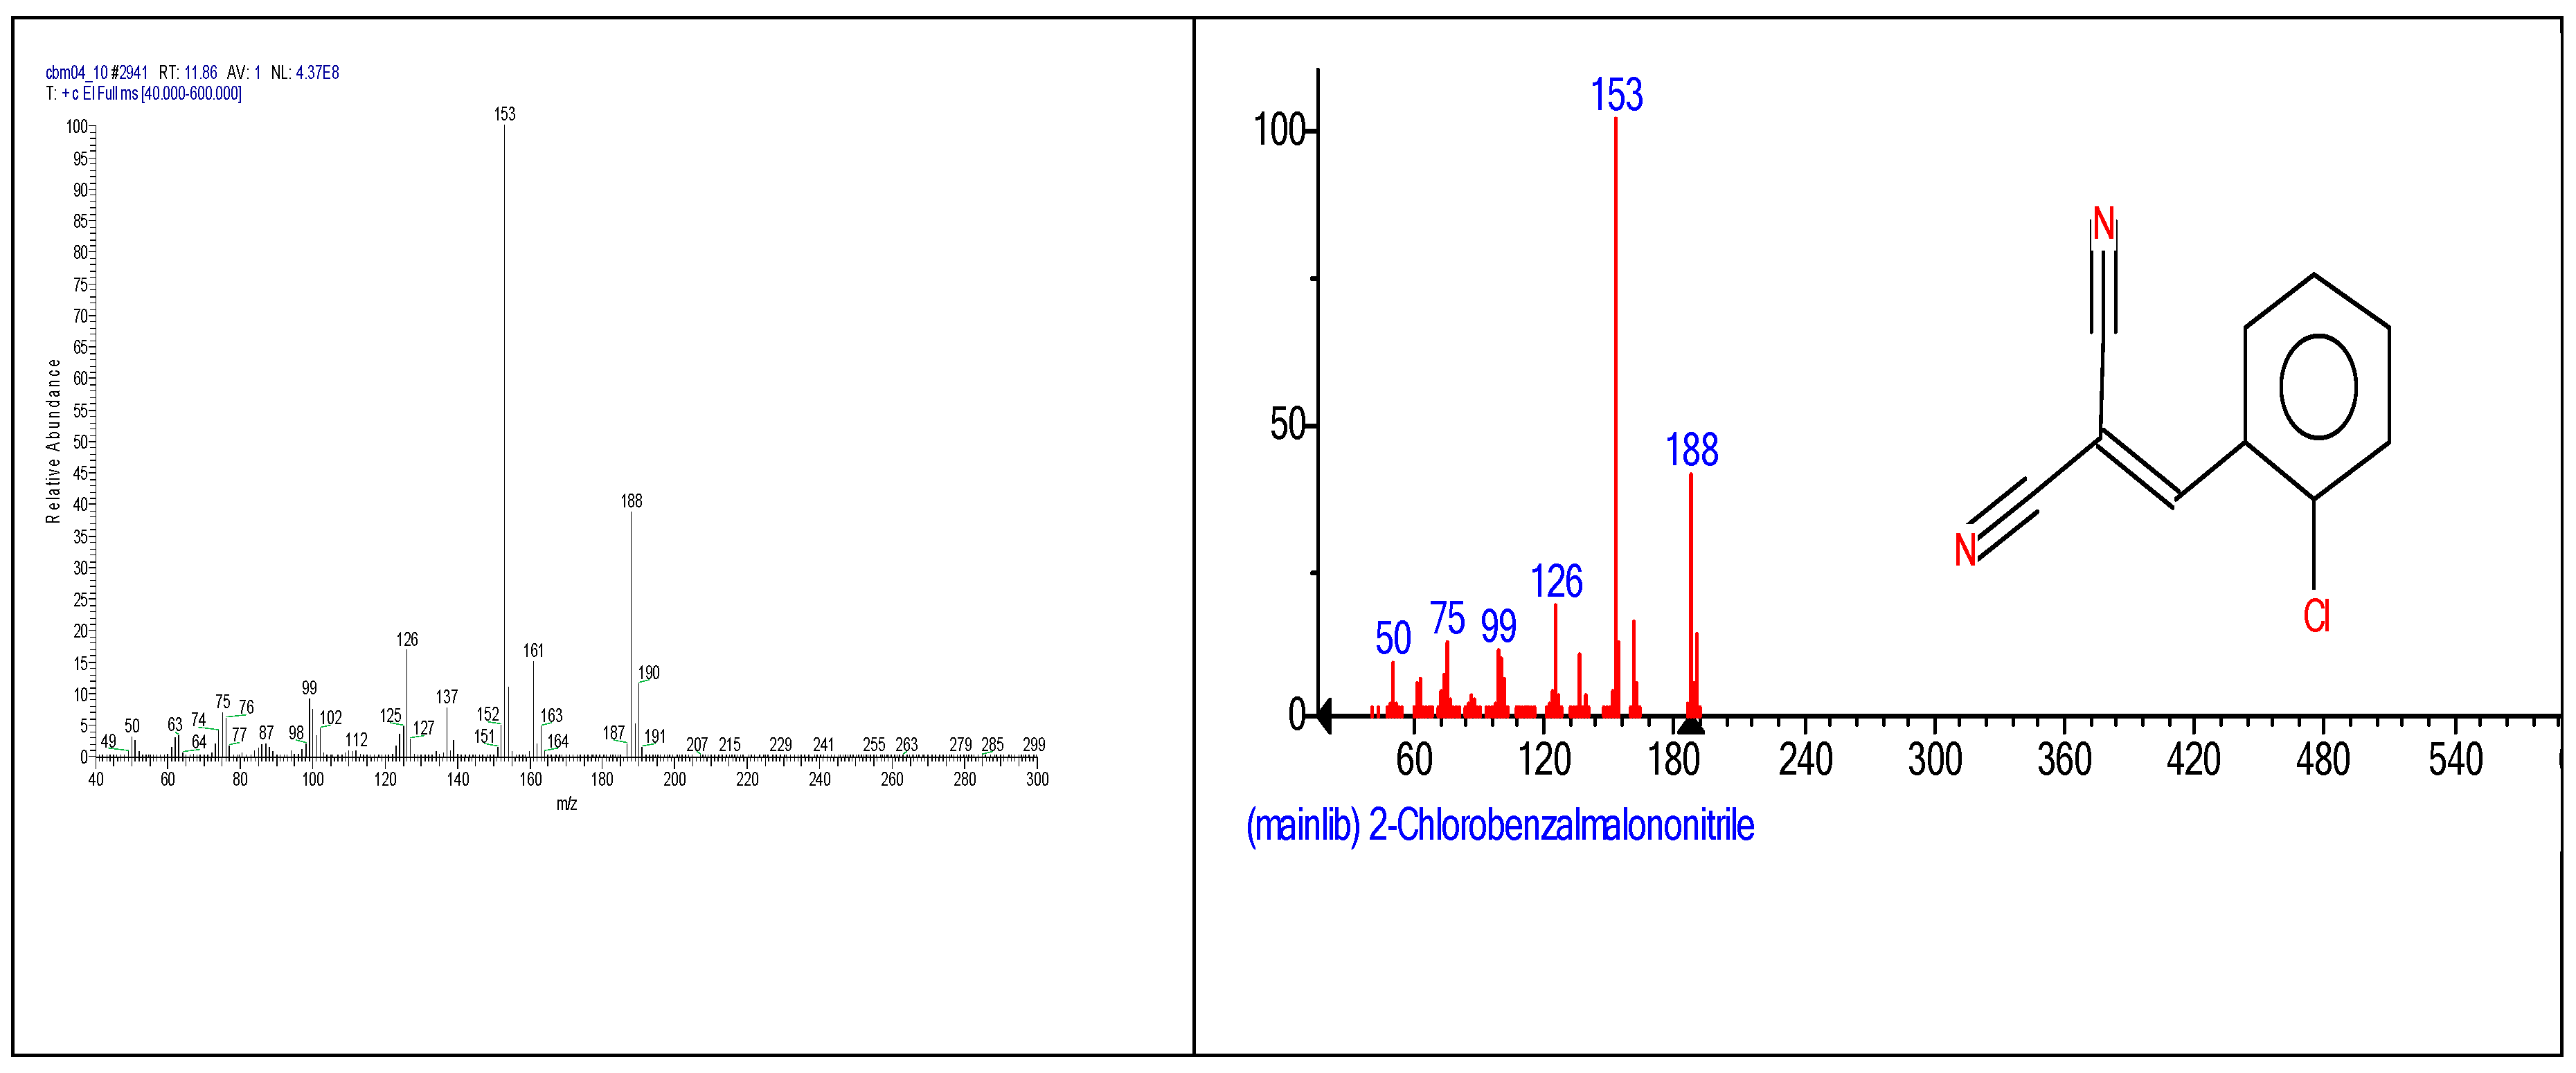
2.3. Chemical characterization and confirmation of the synthesized compound by GC-MS
3. Results obtained
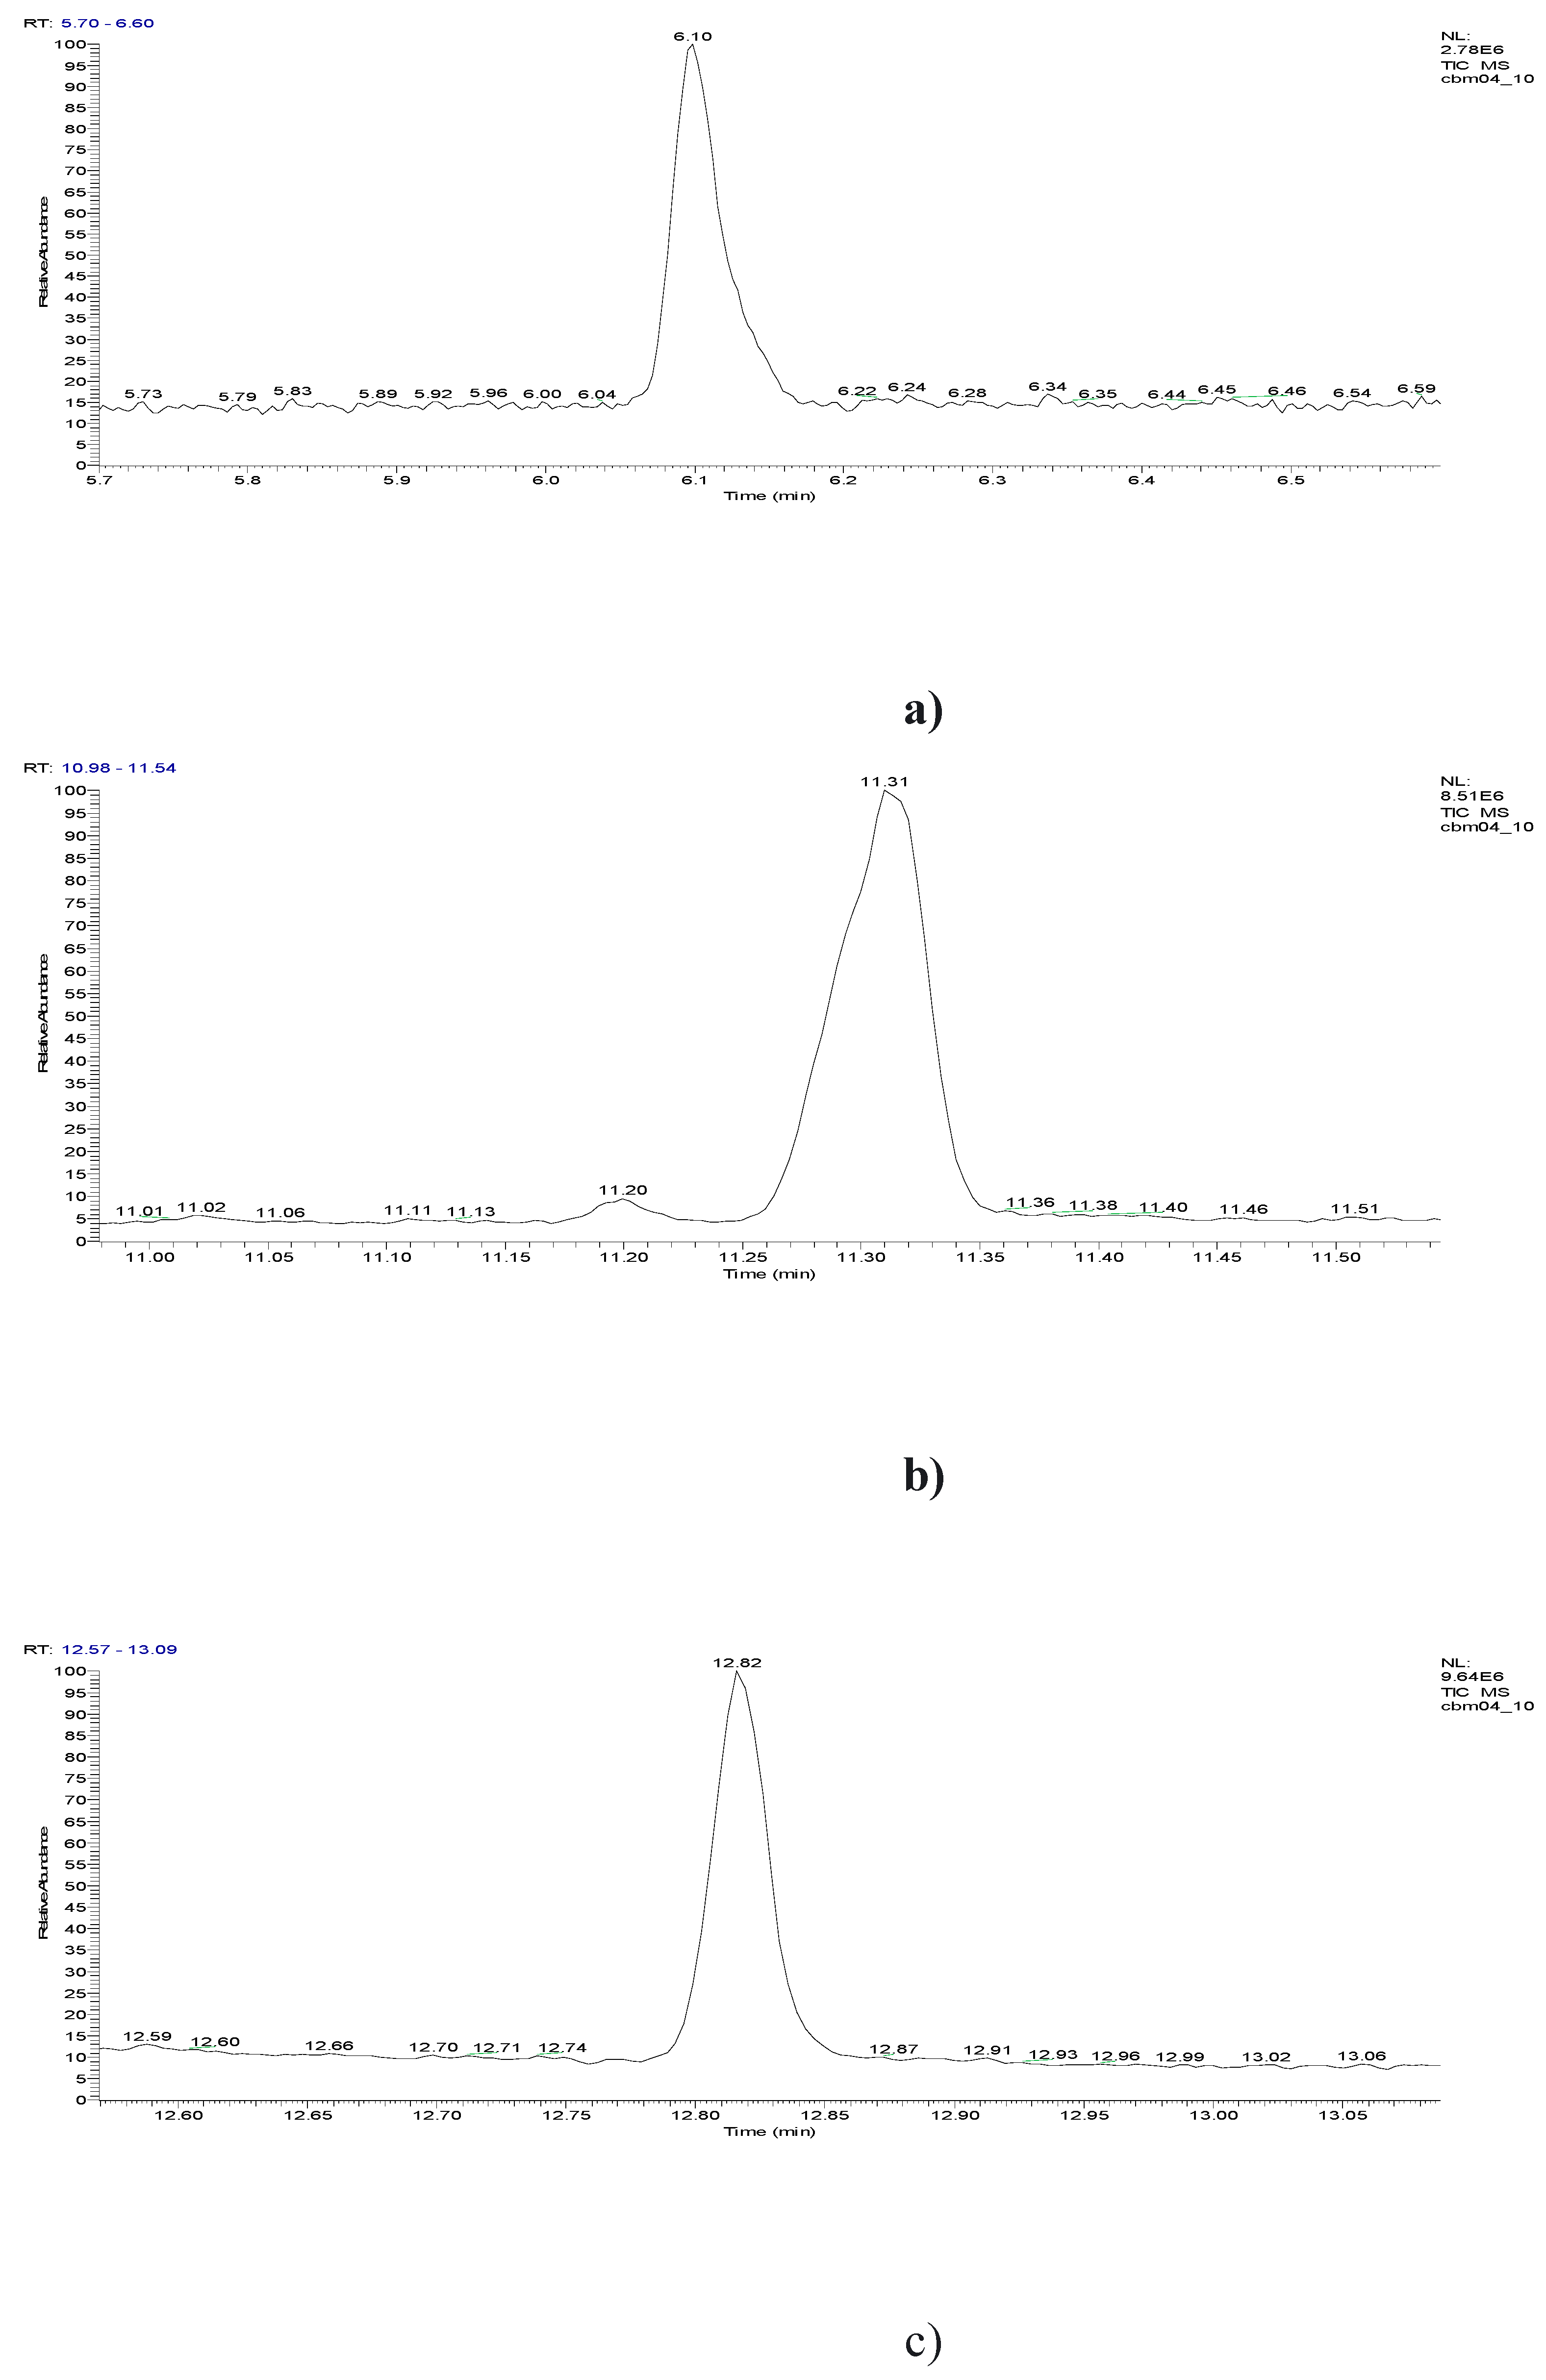
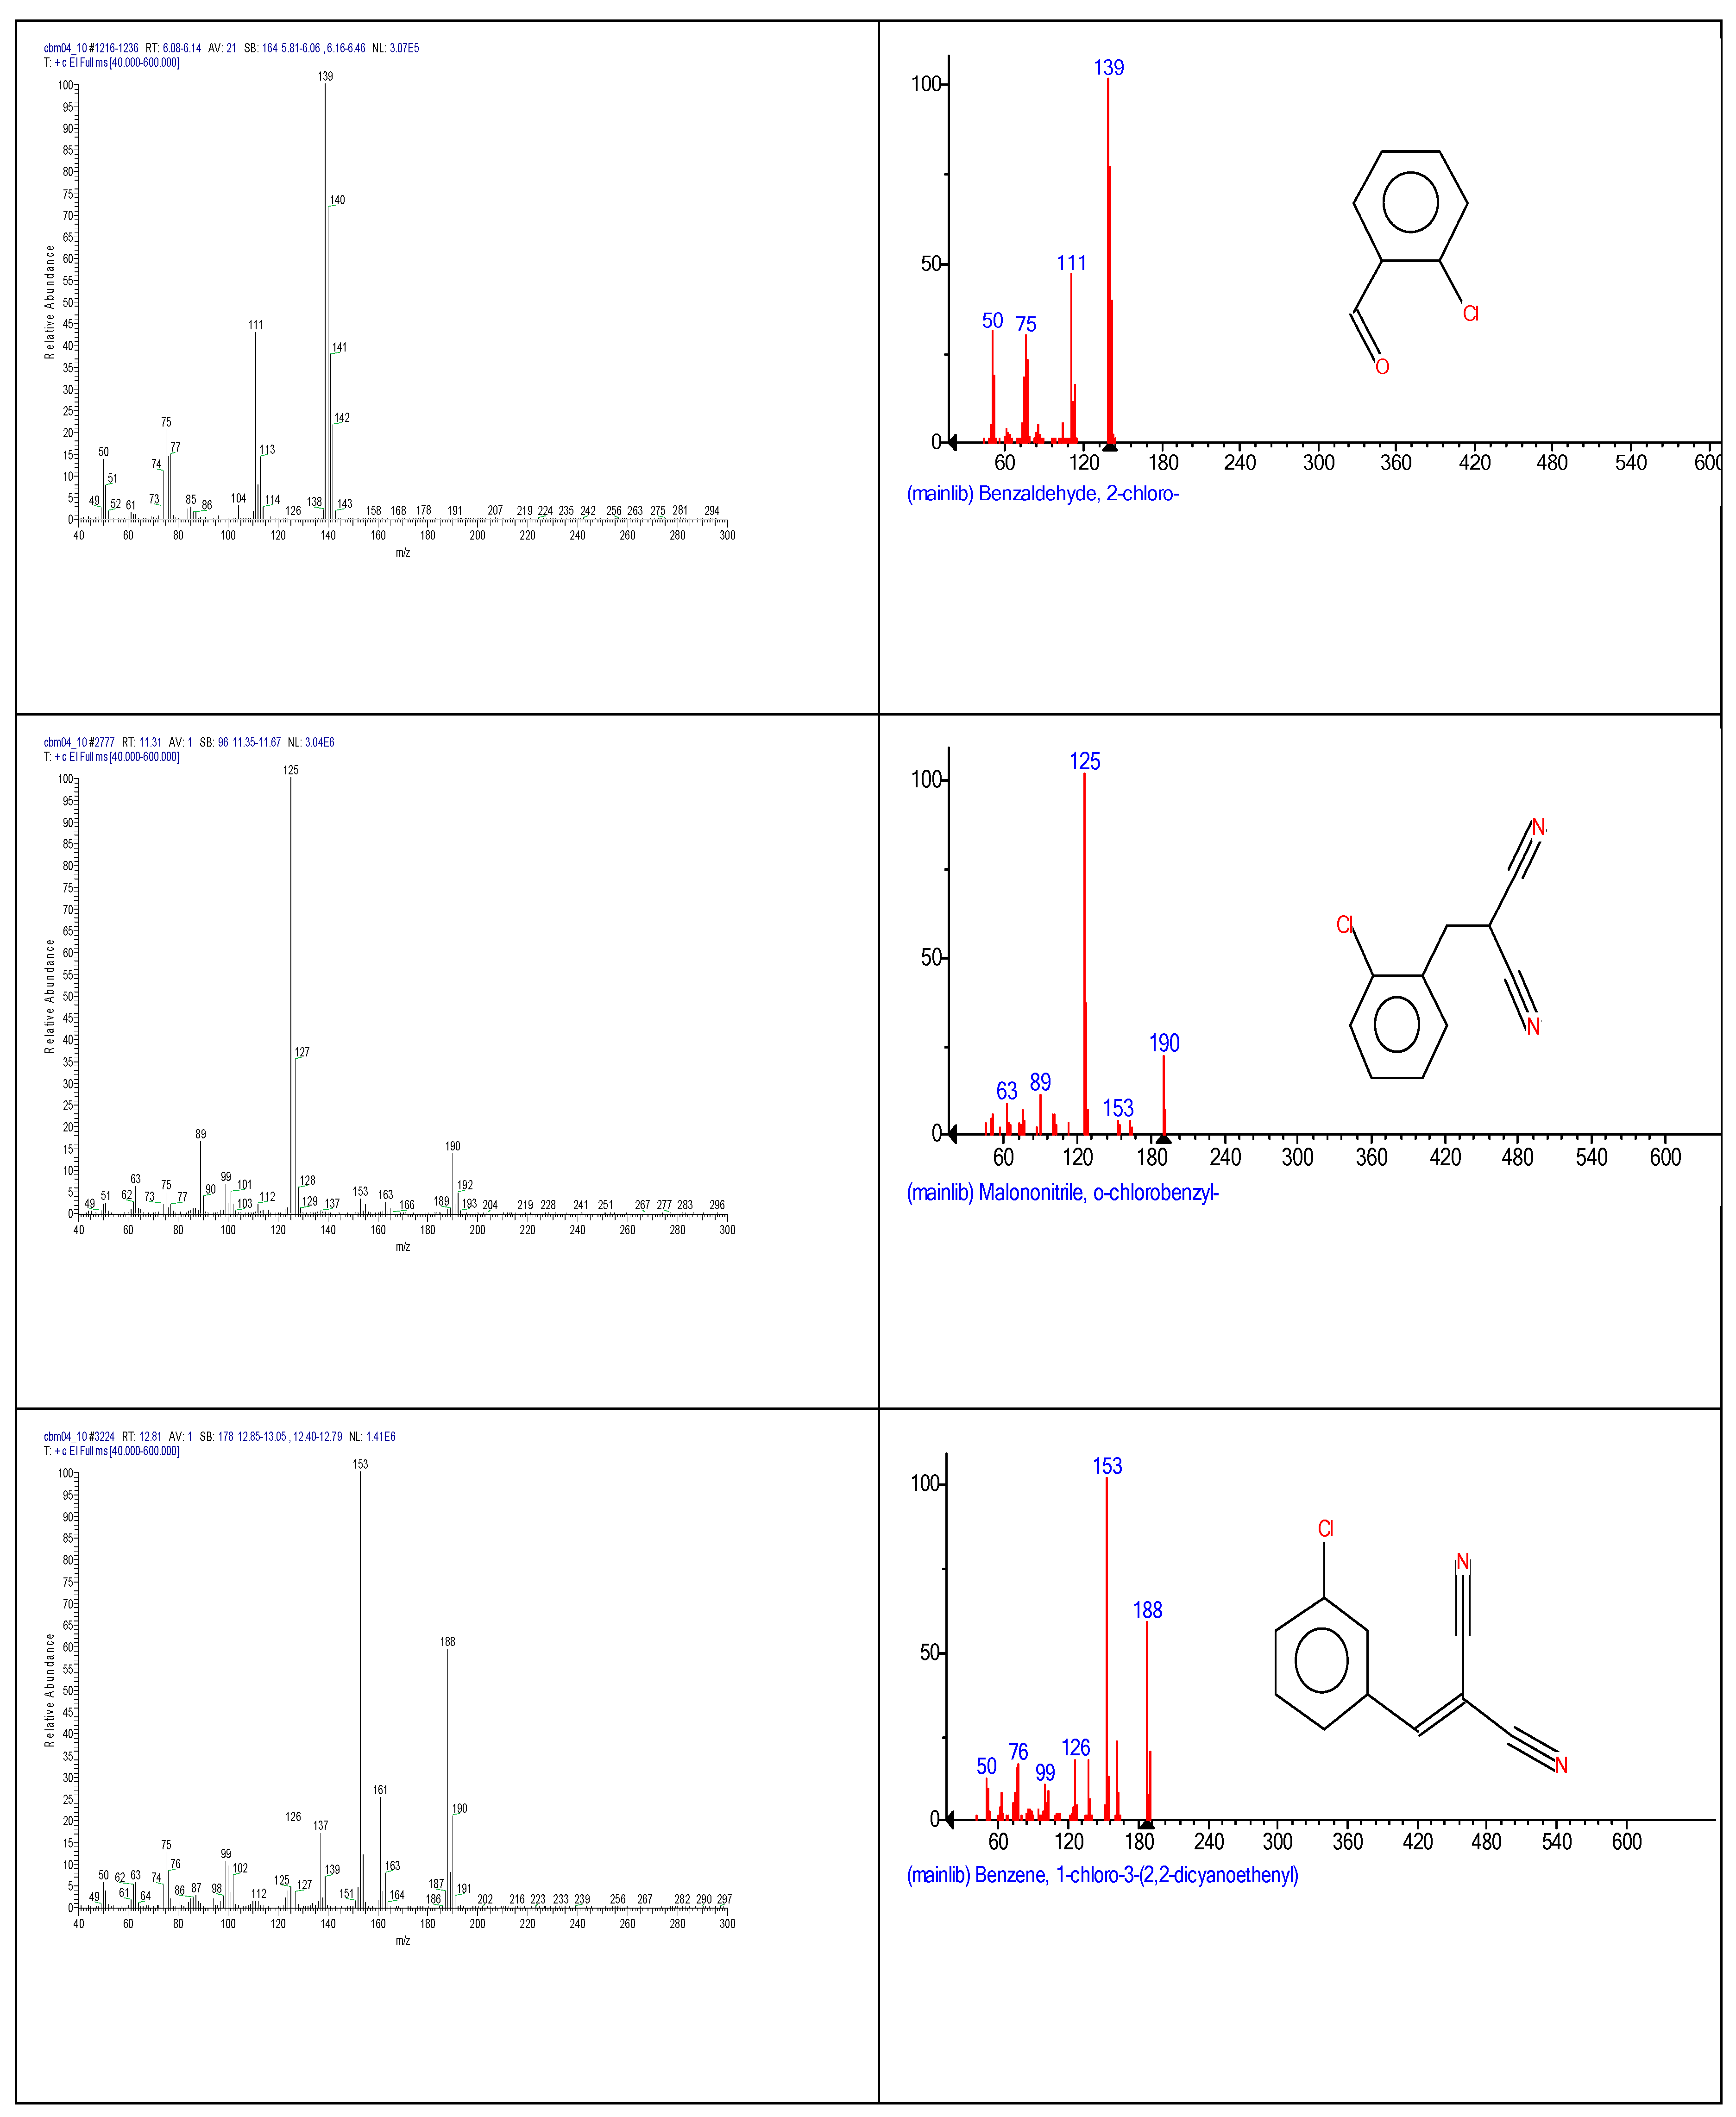
| Chemical name | Retention time (minutes) | Molecular formula | Chemical structure | Molecular weight (g/mole) |
CAS Registry Number |
|---|---|---|---|---|---|
| o-chlorobenzaldehide (C1) |
6.10 | C7H5ClO |  |
140 | 89-98-5 |
| o-chlorobenzylmalononitrile (C2) |
11.31 | C10H7ClN2 |  |
190 | 40915-55-7 |
| 2-chlorobenzalmalononitrile (CBM-C3) |
11.93 | C10H5ClN2 |  |
188 | 2698-41-1 |
| 2-(3-chlorobenzylidene)malononitrile (C4) |
12.82 | C10H5ClN2 | 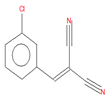 |
188 | 2972-73-8 |
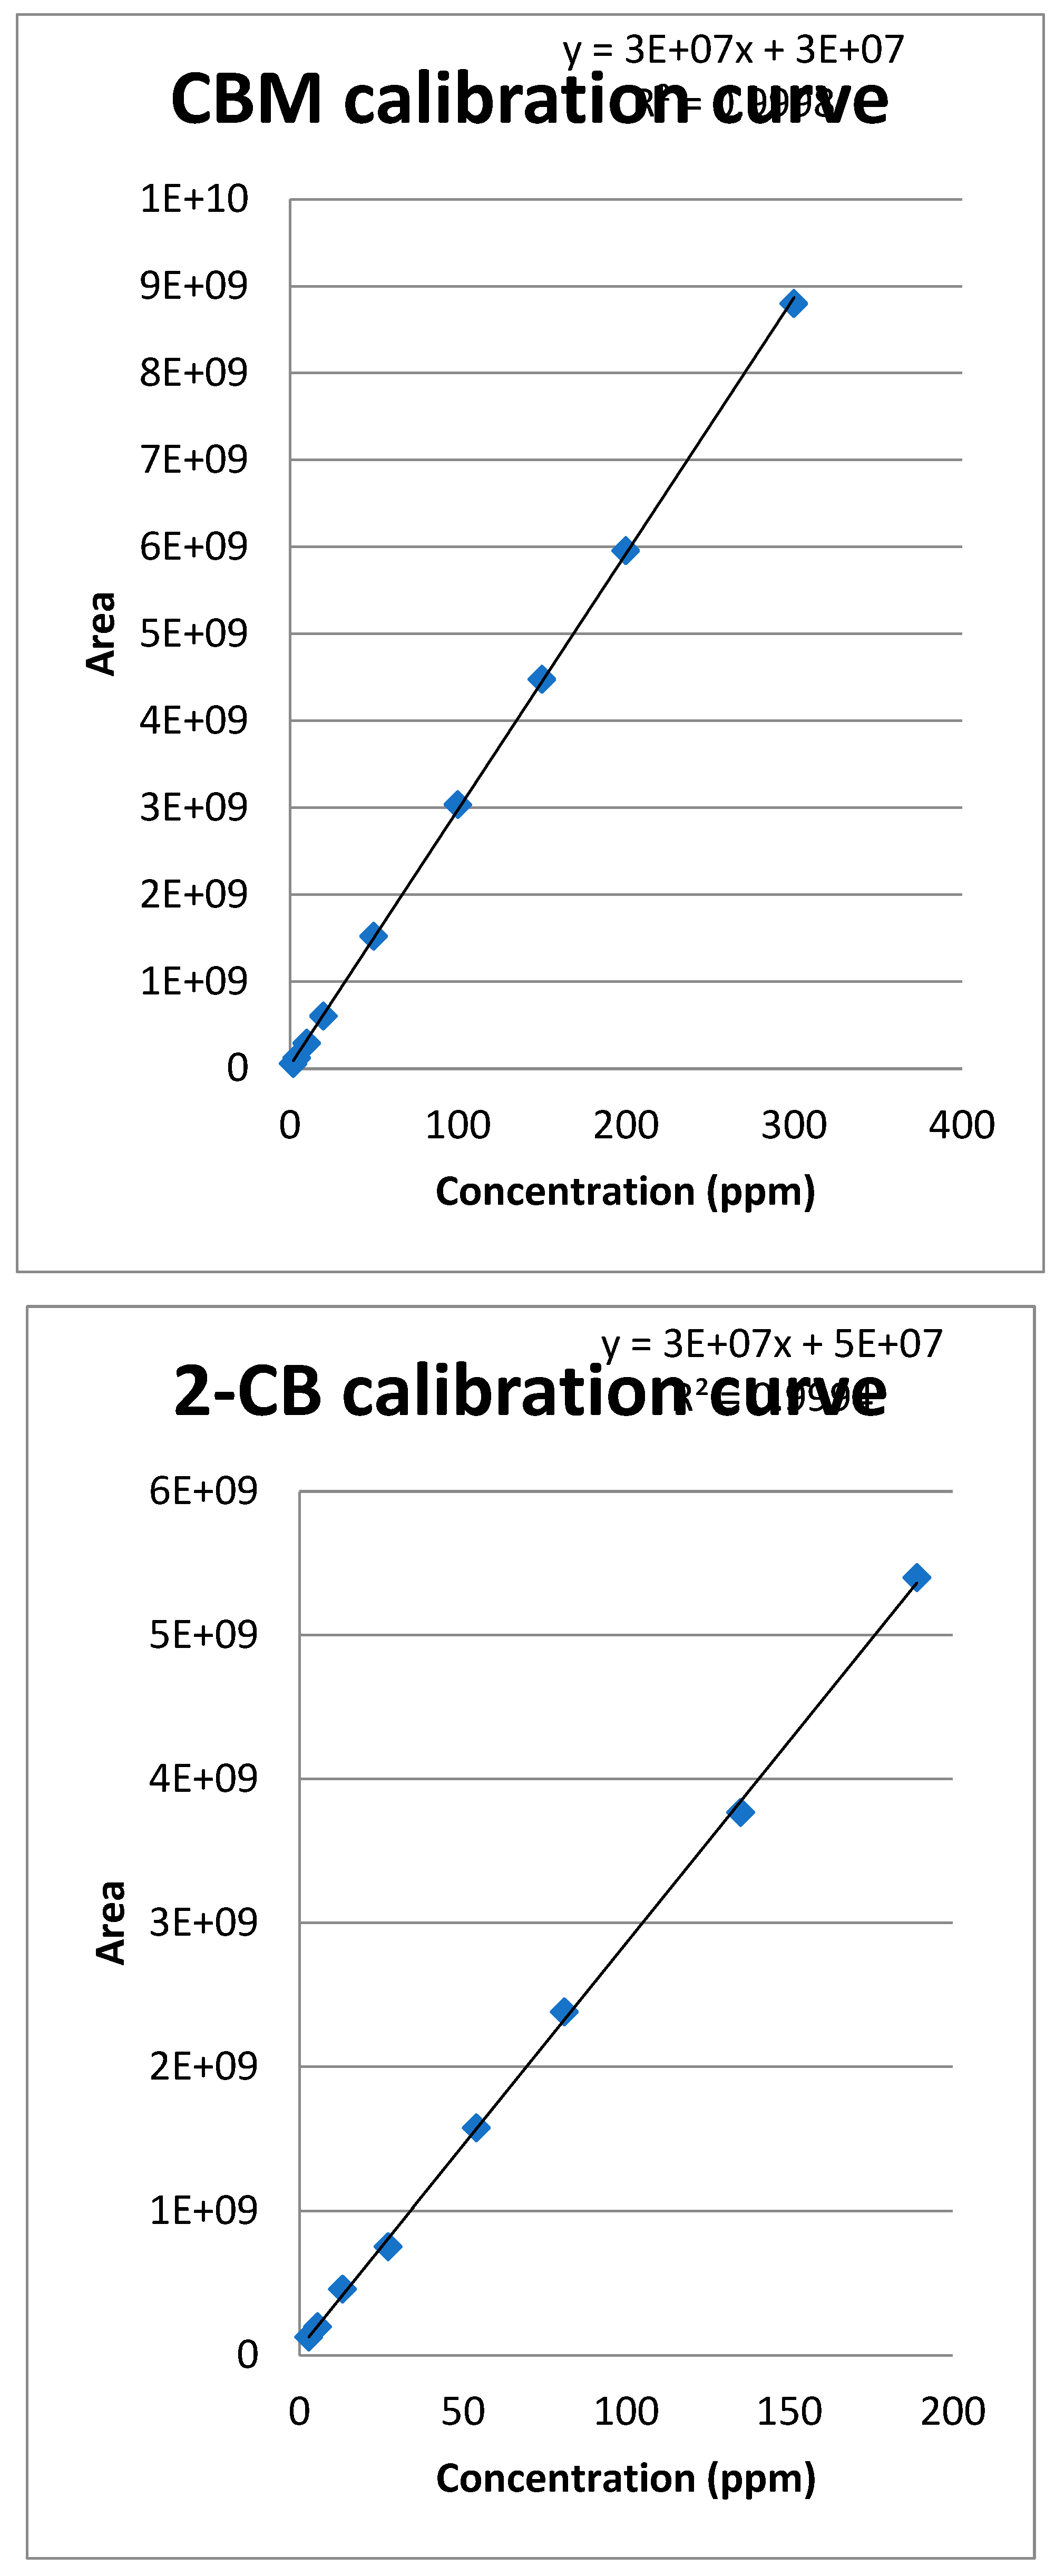
3.1. Calibration curve of CBM and 2-CB
3.1.1. Method quantification
3.1.2. Extraction of the spiked samples with CBM and biological suspension
4. Conclusions
References
- Salem, M. Feasel, B. Ballantyne †, S.A. Katz Riot Control AgentsEncyclopedia of Toxicology (Third Edition) Reference Module in Biomedical Sciences 2014, Pages 137-154.
- E J. Olajo, H. Salem Riot Control Agents: Pharmacology, Toxicology, Biochemistry and Chemistry JOURNAL OF APPLIED TOXICOLOGY J. Appl. Toxicol. 21, 355–391 (2001). [CrossRef]
- Chauhan, S. et all. Chemical warfare agents. Environ. Toxicol. Pharmacol. 26, 113–122. 2008. [CrossRef]
- Lillie, S.H., Hanlon, J.E., Kelly, J.M., Rayburn, B.B., 2017. Potential military chemical/biological agents and compounds. Army, Marine Corps, Navy, Air Force https://irp.fas.org/doddir/army/fm3-11-9.pdf.
- ACGIH (American Conference of Government and Industrial Hygienists). o-Chlorobenzylidene Malononitrile (CAS Reg. No. 2698-41-1); Documentation of the Threshold Limit Values and Biological Exposure Indices; ACGIH: Cincinnati, OH, USA, 1991; pp. 275–278.
- Vaicum, L.M. Epurarea Apelor cu Namol Biologic. Bazele Biochimice; Ed Academica: Tirgu-Mures, Romania, 1981.
- Gheorghe, C.G.; Dusescu, C.; Carbureanu, M. Asphaltenes biodegradation in biosystems adapted on selective media. Rev. Chim. 2016, 67, 2106–2110.
- CG Gheorghe, O Pantea, V Matei, D Bombos, AF Borcea Testing the Behaviour of Pure Bacterial Suspension (Bacillus Subtilis, Pseudomonas Aeruginosa and Micrococcus Luteus) in Case of Hydrocarbons Contaminators Revista de Chimie 62 (9), 926-929.
- CG Gheorghe, AFB Pantea, O, V. Matei, D. Bombos The Efficiency of Flocculants in Biological Treatment with Activated Sludge Revista de chimie 62 (10), 1023-1026.
- CG Gheorghe, O Pantea, V Matei, D Bombos, AF Borcea Testing of Bacterial and Fungal Resistance in the Water Pollution with Cationic Detergents REVISTA DE CHIMIE 62 (7), 707-711.
- E. BERTOLAZZI A Combination Formula of Michaelis-Menten-Monod Type Computers and Mathematms with Apphcations 50 (2005) 201-215. [CrossRef]
- L.Leadbester, G.L.Sainsbury, U.Utley Ortho-Chlorobenzyliden malononitrile: A metabolite formed from Ortho-Chlorobenzyliden malononitrile(CS) Toxicology and applied pharmacology 25, 111-116, 1973. [CrossRef]
- Gheorghe, V.; Gheorghe, C.G.; Bondarev, A.; Toader, C.N.; Bombos, M. The contamination effects and toxicological characterization of o-chlorobenzylidene manolonitrile. Rev. Chim. 2020, 71, 67–75. [CrossRef]
- Silva, A.; Figueiredo, S.A.; Sales, M.G.; Delerue-Matos, C. Ecotoxicity tests using the green algae Chlorella vulgaris—A useful tool in hazardous effluents management. J. Hazard. Mater. 2009, 167, 179–185. [CrossRef]
- NIST Chemistry Web Book, SRD 69; NIST: Gaithersburg, MD, USA, 2022.
- Gheorghe, V.; Gheorghe, C.G.; Bondarev, A.; Somoghi, R. Ecotoxicity of o-Chlorobenzylidene Malononitrile (CBM) and Toxicological Risk Assessment for SCLP Biological Cultures (Saccharomyces sp., Chlorella sp., Lactobacillus sp., Paramecium sp.). Toxics 2023, 11, 285. [CrossRef]
- Grigoriu, N., Epure, G., Moşteanu, D., Overview on analysis of free metabolites for detection of exposure to chemical warfare agents, Scientifical Bulletin of “Nicolae Balcescu” Land Forces Academy, no. 1(39), 49 – 56, 2015. [CrossRef]
- Pretorian, A., Grigoriu, N., Petre, R., Petrea, N., Non-lethal weapons based on composition of malodor-irritating used to accentuate stress or for discomfort features in modern battlefield, Technical Military Magazine no. 1, pp. 13-20, 2018.
- David WetzelJustin Murdock FT-IR Microspectroscopy Enhances Biological and Ecological Analysis of Algae Applied Spectroscopy Reviews 44(4):335-361 June 2009. [CrossRef]
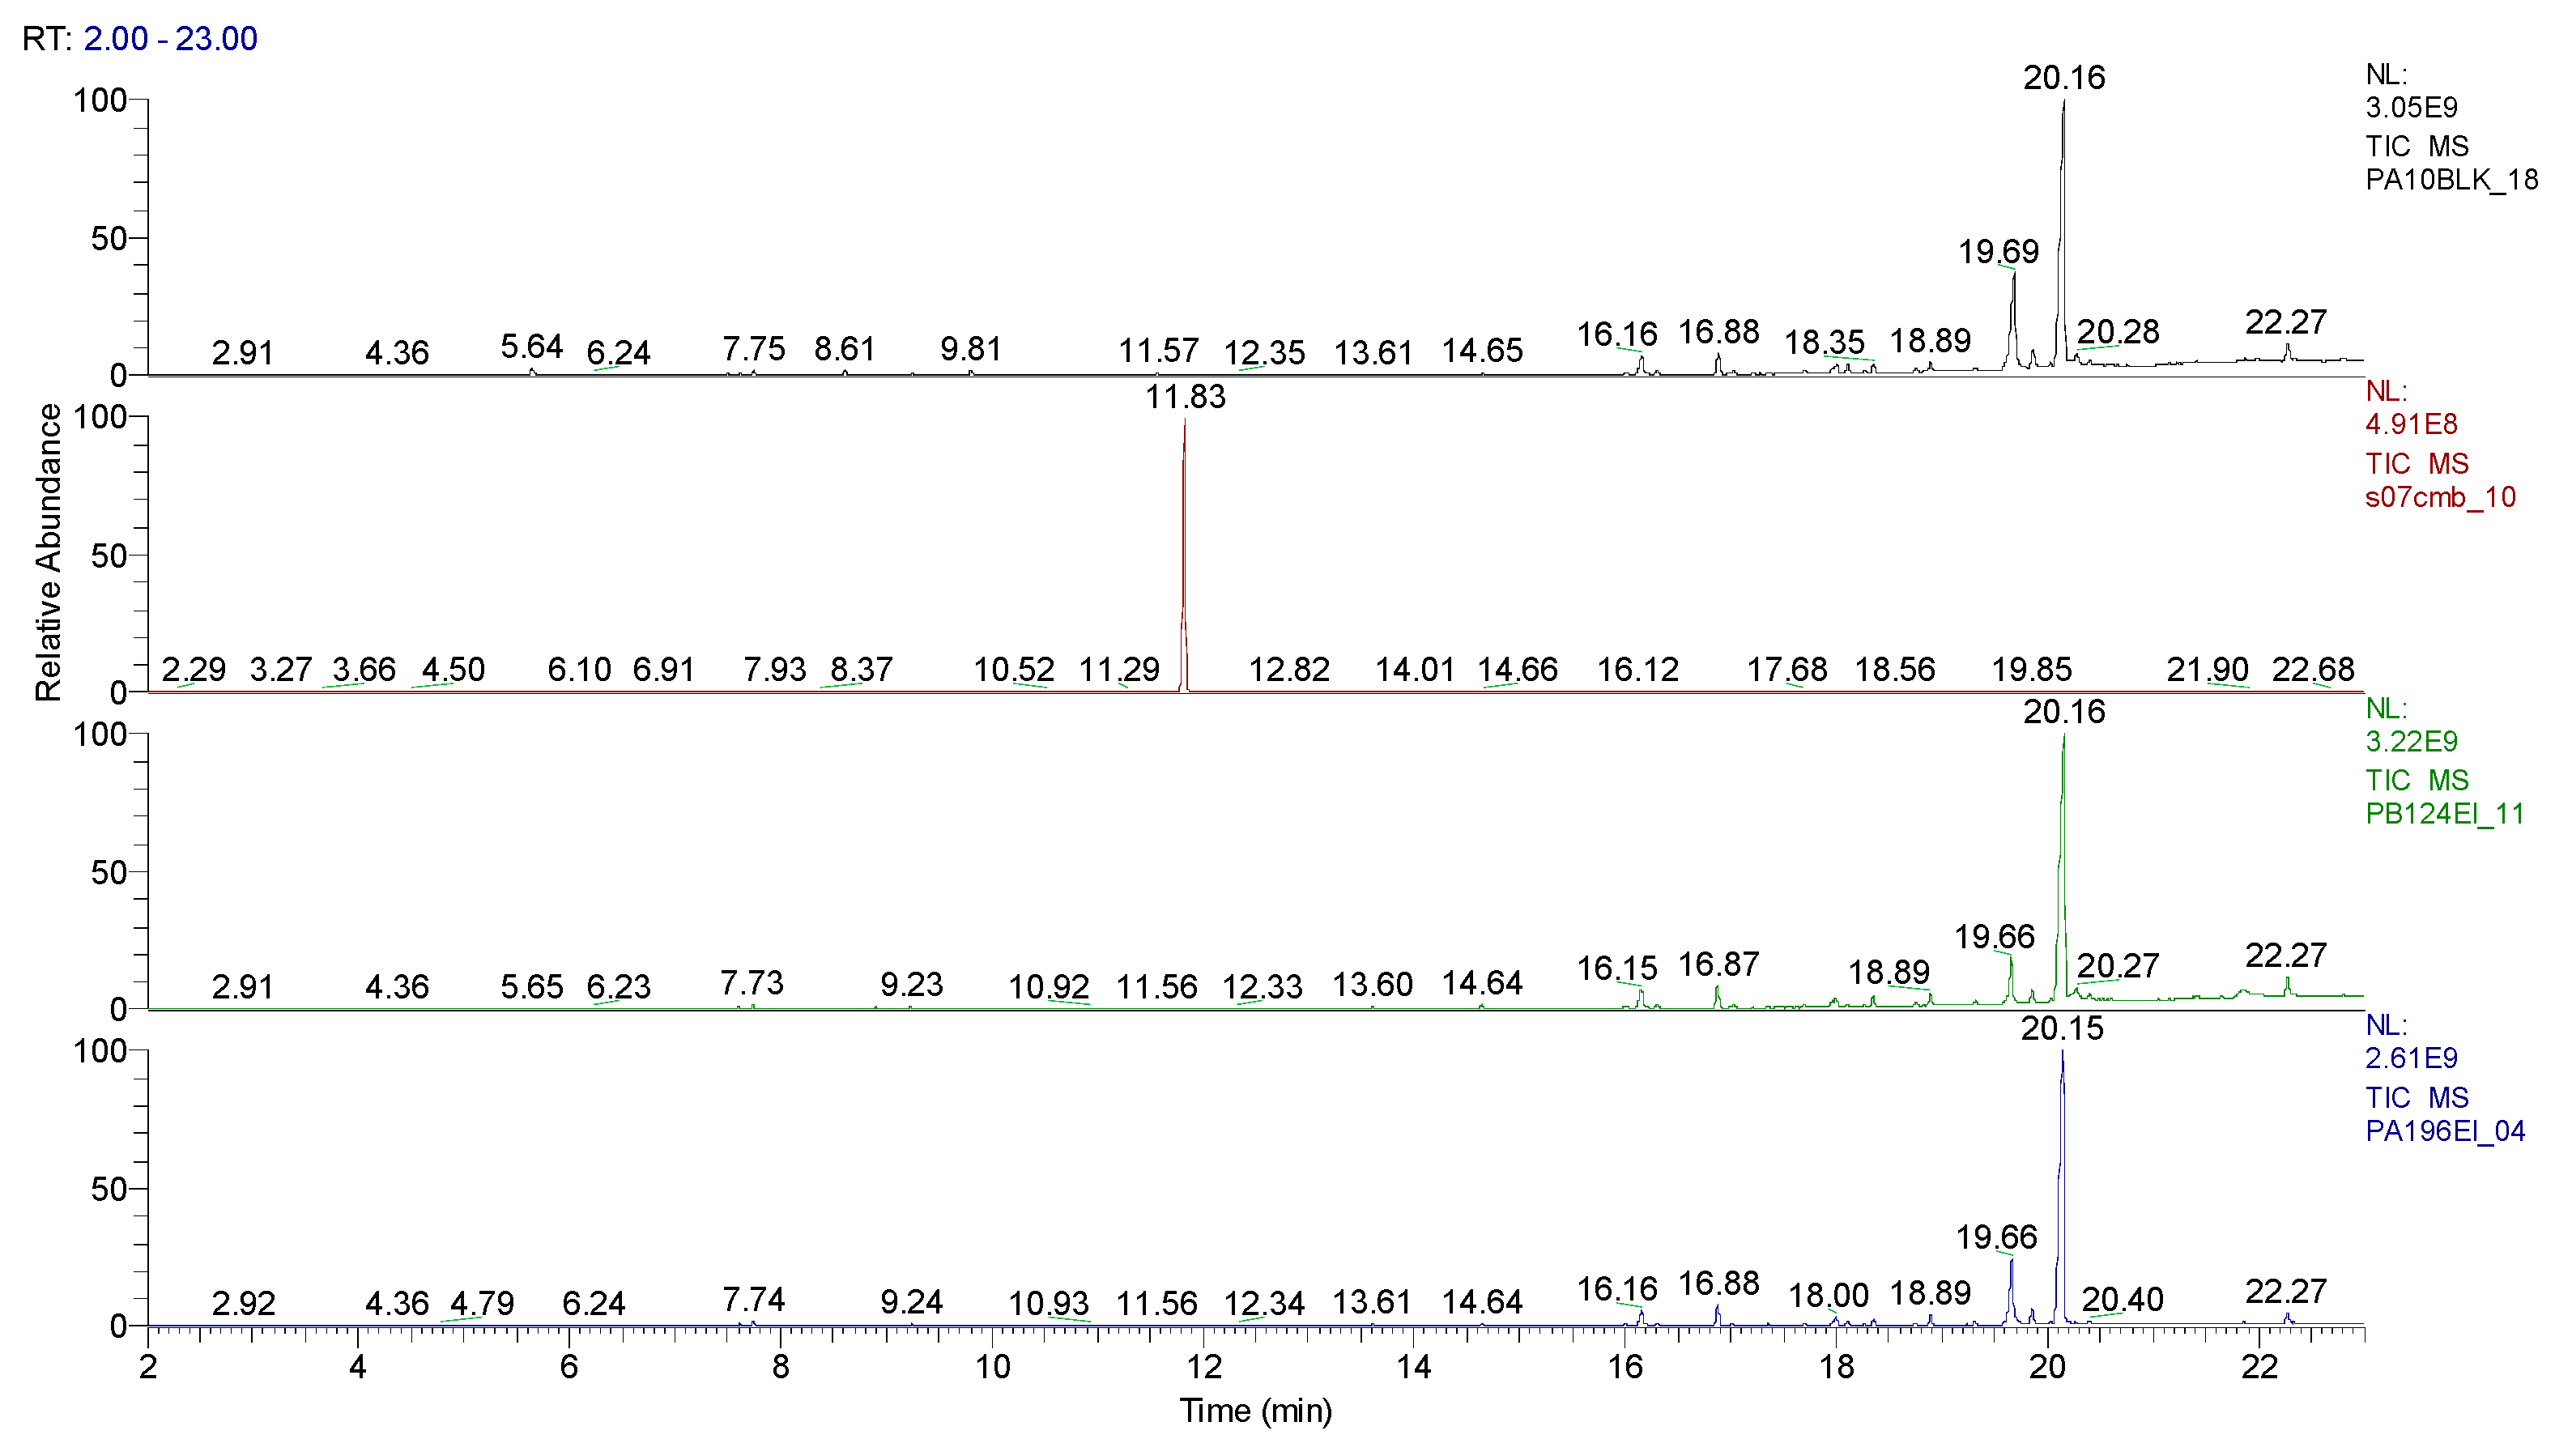
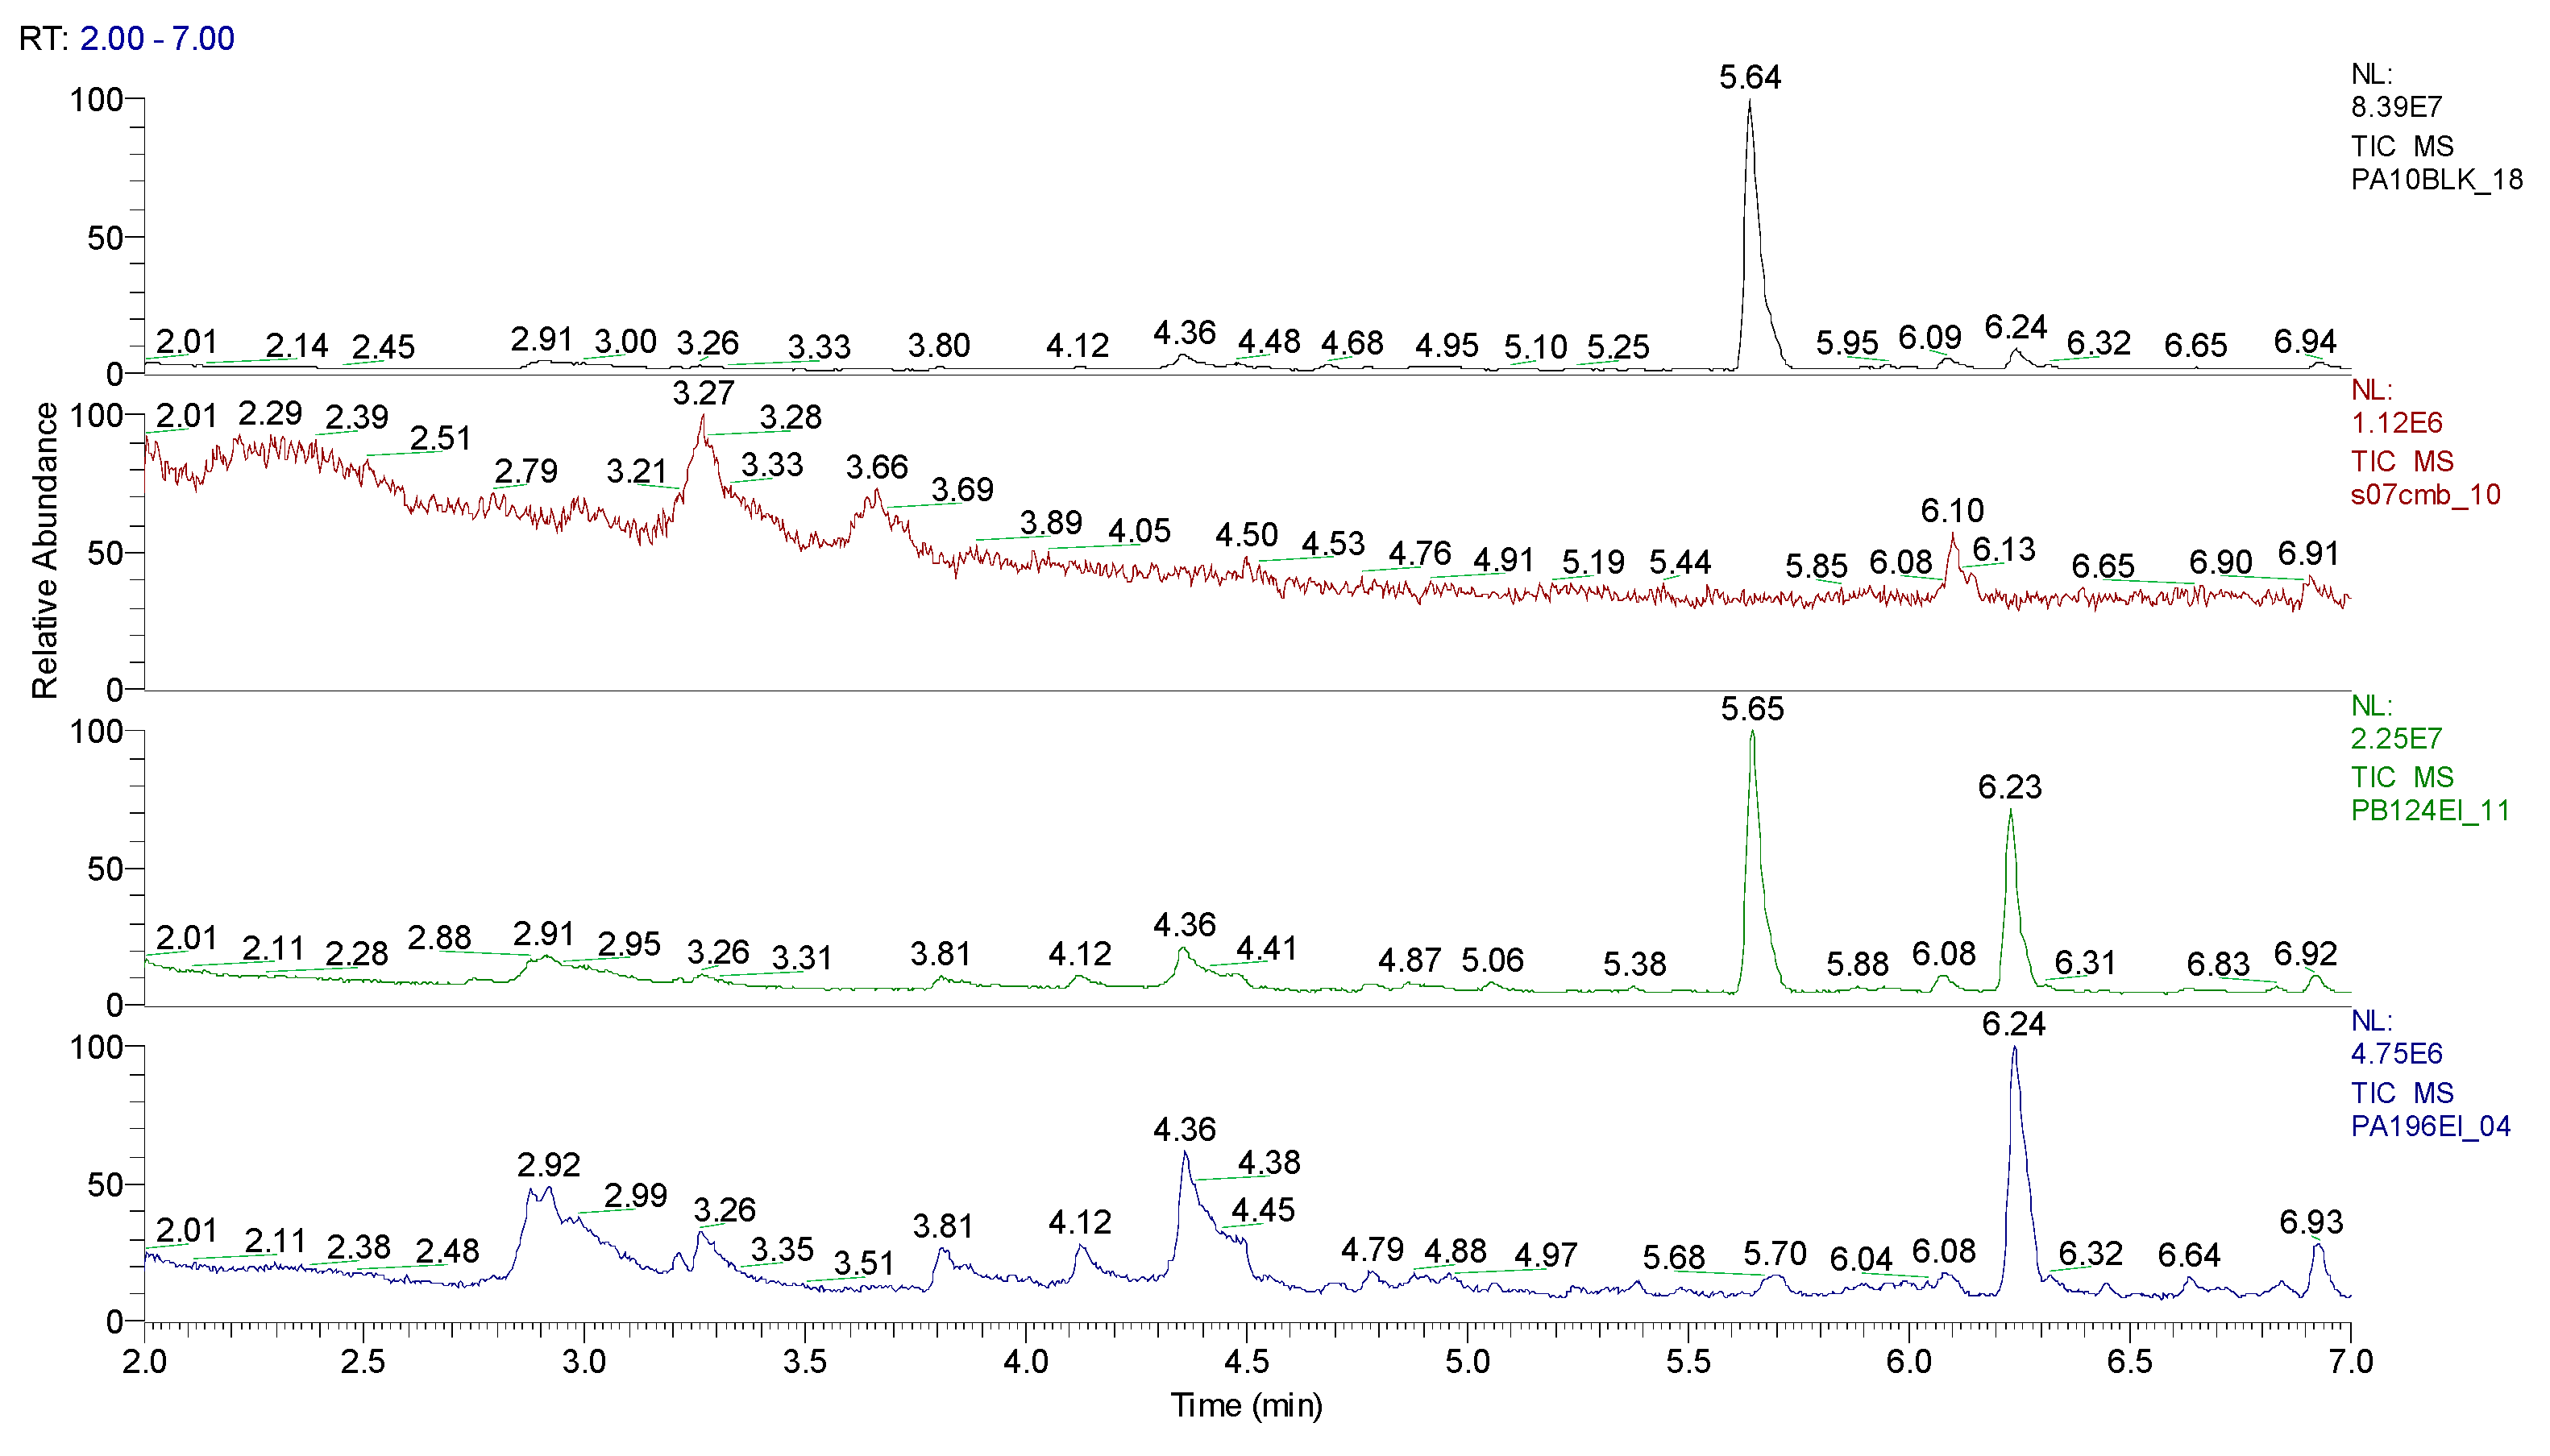
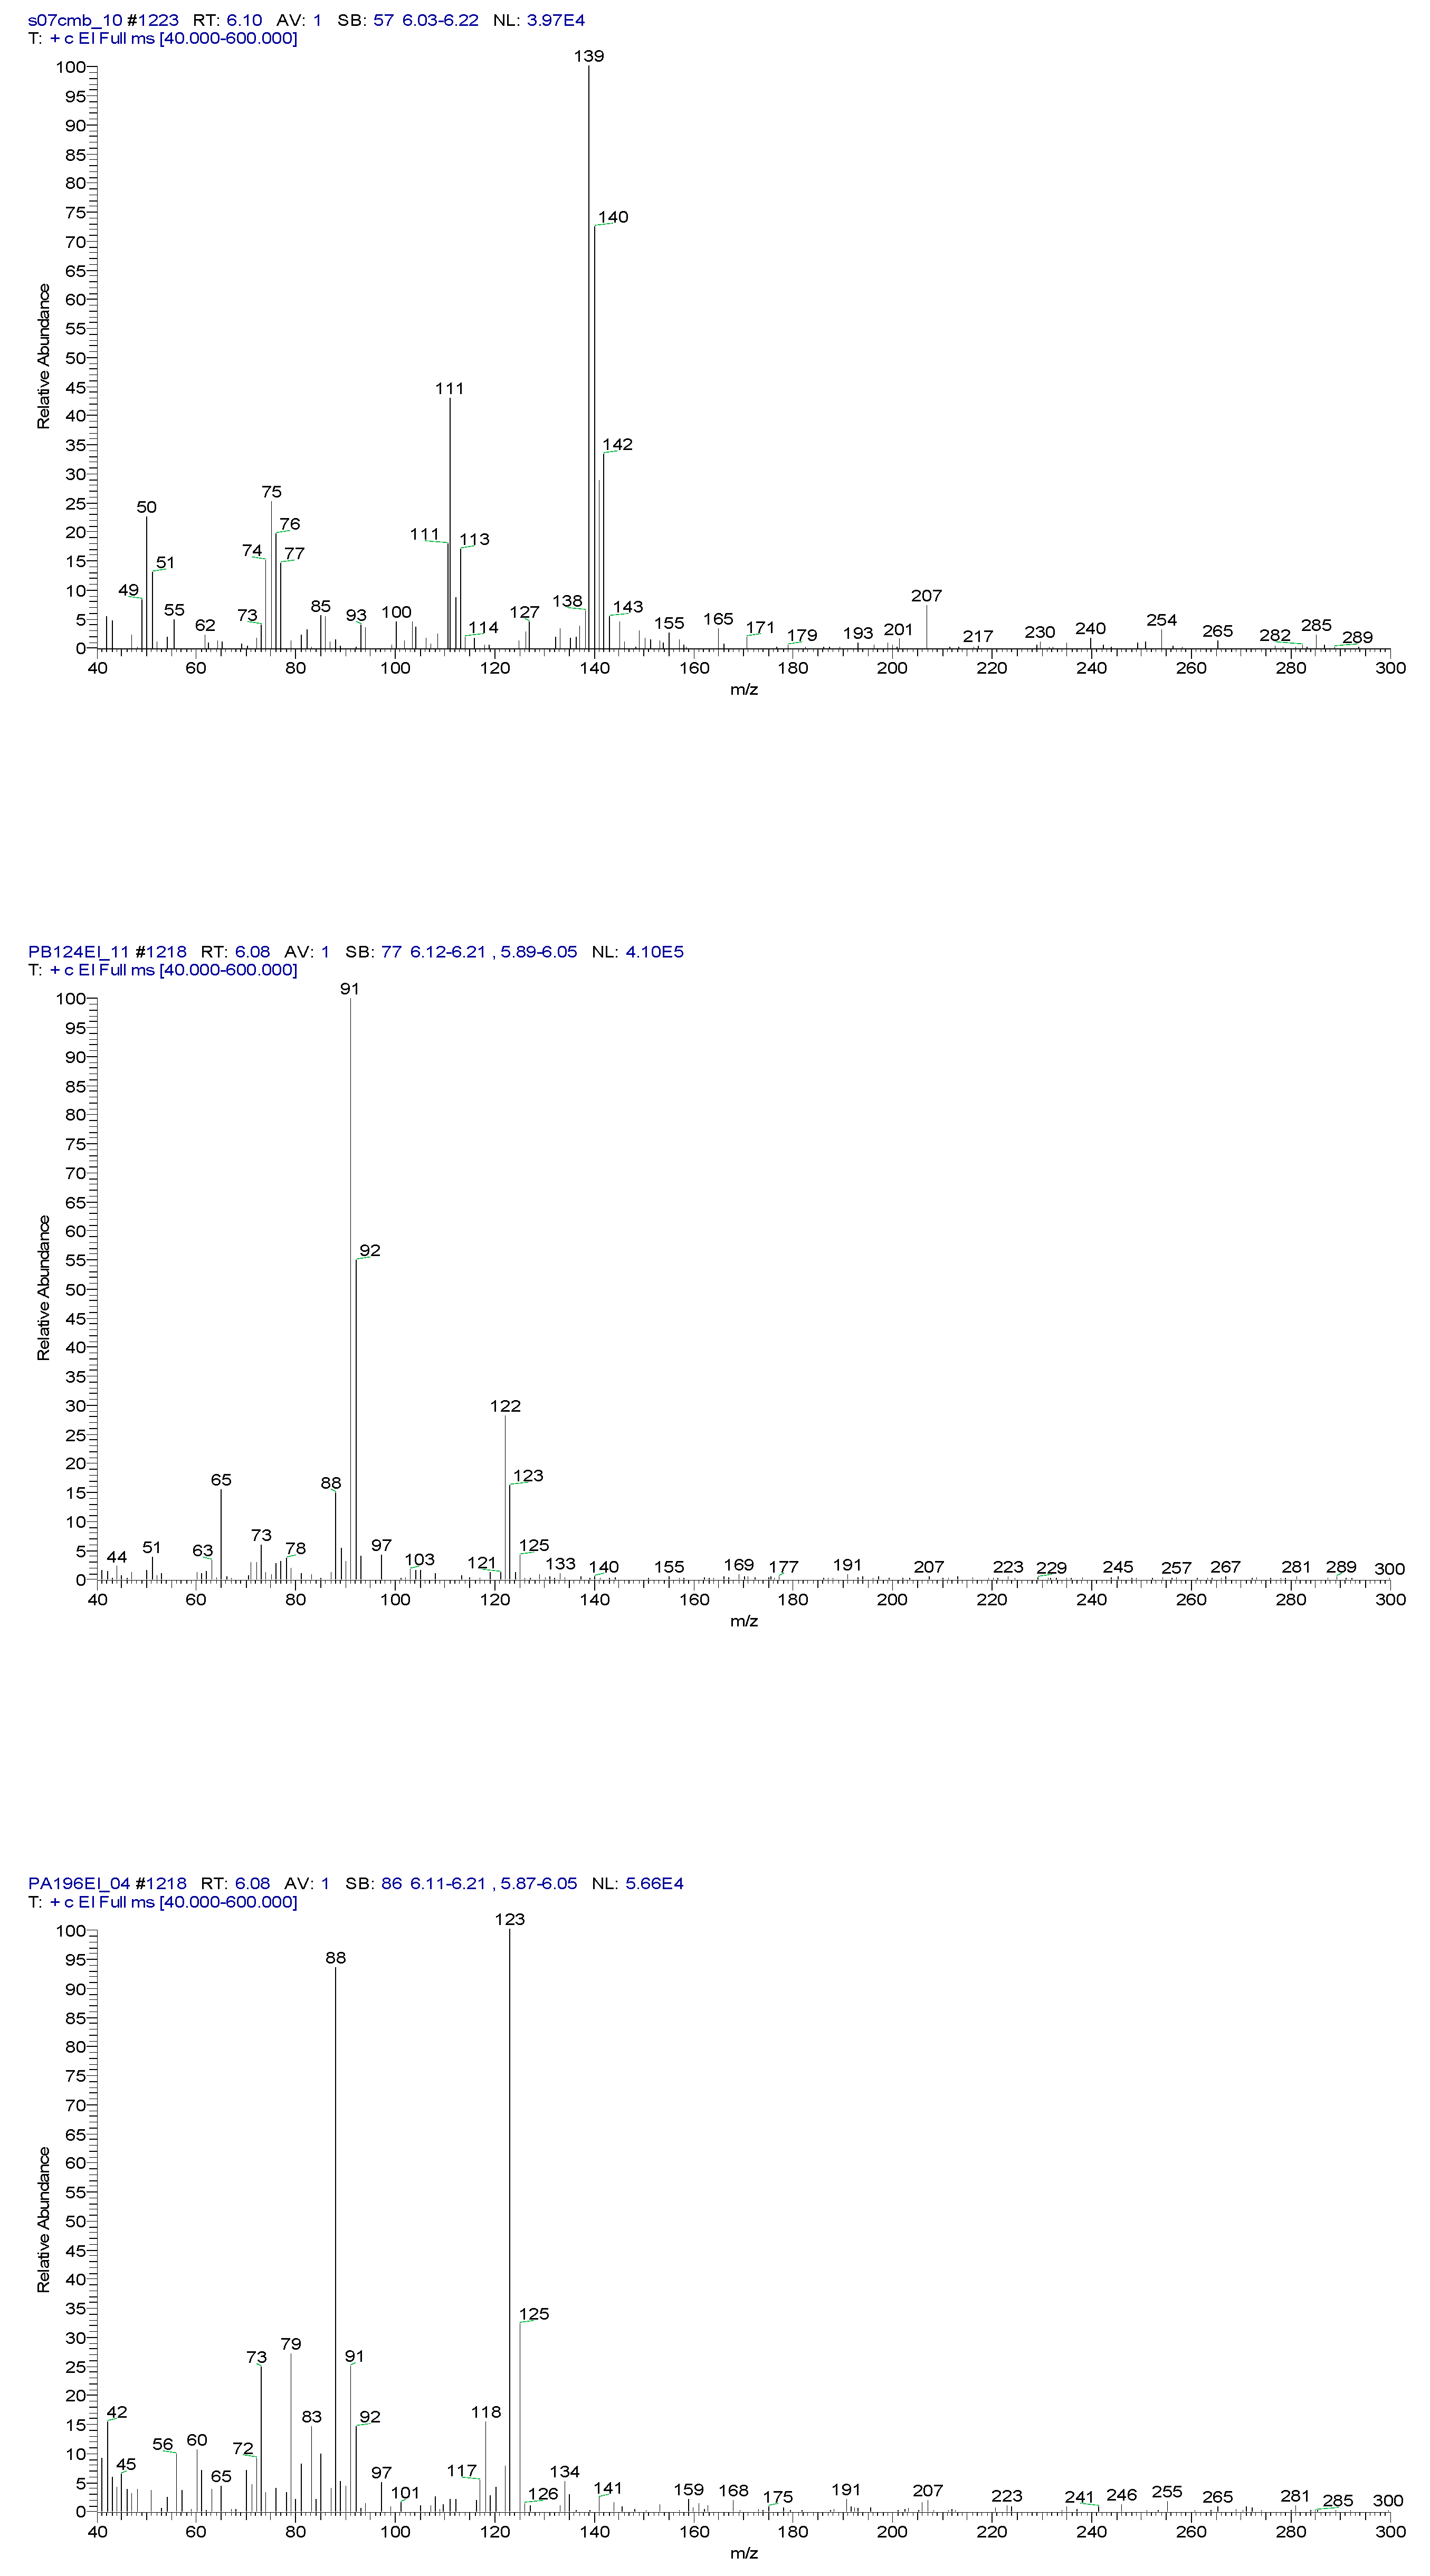
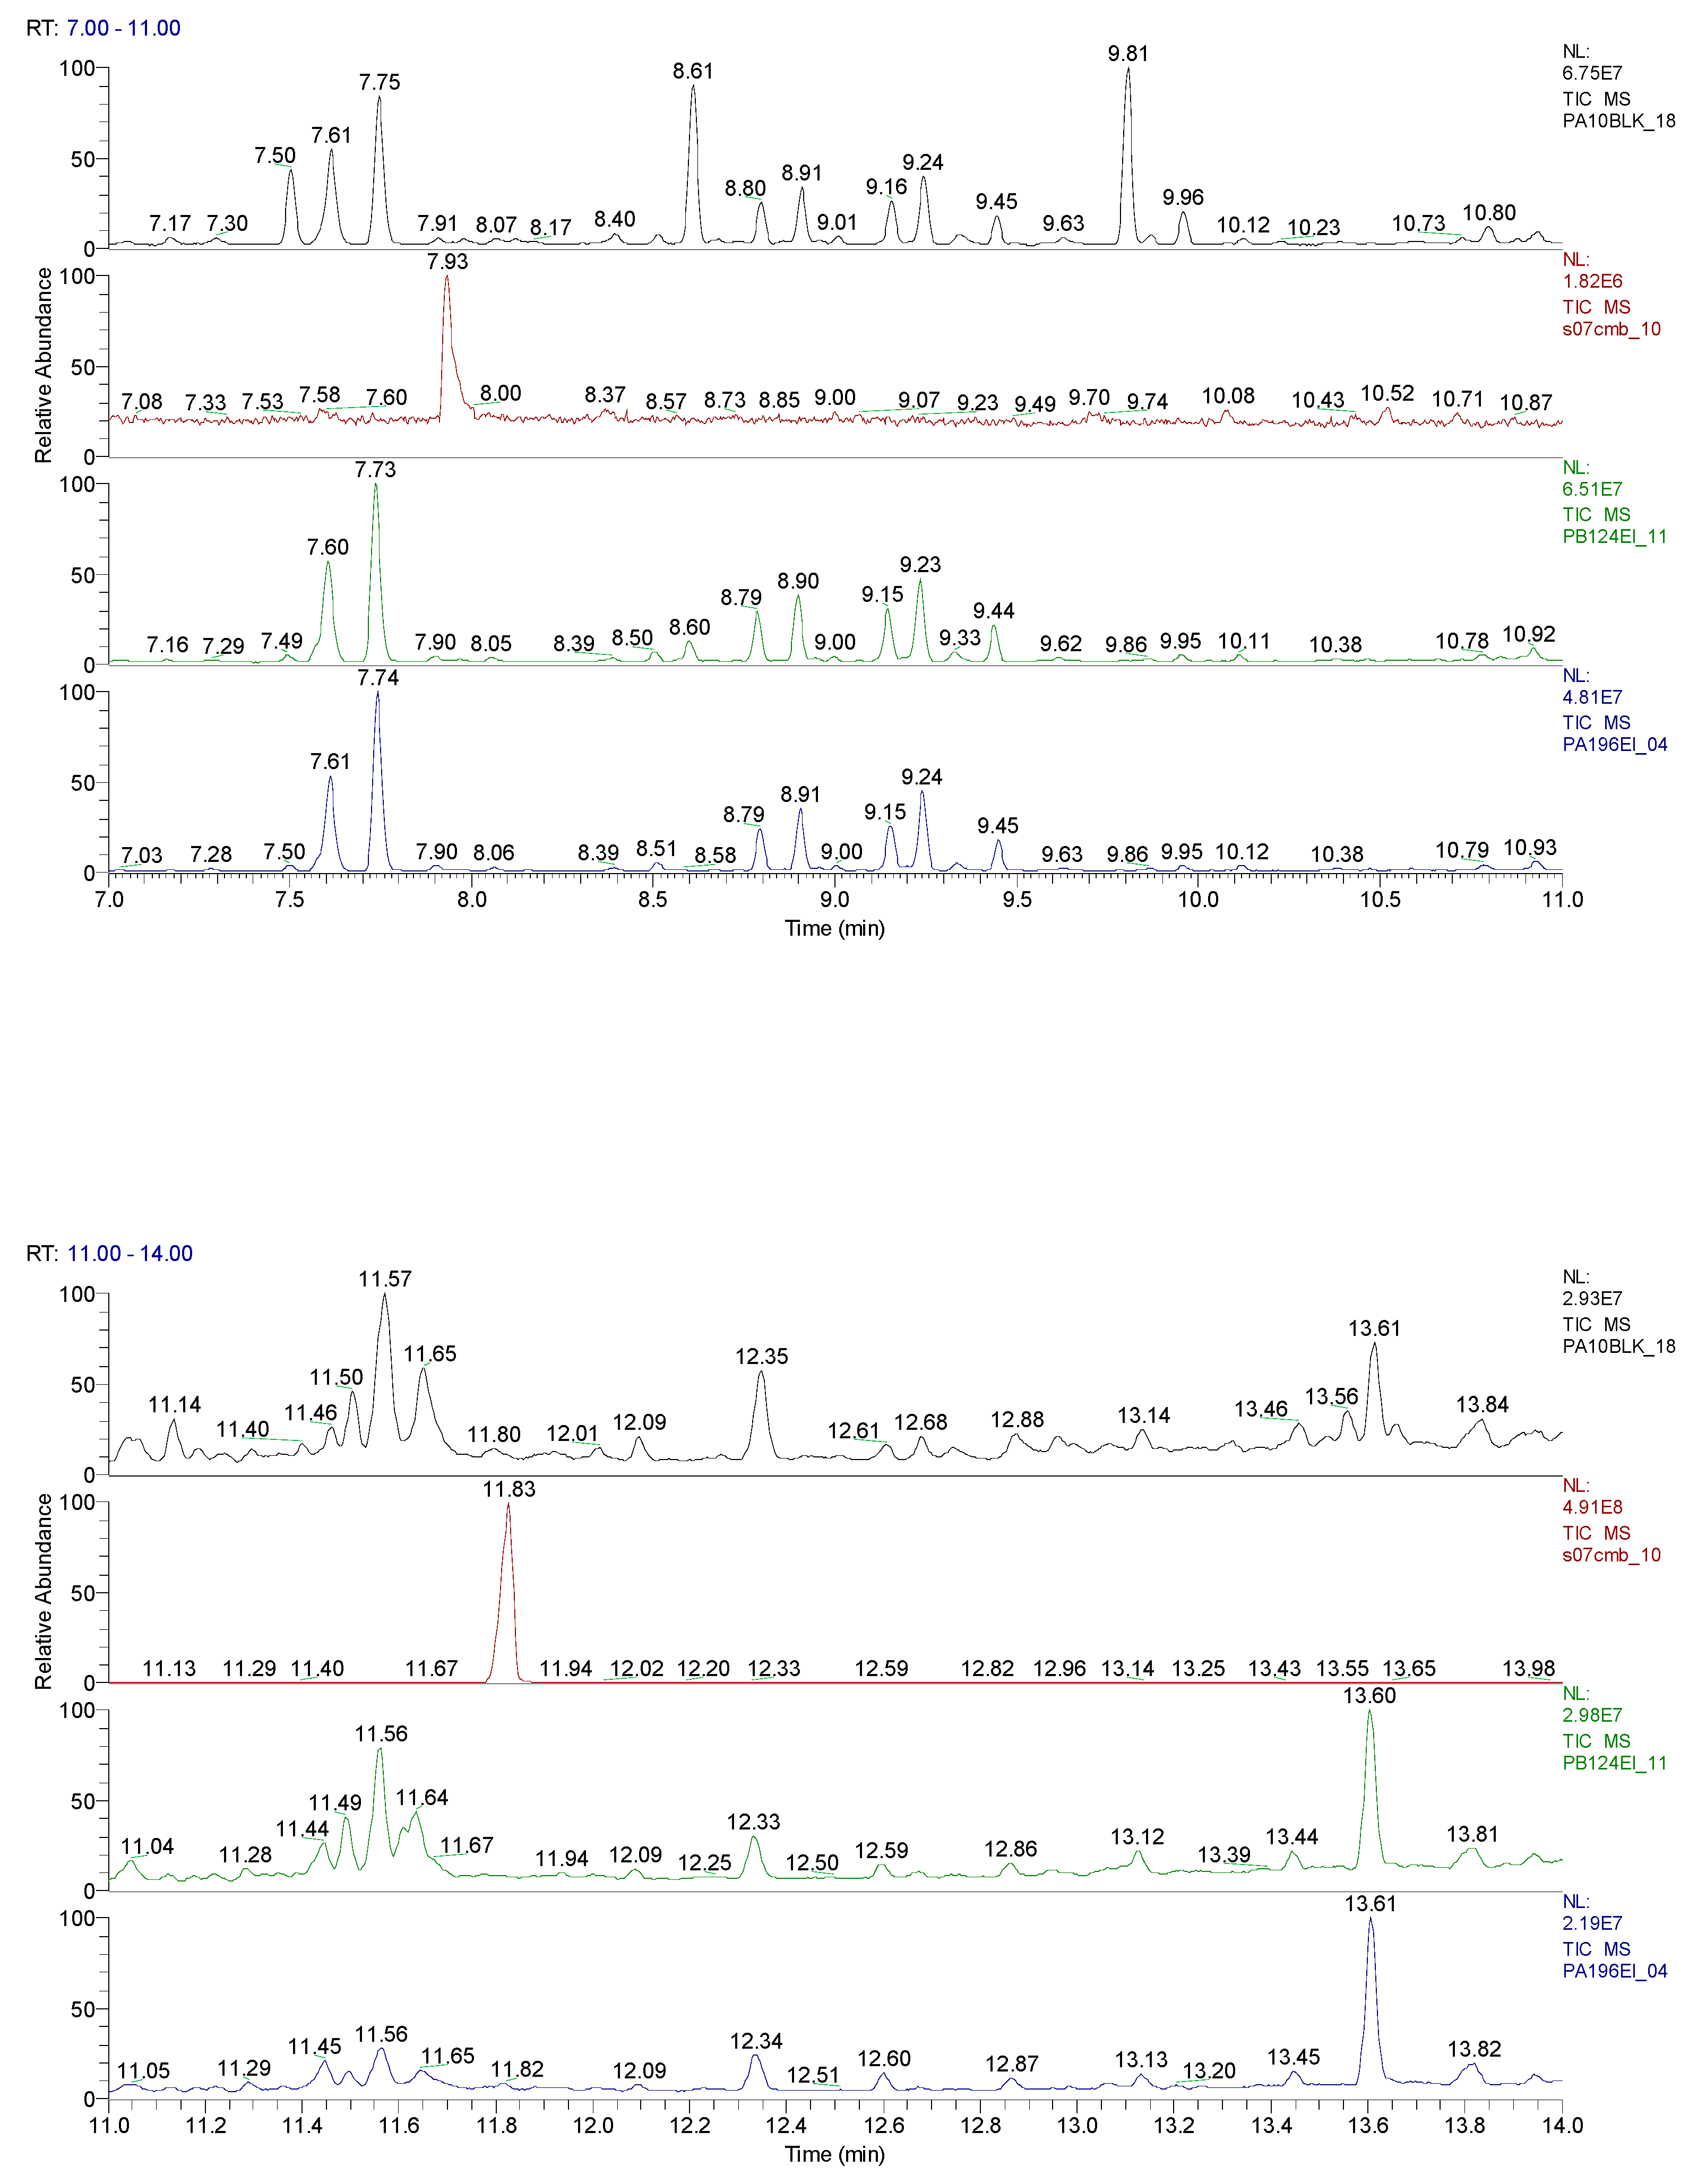
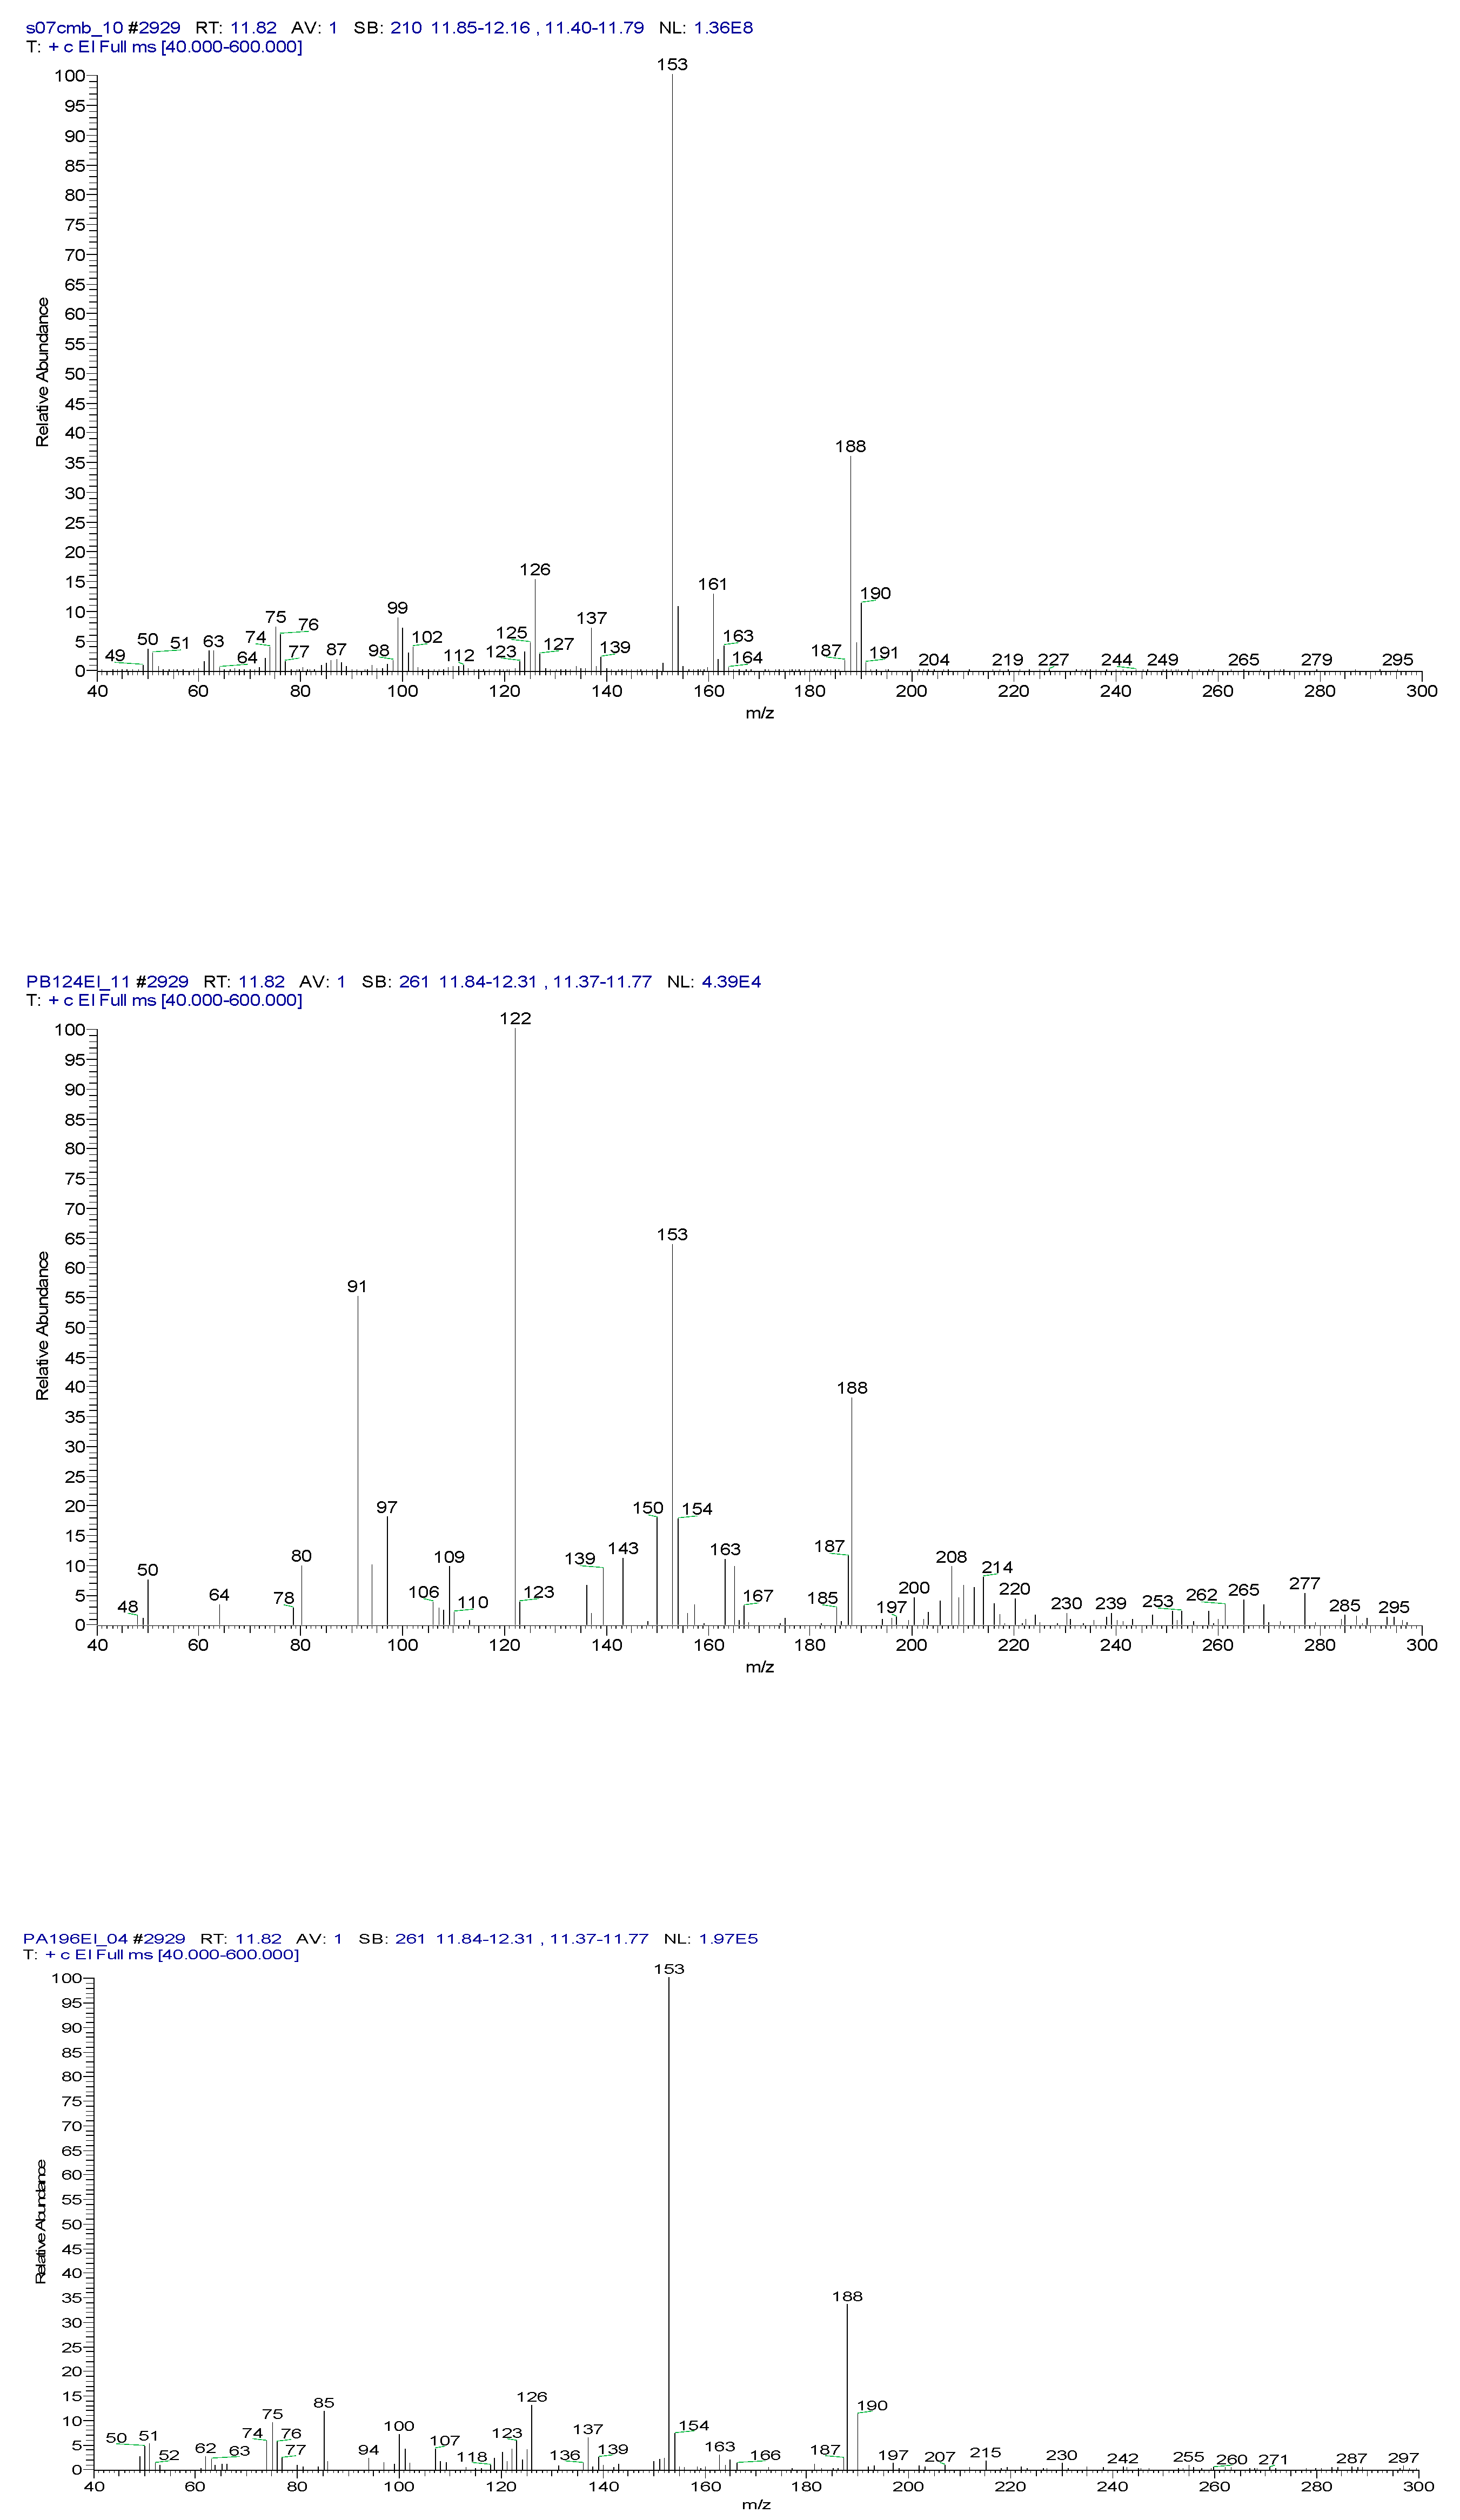
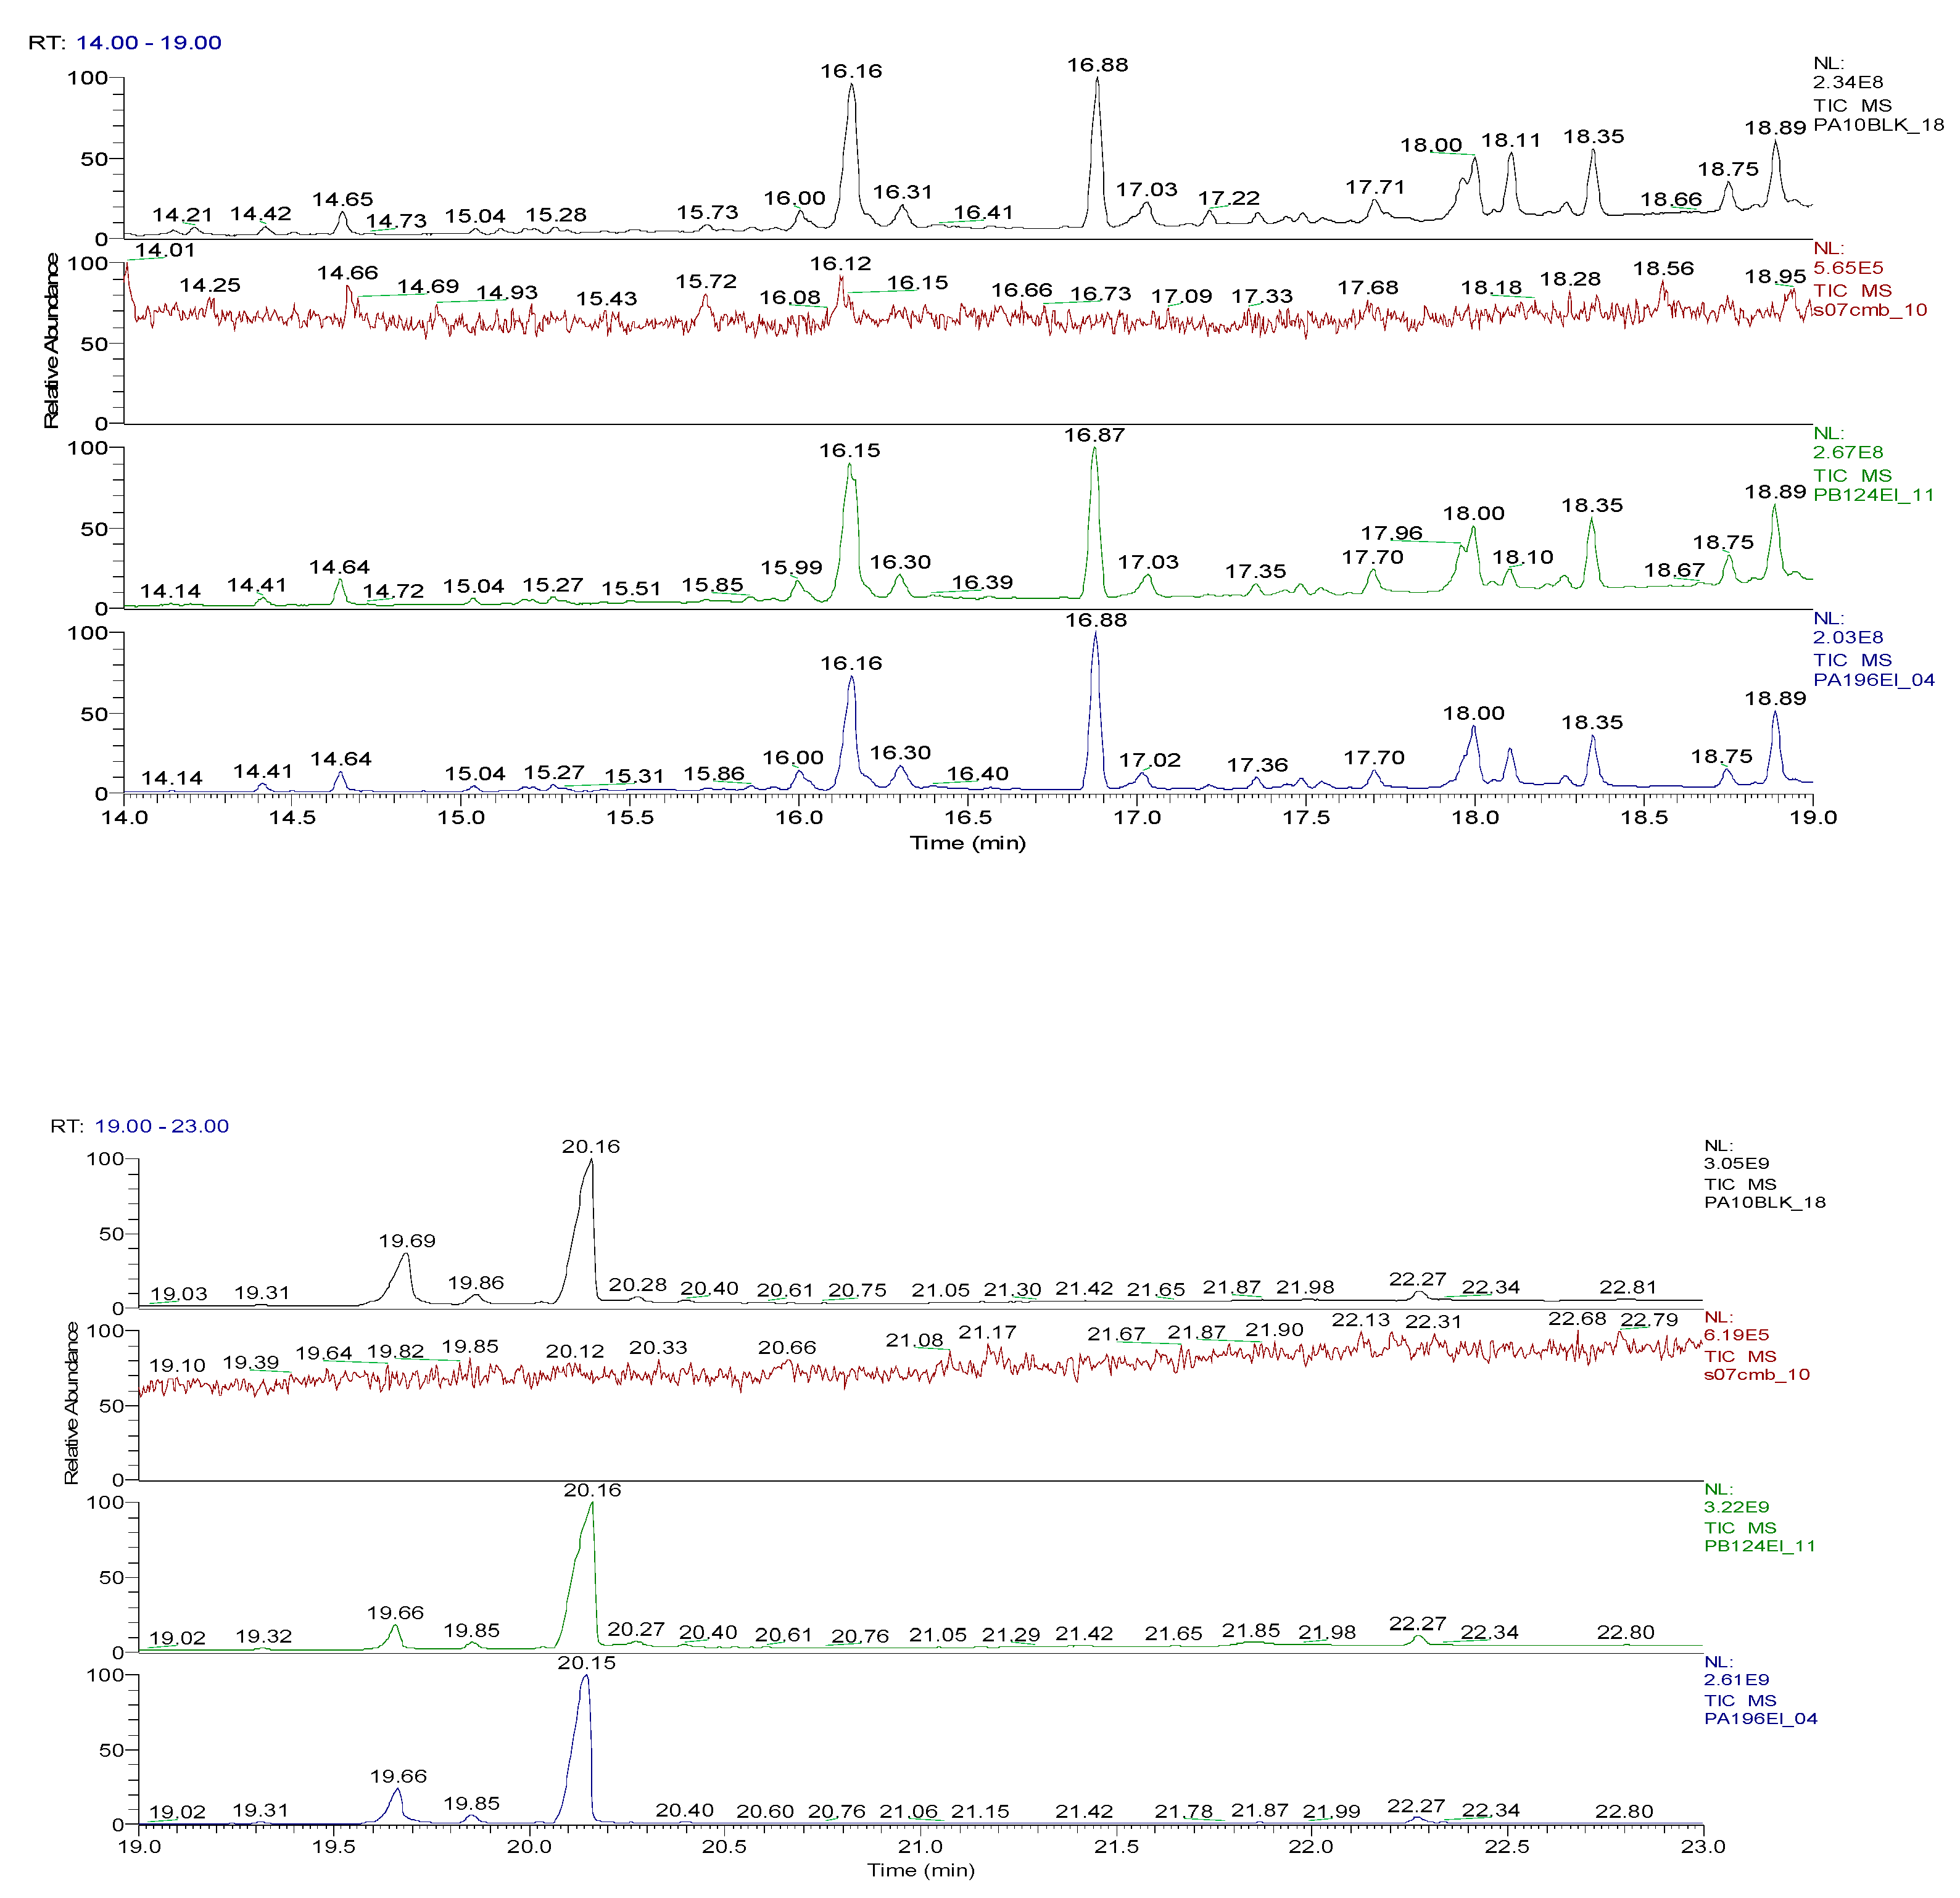
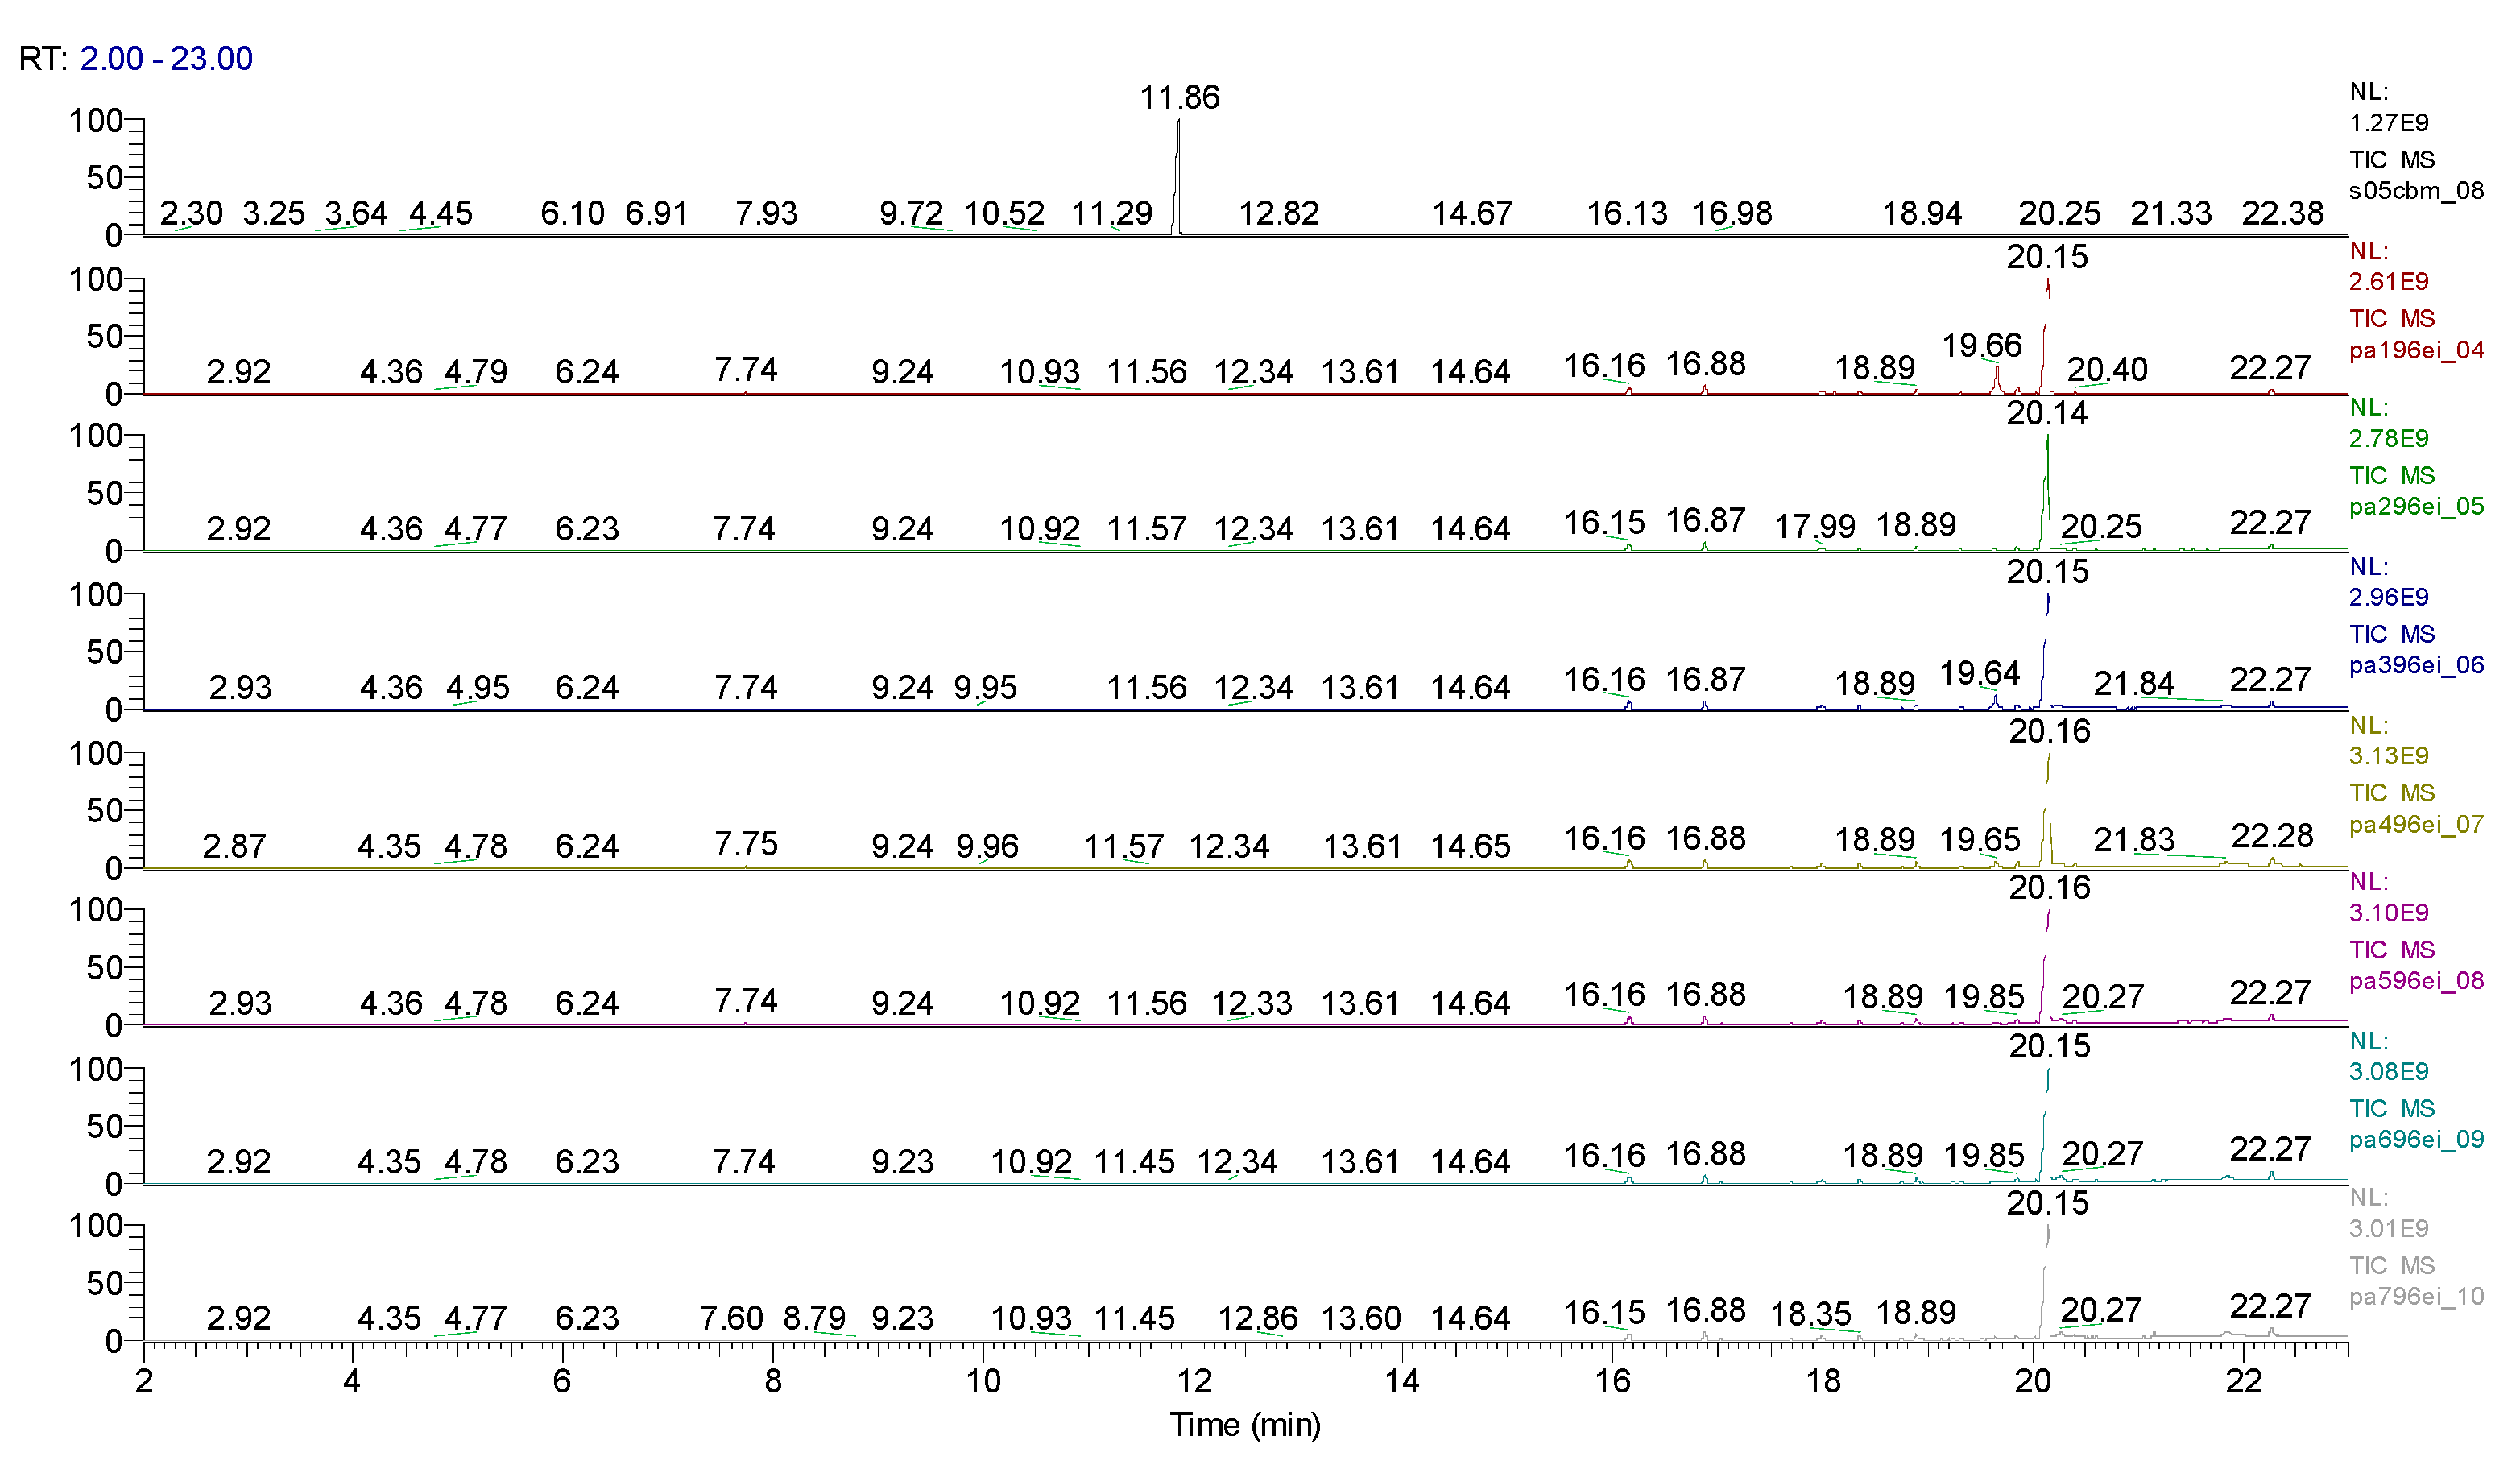
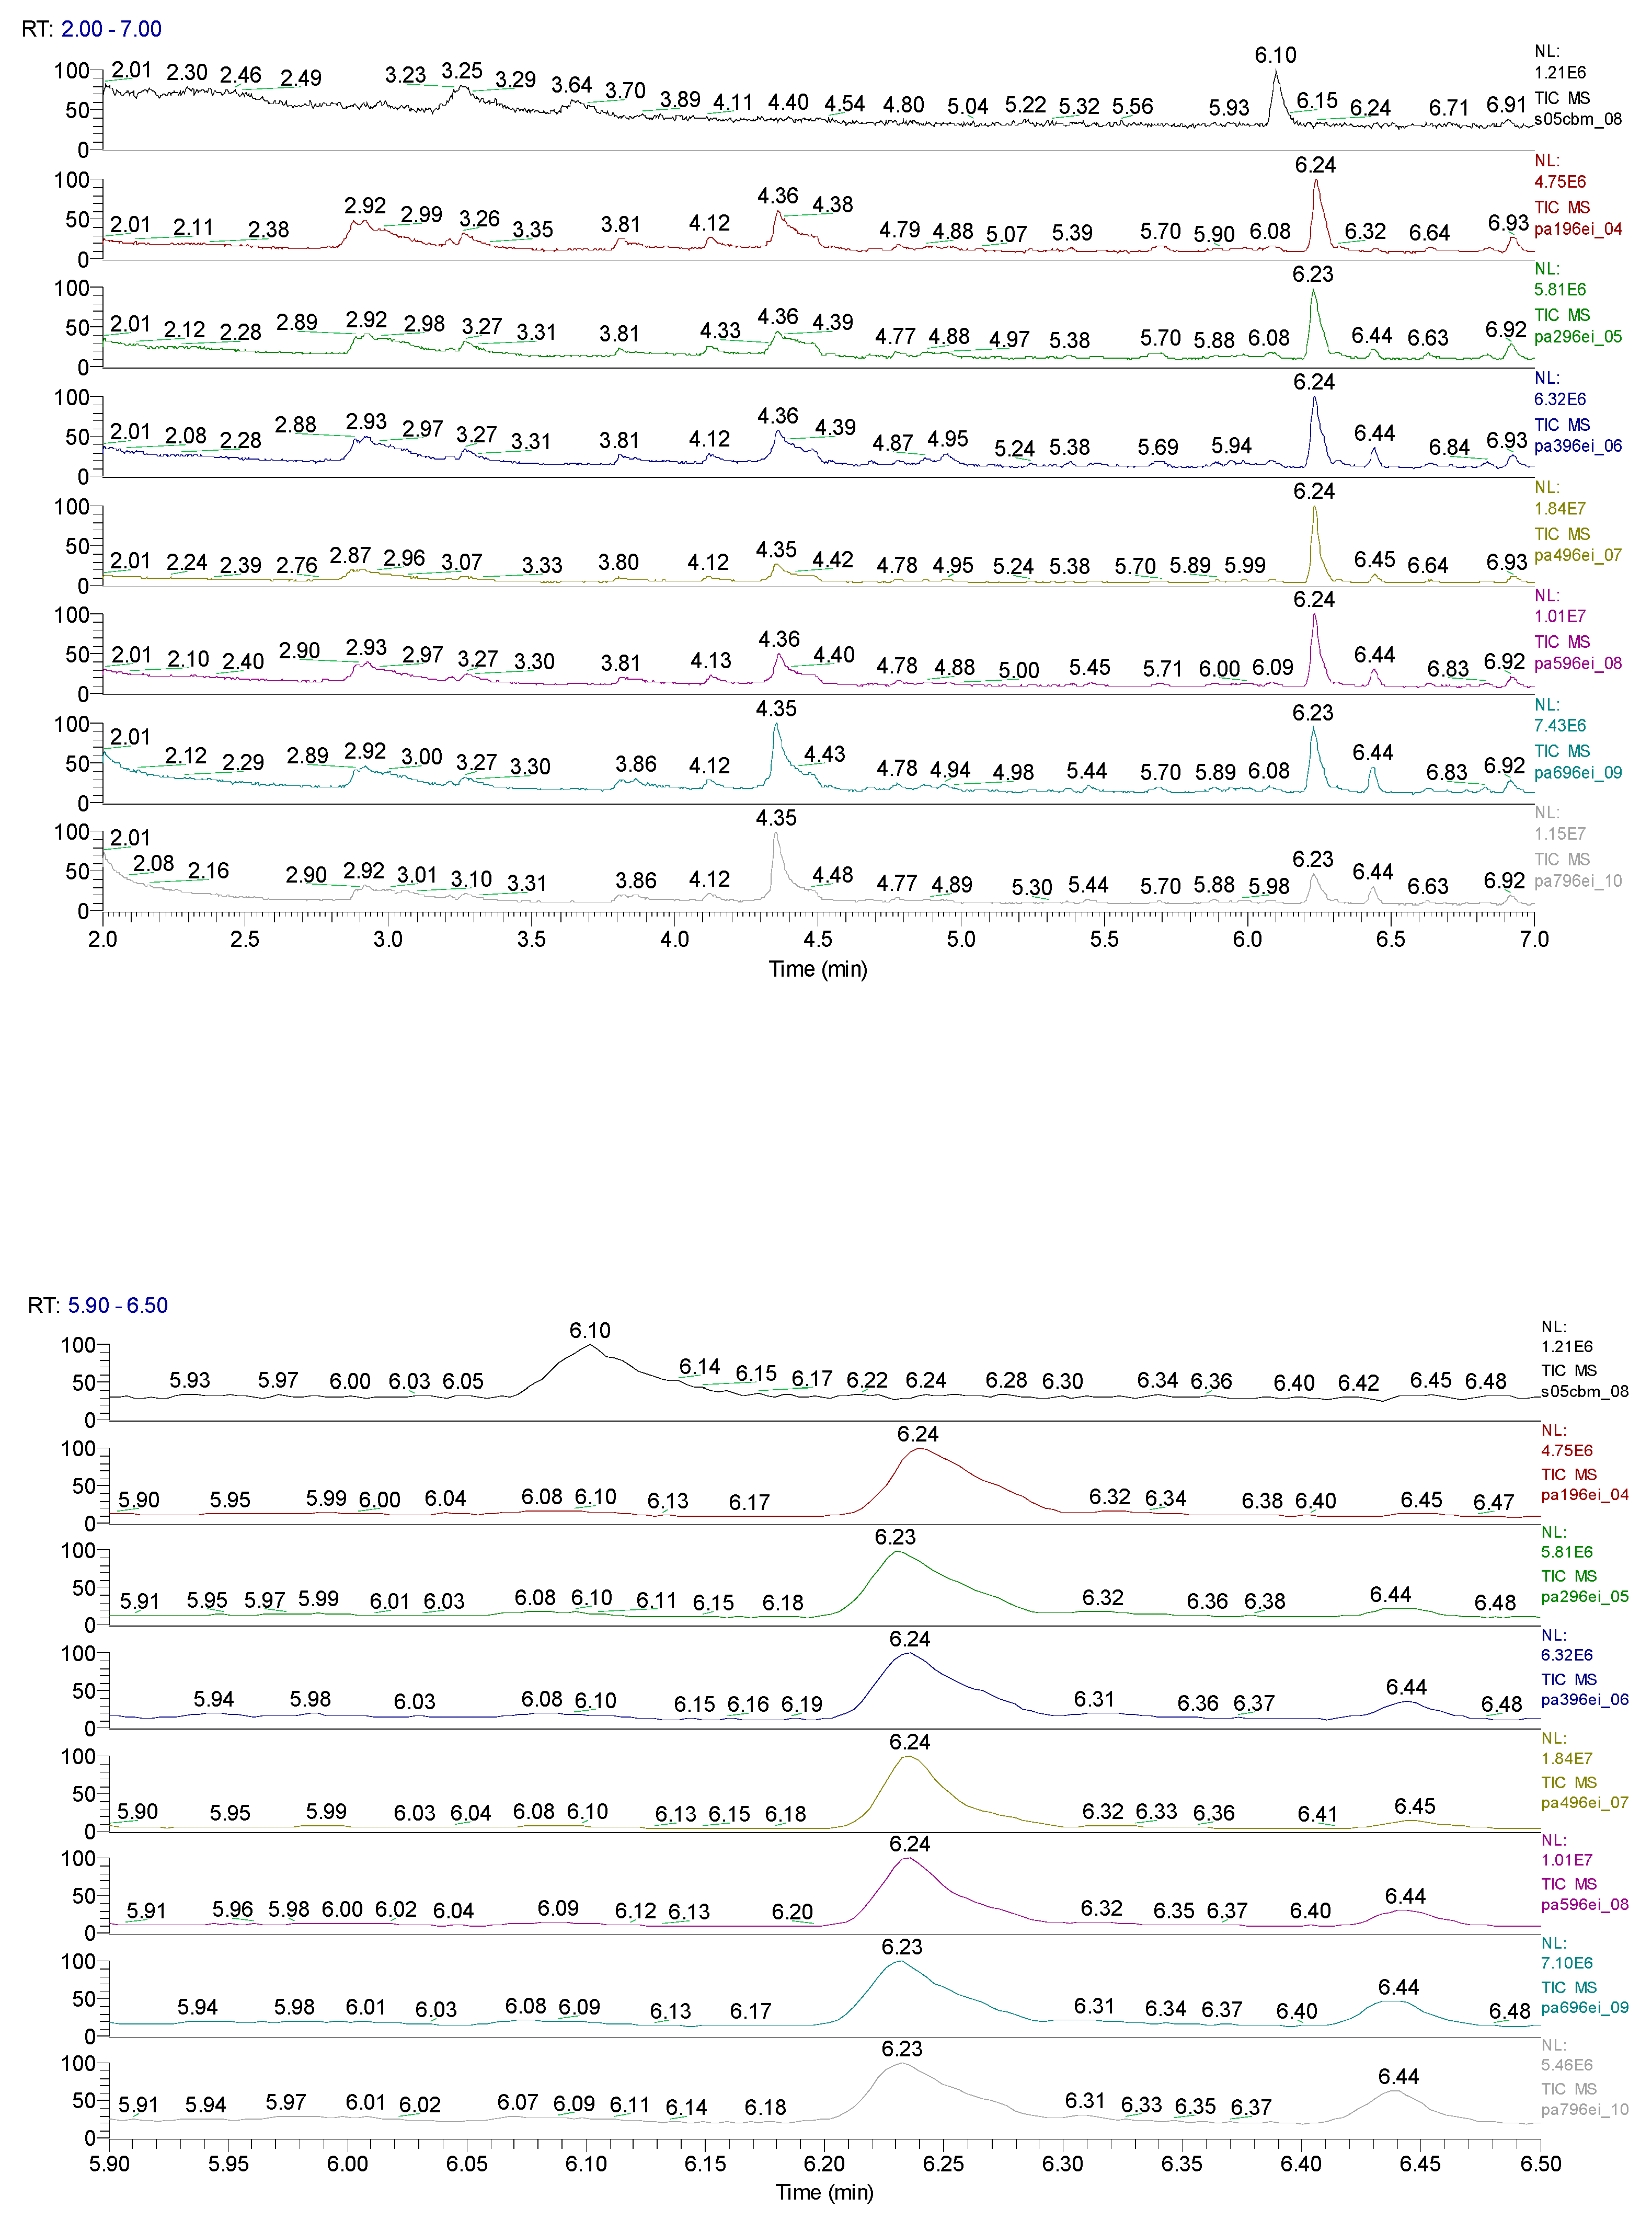
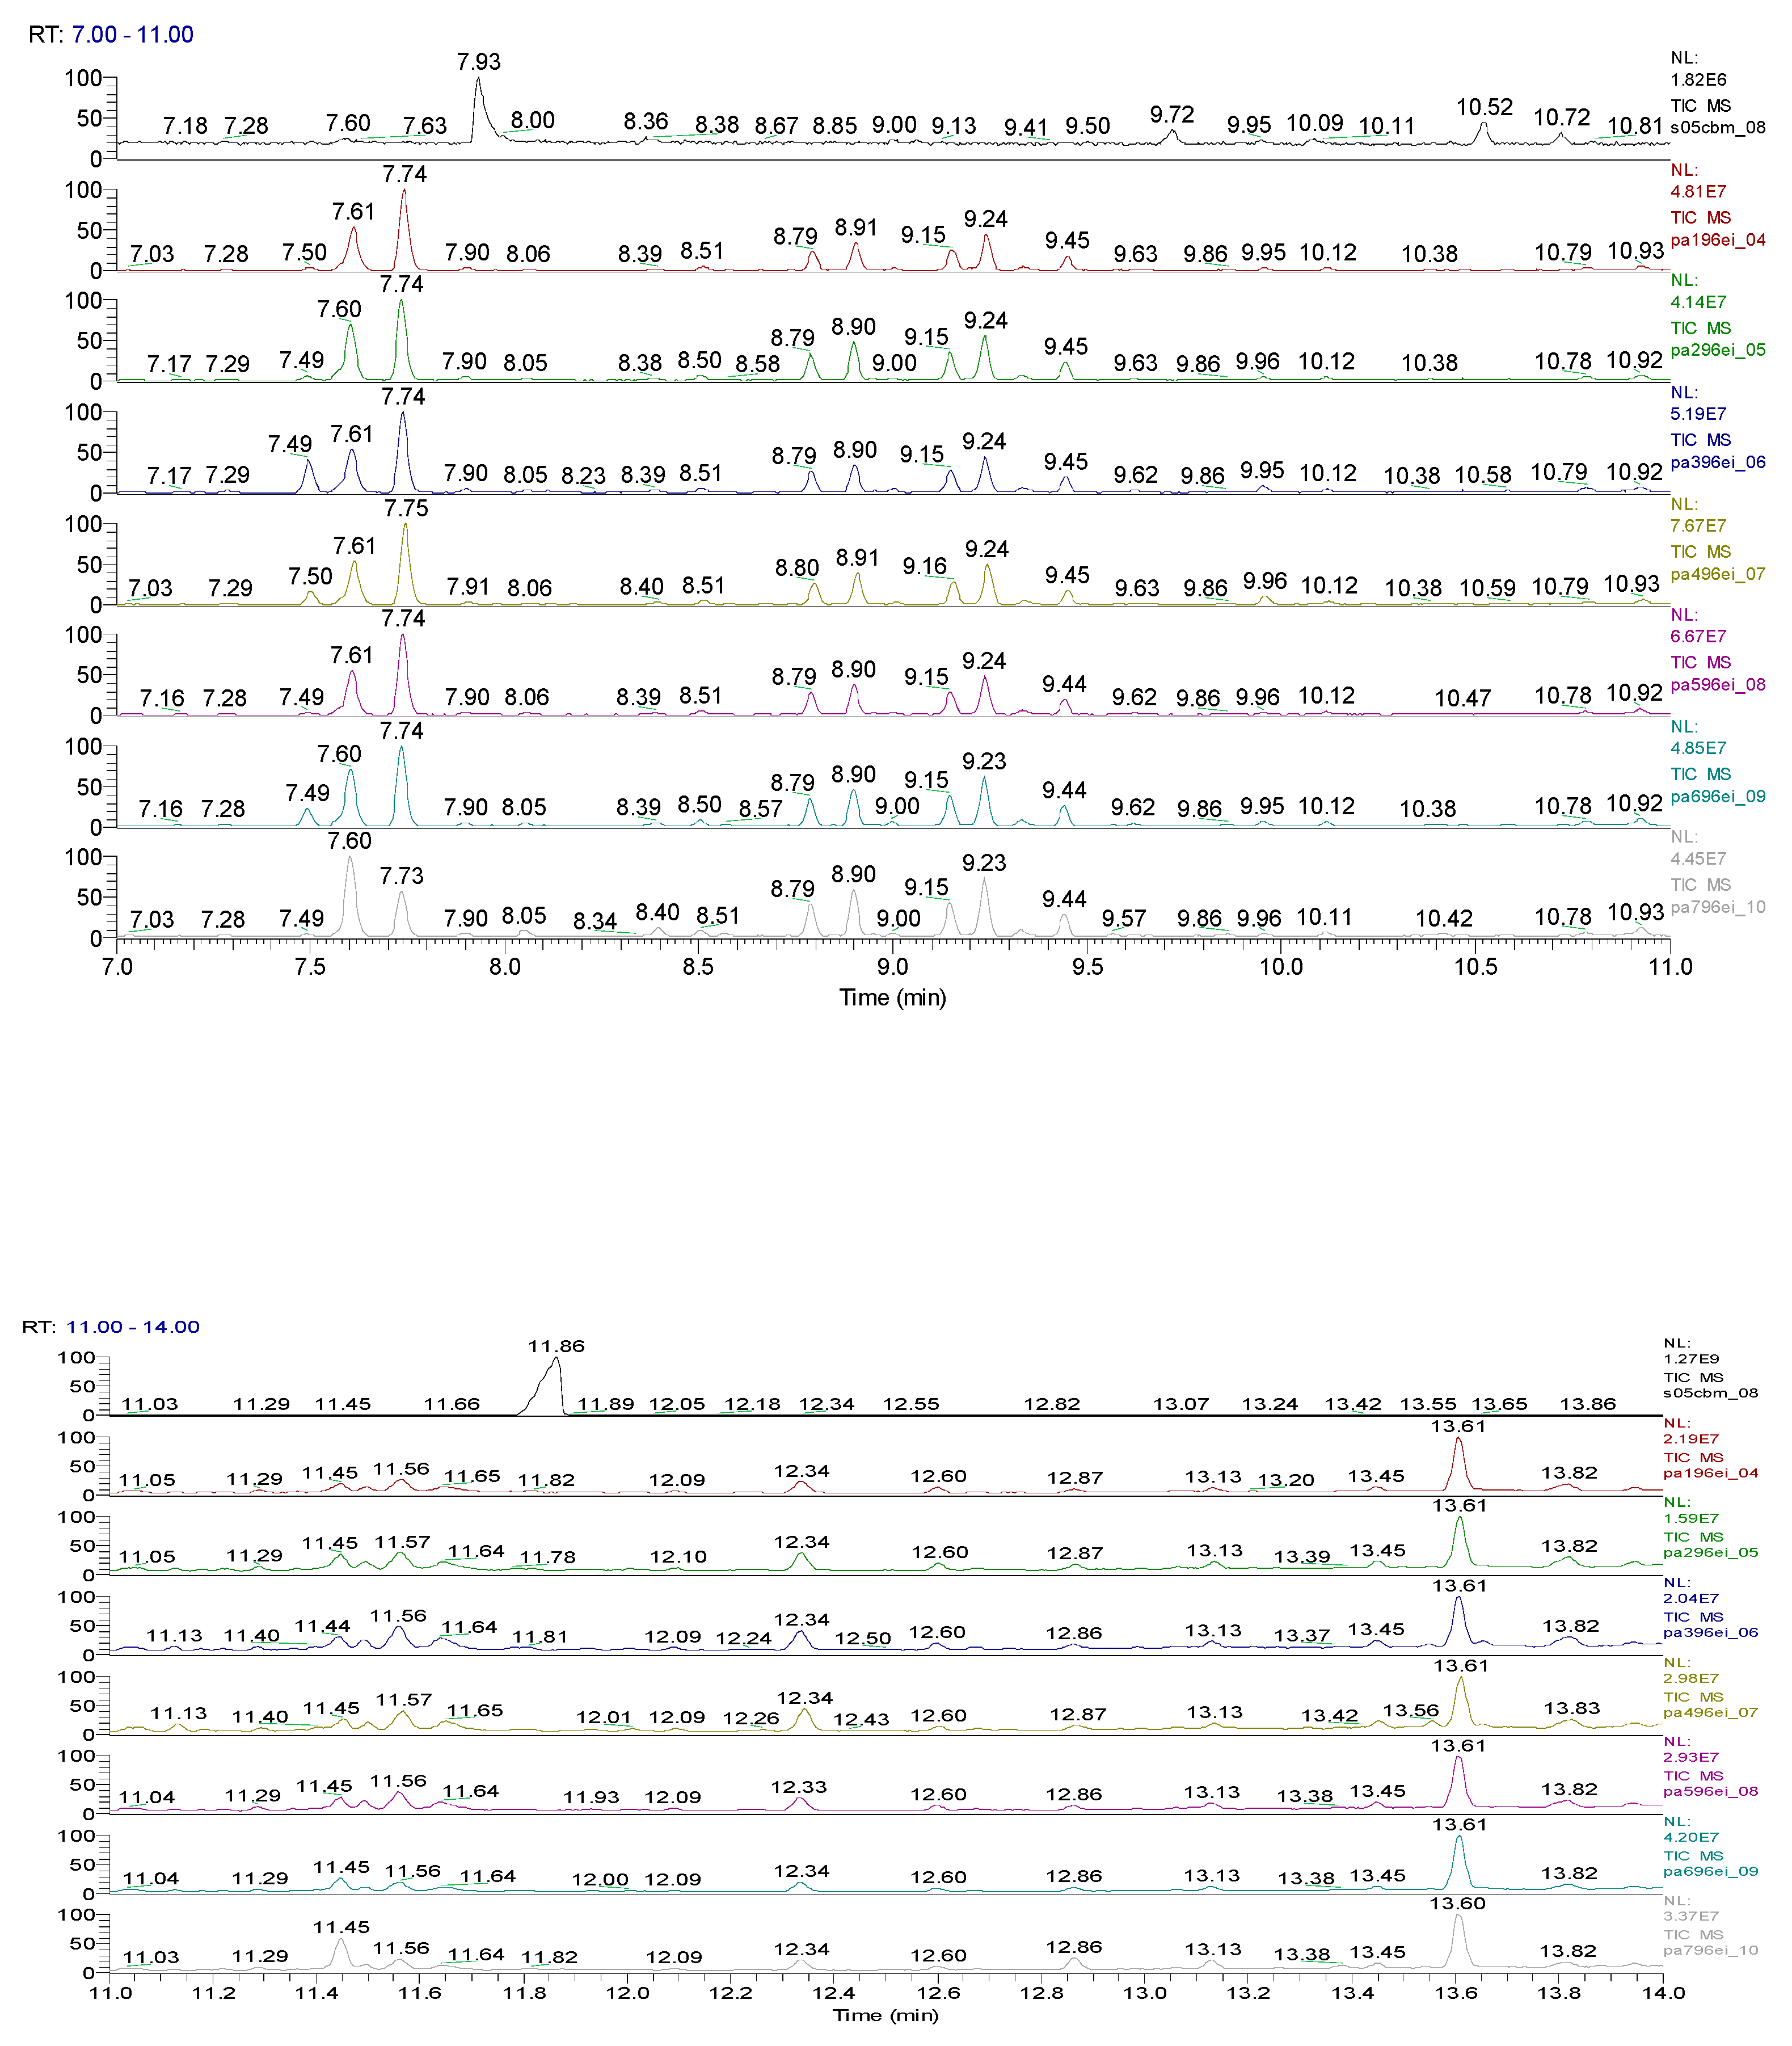
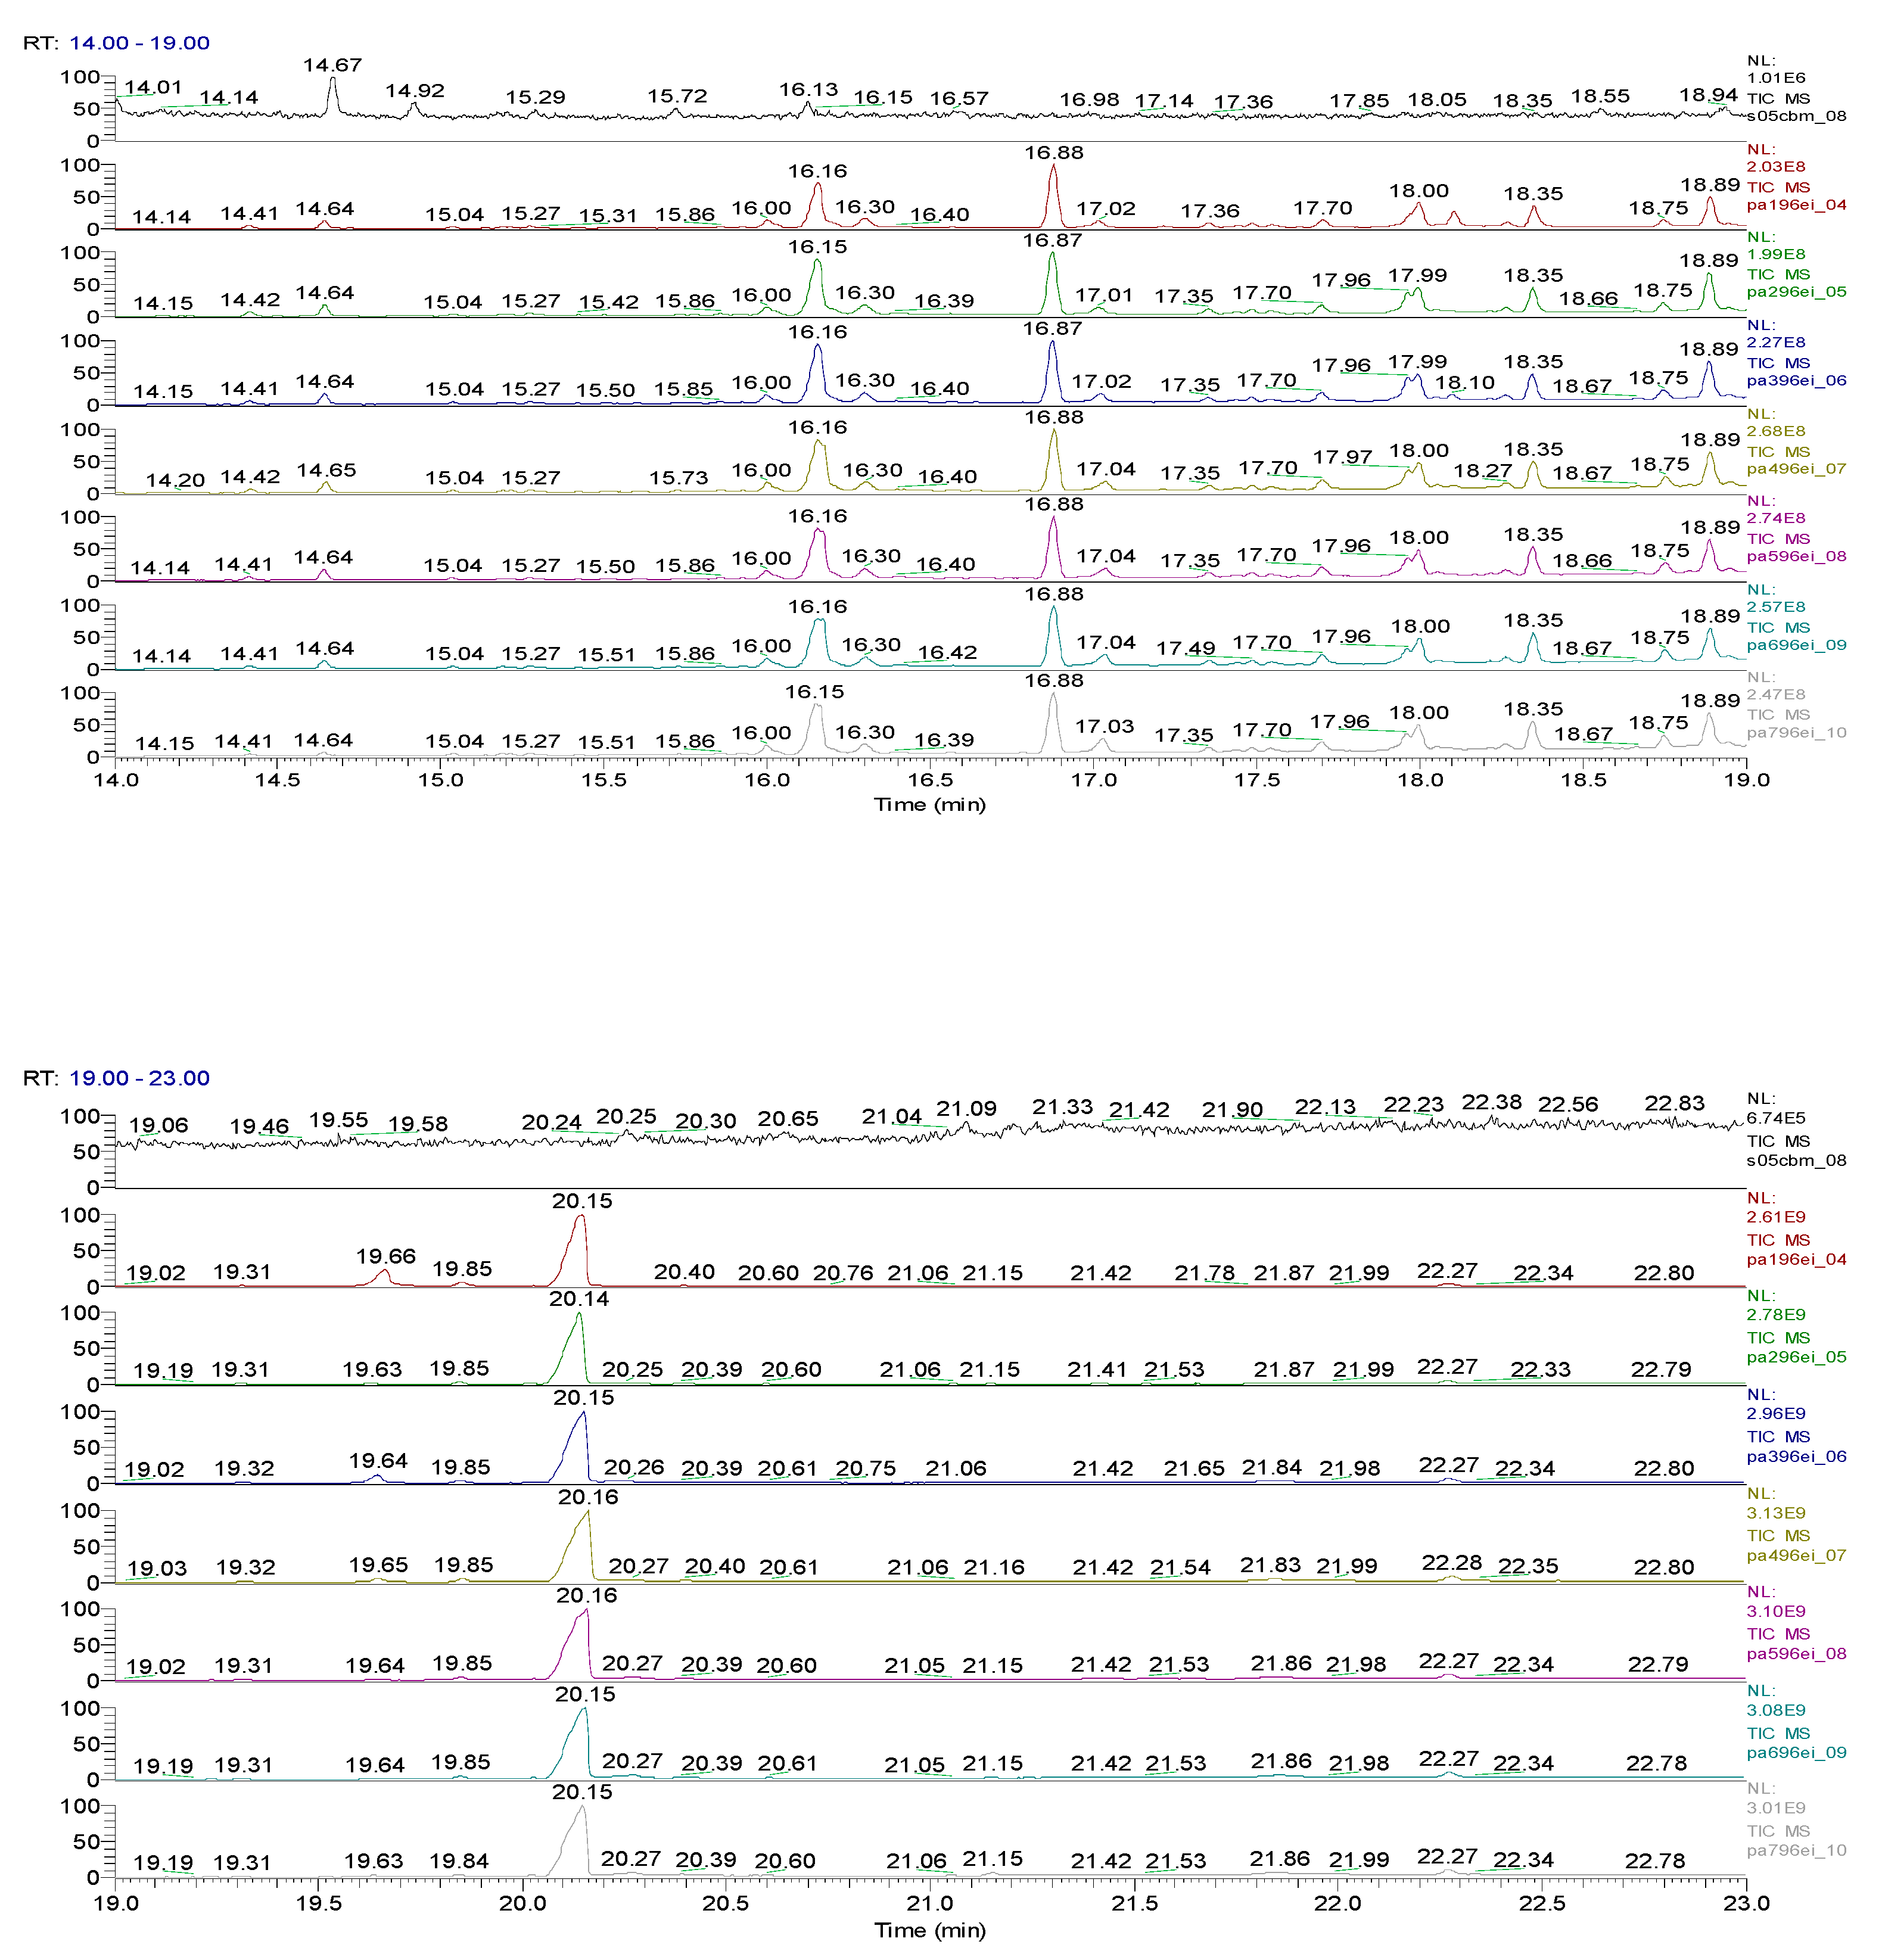
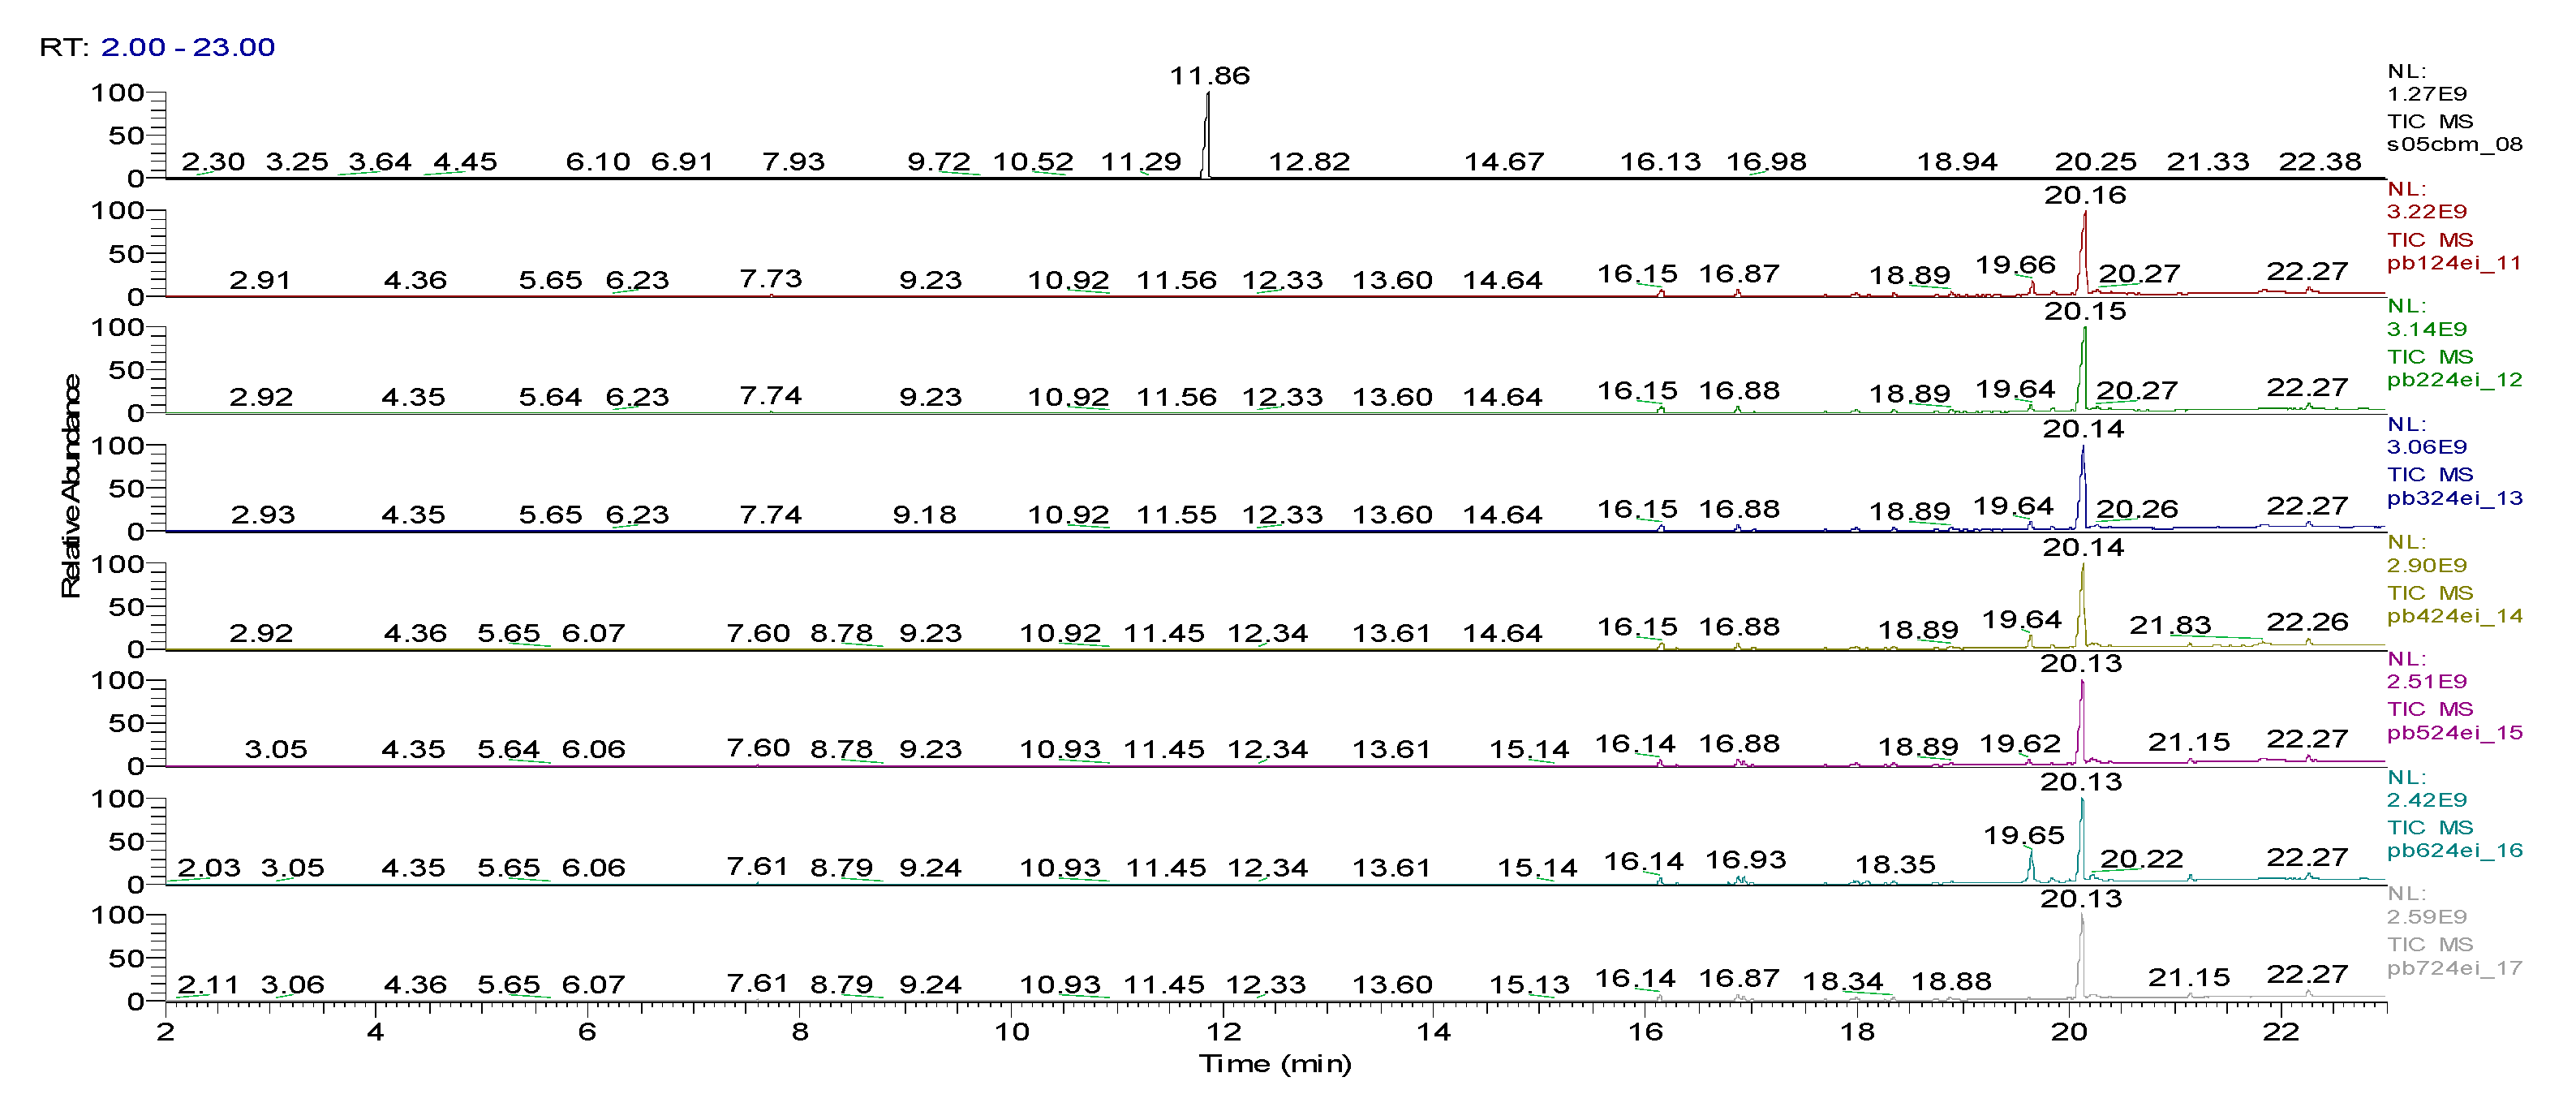
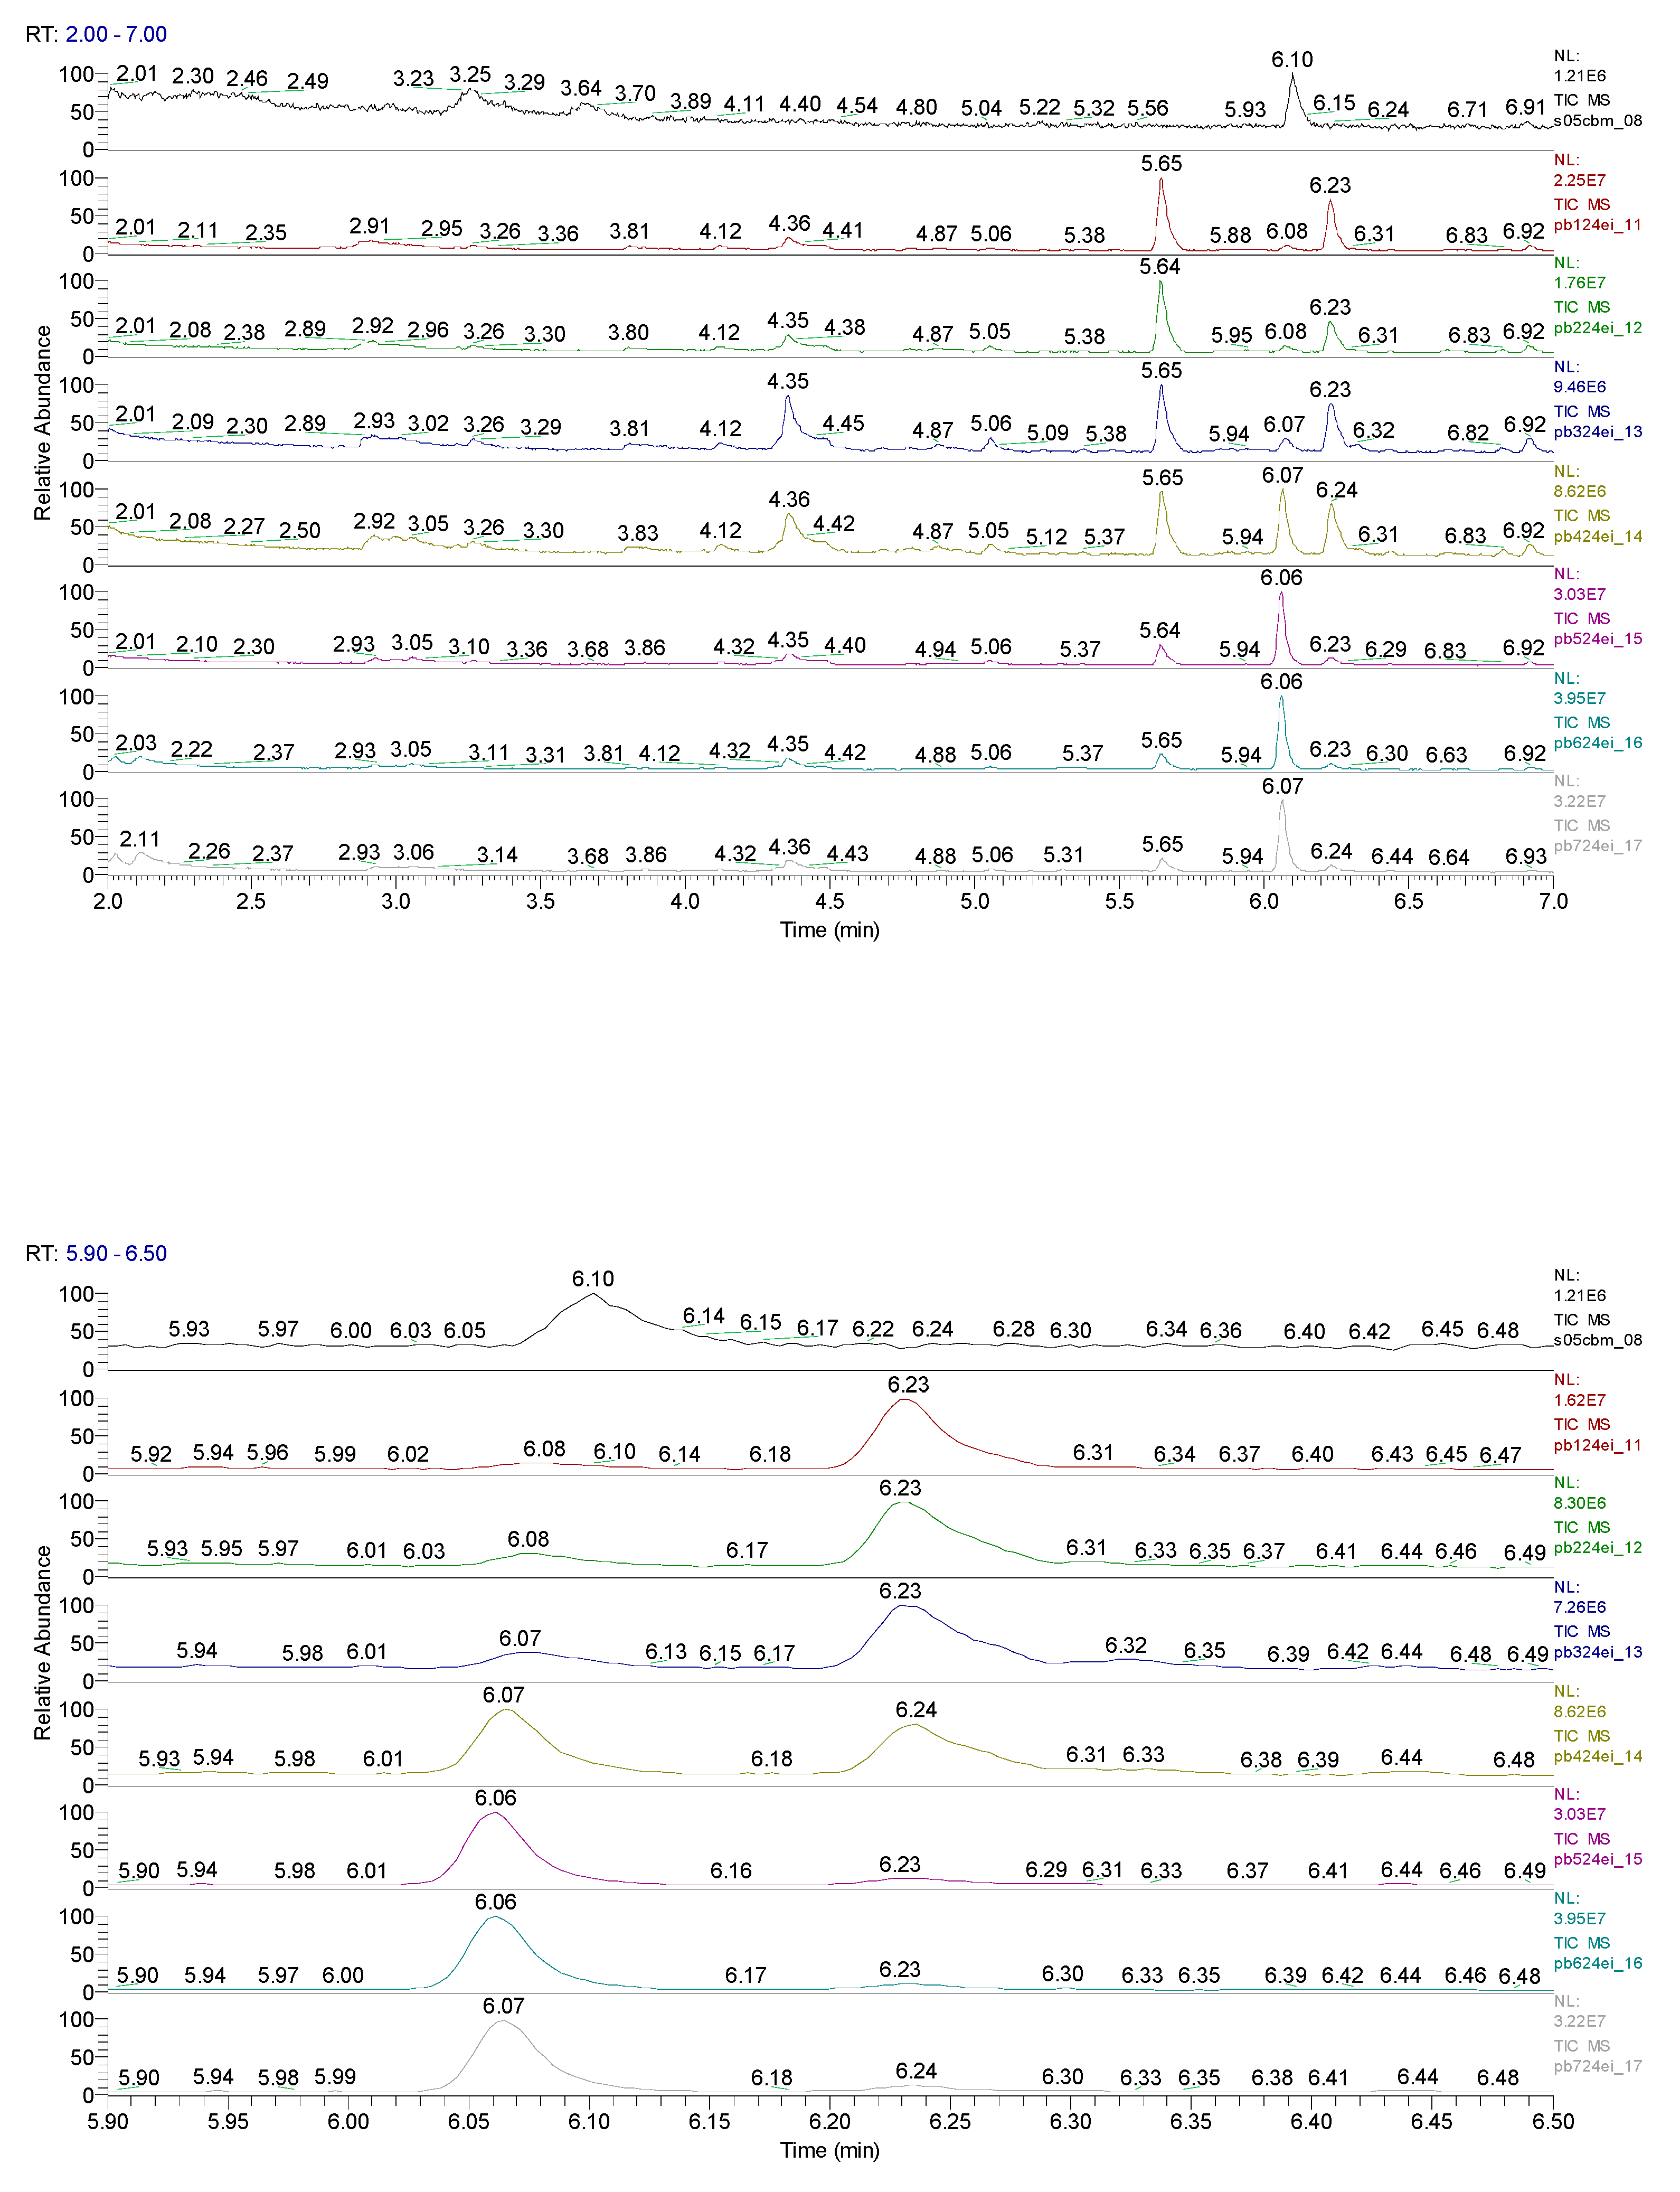
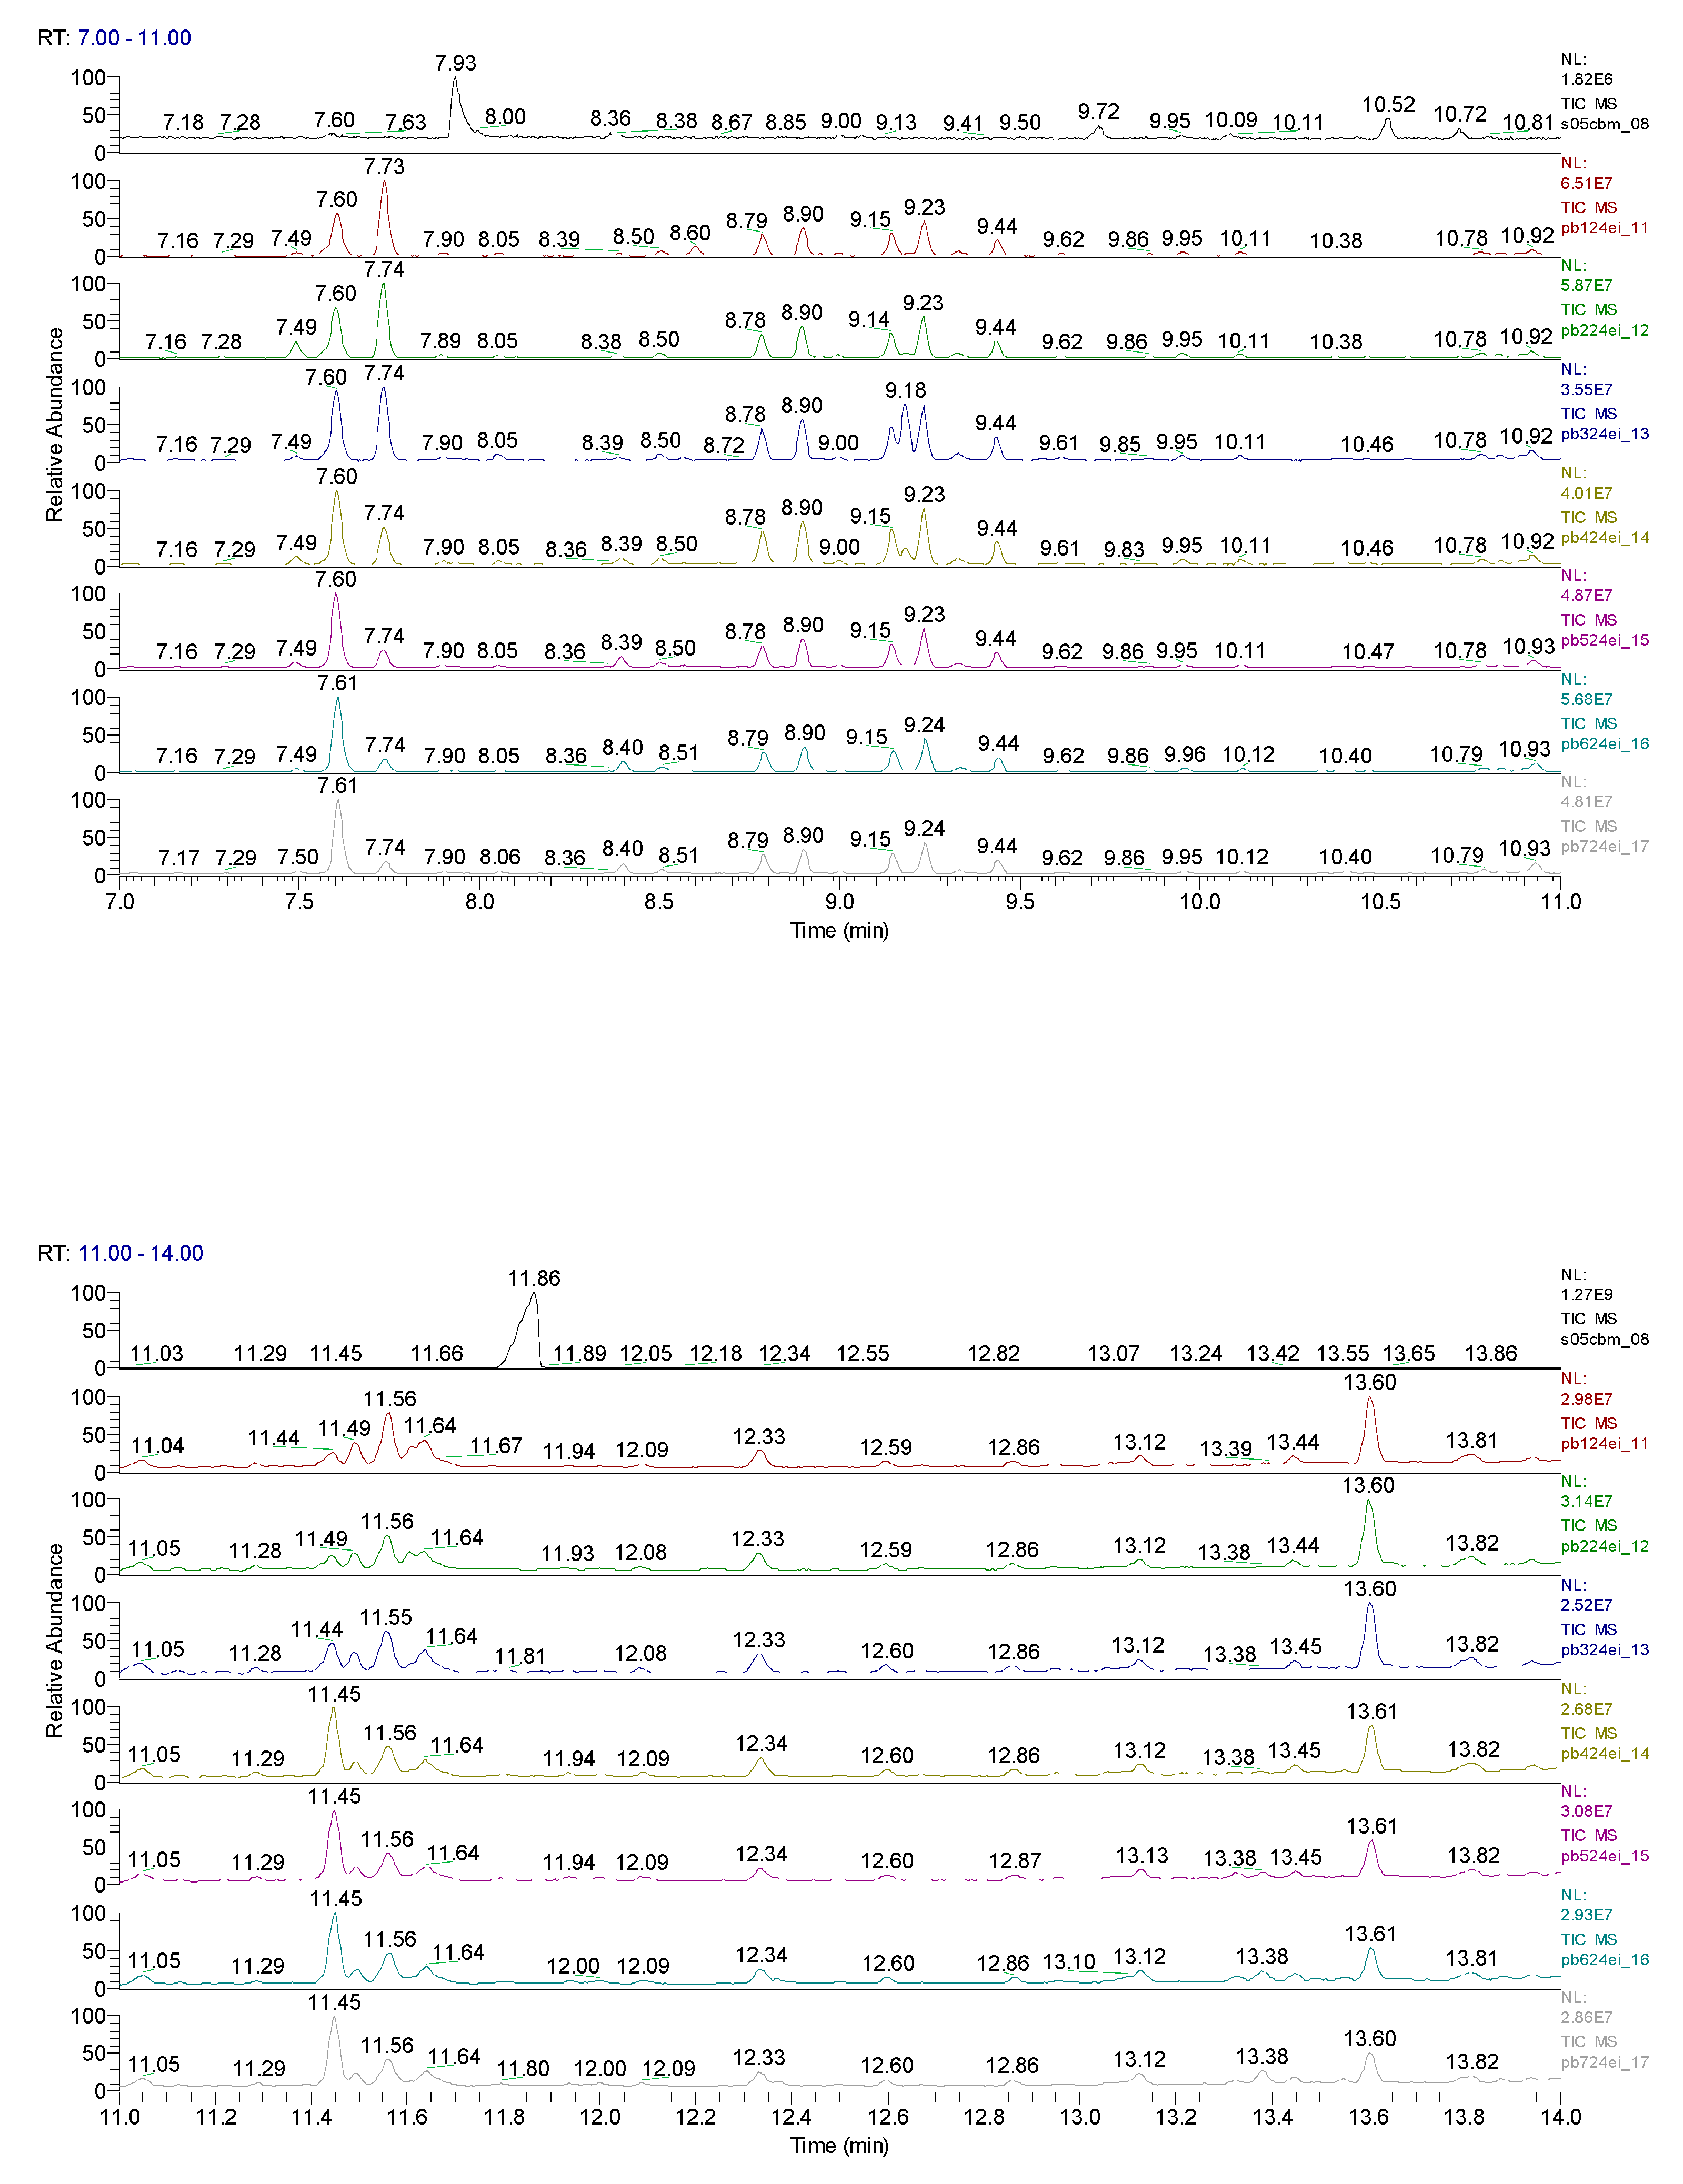
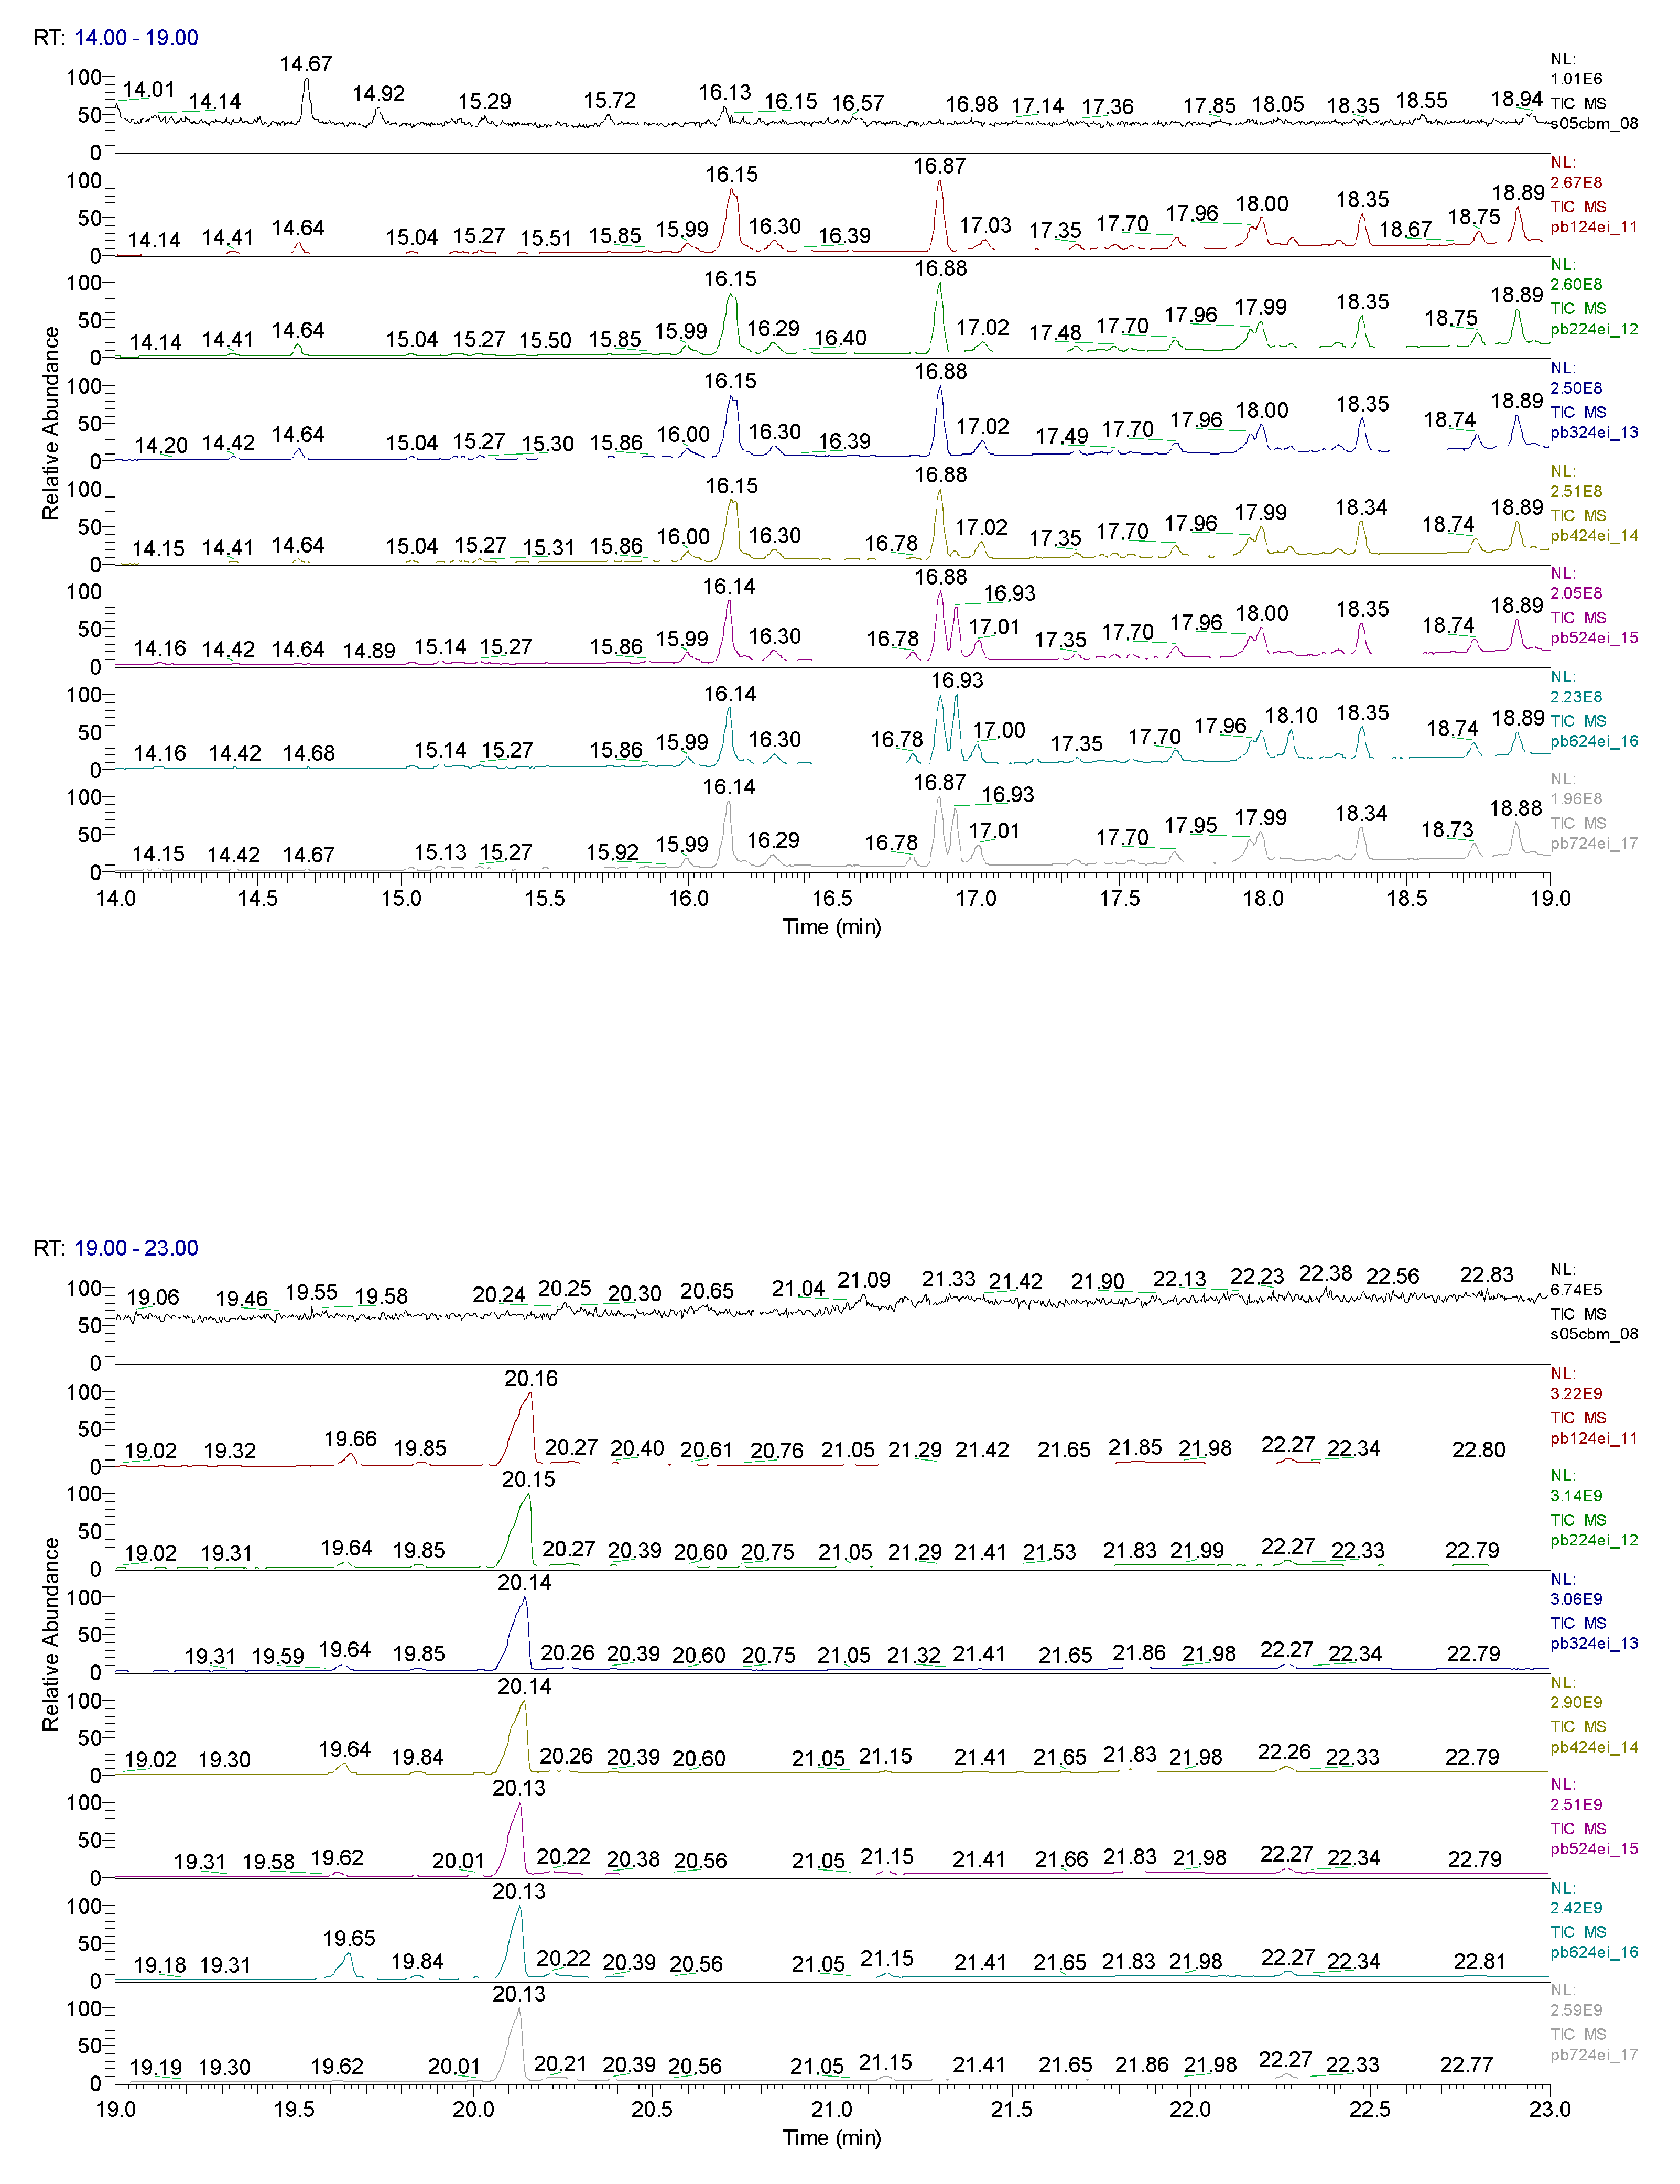
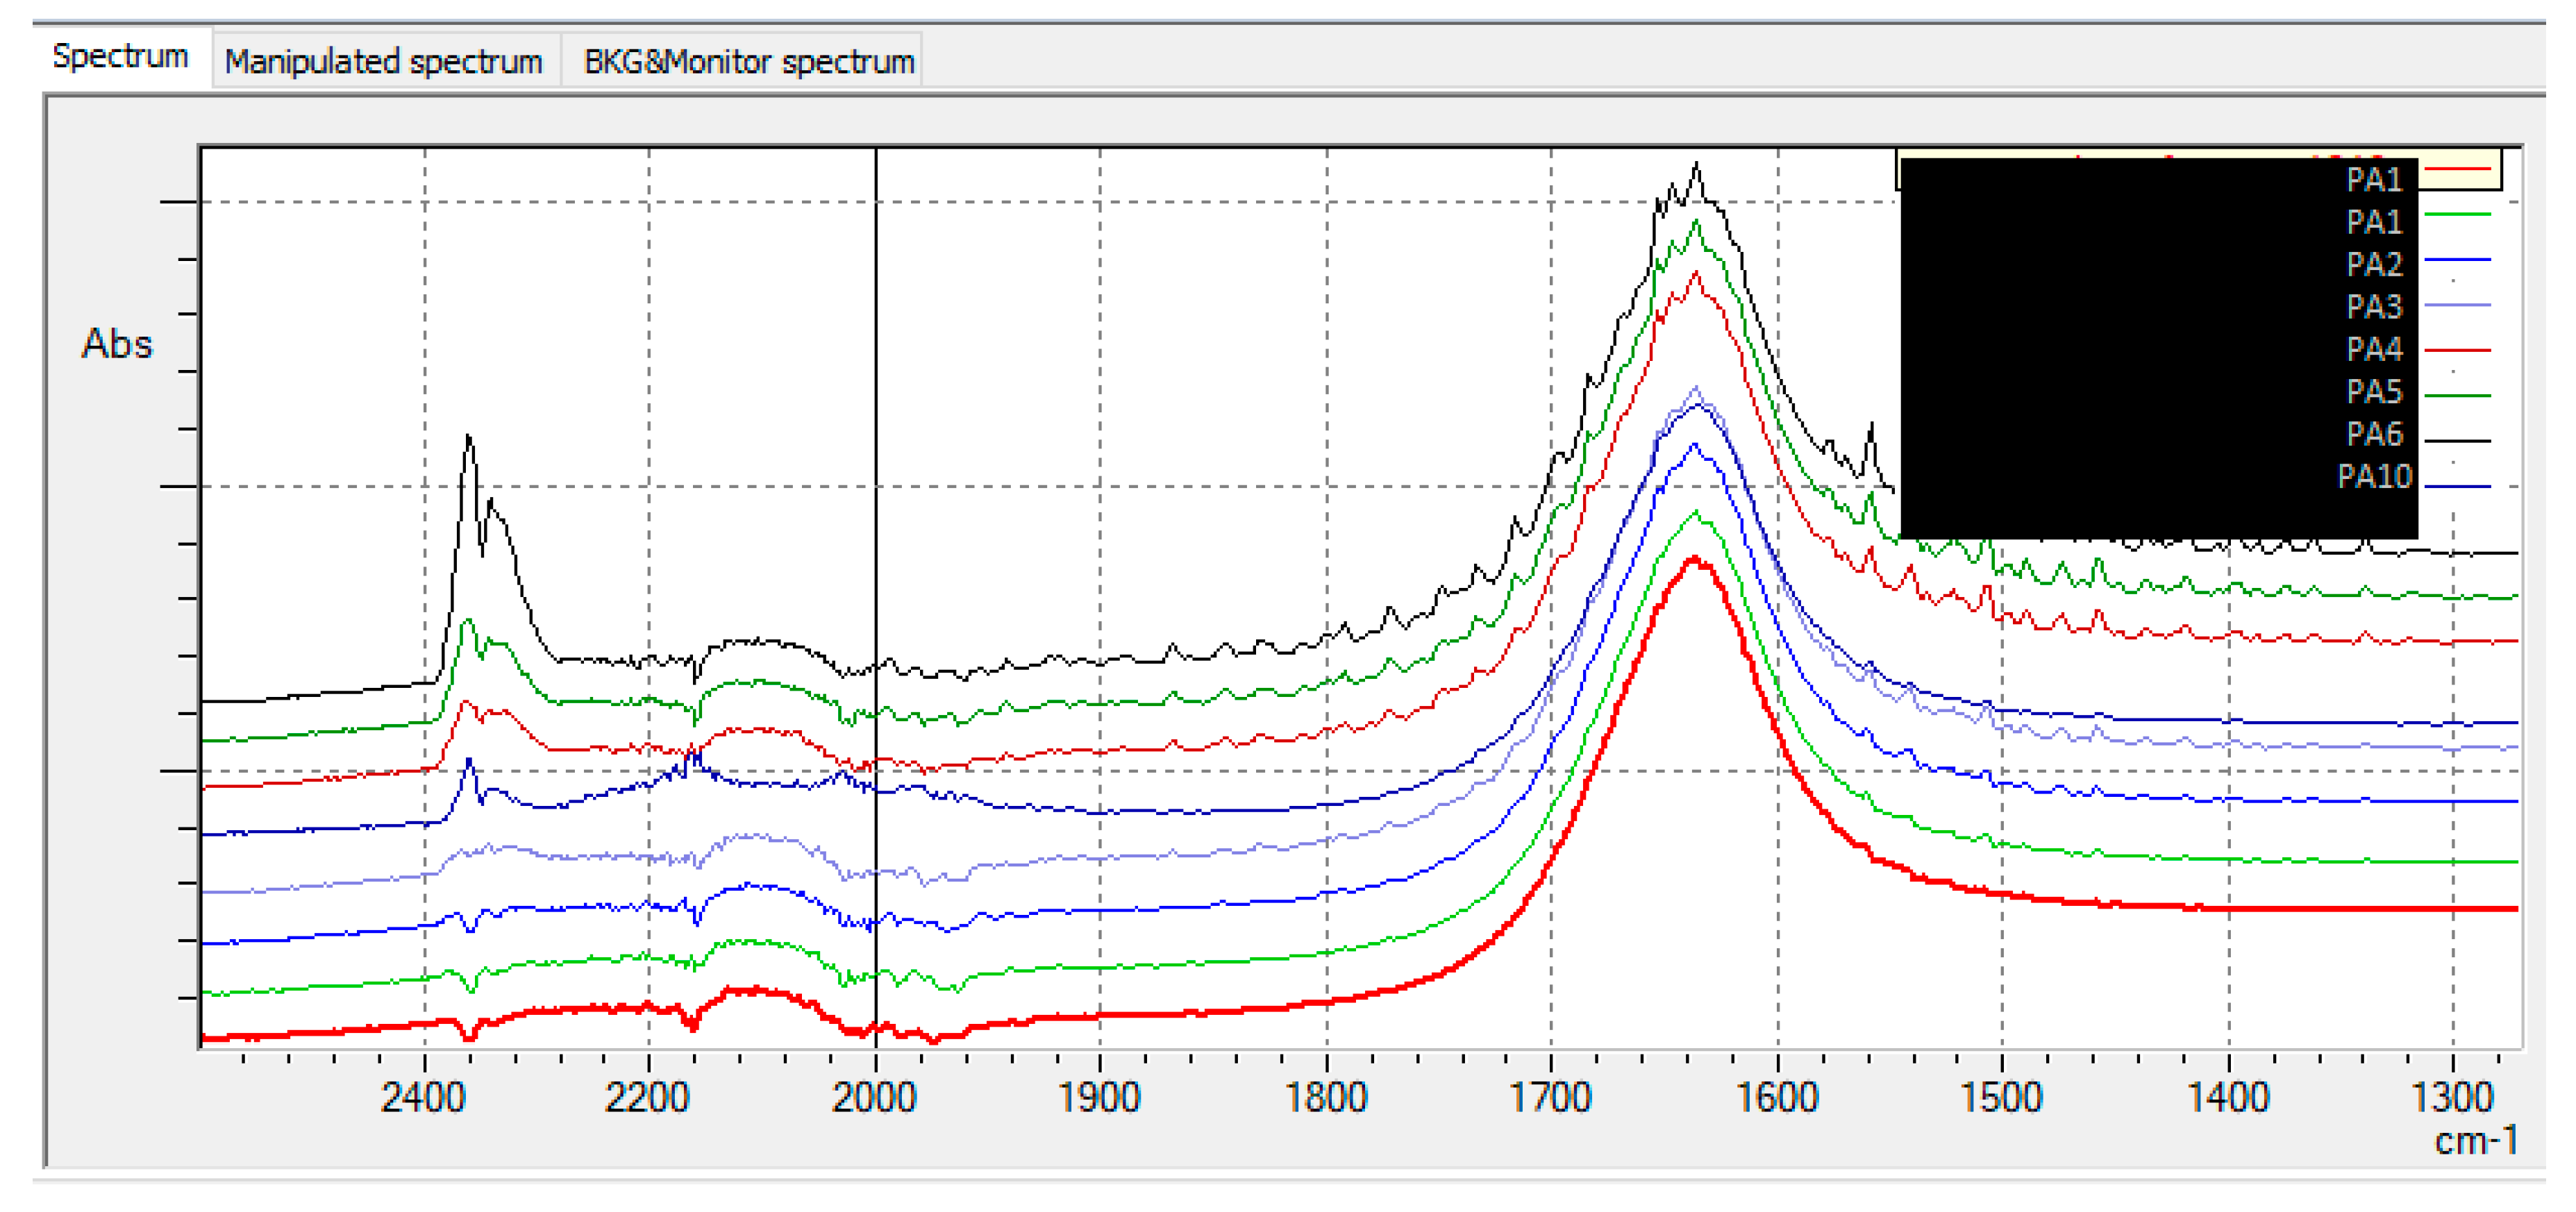
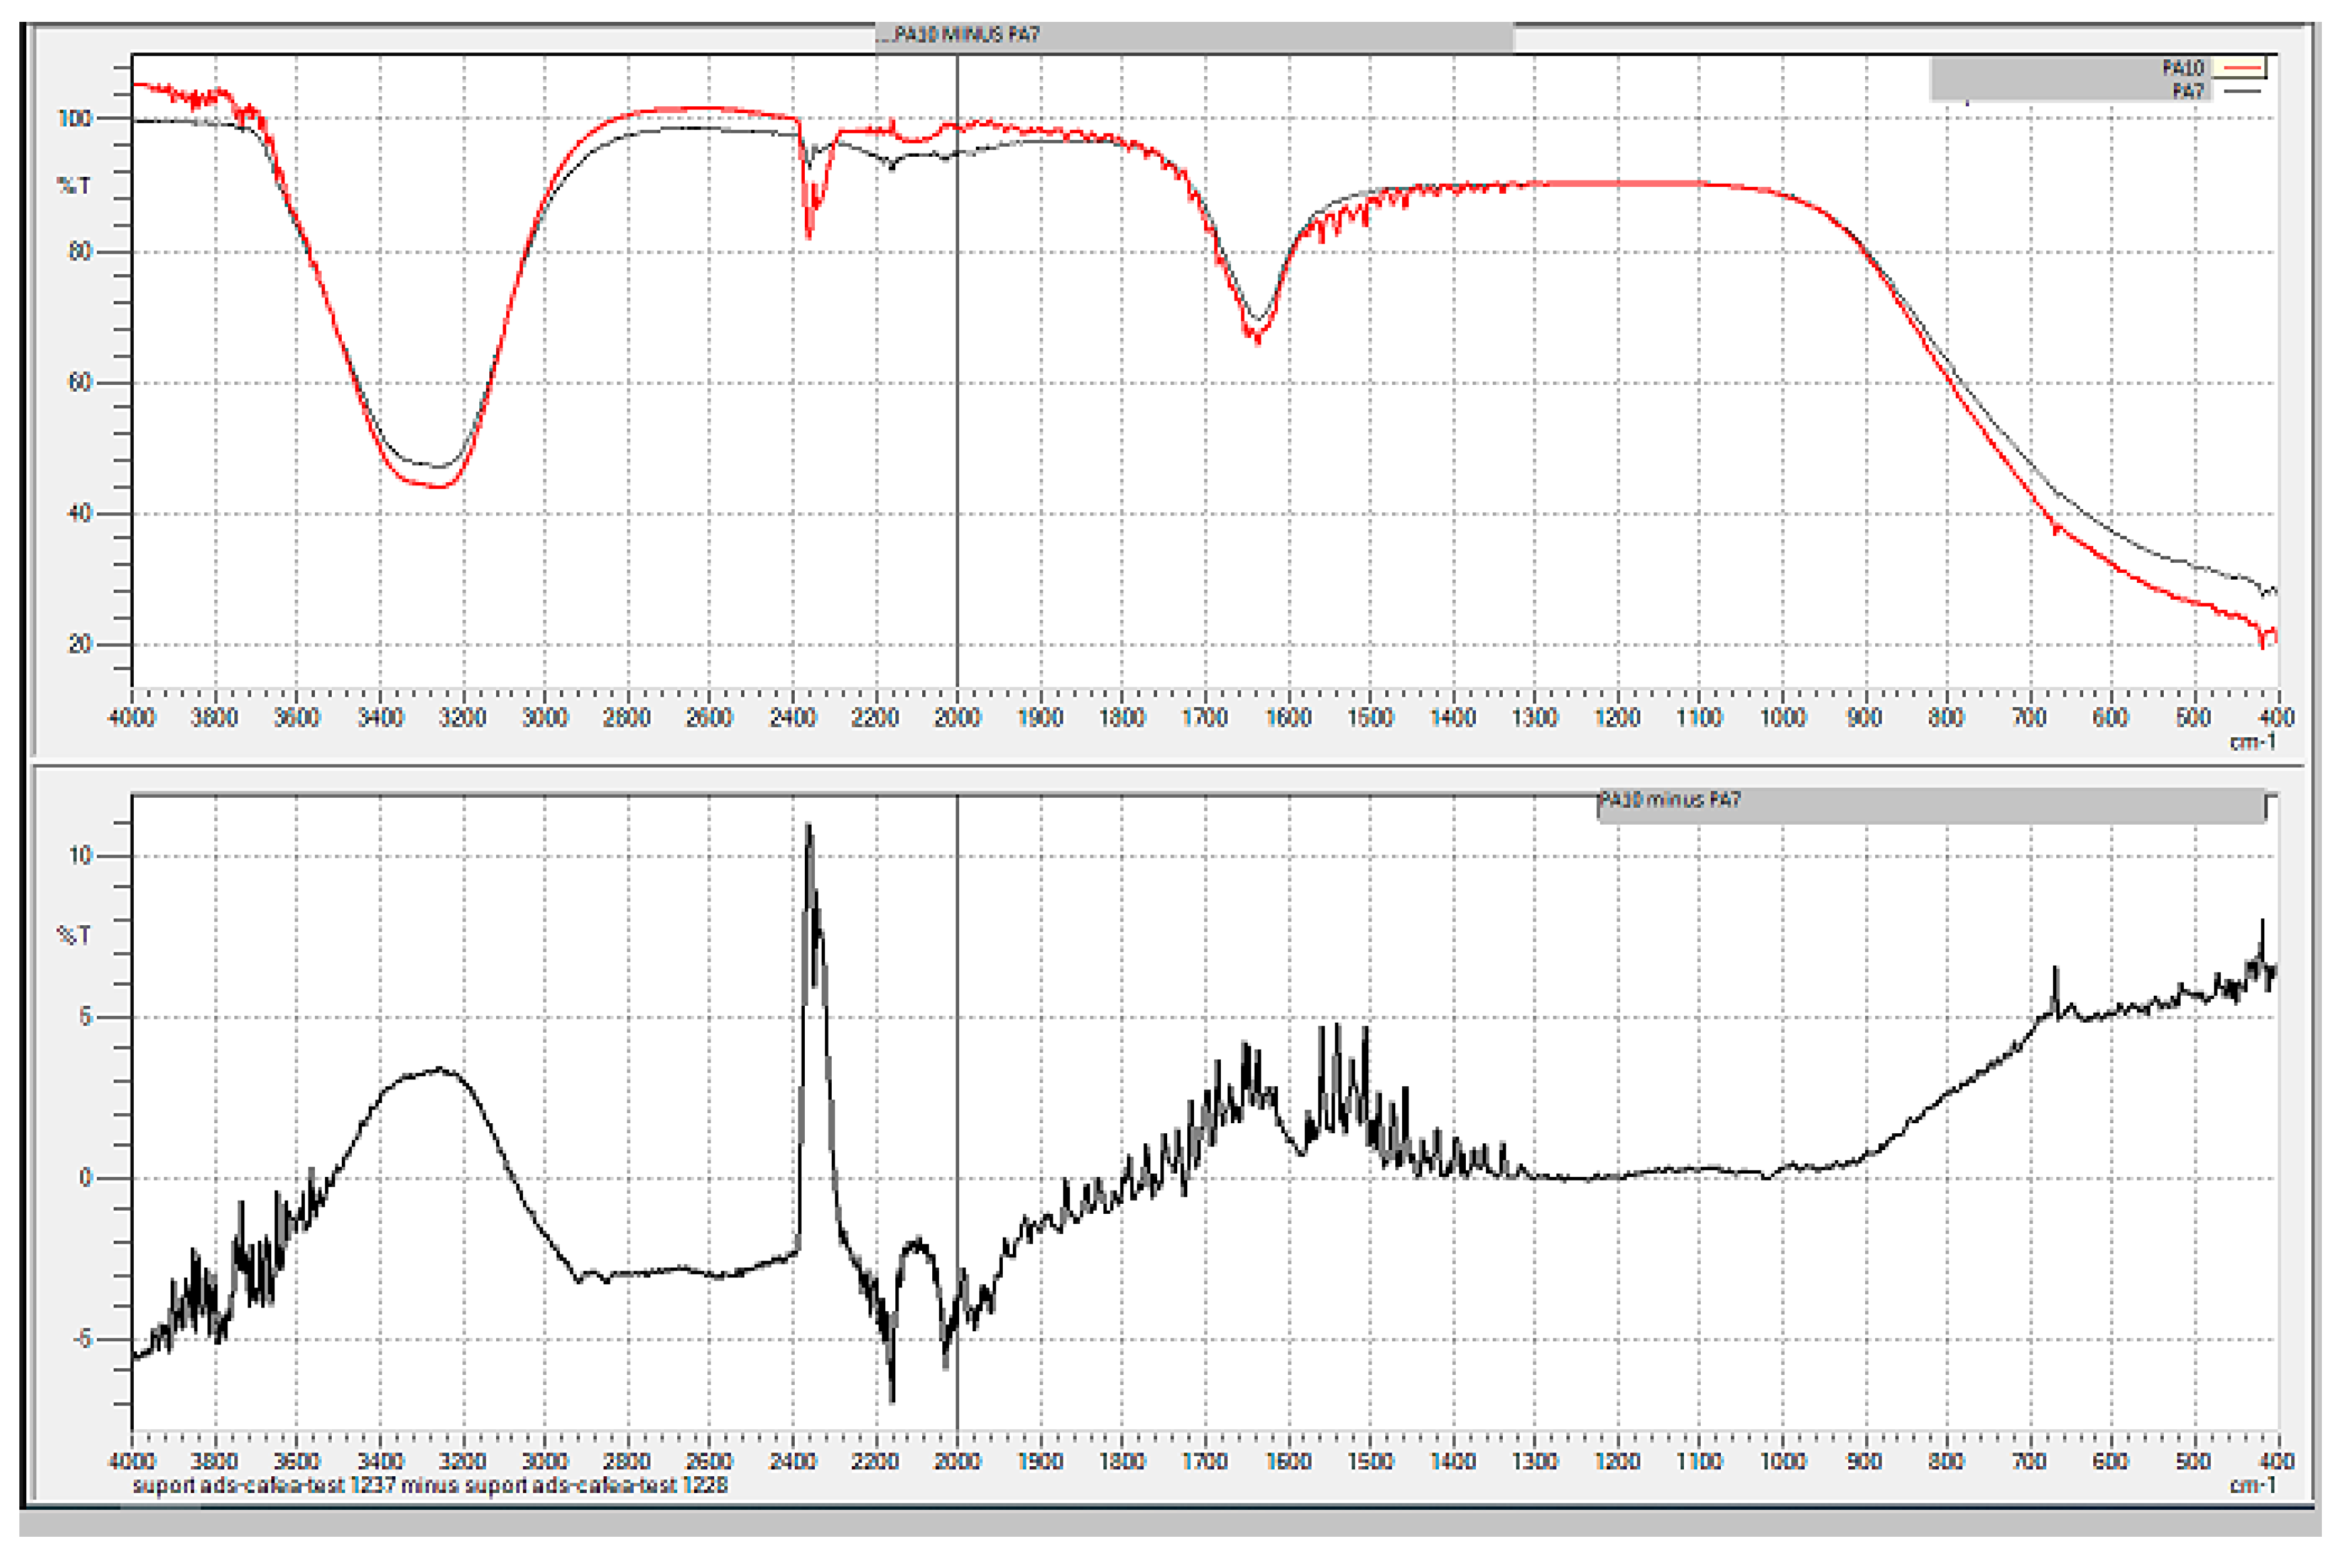
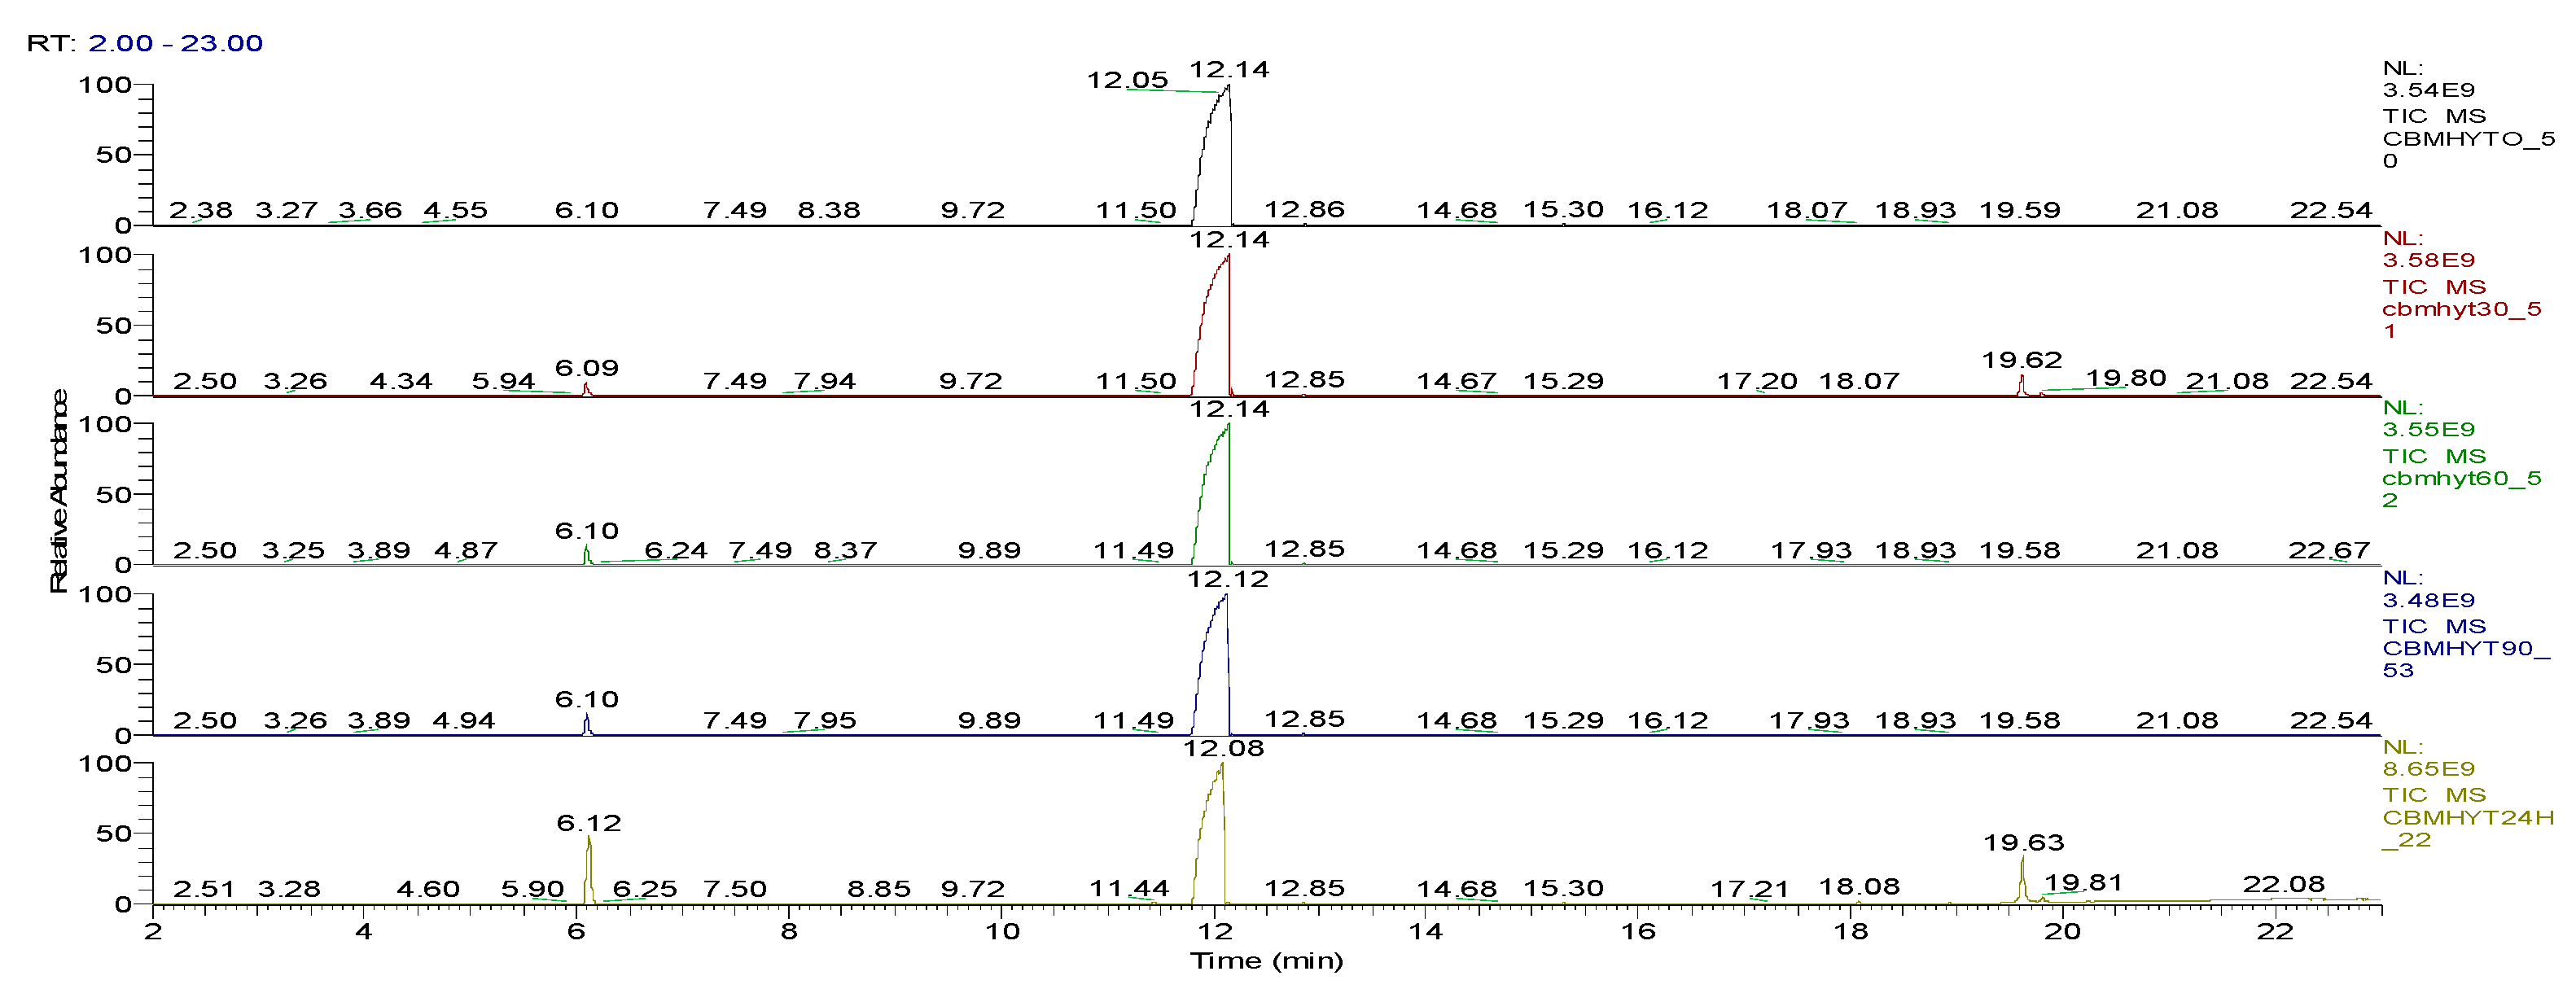
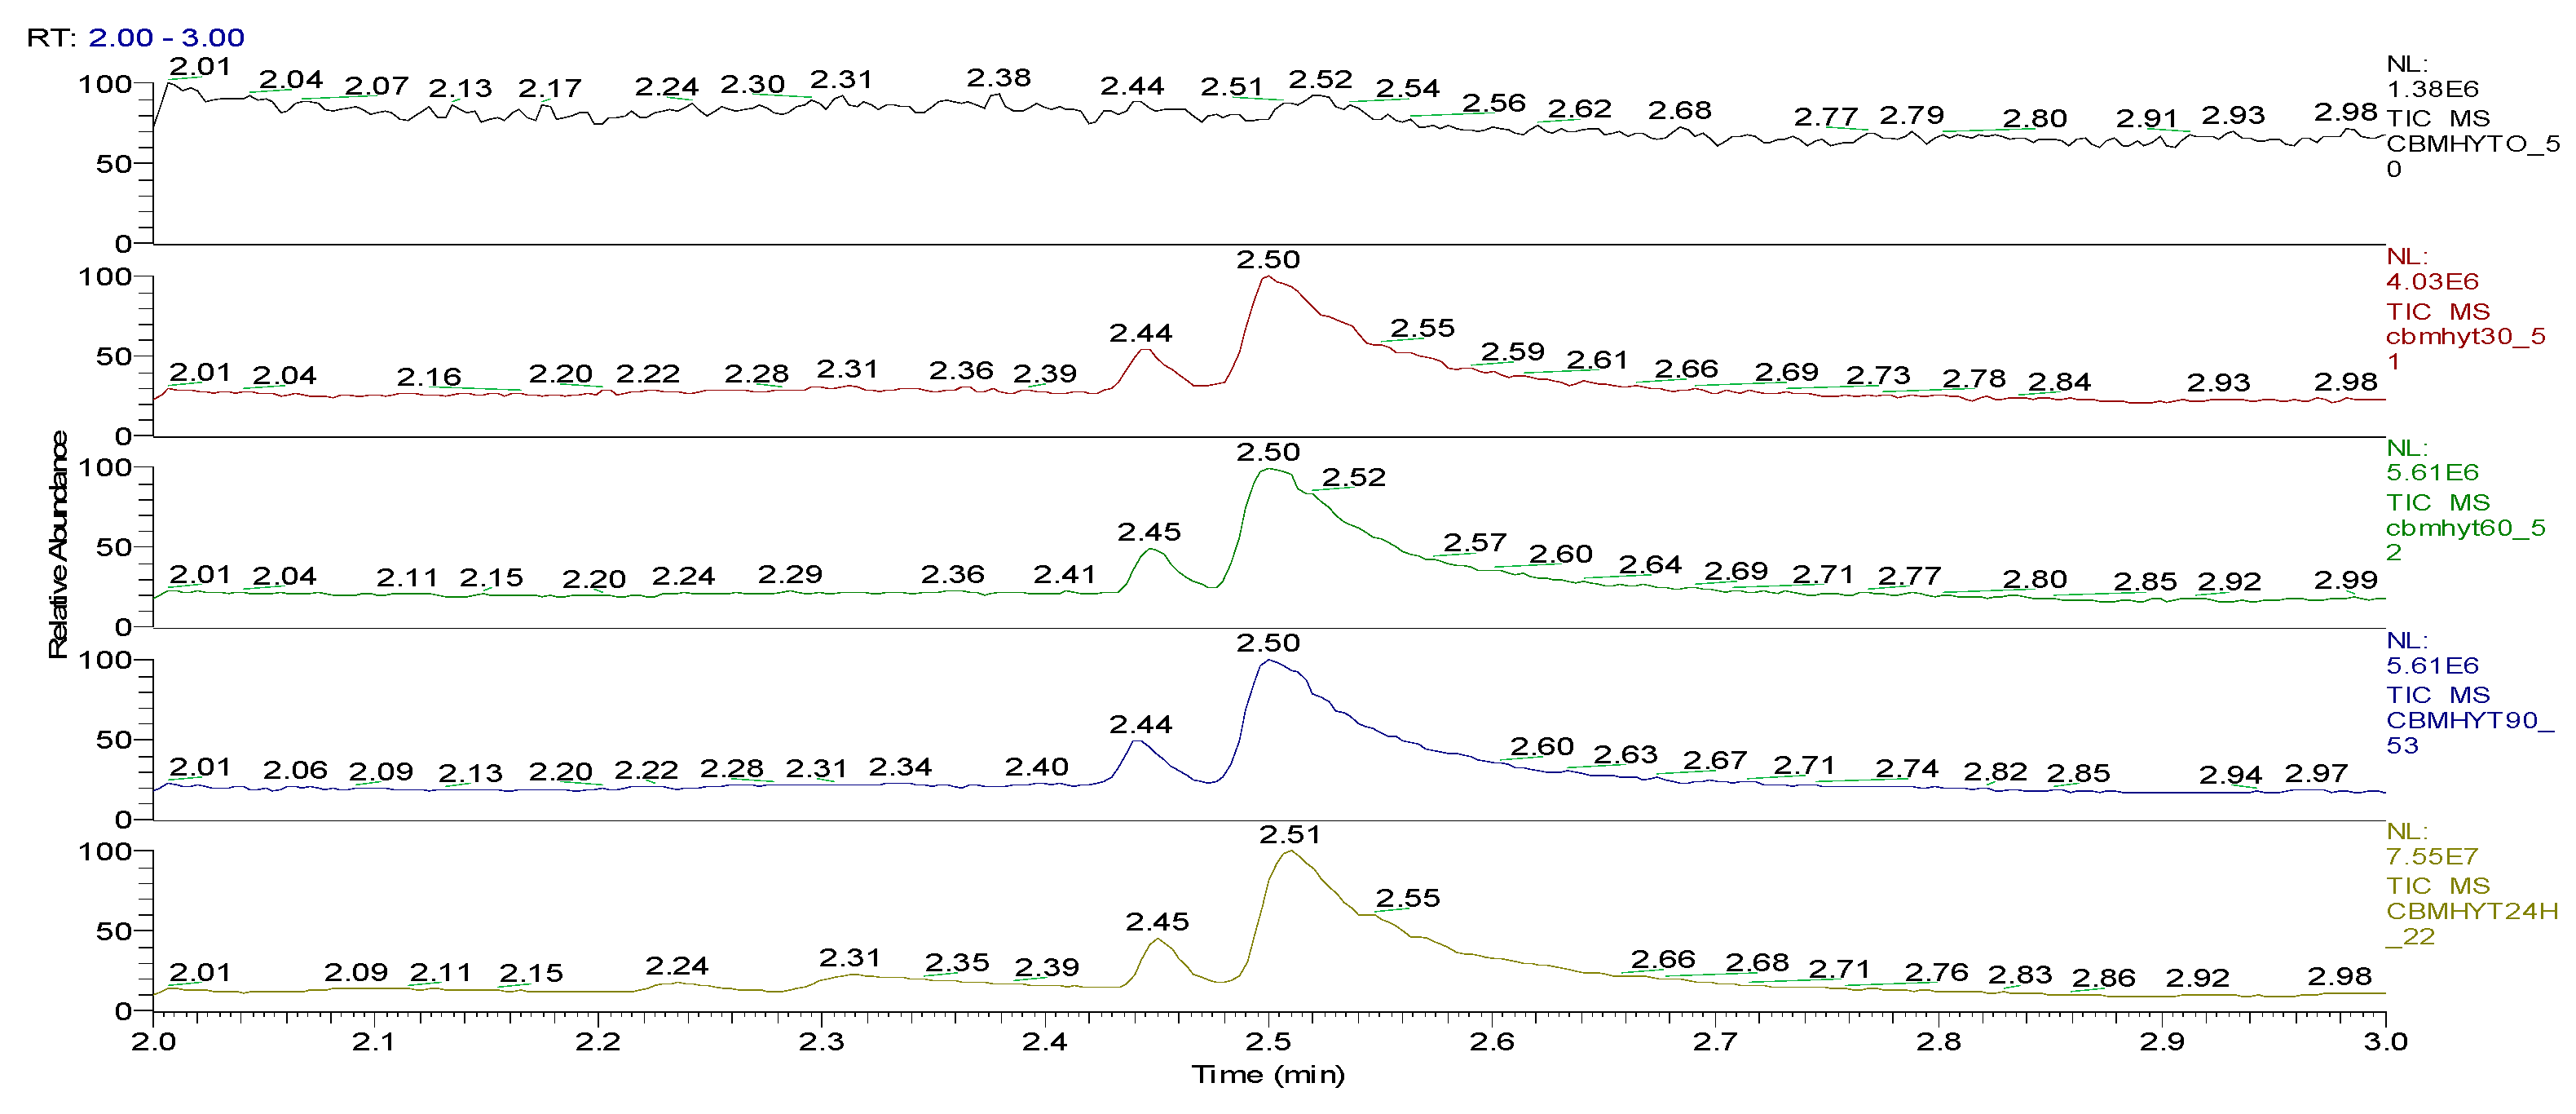
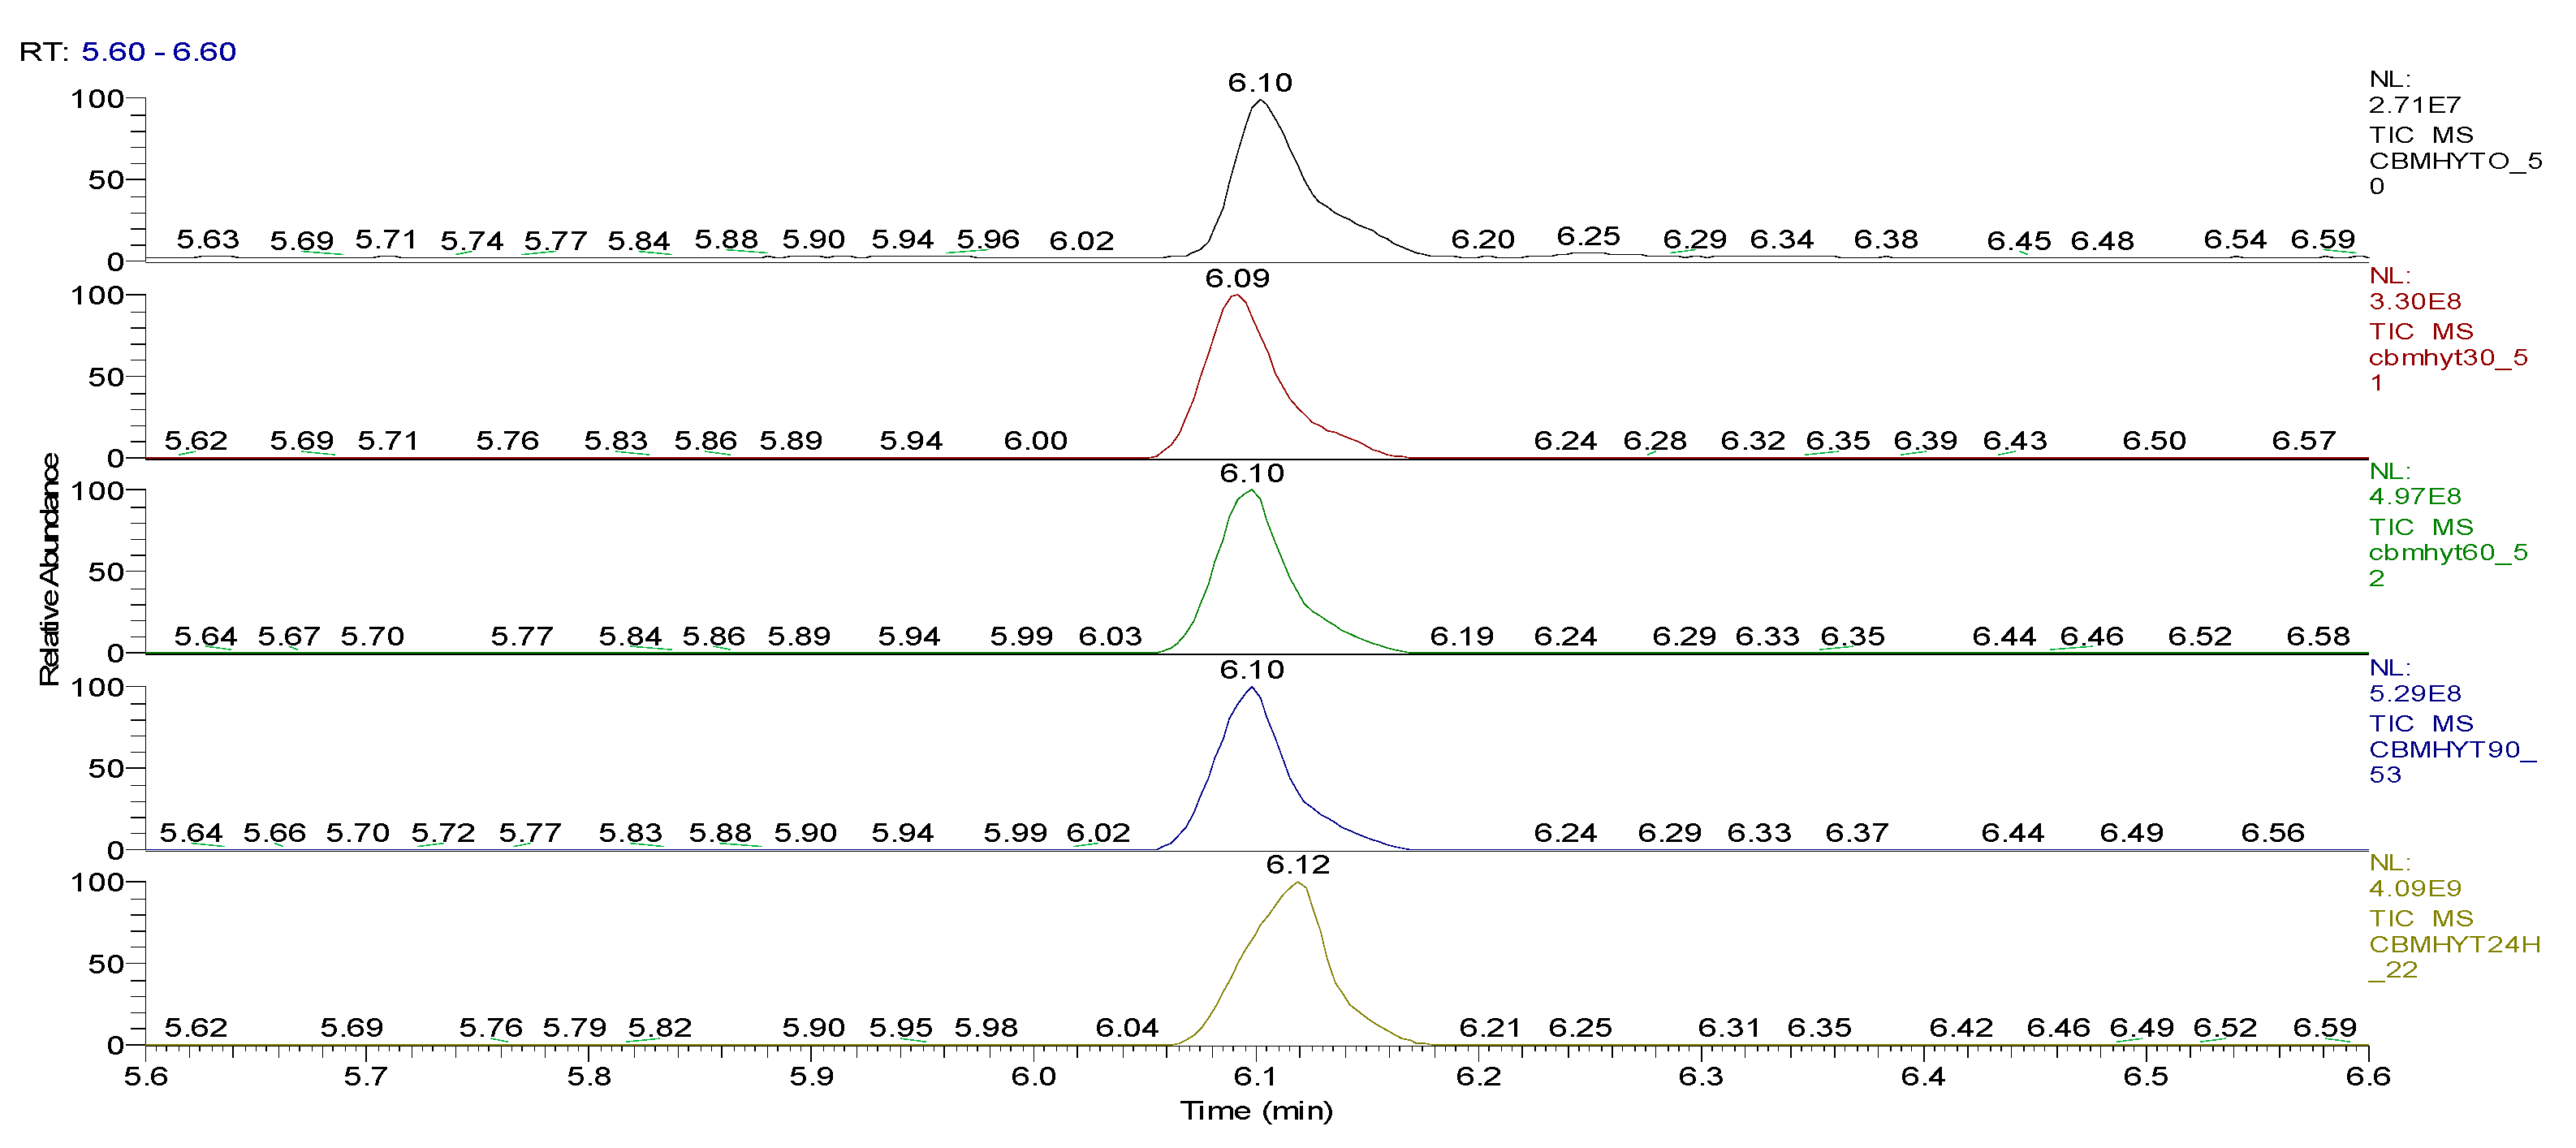
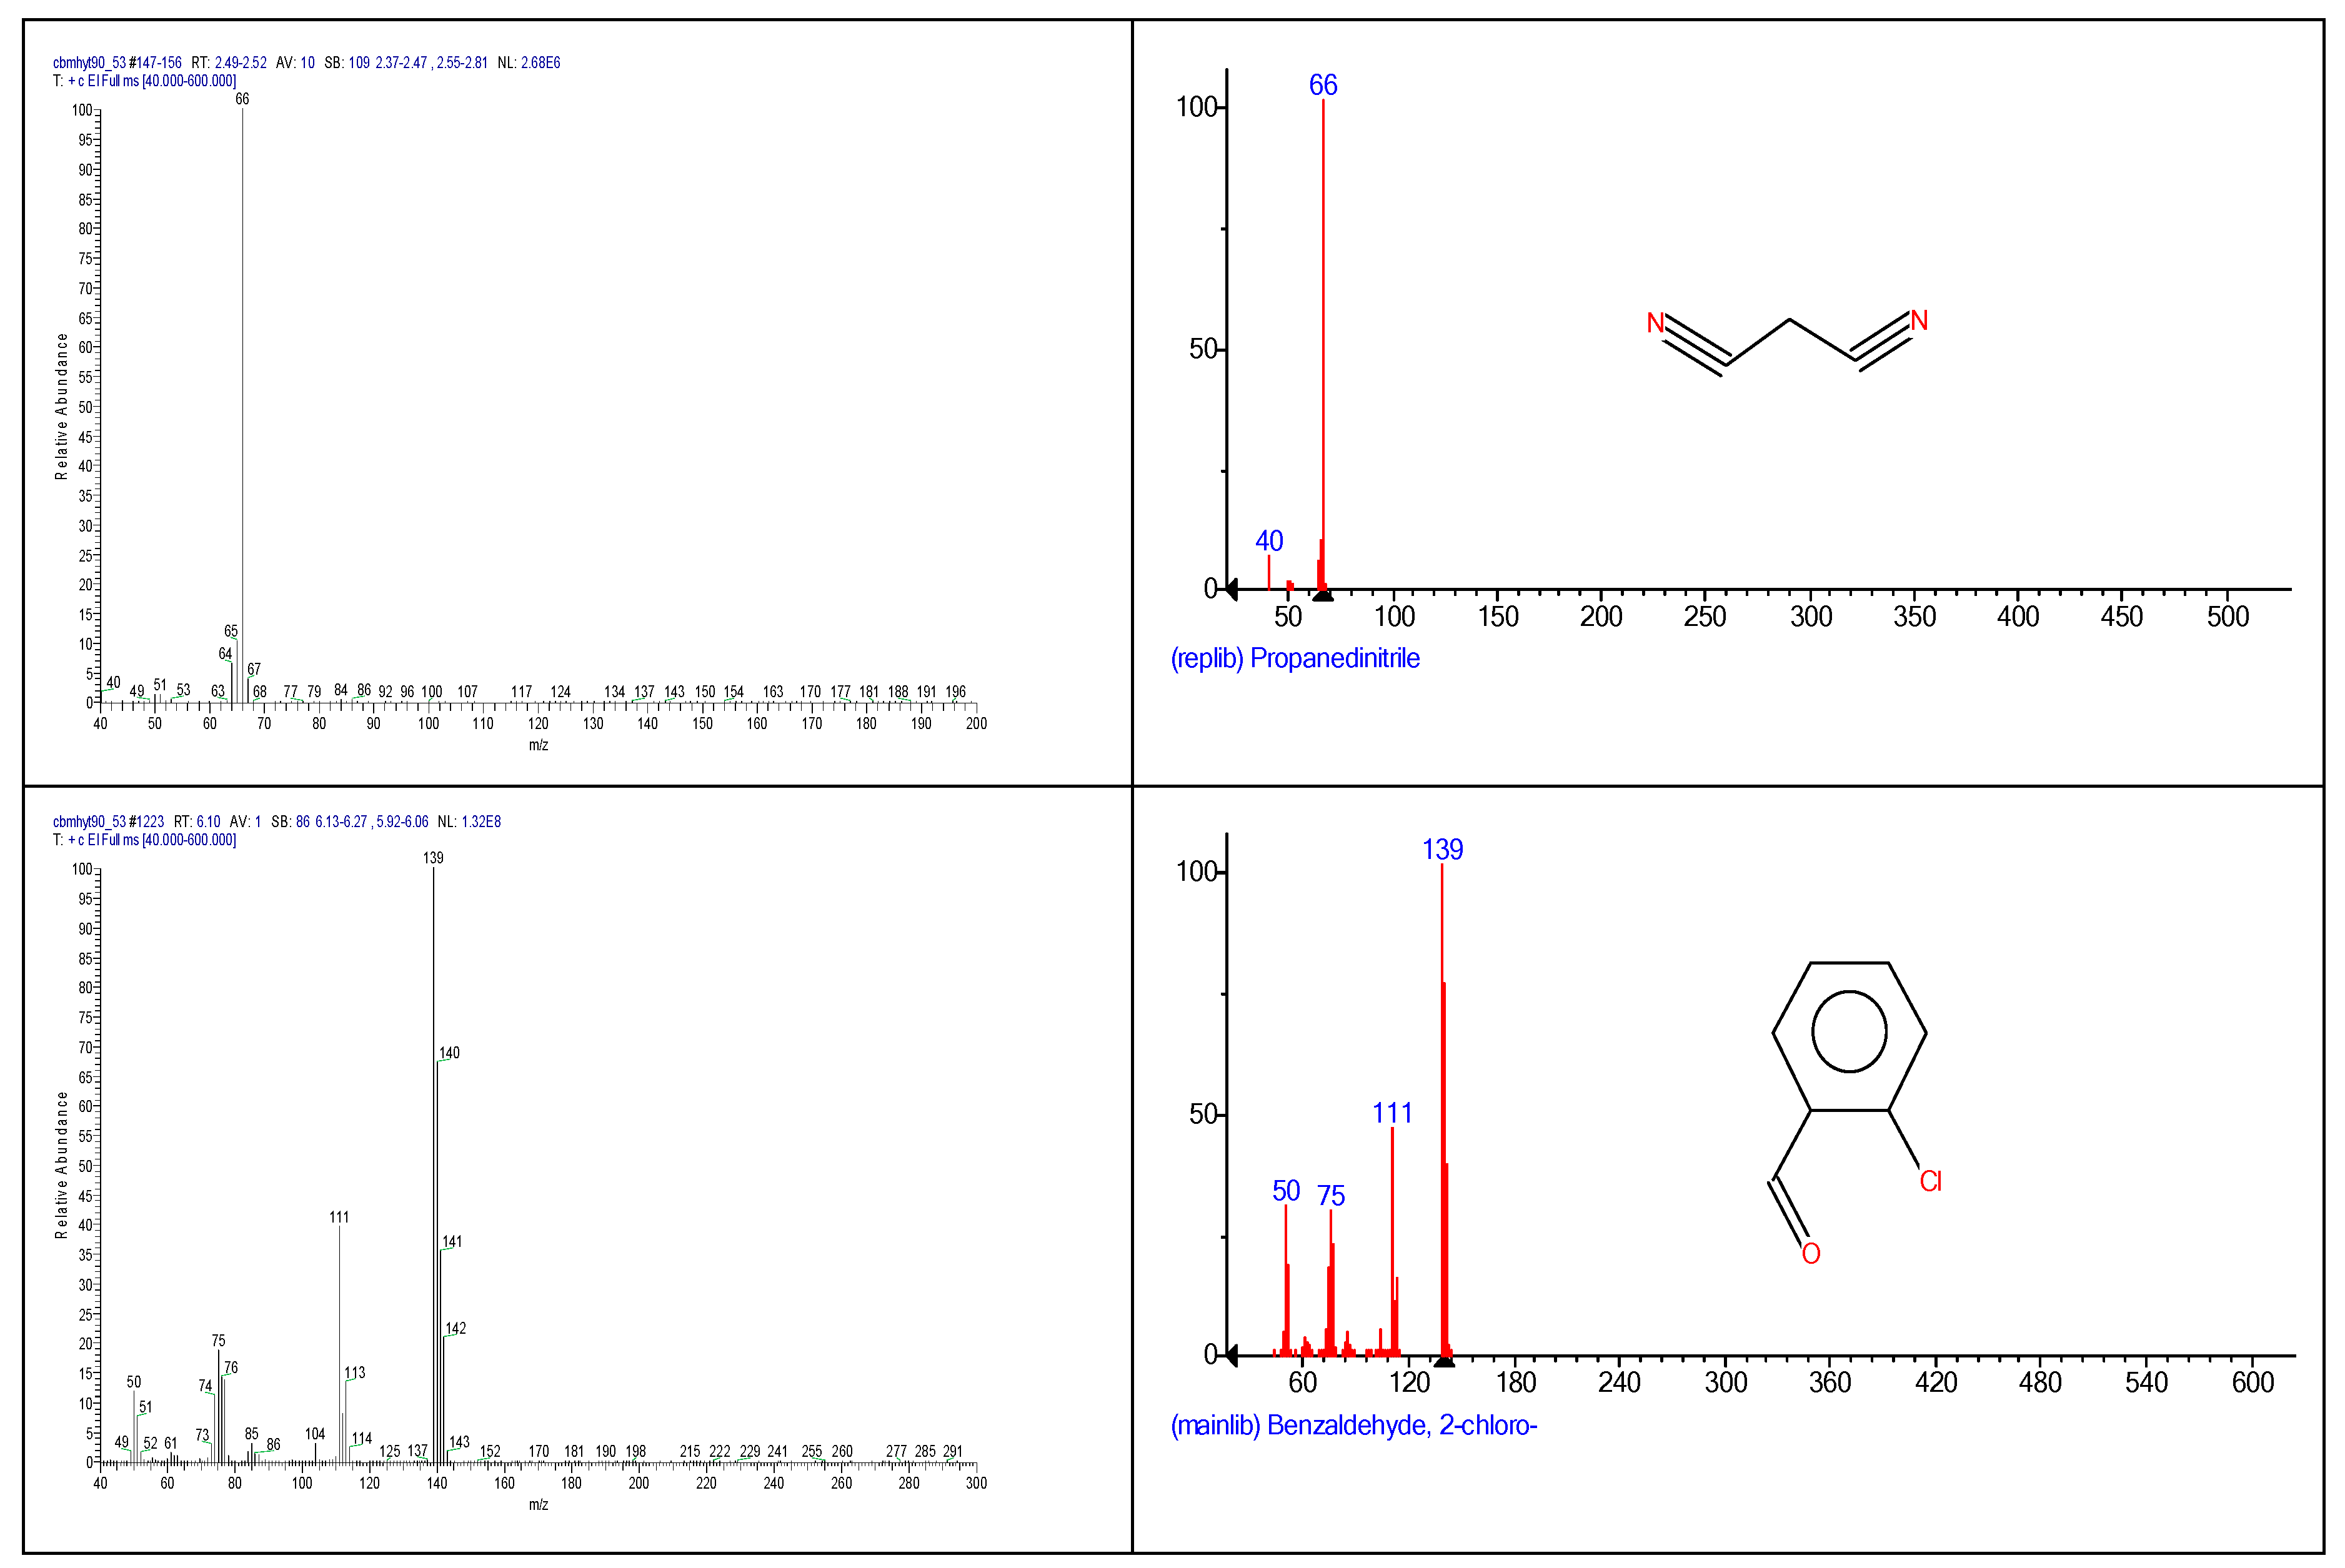
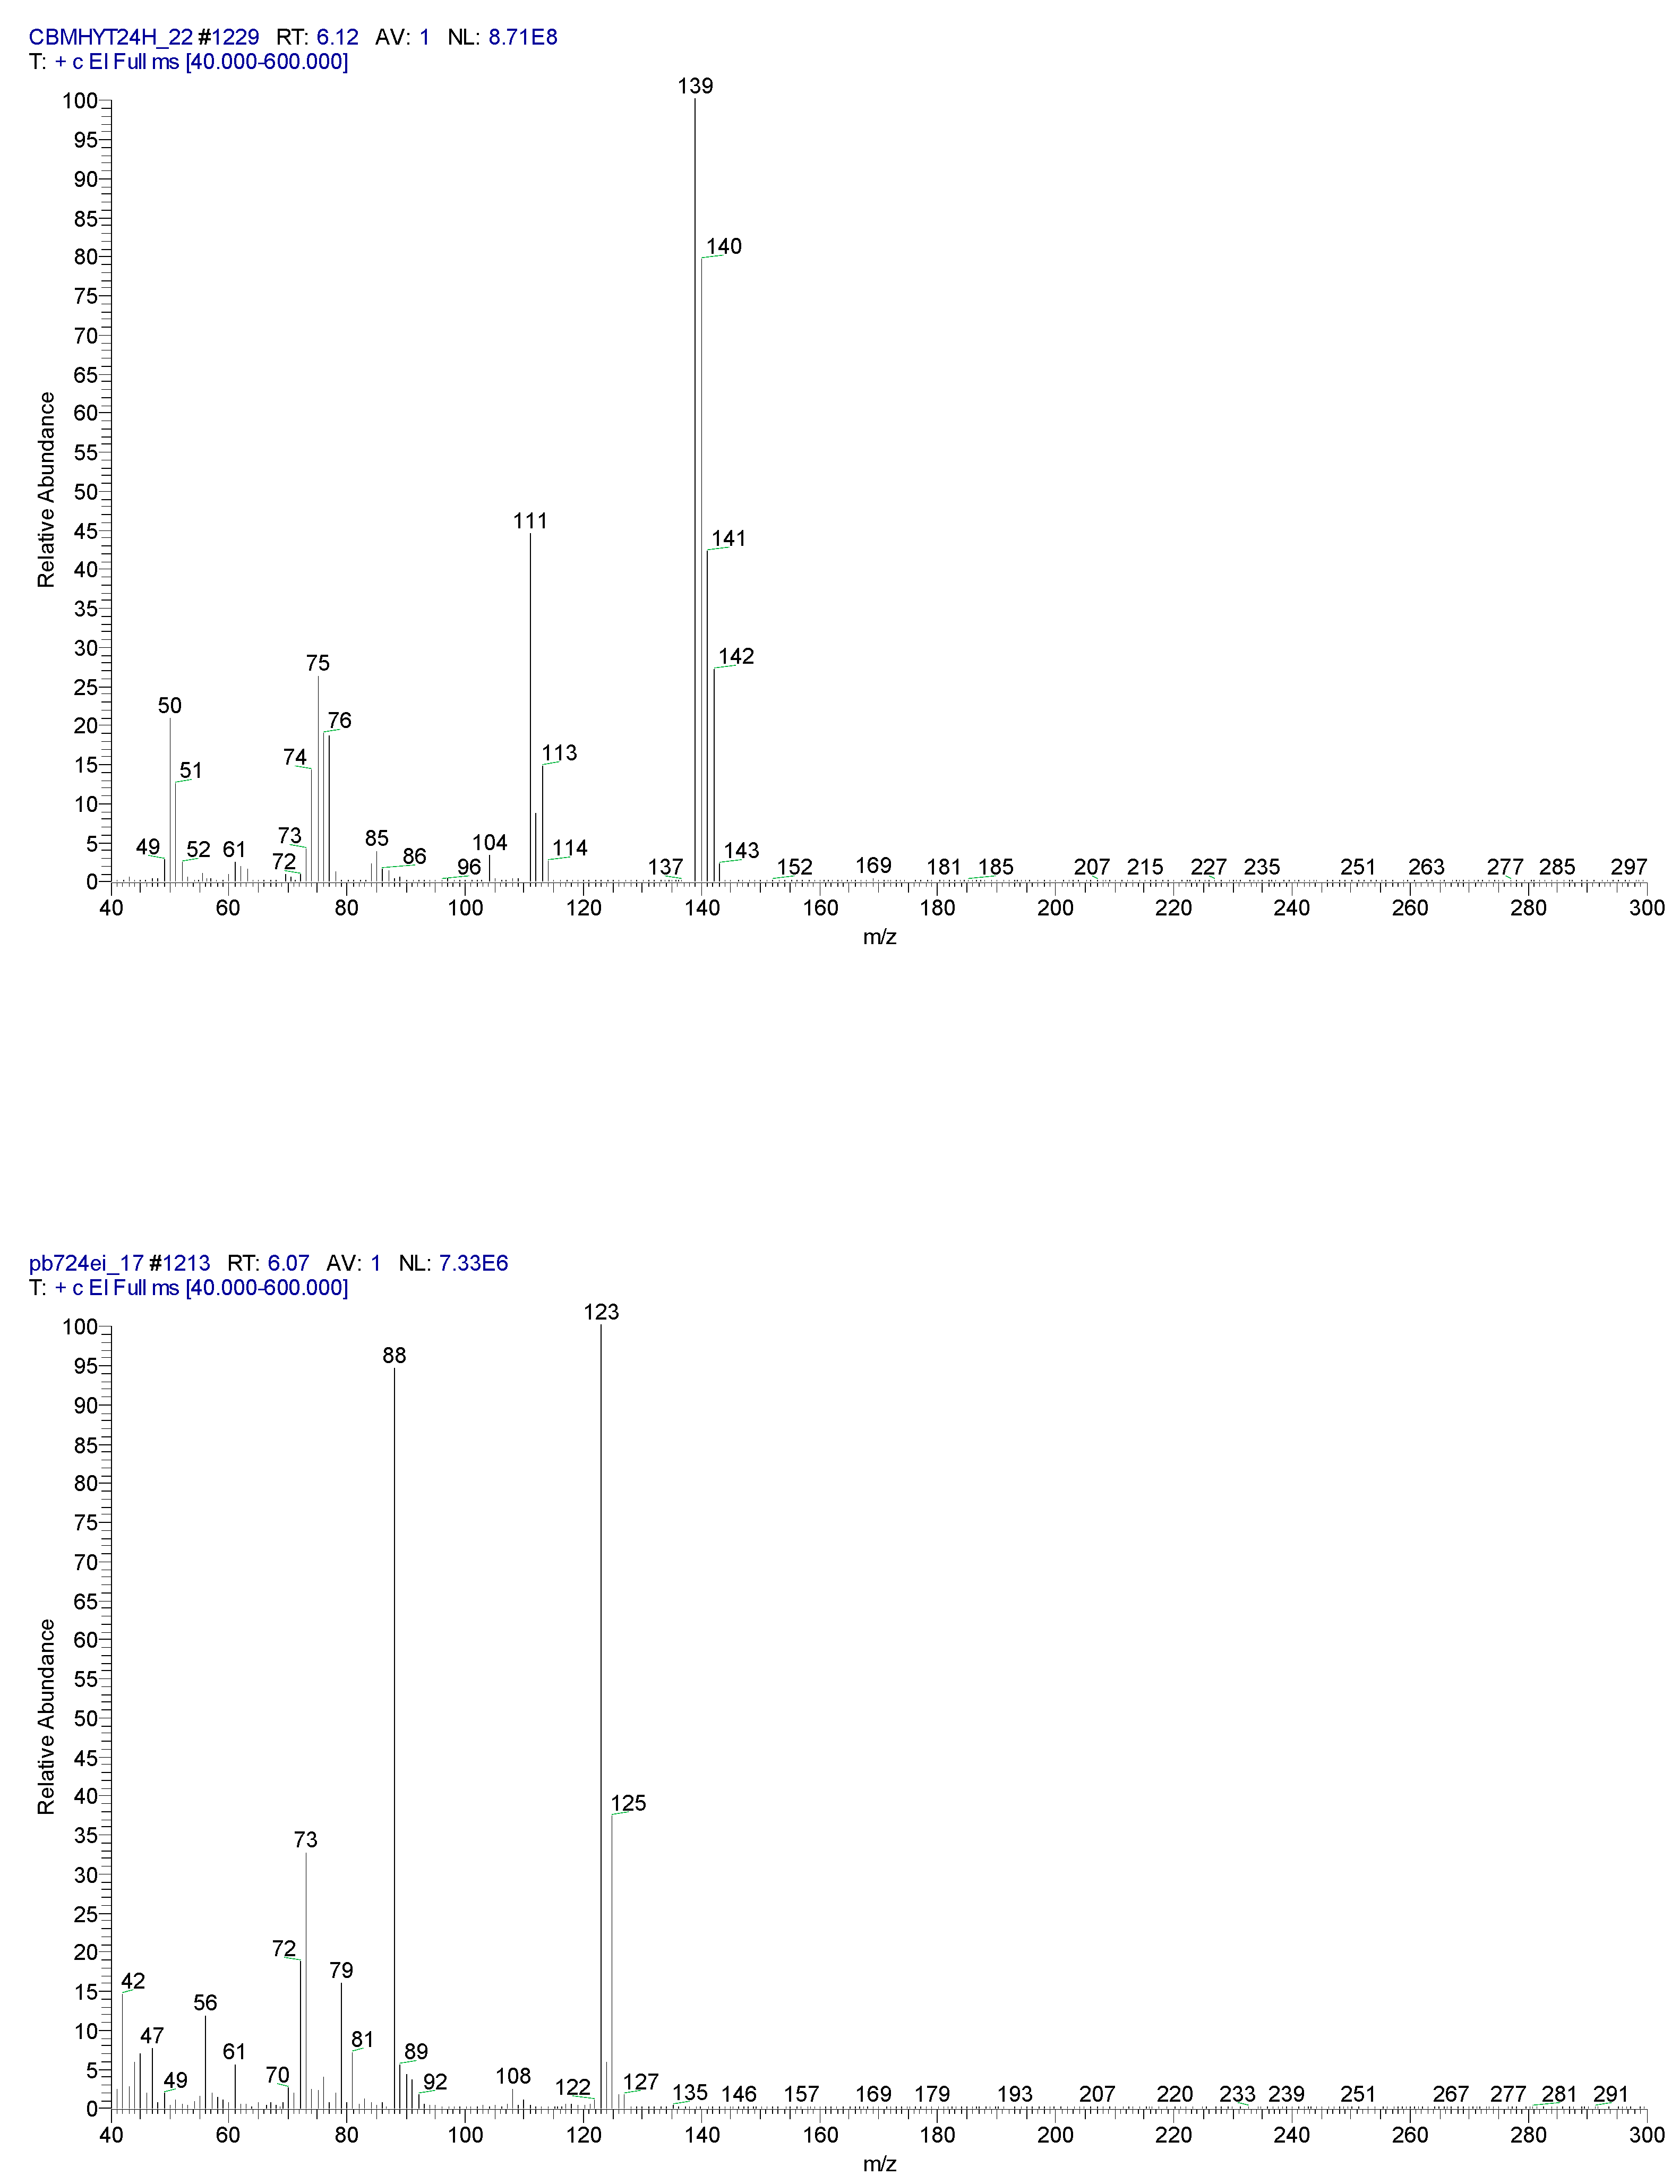
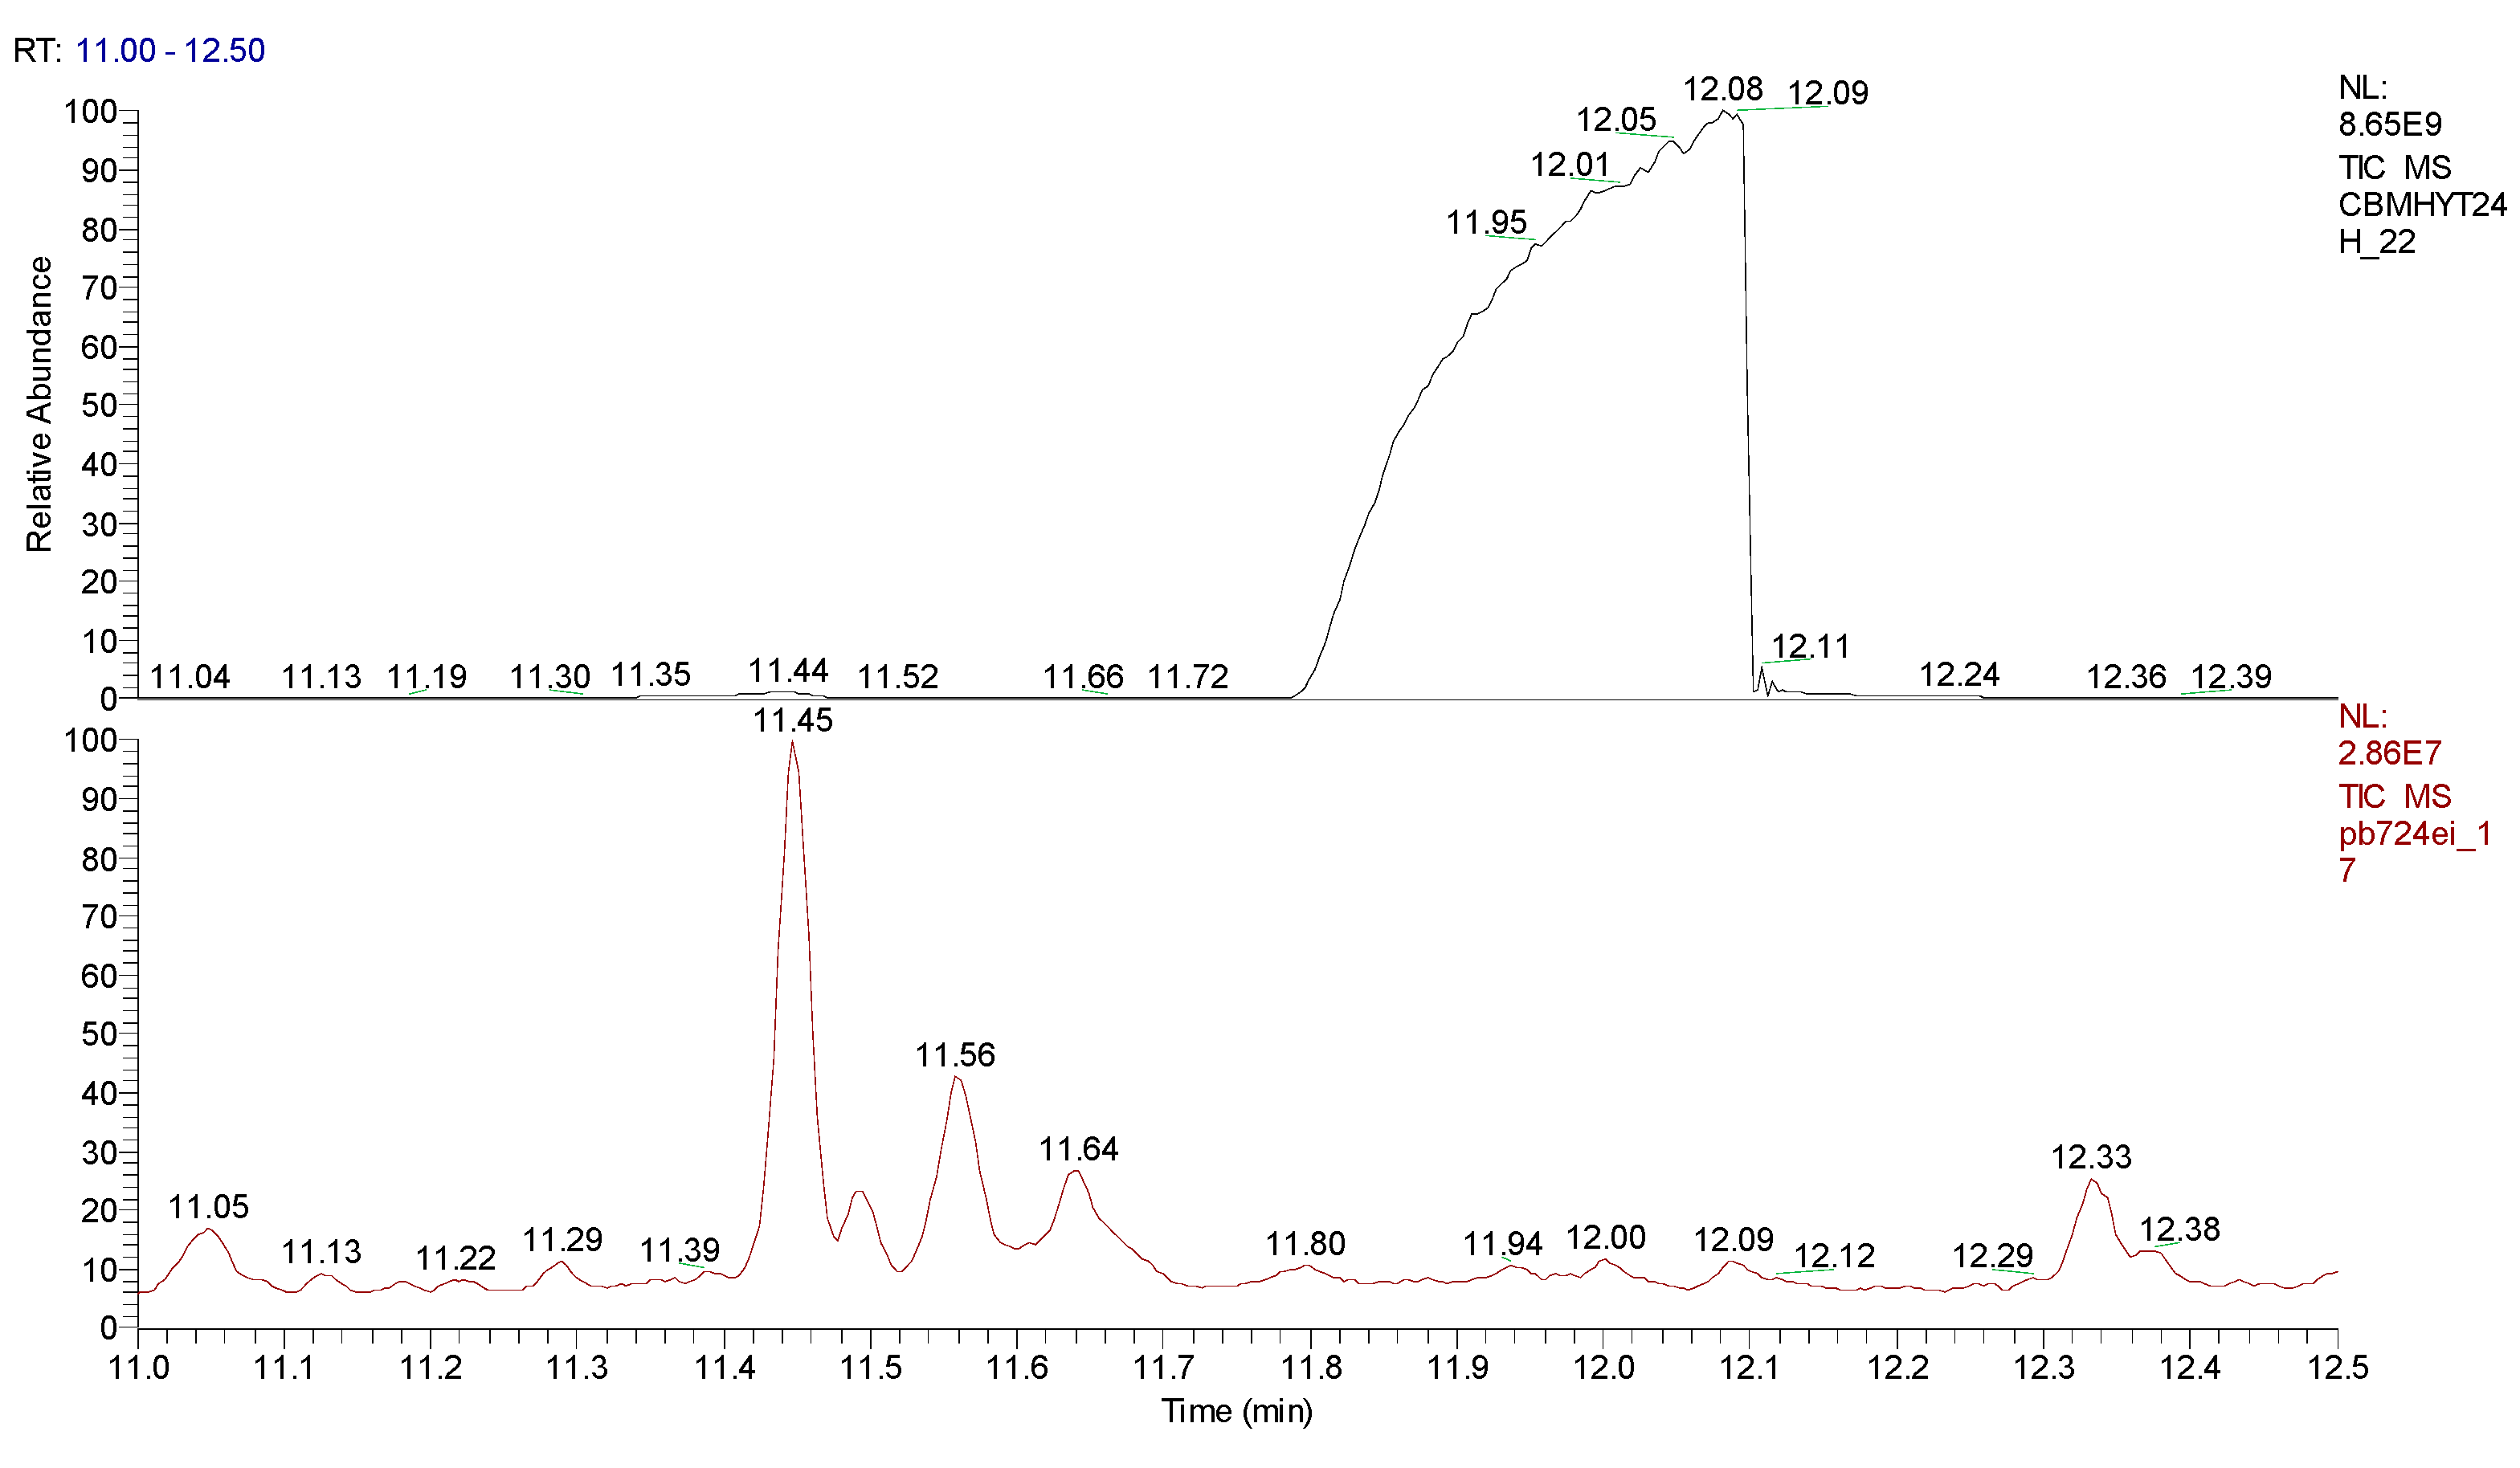
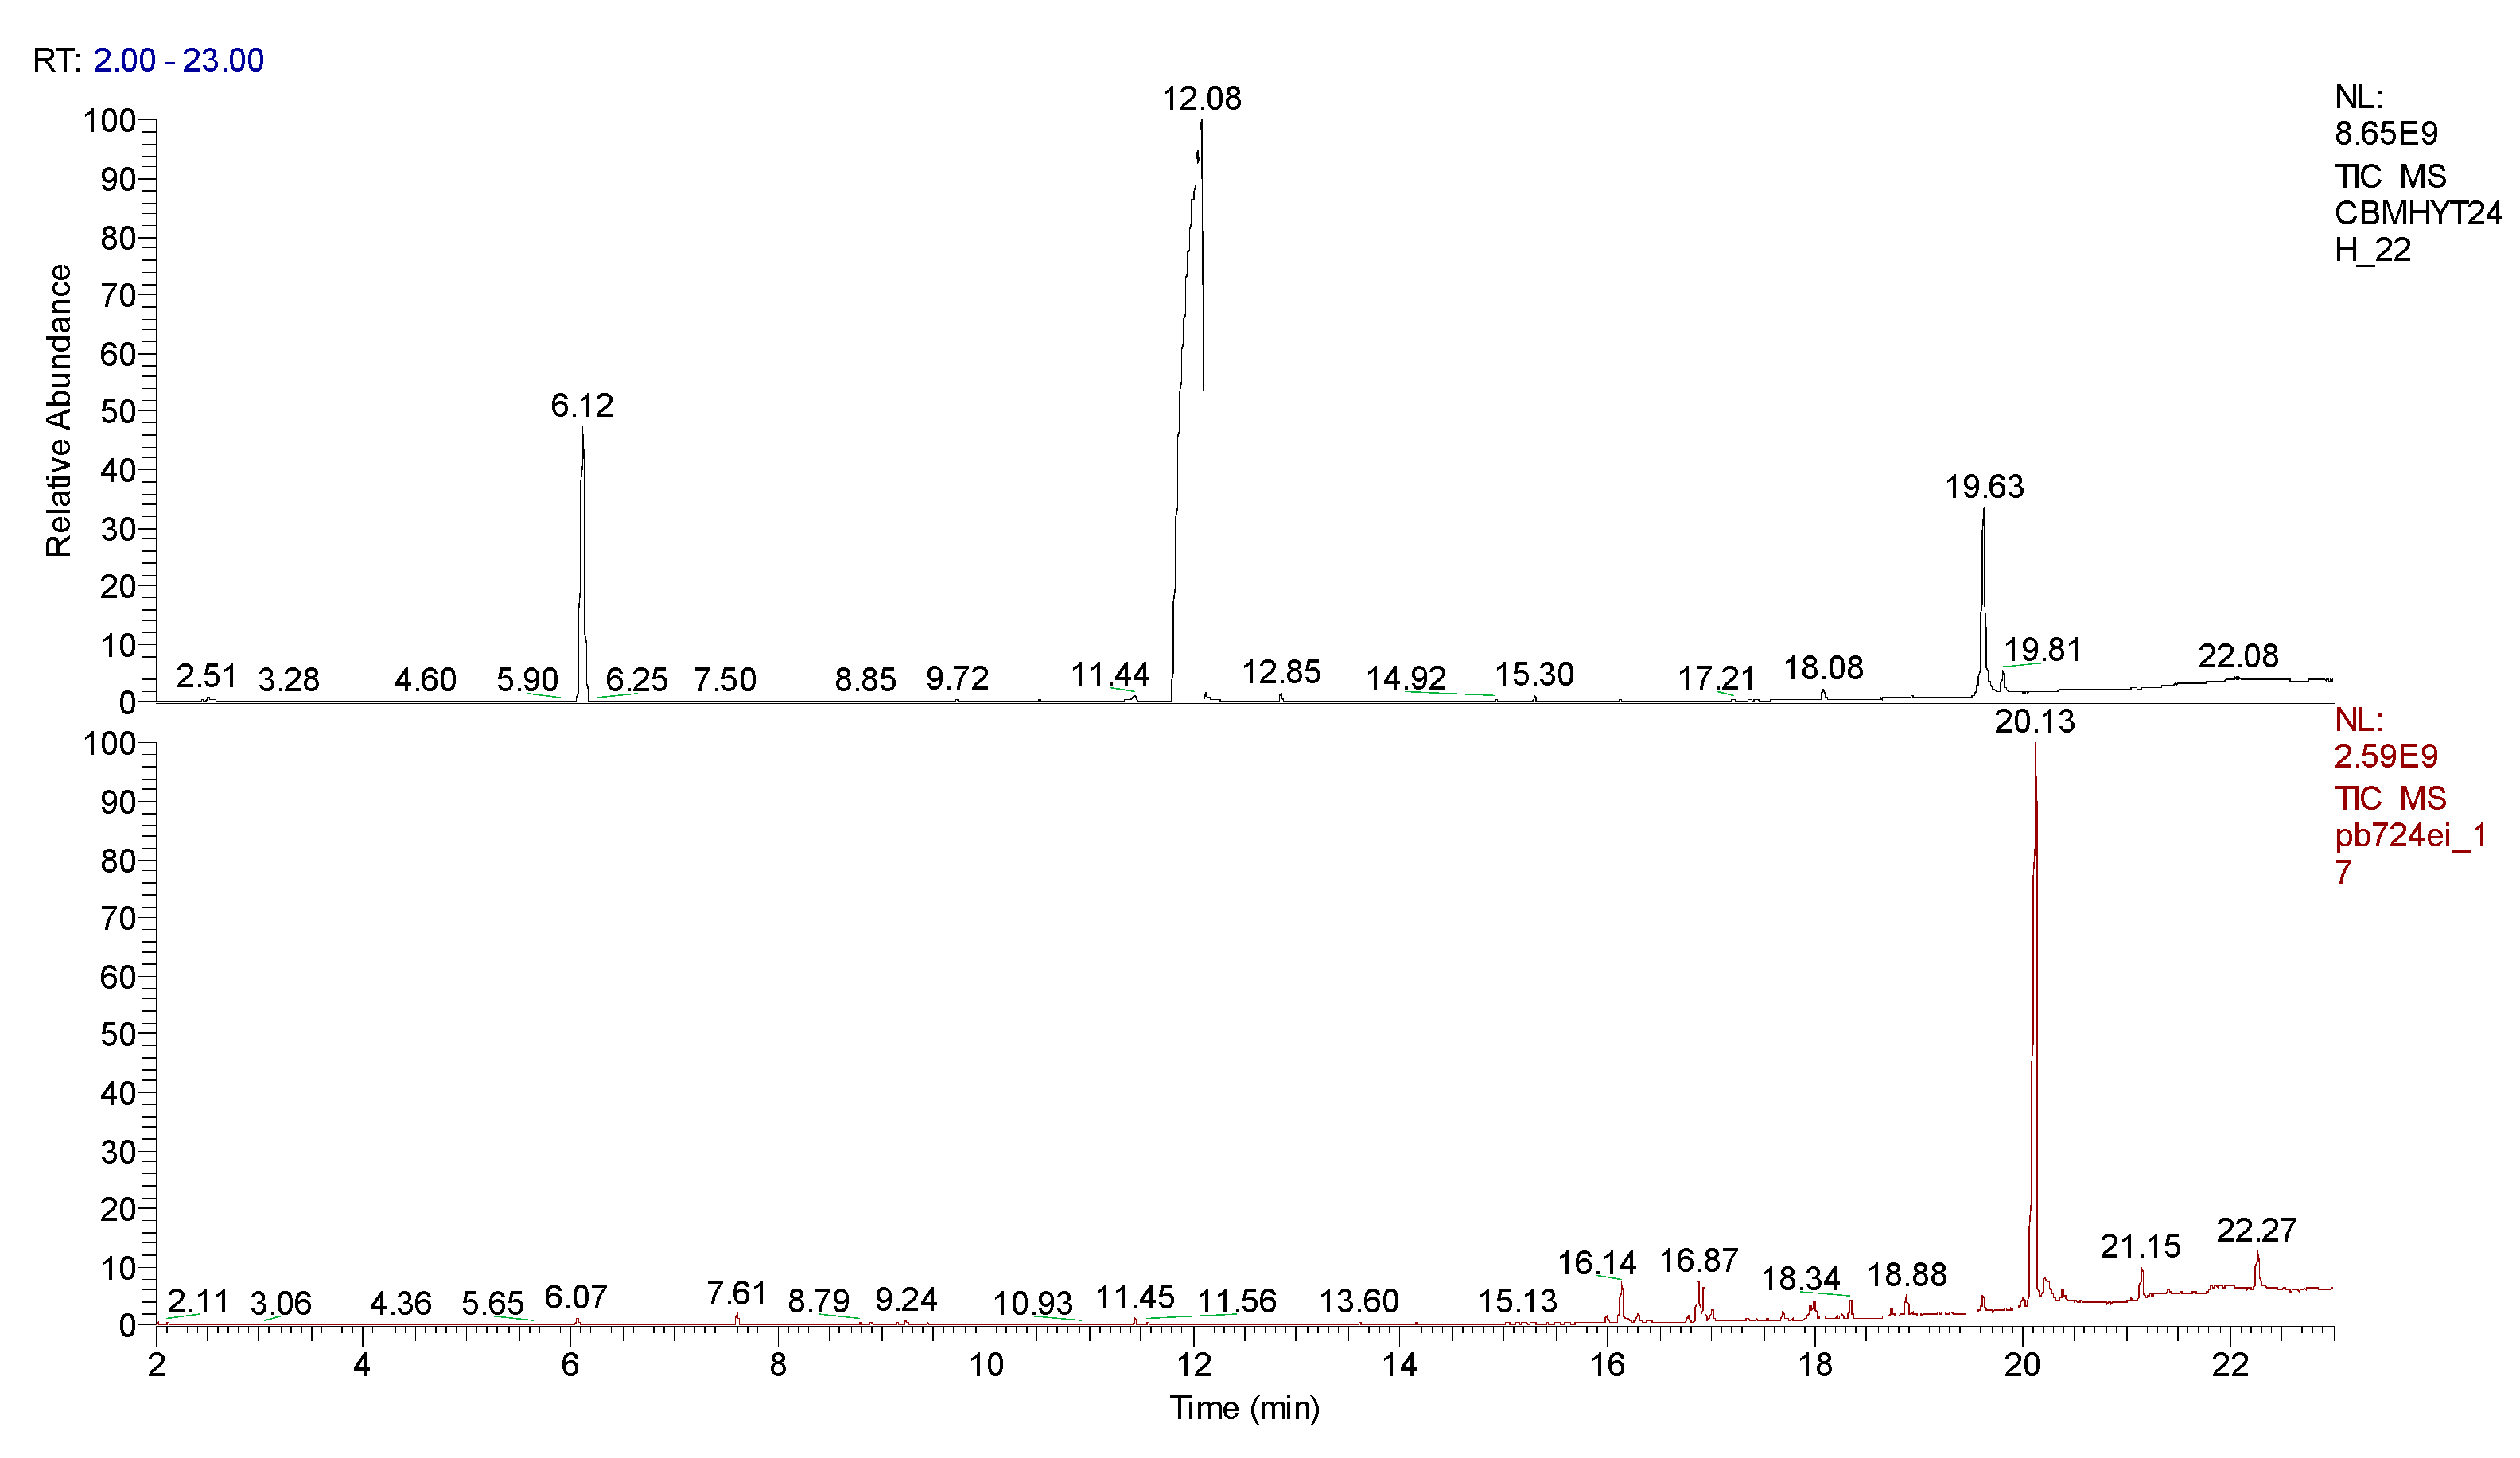
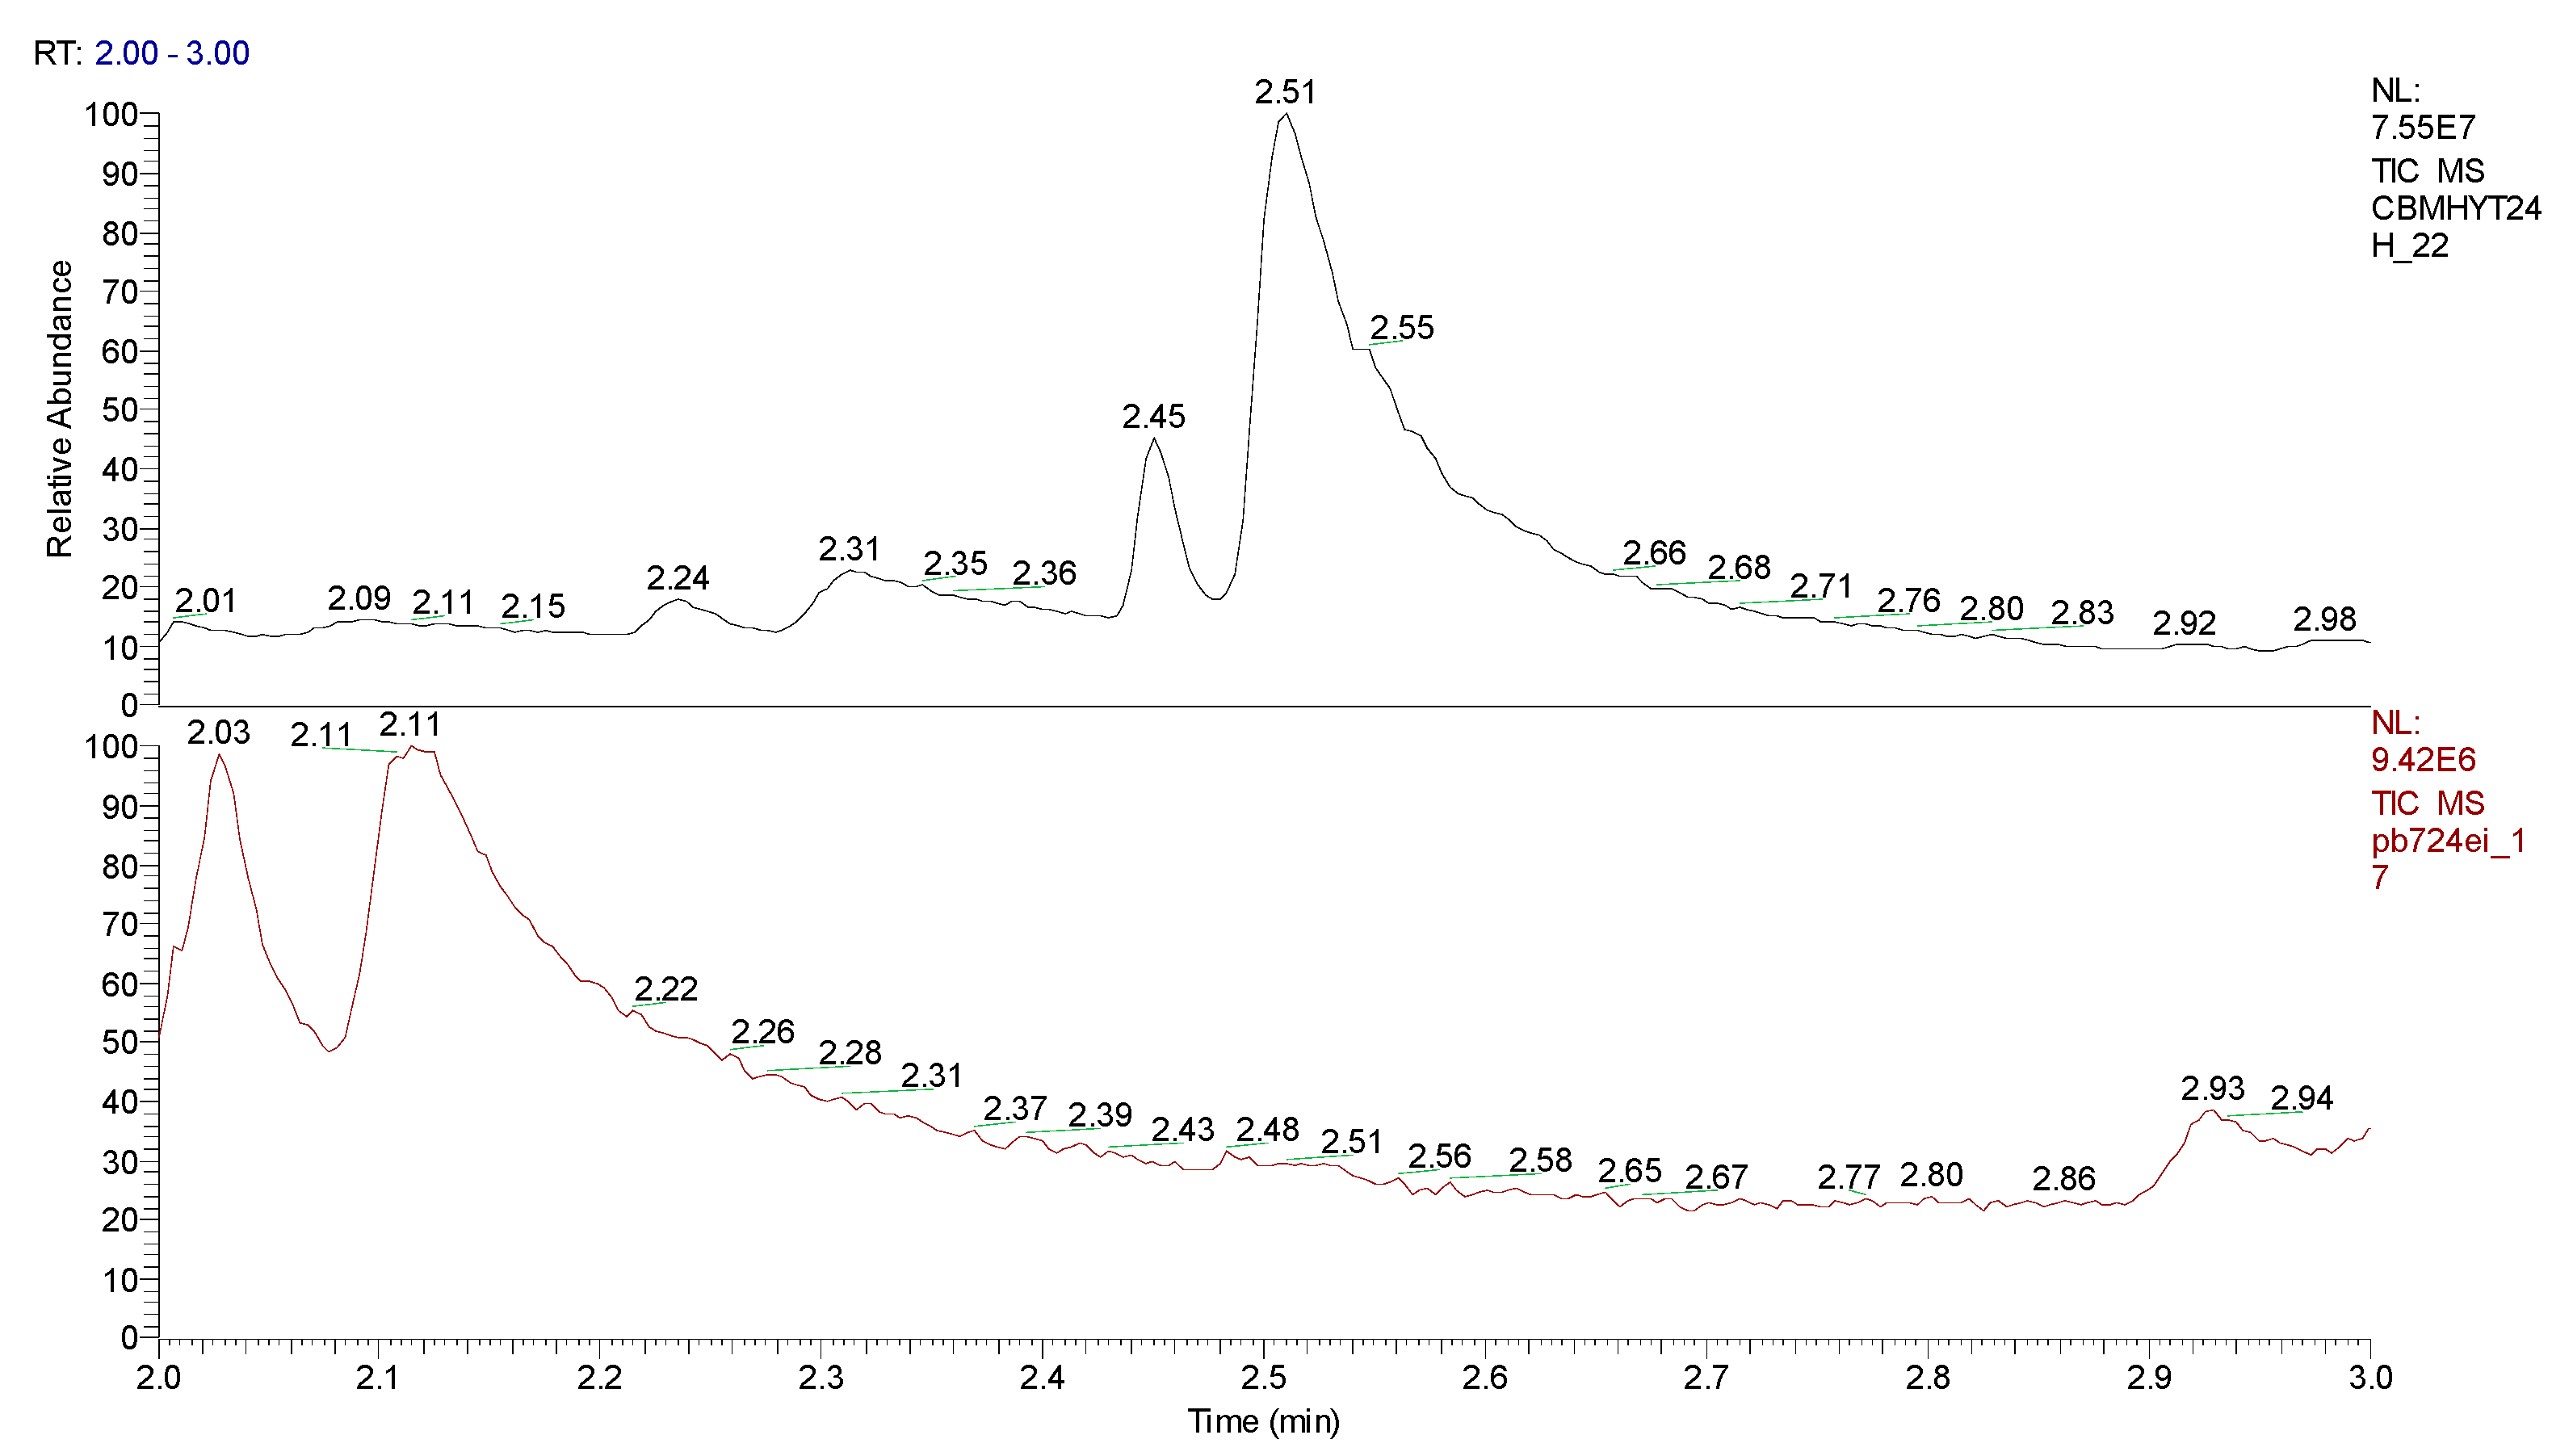
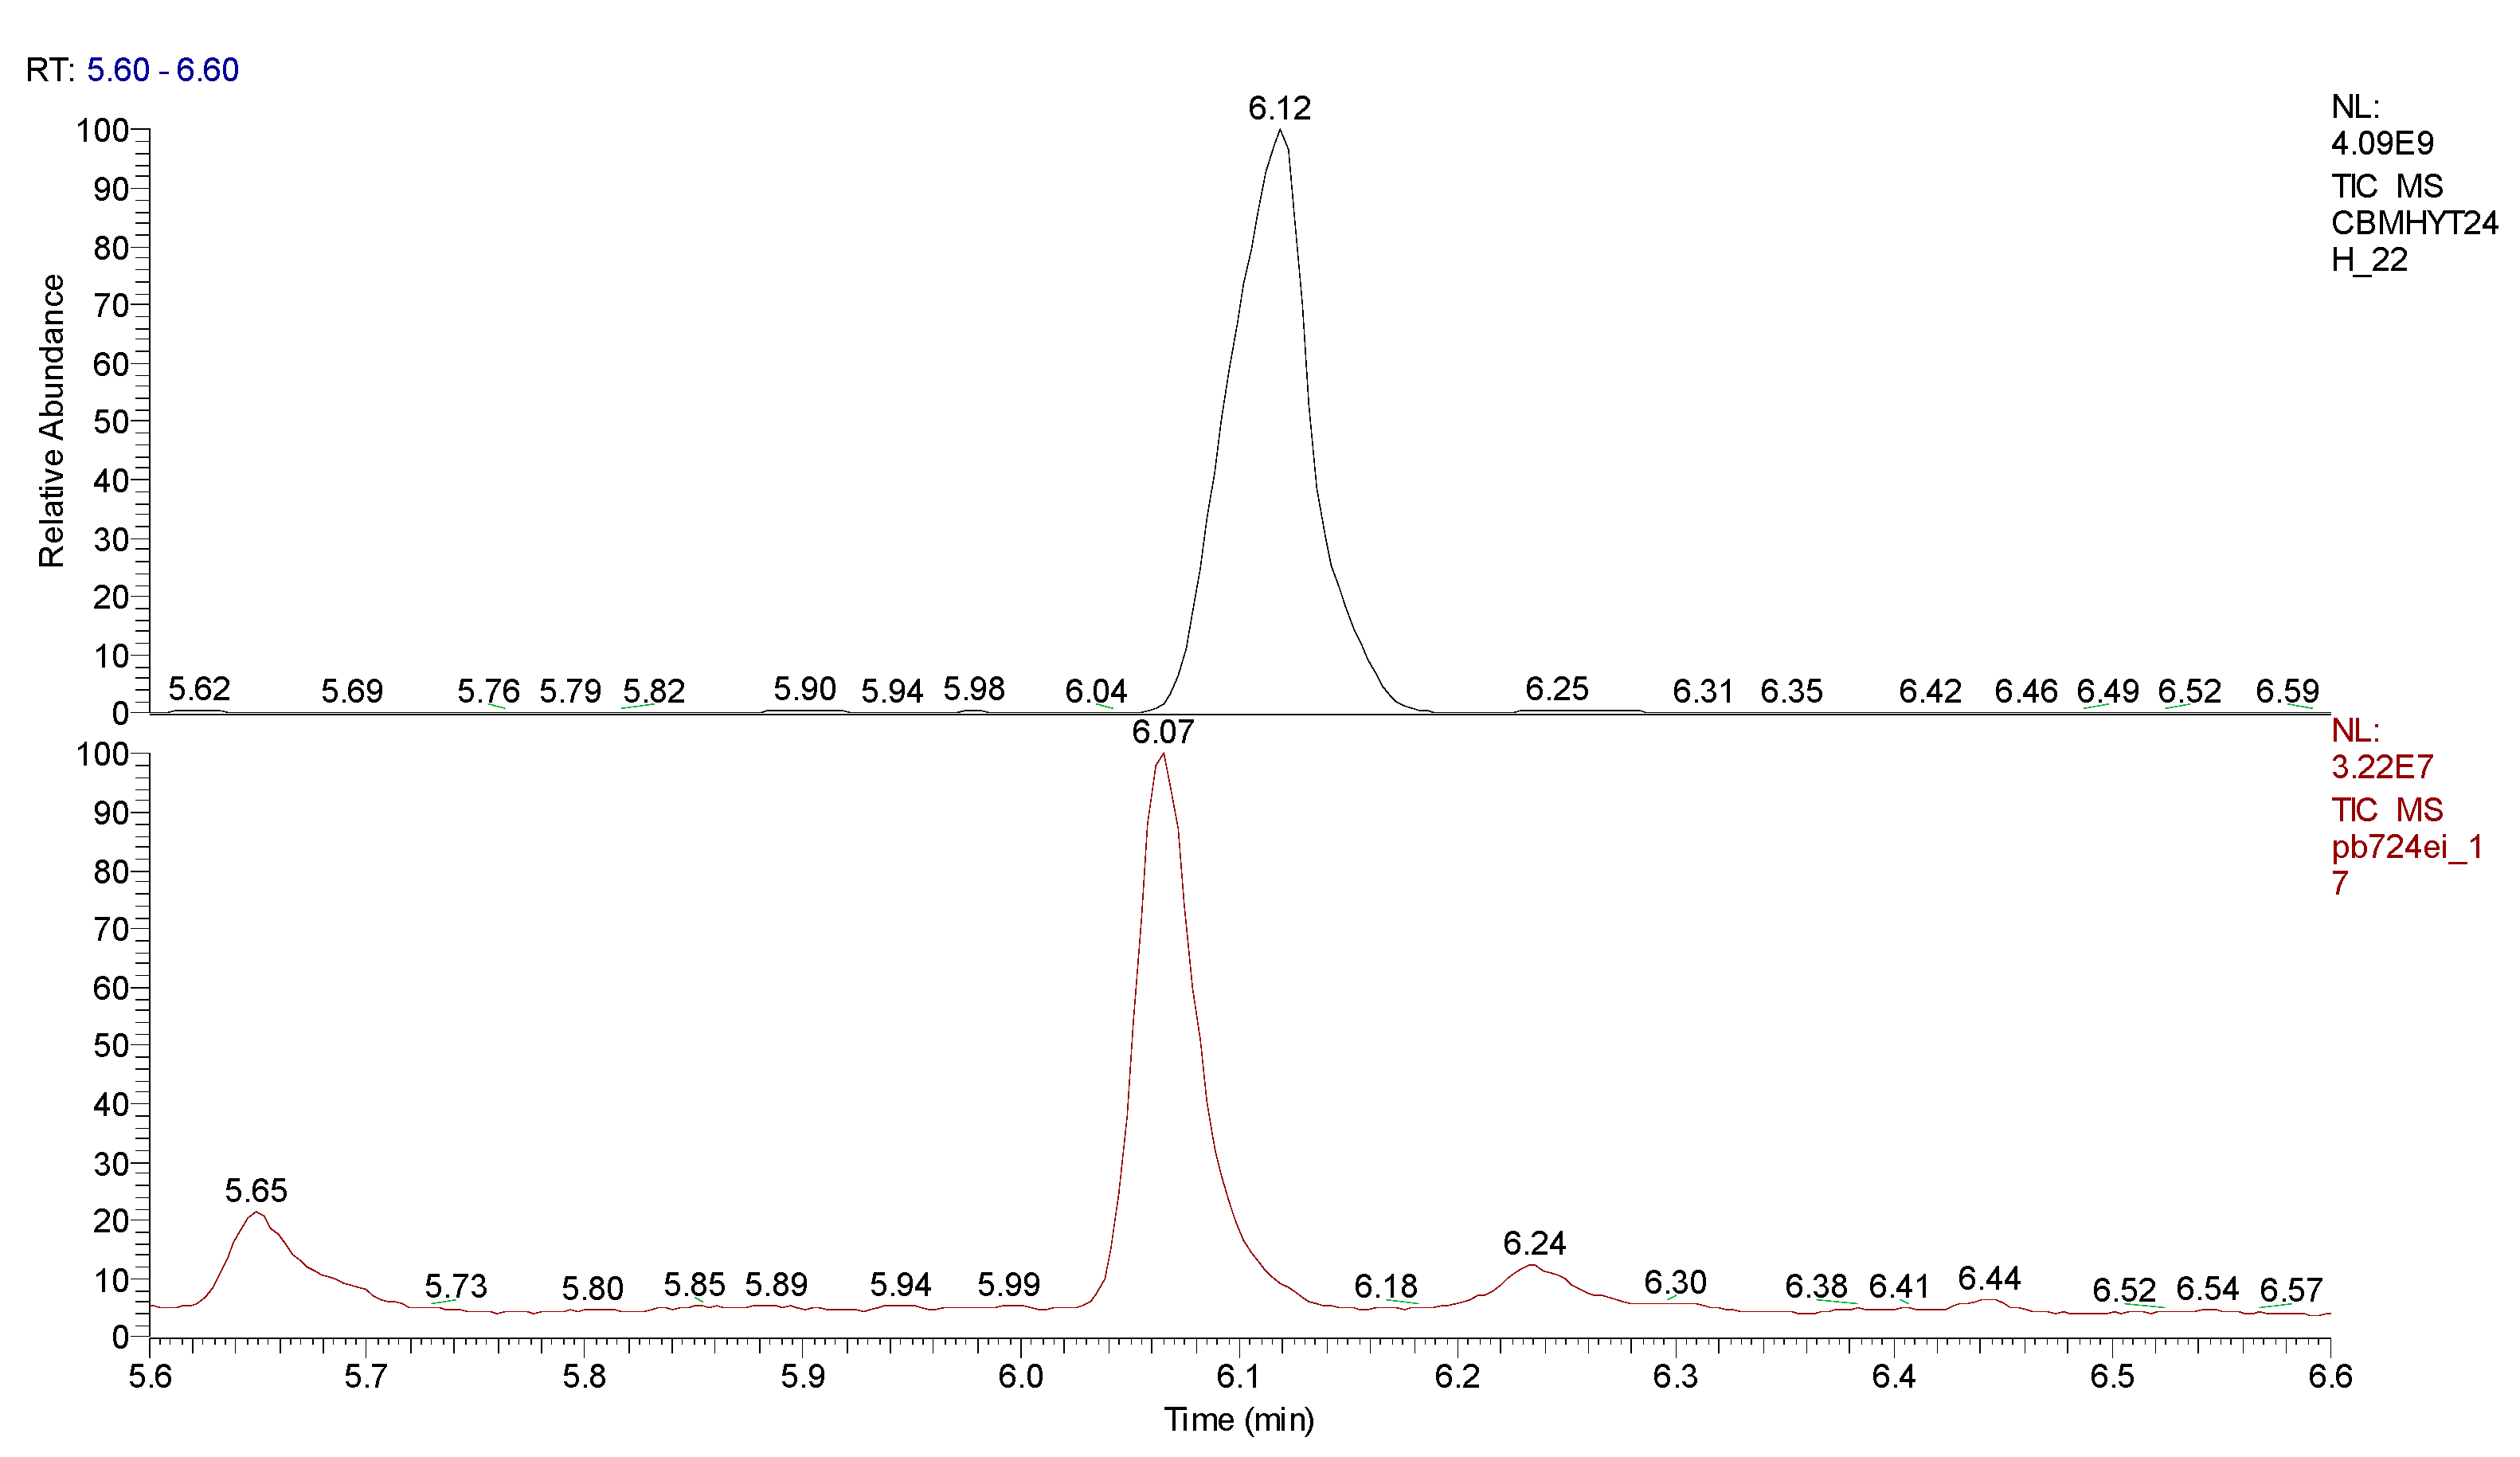
| Sample code/Chemical | Malononitrile (Tr 2.52 min.) |
2-CB (Tr 6.10 min.) |
CBM (Tr 12.14 min.) |
Mass of CBM (mg) | Hydrolysis grade (%)* |
|---|---|---|---|---|---|
| GC area | |||||
| CBMHYT0 | 0 | 64347004 | 52890605168 | 17.62 | - |
| CBMHYT30 | 8974787 | 814678251 | 52777364000 | 17.58 | 0.21 |
| CBMHYT60 | 16137050 | 1185660077 | 50024457883 | 16.66 | 5.42 |
| CBMHYT90 | 17355009 | 1257452113 | 49620527787 | 16.53 | 6.19 |
| CBMHYT24h | 264863119 | 10837442146 | 40513601453 | 13.49 | 23.41 |
Disclaimer/Publisher’s Note: The statements, opinions and data contained in all publications are solely those of the individual author(s) and contributor(s) and not of MDPI and/or the editor(s). MDPI and/or the editor(s) disclaim responsibility for any injury to people or property resulting from any ideas, methods, instructions or products referred to in the content. |
© 2023 by the authors. Licensee MDPI, Basel, Switzerland. This article is an open access article distributed under the terms and conditions of the Creative Commons Attribution (CC BY) license (https://creativecommons.org/licenses/by/4.0/).


