1. Introduction
System optimisation is one of the most relevant topics in naval engineering, specifically hydrodynamics. In recent years, development has focused on analysing the shape and dimensions of hulls and appendages using new technologies, contributing to the reduction of drag [
1]. One of the solutions proposed for sport sailing boats is based on hydrofoils based on wing profiles.
Hydrofoils are structures (in the shape of a wing) placed under a ship's hull, allowing it to rise out of the water as its speed increases. This minimises the hull's friction with the water and therefore reduces drag. In the case of a catamaran with hydrofoils, the effect produced is even more significant due to the presence of two separate hulls, as they can be placed under each hull, increasing lift and reducing drag. In the current market, there are two types of profiles that, according to their functionality, have two main objectives [
1]: (1) Minimise the heel of the boat (i.e. high, speed sailboats) by being installed on the sides; (2) Keep the hull completely out of the water during the sailing period (i.e. AC45 type sailboats used in America's Cup 2017) [
2].
Hydrofoils have been used in shipbuilding since 1898. They are designed based on a system with multiple foils on one side of the vessel and joined vertically (ladder), forming the so-called "multiple-foil ladder system". This so-called "E Foil" design has certain advantages, such as generating low structural stresses due to its structure made up of small, grid-shaped pieces, and even avoids the formation of the wing tip vortex [
3]. However, these mechanisms have disadvantages, such as the risk of hitting a floating object. Because of this, research has been carried out over the years into other foil designs to help reduce the disadvantages of the original foils as much as possible [
4]. However, it was not until 1906 that the basic principles of hydrofoils were published in the magazine "Scientific American", based on the achievements of great inventors such as Alexander Graham Bell, who designed the first sketches of what is now known as a hydrofoil. At this time, the boom in experimentation with foils began (especially in summer), and Casey Baldwin developed the watercraft hydrofoil. After numerous designs, the HD-4 was developed, a Renault engineering mix that reached a top speed of 87 km with good stability [
5].
In 1958, the first tests using V-foils in rough seas were carried out in England, and Baldwin's theory was proved wrong. It was then decided that the front blade should have a relatively insensitive angle of attack and act as a trim device, allowing the main blade to respond in advance to the incoming wave. It is then concluded that a stabiliser arrangement is essential for optimum V-Foil lift [
6]. In 1941, a new design called T Foil appeared in a boat called Hydrofin, in which an installation consisting of a kind of float pivoted on the bow was installed to regulate the trim [
7,
8]. This form of hydrofoil is currently designed with a fixed foil and a rear flap so that the amount of lift is generated and, thus, the boat's trim can be regulated [
9]. In 1973, a new design called C Foil appeared, which supports a lightweight frame with floats on the sides driven by the sail [
10]. This design has been used on several Olympic vessels, including the NACRA17 catamaran [
11]. While it is complex to manufacture, and its "flight" can be unstable, this type of design is simple and is always sufficiently submerged so as not to vent.
Over the past three decades, several motor catamarans have been designed and built as recreational and sport fishing boats and navy and police patrol boats. In 1978, some police boats were tested for border control and found to perform excellently in rough waters, but the propulsion power requirements were extremely high compared to Deep-Vee monohulls. Petrol engines had to be used instead of diesel propulsion, which started an urgent reflection on improving the design to reduce the drag of motor catamarans. The use of hydrofoil to reduce drag was tested on one of the existing police boat test models, resulting in an immediate drag reduction of 40% [
12].
In 1981, Greg Ketterman designed a hydrofoil system called L Foil which was intended to be adjustable [
13]. However, after conducting several tests with different types of L Foil, it was concluded that having a vertex at the junction increases the drag generated by the appendage, so it is necessary to design a radius at the intersection. However, this type of Foil is more complex to manufacture than the previous ones, as it requires excellent effort because part of the structure is cantilevered [
14].
In the present research, an analysis of the drag of a 4.2-metre sport catamaran (Ayakoú), capable of sailing at 7 KN with a medium wind intensity (12-15 KN), is carried out by modifying the appendages present and including hydrofoils of the second group mentioned, to optimise the boat's drag.
2. Materials and Methods
2.1. Geometry of the vessel “Ayakoú”
The boat "Ayakoú", a sport sailing catamaran designed to be sailed by one person and designed in fibreglass, is analysed (
Figure 1). Regarding its dimensions, the total weight is 86.94 kg, its longitudinal centre of gravity (LCG) is set at 1.91 m from the stern of the boat, and the distance from the centre of the centreboard to the transom is 1.88 m.
Table 1 shows the most relevant characteristics of the catamaran, corresponding to a single hull with its respective appendages and considering the weight of one person on board the vessel.
2.2. Vessel messhing
2.2.1. Sensitivity and set up
The vessel's mesh sensitivity analysis is carried out using three different grids (Trimmed Cell), varying the number, size of the elements and flow velocity (3, 5, 7 and 9 kN), according to the catamaran's sailing history recorded with GPS (average wind: 12-15 KN; speed: 7 KN). In addition to obtaining the pressure and friction resistances separately, a simulated towing test is carried out to simplify other factors (induced resistance, healing, healing). The simulations are carried out with a symmetry plane to reduce calculation times.
Table 2 details the flow characteristics from the simulations performed using the STAR-CCM+:
The catamaran hull is immersed in a domain in the shape of a parallelepiped, with a dimension of 4 lengths. The domain has a total width of 5.2 metres, i.e. measured from the centreline of the hull to the furthest surface in the transverse direction; there is a distance of 1 length.
Figure 2 shows that from the bow to the beginning of the field, there is 0.5 length, and from the stern to the end of the domain, there is a distance of 2.5 lengths. In the vertical direction, from the baseline to the bottom, there is 1 length, and from the top of the bow to the top of the domain, there is ¼ length of distance.
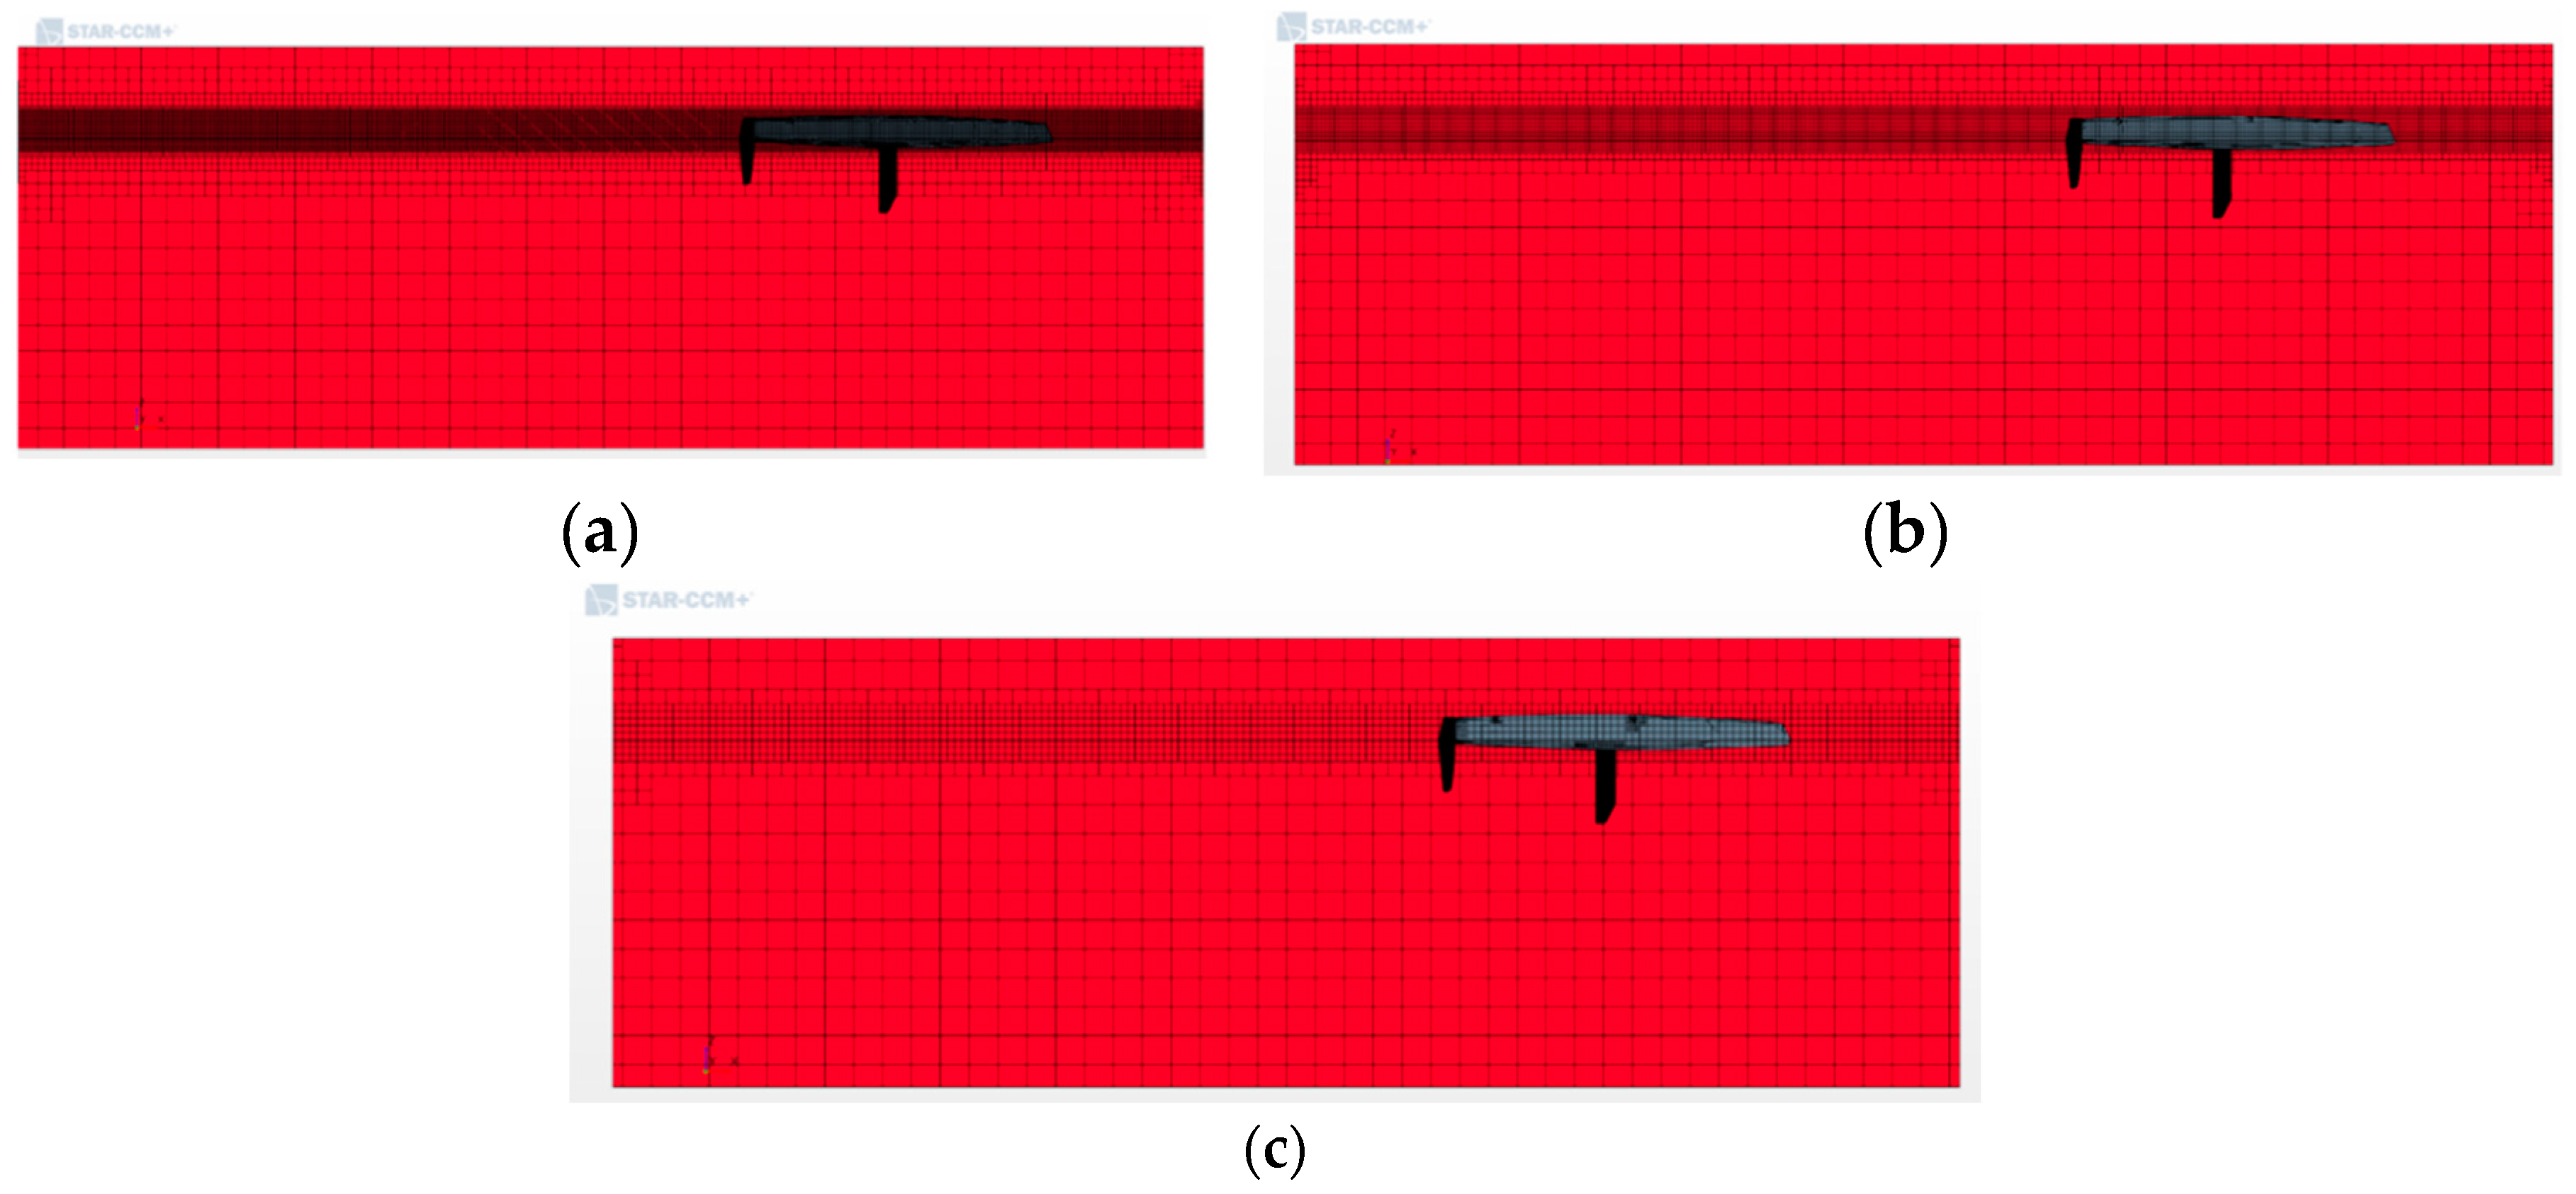
All boundary conditions are considered "inlet", except the surface between hulls and the plane perpendicular to the centreline towards the vessel's stern. These are regarded as symmetry plane and "outlet", respectively. In addition, the free surface condition is established as the boundary between the two fluids (water-air). Three types of grids were used for the numerical analyses performed, which differ in the size of the elements of a control volume positioned from the hull baseline to the deck, as shown in
Figure 3 (fine grid), XY (medium grid), YY (coarse grid). This volume is decided to be placed at that point to have good free surface modelling using an iso-surface. For the fixed parameters of the meshes, a 1.0 inflation layer is used around the catamaran, using 13 elements as "Prism Layers", and the hull appendages are refined, defining an element size capable of describing its shape.
Figure 3a–c show the three types of meshing, corresponding to fine meshing (5,228,269 cells), medium meshing (1,161,014 cells) and coarse meshing (583,915 cells), respectively.
2.2.2. Meshing-dependent drag analysis
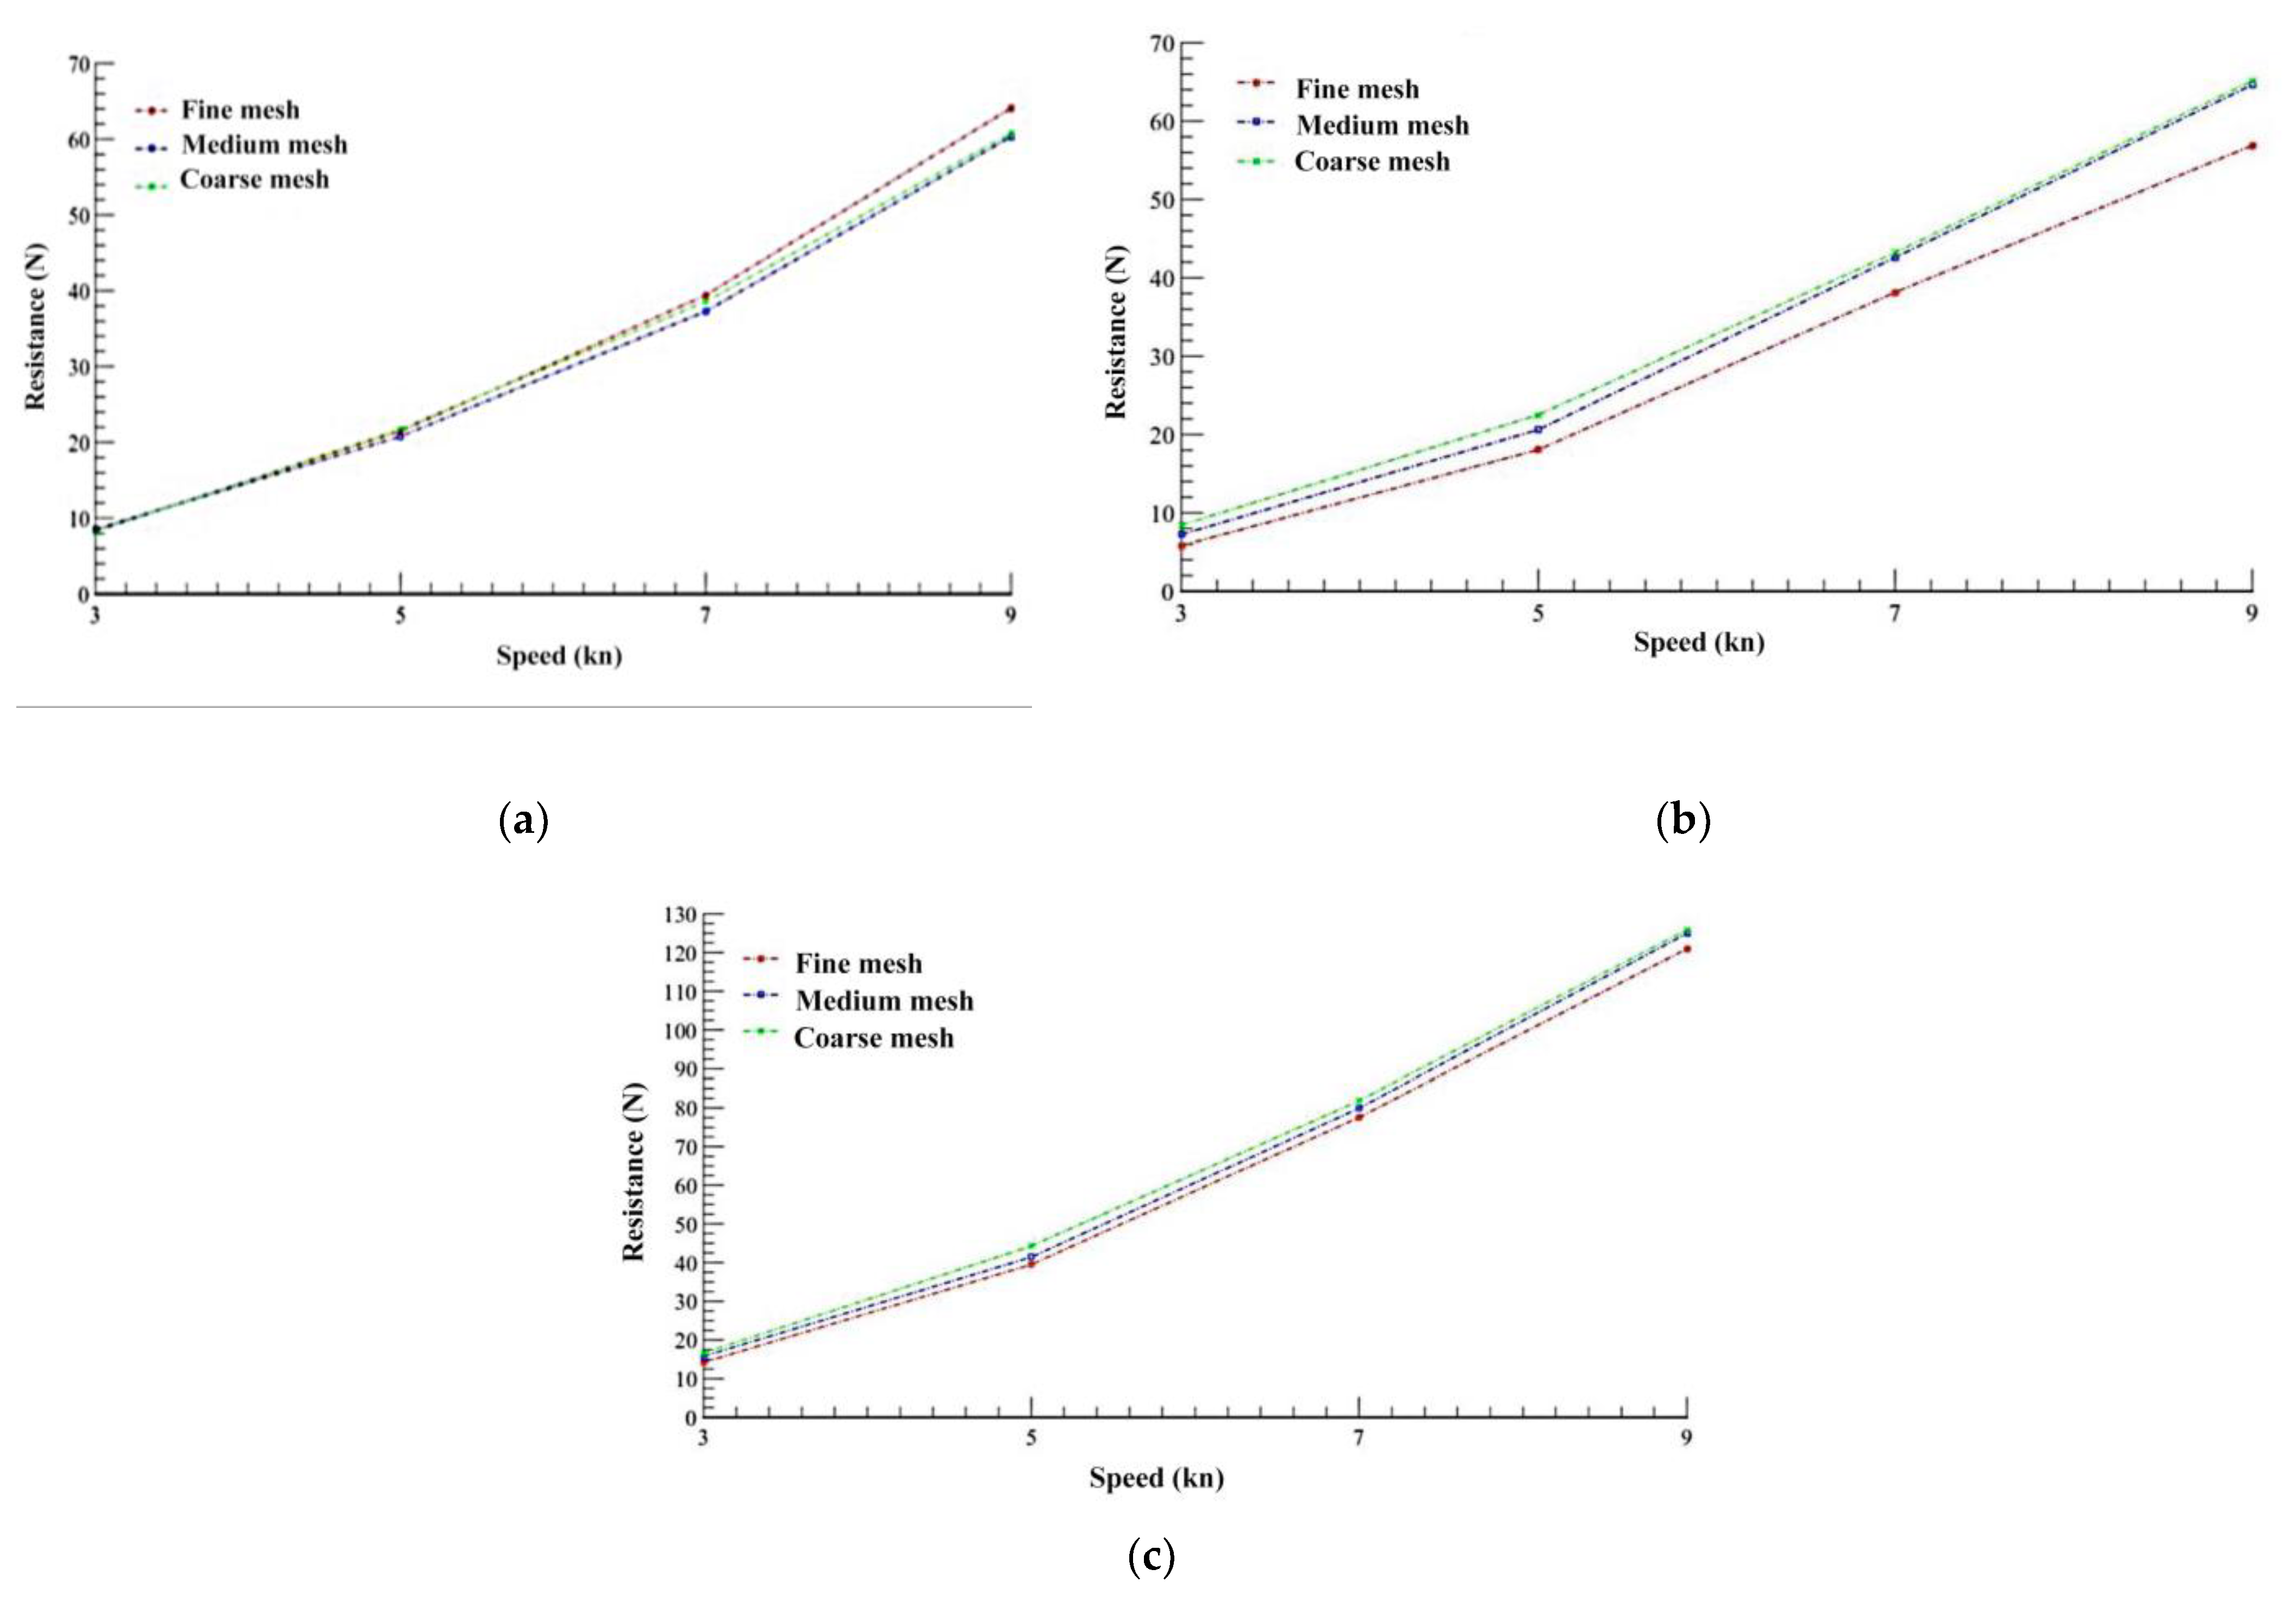
The numerical simulations use the catamaran's geometry as a function of the velocities established at an angle of incidence 0 with respect to the centreline. For this purpose, average frictional resistance and pressures are calculated (from the resistance of a single hull), obtaining the results for each type of mesh used, shown in
Figure 4.
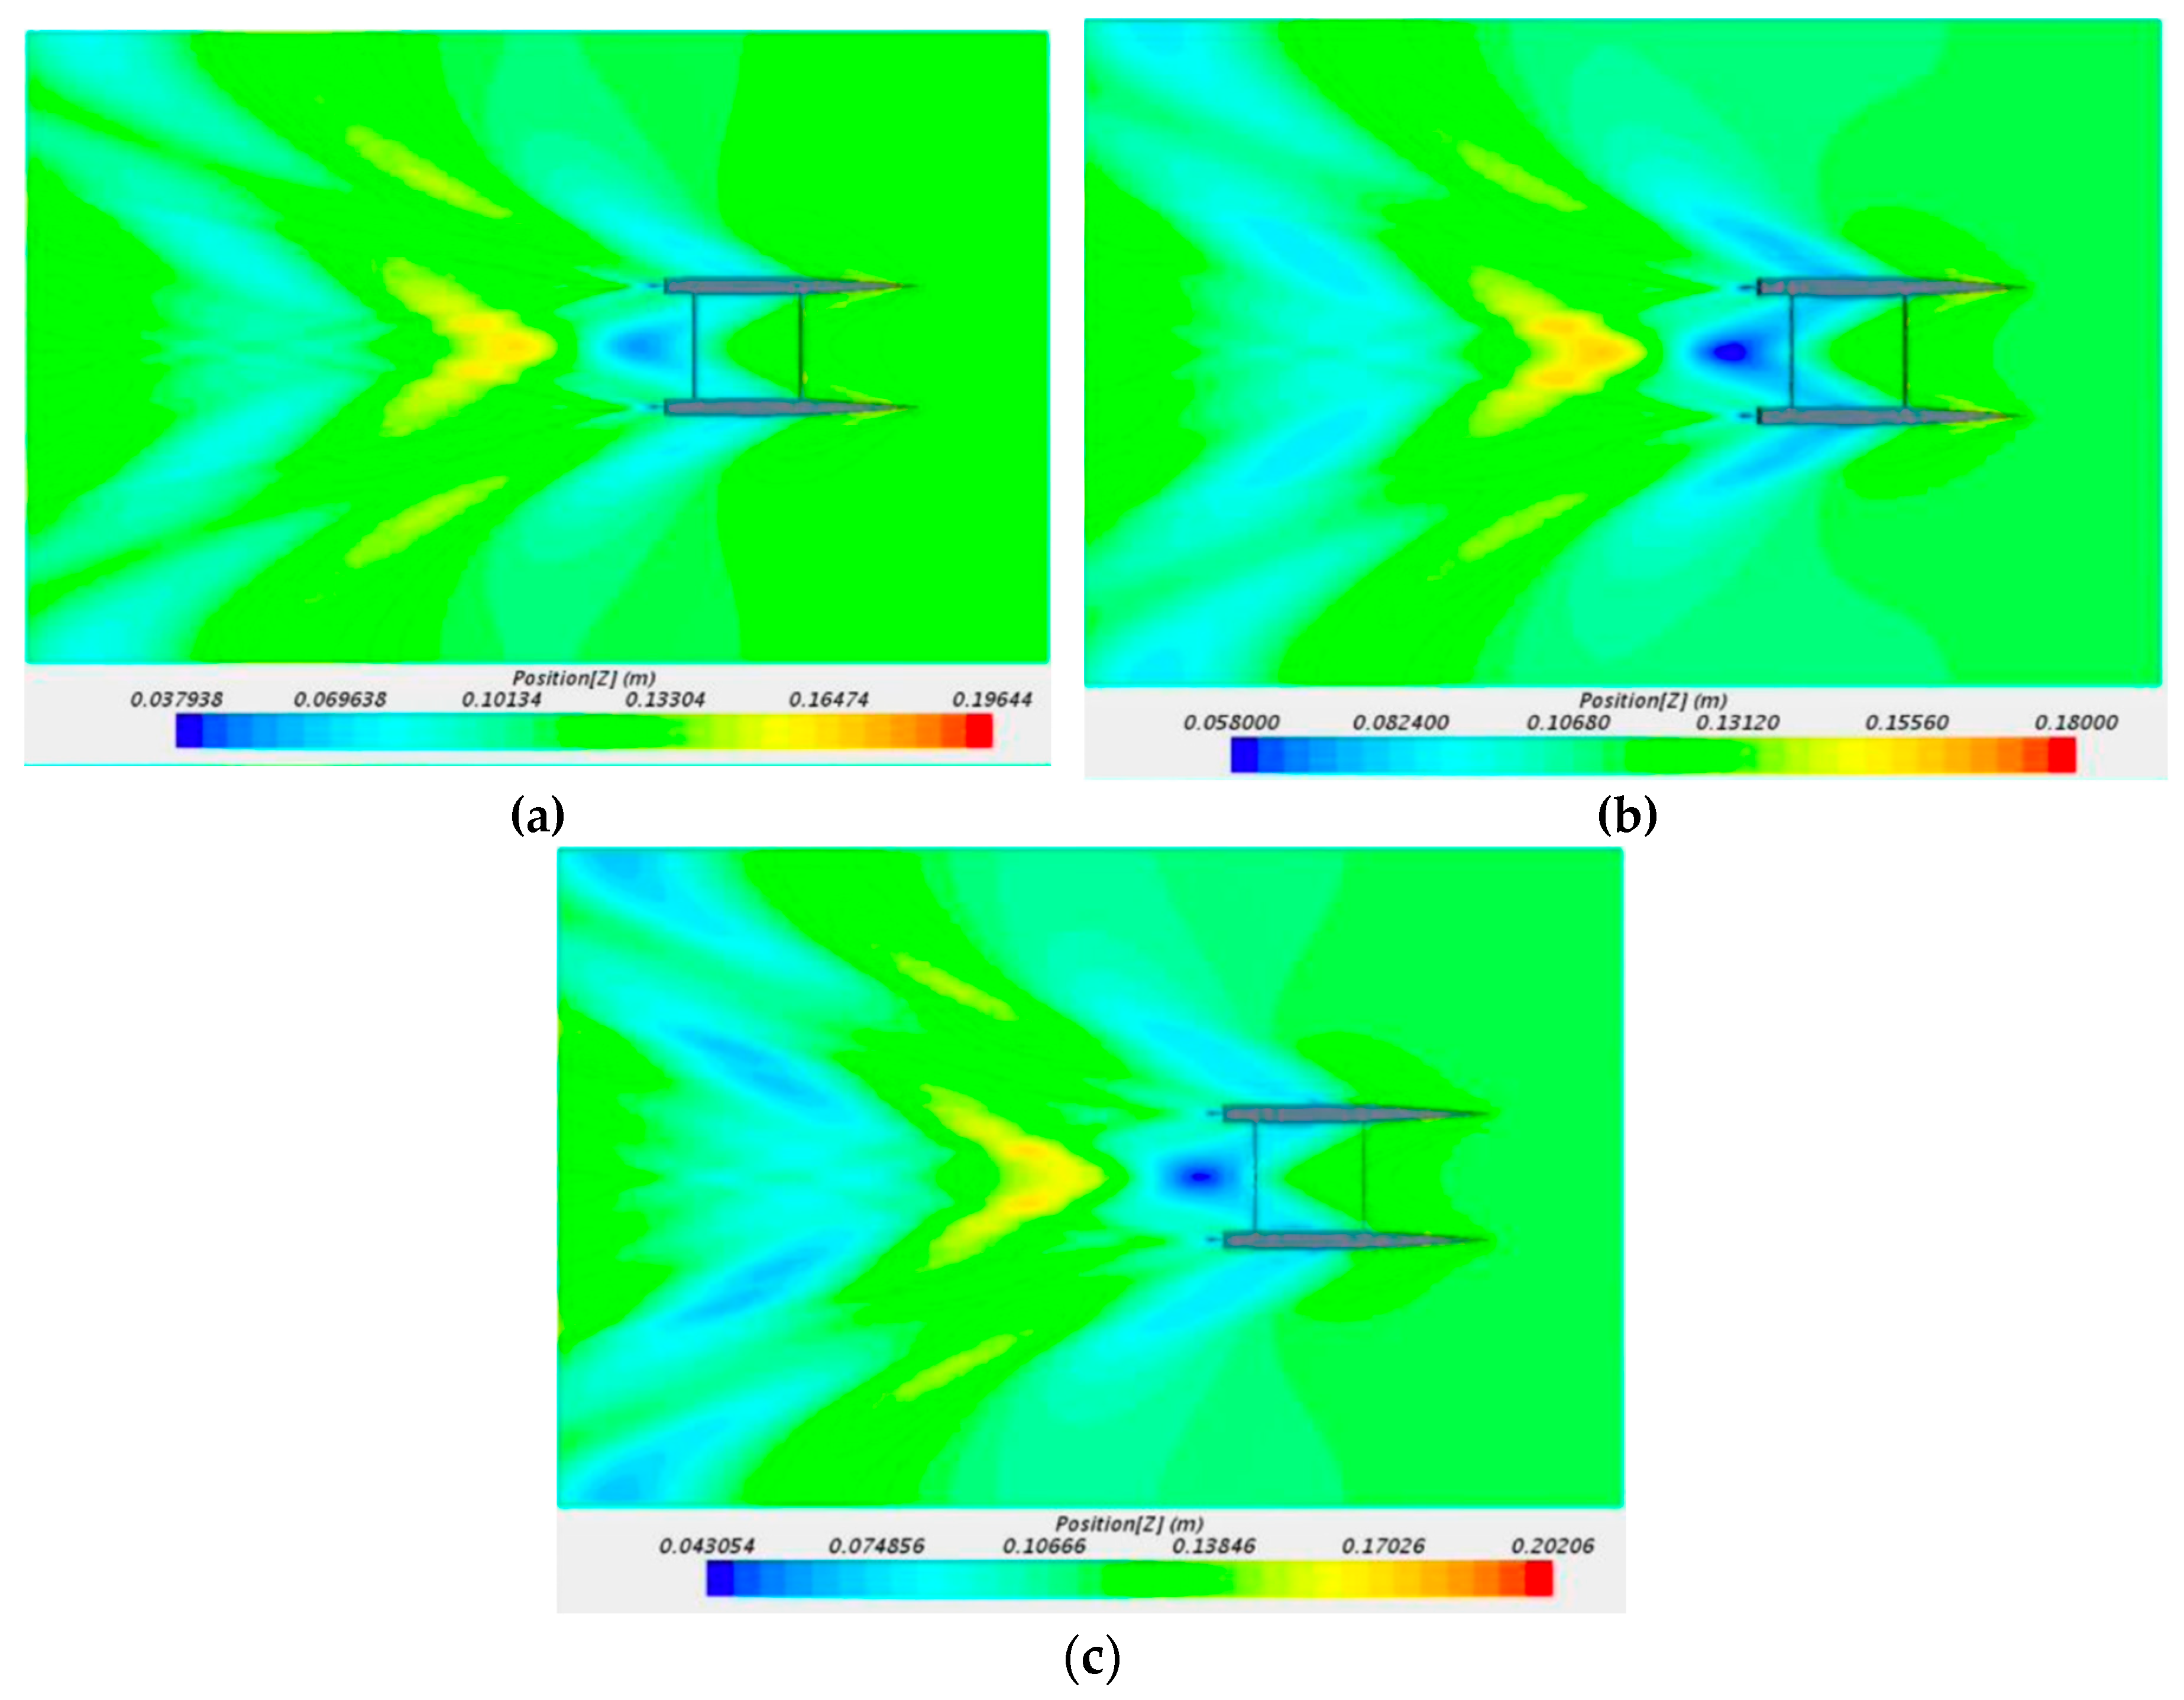
Once the resistances for each type of mesh have been obtained, the simulation is carried out, subsequently generating a qualitative comparison (
Figure 5) between the simulations carried out at 7 KN, observing the height of the wave generated. The results show that the wave patterns are similar, although there is a relevant difference between the maximum and minimum heights. In addition, the highest wake waves are generated in the medium and coarse mesh, consistent with the data obtained in the pressure resistances.
Table 3 shows the percentage comparison between the three mesh types.
It is observed that the frictional resistance presents variations of less than 6% because the cells surrounding the hull vary in control volume but not in size. On the other hand, when reviewing the values of the pressure resistances, in particular the "Medium-Fine" comparison, there are percentage differences of approximately 17%. This is due to the difference in the number of cells (approximately 4 million), with which the pressures affecting the hull, free surface, etc., are better modelled. Likewise, the "Medium-Thick" has a difference of approximately 500,000 cells. For the total resistance, the most significant difference between the "Medium-Fine" values is 8%, and even the average of these percentage differences reaches 4.82%. In the "Medium-Coarse" comparison, an average of 3.71% is obtained.
Despite not obtaining fully convergent values between the three types of grids, it is chosen to work with the "medium grid" due to the computational resources available and the time required for the simulations using the "fine grid". However, it would be necessary to perform simulations with a much finer mesh to obtain greater convergence.
2.3. Profile determination and analysis
The selection of the profile shape depends on the work required, as it is different to need the same support on both sides of the profile in one direction only.
Based on a thorough review of the literature, it was decided to opt for a hydrodynamic profile of the hydrofoil, using an asymmetrical NACA 63-412 profile because, according to some authors, it is the one that requires the lowest speed for the hull of the vessel to lift off from the water. For a better understanding of the profile, the meaning of each of the numbers that make it up is indicated: (63) Series number; (4) Position of agreement in which the maximum thickness is found; (1) Design lift coefficient in tenths of the chord (± 0.1); (2) Measurement of the maximum thickness in the percentage of the chord.
The computational simulations were carried out using STAR-CCM+ to determine the lift and drag coefficient at different angles of attack, calculating the respective force averages.
Table 4 shows the flow characteristics simulating the submerged NACA 63-412 profile.
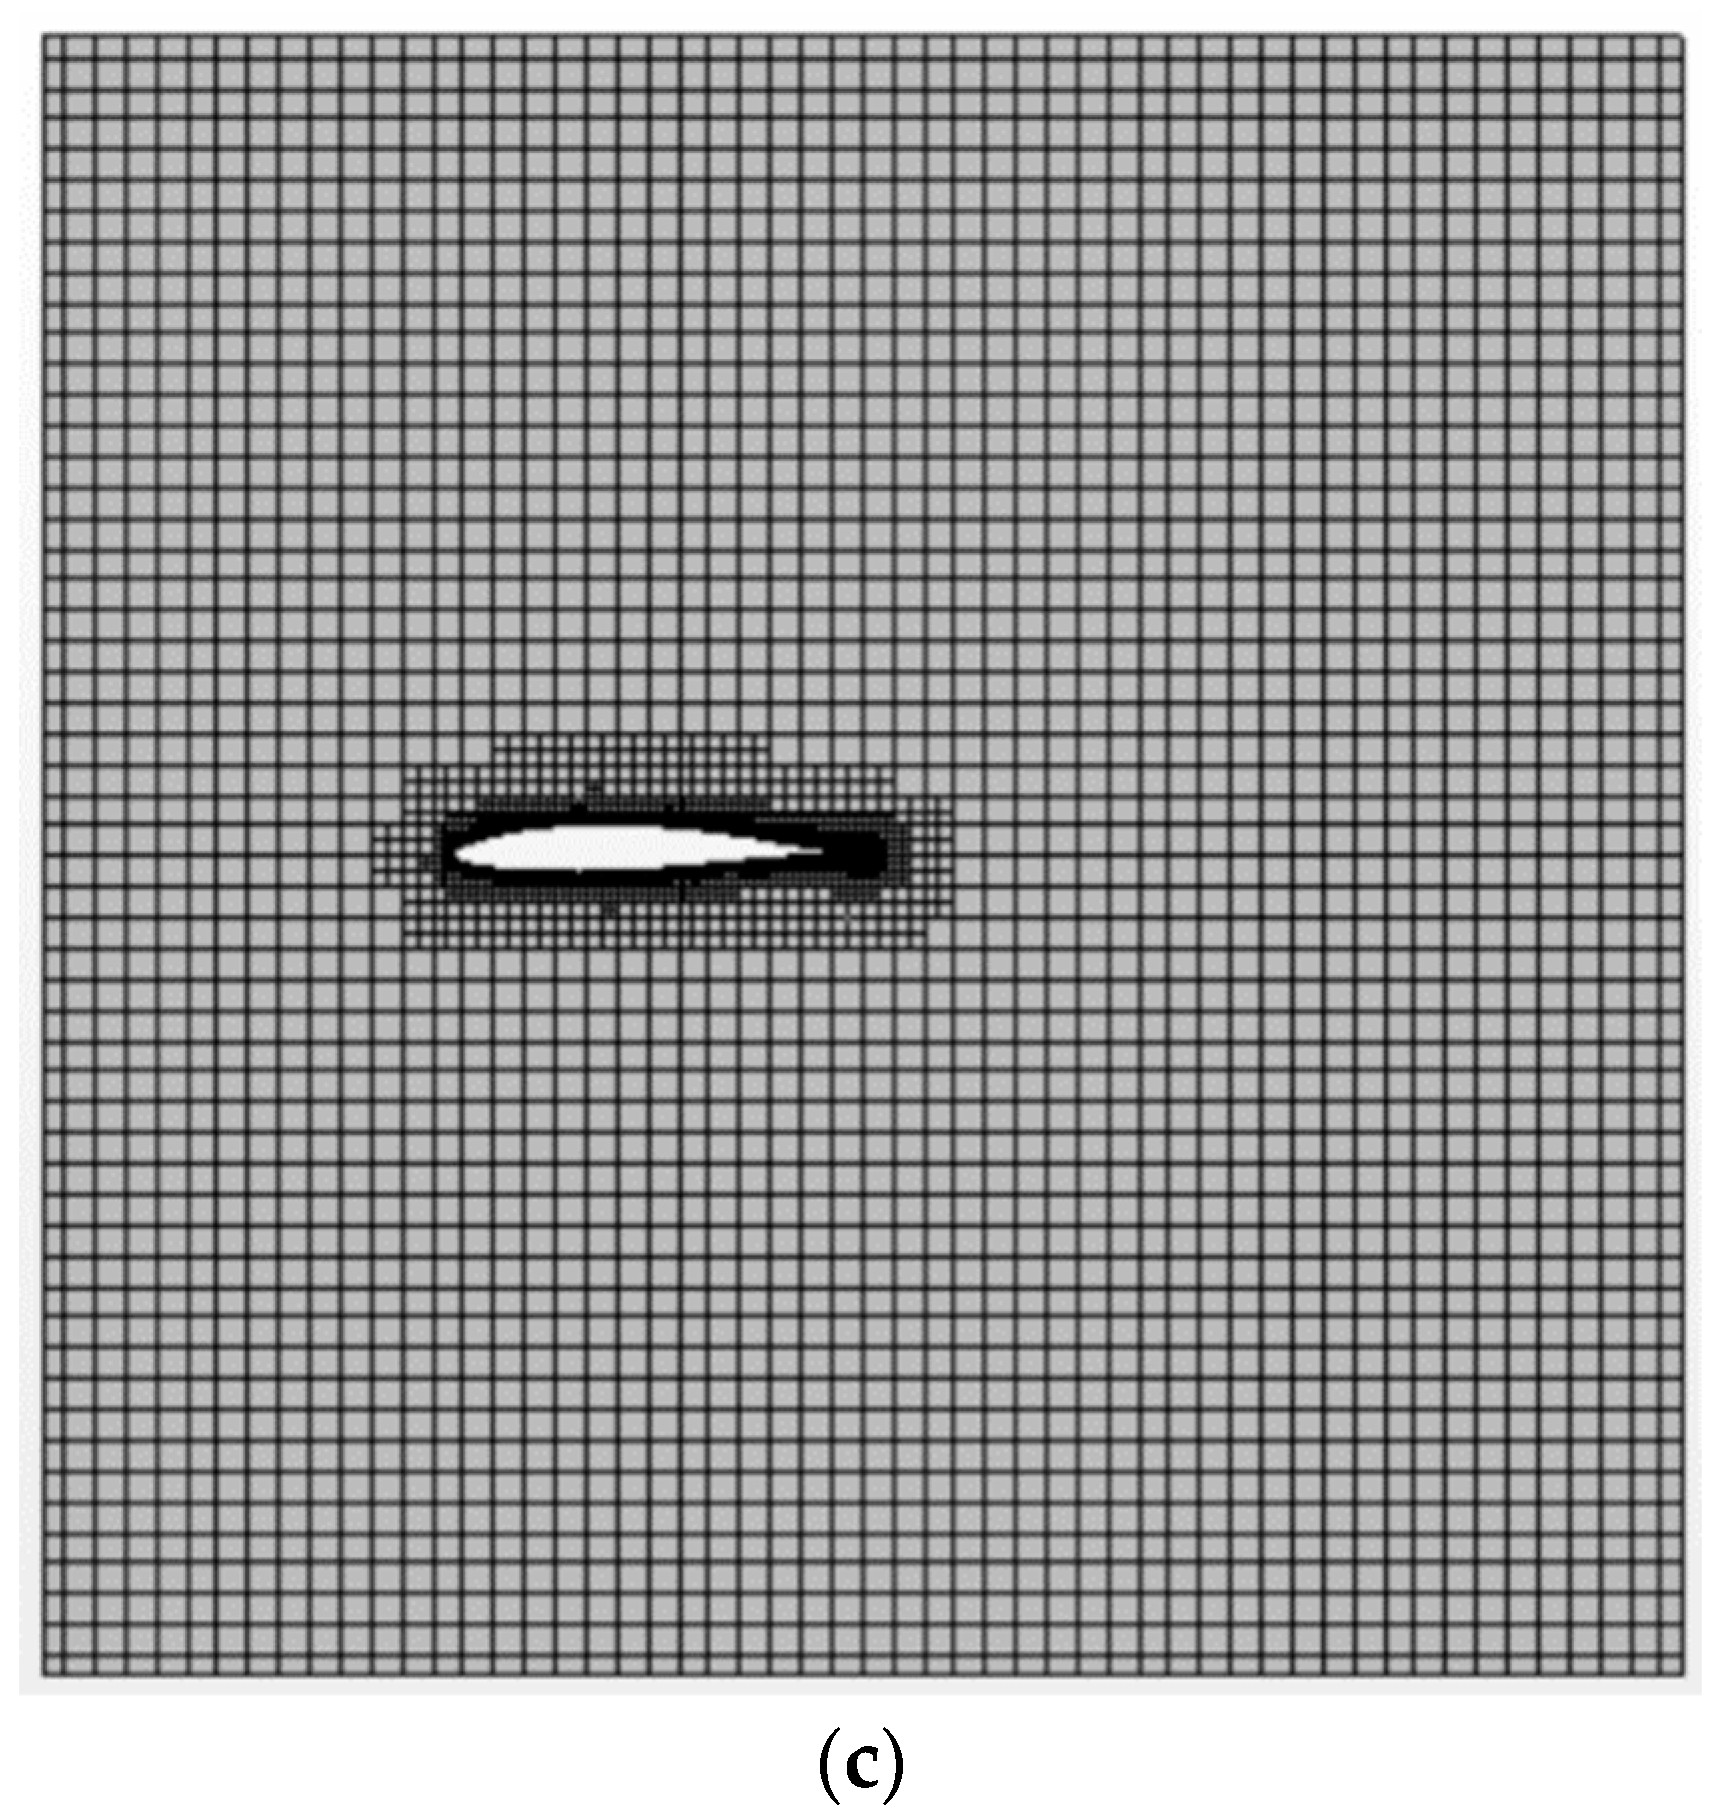
In the simulations performed, the profile has a chord of 200 mm and is immersed in a square domain (4 chords per side). From the leading edge of the profile to the start of the domain there is a distance of 1 chord, while from the trailing edge of the profile to the end of the domain there is a distance of 2 chords. This distance is more significant as it develops the wake generated by the profile. In the vertical direction, the profile is in the middle, so it has two chords of distance to the upper edge of the domain and the same distance to the lower edge.
For the numerical analysis, the flow is considered to move from left to right, perpendicular to the left side of the domain. For the boundary conditions, "inlet" is used for the left edge of the domain and the top and bottom edges, while "outlet" is used for the right edge of the domain. Meshing is performed with a mesh size of 0.1 m for the whole domain and a refinement around the profile with a mesh size of 0.003 mm, up to ten elements, to obtain results with lower uncertainty. Regarding the specific profile, it is considered a "wall" and in a "no-slip" condition (
Figure 6).
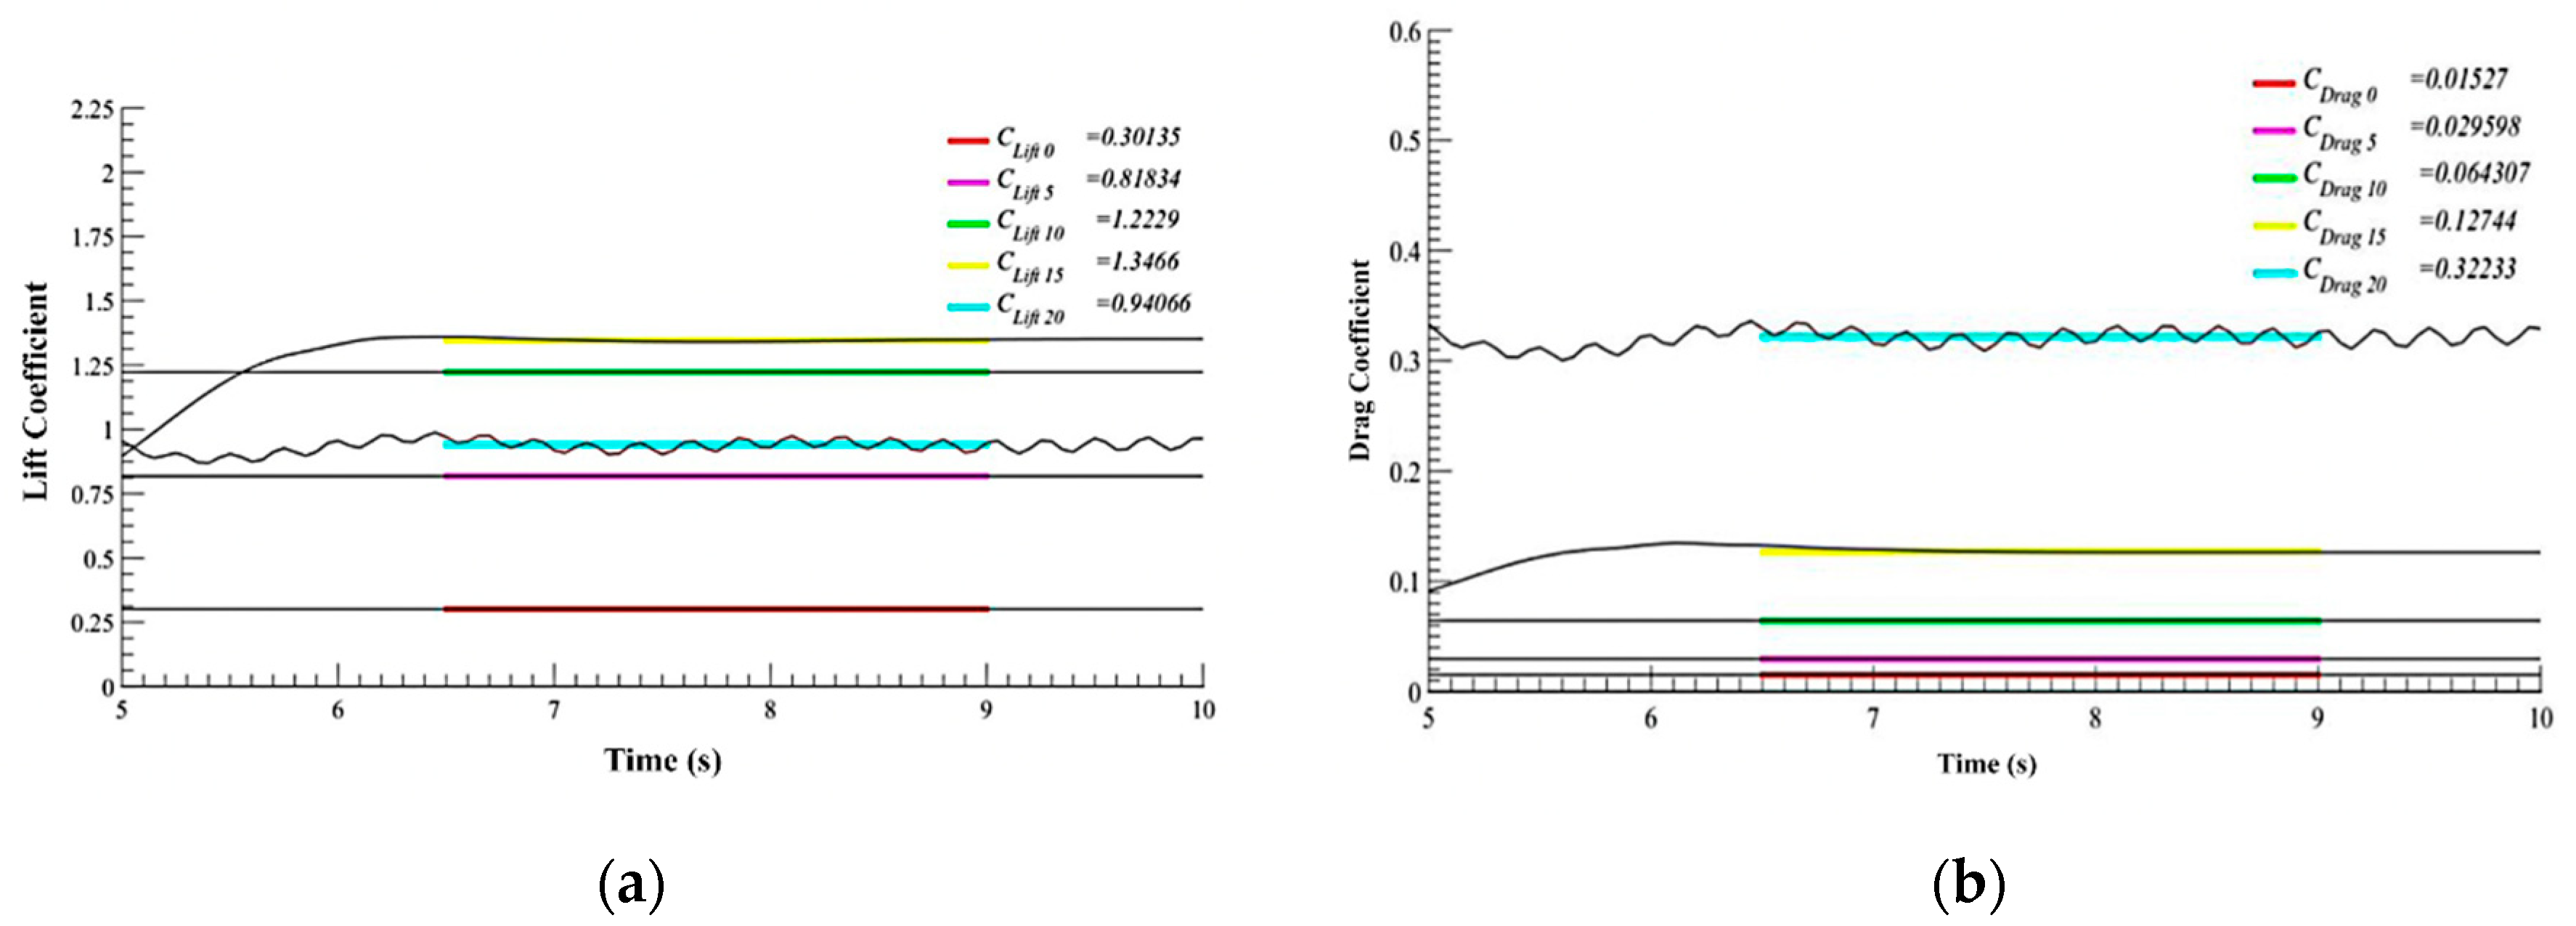
A series of 2D numerical simulations were carried out to obtain the lift and drag coefficients, maintaining the domain, flow characteristics and element size for all cases but varying the profile angle (
Figure 7).
The numerical simulations of the 3D airfoil are performed under similar conditions to the 2D ones, although with a relevant difference. For the 3D simulated airfoil, a 100 mm extrusion was performed, and a symmetry plane condition was established at the ends to avoid the wing tip vortex, aiming to vary the parameters systematically and determine the possible cause of any anomaly in the simulations.
Figure 8 shows the average lift and drag coefficients obtained in the 3D numerical simulation at different angles.
2.4. Hydrofoils
2.4.1. Design considerations
For the design of the hydrofoils and the choice of the model used in this research, the following construction guidelines were considered:
- -
The hydrofoil daggerboard could have been designed curved in the "vertical" area instead of having to join two straight elements, but this would have meant modifying the daggerboard box. Moreover, making a curved element is much more complex.
- -
The hydrofoil rudder could have been designed with a flap. However, this makes the construction process more complex, as the navigator would have an additional manoeuvre to regulate (the yacht already has enough for one person).
- -
An extra 23.8 kg of weight is added to the boat due to the weight of the new appendages, so the displacement of the "catamaran with hydrofoils" is 200 kg.
- -
The vessel's sailing speeds are considered, proposing that the ship's hull lifts off the water between 5 kn and 7 kn speed.
To maintain a controlled pitch angle and a stable "flight", it is necessary to install two hydrofoils on the catamaran, one positioned on the centreboard and the other on the rudder, on each hull, taking into account the position of the navigator to have a minimum trim angle, ideally 0°.
3.2. Geometric design and selection oof hydrofoil models
The development of hydrofoil geometry is an iterative process. The first geometric approximation is made from area estimates, lift and drag coefficients, vessel data (weight and sailing speeds) and the mathematical expression (1):
Where represents the density, is the “lift” coeffcient at a given angle, V es la flow velocity, and A is the area.
Based on the above calculation, 3D models of the catamaran appendages were designed for numerical analysis next to the hull, at a speed of 7 kn and with the selected mean meshing.
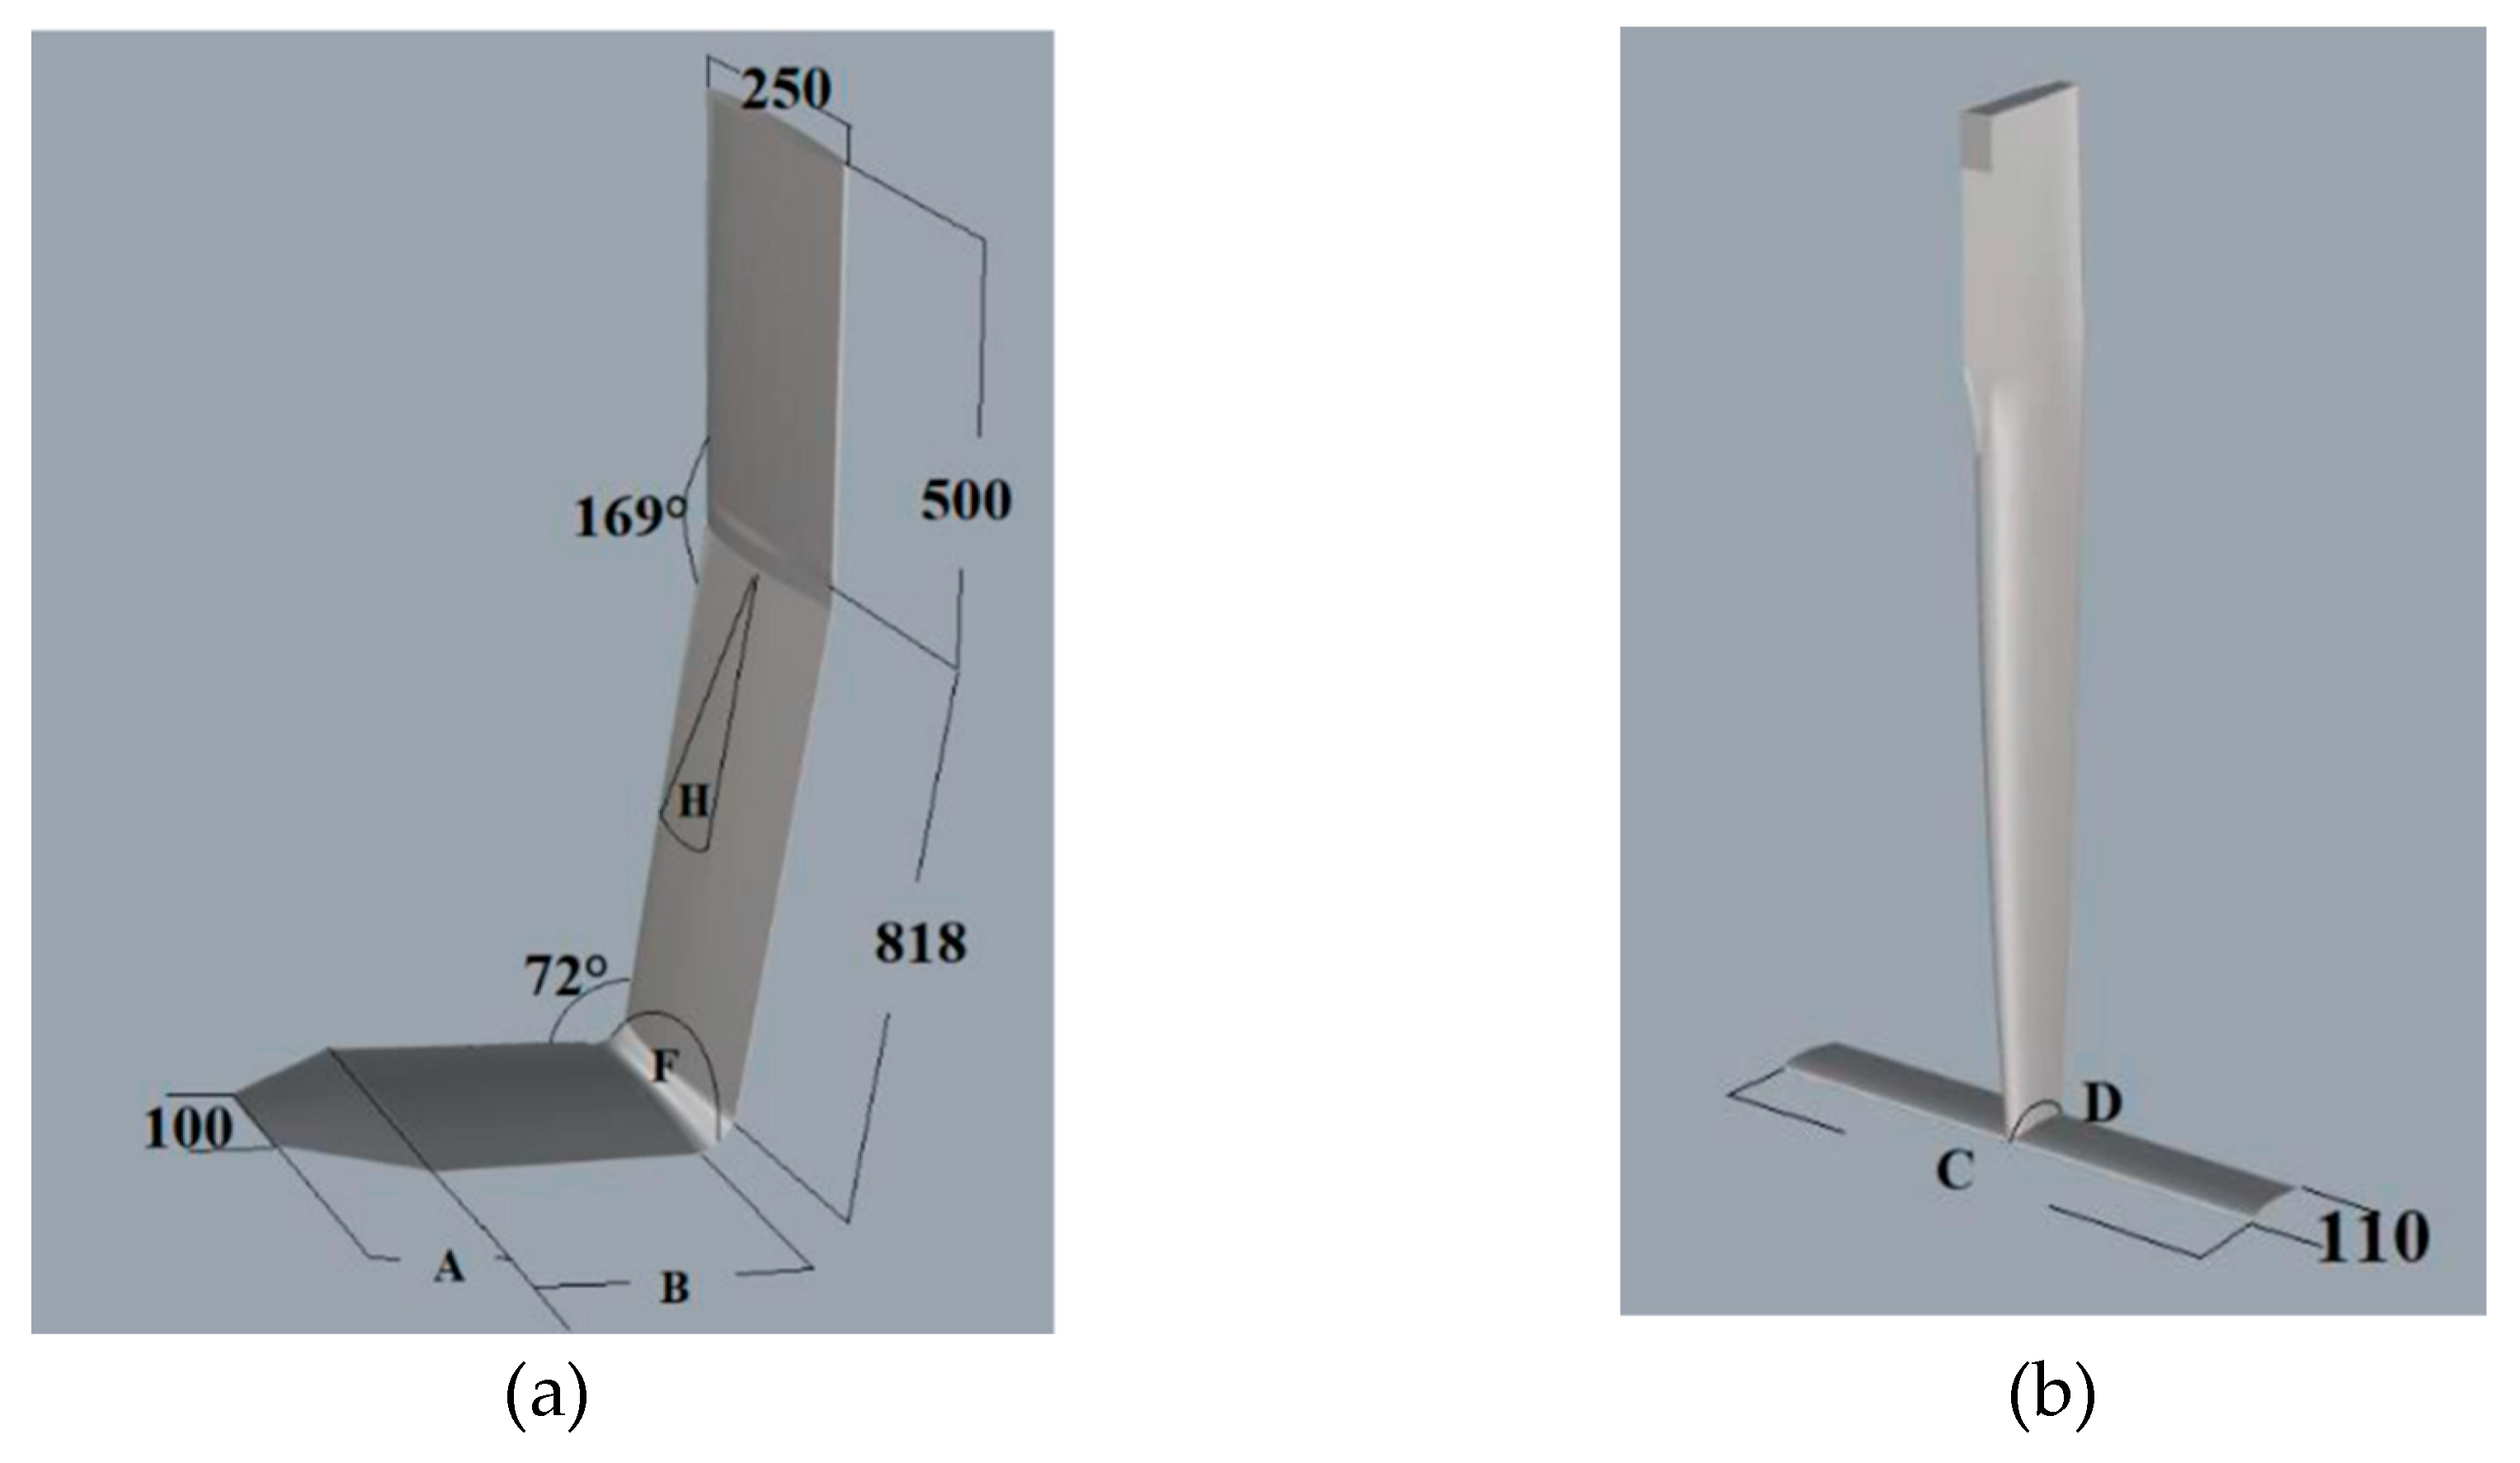
The first of the hydrofoils will be positioned in the daggerboard box of the vessel (
Figure 9a). For this case, an L-Foil is selected, with a reduced area at the end to reduce the wing tip vortex. The angles F and H, which represent the rotation of the "horizontal" element concerning the "vertical" piece and the rotation of the entire appendage concerning the hull, respectively, are modified.
The next appendage designed is a T-Foil, positioned at the lower end of the rudder blade (
Figure 9b). It has a rotation D, representing the horizontal element concerning the vertical. It is indicated that the supplementary angle D is used to clarify the rotation.
Table 5 summarises the measurements of the proposed hydrofoils, referred to as "models" (hydrofoil-thymone and hydrofoil-orange) and analysed at 7 kn.
Table 6 summarises the information obtained in the numerical simulations for the different hydrofoil configurations, using a symmetry plane and a DFBI condition with free displacement for heave and rotation for pitch. The displacement is considered positive in the upward heave direction, and the pitch rotation has a positive value when the vessel is heaving.
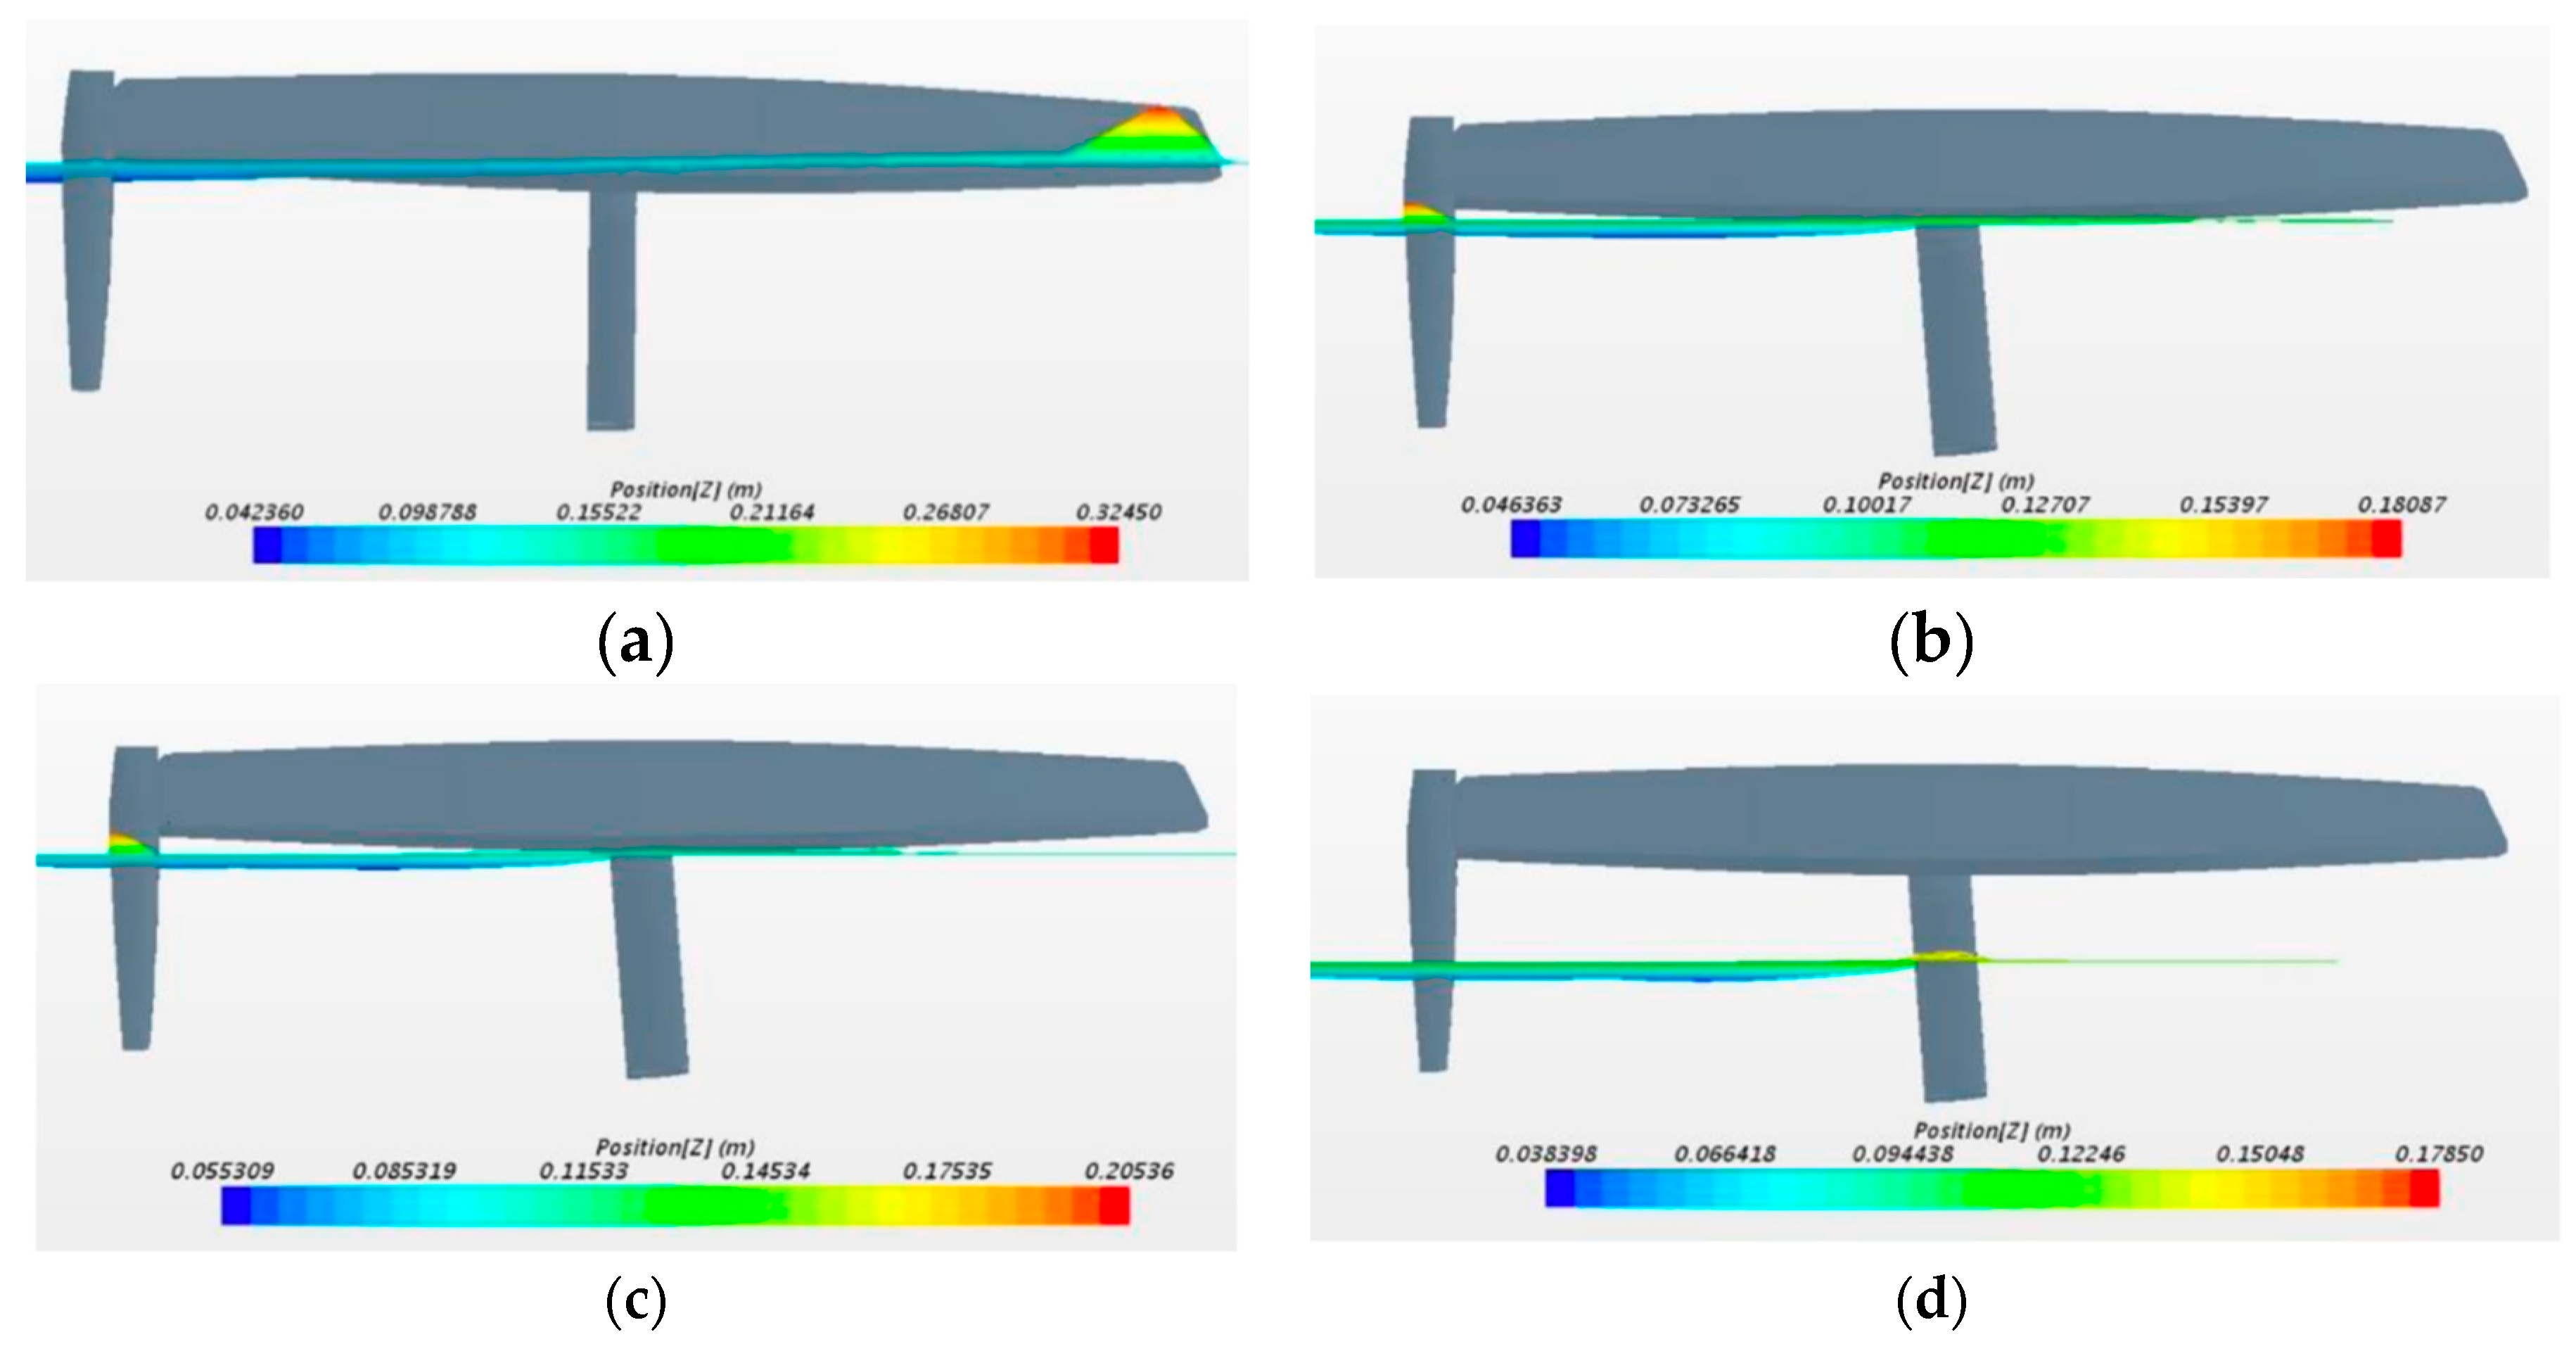
Figure 10 shows the "flight" condition of the vessel with each designed model, where the wave height is shown.
Once the simulation results have been obtained, model 4 is selected. This assembly generates the least resistance to forward motion. Different speed variations (3, 5, 7 and 9 kn) and modifications are made to the location of the Longitudinal Centre of Gravity (LCOG), shown in
Table 7.
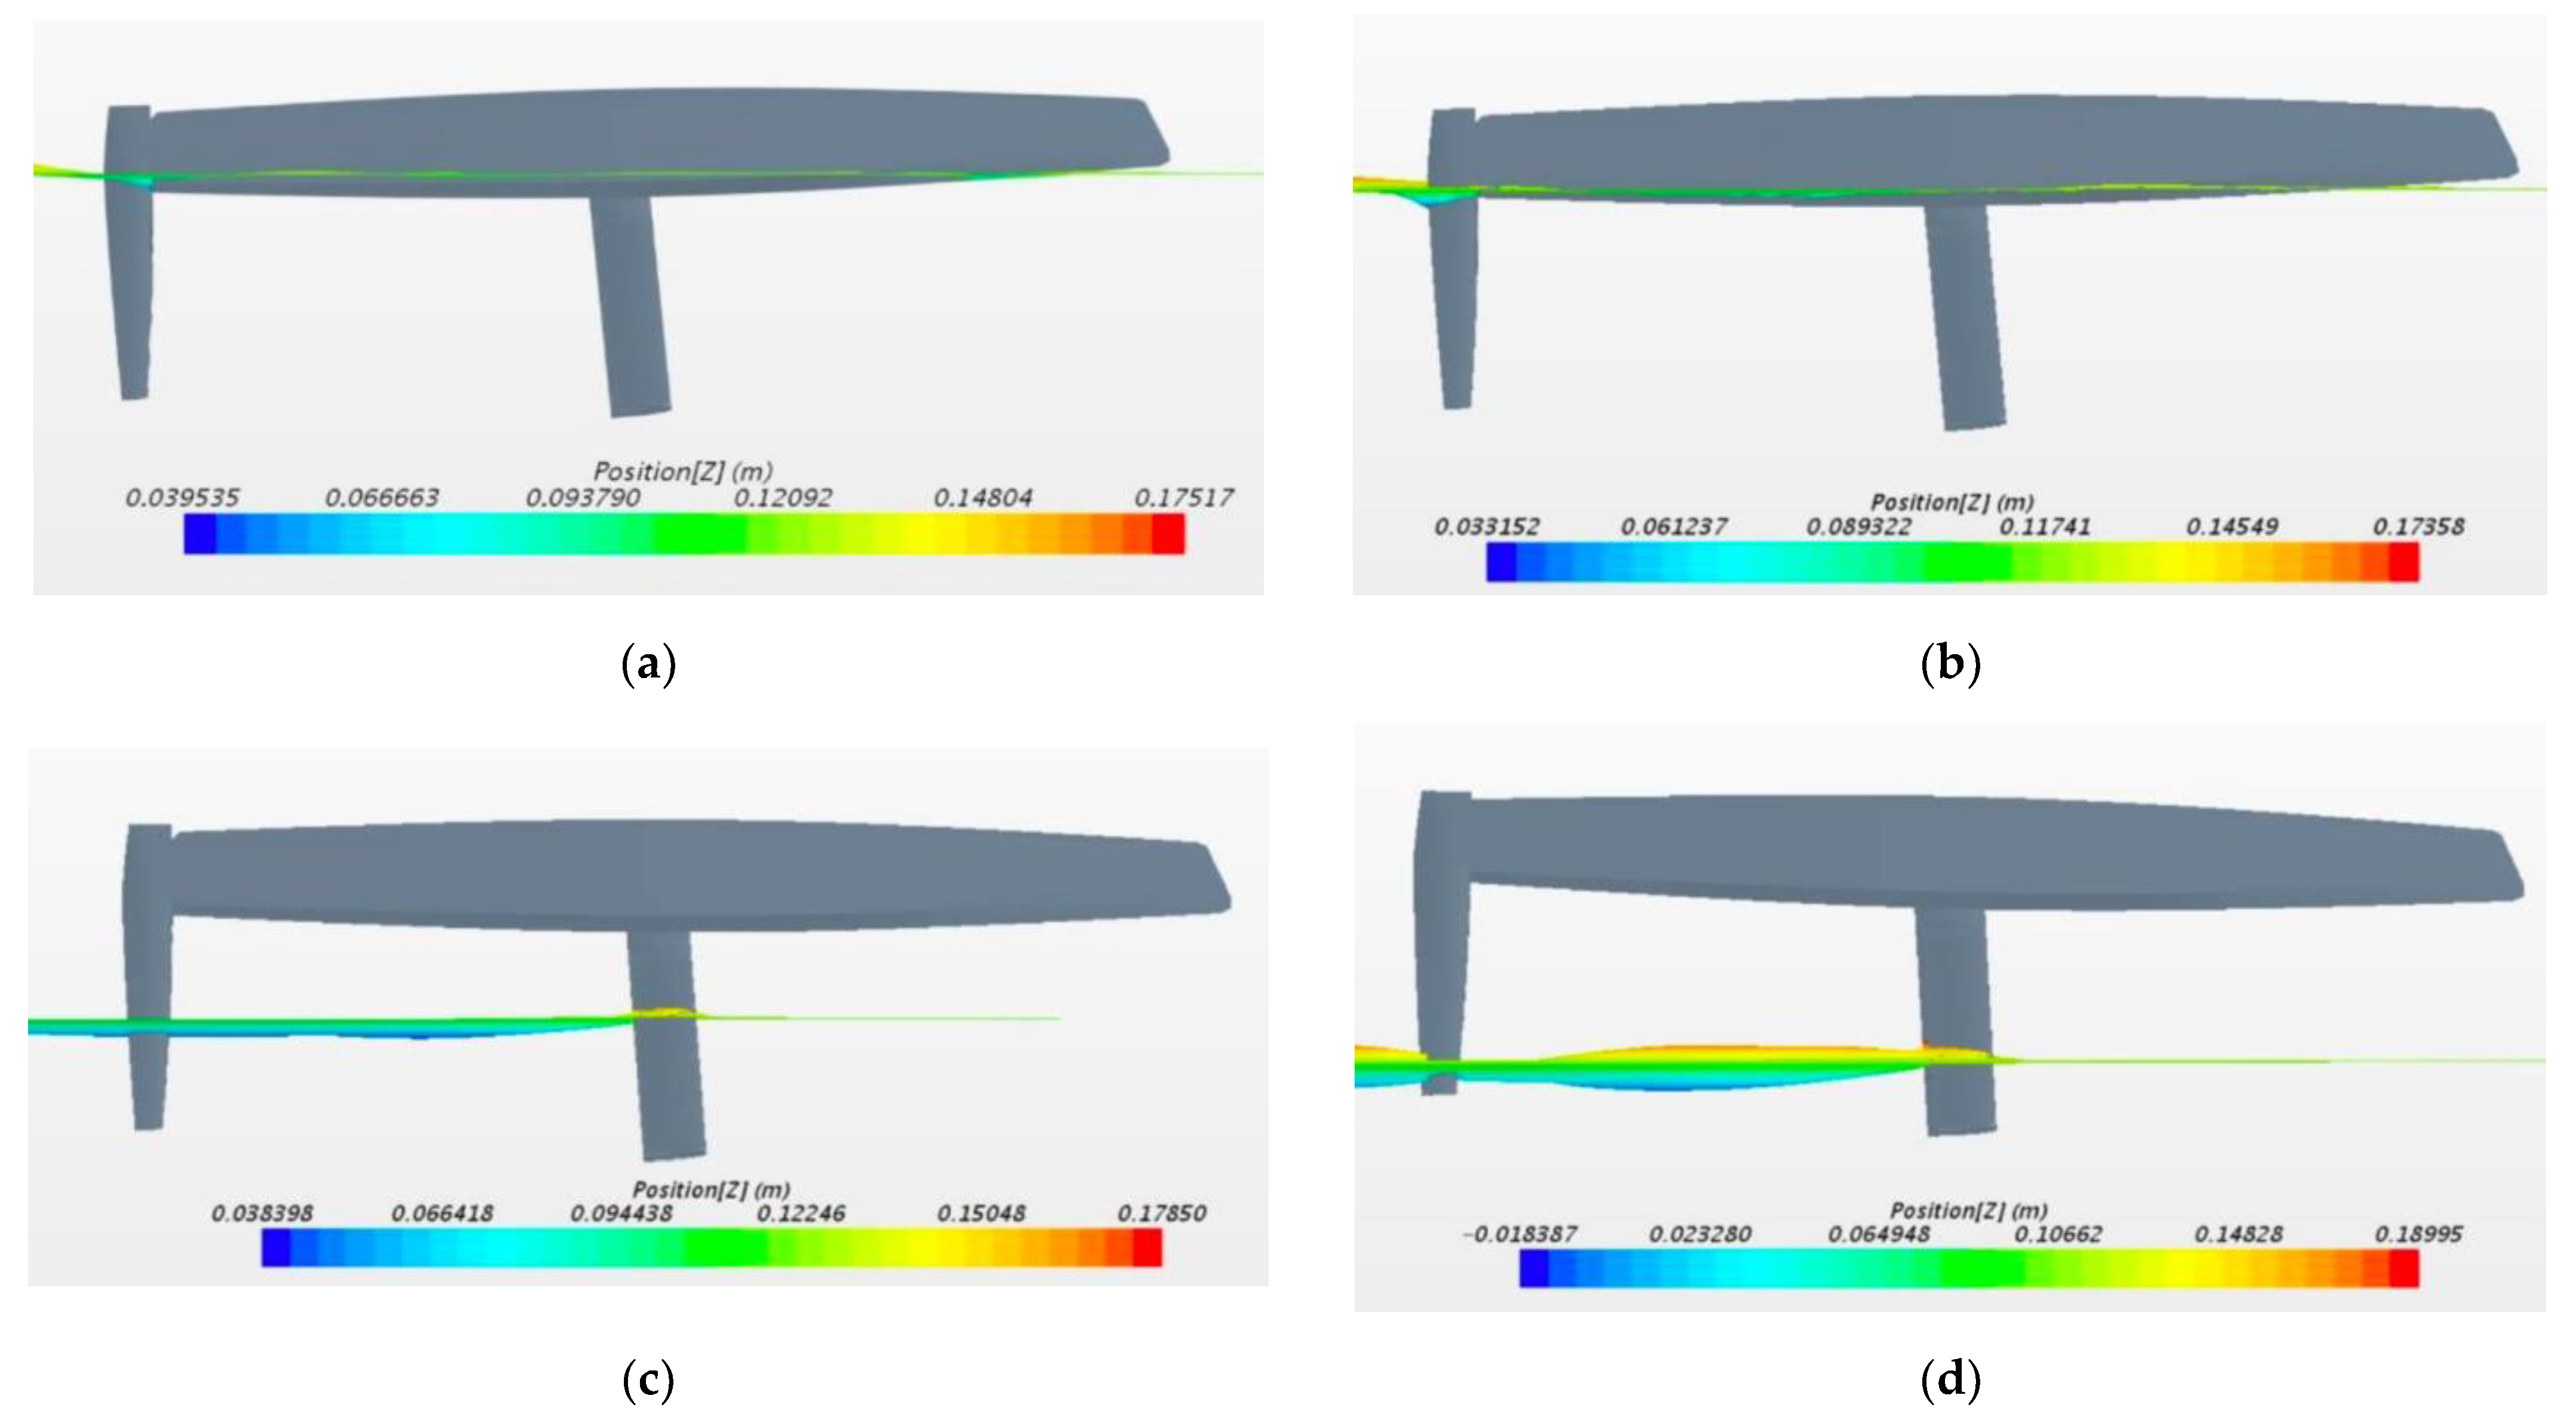
Figure 11 shows the displacement and rotation of Model 4 at different speeds, including the wave height.
2.5. Drag
The drag is calculated by numerical analysis with DFBI, considering that the boat will have freedom of movement for heave and pitch. For this reason, the longitudinal centre of gravity's position is varied to obtain trim angle values close to 0º.
A configuration without a plane of symmetry as a boundary condition must be used to predict the drag on a multihull. However, simulations with and without a plane of symmetry are carried out to compare the variation of the results, always considering that the closest to the actual value will be the simulation with the entire hull.
2.5.1. Drag of the traditional catamaran
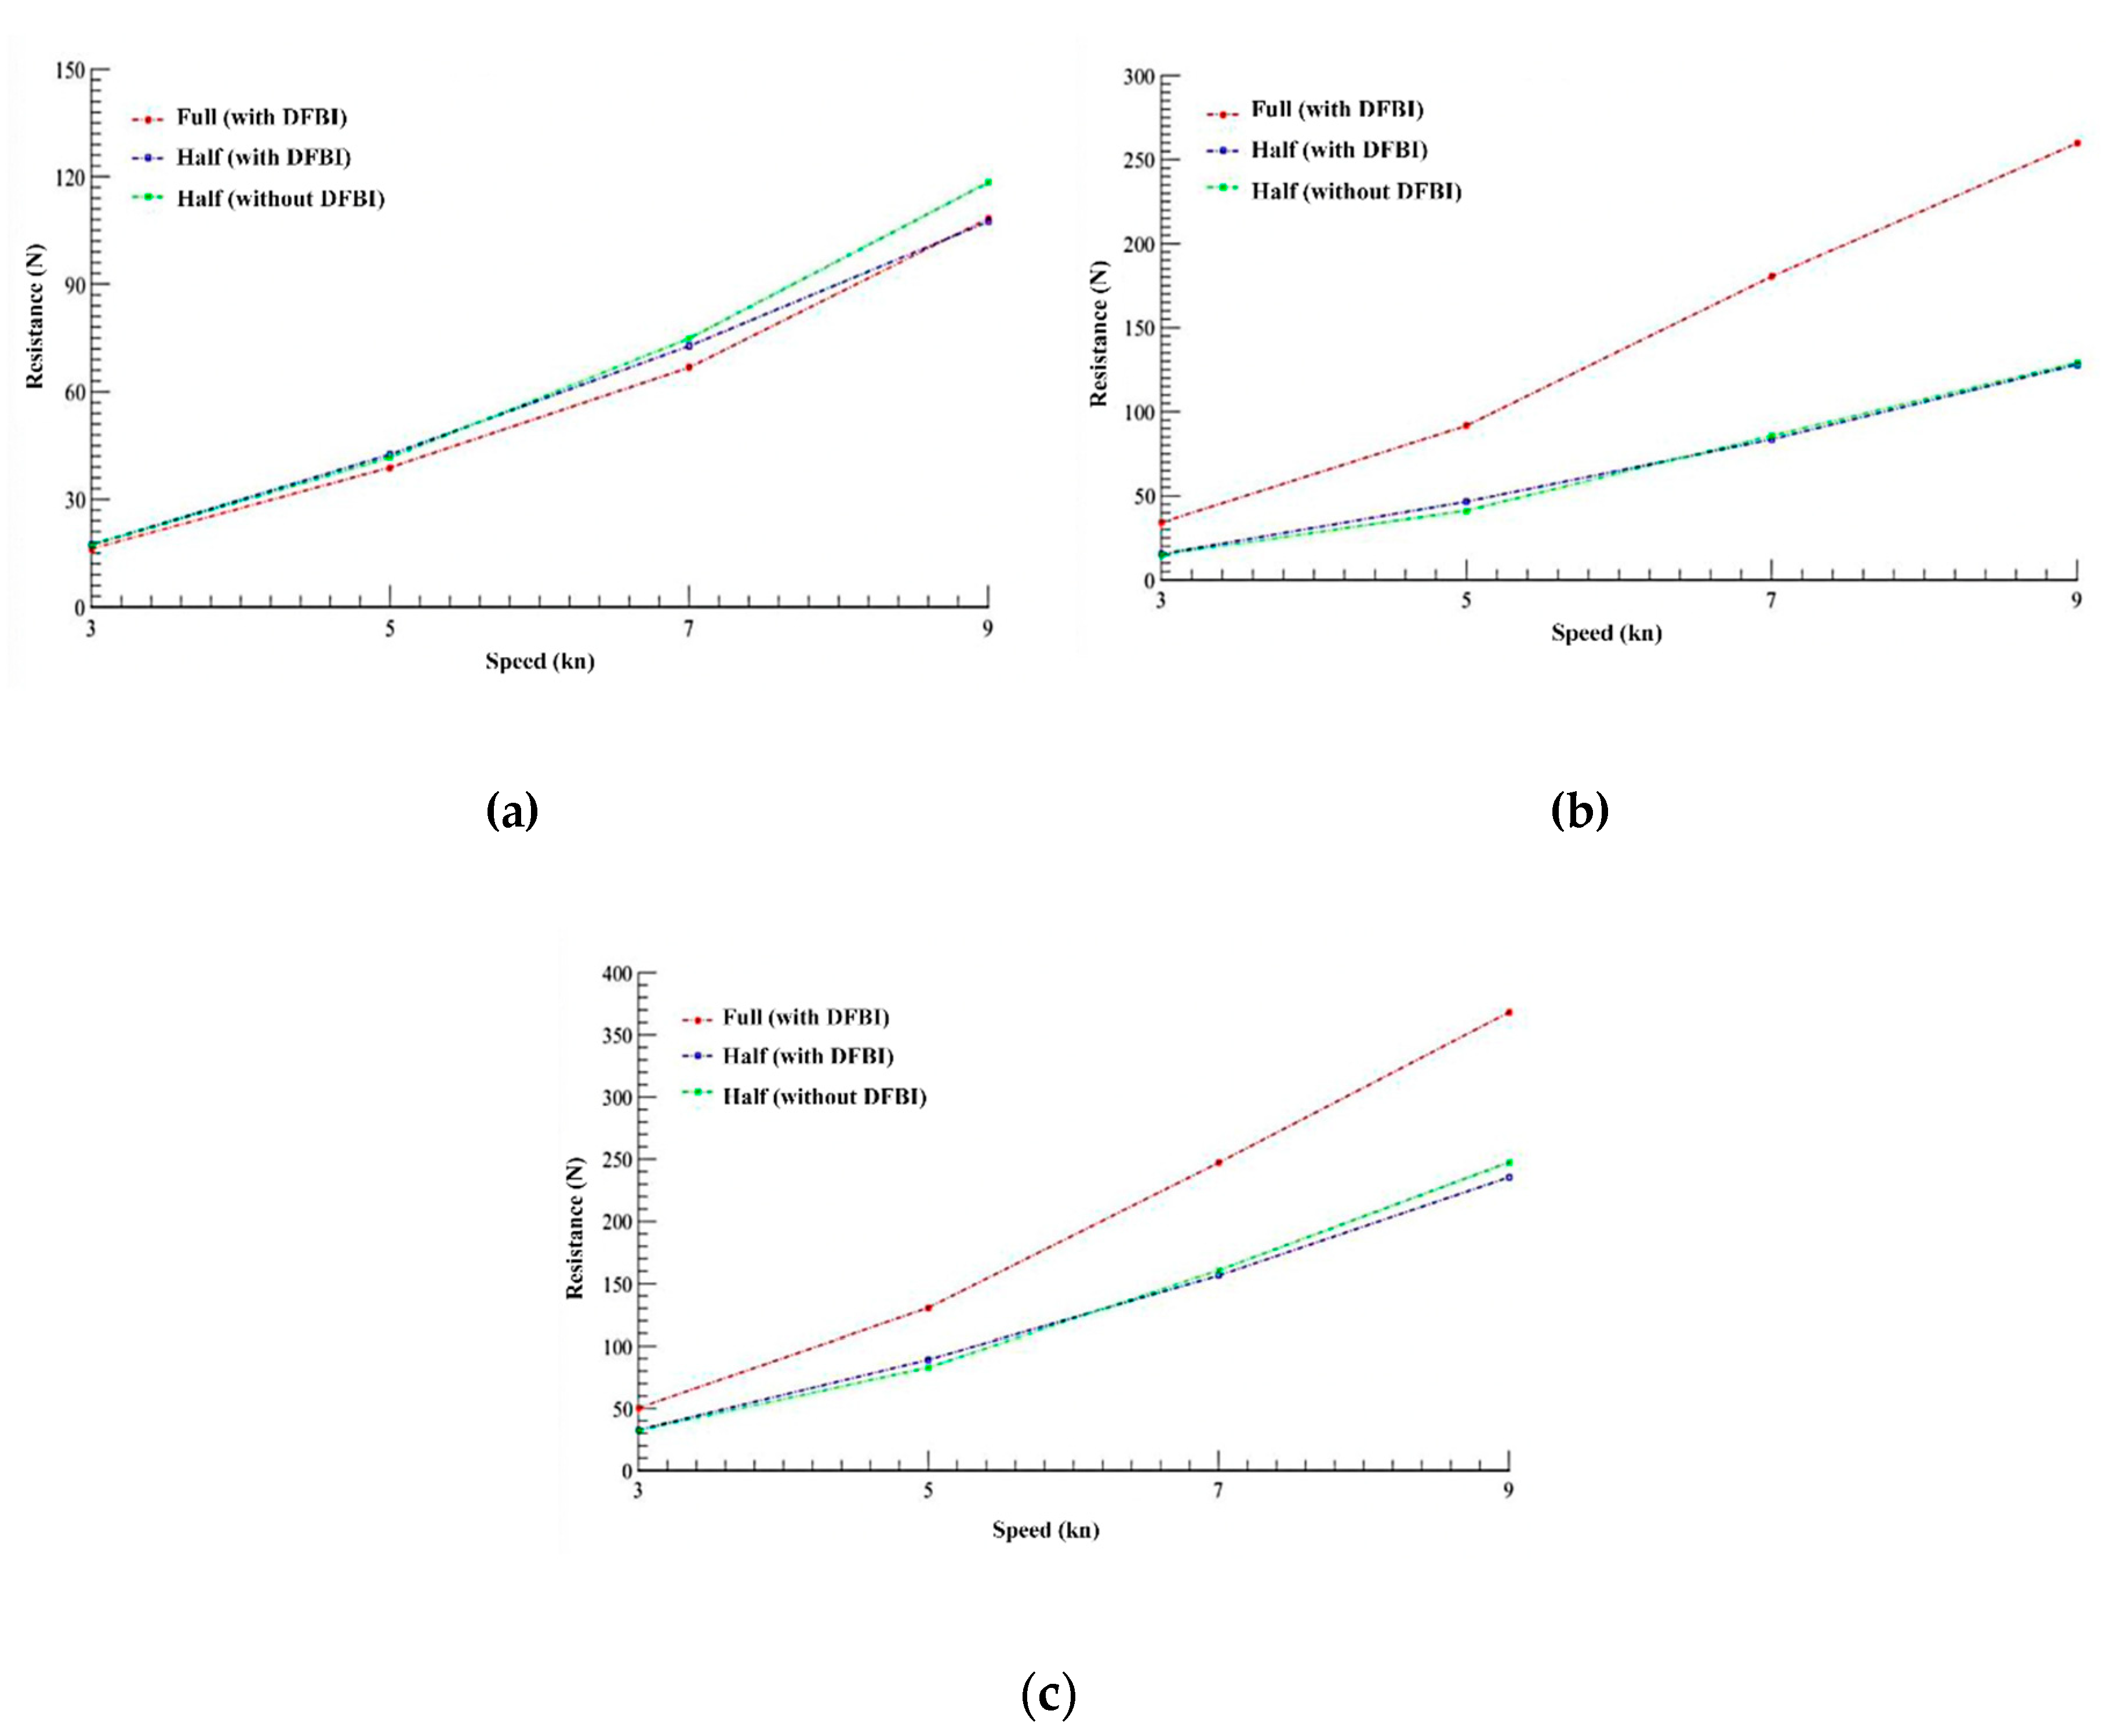
The drag of the "traditional catamaran" at different speeds was determined using three different configurations: complete with DFBI, half with DFBI and half without DFBI. The averages of frictional resistance and pressures obtained from the meshing were used to get the total resistance results shown in
Figure 12.
Once the total resistance has been obtained, a qualitative comparison is made between the simulations.
Figure 13 shows the numerical simulation for the three configurations: a) complete with DFBI, b) half with DFBI, and c) half with DFBI.
2.5.2. Drag of catamaran with hydrofoils
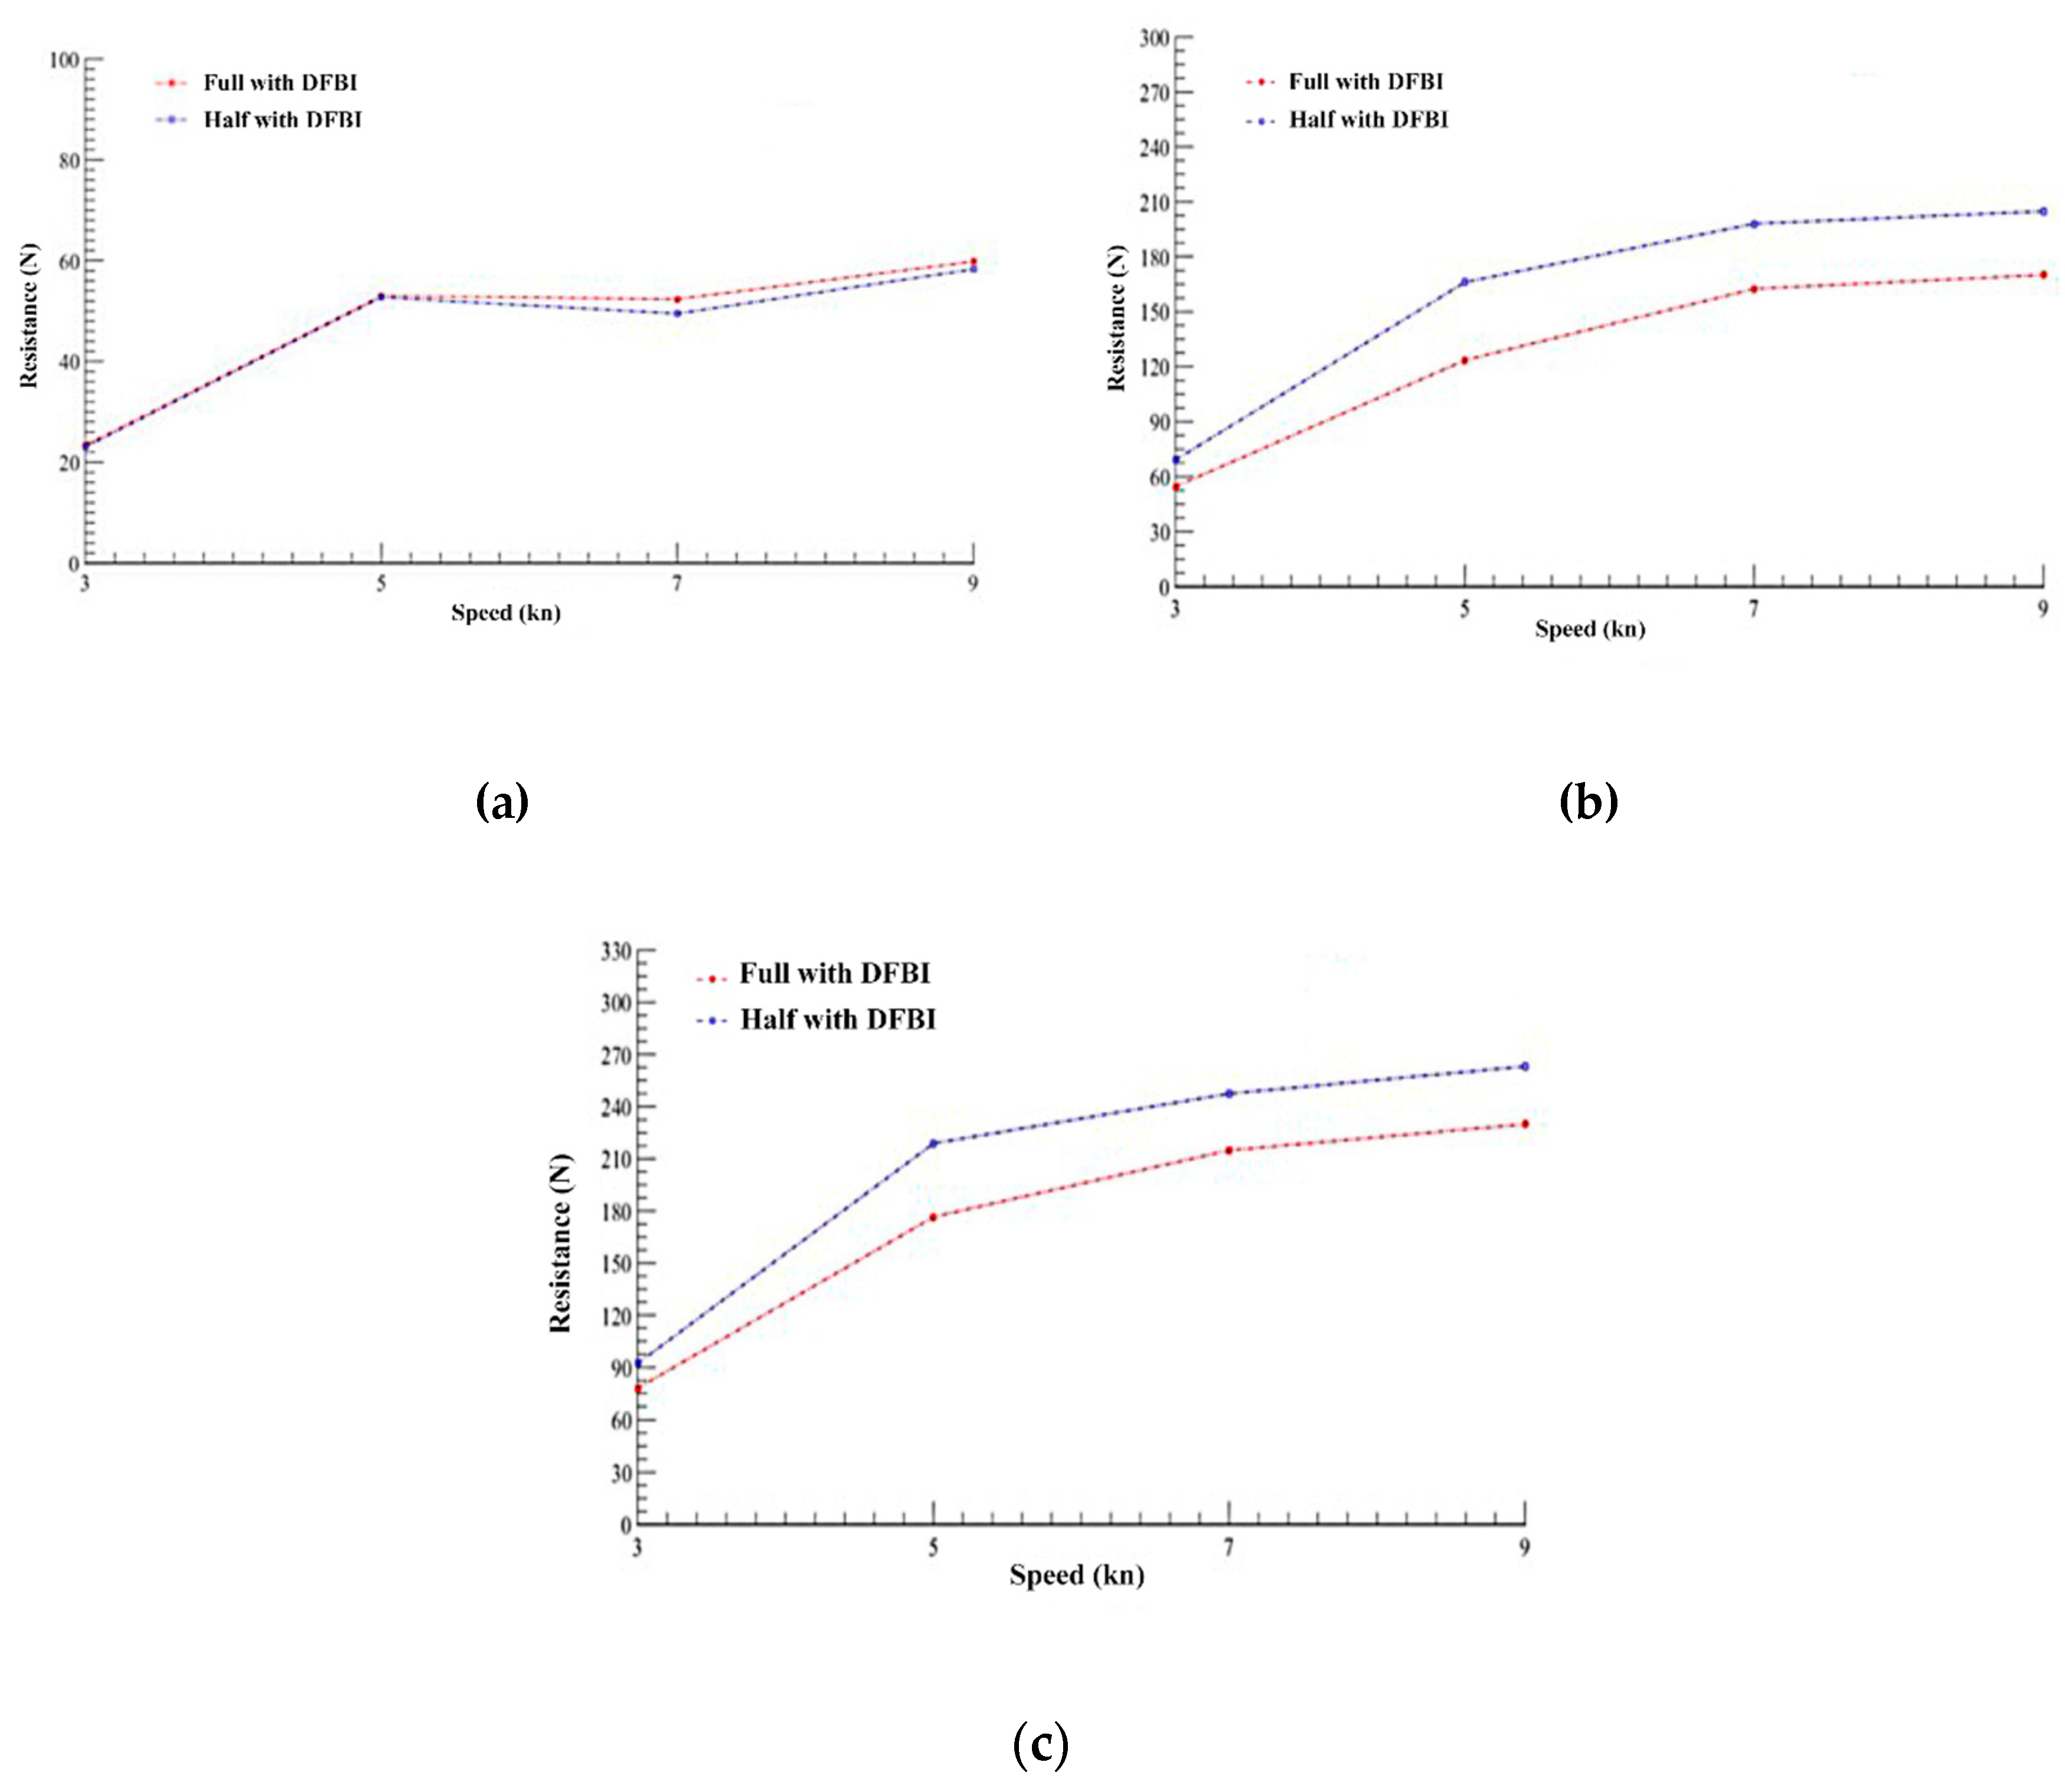
Once the resistance of the "traditional catamaran" has been determined, the drag of the "catamaran with hydrofoils" is defined at different speeds, based on two different configurations: a) complete with DFBI; b) half with DFBI. It is worth noting that, as in the traditional case, the average frictional resistance and pressures obtained in the meshing are used (
Figure 14).
Regarding the results obtained on the friction and pressure resistances, it is essential to remember that at 5 kn, the "catamaran with hydrofoils" is still sailing in a similar condition as the "current catamaran", at 7 kn the "catamaran with hydrofoils" is already able to detach the hull from the free surface, keeping only the hydrofoils submerged in the water. Subsequently, the resistance values for each speed and corresponding configuration are added up, and the total resistance is determined for each case.
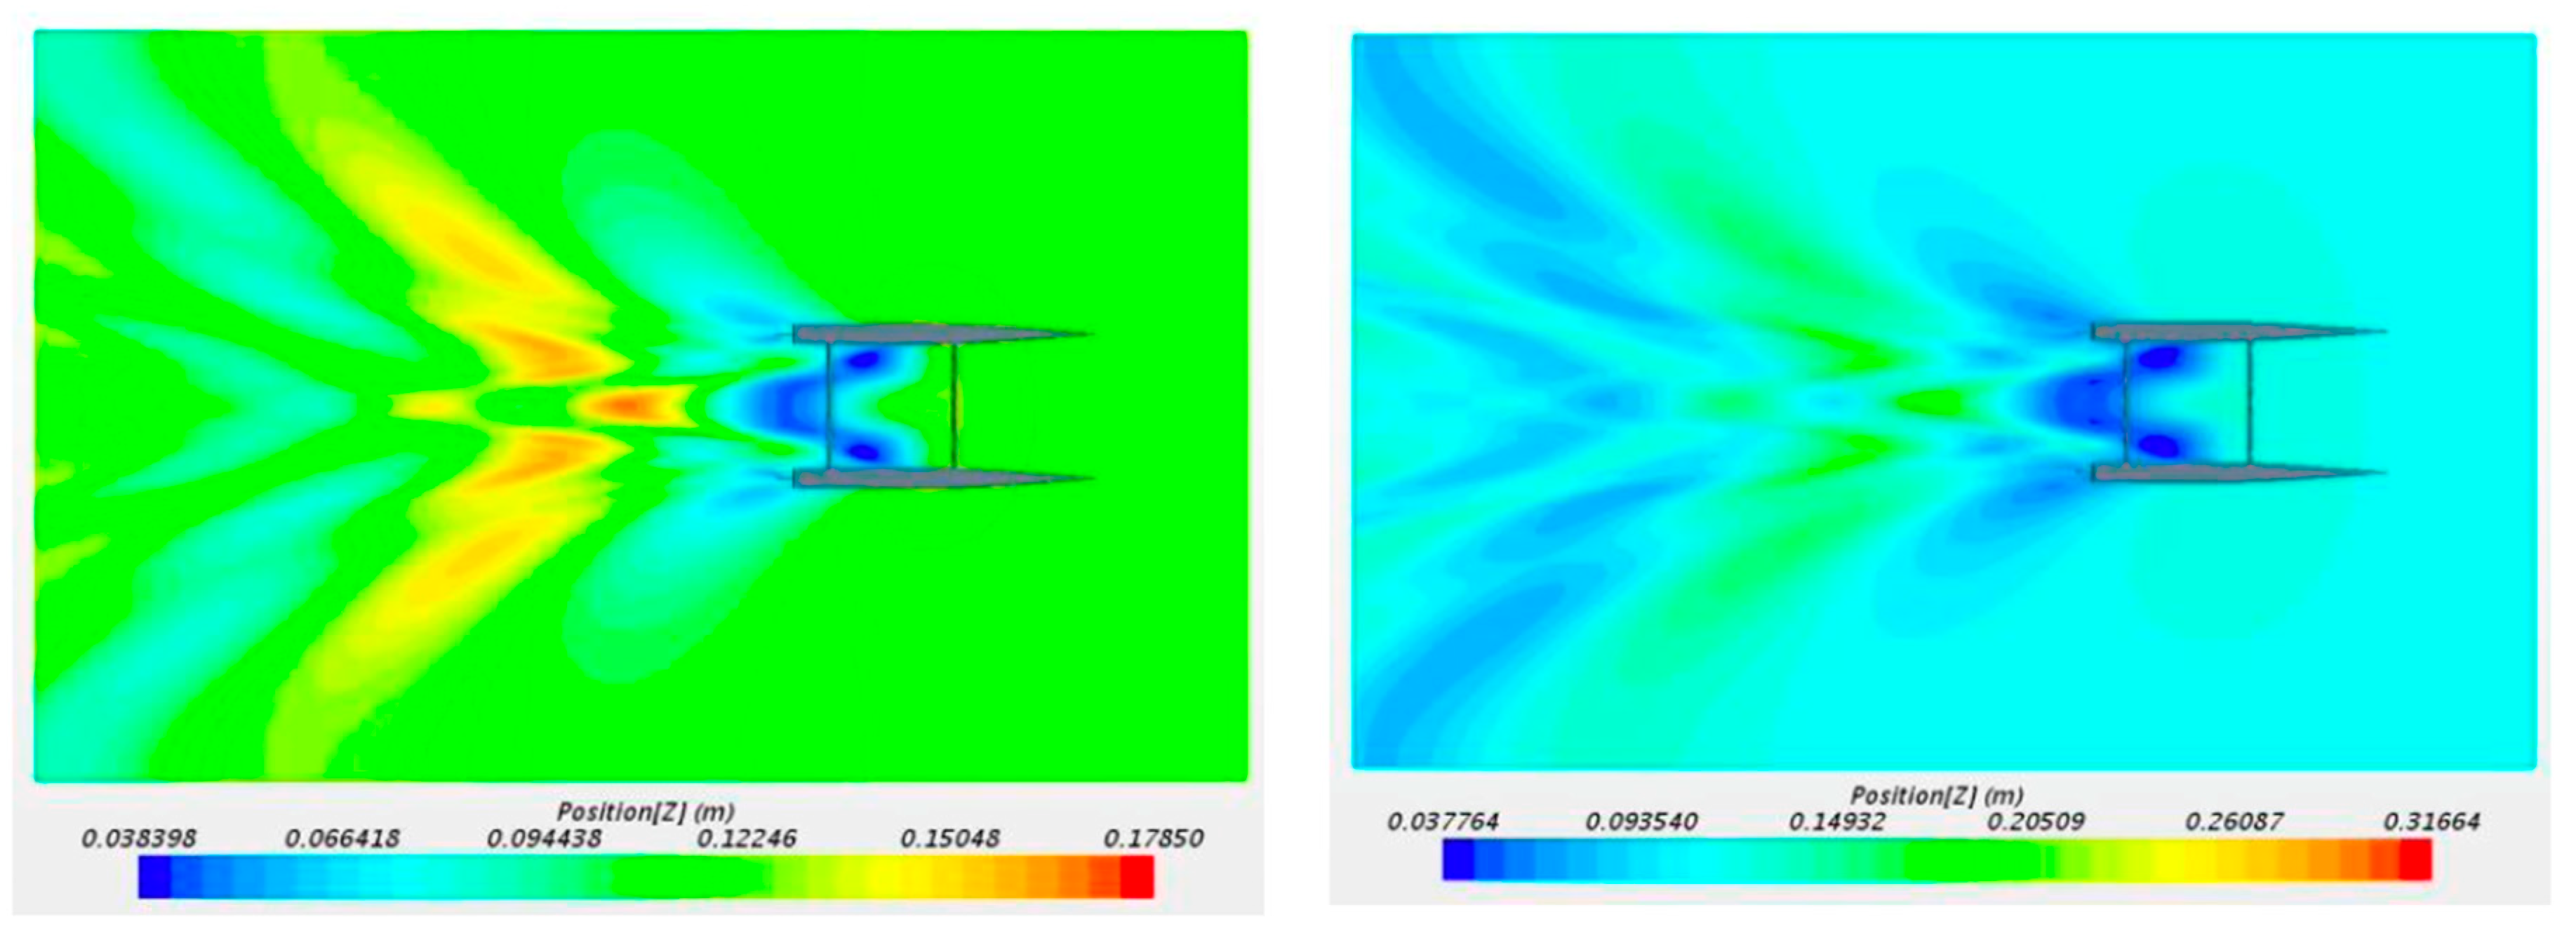
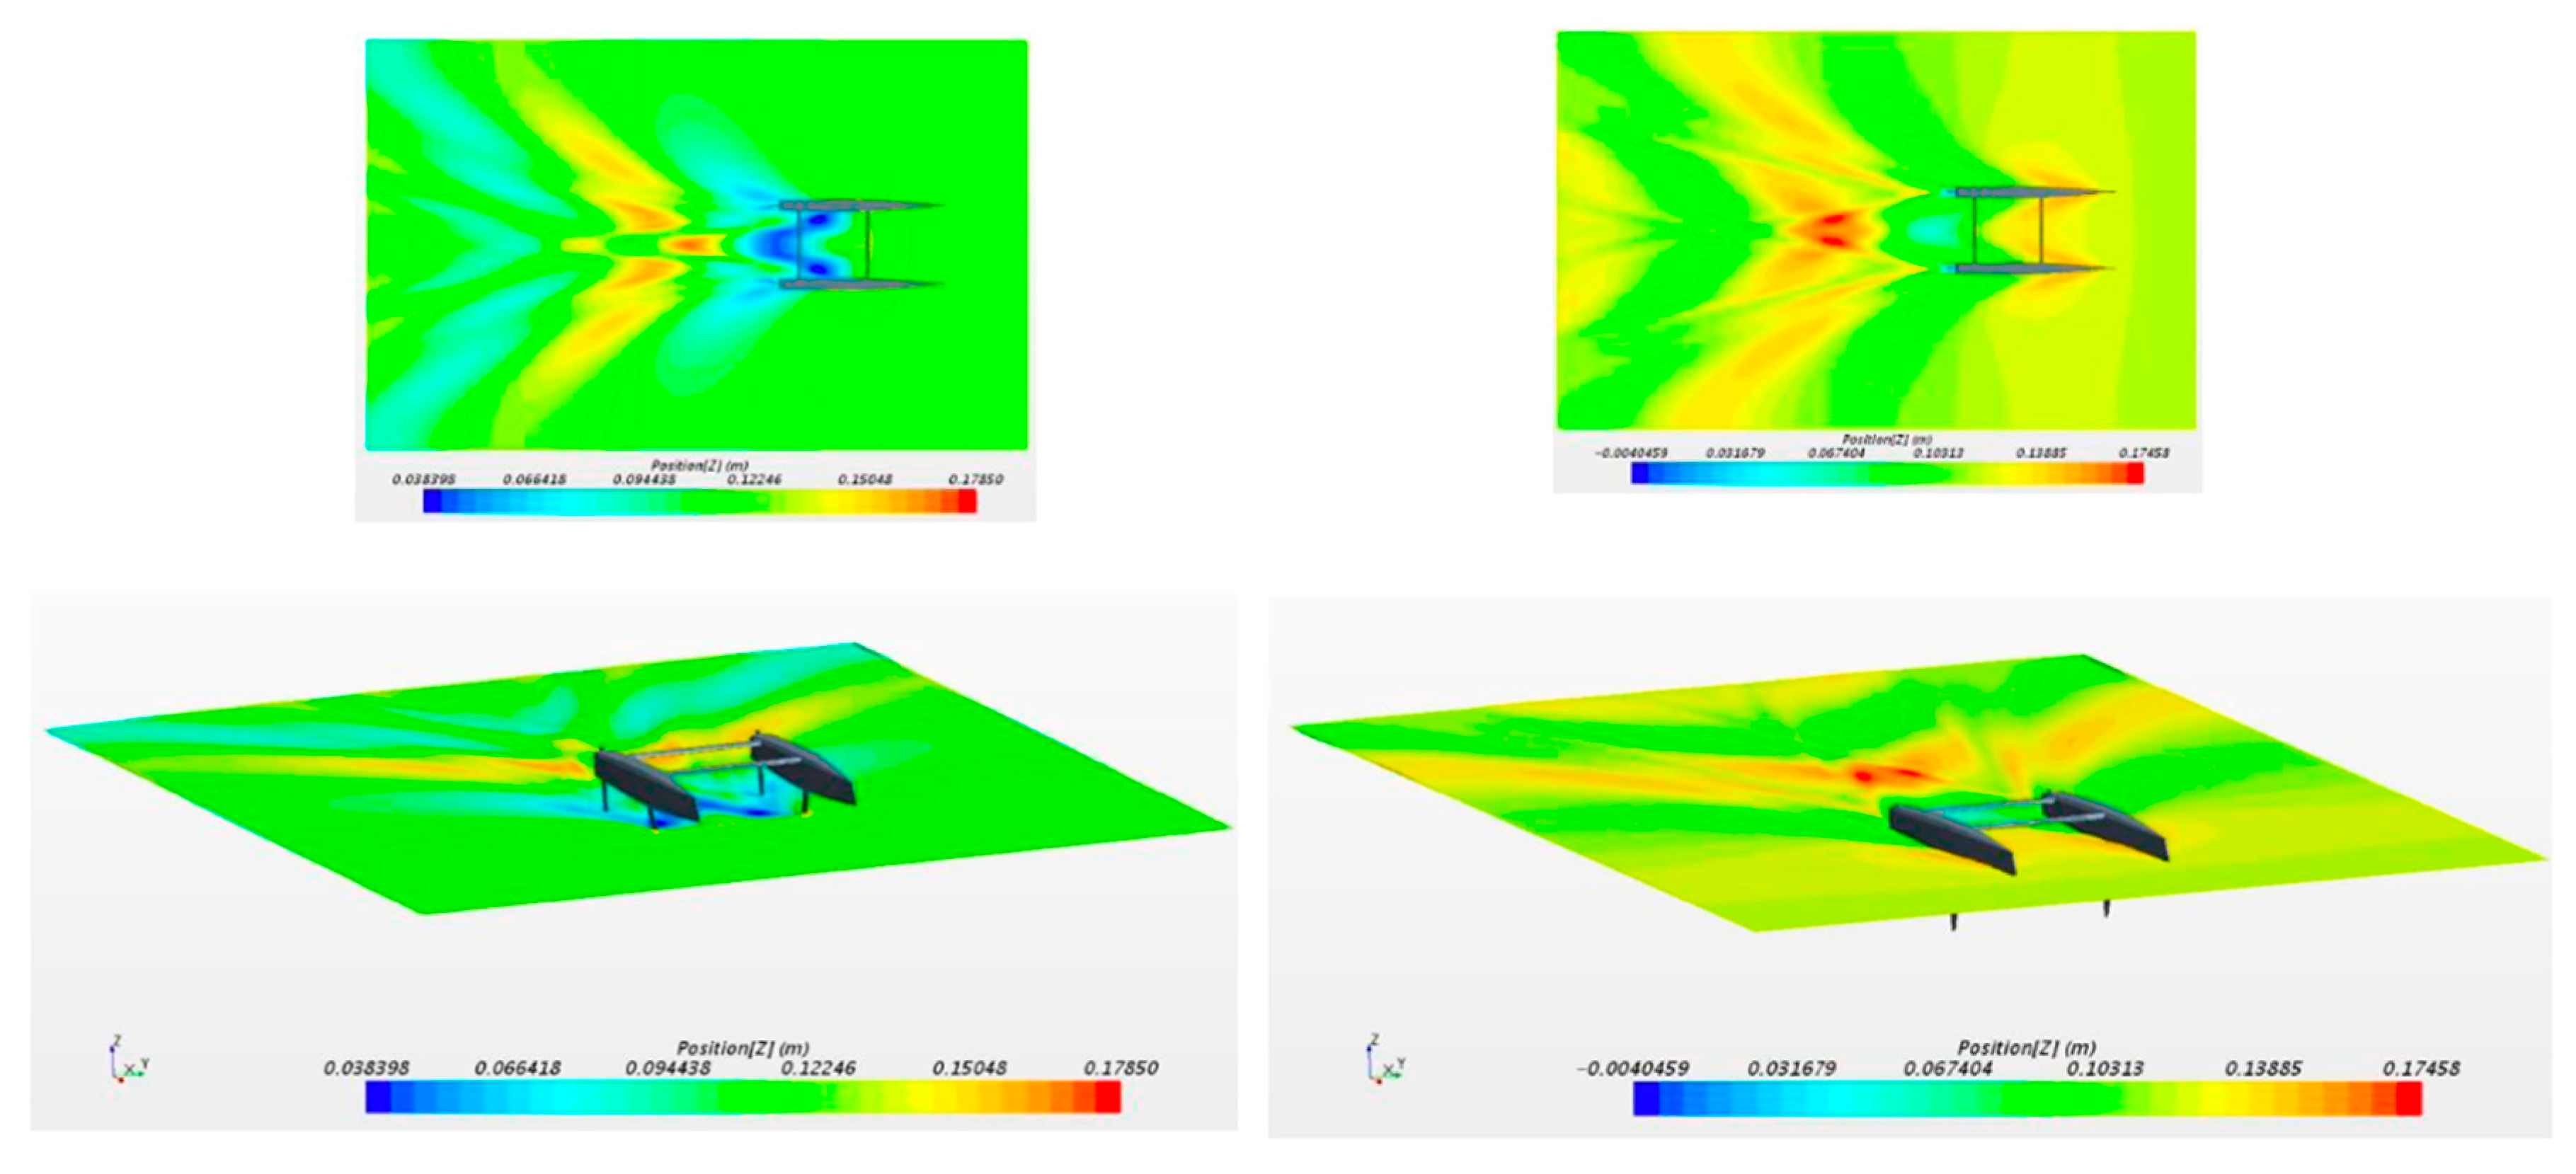
Figure 15 shows a qualitative comparison of the results obtained between the two configurations. On the left is the "catamaran with hydrofoils", and on the right is the "traditional catamaran" (without hydrofoils).
3. Discussion
A percentage comparison was made between the results obtained from the complete simulation of the traditional catamaran with DFBI concerning the rest of the configurations.
Table 7 shows that the variation in frictional resistance between the different designs is less than 10%, which offers the stability of the values obtained only concerning this type of resistance. Regarding the resistance due to pressure, percentage differences of approximately 50% are observed.
On the other hand, when reviewing the percentage differences between the catamaran with complete hydrofoils with DFBI and half with DFBI, it is observed that the frictional resistance averages remain pretty similar between both numerical simulations. In contrast, for the resistance due to pressures, percentage differences of over 20% are obtained (
Table 8).
It can be seen that the percentage variation of the pressure resistance is between 20 and 50%. These differences result from the boundary condition used and the plane of symmetry. This is because, when using the symmetry condition, there are some terms that are simplified, and this generates a loss of information, precisely some gradients such as:
The gradient of a scalar quantity is normal to the plane of symmetry.
The gradient of the tangential velocity is normal to the plane of symmetry.
The gradient of the average speed along the plane of symmetry.
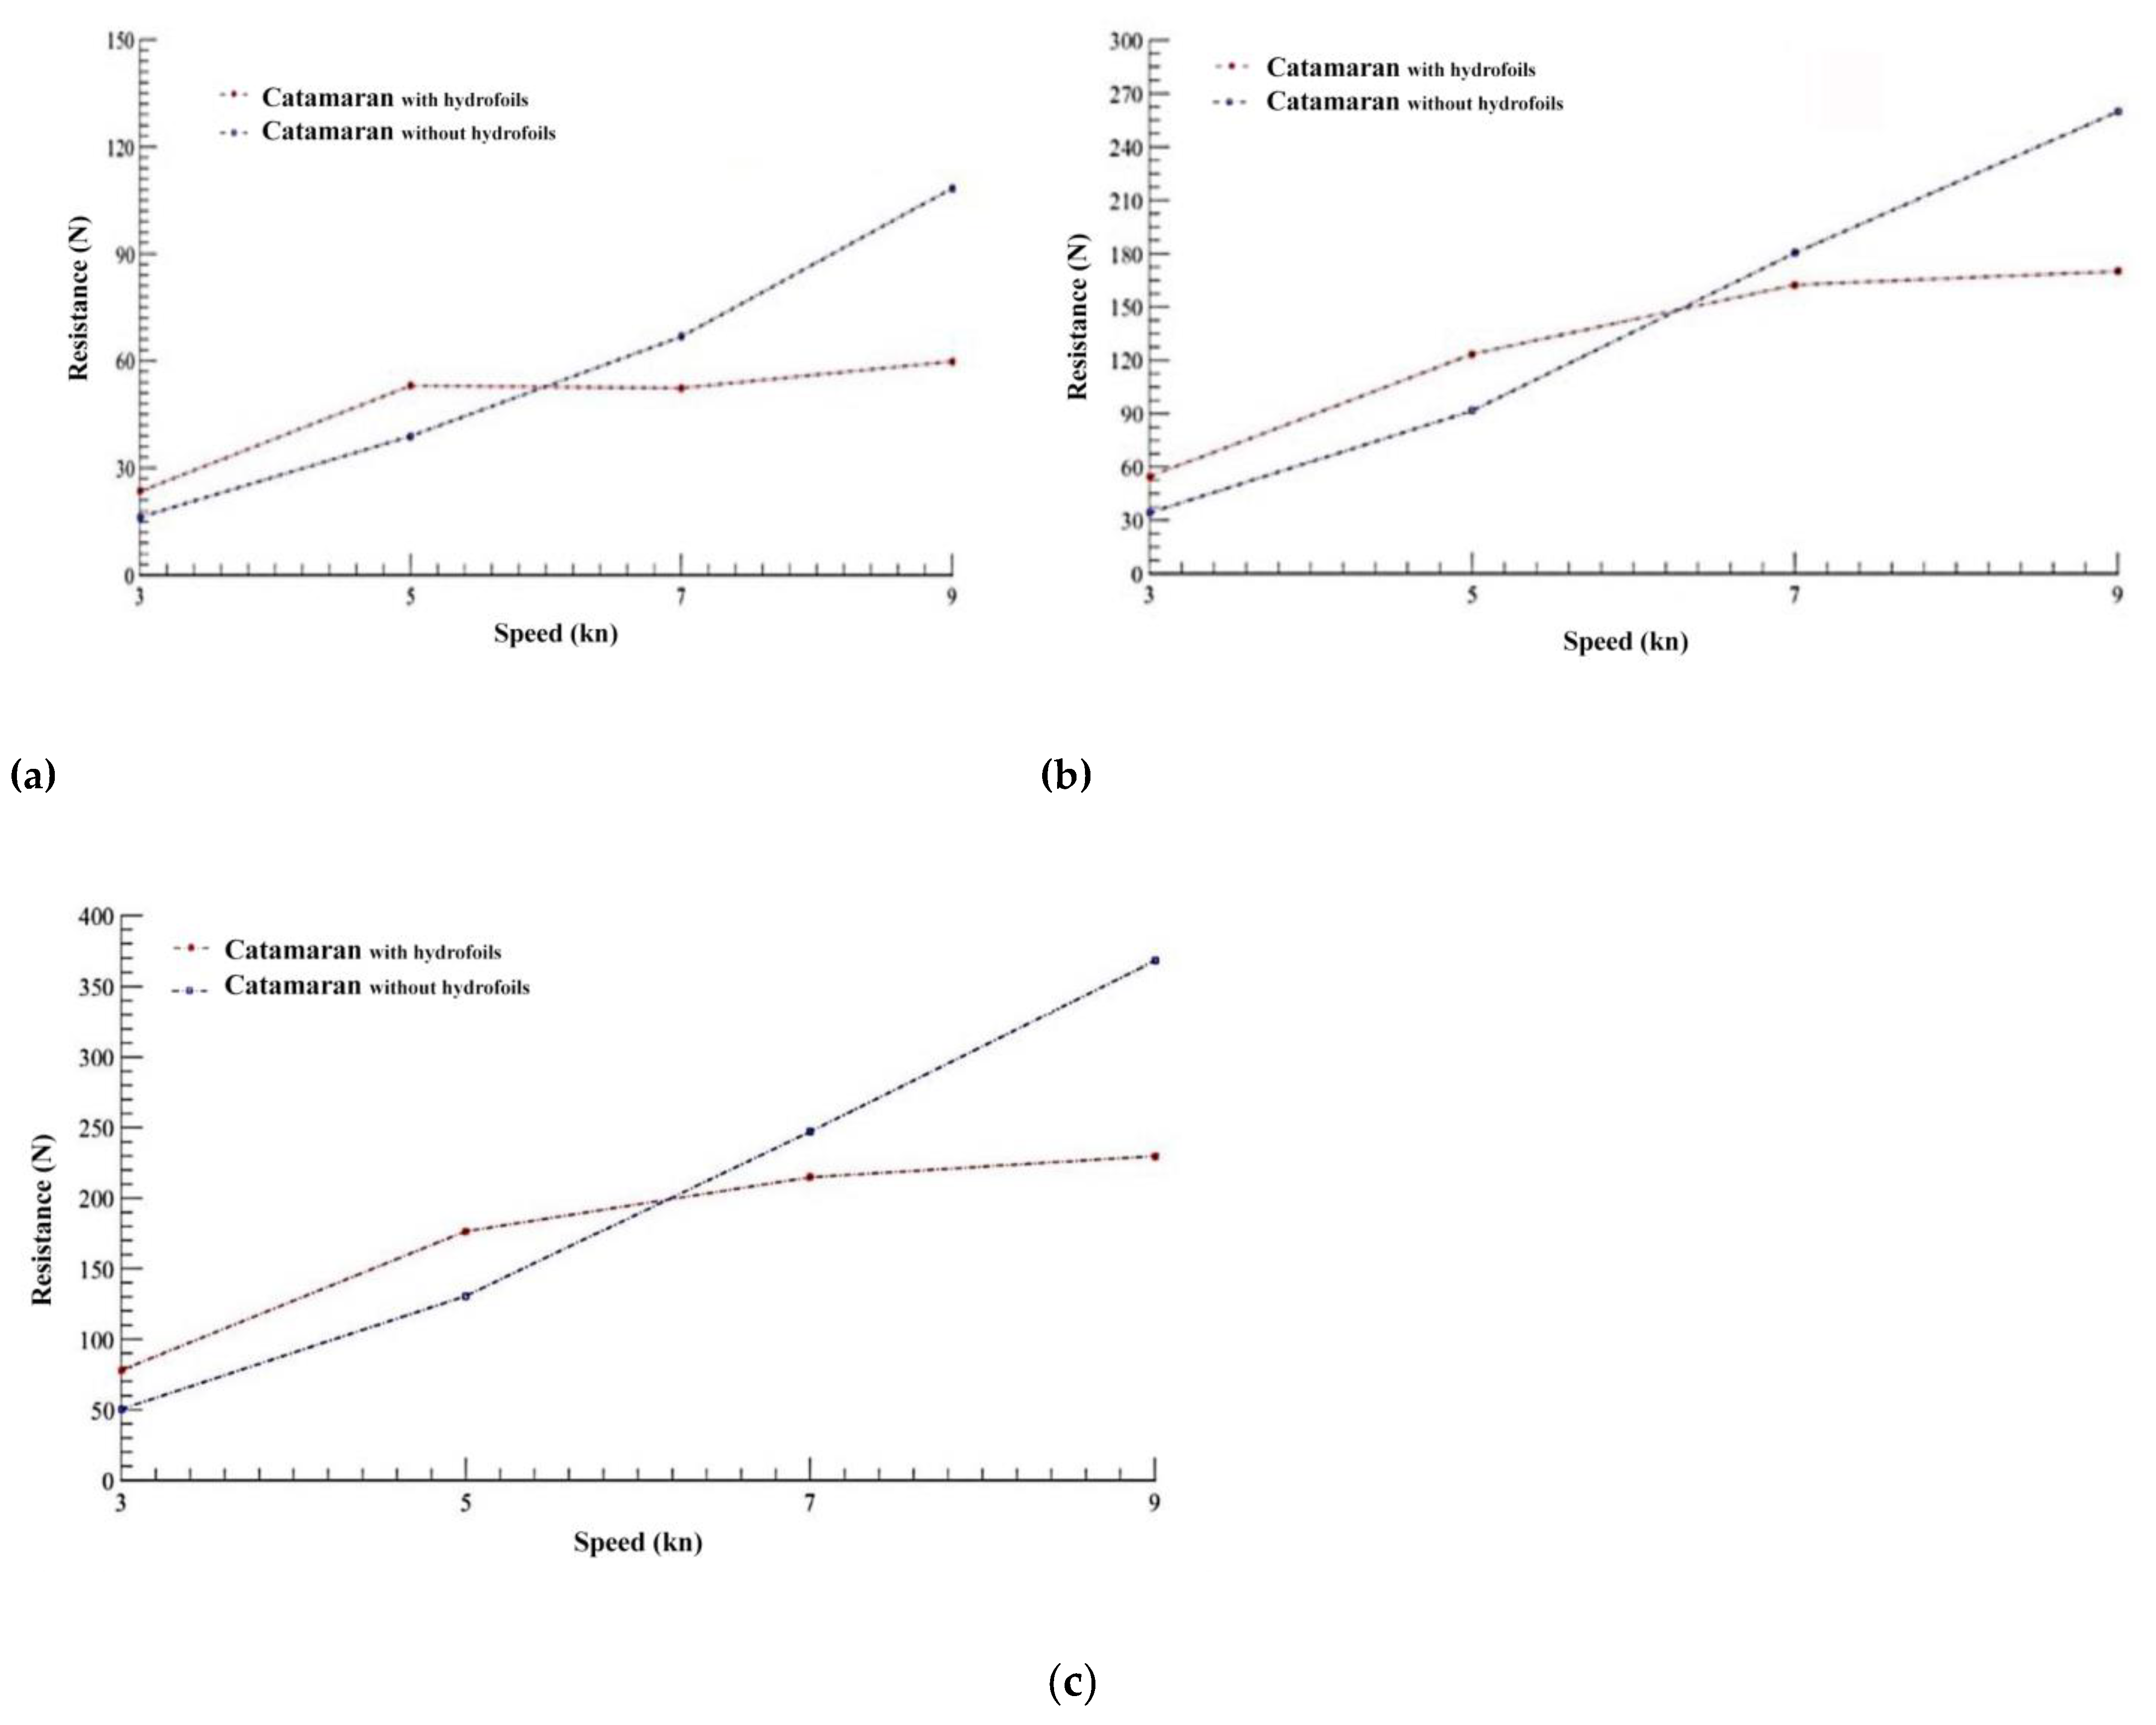
On the other hand, simulations with a plane of symmetry were carried out to reduce the analysis time. However, according to the data presented in Tables XX and YY, there are some discrepancies between the results, which are based on the simplifications of the flow. It is considered essential to show these results and the divergence obtained between them, as it exemplifies the variation of values that could be carried out in future investigations. A comparison is made between the resistances generated by the catamaran with hydrofoils and the catamaran without hydrofoils, using, in both cases, their respective full boat configuration with DFBI (
Figure 16).
Figure 16 shows that between the speeds of 5kn and 7 kn, the catamaran with hydrofoils generates a lower drag than the catamaran without hydrofoils. This is to the information mentioned above since, at a speed of 7 kn, the vessel can lift the hull out of the water. Furthermore, at a rate of 9 kn, the "catamaran with hydrofoils" generates less drag than the "catamaran without hydrofoils" at 7 kn.
A percentage comparison is made between the models presented, contrasting the frictional, pressure and total resistance (
Table 9). The results show that the designed hydrofoils reduce the opposition to the boat's advance provided that the boat can sail at least at a speed of 7kn or close to this, since between 5kn and 7kn is when the hull lifts off the water. In this sailing condition, the vessel's wetted surface area decreases, so the hull generates less frictional resistance and reduces the environmental disturbances caused by the pressures generated.
Figure 17 shows the two configurations presented in Table YY, at a speed of 7 kn. The images on the left correspond to the catamaran with hydrofoils, and those on the right to the actual catamaran (wave height shown).
For their part, the hydrofoils maintained a similar angle of attack in all the simulations, except for the trimming of the vessel, which generated modifications (between - 1.69° and 0.81°). Based on this, new simulations could be developed by systematically varying the angle of attack of the hydrofoils, obtaining even better results.
4. Conclusions
The present research aims to optimise the drag of a 4.2-metre sport catamaran, "Ayakoú", based on the design of hydrofoils. For this purpose, an exhaustive search of the existing hydrofoils on the market and their different profiles has been carried out, being applied to the boat, to subsequently calculate the resistance to the advance of the boat using Computational Flud Dynamics analysis (CFD). From the different comparisons with the traditional method, the following conclusions have been obtained:
In determining the grid, it is necessary to correctly present the disturbances generated by the hull to the medium and determine the resistance produced by the vessel. In the latter, it is essential to decide on its value and that the variation between them is low (a maximum of 5% in the variation between grids is acceptable) to obtain accurate results in a shorter time.
Establishing adequate boundary conditions to develop the numerical analysis is important. Otherwise, significant disturbances are generated in the results obtained. Therefore, the symmetry plane condition should only be used in simulations where the generated wave does not present components normal to it.
The k-ε turbulence model presented stable results for all simulations. Using the complete vessel to choose a hydrofoil model is always proposed since, if a symmetry plane is used, the results obtained may not be correct.
For the DFBI simulations, determining the longitudinal position of the centre of gravity is relevant, as they present a free-pitch rotation. In the investigation, it was observed that for the "traditional catamaran", the shape of the submerged volume was modified. In contrast, for the "catamaran with hydrofoils," the angle of attack of the profile was modified. In addition, being a light boat, the longitudinal position of the sailor's weight must be considered to obtain values close to 0° of trim.
A decrease in resistance is generated by modifying the boat's appendages, but only from the moment the hulls are lifted out of the water, obtaining improvements of 37%. It would be interesting for future research to consider numerical simulations with new variables, such as heel, trim, and rudder angles.
Author Contributions
The following statements should be used “Conceptualization, R.L. and J.M.A.; methodology, R.L. and J.M.A.; software, B.C.; validation, R.L. and JM.A.; formal analysis, X.X.; investigation, B.C.; resources, R.L and J.M.A.; data curation, R.L and J.M.A.; writing—original draft preparation, B.C.; writing—review and editing, D.M. and AC.R.; visualization, D.M. and AC.R.; supervision, R.L.; project administration, R.L.
Funding
This research received no external funding.
Data Availability Statement
No new data were created or analyzed in this study. Data sharing is not applicable to this article.
Acknowledgments
In this section, you can acknowledge any support given which is not covered by the author contribution or funding sections. This may include administrative and technical support, or donations in kind (e.g., materials used for experiments).
Conflicts of Interest
“The authors declare no conflict of interest”.
References
- Sabarishwaran, R.; Reju, R.; Parammasivam, K.M. Numerical Investigation of Drag Reduction in AUV’S at High Turbulence and High-Speed Flow by Optimizing Hull Geometry. In Fluid Mechanics and Fluid Power (Vol. 2) Select Proceedings of FMFP 2021; pp. 2023267–272.
- Sleight, S. The Complete Sailing Manual; Penguin, 2021; ISBN 0744053374.
- Moore, B. , Szakacs, J. Sailing Hydrofoils, 1970. [Google Scholar]
- Inukai, Y.; Horiuchi, K.; Kinoshita, T.; Kanou, H.; Itakura, H. Development of a Single-Handed Hydrofoil Sailing Catamaran. J. Mar. Sci. Technol. 2001, 6, 31–41. [Google Scholar] [CrossRef]
- Paterson, E.T.; Mahoney, S.M.; Spirydowicz, K.E. The Conservation of the HD-4: Alexander Graham Bell’s Hydrofoil. Stud. Conserv. 1979, 24, 93–107. [Google Scholar]
- Ginter, E. Hydrofoils in Construction of Sailing Yachts. AUTOBUSY–Technika, Eksploat. Syst. Transp. 2018, 19, 426–430. [Google Scholar] [CrossRef]
- Liu, Z.; Zheng, L.; Li, G.; Yuan, S.; Yang, S. An Experimental Study of the Vertical Stabilization Control of a Trimaran Using an Actively Controlled T-Foil and Flap. Ocean Eng. 2021, 219, 108224. [Google Scholar] [CrossRef]
- Esteban, S.; Andres-Toro, B.; Besada-Portas, E.; Giron-Sierra, J.M.; De la Cruz, J.M. Multiobjective Control of Flaps and T-Foil in High-Speed Ships. IFAC Proc. Vol. 2002, 35, 313–318. [Google Scholar] [CrossRef]
- Esteban, S.; Giron-Sierra, J.M.; De Andres-Toro, B.; Cruz, J.M. Dela; Riola, J.M. Fast Ships Models for Seakeeping Improvement Studies Using Flaps and T-Foil. Math. Comput. Model. 2005, 41, 1–24. [Google Scholar] [CrossRef]
- Graf, K.; Freiheit, O.; Schlockermann, P.; Mense, J.C. VPP-Driven Sail and Foil Trim Optimization for the Olympic Nacra 17 Foiling Catamaran. J. Sail. Technol. 2020, 5, 61–81. [Google Scholar] [CrossRef]
- Guida, P.; Marimon Giovannetti, L.; Boyd, S. Three-Dimensional Variations of the Nacra 17 Main Foil for Benchmarking Shape Optimizations. 2020.
- Calkins, D.E. HYCAT: Hybrid Hydrofoil Catamaran Concept. Ocean Eng. 1984, 11, 1–21. [Google Scholar] [CrossRef]
- Chapman, E.; Chapman, G. The Rise of the Hydrofoil and the Displacement of the Hull: The Design, Construction and Performance Measurement of a 6m Flying Catamaran. In Proceedings of the SNAME 16th Chesapeake Sailing Yacht Symposium; OnePetro; 2003. [Google Scholar]
- Feng, K.; Zhao, X.; Guo, Z. Design and Structural Performance Measurements of a Novel Multi-Cantilever Foil Bearing. Proc. Inst. Mech. Eng. Part C J. Mech. Eng. Sci. 2015, 229, 1830–1838. [Google Scholar] [CrossRef]
Figure 1.
Design of the sport catamaran “Ayakoú”: (a) 3D view; (b) Profile view.
Figure 1.
Design of the sport catamaran “Ayakoú”: (a) 3D view; (b) Profile view.
Figure 2.
Domain measures (mm): (a) Longitudinal view; (b) Horizontal view.
Figure 2.
Domain measures (mm): (a) Longitudinal view; (b) Horizontal view.
Figure 3.
Grid obtained from STAR-CCM+: (a) Fine mesh (5.228.269 cells); (b) Medium mesh (1.161.014 cells); (c) Coarse mesh (583.915 cells).
Figure 3.
Grid obtained from STAR-CCM+: (a) Fine mesh (5.228.269 cells); (b) Medium mesh (1.161.014 cells); (c) Coarse mesh (583.915 cells).
Figure 4.
Resistances obtained by sensitivity of mesh: a) Frictional resistance; b) Pressure resistance; c) Total resistance.
Figure 4.
Resistances obtained by sensitivity of mesh: a) Frictional resistance; b) Pressure resistance; c) Total resistance.
Figure 5.
Simulation and qualitative comparison at 7 kn as a function of mesh sensitivity.
Figure 5.
Simulation and qualitative comparison at 7 kn as a function of mesh sensitivity.
Figure 6.
Numerical simulation grid of the profile
Figure 6.
Numerical simulation grid of the profile
Figure 7.
2D numerical simulation at different angles for the following coefficients: (a) Lift; (b) Drag.
Figure 7.
2D numerical simulation at different angles for the following coefficients: (a) Lift; (b) Drag.
Figure 8.
3D numerical simulation at different angles for the coefficients: (a) Lift; (b) Drag.
Figure 8.
3D numerical simulation at different angles for the coefficients: (a) Lift; (b) Drag.
Figure 9.
a) Hydrofoil (L-Foil) designed for the daggerboard box of the boat; b) Hydrofoil (T-Foil) designed for the rudder of the vessel.
Figure 9.
a) Hydrofoil (L-Foil) designed for the daggerboard box of the boat; b) Hydrofoil (T-Foil) designed for the rudder of the vessel.
Figure 10.
Graphical representation of the vessel's "flight" condition: a) model 1; b) model 2; c) model 3; d) model 4.
Figure 10.
Graphical representation of the vessel's "flight" condition: a) model 1; b) model 2; c) model 3; d) model 4.
Figure 11.
Graphical representation of the "flight" condition of model 4 at various speeds: a) 3 kn; b) 5 kn; c) 7 kn; d) 9 kn.
Figure 11.
Graphical representation of the "flight" condition of model 4 at various speeds: a) 3 kn; b) 5 kn; c) 7 kn; d) 9 kn.
Figure 12.
Resistances obtained as a function of the configurations with DFBI: a) Frictional resistance; b) Pressure resistance; c) Total resistance.
Figure 12.
Resistances obtained as a function of the configurations with DFBI: a) Frictional resistance; b) Pressure resistance; c) Total resistance.
Figure 13.
Qualitative comparison for the different configurations: a) Complete with DFBI; b) Half with DFBI; c) Half with DFBI.
Figure 13.
Qualitative comparison for the different configurations: a) Complete with DFBI; b) Half with DFBI; c) Half with DFBI.
Figure 14.
Resistances obtained on the catamaran with hidrofoils as a function of the configurations with DFBI: a) Frictional resistance; b) Pressure resistance; c) Total resistance.
Figure 14.
Resistances obtained on the catamaran with hidrofoils as a function of the configurations with DFBI: a) Frictional resistance; b) Pressure resistance; c) Total resistance.
Figure 15.
Qualitative comparison of catamarans with and without hydrofoils at 7kn.
Figure 15.
Qualitative comparison of catamarans with and without hydrofoils at 7kn.
Figure 16.
Resistances obtained on the catamaran with and without hidrofoils as a function of the configurations with DFBI: a) Frictional resistance; b) Pressure resistance; c) Total resistance.
Figure 16.
Resistances obtained on the catamaran with and without hidrofoils as a function of the configurations with DFBI: a) Frictional resistance; b) Pressure resistance; c) Total resistance.
Figure 17.
Qualitative comparison at a speed of 7 kn of the hydrofoil catamaran and the traditional catamaran.
Figure 17.
Qualitative comparison at a speed of 7 kn of the hydrofoil catamaran and the traditional catamaran.
Table 1.
Characteristics of the hull of the catamaran "Ayakoú".
Table 1.
Characteristics of the hull of the catamaran "Ayakoú".
| Characteristic |
Units |
Value |
| Draught of the vessel |
m. |
0,128 |
| Waterline length |
m. |
4,198 |
| Vessel width |
m. |
0,320 |
| Wet grip |
m2
|
2,100 |
| Water plane area |
m2
|
0,993 |
| Prismatic rate |
- |
0,601 |
| Block rate |
- |
0,492 |
| Master quadratic ratio |
- |
0,827 |
| Symmetrical hull spacing |
m. |
2,000 |
Table 2.
Water characteristics, mesh sensitivity.
Table 2.
Water characteristics, mesh sensitivity.
| Flow Characteristics |
Units |
Value |
| Density |
Kg/m3
|
997.561 |
| Dynamic viscosity |
Pa s |
8.8871∙10-4
|
Table 3.
Percentage comparison between fine, medium and coarse mesh.
Table 3.
Percentage comparison between fine, medium and coarse mesh.
| |
Friction |
Pressures |
Total |
Speed
(kn) |
Medium-Fine
(%) |
Medium-Coarse
(%) |
Medium-Fine
(%) |
Medium-Coarse
(%) |
Medium-Fine (%) |
Medium-Coarse
(%) |
| 3 |
1,67 |
3,92 |
16,91 |
14,28 |
8,14 |
5,31 |
| 5 |
3,02 |
4,43 |
14,09 |
8,45 |
4,81 |
6,47 |
| 7 |
5,35 |
3,32 |
11,69 |
1,44 |
3,03 |
2,33 |
| 9 |
5,86 |
0,71 |
13,63 |
0,76 |
3,30 |
0,74 |
Table 4.
Simulation flow characteristics (NACA 64-412).
Table 4.
Simulation flow characteristics (NACA 64-412).
| Flow Characteristics |
Units |
Value |
| Density |
Kg/m3
|
997.561 |
| Dynamic viscosity |
Pa s |
8.8871∙10-4
|
| Speed |
m/s |
3.5 |
Table 5.
Summary of the dimensions of the models analysed.
Table 5.
Summary of the dimensions of the models analysed.
| Measures |
Models |
| 1 |
2 |
3 |
4 |
| A (mm) |
350 |
350 |
350 |
450 |
| B (mm) |
300 |
300 |
300 |
200 |
| C (mm) |
500 |
500 |
650 |
650 |
| E (º) |
0 |
2 |
3 |
6 |
| G (º) |
0 |
3 |
3 |
3 |
| H (º) |
0 |
4 |
4 |
4 |
Table 6.
Summary of the dimensions of the models analysed.
Table 6.
Summary of the dimensions of the models analysed.
| Parameters |
Models |
| 1 |
2 |
3 |
4 |
| Scrolling (m) |
0.01 |
0.09 |
0.11 |
0.47 |
| Rotation (º) |
0.59 |
-0.61 |
-0.48 |
-0.08 |
| LCG (m) |
150.58 |
166.12 |
165.29 |
132.08 |
Table 6.
Summary of the dimensions of the models analysed.
Table 6.
Summary of the dimensions of the models analysed.
| Parameters |
Speed (kn) |
| 3 |
5 |
7 |
9 |
| Scrolling (m) |
0.001 |
0.03 |
0.47 |
0.72 |
| Rotation (º) |
-1.69 |
-1.31 |
-0.08 |
0.81 |
| LCG (m) |
1.45 |
1.45 |
1.25 |
1.25 |
Table 7.
Percentage comparison between the Traditional Catamaran complete with DFBI and the rest of the configurations.
Table 7.
Percentage comparison between the Traditional Catamaran complete with DFBI and the rest of the configurations.
| |
Friction |
Pressures |
Total Drag |
| Speed (kn) |
Full -Half
(both with DFBI)
(%) |
Full with DFBI- Half without DFBI
(%) |
Full -Half
(both with DFBI)
(%) |
Full with DFBI- Half without DFBI
(%) |
Full -Half
(both with DFBI)
(%) |
Full with DFBI- Half without DFBI
(%) |
| 3 |
6.72 |
5.74 |
54.73 |
55.88 |
34.93 |
36.03 |
| 5 |
9.31 |
7.02 |
49.24 |
54.90 |
31.80 |
36.46 |
| 7 |
8.98 |
9.73 |
53.67 |
52.46 |
36.75 |
35.02 |
| 9 |
0.84 |
9.24 |
50.71 |
50.25 |
36.04 |
32.74 |
Table 8.
Percentage comparison between Catamaran with hydrofoils full with DFBI and half with DFBI.
Table 8.
Percentage comparison between Catamaran with hydrofoils full with DFBI and half with DFBI.
| |
Friction |
Pressures |
Total Drag |
Speed
(kn) |
Full -Half
(both with DFBI)
(%) |
Full -Half
(both with DFBI)
(%) |
Full -Half
(both with DFBI)
(%) |
| 3 |
1.77 |
26.76 |
18.19 |
| 5 |
0.53 |
34.45 |
23.95 |
| 7 |
5.48 |
21.83 |
15.17 |
| 9 |
2.54 |
20.43 |
114.45 |
Table 9.
Percentage comparison between Catamaran with hydrofoils complete with DFBI and half with DFBI.
Table 9.
Percentage comparison between Catamaran with hydrofoils complete with DFBI and half with DFBI.
| |
Friction |
Pressures |
Total Drag |
| Speed (kn) |
Catamaran
With hydrofoils/Traditional
(%) |
Catamaran
With hydrofoils/Traditional
(%) |
Catamaran
With hydrofoils/Traditional
(%) |
| 3 |
44.24 |
59.83 |
54.82 |
| 5 |
36.26 |
34.73 |
35.18 |
| 7 |
-21.55 |
-9.98 |
-13.07 |
| 9 |
-44.79 |
-34.53 |
-37.55 |
|
Disclaimer/Publisher’s Note: The statements, opinions and data contained in all publications are solely those of the individual author(s) and contributor(s) and not of MDPI and/or the editor(s). MDPI and/or the editor(s) disclaim responsibility for any injury to people or property resulting from any ideas, methods, instructions or products referred to in the content. |
© 2023 by the authors. Licensee MDPI, Basel, Switzerland. This article is an open access article distributed under the terms and conditions of the Creative Commons Attribution (CC BY) license (http://creativecommons.org/licenses/by/4.0/).


