Submitted:
28 April 2023
Posted:
04 May 2023
You are already at the latest version
Abstract
Acute encephalopathy with biphasic seizures and reduced diffusion (AESD) is characterized by biphasic seizures following febrile viral infections and delayed reduced diffusion of the cerebral white matter on magnetic resonance imaging (MRI) diffusion-weighted imaging (DWI) (bright tree appearance, BTA). However, hypoxic encephalopathy with biphasic seizures and AESD-mimicking imaging findings has not been reported. Herein, we report an case of hypoxic encephalopathy due to suffocation with concomitant biphasic seizures and BTA, mimicking AESD. On day 1, a 5-month-old female was found face down with breathing cessation and deteriorating consciousness level. The electroencephalography (EEG) revealed periodic epileptic discharges, suggesting possible nonconvulsive status epilepticus. Despite the improvements in consciousness level and EEG abnormalities on day 2, her consciousness level deteriorated again with generalized tonic-clonic seizures on day 3, and head MRI-DWI revealed restricted diffusion predominantly in the subcortical areas, suggesting BTA. Treatment for acute encephalopathy resolved clinical sei-zures and EEG abnormalities. The persistence of abnormal EEG, reflecting abnormal excitation and accumulation of neurotoxic substances caused by hypoxia, may have contributed to the devel-opment of AESD-like findings. As hypoxic encephalopathy causes AESD-like biphasic seizures, monitoring the consciousness level, seizure occurrence, and EEG abnormalities even after acute symptoms have temporarily improved following hypoxia is essential.
Keywords:
acute encephalopathy with biphasic seizures and late reduced diffusion
; hypoxic encephalopathy
; bright tree appearance
; glutamate excitotoxicity
; nonconvulsive status epilepticus
1. Introduction
Several hundred cases of acute encephalopathy with biphasic seizures and late reduced diffusion (AESD), a common form of acute encephalopathy among Asian children, are recorded each year [1,2]. AESD is characterized by biphasic seizures and delayed reduced diffusion several days after the onset, mainly in the frontal and occipital subcortical white matter on MRI diffusion-weighted imaging (DWI), which is referred to as the bright tree appearance (BTA) with central sparing [1]. In AESD, early-phase seizures develop during the febrile viral infections, whereas late-phase seizures typically occur 3–7 days after temporary improvement [1]. The pathogenesis of AESD is thought to be glutamate excitotoxicity resulting from seizures in the first phase of status epilepticus [3,4]. Because AESD is associated with severe neurological sequelae, seizures should be monitored carefully and may be treated early to suppress excitotoxicity [1].
However, there have been no reports of hypoxic encephalopathy with biphasic seizures and imaging findings mimicking AESD. In patients with hypoxic encephalopathy, neurological symptoms, including seizures, are generally monophasic.
Herein, we report an infantile case of hypoxic encephalopathy combined with biphasic seizures and BTA-like findings that mimicked the clinical course of AESD.
2. Case Report
2.1. Patient presentation
A 5-month-old female patient who seemed to have suffocated was found lying prone on a cushion by her guardians. She was transported to our emergency room and fitted with a bag valve mask ventilation to administer oxygen during breathing cessation. She had previously been healthy, with no history of perinatal or developmental abnormalities. Neonatal screening for metabolic diseases was negative. Her parents reported that she recently developed the capacity to roll over by herself. On the day of onset, she had no symptoms of respiratory tract infection or gastroenteritis.
2.2. Physical findings
Upon admission, the patient’s consciousness level was E3V2M4 on the Glasgow Coma Scale (GCS) and her body temperature was 37.0°C. Eye opening was obserbed in response to mild pain or sound stimuli but her eyes were misaligned (Figure 1). There was no evidence of retinal hemorrhage. No signs of trauma were evident on the body’s surface or on whole-body skeletal radiography.
2.3. Laboratory and imaging findings upon admission
Blood biochemistry revealed elevated levels of aspartate aminotransferase (AST 263 U/L), alanine transaminase (ALT 76 U/L), lactate dehydrogenase (LDH 976 U/L), creatine kinase (CK 9005 U/L), and serum lactate (9.8 mmol/L). C-reactive protein and blood glucose levels were normal. Her complete blood count showed an elevated white blood cell count of 17,090/µL; however, it was otherwise normal. Arterial blood gas analysis (after a bag valve mask with 100% oxygen) revealed a pH of 7.398, PaCO2 of 33 mmHg, PaO2 of 193 mmHg, HCO3− of 21.3 mmol/L and an anion gap of 9.0 mmol/L. A cerebrospinal fluid (CSF) examination revealed no abnormalities. Polymerase chain reaction testing of the CSF was negative for viruses, including those that frequently cause acute encephalopathy (human herpes virus (HHV)-6, HHV-7, influenza virus, respiratory syncytial virus, rotavirus, herpes simplex virus, and enterovirus). Urine organic acid and blood amino acid analyses were unremarkable. Head CT revealed diffuse cerebral edema and an indistinct corticomedullary border (Figure 2a).
2.4. Clinical course after hospitalization
Continuous EEG monitoring was started after admission. From 5 h to 10 h after the onset, a phase consisting of 1–3 Hz, 150–250 µV slow wave burst (Figure 3a, left panel), and another phase composed of 1–3 Hz, 200–350 µV rhythmic (poly)spike-and-wave complexes including 6–10 Hz, 200–350 µV spike component (Figure 3a, right panel) was observed predominantly in the bilateral occipital region without apparent seizures (Figure 3A,B). These phases alternated every 15–30 minutes (Figure 3b). Based on fluctuation in the EEG findings and the patient’s impaired consciousness, a diagnosis of “possible NCSE” was made [5]. No antiepileptic drugs were administered at this time, as the patient's level of consciousness and EEG findings were improving by 12 h after the onset (Figure 1). Twelve hours after the onset, her consciousness level improved to E4V5M6 on the GCS, and the abnormal waves resolved with the appearance of spindle-like fast waves on the EEG (Figure 1 and Figure 3c). Mechanical ventilation was not required until day 3.
On day 3, however, the patient’s consciousness level deteriorated to E3V2M4 (GCS), and she experienced a cluster of generalized tonic–clonic seizures. EEG revealed diffuse spike-and-wave complexes predominantly in the occipital region (Figure 3d). Head MRI-DWI on the same day showed reduced diffusion in the subcortical areas, except the perirolandic regions invoking BTA with central sparing (Figure 2b). In the occipital and lateral temporal lobes, DWI high-signal areas extended into the cortex as well as the subcortex (Figure 2b). Magnetic resonance spectroscopy (MRS) (TE = 144 msec) revealed only a slightly inverted lactate peak (Figure 2d).
2.5. Diagnosis, treatment, and outcomes
Based on the biphasic course that is unusual for hypoxic encephalopathy, a diagnosis of secondary AESD-like acute encephalopathy due to hypoxic encephalopathy was made. On day 3, treatment was initiated with artificial ventilation, methylprednisolone pulse therapy, intravenous immunoglobulin therapy, and intravenous anticonvulsant therapy with midazolam, phenobarbital, and fosphenytoin immediately after the emergence of second seizures (Figure 1). As the clinical seizures and abnormal EEG resolved and her consciousness level improved to E4V5M6 on the GCS by day 10, these treatments were discontinued (Figure 1). Head MRI T2-weighted imaging on day 23 revealed laminar necrosis in the frontal and occipital cortices, thinning of the corpus callosum, and a decrease in the volume of the bilateral cerebral hemispheres, basal ganglia, and hippocampi (Figure 2c). One year after onset, at the age of 1.5 years, she experienced visual cognitive dysfunction but could utter ten meaningful words and walk without assistance.
Written informed consent was obtained from the patient’s parents for the publication of this case report. Neurofax EEG-1250 (Nihon Kohden, #Code: EEG-1250) was used for EEG measurement and analysis.
3. Discussion
The biphasic clinical course and reduced diffusion predominantly in the subcortical white matter on head MRI in the present patient indicated the AESD-like clinical course. However, there was no evidence of a viral infection or febrile period, which is almost invariably observed in AESD. In addition, abnormal subcortical white matter signals extending to the occipital and lateral temporal cortex were not typical of BTA in AESD. Therefore, we considered these AESD-like findings to have appeared as a result of primary hypoxic encephalopathy.
We found six pieces of evidence of the presence of hypoxic encephalopathy primarily at the time of onset in our case:
- Based on her present history, sleeping in a prone position on a cushion was believed to be the cause of suffocation. Lying prone on soft bedding may have caused the elevation of her diaphragm, CO2 rebreathing, and frequent oxygen desaturation due to airway obstruction [6];
- A significant increase in the level of serum lactate and enzyme deviation reflecting neuronal injury and tissue hypoxia was also observed immediately after the onset of hypoxic encephalopathy. While in excitotoxic encephalopathy including AESD, the levels of lactate and other deviating enzymes are rarely elevated immediately after onset [1,3,8];
- A slight lactate peak on MRS was observed in our case, which indicated acute hypoxia and cerebral ischemia reflecting anaerobic brain metabolism, suggesting that hypoxia was already present at the time of onset [9];
- Cortical laminar necrosis, which manifests as subacute, curvilinear, hyperintense cortical lesions on T1-weighted imaging, indicated selective hypoxic necrosis of cortical layers 3, 5, and 6, which are particularly vulnerable to hypoxia, as was observed in our case [10];
Based on these findings, hypoxic encephalopathy was considered as the primary etiology in this patient.
Hypoxic encephalopathy does not always cause biphasic seizures; however, in the present case, continuous NCSE and brain damage due to hypoxia and the subsequent accumulation of neurotoxic substances might have contributed conjointly to the second-phase seizures, just like in AESD. Although the pathogenesis of AESD remains unclear, recent studies have suggested that biphasic seizures in AESD are caused by neuronal death, astrocyte dysfunction, and neuronal edema associated with excessive glutamate excitotoxicity resulting from seizures that occurred in the early-phase [3,4]. In this case, there were epileptic discharges of <2.5 Hz and periodic EEG fluctuation, confirming the diagnosis of possible NCSE based on Salzburg criteria [5]. It was suggested that persistence of abnormal EEG reflecting abnormal excitation due to hypoxic damage in the first phase may have caused glutamate excitotoxicity. Besides, in hypoxic encephalopathy, impaired ATP production and lactate accumulation due to hypoxia are associated with the depolarization of neuronal cells and the release of excitatory neurotransmitters, including glutamate. The overactivation of glutamate receptors causes Ca2+ influx via receptor-mediated Ca2+ channels, which activate calcium-dependent intracellular enzymes, which, in turn, leads to the accumulation of reactive oxygen/nitrosative species and secondary brain injury 24 h after the onset of hypoxia [8,11].
Etiologies other than infection, such as head trauma, have been reported to produce AESD-like findings; i.e., biphasic seizures and BTA. [1,7,12,13]. Takase et al. reported a patient with head trauma resulting in acute subdural hematoma who presented with AESD-like biphasic seizures and delayed reduced diffusion, indicating BTA [14]. In their report, they stated that cytotoxic edema, microglial activation, glutamate excitotoxicity, and intracellular Ca2+ influx due to diffuse brain damage can cause AESD-like clinical findings [14]. In our case, just like in the trauma case, extensive brain damage due to hypoxia and neuronal excitotoxicity and increased intracellular Ca2+ influx may have contributed to the development of AESD-like findings.
In the present case, reduced diffusion seen on day 3 MRI-DWI was limited to the subcortical area in the anterior lobe, invoking BT; however, the fact that the high signals on DWI extended to not only the subcortical area but also the cortex of the occipital and partially temporal lobes was not typical of BTA. BTA is one of the specific features of AESD that can be caused by excitotoxicity, as described above [1,3,4]. These findings are thought to reflect reduced water motion in most of the white matter, except the central sulcus regions in the anterior lobes, and lesions are typically limited to the subcortex in AESD [7]. On the other hand, in hypoxic encephalopathy, it is known that reduced water motion can be broadly observed in most of the cerebral cortex as well as the subcortical white matter [7]. It is suggested that the coexistence of typical BTA and high DWI signals extending to the cortex may have been the result of a combination of glutamate excitotoxicity, as well as hypoxic brain injury and the subsequent accumulation of neurotoxic substances in our case.
5. Conclusions
It is necessary for not only pediatric neurologists but also pediatric generalists to understand the concept of AESD and that hypoxic encephalopathy can result in an AESD-like biphasic clinical course with BTA-like findings. Therefore, it is necessary to monitor the patient’s consciousness level, seizure occurrence, and changes in EEG and MRI findings carefully even after the seizures and/or consciousness have temporarily improved following hypoxia.
Author Contributions
Conceptualization, S.F. and S.M.; methodology, S.F., M.E., T.K. and S.M.; software, S.F.; validation, S.F., M.E. and S.M.; formal analysis, S.F.; investigation, S.F. and S.M.; resources, S.F., M.E., T.K. and S.M.; data curation, S.F.; writing—original draft preparation, S.F.; writing—review and editing, S.F. and S.M.; visualization, S.F.; supervision, S.M.; project administration, S.F. and S.M. All authors have read and agreed to the published version of the manuscript.
Funding
This research received no external funding.
Institutional Review Board Statement
The study complies with the ethical requirements of the Tokyo Metropolitan Children’s Medical Center. The Ethics Committee of Tokyo Metropolitan Childrens’ Medical Center has confirmed that ethical approval is not required for a case report.
Informed Consent Statement
Written informed consent has been obtained from the patient’s guardians to publish this paper.
Data Availability Statement
The data that support the findings of this report are available from the corresponding author, SF, upon reasonable request.
Acknowledgments
We thank James R. Valera (the in-house editor at Tokyo Metropolitan Children’s Medical Center) and Enago (www.enago.jp) for their assistance in editing the final draft of this manuscript.
Conflicts of Interest
The authors declare no conflict of interest. The funders had no role in the design of the study; in the collection, analyses, or interpretation of data; in the writing of the manuscript; or in the decision to publish the results.
References
- Mizuguchi, M.; Ichiyama, T.; Imataka, G.; Okumura, A.; Goto, T.; Sakuma, H.; Takanashi, J.I.; Murayama, K.; Yamagata, T.; Yamanouchi, H.; Fukuda, T.; Maegaki, Y. Guidelines for the diagnosis and treatment of acute encephalopathy in childhood. Brain Dev 2021, 43, 2–31. [Google Scholar] [CrossRef] [PubMed]
- Hoshino, A.; Saitoh, M.; Oka, A.; Okumura, A.; Kubota, M.; Saito, Y.; Takanashi, J.; Hirose, S.; Yamagata, T.; Yamanouchi, H.; Mizuguchi, M. Epidemiology of acute encephalopathy in Japan, with emphasis on the association of viruses and syndromes. Brain Dev 2012, 34, 337–343. [Google Scholar] [CrossRef] [PubMed]
- Takanashi, J.; Tada, H.; Terada, H.; Barkovich, A.J. Excitotoxicity in acute encephalopathy with biphasic seizures and late reduced diffusion. AJNR Am J Neuroradiol 2009, 30, 132–135. [Google Scholar] [CrossRef] [PubMed]
- Takanashi, J.; Mizuguchi, M.; Terai, M.; Barkovich, A.J. Disrupted glutamate-glutamine cycle in acute encephalopathy with biphasic seizures and late reduced diffusion. Neuroradiology 2015, 57, 1163–1168. [Google Scholar] [CrossRef] [PubMed]
- Leitinger, M.; Trinka, E.; Gardella, E.; Rohracher, A.; Kalss, G.; Qerama, E.; Höfler, J.; Hess, A.; Zimmermann, G.; Kuchukhidze, G.; Dobesberger, J.; Langthaler, P.B.; Beniczky, S. Diagnostic accuracy of the Salzburg EEG criteria for non-convulsive status epilepticus: a retrospective study. Lancet Neurol 2016, 15, 1054–1062. [Google Scholar] [CrossRef] [PubMed]
- Sperhake, J.; Jorch, G.; Bajanowski, T. The prone sleeping position and SIDS. Historical aspects and possible pathomechanisms. Int J Legal Med 2018, 132, 181–185. [Google Scholar] [CrossRef] [PubMed]
- Schwartz, E.S.; Barkovich, A.J. Brain and spine injuries in infancy and childhood. In Pediatric Neuroimaging, 6th ed.; Barkovich, A.J., Raybaud, C., Eds.; Wolters Kluwer: Philadelphia, 2019; pp. 263–404. [Google Scholar]
- Nishiyama, M.; Tanaka, T.; Fujita, K.; Maruyama, A.; Nagase, H. Targeted temperature management of acute encephalopathy without AST elevation. Brain Dev 2015, 37, 328–333. [Google Scholar] [CrossRef] [PubMed]
- Gutierrez, L.G.; Rovira, A.; Portela, L.A.; Leite, C.; Lucato, L.T. CT and MR in non-neonatal hypoxic-ischemic encephalopathy: radiological findings with pathophysiological correlations. Neuroradiology 2010, 52, 949–976. [Google Scholar] [CrossRef] [PubMed]
- Niwa, T.; Aida, N.; Shishikura, A.; Fujita, K.; Inoue, T. Susceptibility-weighted imaging findings of cortical laminar necrosis in pediatric patients. AJNR Am J Neuroradiol 2008, 29, 1795–1798. [Google Scholar] [CrossRef] [PubMed]
- Thornton, C.; Hagberg, H. Role of mitochondria in apoptotic and necroptotic cell death in the developing brain. Clin Chim Acta 2015, 451, 35–38. [Google Scholar] [CrossRef] [PubMed]
- Nishiyama, M.; Fujita, K.; Maruyama, A.; Nagase, H. Two cases of traumatic head injury mimicking acute encephalopathy with biphasic seizures and late reduced diffusion. Brain Dev 2014, 36, 928–931. [Google Scholar] [CrossRef] [PubMed]
- Inoue, H.; Hasegawa, S.; Kajimoto, M.; Matsushige, T.; Ichiyama, T. Traumatic head injury mimicking acute encephalopathy with biphasic seizures and late reduced diffusion. Pediatr Int 2014, 56, e58–e61. [Google Scholar] [CrossRef] [PubMed]
- Takase, N.; Igarashi, N.; Taneichi, H.; Yasukawa, K.; Honda, T.; Hamada, H.; Takanashi, J.I. Infantile traumatic brain injury with a biphasic clinical course and late reduced diffusion. J Neurol Sci 2018, 390, 63–66. [Google Scholar] [CrossRef] [PubMed]
Figure 1.
The patient’s biphasic clinical course and treatment in the acute period. Abnormalities of electroencephalogram (EEG), seizures, and impairment of consciousness showed a biphasic course. MDL, midazolam; fPHT, fosphenytoin; PB, phenobarbital; mPSL, methylprednisolone; IVIG, intravenous immunoglobulin; GCS, Glasgow Coma Scale.
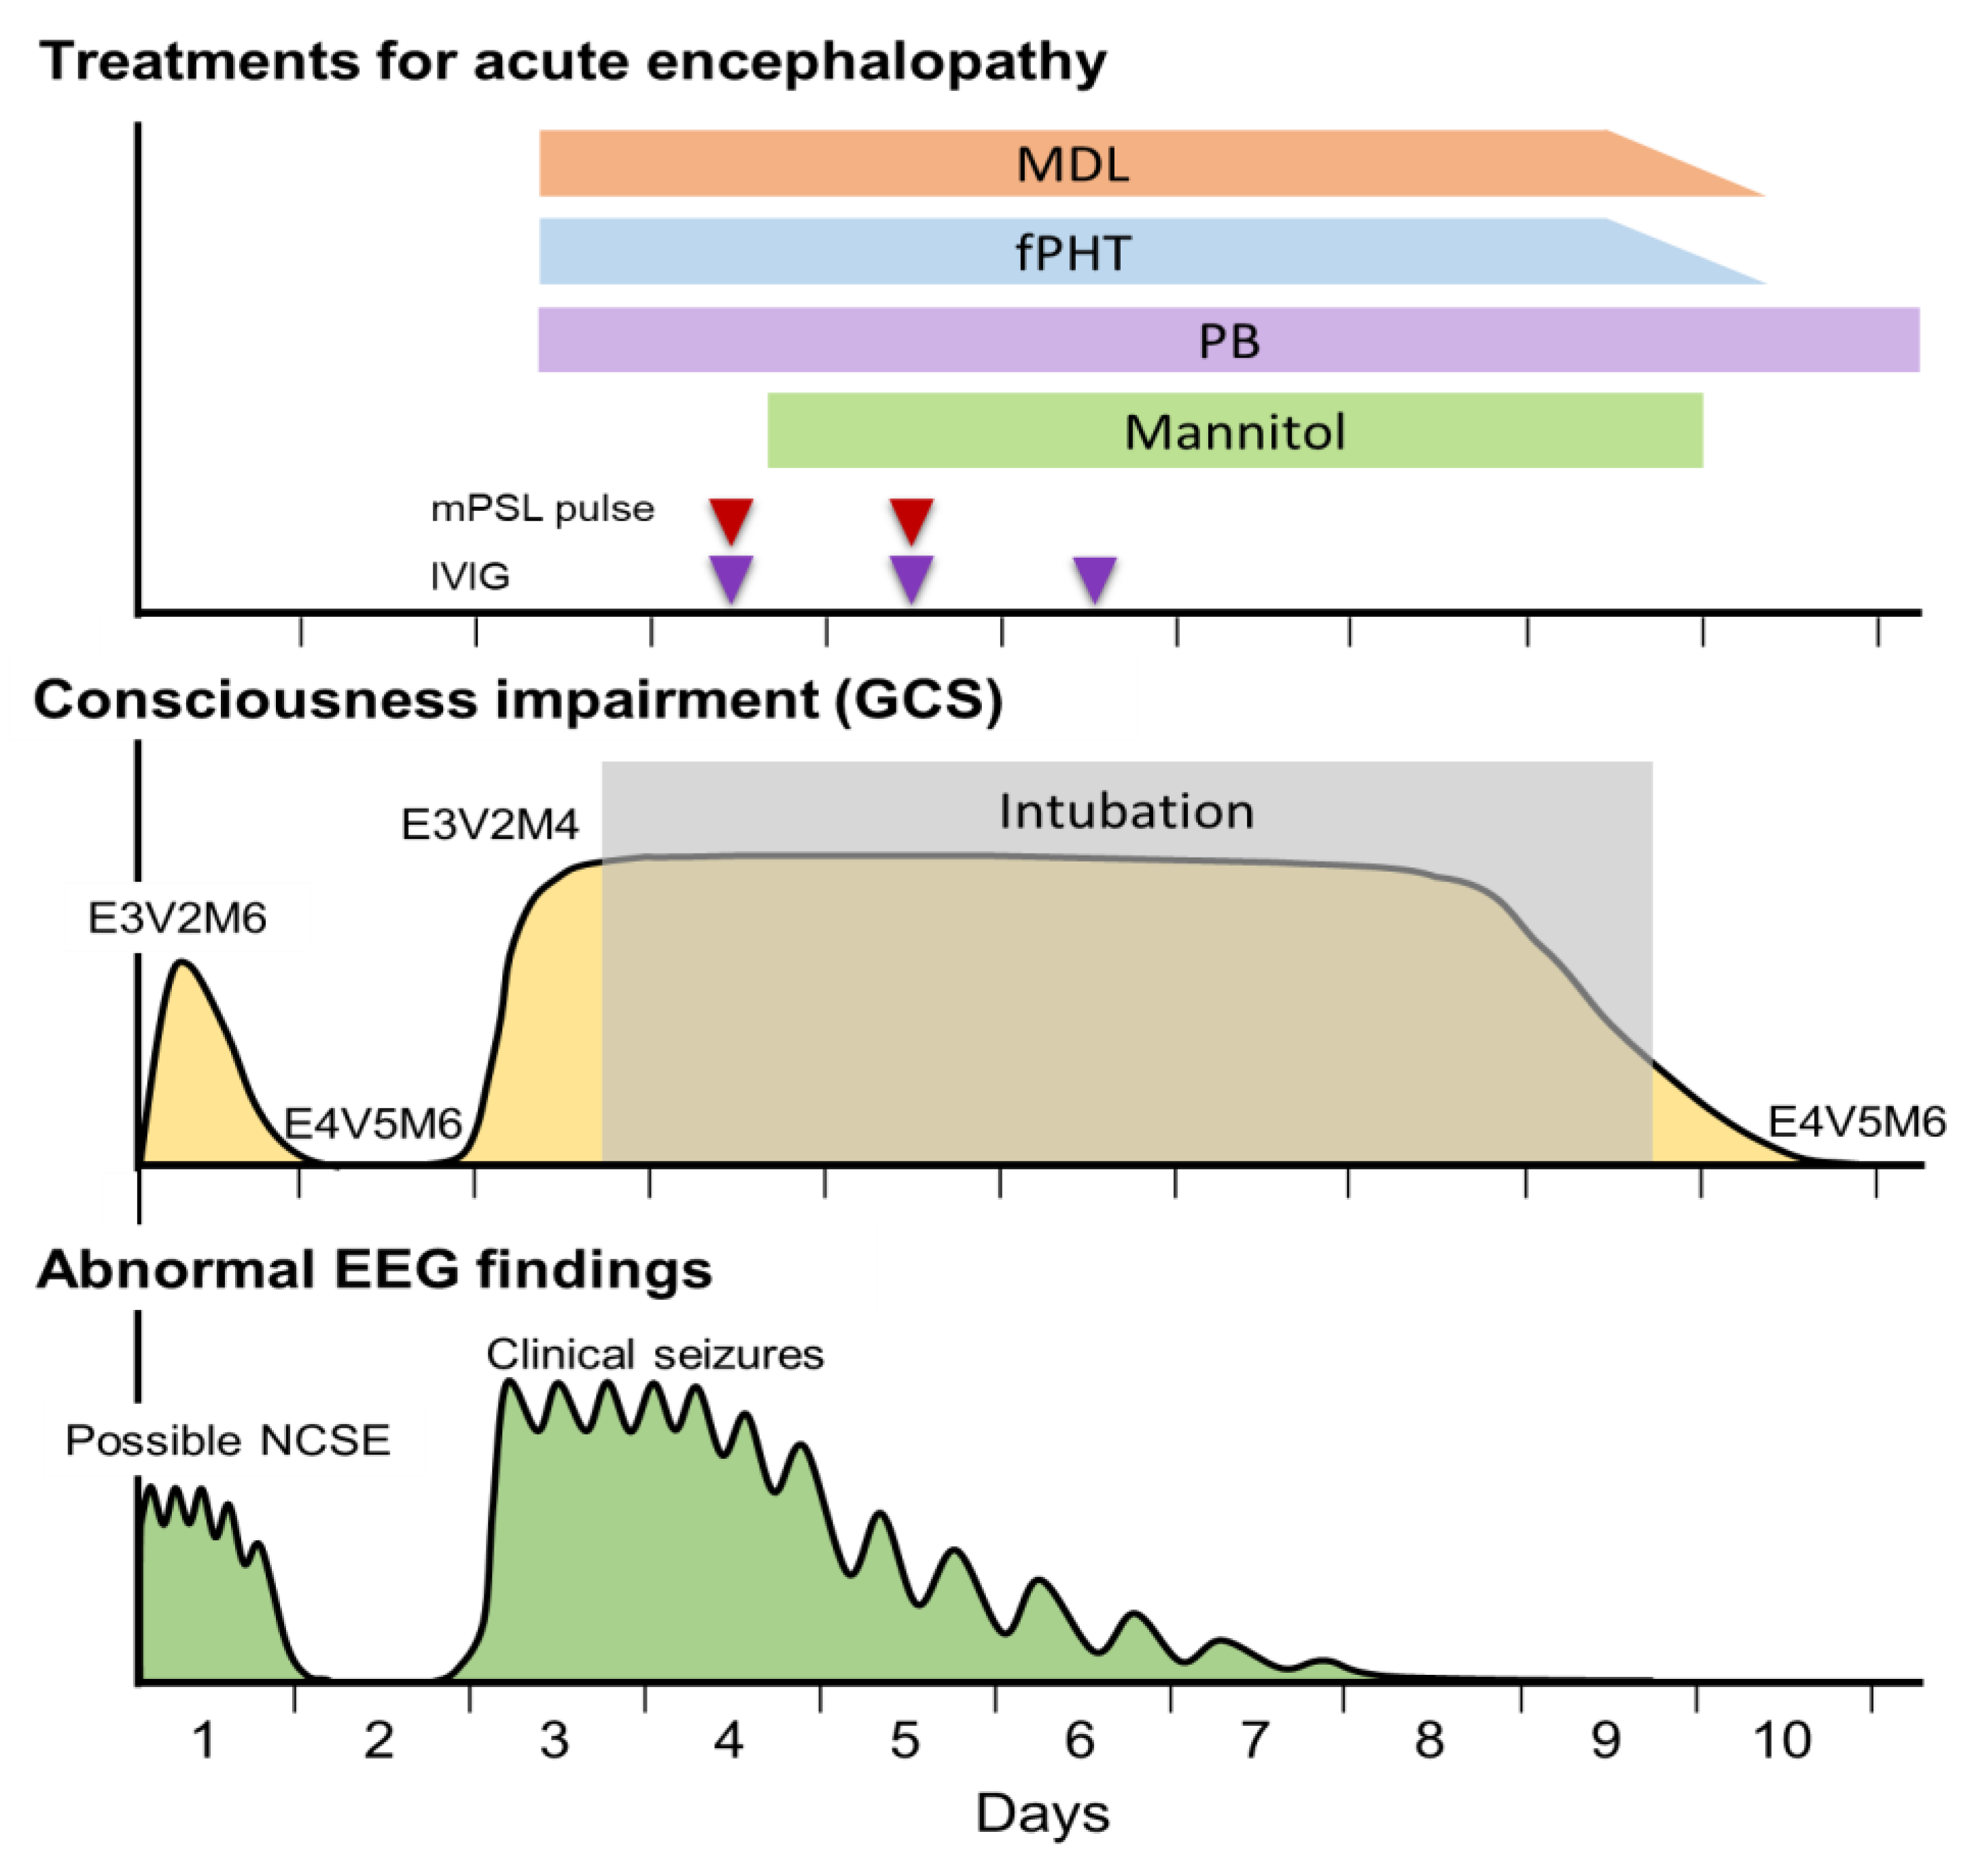
Figure 2.
Changes in imaging findings during the acute to subacute phases. (a) Head CT (Day 1): Diffuse cerebral edema and indistinct corticomedullary borders (white arrowhead). (b) Head MRI-DWI (Day 3): High-intensity lesions can be seen extending throughout the subcortical white matter and deep white matter of the frontal lobes (bright tree appearance, black arrows). In the occipital and lateral temporal lobes, the high-signal extends to the cortex (white arrows). No high-intensity area was observed around the central cerebral sulcus (central sparing). (c) Head MRI T1-weighted imaging (T1WI) during the subacute period (day 23). Curvilinear hyperintense lesions were observed mainly in the cortex of the frontal and occipital lobes (cortical laminar necrosis, black arrows). Significantly decreased volumes of the cerebral cortex hemispheres, basal ganglia, hippocampi, and cerebral corpus callosum were also observed. (d) Proton MR spectroscopy of the parietal lobe (volume of interest, 15x20x20 mm3, echo time=144 msec, repetition time=2000 msec) on day 3. No specific spectrum was observed, except for a slightly inverted lactate peak (black arrow). Lac, lactate; NAA, N-acetylaspartate; Cr, creatine; Cho, choline.
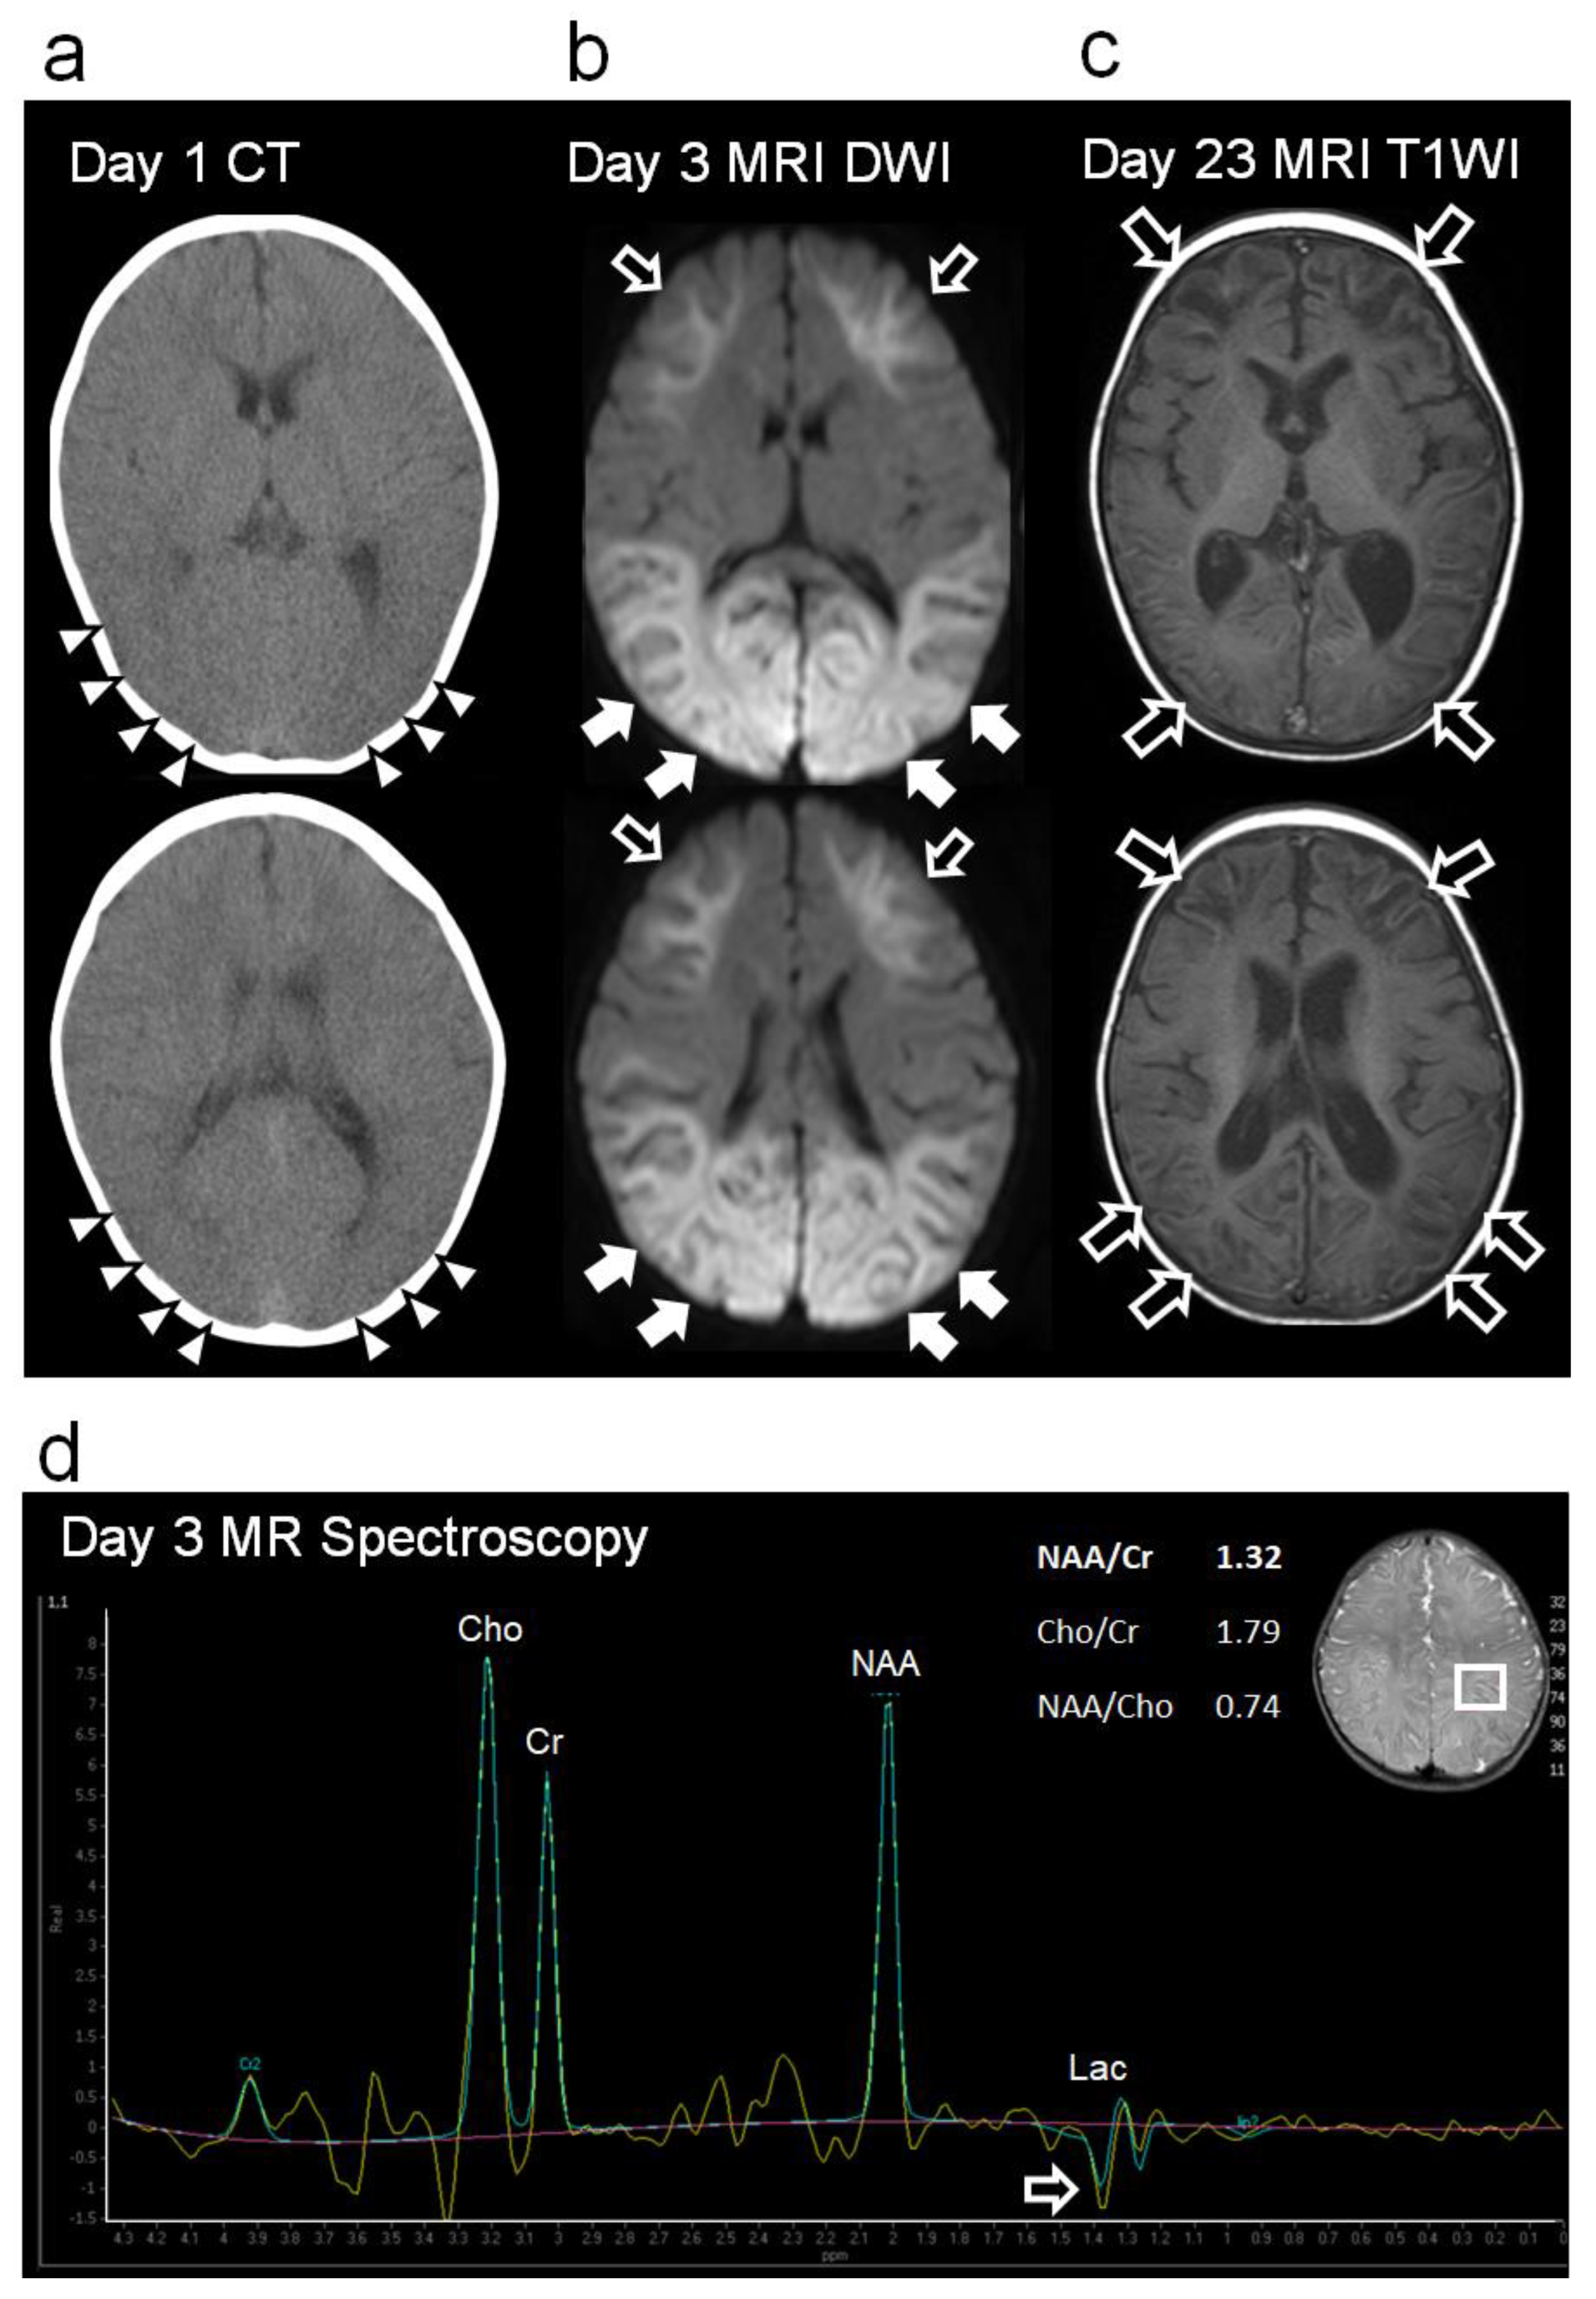
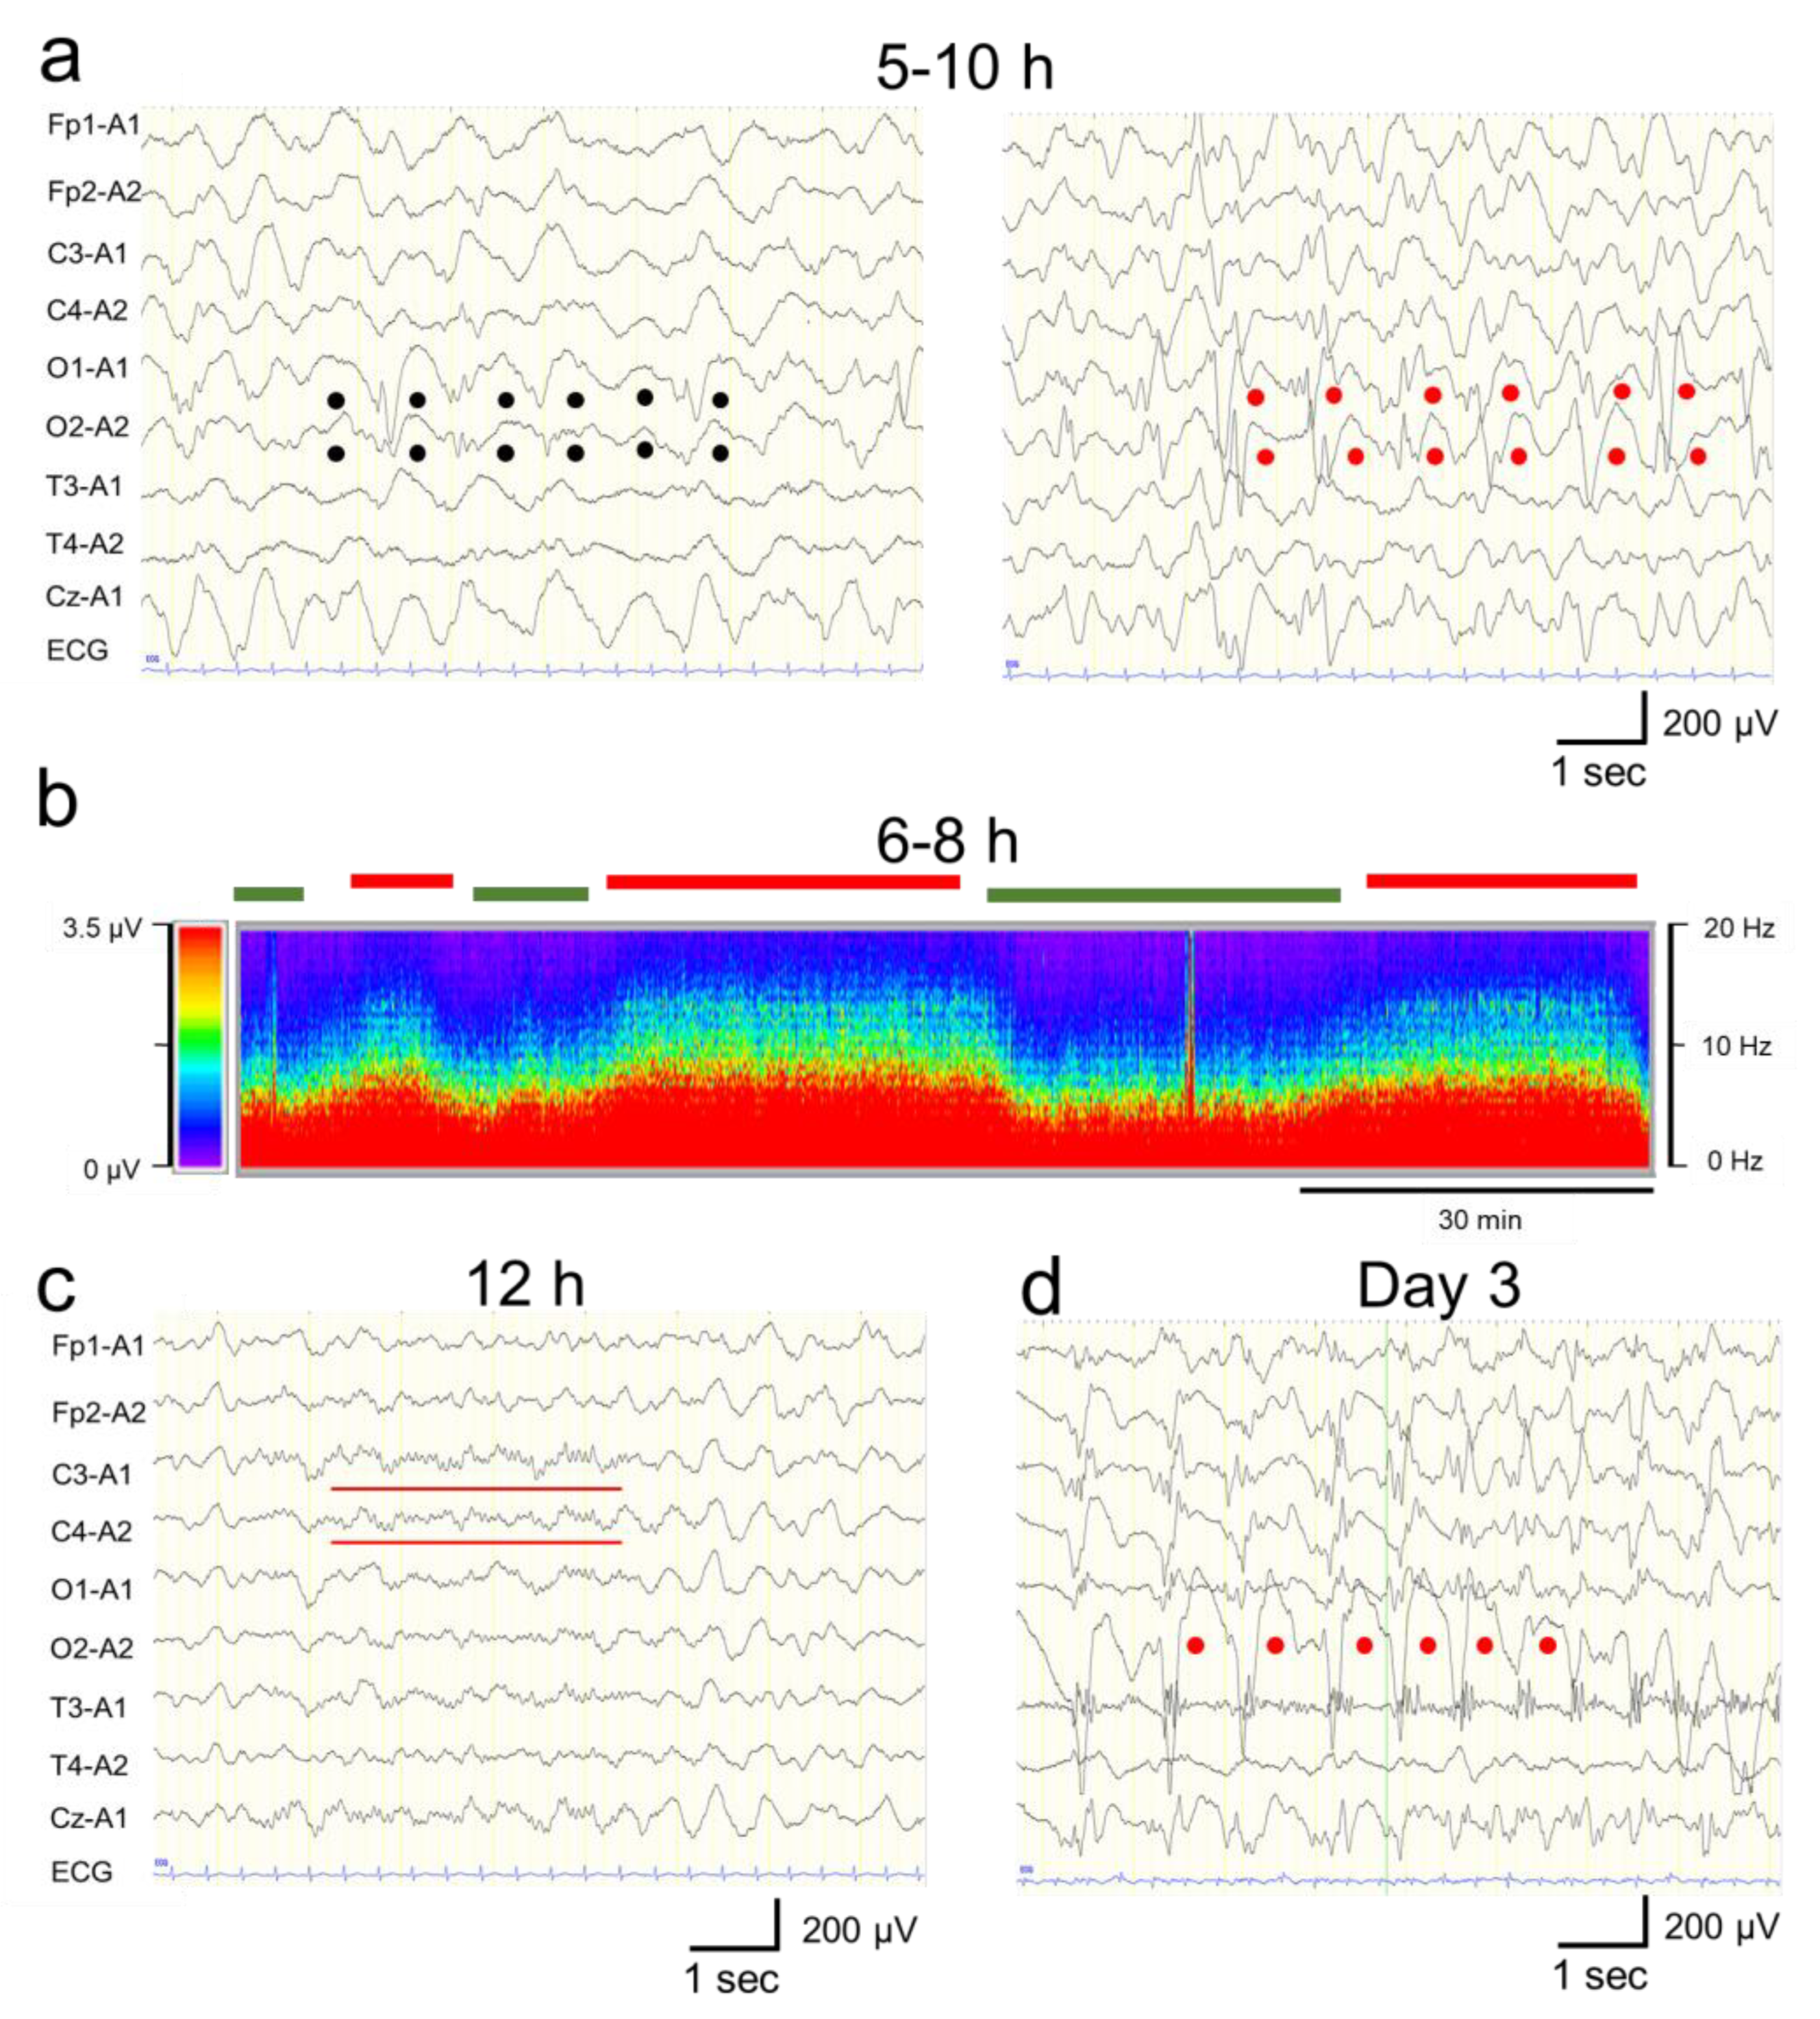
Figure 3.
Electroencephalogram (EEG) findings. (a) EEG findings 9 h after the onset: High-amplitude slow waves (1–3 Hz, 150–250 μV) were observed predominantly in the occipital region (black dots, left panel). Rhythmic 1–3 Hz, 200–350µV spike-and-wave complexes including 6–10 Hz, 200–350 µV spikes were observed predominantly in the bilateral occipital region (red dots, right panel). (b) Density-modulated spectral array obtained from EEG waveforms during the first 6–8 hours from onset. The vertical axis indicates the frequency (in the 0–20 Hz range), the horizontal axis indicates the time, and the color change indicates the amplitude intensity based on the EEG frequency spectrum using the Fast Fourier Transform analysis (in the 0–3.5 µV range). A phase containing 1–3 Hz spike-and-wave components and 6–10 Hz spike components (red lines on top) and a phase consisting of <5 Hz slow waves (green lines) alternating every 15–30 minutes. (c) EEG findings 12 h after the onset. The high-amplitude slow waves and spikes disappeared, and the amplitude decreased throughout the region. Spindle-like fast waves were also observed partially in C3 and C4 (red bars). (d) EEG findings on day 3. Right, occipitally predominant, rhythmic spikes, slow waves, and spike-and-wave complexes were frequently observed (red dots). Monopolar recordings: sensitivity, 10 mV; high-cut filter, 30 Hz; alternating current filter, off; time constant, 0.1 s.
Disclaimer/Publisher’s Note: The statements, opinions and data contained in all publications are solely those of the individual author(s) and contributor(s) and not of MDPI and/or the editor(s). MDPI and/or the editor(s) disclaim responsibility for any injury to people or property resulting from any ideas, methods, instructions or products referred to in the content. |
© 2023 by the authors. Licensee MDPI, Basel, Switzerland. This article is an open access article distributed under the terms and conditions of the Creative Commons Attribution (CC BY) license (http://creativecommons.org/licenses/by/4.0/).
Copyright: This open access article is published under a Creative Commons CC BY 4.0 license, which permit the free download, distribution, and reuse, provided that the author and preprint are cited in any reuse.


