Submitted:
27 April 2023
Posted:
04 May 2023
You are already at the latest version
Abstract
Keywords:
1. Introduction
2. Materials and Methods
2.1. Optical imaging techniques
2.2. X-ray tomography
2.3. Sub-100 nm surface texturing
3. Results
3.1. Spider scales: peacock spider
3.2. Spider silk
4. Discussion
4.1. Polychromatic polarizing module
4.2. Four-polarisation camera
4.3. Stokes parameters from 4-pol. imaging
4.4. Nanotextured surfaces for analysis of polarisation anisotropy in reflection
5. Conclusions and Outlook
Supplementary Materials
Acknowledgments
Appendix A. Complex and larger fibers
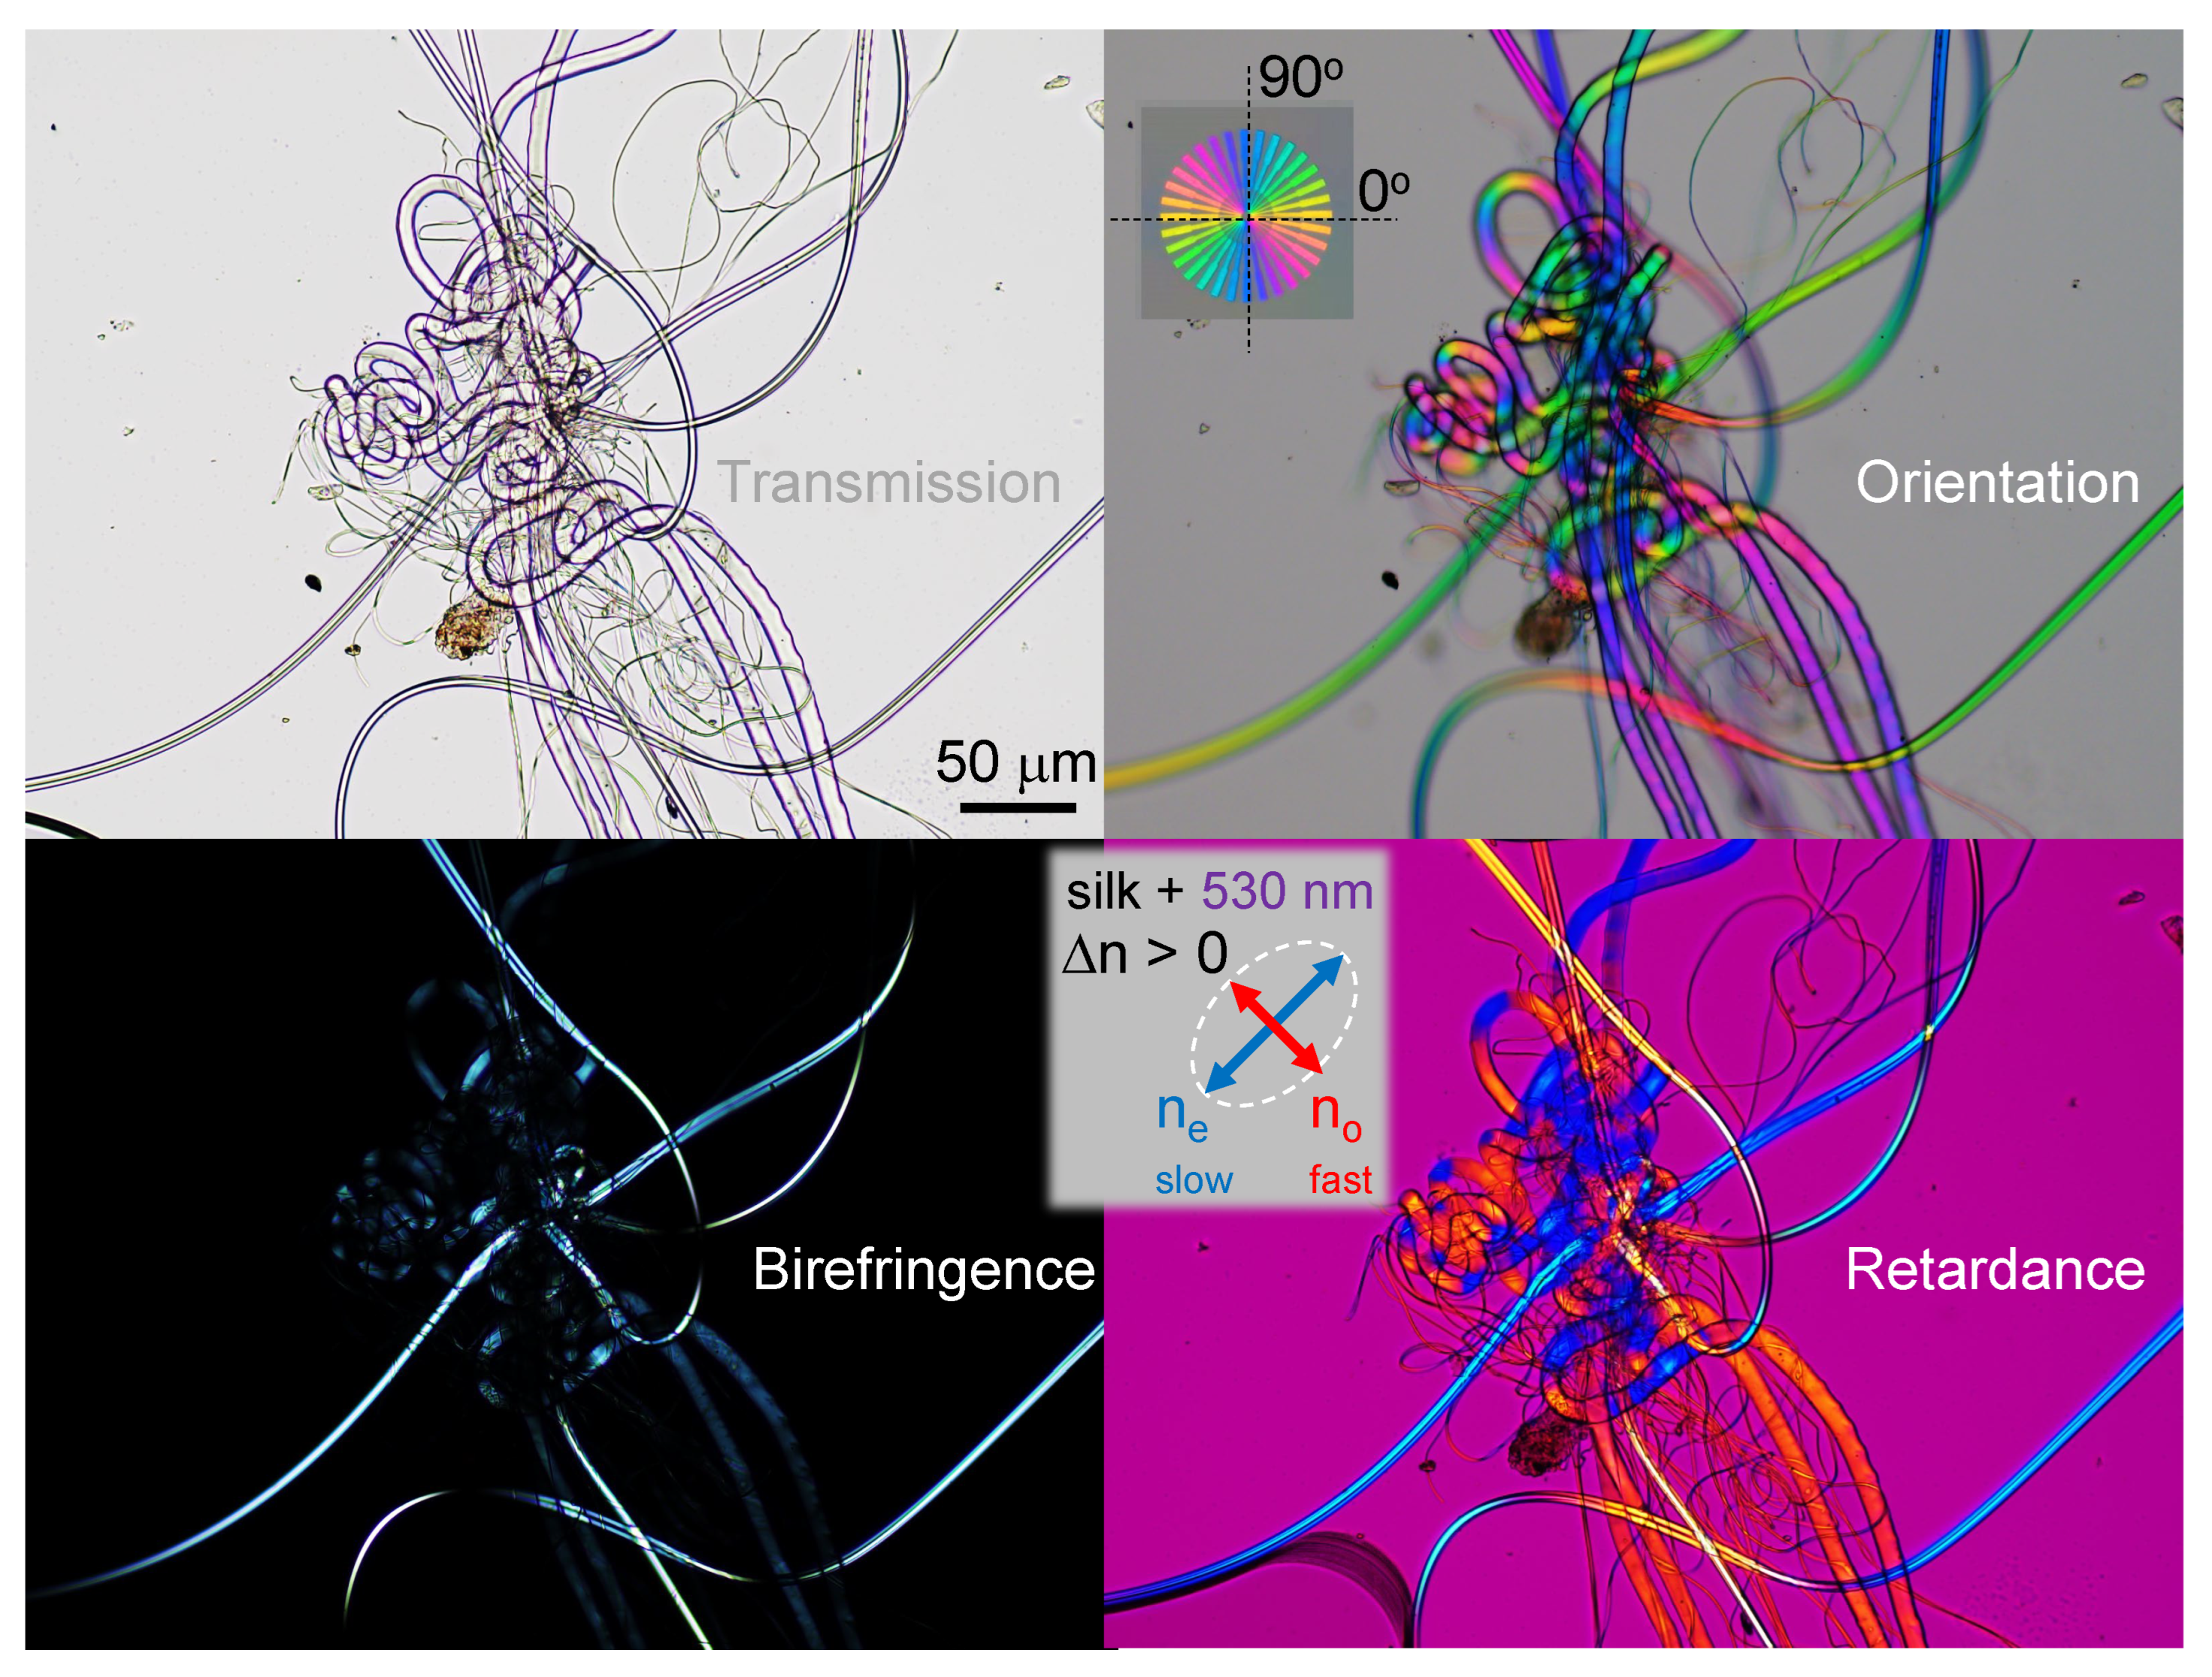
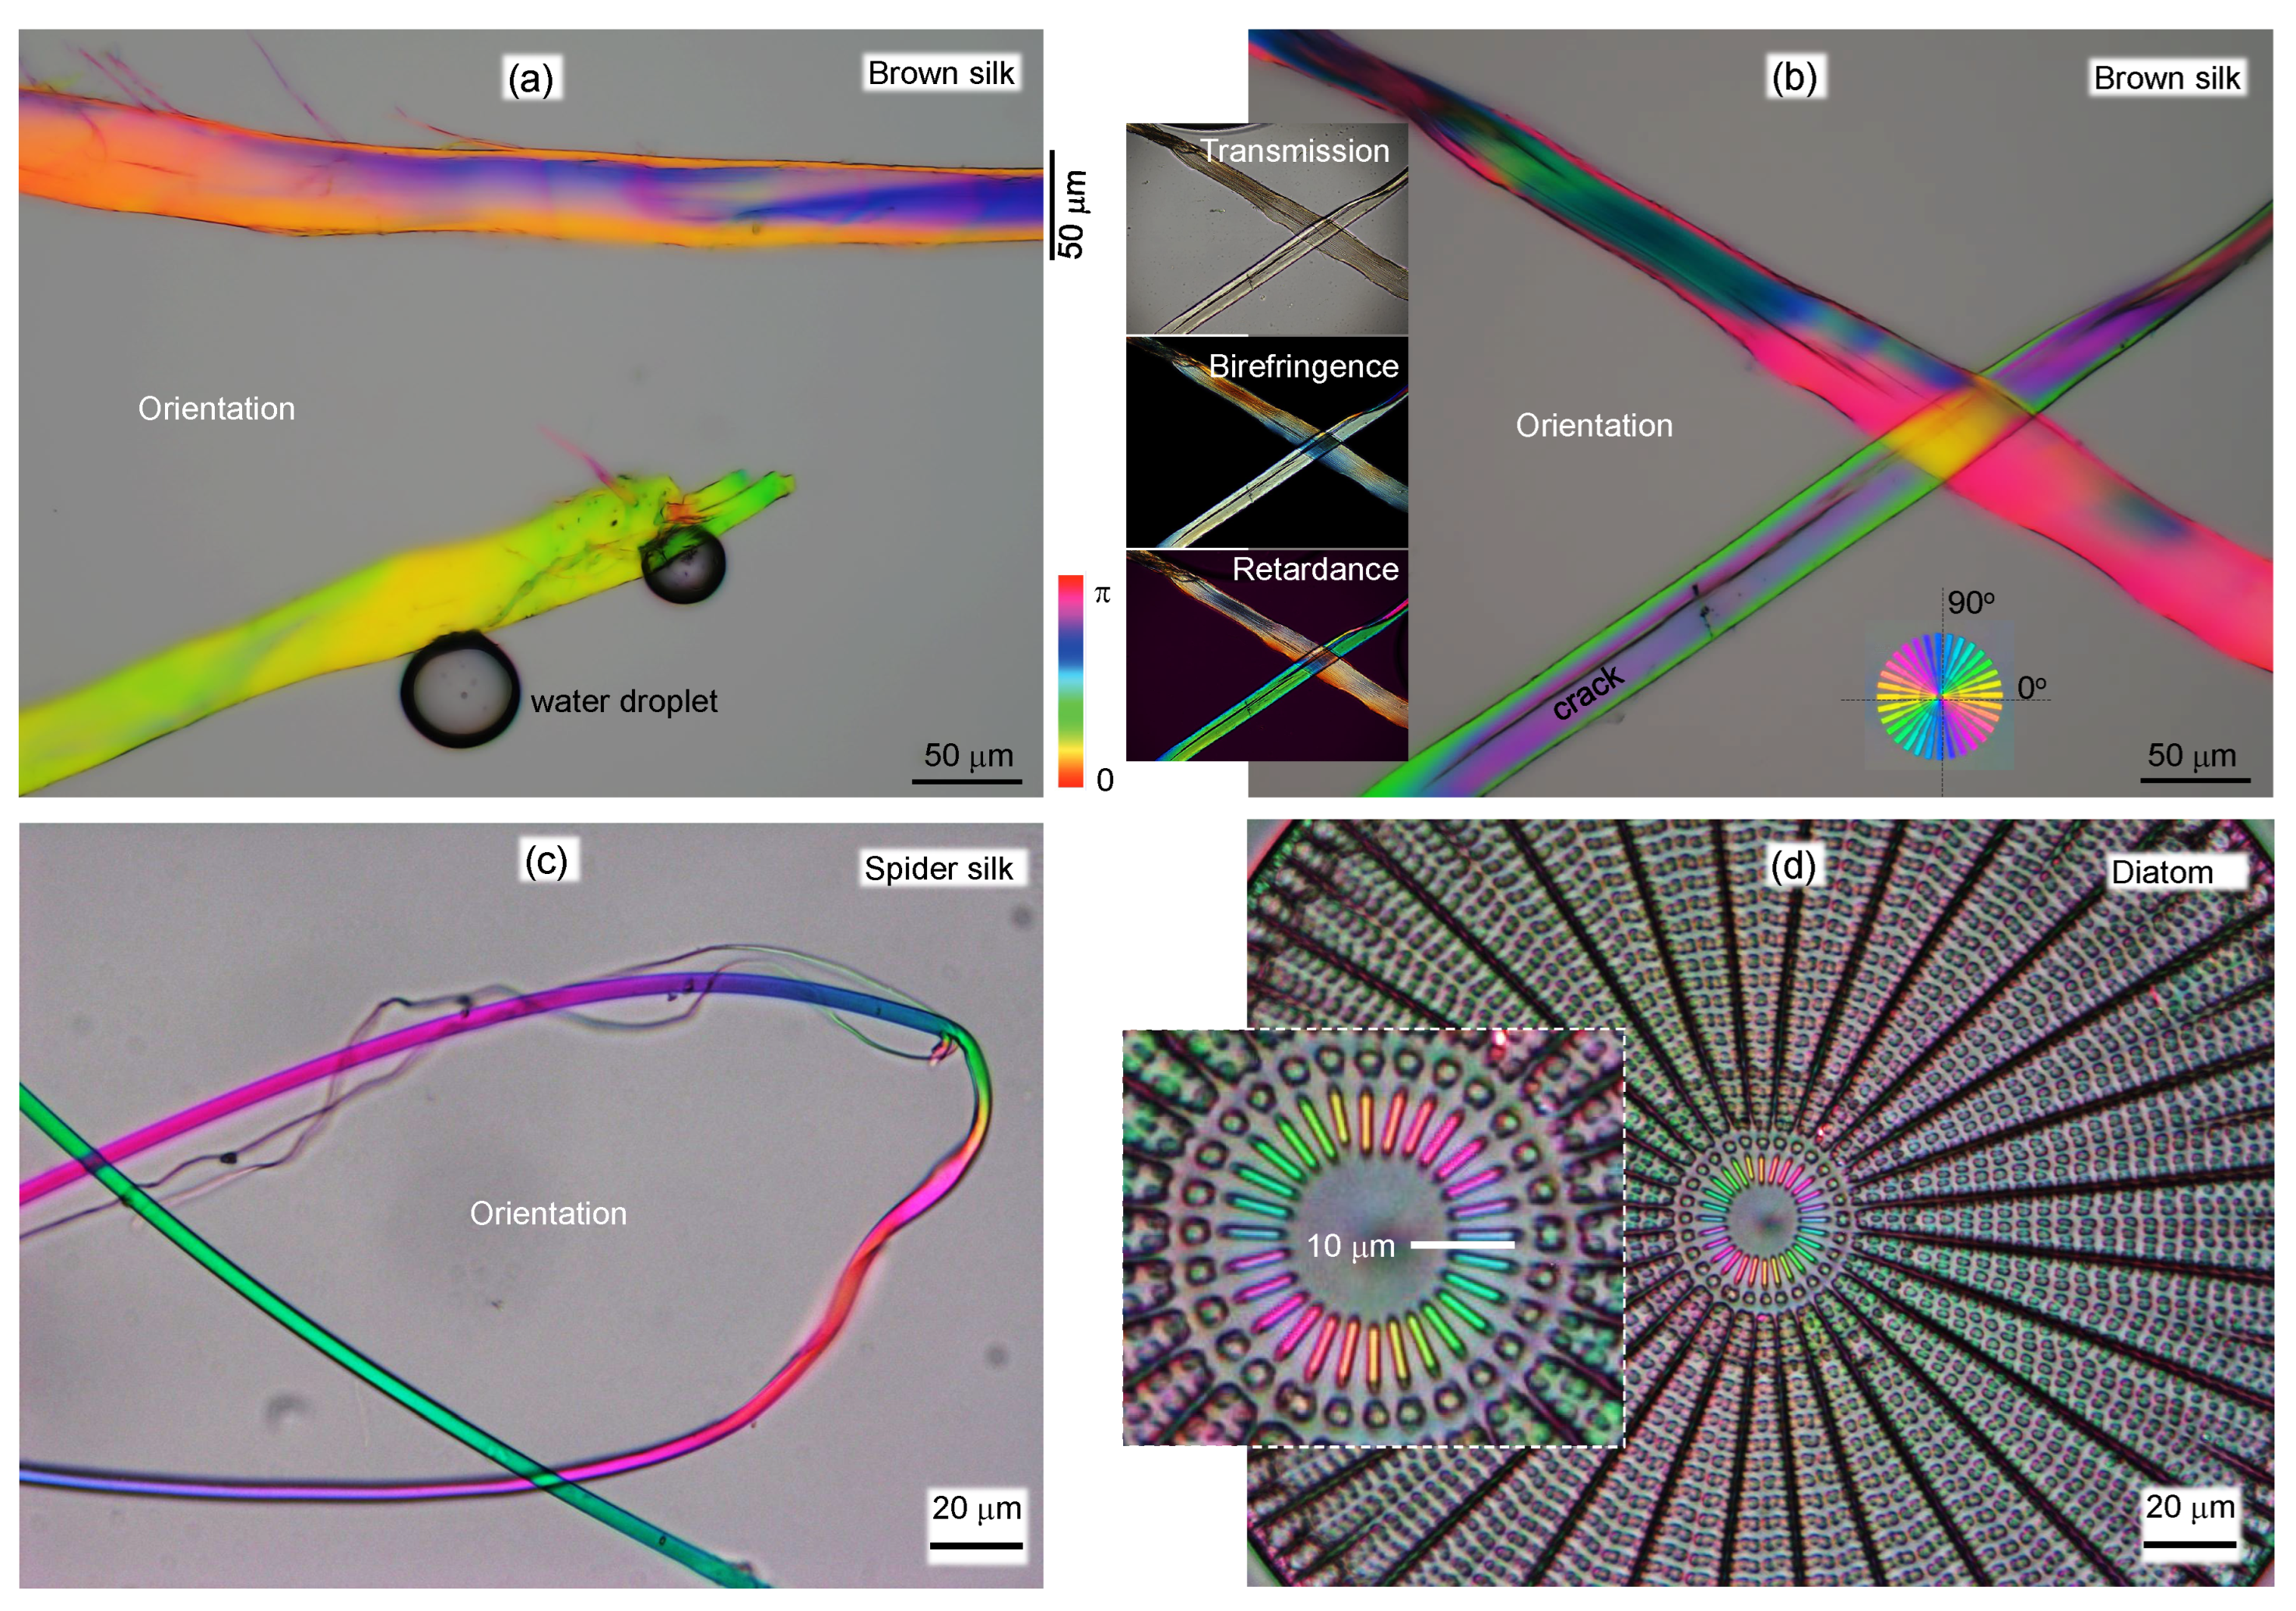
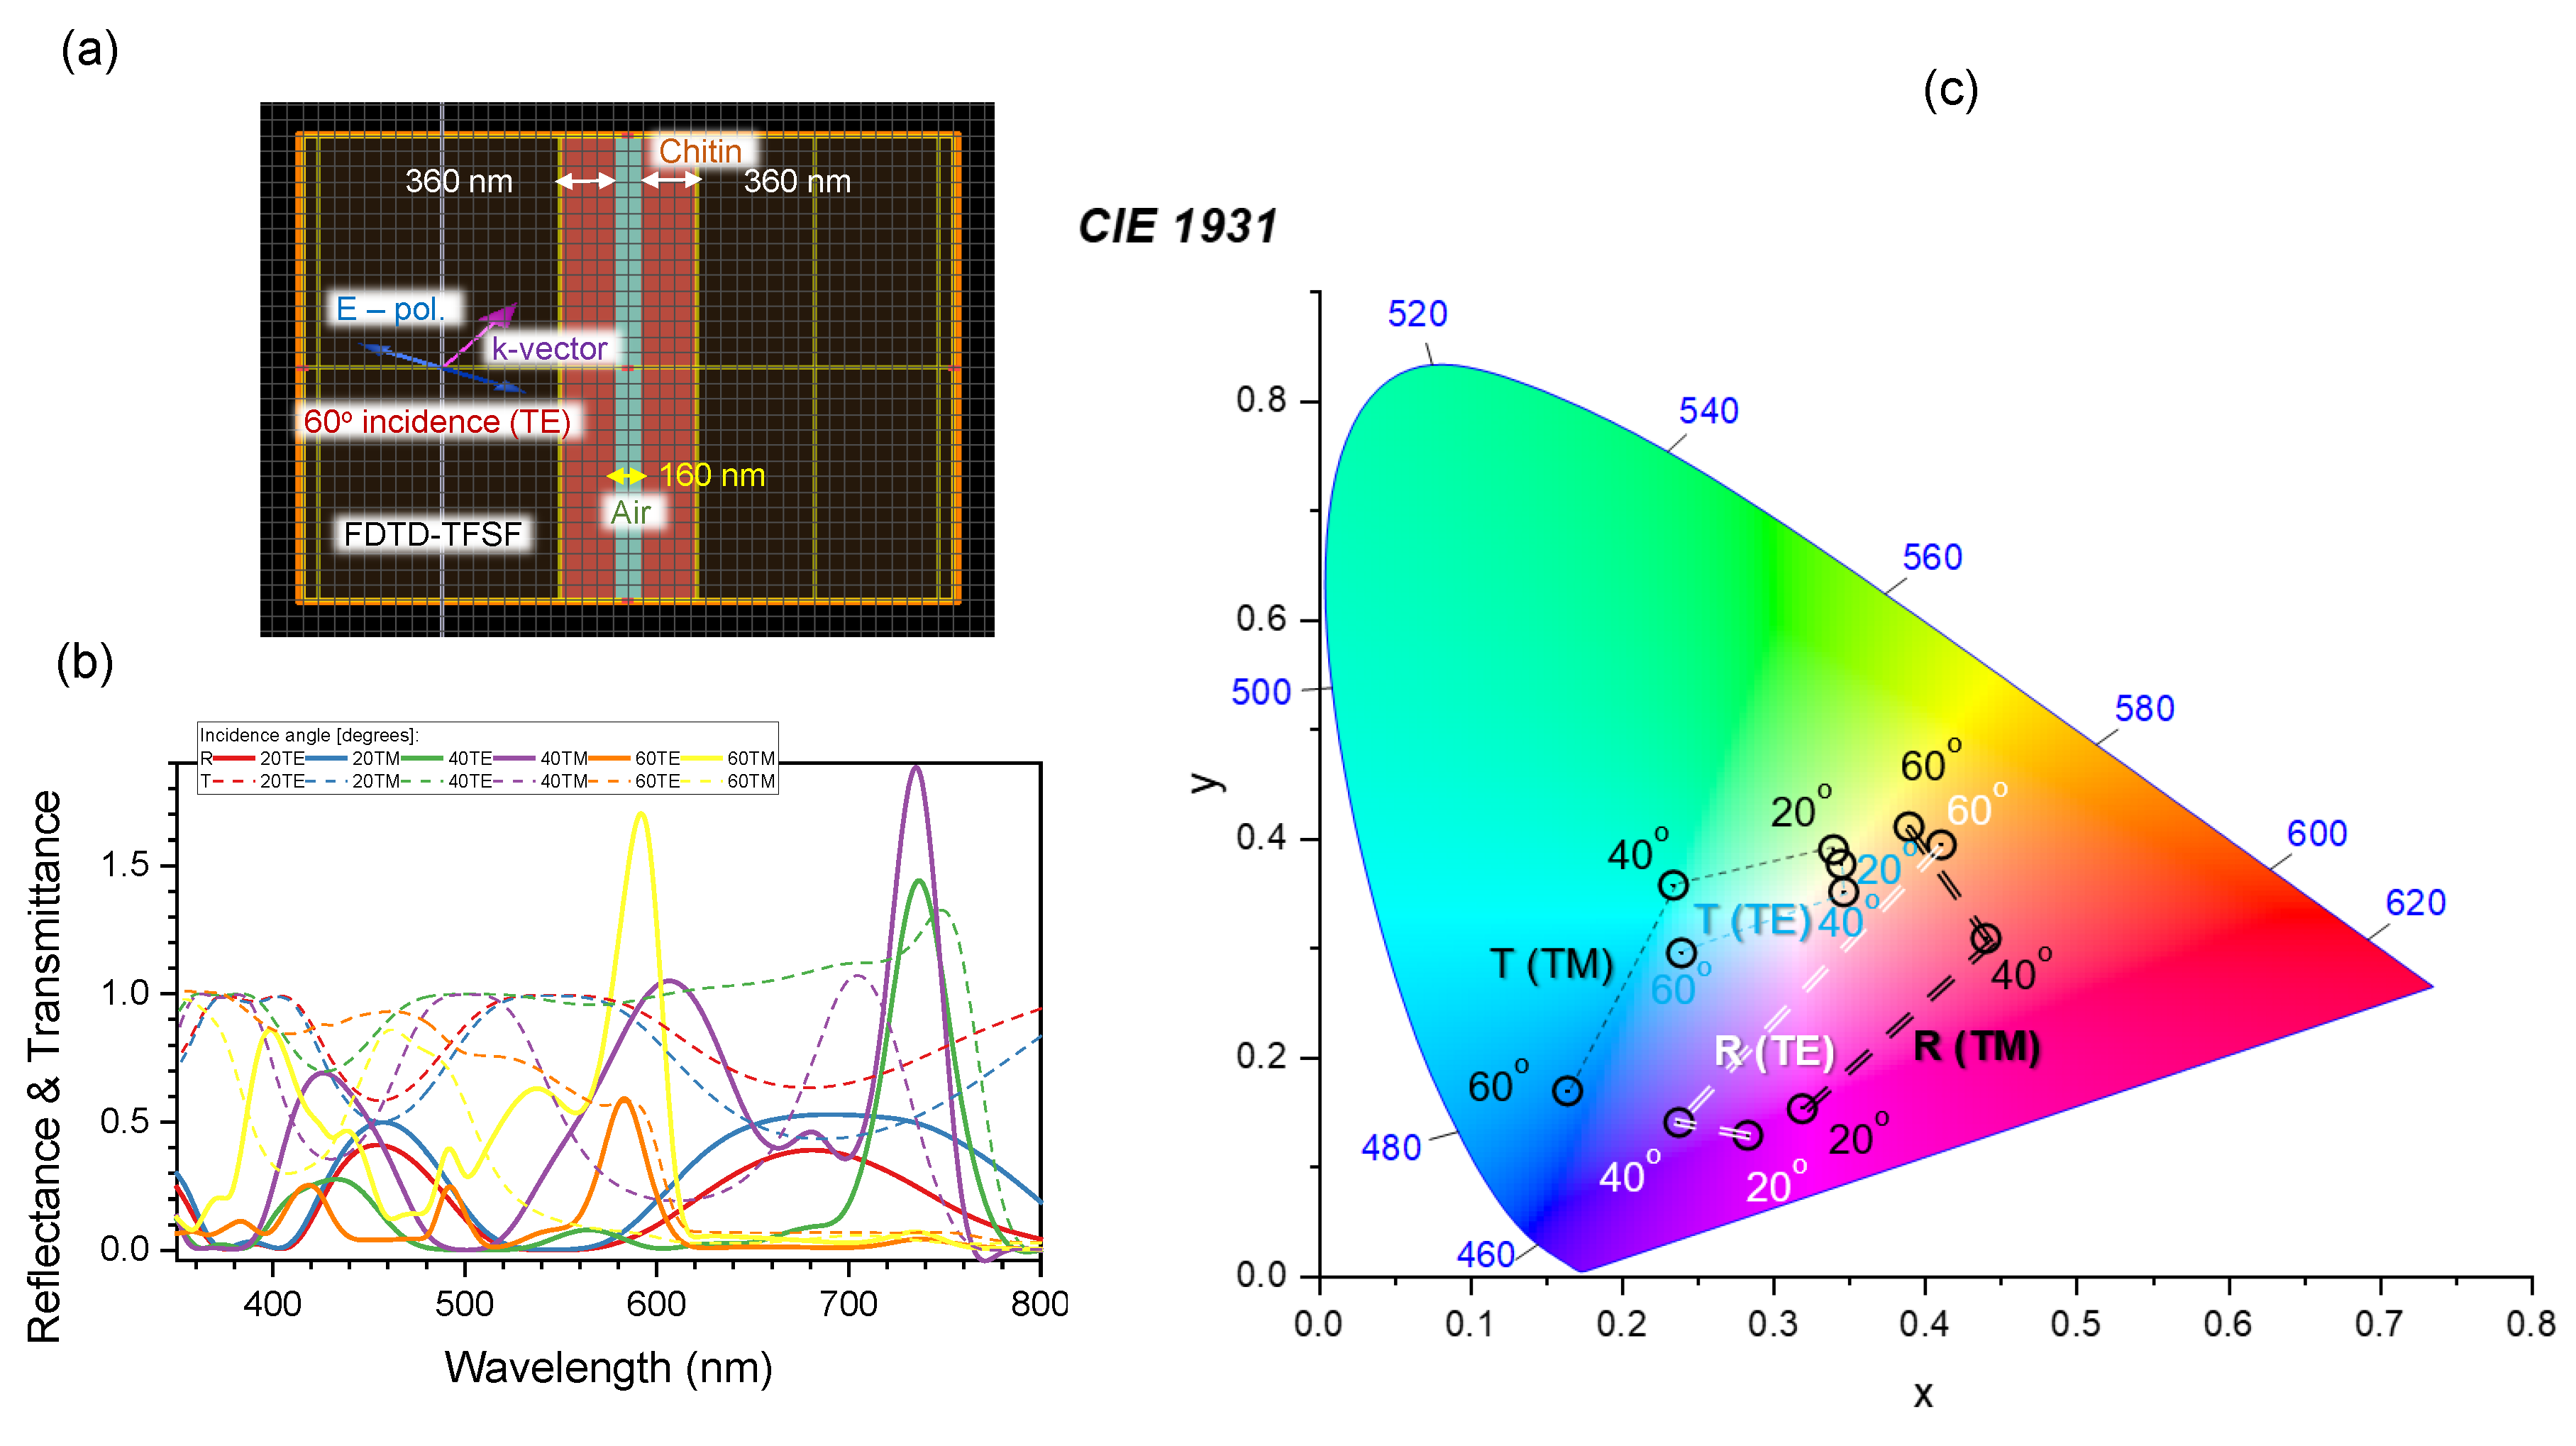
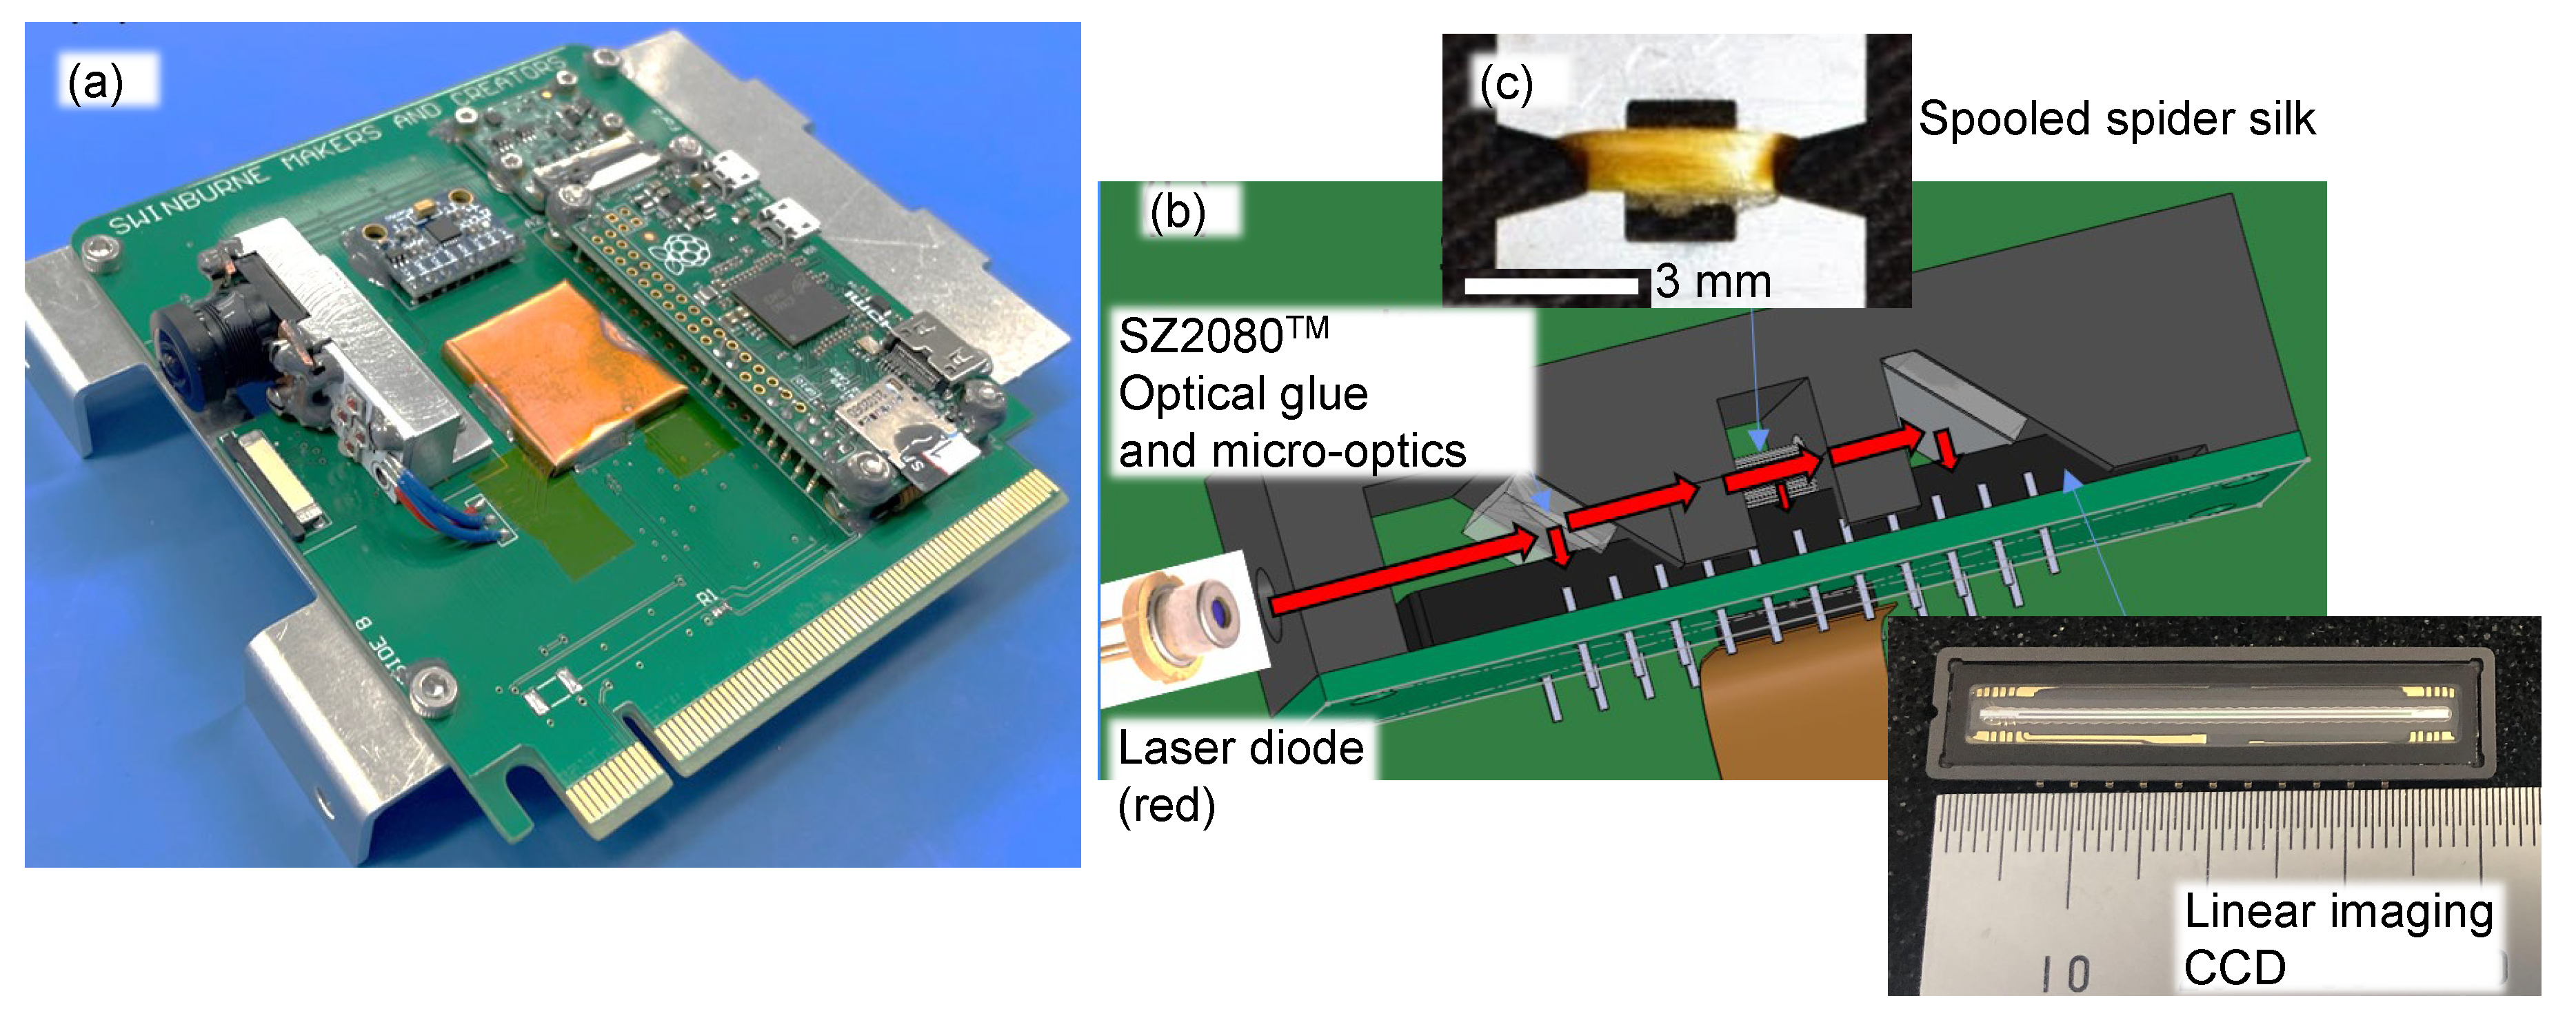
Appendix B. Model: spider scale illuminated at an angle
Appendix C. Spider silk test in outer space
References
- M. Rothammer, C. Zollfrank, K. Busch, and G. von Freymann, “Tailored disorder in photonics: Learning from nature,” Adv. Optical Mater. 9, 2100787 (2021). [CrossRef]
- A. Parker and Z. Hegedus, “Diffractive optics in spiders,” J. Opt. A: Pure Appl. Opt. 5, S111 (2003). [CrossRef]
- Natural History Museum Bern, “World spider catalog. version 24,” Online; accessed on. 26 March 2023.
- S. Kariko, J. Timonen, J. Weaver, D. Gur, C. Marks, L. Leiserowitz, M. Kolle, and L. Li, “Structural origins of coloration in the spider phoroncidia rubroargentea berland, 1913 (araneae: Theridiidae) from madagascar,” J. R. Soc. Interface 15, 20170930 (2018).
- M. John and S. Thomas, “Biofibres and biocomposites,” Carbohydrate polymers 71, 343–364 (2008). [CrossRef]
- M. Ryu, R. Honda, A. Reich, A. Cernescu, J.-L. Li, J. Hu, S. Juodkazis, and J. Morikawa, “Near-field IR orientational spectroscopy of silk,” Appl. Sci. 9, 3991 (2019). [CrossRef]
- H. Fujisawa, M. Ryu, S. Lundgaard, D. Linklater, E. Ivanova, Y. Nishijima, S. Juodkazis, and J. Morikawa, “Direct measurement of temperature diffusivity of nanocellulose-doped biodegradable composite films,” Micromachines 11, 738 (2020). [CrossRef]
- M. Ryu, A. Balčytis, X. Wang, J. Vongsvivut, Y. Hikima, J. Li, M. J. Tobin, S. Juodkazis, and J. Morikawa, “Orientational mapping augmented sub-wavelength hyper-spectral imaging of silk,” Sci. Reports 7, 7419 (2017). [CrossRef]
- M. Ryu, H. Kobayashi, A. Balcytis, X. Wang, J. Vongsvivut, J. Li, N. Urayama, V. Mizeikis, M. Tobin, and S. Juodkazis, “Nanoscale chemical mapping of laser-solubilized silk,” Mater. Res. Express 4, 115028 (2017). [CrossRef]
- M. Ryu, R. Honda, A. Cernescu, A. Vailionis, A. Balcytis, J. Vongsvivut, J.-L. Li, D. Linklater, E. Ivanova, V. Mizeikis, M. Tobin, and J. M. S. Juodkazis, “Nanoscale optical and structural characterisation of silk,” Beilstein J. Nanotechnol. 10, 922–929 (2019). [CrossRef]
- W. P. Moestopo, S. Shaker, W. Deng, and J. R. Greer, “Knots are not for naught: Design, properties, and topology of hierarchical intertwined microarchitected materials,” Science Advances 9, eade6725 (2023). [CrossRef]
- S. Blamires, M. Nobbs, P. Martens, I. Tso, W. Chuang, C. Chang, and H. Sheu, “Multiscale mechanisms of nutritionally-induced property variation in spider silk,” PLoS One 13, e0192005 (2018). [CrossRef]
- S. Blamires, D. Little, T. White, and D. Kane, “Photoreflectance/scattering measurements of spider silks informed by standard optics,” Royal Society Open Science 7, 192174 (2020). [CrossRef]
- S. Blamires, G. Cerexhe, T. White, M. Herberstein, and M. Kasumovic, “Spider silk colouration co-varies with thermal properties but not protein structure,” J. Royal Society Interface 16, 20190199 (2019).
- A. Balčytis, M. Ryu, X. Wang, F. Novelli, G. Seniutinas, S. Du, X. Wang, J. Li, J. Davis, D. Appadoo, J. Morikawa, and S. Juodkazis, “Silk: Optical properties over 12.6 octaves THz-IR-Visible-UV range,” Materials 10, 356 (2017).
- M. Rajabi, O. Lavrentovich, and M. Shribak, “Instantaneous mapping of liquid crystal orientation using a polychromatic polarizing microscope,” Liquid Crystals, 1–10 (2023). [CrossRef]
- H. Masuda and K. Fukuda, “Ordered metal nanohole arrays made by a two-step replication of honeycomb structures of anodic alumina,” Science 268, 1466 (1995). [CrossRef]
- H. Masuda and M. Satoh, “Fabrication of gold nanodot array using anodic porous alumina as an evaporation mask,” Jpn. J. Appl. Phys.-Part 2 Lett. 35, 126 (1996). [CrossRef]
- T. Kondo, T. Fukushima, K. Nishio, and H. Masuda, “Surface-enhanced raman scattering in hierarchical structures of au formed using templates by site-controlled tunnel etching of Al,” Applied Physics Express 2, 125001 (2009). [CrossRef]
- H. Masuda, T. Yanagishita, and T. Kondo, “Encyclopedia of interfacial chemistry: Surface science and electrochemistry,” (Elsevier, 2018) Chap. Fabrication of Anodic Porous Alumina, pp. 226–235, 1st ed.
- A. Ingram and A. Parker, “Diffractive optics in spiders,” Philos Trans R Soc Lond B Biol Sci. 363, 2465–2480 (2008).
- A. Saito, M. Yonezawa, J. Murase, S. Juodkazis, V. Mizeikis, M. Akai-Kasaya, and Y. Kuwahara, “Numerical analysis on the optical role of nanometer scale randomness on the morpho butterfly’s scale,” J. Nanosci. Nanotechnol. 11, 2785–2792 (2011).
- A. Saito, K. Yamashita1, T. Hattori, and Y. Kuwahara, “Novel optical applications inspired by the morpho butterfly’s coloration: technology transfer from reflection to transmission,” Jpn. J. Appl. Phys. 61, SD0801 (2022). [CrossRef]
- D. Stavenga, J. Otto, and B. Wilts, “Splendid coloration of the peacock spider Maratus splendens,” J. R. Soc. Interface 2016, 20160437 (2016).
- D. McCoy, V. McCoy, N. Mandsberg, A. Shneidman, J. Aizenberg, R. Prum, and D. Haig, “Structurally assisted super black in colourful peacock spiders,” Proc Biol Sci. 286, 20190589 (2019). [CrossRef]
- M. Han, D. Smith, S.-H. Ng, Z. Vilagosh, V. Anand, T. Katkus, I. Reklaitis, H. Mu, M. Ryu, J. Morikawa, J. Vongsvivut, D. Appadoo, and S. Juodkazis, “THz filters made by laser ablation of stainless steel and kapton film,” Micromachines 13, 1170 (2022).
- R. Honda, M. Ryu, J.-L. Li, V. Mizeikis, S. Juodkazis, and J. Morikawa, “Simple multi-wavelength imaging of birefringence:case study of silk,” Sci. Rep. 8, 17652 (2018). [CrossRef]
- Y. Shimotsuma, P. Kazansky, J. Qiu, and K. Hirao, “Self-organized nanogratings in glass irradiated by ultrashort light pulses,” Phys. Rev. Lett. 91, 247405 (2003). [CrossRef]
- M. Ryu, Y. Nishijima, S. M. N. To, T. Hashizume, R. Matsubara, A. Kubono, J. Hu, S. Ng, S. Juodkazis, and J. Morikawa, “Hyperspectral molecular orientation mapping in metamaterials,” Appl. Sci. 11, 1544 (2021). [CrossRef]
- Y. Hikima, J. Morikawa, and T. Hashimoto, “FT-IR image processing algorithms for in-plane orientation function and azimuth angle of uniaxially drawn polyethylene composite film,” Macromolecules 44, 3950–3957 (2011). [CrossRef]
- R. Honda, M. Ryu, M. Moritake, A. Balcytis, V. Mizeikis, J. Vongsvivut, M. J. Tobin, D. Appadoo, J.-L. Li, S. H. Ng, S. Juodkazis, and J. Morikawa, “Hyperspectral mapping of anisotropy,” Nanoscale Horizons 4, 1443–1449 (2019).
- R. Honda, M. Ryu, A. Balcytis, J. Vongsvivut, M. J. Tobin, S. Juodkazis, and J. Morikawa, “Paracetamol micro-structure analysis by optical mapping,” Appl.Surf. Sci. 473, 127–132 (2019).
- G. Stavenga, B. Wilts, H. Leertouwer, and T. Hariyama, “Polarized iridescence of the multilayered elytra of the japanese jewel beetle, Chrysochroa fulgidissima,” Philos. Trans. R. Soc. Lond. B Biol. Sci. 366, 709–723 (2011).
- E. Collett, Polarization, 3rd ed. (SPIE Press, Field guides, Bellingham, 2005).
- D. Linklater, S. Juodkazis, and E. Ivanova, “Nanofabrication of mechano-bactericidal surfaces,” Nanoscale 9, 16564–16585 (2017). [CrossRef]
- D. Linklater, H. Nguyen, C. Bhadra, S. Juodkazis, and E. Ivanova, “Influence of nanoscale topology on bactericidal efficiency of black silicon surfaces,” Nanotechnology 28, 469501 (2017). [CrossRef]
- D. Linklater, V. Baulin, S. Juodkazis, R. Crawford, P. Stoodley, and E. Ivanova, “Mechano-bactericidal actions of nanostructured surfaces,” Nature Reviews Microbiology 19, 8–22 (2021). [CrossRef]
- D. Linklater, S. Saita, T. Murata, T. Yanagishita, C. Dekiwadia, R. Crawford, H. Masuda, H. Kusaka, and E. Ivanova, “Nanopillar polymer films as antibacterial packaging materials,” ACS Appl. Nano Mater. 5, 2578–2591 (2022). [CrossRef]
- R. Honda, M. Ryu, M. Moritake, A. Balcytis, V. Mizeikis, J. Vongsvivut, M. J. Tobin, D. Appadoo, J.-L. Li, S. H. Ng, S. Juodkazis, and J. Morikawa, “Infrared polariscopy imaging of linear polymeric patterns with a focal plane array,” Nanomaterials 9, 732 (2019). [CrossRef]
- S. Ng, B. Allan, D. Ierodiaconou, V. Anand, A. Babanin, and S. Juodkazis, “Drone polariscopy—towards remote sensing applications,” Eng. Proc. 11, 46 (2021).
- E. Brasselet, G. Gervinskas, G. Seniutinas, and S. Juodkazis, “Topological shaping of light by closed-path nanoslits,” Phys. Rev. Lett. 111, 193901 (2013). [CrossRef]
- Y. Nishijima, R. Komatsu, S. Ota, G. Seniutinas, A. Balčytis, and S. Juodkazis, “Anti-reflective surfaces: Cascading nano/microstructuring,” Appl. Phys. Lett.: Photonics 1, 076104 (2016). [CrossRef]
- E. P. Ivanova, J. Hasan, H. K. Webb, G. Gervinskas, S. Juodkazis, V. K. Truong, A. H. F. Wu, R. N. Lamb, V. Baulin, G. S. Watson, J. A. Watson, D. E. Mainwaring, and R. J. Crawford, “Bactericidal activity of nanostructured black silicon,” Nature Commun. 4, 2838 (2013).
- T. Nagai, K.-I. Yuyama, T. Shoji, Y. Matsumura, D. Linklater, E. Ivanova, S. Juodkazis, and Y. Tsuboi, “Wavelength-sensitive optical tweezers using black-si nanospikes for controlling the internal polarity of a polymer droplet,” ACS Appl. Nano Mater. 6, 180–189 (2023). [CrossRef]
- M. Ryu, S. Ng, M. Han, V. Anand, T. Katkus, J. Vongsvivut, D. Appadoo, Y. Nishijima, S. Juodkazis, and J. Morikawa, “Polariscopy with optical near-fields,” Nanoscale Horiz. 7, 1047–1053 (2022). [CrossRef]
- M. Ryu, S. Ng, V. Anand, S. Lundgaard, J. Hu, T. Katkus, D. Appadoo, Z. Vilagosh, A. Wood, S. Juodkazis, and J. Morikawa, “Attenuated total reflection at thz wavelengths: Prospective use of total internal reflection and polariscopy,” Applied Sciences 11, 7632 (2021). [CrossRef]
- “A mini-atlas of diatom frustule electron microscopy images at different magnifications,” Materials Today: Proceedings 33, 1924–1933 (2020), 10th International Conference on Key Engineering Materials 2020.

Disclaimer/Publisher’s Note: The statements, opinions and data contained in all publications are solely those of the individual author(s) and contributor(s) and not of MDPI and/or the editor(s). MDPI and/or the editor(s) disclaim responsibility for any injury to people or property resulting from any ideas, methods, instructions or products referred to in the content. |
© 2023 by the authors. Licensee MDPI, Basel, Switzerland. This article is an open access article distributed under the terms and conditions of the Creative Commons Attribution (CC BY) license (http://creativecommons.org/licenses/by/4.0/).


