Submitted:
03 May 2023
Posted:
04 May 2023
You are already at the latest version
Abstract
In recent years, with the popularity of smart mobile devices, the interaction between devices and users, especially in the form of voice interaction, has become increasingly important. If smart devices can understand more users' emotional states through voice data, more customized services can be provided for users. This paper proposes a novel machine learning model for speech emotion recognition, which combines convolutional neural networks (CNN), long short-term memory neural networks (LSTM), and deep neural networks (DNN), called CLDNN. To make the designed system can recognize the audio signal closer to the human auditory system does, this article uses the Mel frequency cepstral coefficients (MFCCs) of audio data as the input of the machine learning model. First, the MFCCs of the voice signal is extracted as the input of the model, and the feature values of the data are calculated using several local feature learning blocks (LFLB) composed of one-dimensional CNN. Because the audio signals are time-series data, the feature values obtained from LFLBs then input into LSTM layer to enhance the learning on time-series level. Finally, fully connected layers are used for classification and prediction. Three databases RAVDESS, EMO-DB and IEMOCAP are used for the experiments in this paper. The experimental results show that the proposed method can improve the accuracy compared to other related researches in speech emotion recognition.
Keywords:
Speech emotion recognition
; one-dimensional neural network
; LSTM
; CNN
; MFCCs
1. Introduction
Speech is one of the important basic modes of expression for humans. A speech signal contains a lot of information, such as semantics, speaker identity, language type, speaker emotion, and so on. Among them, speech emotion recognition is a technology that many organizations and companies are eager to develop in recent years, for example, Amazon Web Services (AWS), Google, NVIDIA, etc.
Speech emotion recognition is an artificial intelligence technology that identifies the emotional state expressed in speech, such as sadness, happiness, anger, and anxiety, by analyzing features from tone, intonation, and rhythm, etc. The application of speech emotion recognition technology is very extensive, see the papers [1,2,3,4,5,6,7,8,9,10,11,12,13,14,15,16,17,18,19,20,21,22,23,24,25,26,27,28]. For example, in the customer service industry, it can quickly determine whether customers are satisfied and whether they need more support by identifying the emotional state from their speech. In the medical field, speech emotion recognition technology can help doctors better understand the emotional state of patients and provide more humane treatment plans. In the entertainment industry, speech emotion recognition technology can be applied in gaming, music, and other scenarios to provide more personalized and immersive experiences by recognizing the emotional state of players or audiences.
With the global popularity of smart mobile devices, speech has become an indispensable means of interaction between the devices and users. If the terminal device can understand the user’s current emotional state through speech signals, it can make the device more humane, allowing users to interact with more than just a machine that provides the same response repeatedly. This not only enhances the pleasure of interaction between users and terminal devices but also enables the terminal device to provide more activate personalized services.
There are many challenges in speech emotion recognition technology. The diversity of speech signals produced by different people in different languages can affect the accuracy of recognition. In addition, speech signals are often subject to environmental noise, microphone distortion, and other interferences, which can make speech emotion recognition even more difficult. The most difficult challenge to be overcame is the subjectivity of emotions, as different individuals may perceive different emotions from the same speech signal.
The convolutional neural network architectures for speech recognition can be divided into two types: one-dimensional convolution and two-dimensional convolution. The 2-D convolution requires the speech data to be transformed from the time domain to the frequency domain before being used as input for convolution, and the calculations of 2-D convolution is more complicated than that of 1-D convolution. Considering the computation cost and power consumption of wearable or portable smart devices, this paper proposes a machine learning model based on 1-D convolutional neural network for speech emotion recognition. Compared with other related studies, the experimental results show that the method proposed in this paper has higher recognition rate and data portability.
2. Related works
The paper [1] proposes a model, called Convolutional Long Short-Term Memory Fully Connected Deep Neural Networks (ConvLSTM-FCN), for processing time-series data, such as speech signals or video sequences. The ConvLSTM-FCN model combines the characteristics of convolutional neural networks and long short-term memory models, and uses a fully connected deep neural network for final classification.
The paper [2] proposes a method for speech emotion recognition based on Resnet. Firstly, each speech data is segmented into multiple frames. Then the K-means algorithm is conducted for clustering the frames and replaced each frame with the corresponding cluster centroid. The one-dimensional audio signals are transformed into a two-dimensional spectrum using the short-time Fourier transform. The Resnet 101 model is trained by using the training data on frequency domain. Finally, a bidirectional long short-term memory neural network is used to model the time-series features. This method uses the RAVDESS, EMO-DB, and IEMOCAP databases for training and testing, and achieves accuracies of 77.02%, 85.57%, and 72.25%, respectively. In [3], the authors preprocess the speech signals with algorithms for noise removal, and then the speech signals are converted into two-dimensional spectrograms as inputs for training the convolutional neural networks. The paper applies RAVDESS and IEMOCAP databases for training and testing, and respectively achieves accuracies of 81.75% and 79.50%. The paper [4] proposes a speech emotion recognition method that utilizes support vector machines (SVM). The method extracts the Mel-frequency cepstral coefficients of speech data as feature values and conducted support vector machine algorithms to perform non-linear classification. The accuracies obtained by this method on the RAVDESS and EMO-DB databases are 75.69% and 92.45%, respectively.
In [5], MFCCs and Log-power on Mel spectrogram and chromagram are used as features for the speech signals. These features are then fed into the residual bidirectional LSTM (RBLSTM) and attention-based multi-learning model (ABMD) models for training and classification. The RBLSTM model consists of residual bidirectional LSTM blocks and multi-head attention mechanism blocks, which can ensure that the more important features in the time-series are captured and can analyze the dependencies between these features at different lengths of time. The ABMD model uses residual dilated causal convolution blocks and dilated convolution layers with multi-head attention to analyze the global correlations between features in a parallel manner. This speech emotion recognition method achieves an accuracy of 85.89% on the RAVDESS database and 95.93% on the EMO-DB database.
A speech emotion recognition method that first performs data augmentation on the speech signal is proposed in [6]. This paper uses Left Mel Spectrogram segment, Right Mel Spectrogram segment, Mid Mel Spectrogram segment, and Side Mel Spectrogram segment to obtain Mel Spectrograms of different segment levels. These Mel Spectrograms are then combined into multi-dimensional data and fed into 2-D Local Feature Learning Blocks for local feature extraction. Finally, two LSTM layers are applied for time-series level feature learning. Experimental results show that the model trained and tested on the IEMOCAP database achieves an average accuracy of 88.80%.
The researches above make some effect on exploring effective features. There are some researches focus on the development of innovative model for speech emotion recognition. The paper [7] proposes 1-D and 2-D convolutional neural networks combined with LSTM to compare the performance of the models. Both deep learning models consisted of the same number of local feature learning block and LSTM layers. The 1-D CNN-LSTM model applied raw speech data as input, while the 2-D CNN-LSTM model used the Log-power of the speech signal on the Mel spectrogram as input. Trained and tested on the EMO-DB database, the 2-D CNN-LSTM model achieved an accuracy of 95.89%, which was 9.16% higher than the 1-D CNN-LSTM model. Similarly, the paper [8] proposes a ConvLSTM neural network model based on two-dimensional CNN. Unlike the general CNN-LSTM architecture, ConvLSTM directly applies the convolutional layer as a part of LSTM layer for each time-step. The model proposed in this study achieved an accuracy of 80.00% on the RAVDESS database and 75.00% on the IEMOCAP database.
Finally, to improve the recognition rates, the data augmentation technique is promising. An LDA-based data augmentation algorithm for acoustic scene classification is proposed in [9]. This algorithm transforms the raw audio data into feature vectors in LDA space and generates new data samples with differentiated features. This can expand the dataset. Experimental results show that, using the LDA algorithm for data augmentation, the performance of acoustic scene classification can be improved.
Due to the room for improvement in the recognition rate of previous studies, this paper modifies the CLDNN architecture proposed in [1], and aims to improve the recognition rate by combining one-dimensional CNN, LSTM, and DNN.
3. Database and Feature Extraction
3.1. Databases
Three different databases are applied for data training and validation in the experiments of this paper: RAVDESS, EMO-DB and IEMOCAP. In order to ensure the reliability of machine learning model, the Scikit-Learn package is conducted to randomly select 10% of the dataset as the data for testing, and the remaining 90% data are randomly divided into train data and validation data at a ratio of 90:10. Figure 1 illustrates the data proportions of the training set, validation set, and testing set.
RAVDESS (The Ryerson Audio-Visual Database of Emotional Speech and Songs) is a database for speech and expression emotion recognition created by Ryerson University’s Voice Research Lab in Canada. RAVDESS database contains audio and video samples from 24 actors (12 male and 12 female) and includes 8 different emotions (angry, calm, disgust, fear, happy, neutral, sad and surprised). The audio data is recorded in English language with singing and speaking pronunciations. There are 2,452 speech samples totally in the database. The data number and proportion of each emotion label in the RAVDESS database is shown in Table 1.
EMO-DB (Berlin Database of Emotional Speech) database is a speech emotion database created by the Psychoacoustics Research Group at the Technical University of Munich in 1997. The database contains audio data from 10 German actors (5 male and 5 female) in 7 emotional states (angry, boredom, disgust, fear, happy, neutral and sad). There are totally 535 speech samples in this database. The audio data in this database was recorded in German language and has been widely applied for training and testing in different speech emotion recognition researches. Table 2 shows the data number and proportion of each emotional label in the EMO-DB database.
IEMOCAP (Interactive Emotional Dyadic Motion Capture) is a commonly used database for speech emotion recognition researches, created by the Speech and Communication Technology Lab at the University of Southern California. The database consists of English speech recordings from 10 professional actors (5 male and 5 female) that include elements of scenes (such as arguments and negotiations) and are labeled with emotion intensity scores from 1 to 5, as well as synchronized with facial expression and audio data. This database is highly suitable for training and testing models for speech emotion recognition and multimodal emotion analysis. In this study, we referred to [2] and utilized the angry, happy, neutral, and sad data from the IEMOCAP database for model training and testing, with a total number of 5,531 audio data. The data number and proportion of each emotion label in the IEMOCAP database is shown in Table 3.
The raw audio data from these databases will be converted into Mel-frequency cepstral coefficients (MFCCs). Then the MFCCs are used as the input of the neural network model.
3.2. Data Augmentation
When training a machine learning model, a small number of data can directly lead to a deterioration in the model’s training results. Therefore, increasing the amount of effective training and testing data through the data augmentation can help the machine learning model learn more useful features and avoid under-fitting. In this paper, we conducted a data augmentation algorithm to expand the total number of audio data. We refer to the results of comparing various data augmentation methods in [9] and choose two relatively simple methods with better results: adding noise and shifting pitch. This paper sets the noise ratio to 0.035, calculates the noise amplitude by multiplying the noise ratio with the maximum value of the speech signal, and adds the noise amplitude to the original speech signal to obtain the speech signal with added noise. In terms of pitch shifting, this paper applies Fourier transform to the original speech signal, multiplies the frequency of the frequency-domain signal by a logarithmic phase factor of value 0.7, and then transforms the signal back to the time domain through Fourier inverse transform to achieve pitch shifting.
After applying the data augmentation, we obtain audio signals with added noise, adjusted pitch, and both added noise and adjusted pitch. This has increased the total number of audio data by four times. Figure 2 shows the information of the data augmentation methods conducted in this paper.
3.3. Feature Value
For making the audio signal closer to the human auditory system, our work extracts the MFCCs of the speech signals as the feature values of the audio data. For speech recognition and speaker recognition, the most commonly used speech feature value is MFCCs. This parameter takes into account the sensitivity of the human ear to different frequencies, so it is especially suitable for speech recognition. The extraction process of MFCCs is shown in Figure 3.
The steps of extracting MFCCs are briefly introduced as follows.
Step 1: pre-emphasis can enhance the high-frequency part of the speech signal, for simulating the human ear’s automatic gain for high-frequency waves. The Equation (1) reveals the calculation of pre-emphasis.
In which is the original signals and is the resulting signals after pre-emphasis.
Step 2: framing helps us better analyze the relationship between signals and time-changing. This study set 256 points as the length of each frame in the audio signal, and the overlap rate between frames is 50%.
Step 3: for the purpose of reducing the interference caused by the discontinuity between frames after Fast Fourier Transform, all frames have to be multiplied by the Hamming window in Equation (2).
Step 4: the logarithmic power can be obtained by calculating the spectrum after Fourier transform through the triangular filter in Equation (3).
In which is the number of filters, and is the center frequency of th filter.
Step 5: finally, the discrete cosine transform of the logarithmic power is used to obtain the MFCCs of audio signals based on Equations (4) and (5).
In which is the spectrum of each frame in speech and is the resulting MFCCs.
The data dimension after MFCCs extraction is 20 in this paper. To facilitate training these data using 1-D CNNs, we reshape each MFCCs into one-dimensional data format.
4. Methods and Experiments
In this section, two models used in this paper for speech emotion recognition are introduces. The first model is 1-D CNN-DNN model and the second is 1-D CLDNN model. Some experiments are also conducted, and the numerical results are revealed in this section.
Moreover, in the experiments, this paper uses the NVIDIA GeForce RTX 3090 graphics card for ML training and testing, and the Intel i7-10700 processor is used for the data augmentation and MFCCs extraction. The experimental environment is shown in Table 4.
4.1. CNN-DNN model
The architecture and training process of the CNN-DNN model applied in this paper is shown in Figure 4. Mel-frequency cepstral coefficients are extracted from the audio data after the data augmentation and are used as the input of the model. The model calculates feature maps using five LFLBs composed of one-dimensional CNN and then uses one hidden layer to extract feature values. Finally, the Softmax function is used as the activation function of the output layer to obtain the classification results.
All convolutional layers apply zero padding method, as the activation function use Rectified Linear Unit (ReLU). Moreover, each convolutional layer is equipped with a max pooling layer and a batch normalization layer to help the feature values converge and avoid gradient vanishing. The parameters of the CNN-DNN model used in this paper are shown in Table 5.
To observe the impact of the data augmentation on model training, we train the same model architecture and with the same parameters with two different training dataset, the raw audio data and the augmented audio data, using 10-fold cross-validation method. Taking the RAVDESS database as an example, the average accuracy for training with the raw data was 63.41%, with a standard deviation of 1.34%. After the data augmentation, the average accuracy increased to 91.87%, with a standard deviation of 1.00%, resulting in a 28.46% improvement over using the raw audio data. The experimental results indicate that training data can significantly affect the performance of the CNN-DNN model, and that the data augmented by the data augmentation conducted in this paper is effective for model training. The confusion matrix of experimental results for RAVDESS database using raw audio data for training by CNN-DNN model is shown in Figure 5, and the confusion matrix of experimental results using data after the data augmentation for training is shown in Figure 6.
For the database EMO-DB, we conduct the same experiments as that for RAVDESS. The EMO-DB database contains only 535 samples. After the data augmentation, the total number of samples increased to 2140. By conducting 10-fold cross-validation, the model achieved an average accuracy of 88.22% with a standard deviation of 6.30%. Figure 7 shows the confusion matrix of the experimental results for the EMO-DB database.
Subsequently, the same experiments as those for RAVDESS and EMO-DB databases is performed on IEMOCAP database. The IEMOCAP database includes four different emotion labels and contains 5,531 raw audio samples. After the data augmentation, a total of 22,124 audio samples were obtained. Although it has the least number of emotion labels among the three databases, but it also has the largest amount of data. By conducting 10-fold cross-validation, the model achieved an average accuracy of 91.04% with a standard deviation of 0.60%. Figure 8 shows the confusion matrix for the IEMOCAP database.
Without considering the speaker or language, the RAVDESS database has different pronunciations (singing and speaking), with the most emotion categories and a more evenly distributed sample proportion. The EMO-DB database has the smallest total number of samples and a less uniform distribution. The IEMOCAP database has the largest amount of data, but only four emotion categories. The CNN-DNN model achieved an average accuracy of around 90% for all three databases in cross-validation. In other words, with sufficient data size, the CNN-DNN model has a certain degree of generalizability to different databases. Therefore, based on the CNN-DNN model, we will add a long short-term memory neural network to enhance the feature learning on time-series level.
4.2. CLDNN model
The convolutional neural networks are more focused on learning local features. However, the audio is temporal sequence data, training with recurrent neural networks can help the model learn features over time. Hence, a CLDNN model is proposed in this paper by adding a long short-term memory (LSTM) network between the convolutional and hidden layers, allowing the model to analysis the relationship between feature values and time-changing during training process. The architecture and training process of the model is shown in Figure 9.
In this paper, the output dimension of the LSTM layer is set to 50 and the parameters of the CLDNN model are shown in Table 6.
Similarly, we take the RAVDESS database as an example to observe the impact of the data augmentation on model training. Using the raw audio data for 10-fold cross-validation, we obtained an average accuracy of 68.70% with a standard deviation of 2.54%. After the data augmentation, the cross-validation yielded an average accuracy up to 95.52% with an average standard deviation of 0.47%. For CLDNN model, the average accuracy increases by 26.82% after the data augmentation. This once again verifies that the data augmentation is an effective method for speech emotion recognition. Figure 10 and Figure 11 show the confusion matrix of the experimental results on the RAVDESS database before and after the data augmentation, respectively.
For the database EMO-DB, we conduct the same experiments as that for RAVDESS. Performing 10-fold cross-validation for the training of CLDNN model on the EMO-DB database obtained an average accuracy of 95.84% with a standard deviation of 1.75%, indicating a slight improvement compared to the performance of the CNN-DNN model. The confusion matrix of the experimental results for cross-validation on the EMO-DB database is shown in Figure 12.
Subsequently, the same experiments as those for RAVDESS and EMO-DB databases is performed on IEMOCAP database. In many related studies, due to the fewer number of emotion labels, the accuracy of models tested on the IEMOCAP database is usually lower. However, the CLDNN model achieved a 96.21% accuracy with a standard deviation of 0.39% in the cross-validation on the IEMOCAP database, and the confusion matrix of the experimental results is shown in Figure 13. Besides performing a little improvement than the CNN-DNN model, the validation results on the IEMOCAP database are comparable to those using other databases, indicating that the use of different databases has little impact on the proposed method for speech emotion recognition in this paper. This again verifies the generality and stability of the proposed methods.
5. Results and Discussion
Comparing the training results of the CNN-DNN model and the CLDNN model, the average accuracy of cross-validation without using the data augmentation for the model CLDNN is 5.29% better than that CNN-DNN. Besides, the average accuracy of cross-validation after the data augmentation for the model CLDNN increases by 3.65% compared to that of CNN-DNN model. The comparison is shown in Table 7. This indicates that adding LSTM layers can improve the training performance by learning features on time sequence level.
Three performance indexes: precision, recall and f1-score, are adopted in this paper to evaluate the performance of the proposed method. The performance indexes of the designed model are calculated based on the Equations (6) to (8).
Table 8 shows the precision, recall, and f1-score of each emotion label recognized by using the CLDNN model with 10-fold cross-validation on RAVDESS database.
It can be seen that the precisions of ‘fear’ and ‘sad’ are lower than the other emotions. It is likely due to the reason that the two voices of ‘fear’ and ‘sad’ have a relatively low tone expression, and emotion of labels with a similar low tone of voice may be mistakenly predicted as belonging to these two labels. On the other hand, the recall of ‘disgust’ and ‘surprised’ show poorer performance, which is likely because that the model does not capture the features of these two emotions as well as it does for other emotions. As a result, these two emotions are more likely to be mistakenly predicted as other emotions.
The CLDNN model’s precision, recall, and f1-score, calculated through cross-validation using the EMO-DB database, are shown in Table 9. It shows that the precision for the emotion ‘sad’ is 100%. This indicate that the error prediction rate is almost zero, which is the lowest among those of all emotions. The precision for the emotion ‘happy’ is the lowest one. By examining the confusion matrix in Figure 12, it is found that the model tends to mis-predict the emotion ‘angry’ as ‘happy’. This is possibly due to both emotions have a similar high-tone expression.
Table 10 shows the precision, recall, and F1-score of the CLDNN model calculated using the IEMOCAP database after 10-fold cross-validation. The standard deviation of these data for each emotion label is relatively smaller than that of the RAVDESS and EMO-DB databases. It is possibly due to the fact that the IEMOCAP database has the largest total number of data and only 4 emotion categories. This makes the designed model less prone to have incorrect prediction between different emotions.
Table 11, Table 12 and Table 13 show the comparison of the proposed 1-D CLDNN model with other related researches using the RAVDESS, EMO-DB, and IEMOCAP databases in terms of average accuracy through cross-validation. The CLDNN model proposed in this paper achieved the highest accuracy in both the RAVDESS and IEMOCAP databases, with a lot improvements relative to other studies, and had an accuracy of around 95% for all three databases. As for the EMO-DB database, the accuracy of the proposed CLDNN model is just a little lower (less than 0.1%) than those of [5,7]. Hence, it can be summarized that the proposed CLDNN model can extract important features from audio data in these three databases and has a certain degree of data generalization.
6. Conclusion and future work
This paper applied data augmentation techniques such as adding noise and adjusting pitch to expand the effective training and testing datasets. Combining with CNN, LSTM and DNN, this paper proposed a 1-D CLDNN model to improve the recognition rate for speech emotion recognition. MFCCs are extracted from the audio signals and used as inputs to train the CLDNN model. The 10-fold cross-validation experiments are conducted on the RAVDESS, EMO-DB, and IEMOCAP databases, resulting in accuracies of 95.52%, 95.84%, and 96.21%, respectively. The overall recognition rate is higher than those of other related studies. Moreover, the experimental results show that variant samples from these three different databases for training and testing has little effect on the prediction results. This verifies the generality and stability of the proposed model.
In the future, the proposed 1-D CLDNN model can be used to extract other speech features such as acoustic feature extraction (AFE) as inputs to the model for training, not only expecting for higher speech emotion recognition performance, and also enabling different kind of applications, for example, the applications on cough and spoofing detection. Additionally, an integration with an image-based emotion recognition model will be explored to develop a multimodal neural network model. This will be further investigated for deployment on embedded devices to reduce power consumption and computational complexity.
References
- Sainath, T.N.; Vinyals, O.; Senior, A.; Sak, H. Convolutional, Long Short-Term Memory, fully connected Deep Neural Networks. In Proceedings of the IEEE International Conference on Acoustics, Speech and Signal Processing (ICASSP), South Brisbane, Australia, 19–24 April 2015; pp. 4580–4584. [Google Scholar] [CrossRef]
- Mustaqeem; Sajjad, M. ; Kwon, S. Clustering-Based Speech Emotion Recognition by Incorporating Learned Features and Deep BiLSTM. IEEE Access 2020, 8, 79861–79875. [Google Scholar] [CrossRef]
- Mustaqeem; Kwon, S. A CNN-Assisted Enhanced Audio Signal Processing for Speech Emotion Recognition. Sensors 2020, 20, 183. [Google Scholar] [CrossRef] [PubMed]
- Bhavan, A.; Chauhan, P.; Hitkul; Shah, R. R. Bagged support vector machines for emotion recognition from speech. Knowledge-Based Syst. 2019, 184. [Google Scholar] [CrossRef]
- Kakuba, S.; Poulose, A.; Han, D.S. Attention-Based Multi-Learning Approach for Speech Emotion Recognition With Dilated Convolution. IEEE Access 2022, 10, 122302–122313. [Google Scholar] [CrossRef]
- Amjad, A.; Khan, L.; Ashraf, N.; Mahmood, M.B.; Chang, H.-T. Recognizing Semi-Natural and Spontaneous Speech Emotions Using Deep Neural Networks. IEEE Access 2022, 10, 37149–37163. [Google Scholar] [CrossRef]
- Zhao, J.; Mao, X.; Chen, L. Speech emotion recognition using deep 1D & 2D CNN LSTM networks. Biomed. Signal Process. Control. 2019, 47, 312–323. [Google Scholar] [CrossRef]
- M. Khan and S. Kwon, ‘‘CLSTM: Deep Feature-Based Speech Emotion Recognition Using the Hierarchical ConvLSTM Network’’, 2020, Mathematics, 8, 2133.
- Leng, Y.; Zhao, W.; Lin, C.; Sun, C.; Wang, R.; Yuan, Q.; Li, D. LDA-based data augmentation algorithm for acoustic scene classification. Knowledge-Based Syst. 2022, 195, 105600. [Google Scholar] [CrossRef]
- S. K. Pandey, H. S. K. Pandey, H. Shekhawat and S. Prasanna, ‘‘Emotion Recognition from Raw Speech using Wavenet’’, 2019, IEEE Region 10 Conference (TENCON), pp. 1292-1297.
- Han, W.; Chan, C.-F.; Choy, C.-S.; Pun, K.-P. An efficient MFCC extraction method in speech recognition. 2006, In Proc. IEEE ISCAS, pp. 145-148.
- Ma, X.; Wu, Z.; Jia, J.; Xu, M.; Meng, H.; Cai, L. Emotion Recognition from Variable-Length Speech Segments Using Deep Learning on Spectrograms. 2019, in Proc. Interspeech, 9, pp. 3683-3687.
- S. R. Livingstone and F. A. Russo, ‘‘The Ryerson Audio-Visual Database of Emotional Speech and Song (RAVDESS): A Dynamic, Multimodal Set of Facial and Vocal Expressions in North American English’’, 2018, Public Library of Science, Vol. 13, pp. 1-35.
- Mudaliar, N.K.; Hegde, K.; Ramesh, A.; Patil, V. Visual Speech Recognition: A Deep Learning Approach. 2020, ICCES, pp. 1218-1221.
- Liu, Z.-T.; Wu, M.; Cao, W.-H.; Mao, J.-W.; Xu, J.-P.; Tan, G.-Z. Speech emotion recognition based on feature selection and extreme learning machine decision tree. Neurocomputing 2018, 273, 271–280. [Google Scholar] [CrossRef]
- S. Padi, D. S. Padi, D. Manocha and R. D. 2020; arXiv:2010.09895. [Google Scholar]
- Aggarwal, A.; Srivastava, A.; Agarwal, A.; Chahal, N.; Singh, D.; Alnuaim, A.A.; Alhadlaq, A.; Lee, H.-N. Two-Way Feature Extraction for Speech Emotion Recognition Using Deep Learning. Sensors 2022, 22, 2378. [Google Scholar] [CrossRef] [PubMed]
- Wu, S.; Falk, T.H.; Chan, W.-Y. Automatic speech emotion recognition using modulation spectral features. Speech Commun. 2011, 53, 768–785. [Google Scholar] [CrossRef]
- M. S. Likitha, S. R. R. M. S. Likitha, S. R. R. Gupta, K. Hasitha and A. U. Raju, ‘‘Speech Based Human Emotion Recognition Using MFCC’’, 2017, IEEE WiSPNET, pp. 2257-2260.
- Zhao, Z.; Zhao, Y.; Bao, Z.; Wang, H.; Zhang, Z.; Li, C. Deep Spectrum Feature Representations for Speech Emotion Recognition, 2018, In Proc. ASMMC-MMAC, pp. 27-33.
- Y. Zeng, H. Y. Zeng, H. Mao, D. Peng and Z. Yi, ‘‘Spectrogram Based Multi-Task Audio Classification’’, 2019, Multimed. Tools Appl., 78, pp. 3705–3722.
- Yi, L.; Mak, M.-W. Adversarial Data Augmentation Network for Speech Emotion Recognition, 2019, In Proc. APSIPA ASC, pp. 529-534.
- Anvarjon, T.; Mustaqeem; Kwon, S. Deep-Net: A Lightweight CNN-Based Speech Emotion Recognition System Using Deep Frequency Features. Sensors 2022, 20, 5212. [Google Scholar] [CrossRef] [PubMed]
- Z. Q. Chen and S. T. Pan, ‘‘Integration of Speech and Consecutive Facial Image for Emotion Recognition Based on Deep Learning’’, 2021.
- G. Hinton, L. G. Hinton, L. Deng, D. Yu, G. Dahl, A. Mohamed, N. Jaitly, A. Senior, V. Vanhoucke, P. Nguyen, T. N. Sainath and B. Kingsbury, “Deep Neural Networks for Acoustic Modeling in Speech Recognition”, 2012, IEEE Signal Process. Mag. 29, pp. 82-97.
- Soltau, H.; Saon, G.; Sainath, T.N. Joint Training of Convolutional and Non-Convolutional Neural Networks”, 2014, in Proc. ICASSP, pp. 5572-5576.
- Yoon, S.; Byun, S.; Jung, K. Multimodal Speech Emotion Recognition Using Audio and Text. In Proceedings of the IEEE Spoken Language Technology Workshop (SLT), Athens, Greece, 18–21 December 2018; pp. 112–118. [Google Scholar] [CrossRef]
- H. J. Wu and Shing-Tai Pan, “基於一維卷積神經網路結合LSTM實現語音情緒辨識”, The 27th International Conference on Technologies and Applications of Artificial Intelligence (TAAI 2022), Domestic Track, Dec. 1-3, 2022.
Figure 1.
Randomly splits the database into training dataset, validation dataset, and testing dataset with a ratio of 81%, 9%, and 10%.
Figure 1.
Randomly splits the database into training dataset, validation dataset, and testing dataset with a ratio of 81%, 9%, and 10%.
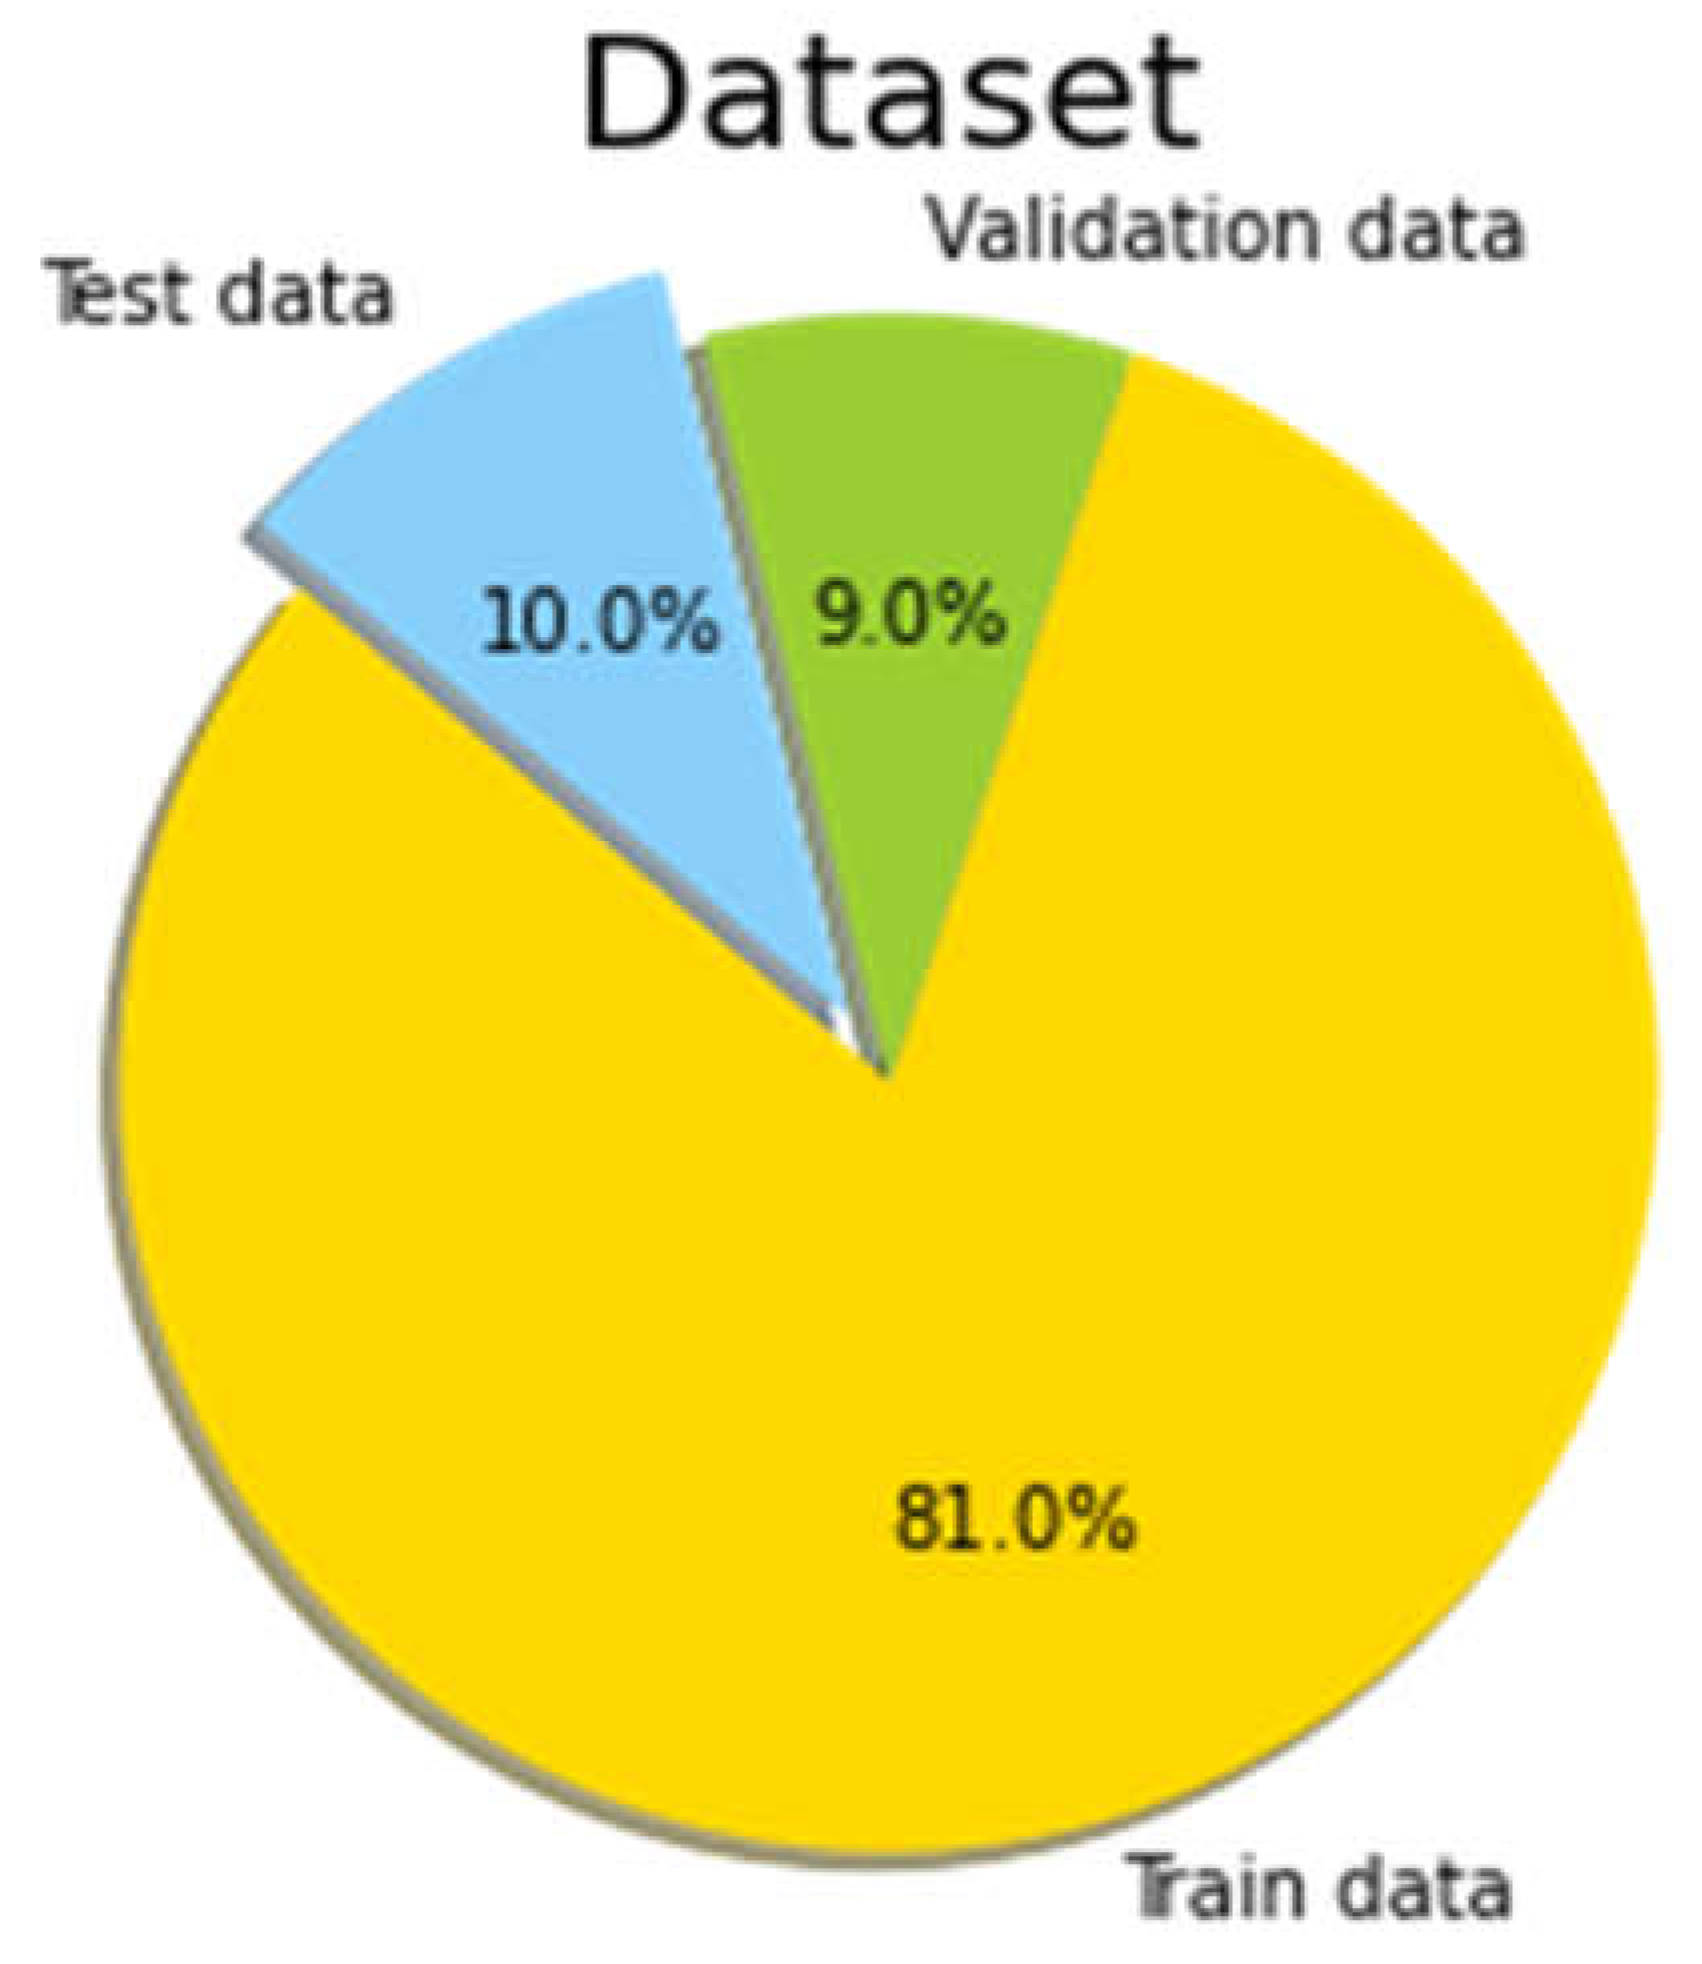
Figure 2.
(a) Raw audio signal; (b) Audio signal with added noise; (c) Audio signal with pitch shifting; (d) Audio signal with added noise and pitch shifting.
Figure 2.
(a) Raw audio signal; (b) Audio signal with added noise; (c) Audio signal with pitch shifting; (d) Audio signal with added noise and pitch shifting.
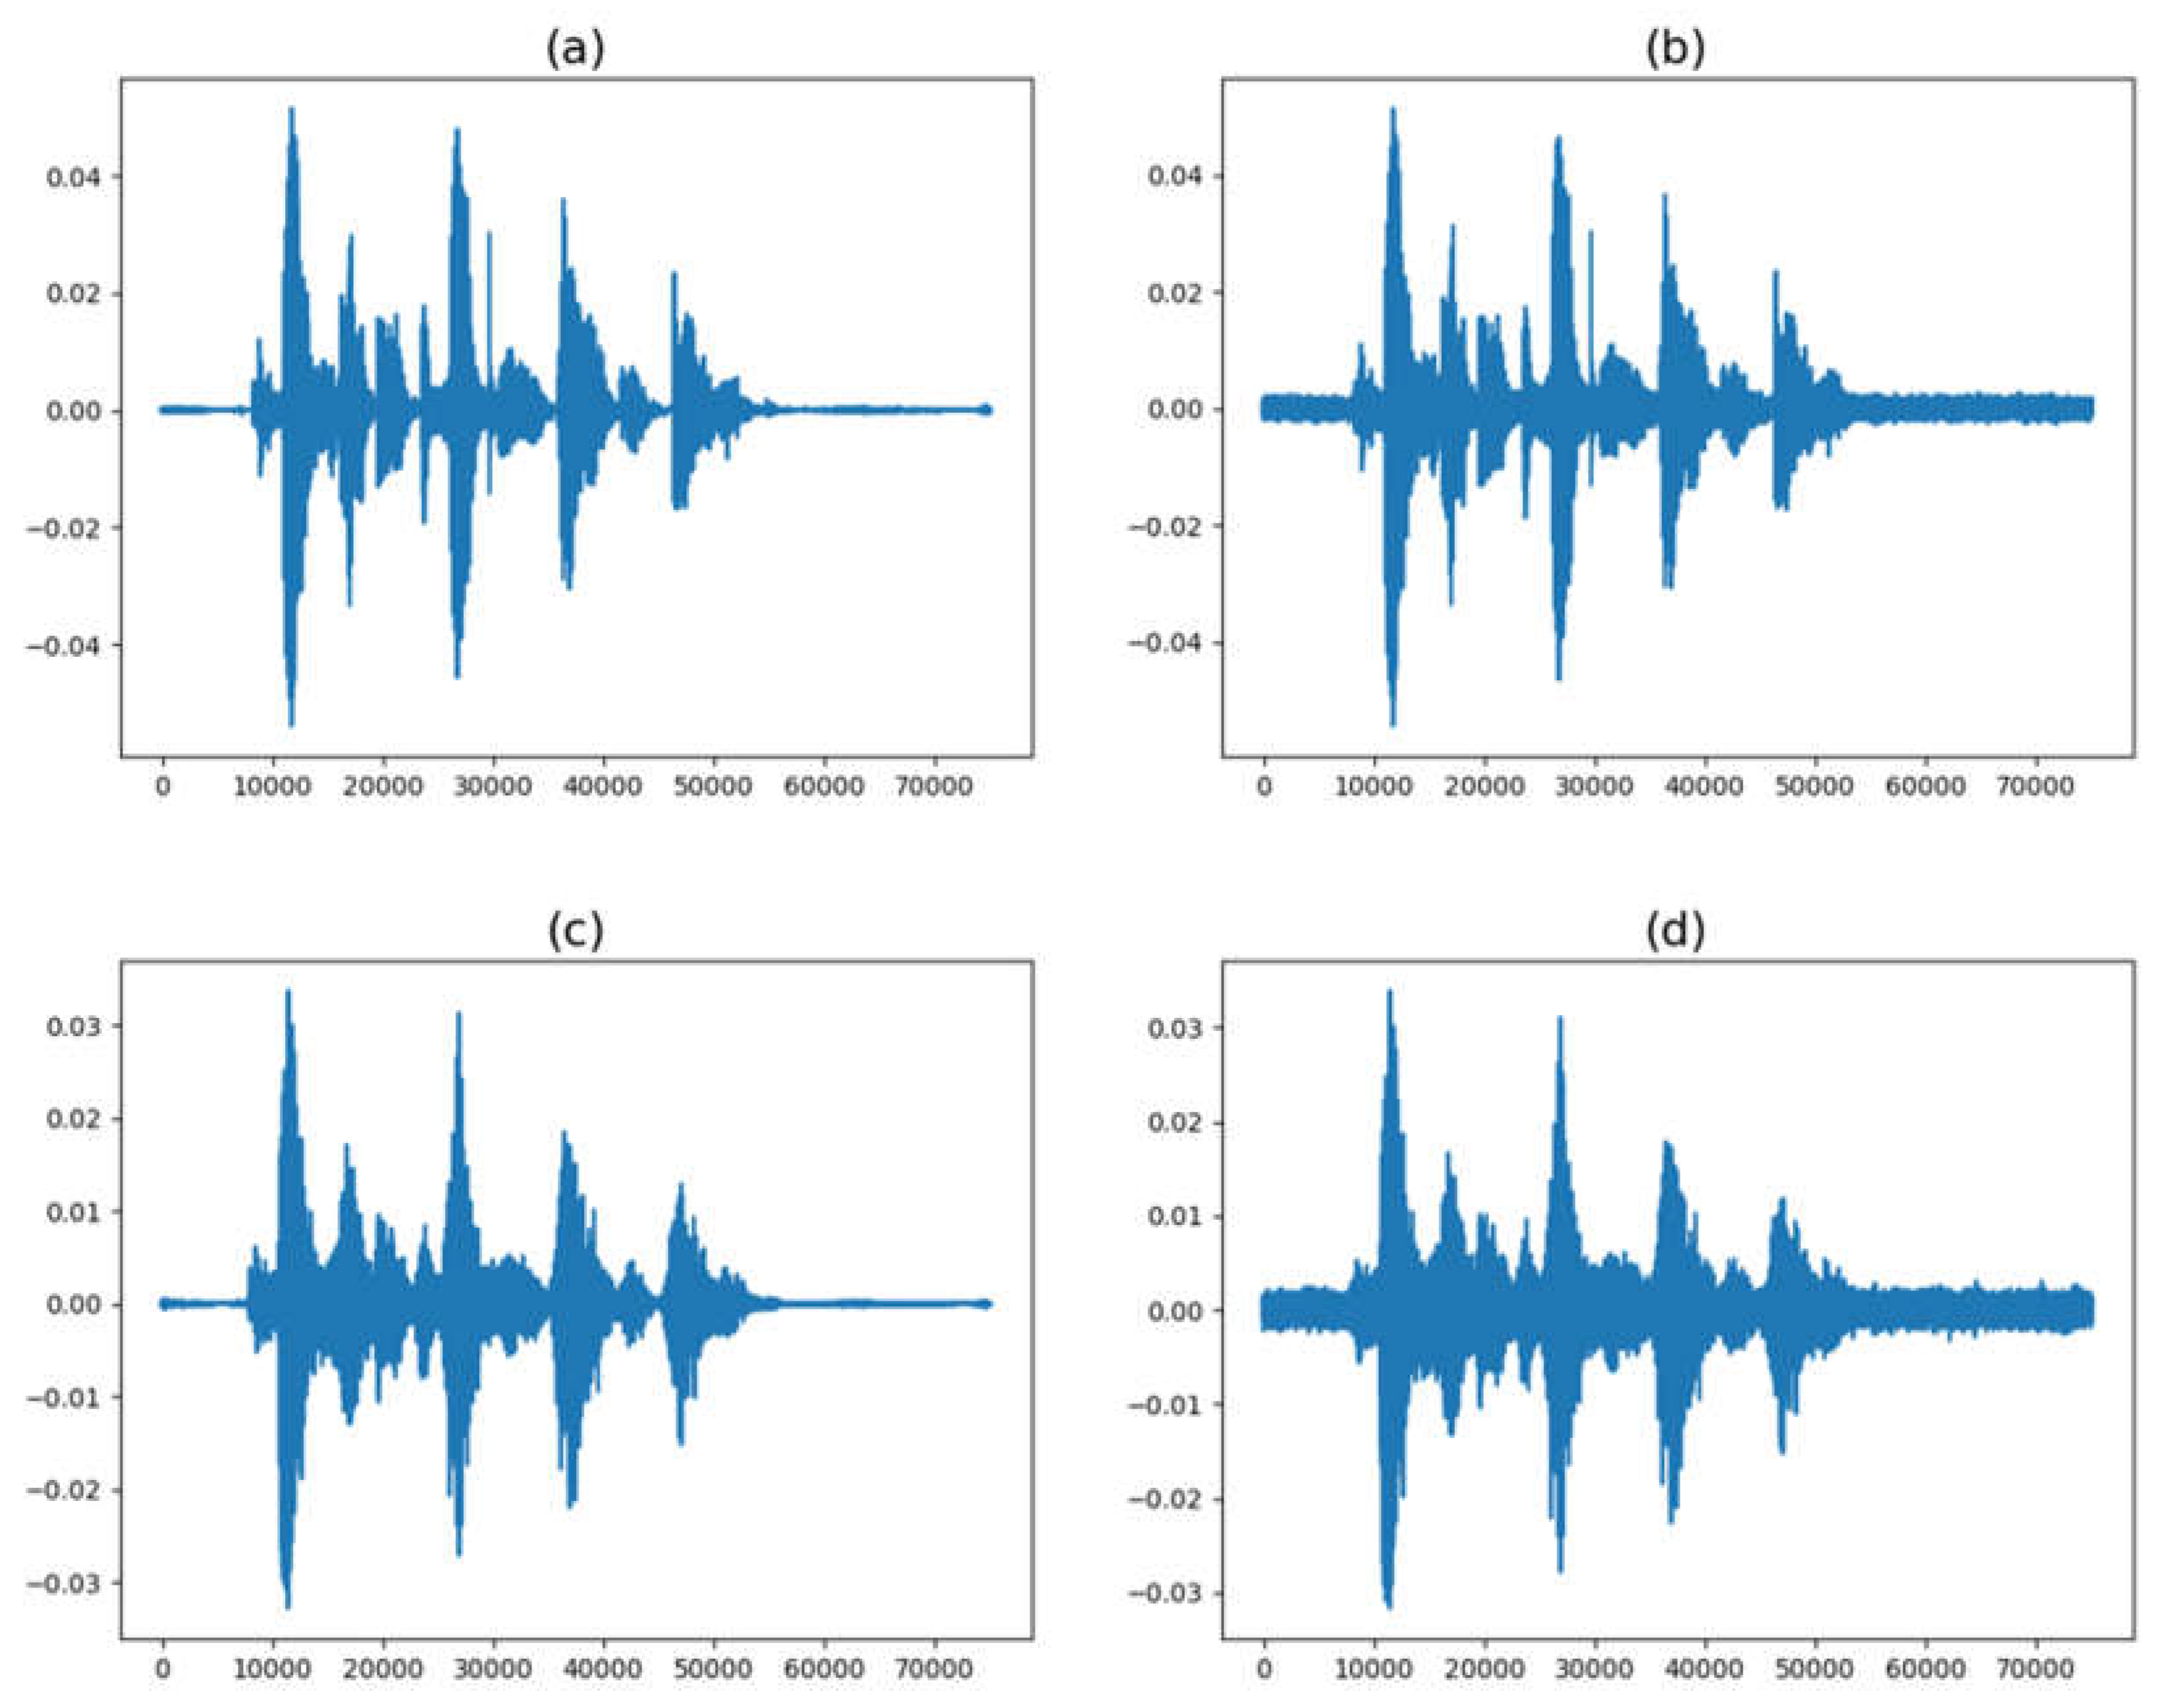
Figure 3.
The process for extracting MFCCs.
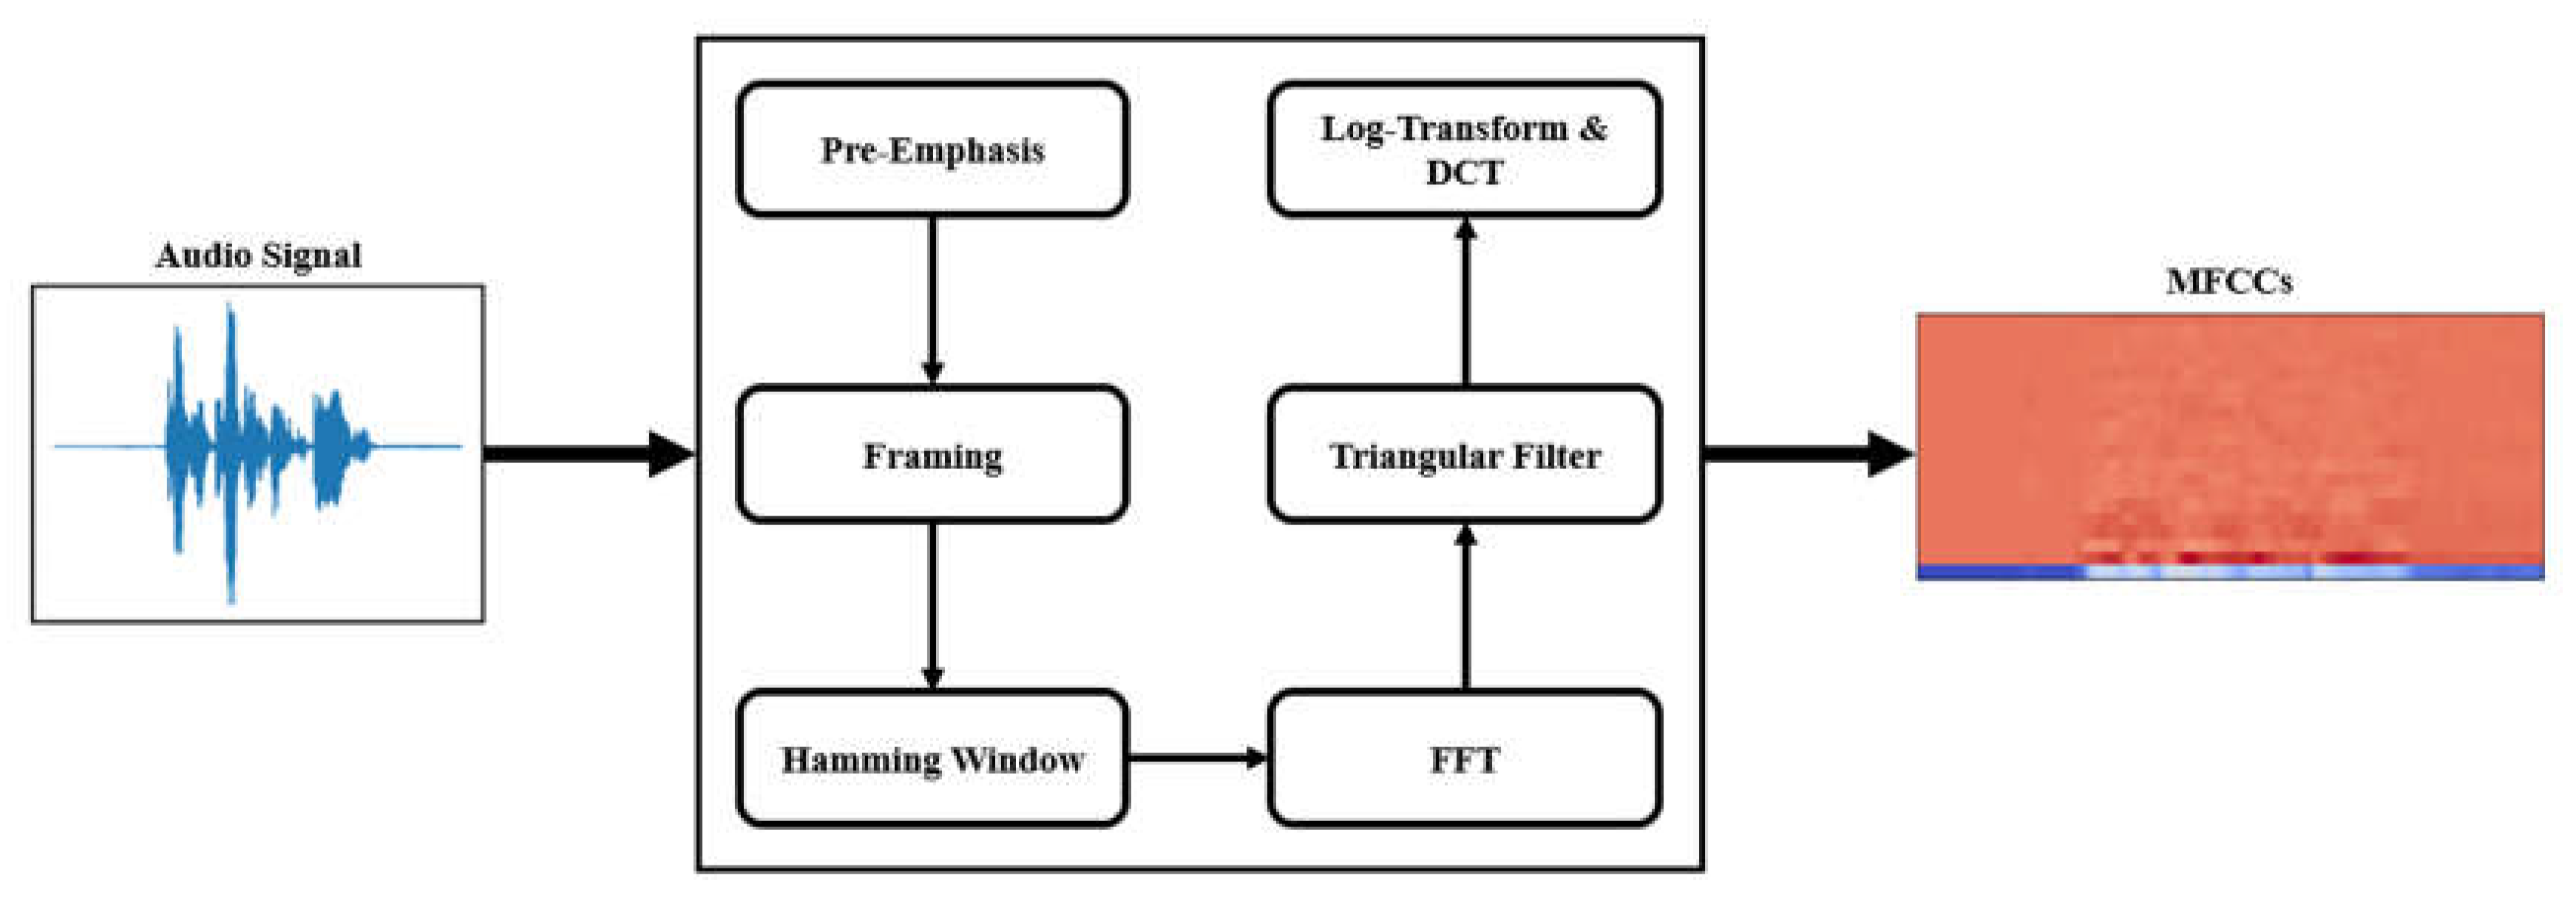
Figure 4.
Architecture and training process of the CNN-DNN model.
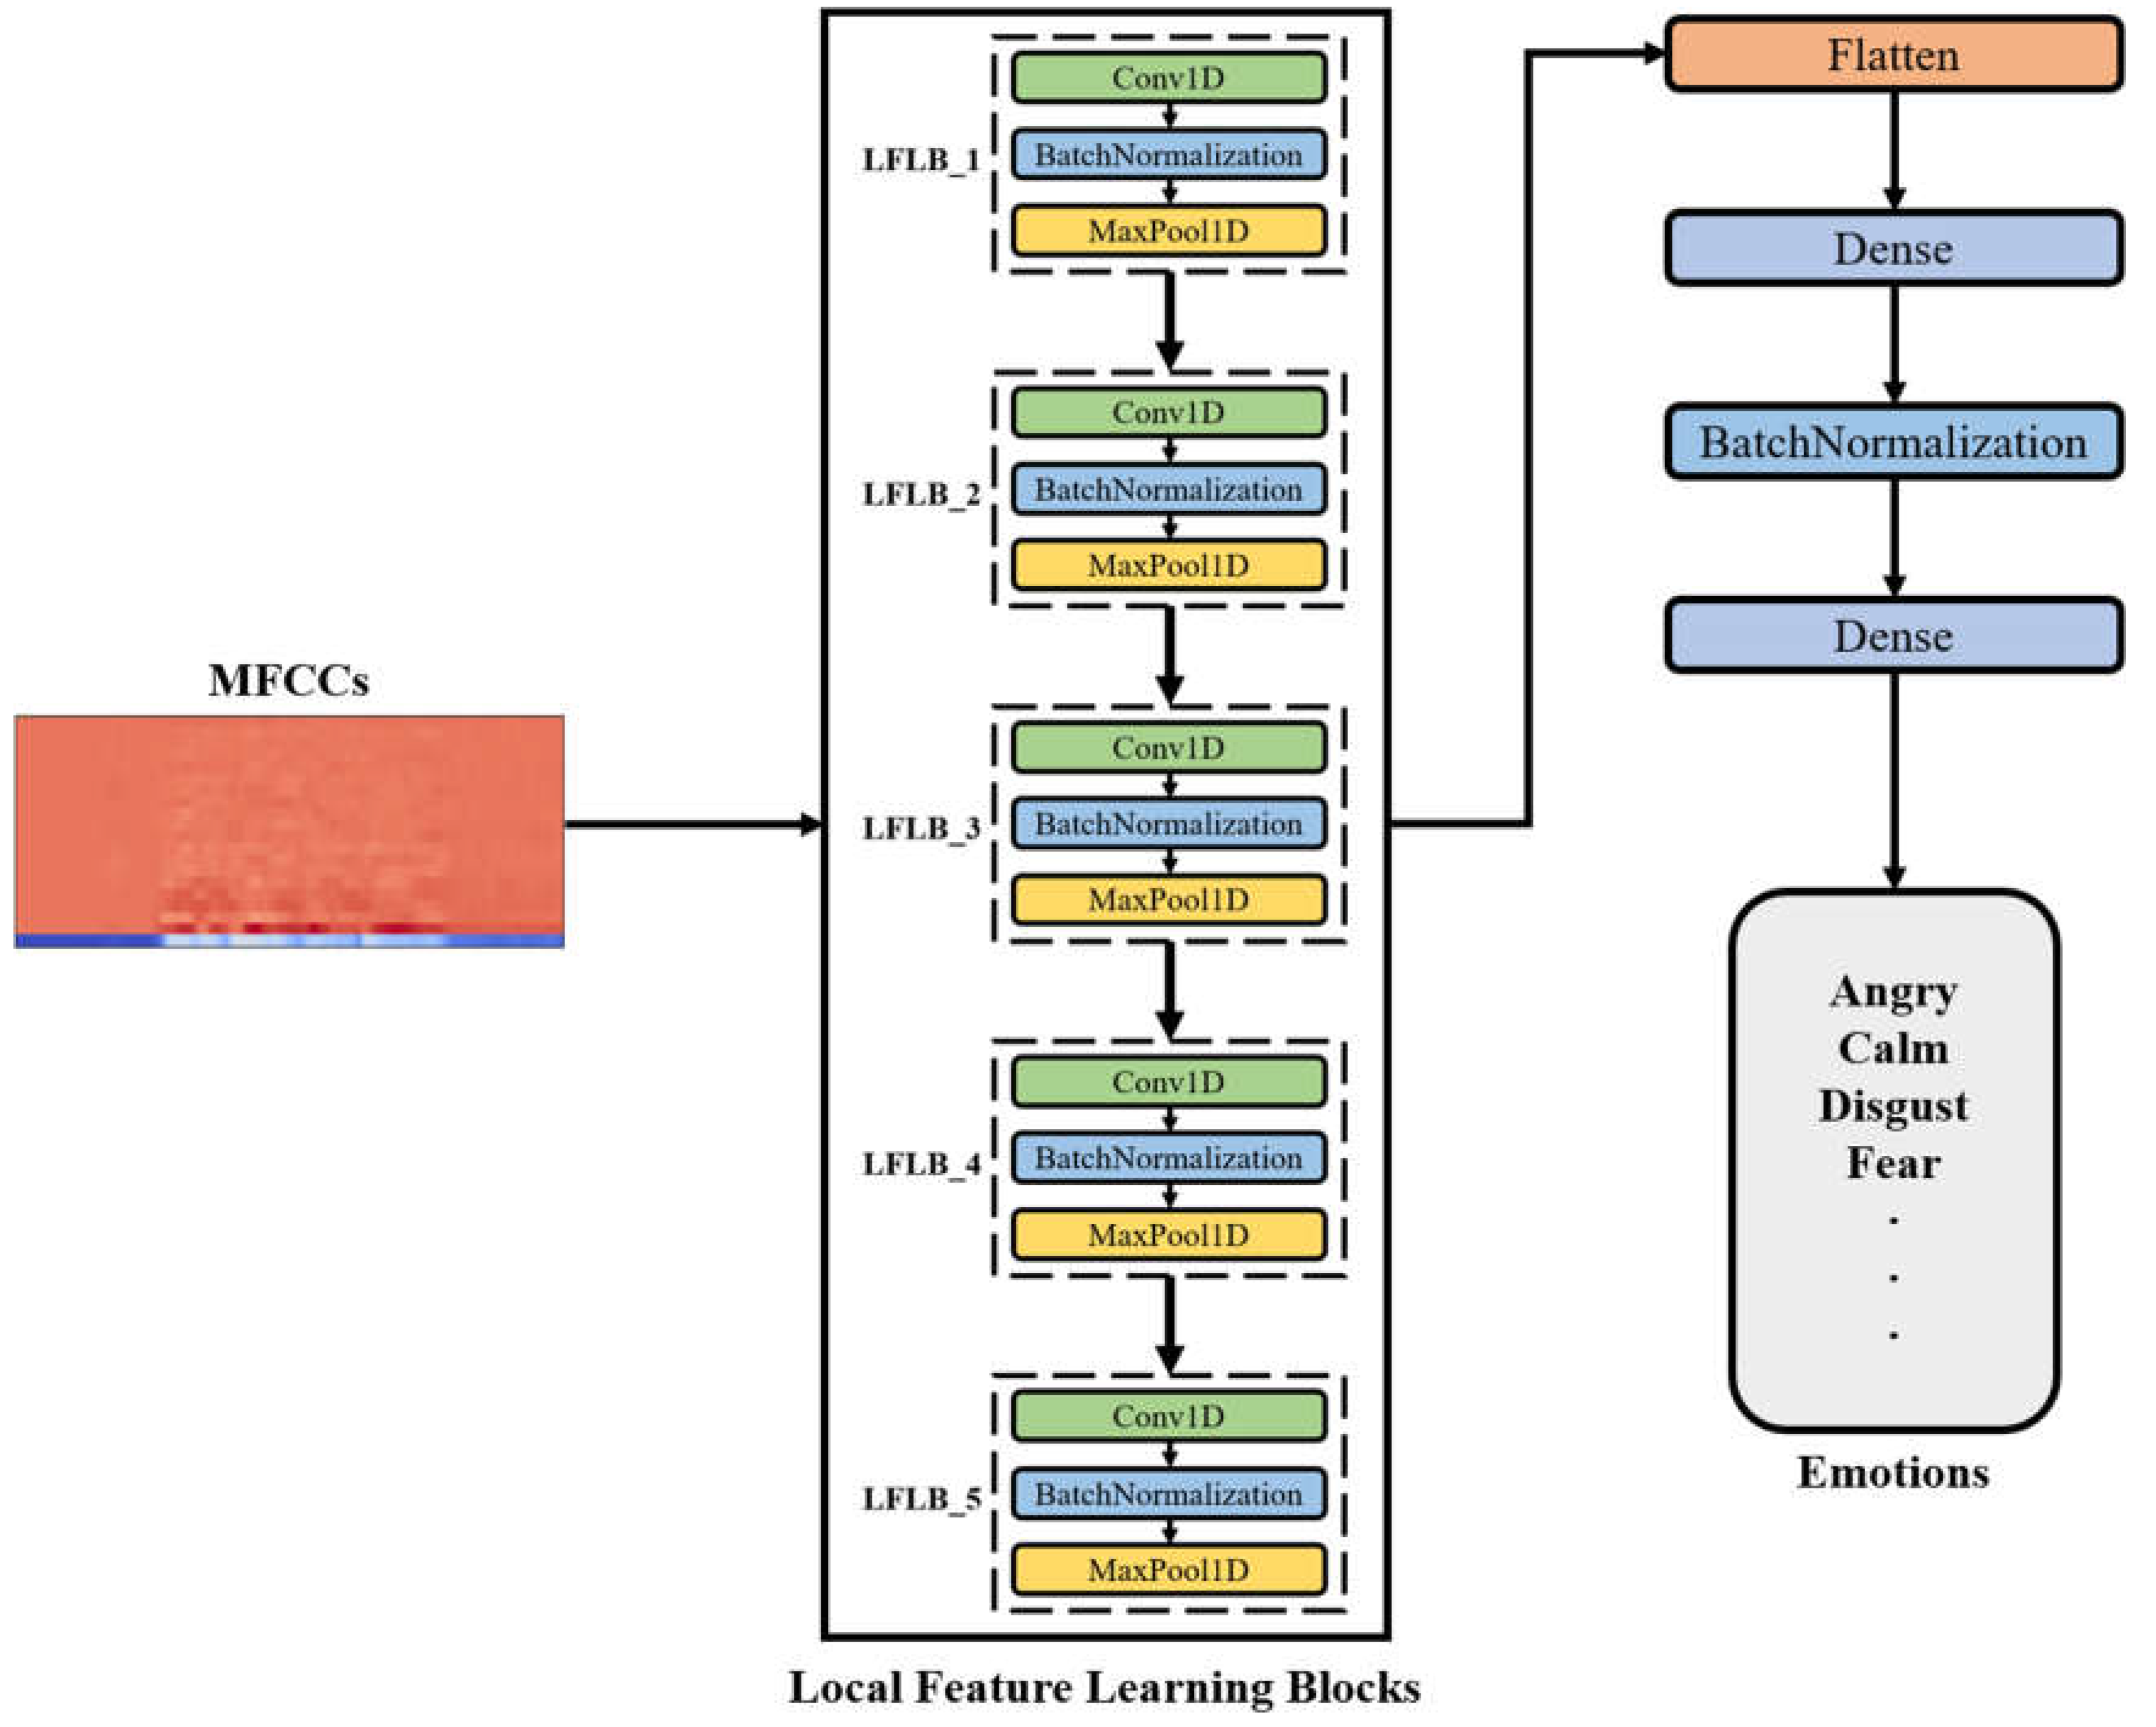
Figure 5.
Confusion matrix for RAVDESS database using raw audio data.
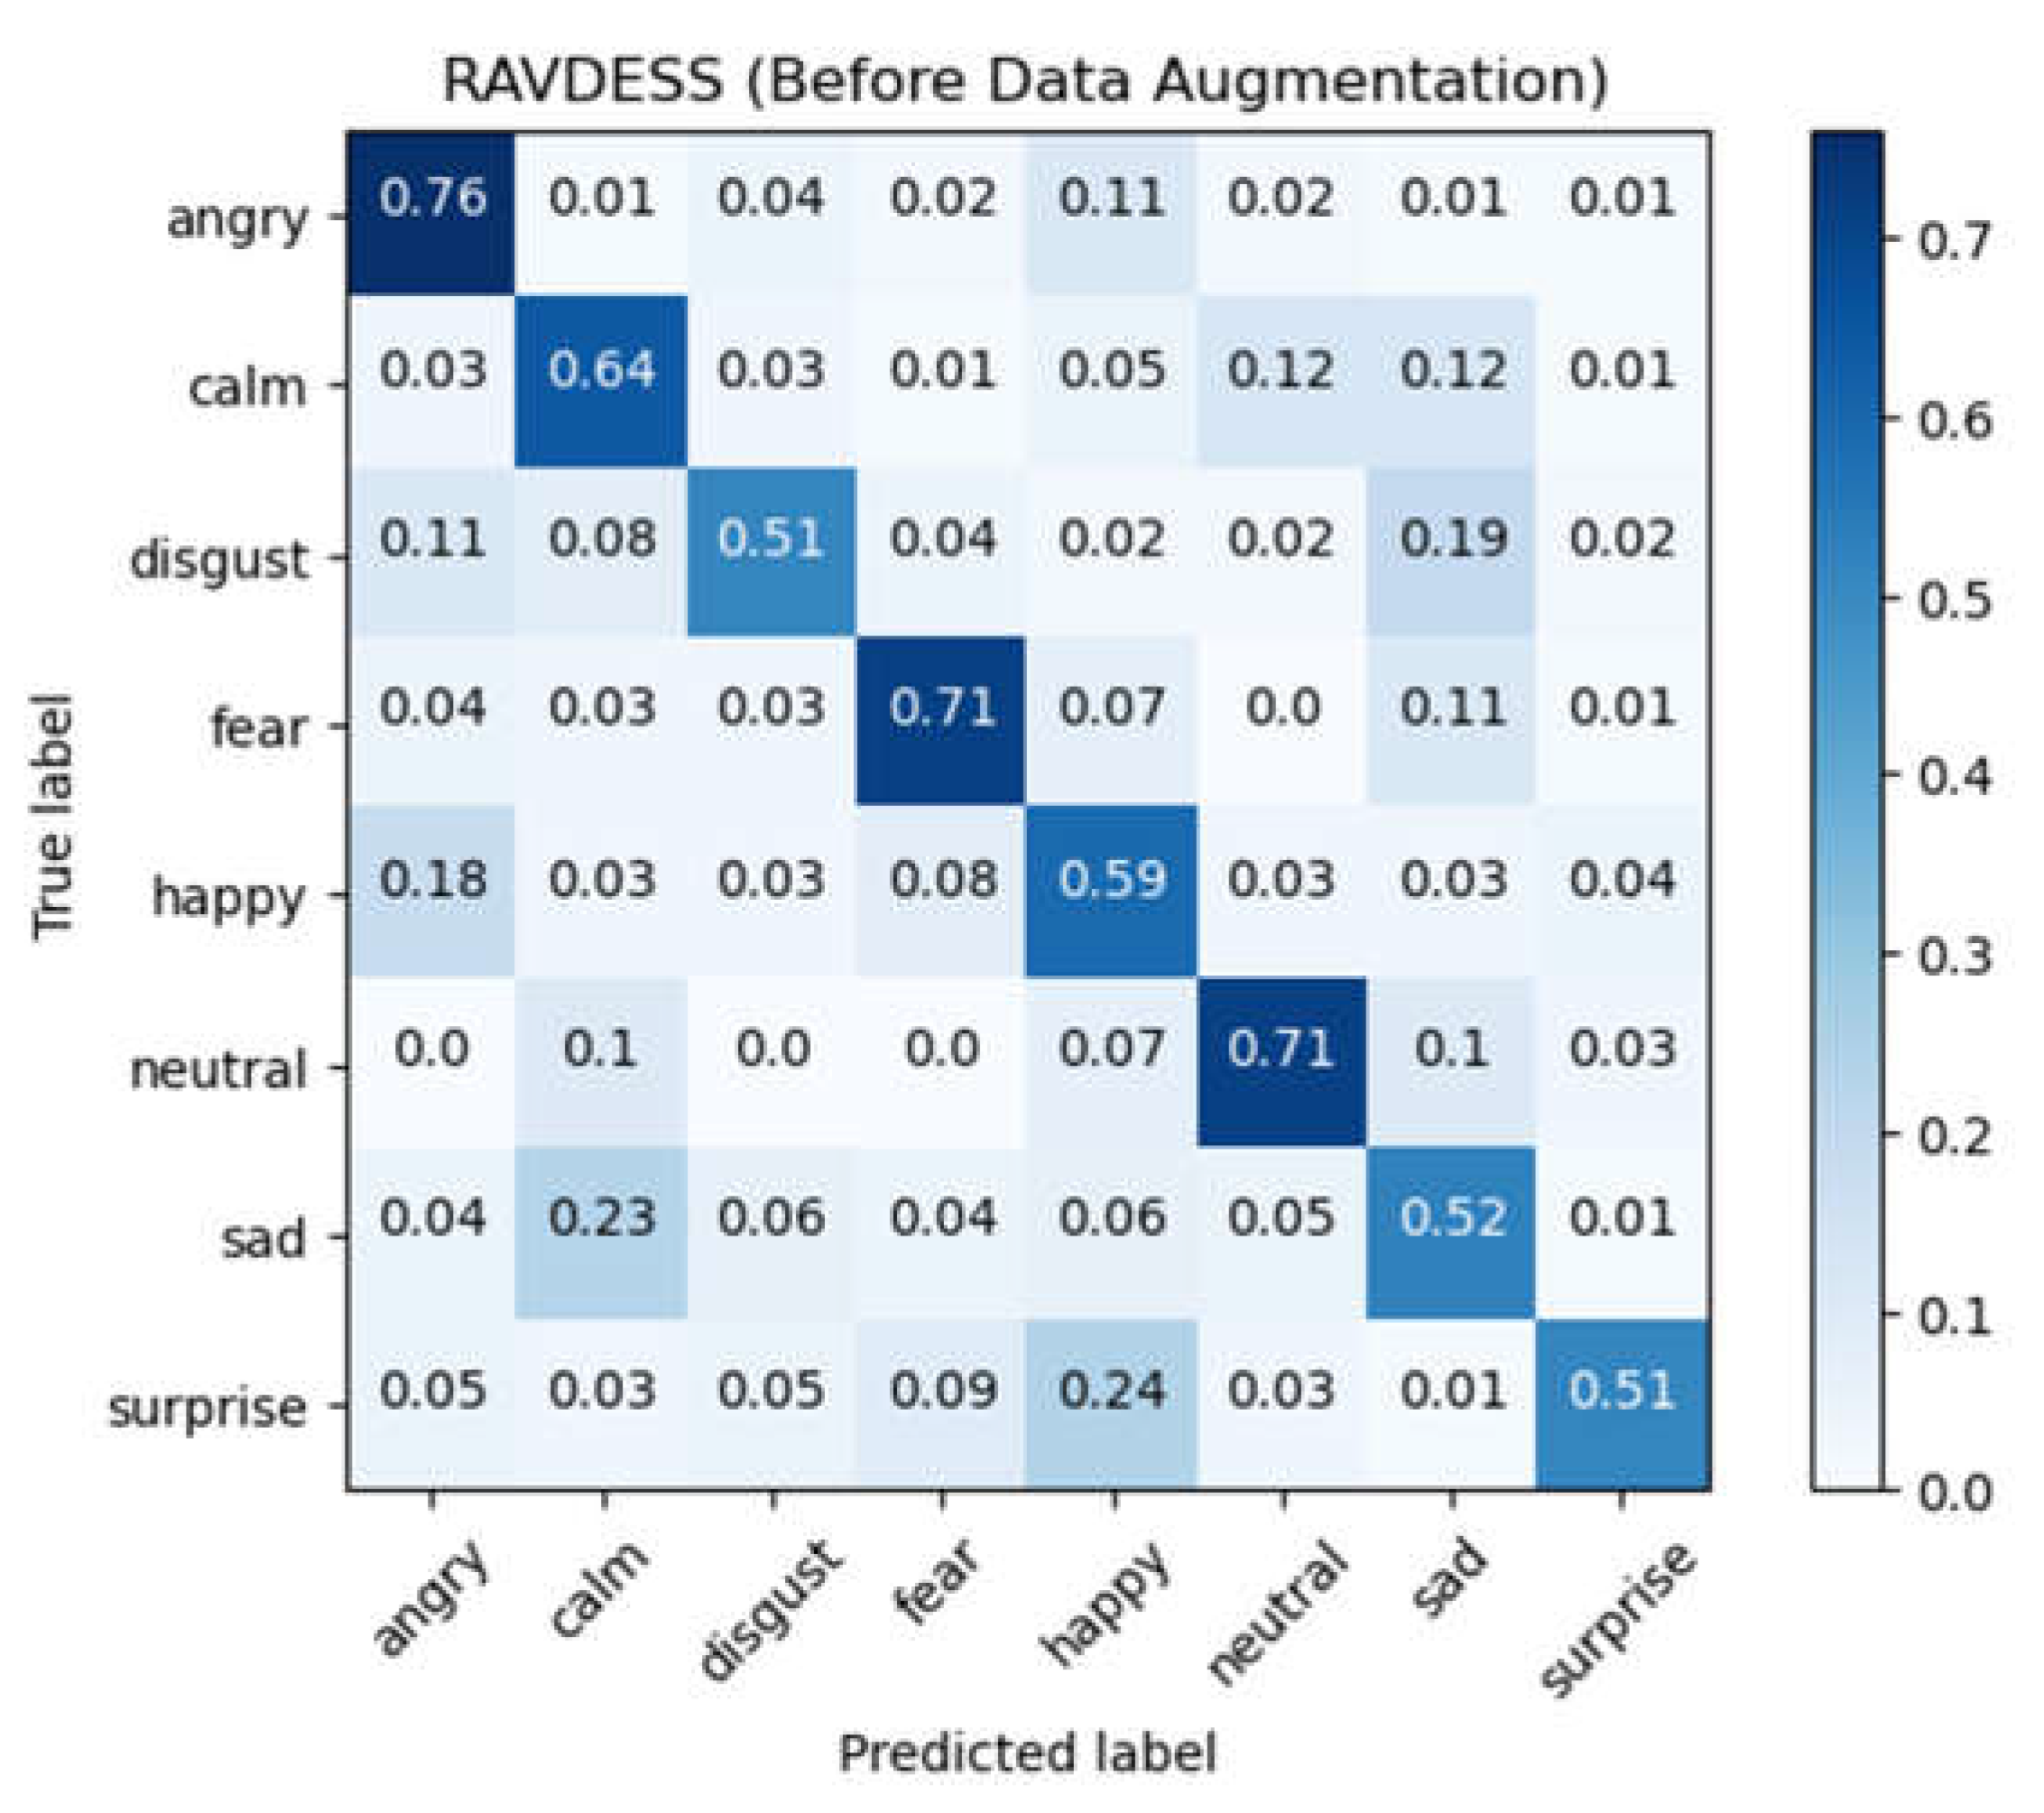
Figure 6.
Confusion matrix for RAVDESS database after data augmentation.
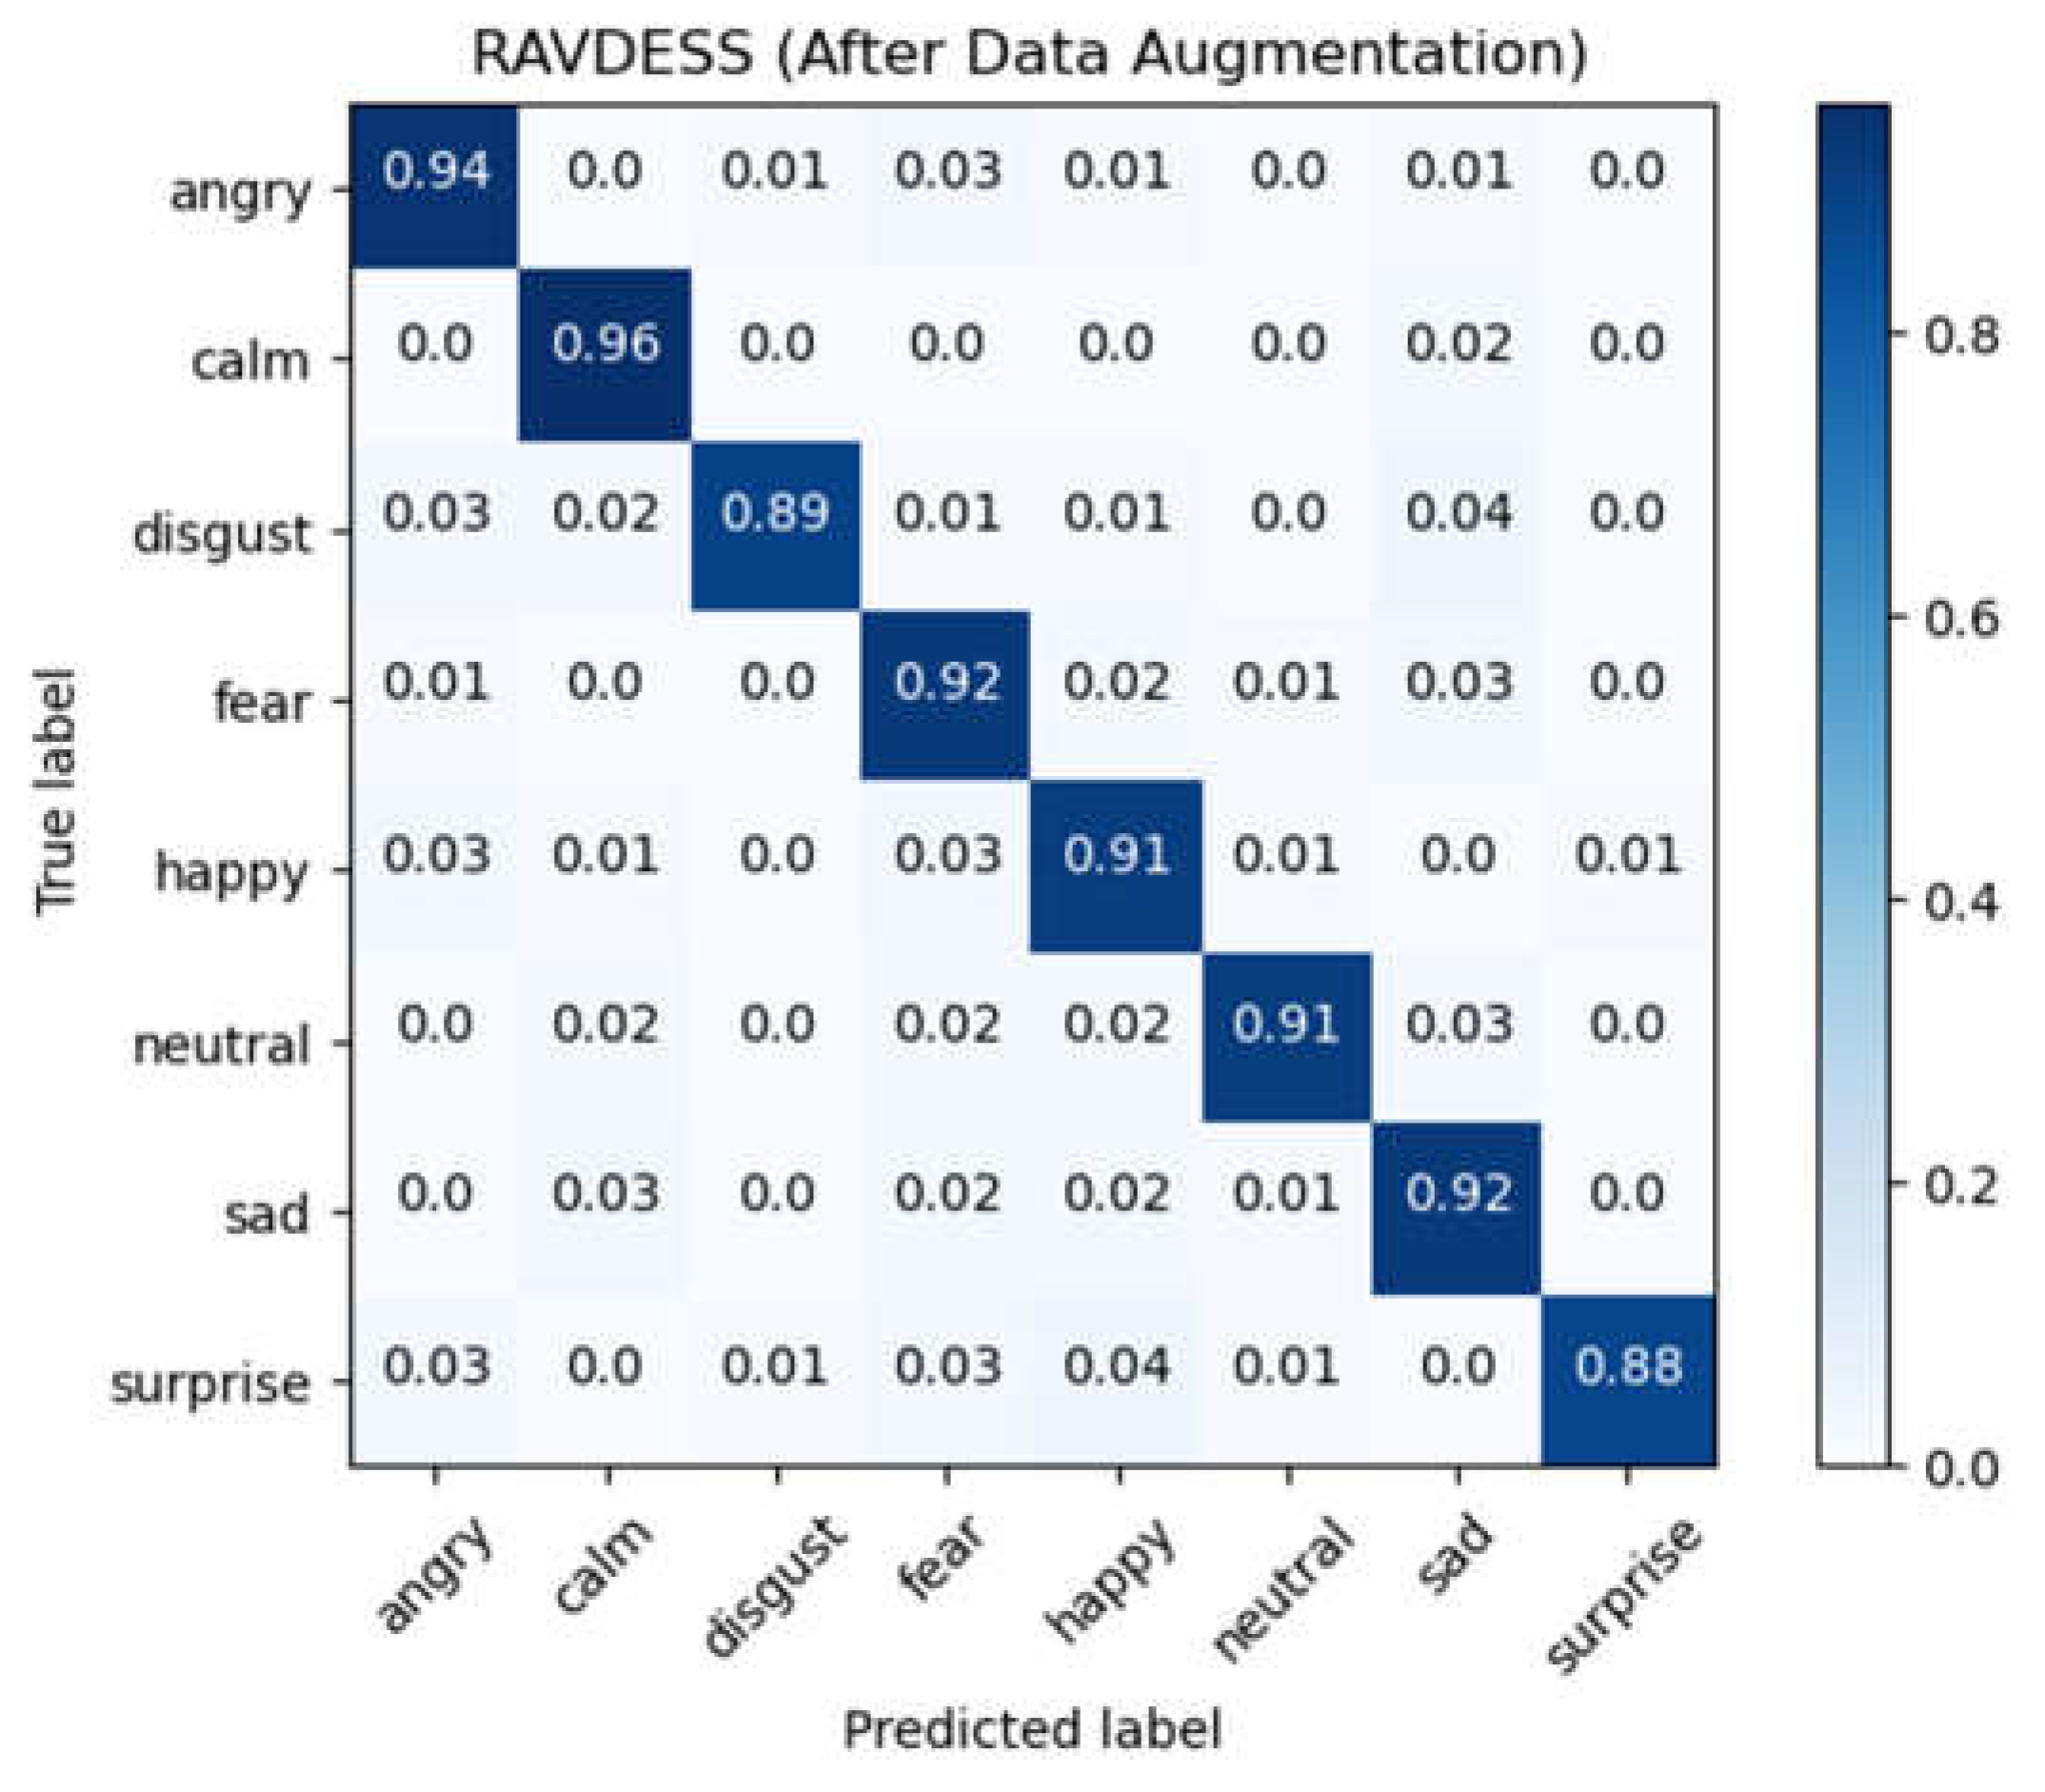
Figure 7.
Confusion matrix for EMO-DB database after data augmentation.
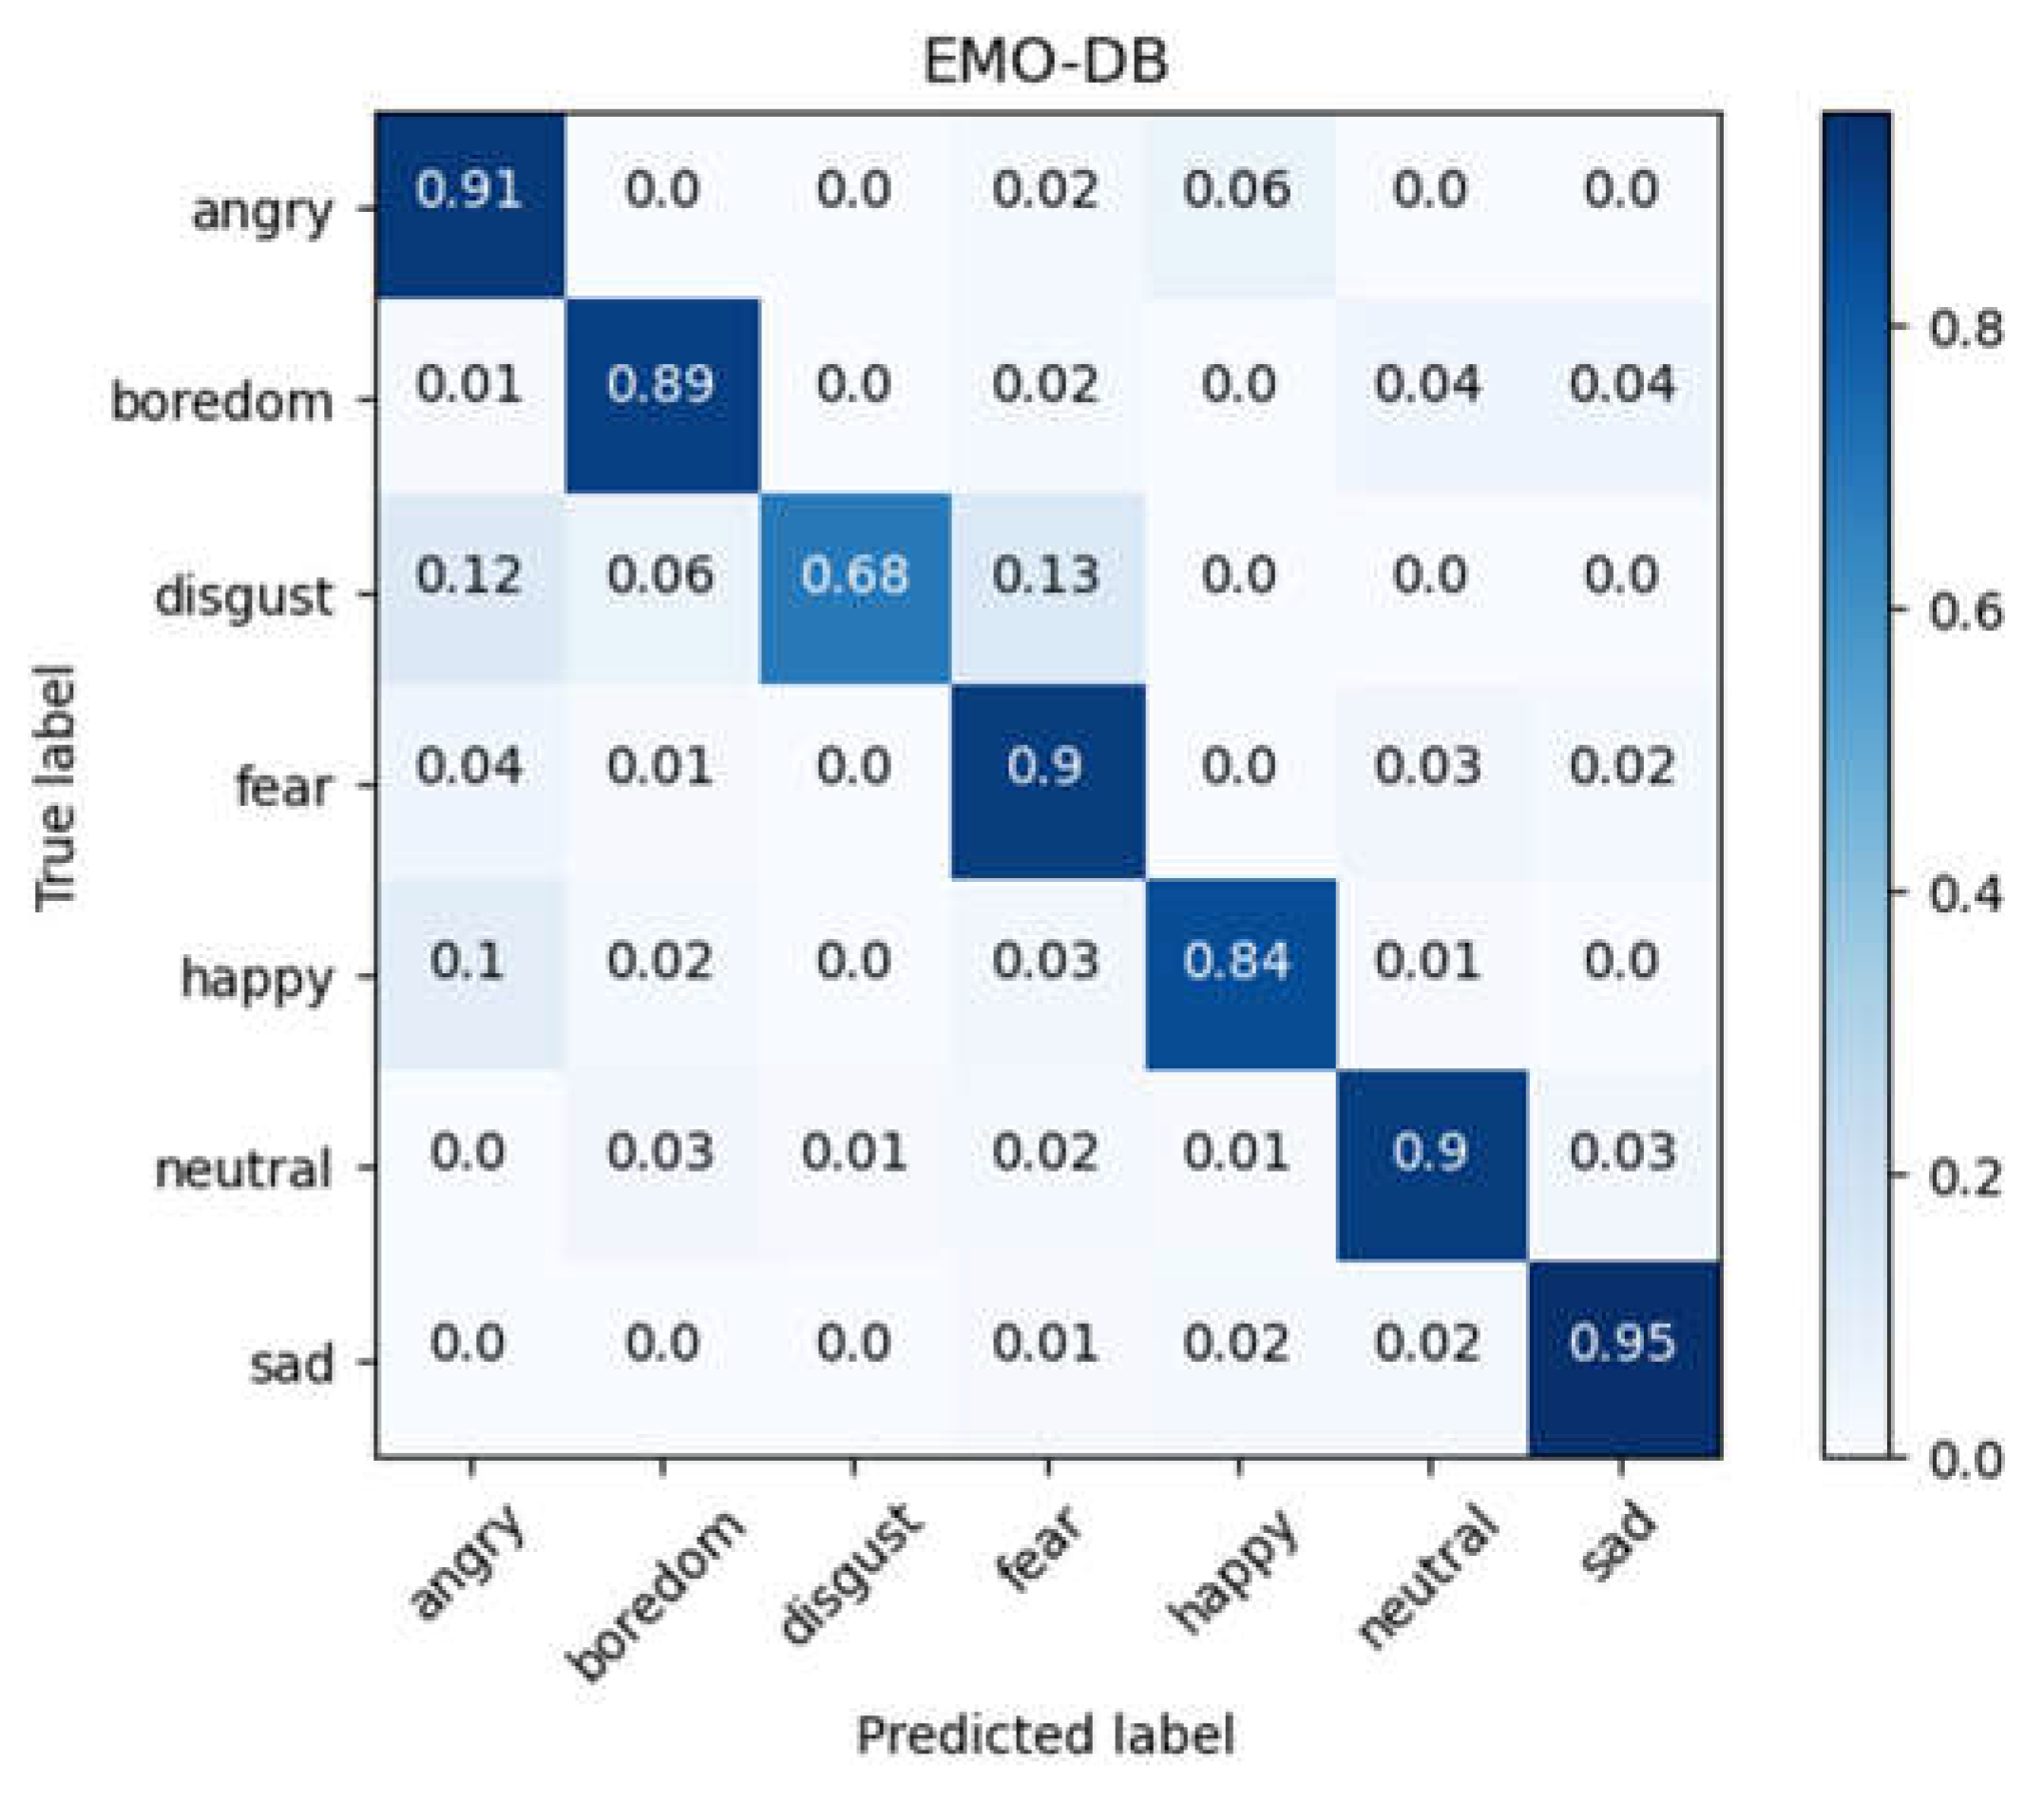
Figure 8.
Confusion matrix for IEMOCAP database after data augmentation.
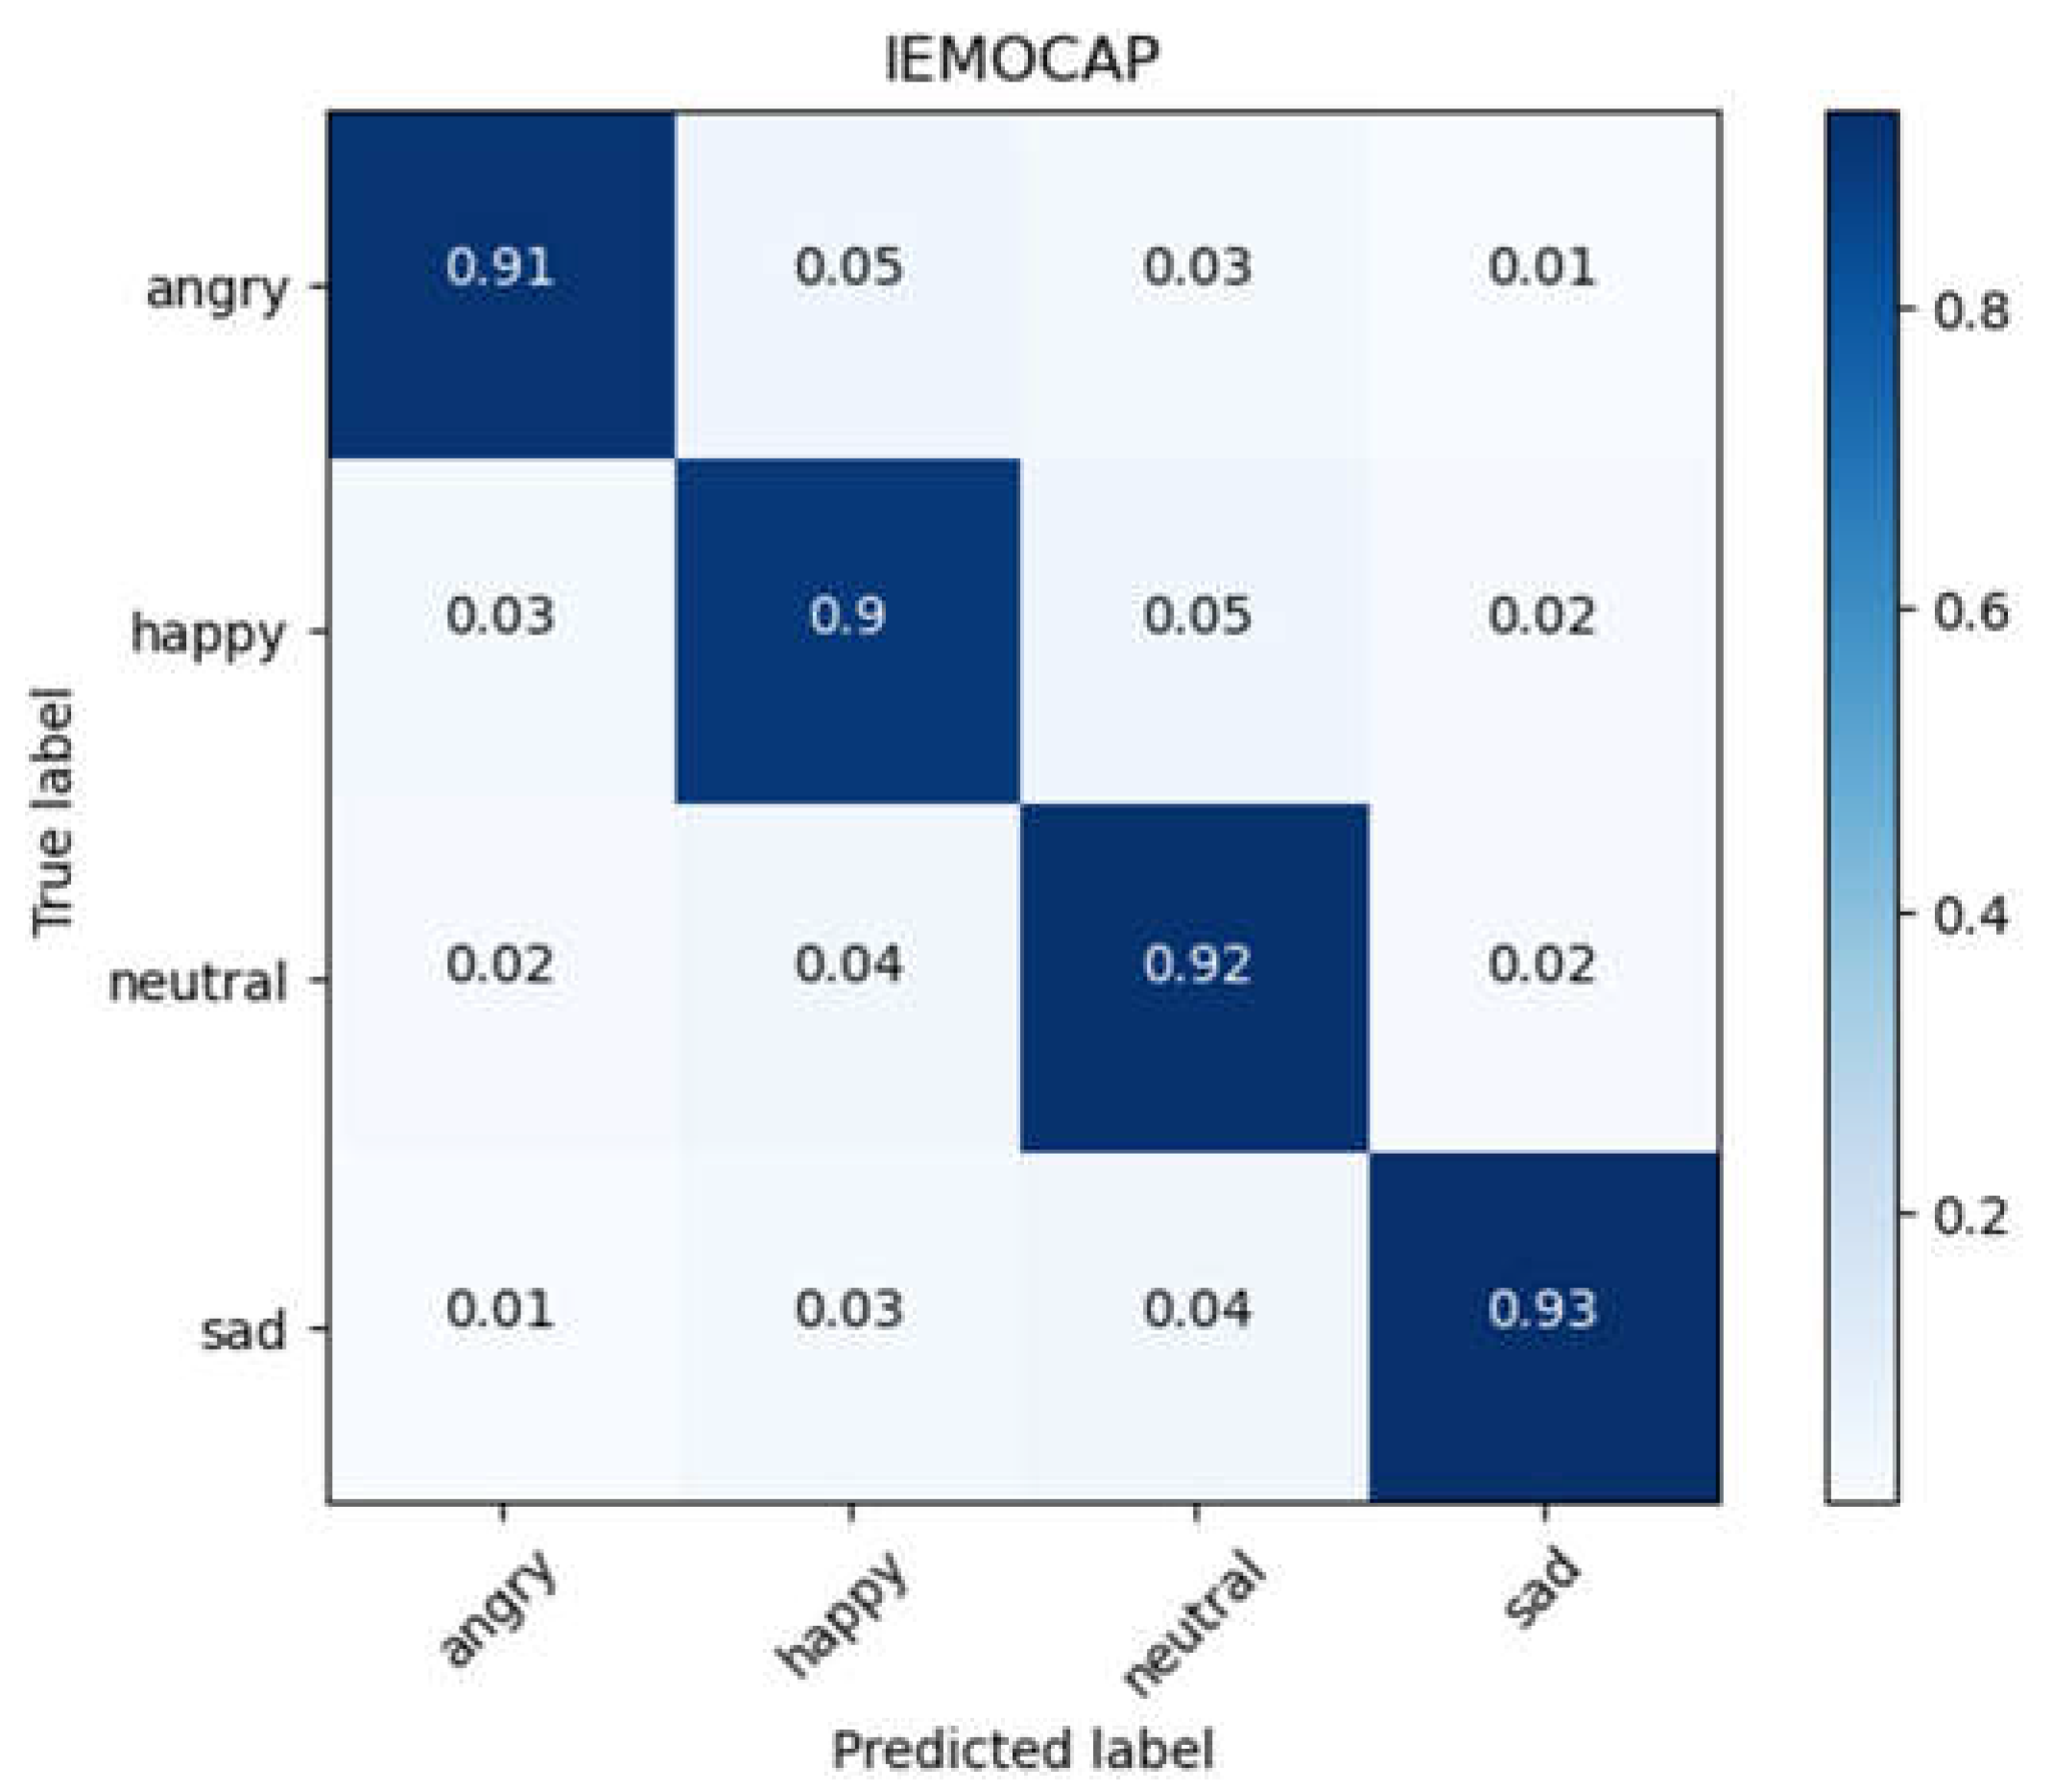
Figure 9.
Architecture and training process of the CLDNN model.
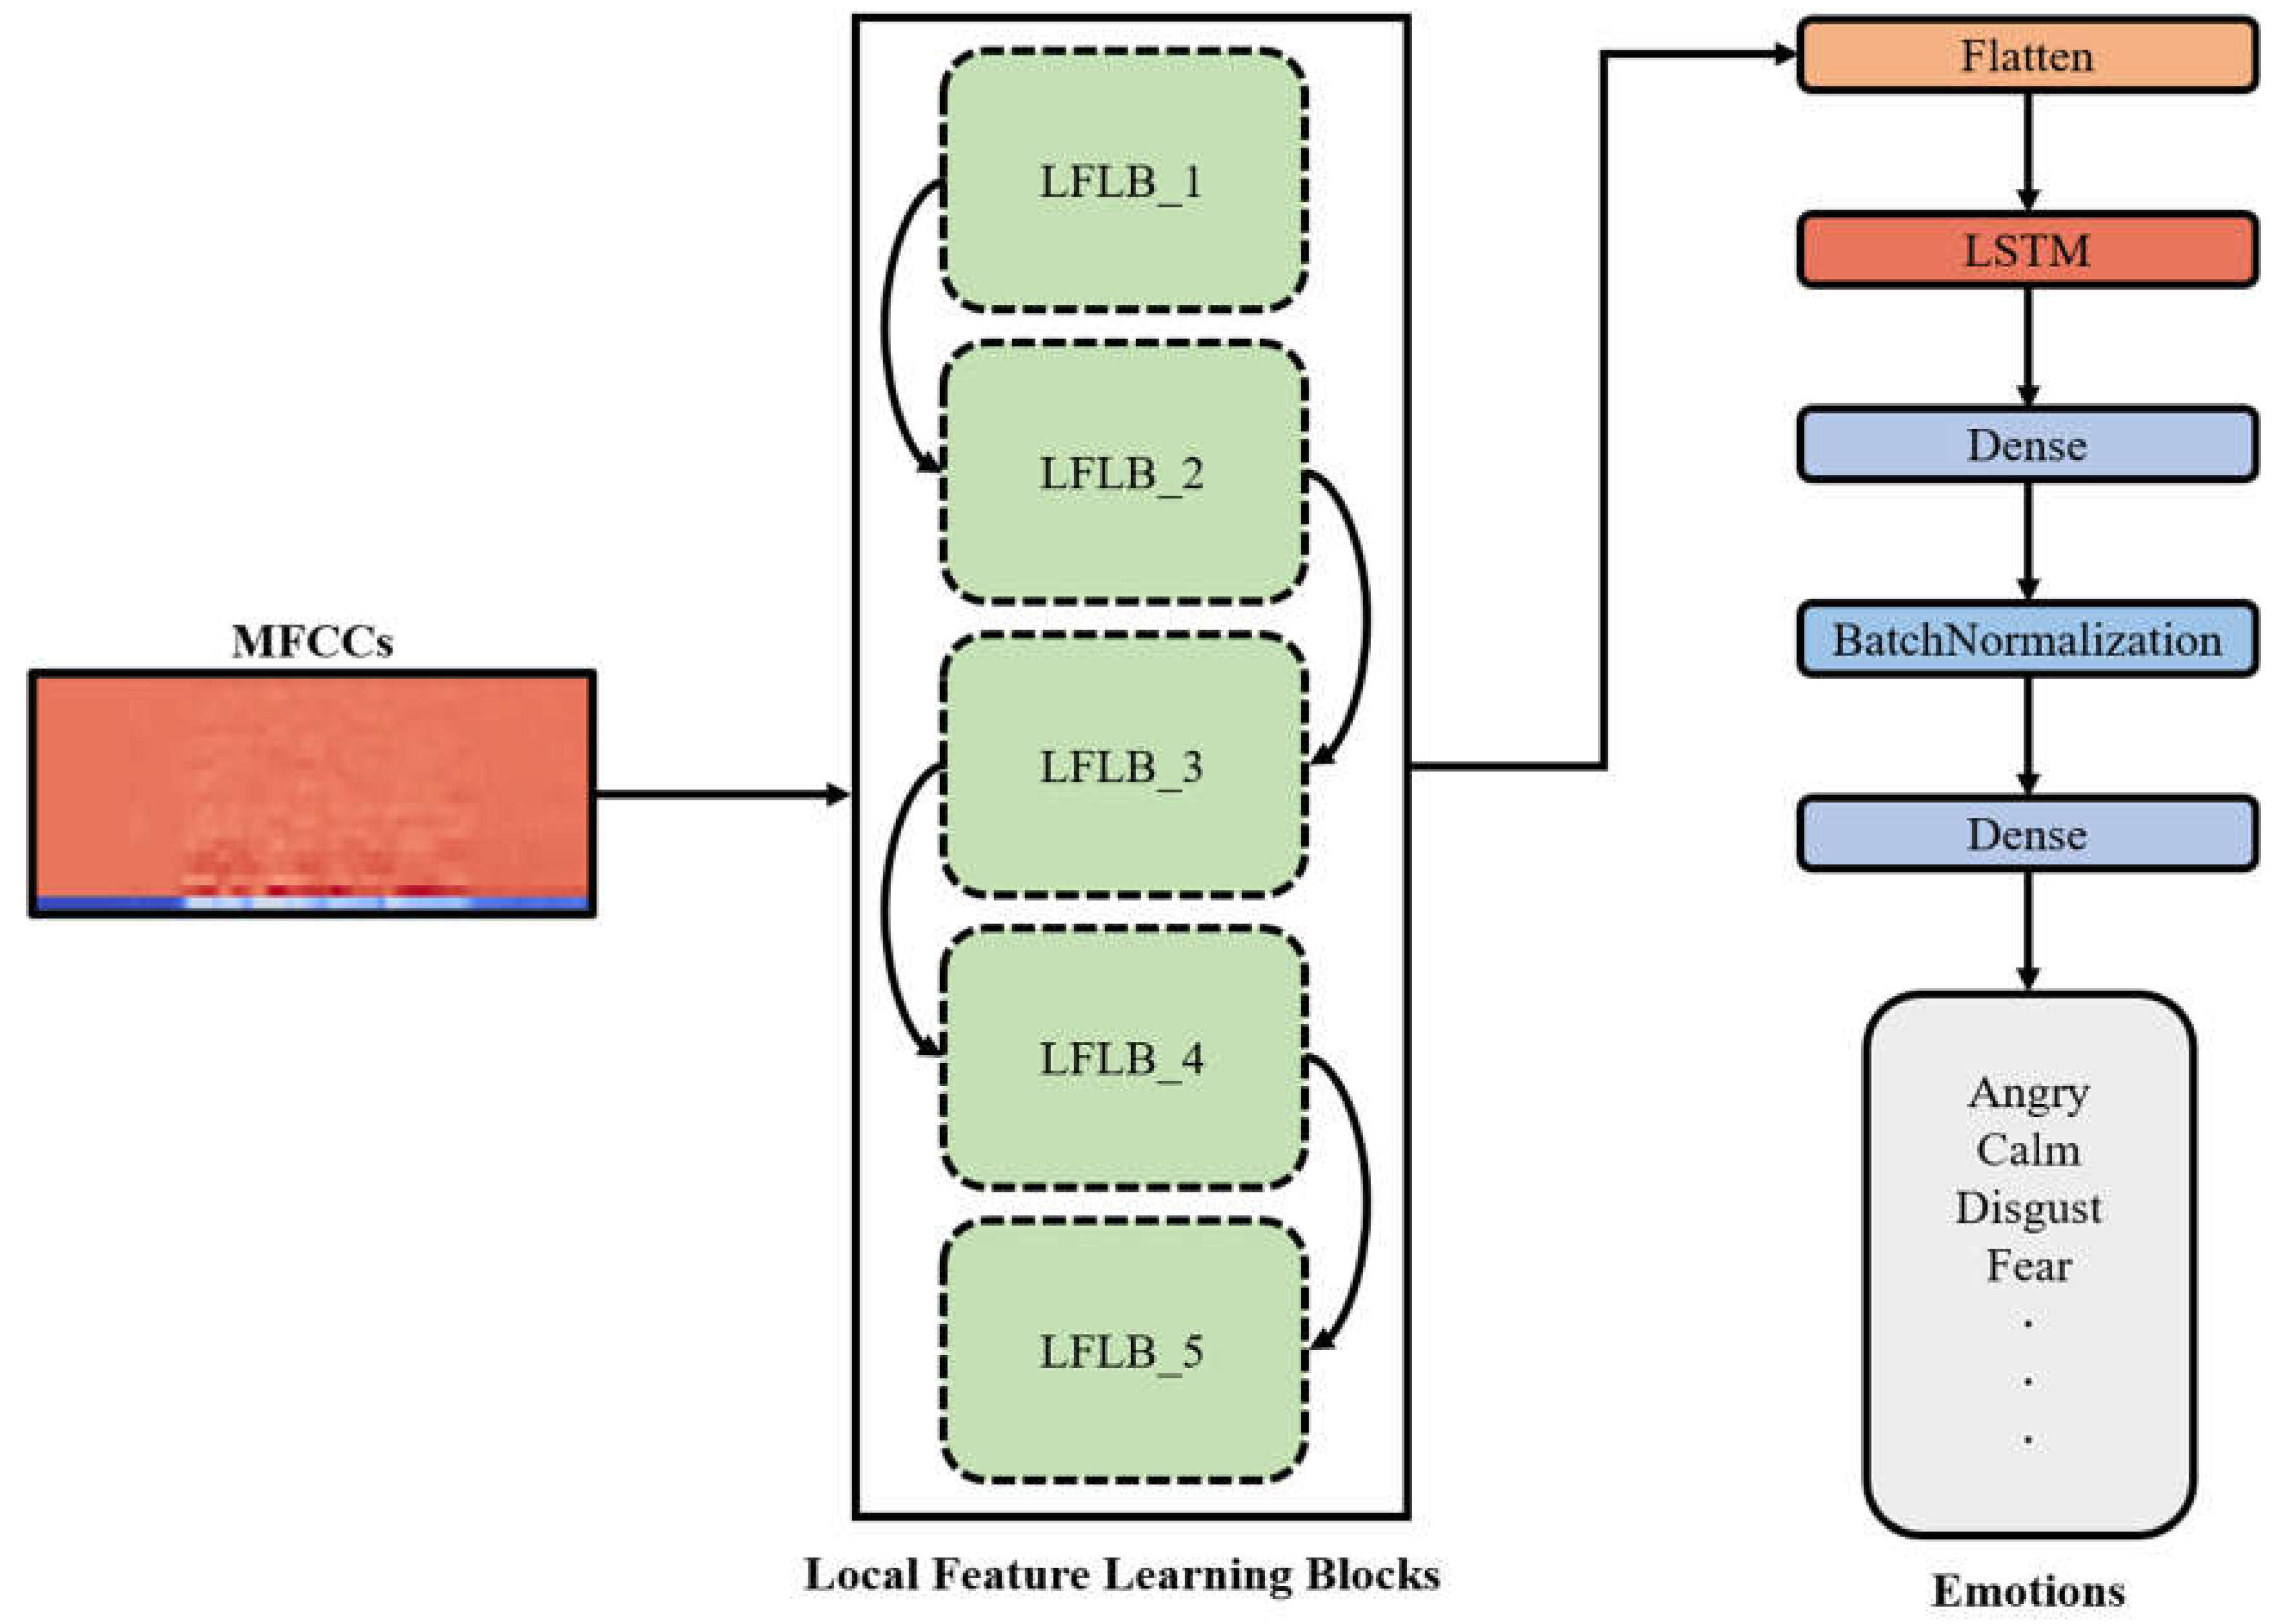
Figure 10.
Confusion matrix for RAVDESS database using raw audio data (CLDNN).
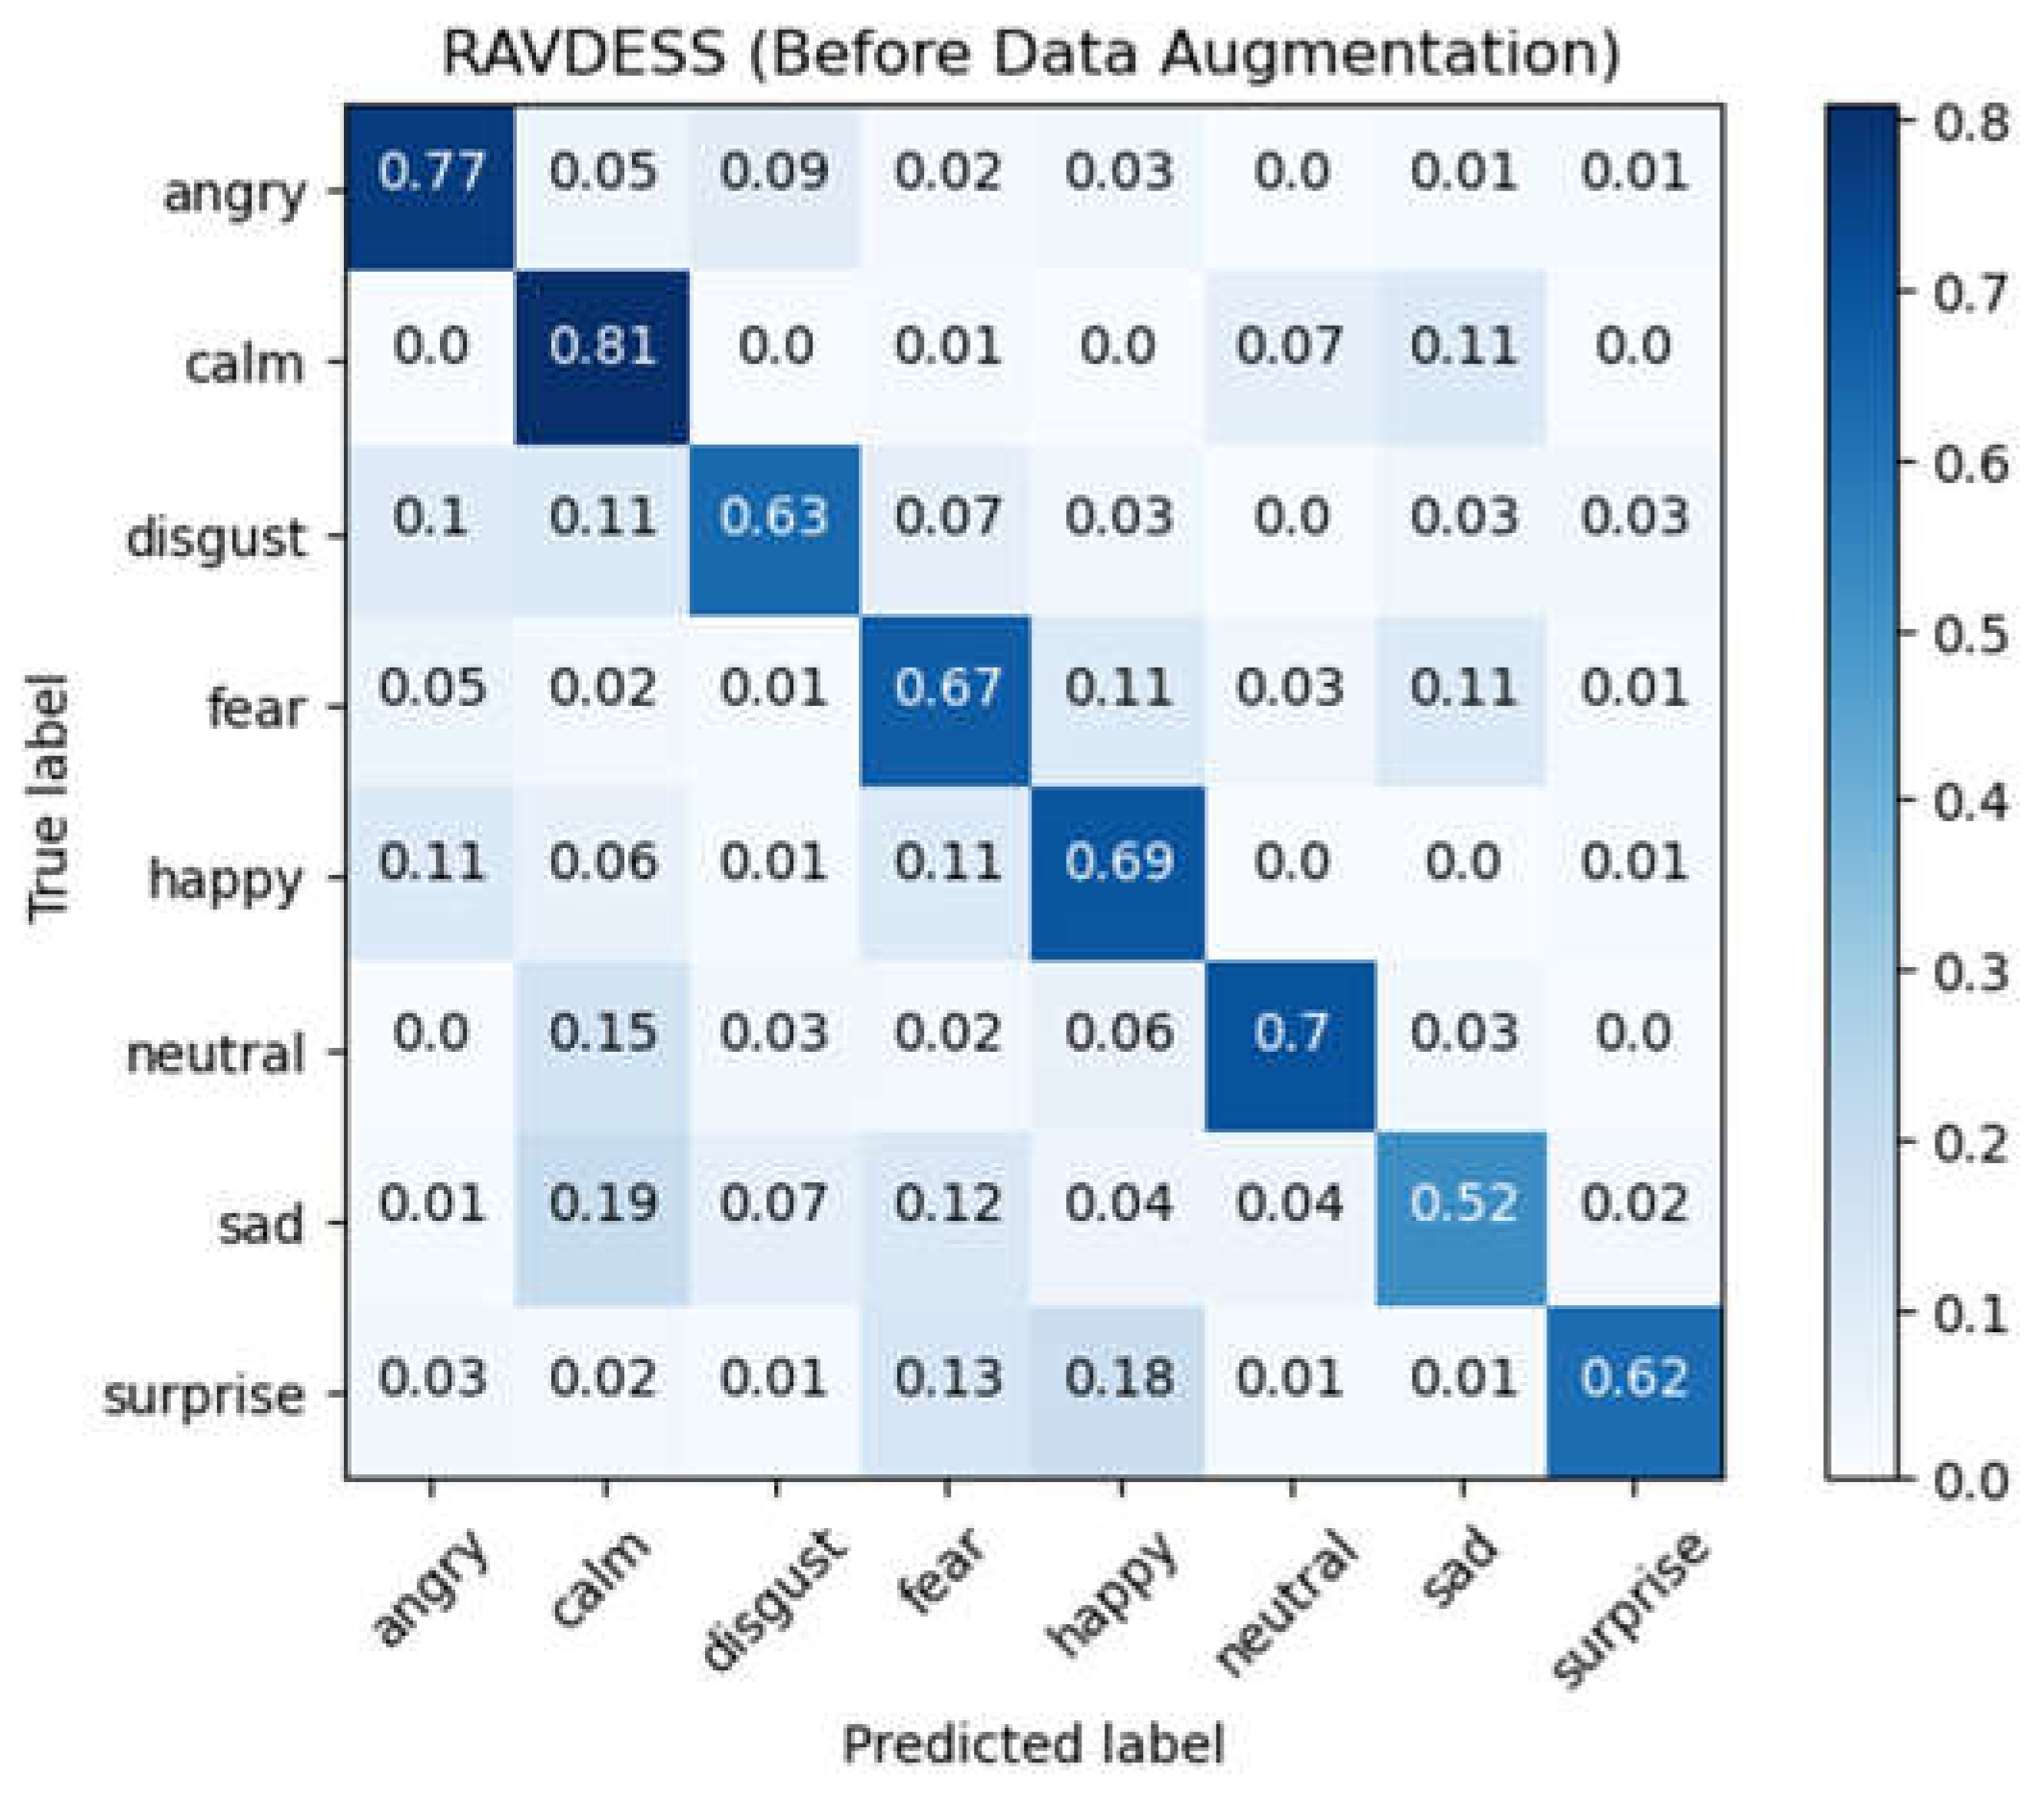
Figure 11.
Confusion matrix for RAVDESS database after data augmentation (CLDNN).
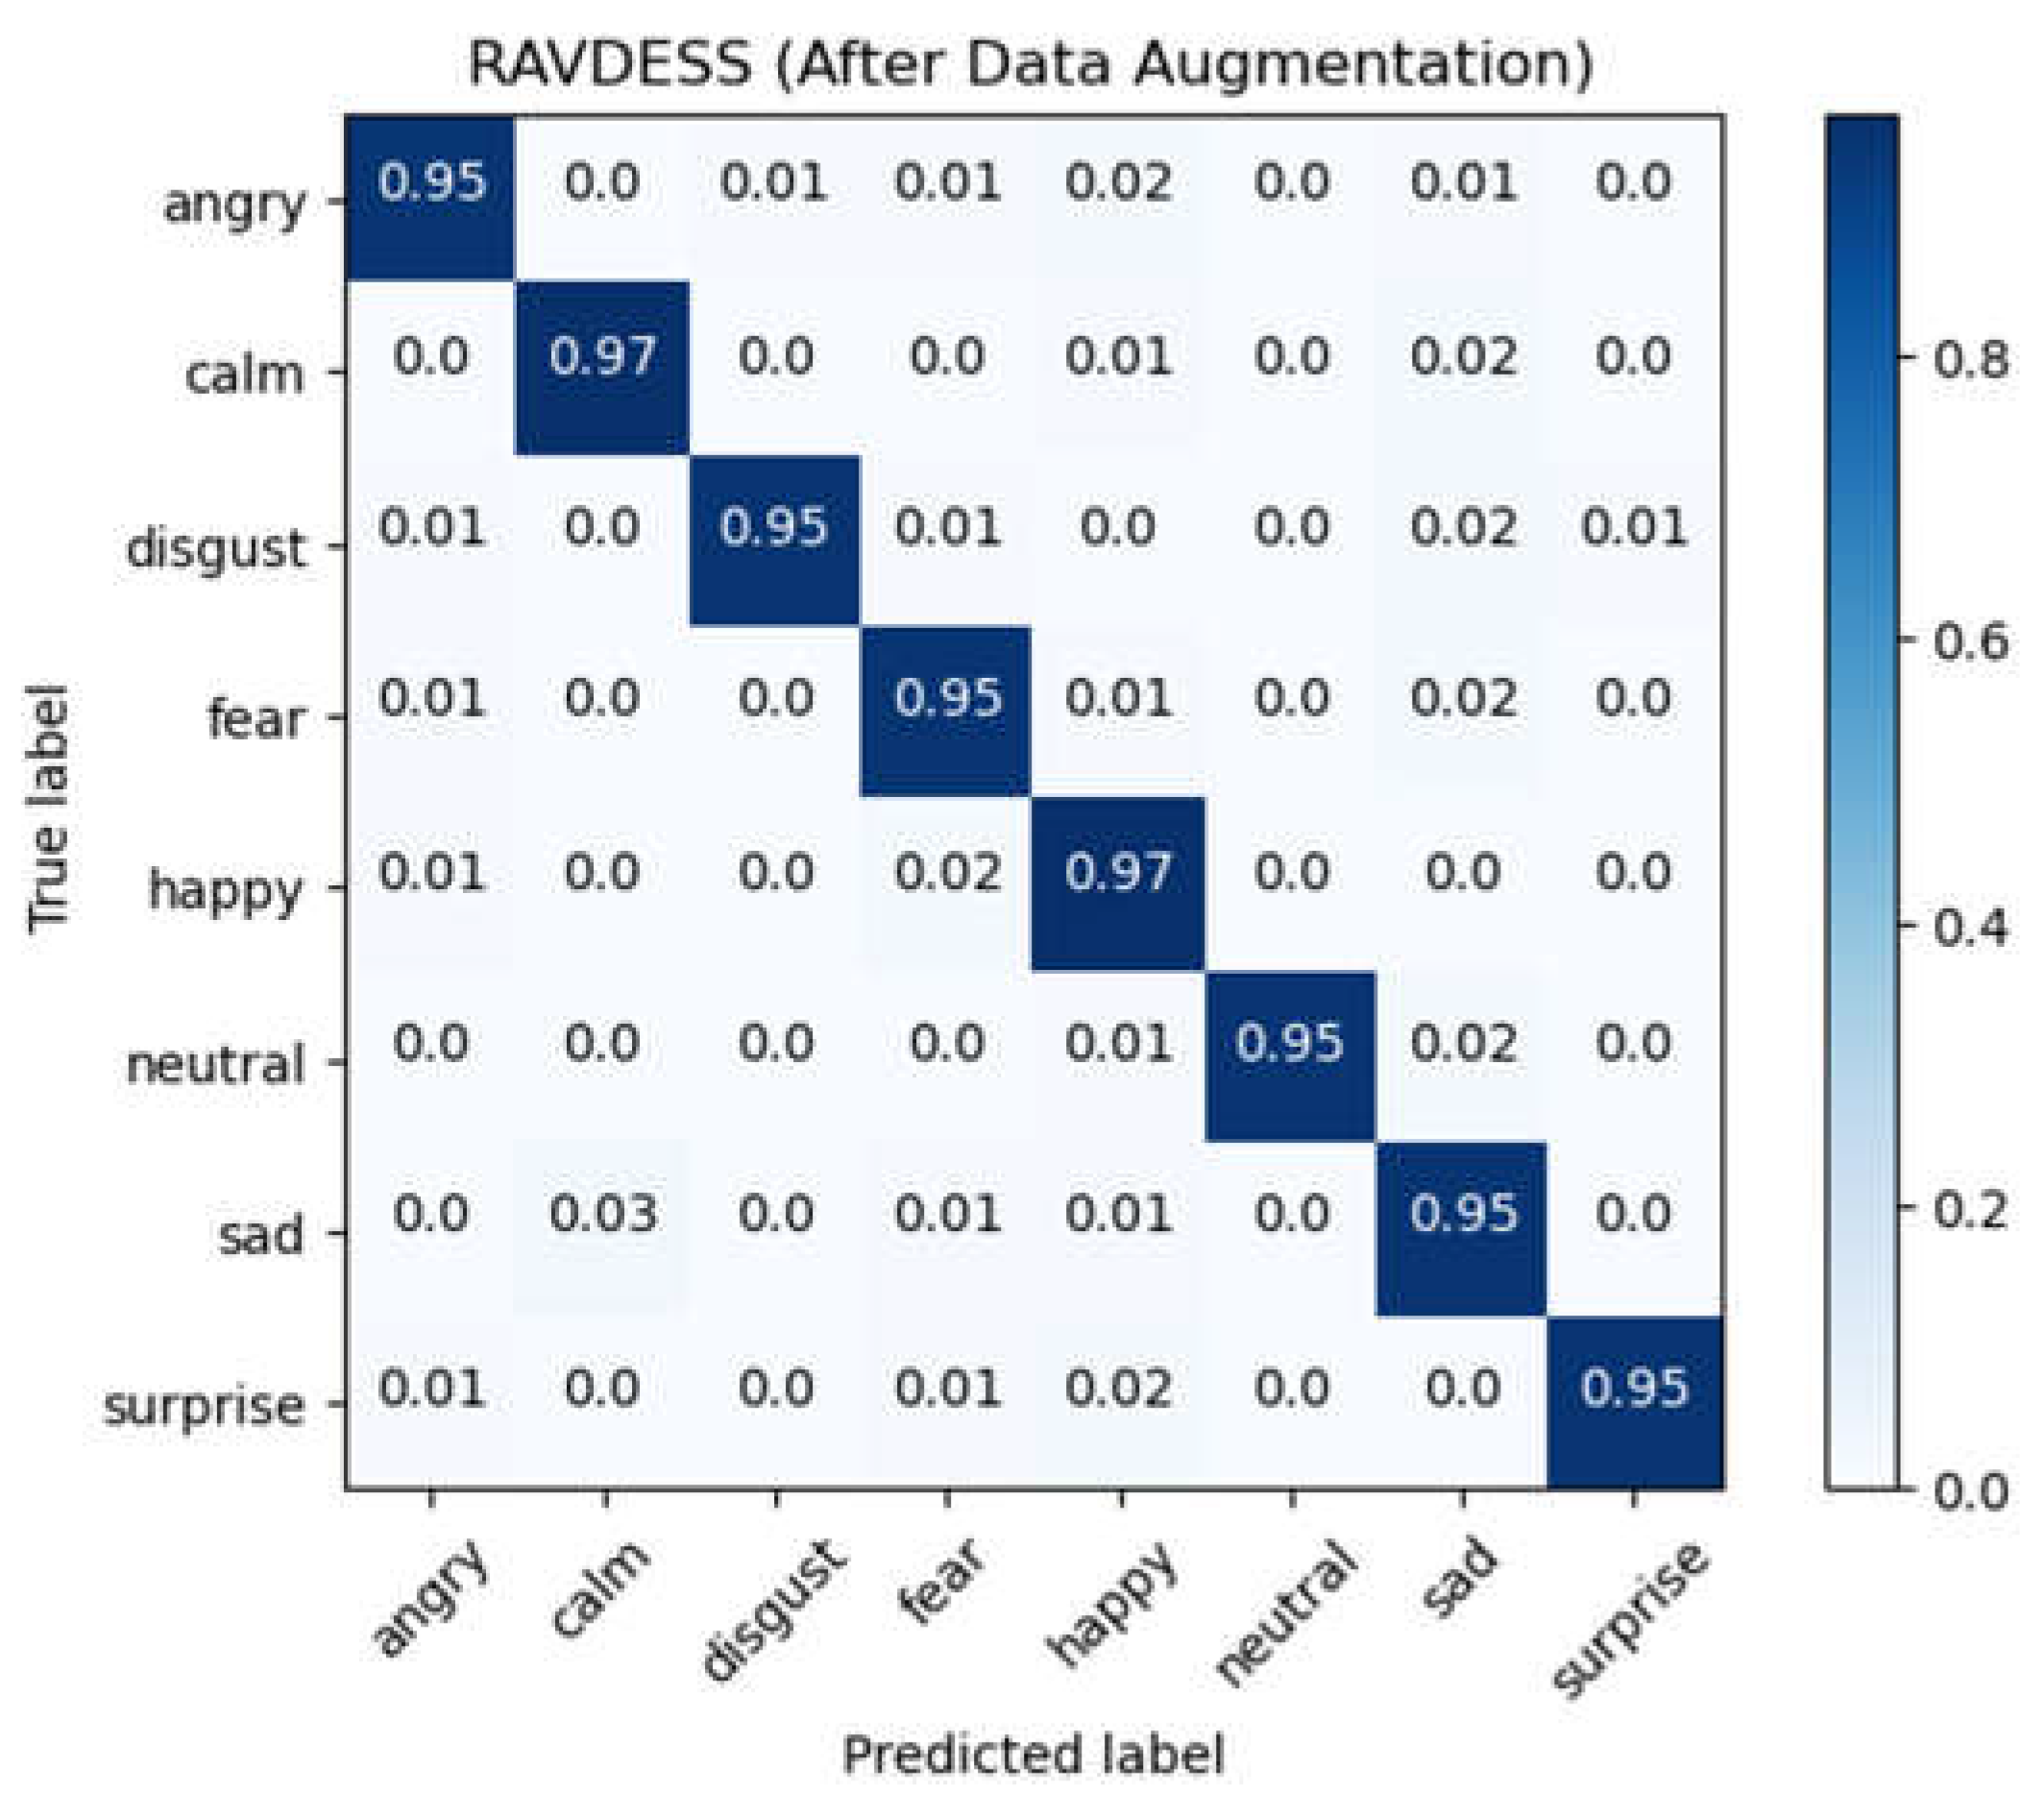
Figure 12.
Confusion matrix for EMO-DB database after data augmentation (CLDNN).
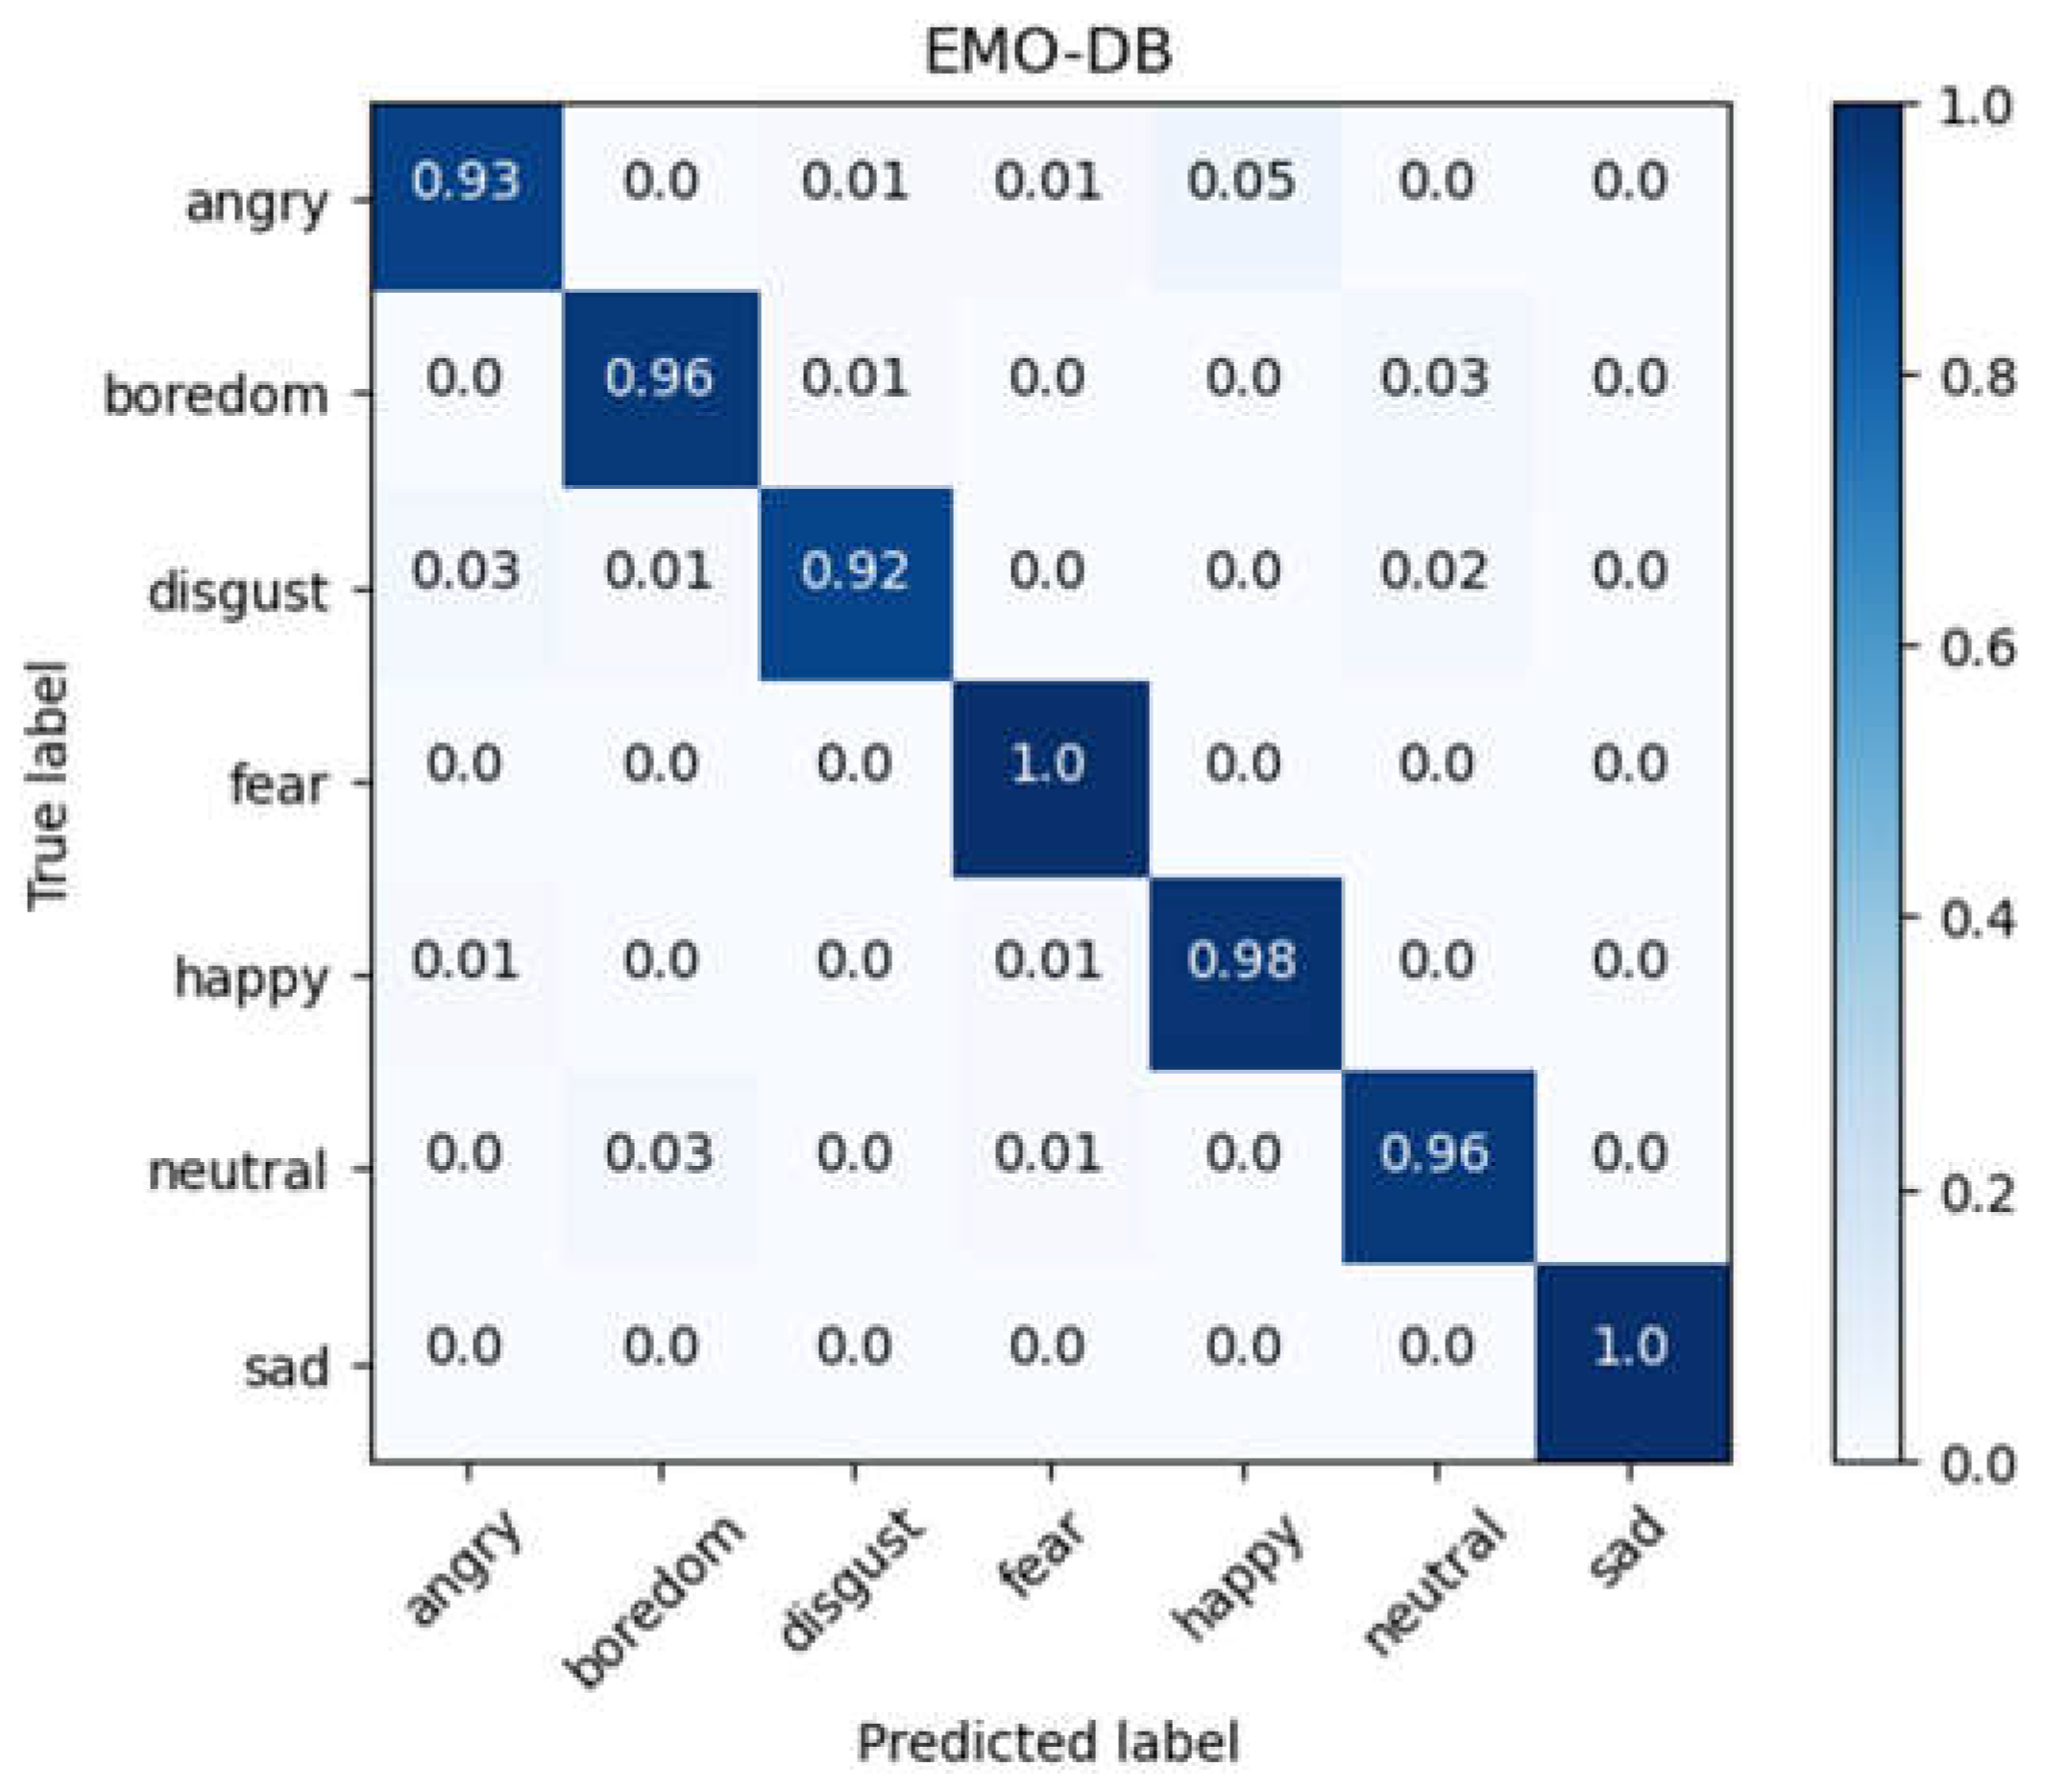
Figure 13.
Confusion matrix for IEMOCAP database after data augmentation (CLDNN).
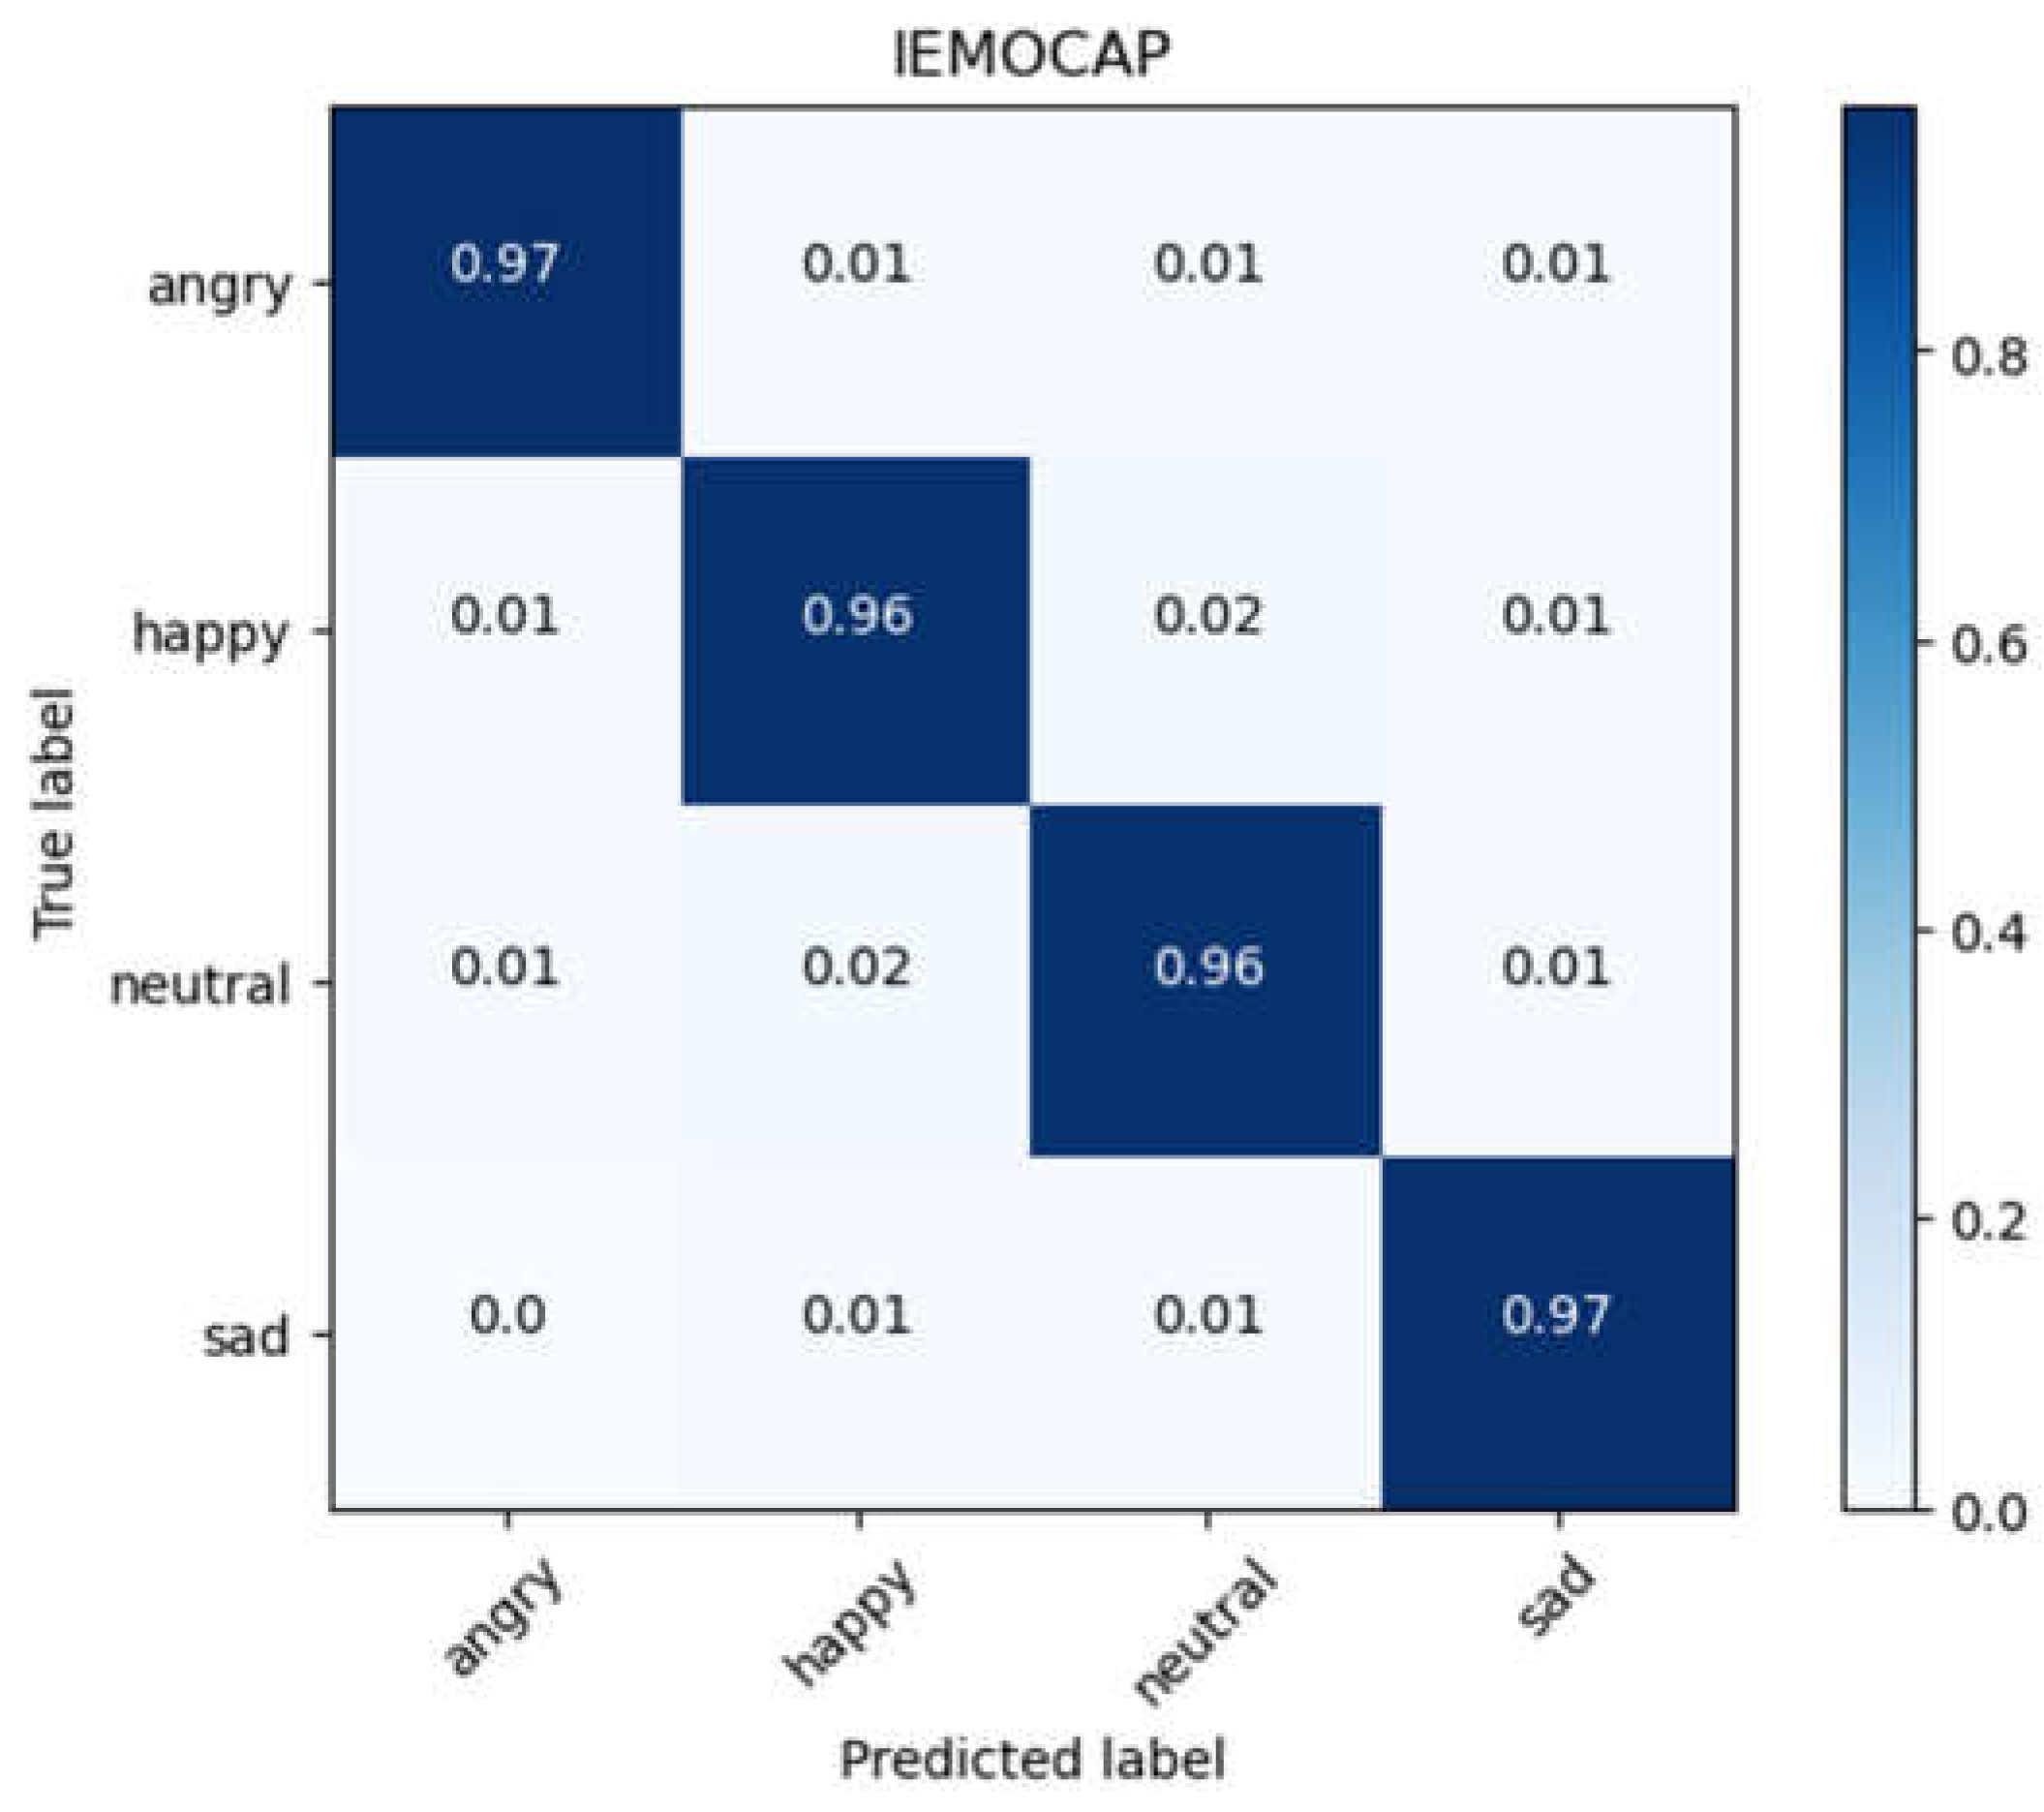

Table 1.
The quantity and proportion of data for each emotion in the RAVDESS database.
| Label | Number of Data | Proportion |
|---|---|---|
| Angry | 376 | 15.33% |
| Calm | 376 | 15.33% |
| Disgust | 192 | 7.83% |
| Fear | 376 | 15.33% |
| Happy | 376 | 15.33% |
| Neutral | 188 | 7.39% |
| Sad | 376 | 15.33% |
| Surprised | 192 | 7.83% |
| Total | 2,452 | 100% |
Table 2.
The quantity and proportion of data for each emotion in the EMO-DB database.
| Label | Number of Data | Proportion |
|---|---|---|
| Angry | 127 | 23.74% |
| Boredom | 81 | 15.14% |
| Disgust | 46 | 8.6% |
| Fear | 69 | 12.9% |
| Happy | 71 | 13.27% |
| Neutral | 79 | 14.77% |
| Sad | 62 | 11.59% |
| Total | 535 | 100% |
Table 3.
The quantity and proportion of data for each emotion in the IEMOCAP database.
| Label | Number of Data | Proportion |
|---|---|---|
| Angry | 1,103 | 19.94% |
| Happy | 1,636 | 29.58% |
| Neutral | 1,708 | 30.88% |
| Sad | 1,084 | 19.6% |
| Total | 5,531 | 100% |
Table 4.
The research equipment and environment used in the experiment.
| Experimental Environment | |
|---|---|
| CPU | Intel® Core™ i7-10700 CPU 2.90GHz |
| GPU | NVIDIA GeForce RTX 3090 32GB |
| IDE | Jupyter notebook (Python 3.7.6) |
| Cross-validation | 10-fold |
Table 5.
Parameters used for the CNN-DNN model in this paper.
| Layer | Information | |
|---|---|---|
|
LFLB 1 |
Conv1D (input) BatchNormalization MaxPooling1D |
filters = 256, kernel_size = 5, strides = 1 pool_size = 5, strides = 2 |
|
LFLB 2 |
Conv1D BatchNormalization MaxPooling1D |
filters = 128, kernel_size = 5, strides = 1 pool_size = 5, strides = 2 |
|
LFLB 3 |
Conv1D BatchNormalization MaxPooling1D |
filters = 128, kernel_size = 5, strides = 1 pool_size = 5, strides = 2 |
|
LFLB 4 |
Conv1D BatchNormalization MaxPooling1D |
filters = 64, kernel_size = 3, strides = 1 pool_size = 5, strides = 2 |
|
LFLB 5 |
Conv1D BatchNormalization MaxPooling1D |
filters = 64, kernel_size = 3, strides = 1 pool_size = 3, strides = 2 |
| Flatten | ||
| Dense | units = 256, activation = “relu” | |
| BatchNormalization | ||
| Dense (output) | activation = “softmax” | |
Table 6.
Parameters used for the CLDNN model in this paper.
| Layer | Information |
|---|---|
| Conv1D (input) | filters = 256, kernel_size = 5, strides = 1 |
| Conv1D | filters = 128, kernel_size = 5, strides = 1 |
| Conv1D | filters = 128, kernel_size = 5, strides = 1 |
| Conv1D | filters = 64, kernel_size = 3, strides = 1 |
| Conv1D | filters = 64, kernel_size = 3, strides = 1 |
| Flatten | |
| LSTM | units = 50 |
| Dense | units = 256, activation = “relu” |
| Dense (output) | units = 8, activation = “softmax” |
Table 7.
The average accuracy of cross-validation for the CNN-DNN and CLDNN models using raw audio data and audio data enhancement through the data augmentation.
Table 7.
The average accuracy of cross-validation for the CNN-DNN and CLDNN models using raw audio data and audio data enhancement through the data augmentation.
| Model | Raw Audio Data | Data Augmentation |
|---|---|---|
| CNN-DNN | 63.41% | 91.87% |
| CLDNN | 68.70% | 95.52% |
Table 8.
The precision, recall, and f1-score on each emotion recognized by using CLDNN model with data augmentation of the RAVDESS database.
Table 8.
The precision, recall, and f1-score on each emotion recognized by using CLDNN model with data augmentation of the RAVDESS database.
| Label | Precision | Recall | F1-Score |
|---|---|---|---|
| Angry | 93.54% | 93.85% | 93.69% |
| Calm | 93.53% | 95.99% | 94.74% |
| Disgust | 95.02% | 88.86% | 91.84% |
| Fear | 88.91% | 91.56% | 90.22% |
| Happy | 90.52% | 90.96% | 90.74% |
| Neutral | 92.84% | 91.07% | 91.95% |
| Sad | 88.35% | 91.52% | 89.91% |
| Surprised | 97.42% | 88.18% | 92.57% |
| Average | 92.52% | 91.50% | 91.96% |
Table 9.
The precision, recall, and F1-score on each emotion recognized by using CLDNN model with data augmentation of the Emo-DB database.
Table 9.
The precision, recall, and F1-score on each emotion recognized by using CLDNN model with data augmentation of the Emo-DB database.
| Label | Precision | Recall | F1-Score |
|---|---|---|---|
| Angry | 98.04% | 92.59% | 95.24% |
| Boredom | 95.53% | 95.86% | 95.70% |
| Disgust | 95.10% | 92.38% | 93.72% |
| Fear | 94.65% | 100% | 97.25% |
| Happy | 90.44% | 98.15% | 94.14% |
| Neutral | 95.71% | 95.71% | 95.71% |
| Sad | 100% | 99.60% | 99.80% |
| Average | 95.64% | 96.33% | 95.94% |
Table 10.
The precision, recall, and f1-score on each emotion recognized by using CLDNN model with data augmentation of the Emo-DB database.
Table 10.
The precision, recall, and f1-score on each emotion recognized by using CLDNN model with data augmentation of the Emo-DB database.
| Label | Precision | Recall | F1-Score |
|---|---|---|---|
| Angry | 95.92% | 96.92% | 96.42% |
| Happy | 96.18% | 95.53% | 95.86% |
| Neutral | 96.38% | 96.02% | 96.20% |
| Sad | 96.26% | 96.63% | 96.60% |
| Average | 96.19% | 96.28% | 96.27% |
Table 11.
Comparison of the results of cross-validation for the proposed CLDNN model with other related researches on the RAVDESS database.
Table 11.
Comparison of the results of cross-validation for the proposed CLDNN model with other related researches on the RAVDESS database.
| Methods | Cross-Validation | Accuracy |
|---|---|---|
| M. Sajjad et al. [2] | 5-fold | 77.02% |
| S. Kwon [3] | 5-fold | 79.50% |
| A. Bhavan et al. [4] | 10-fold | 75.69% |
| S. Kakuba et al. [5] | 10-fold | 85.89% |
| Proposed model | 10-fold | 95.52% |
Table 12.
Comparison of the results of cross-validation for the proposed CLDNN model with other related researches on the EMO-DB database.
Table 12.
Comparison of the results of cross-validation for the proposed CLDNN model with other related researches on the EMO-DB database.
| Methods | Cross-Validation | Accuracy |
|---|---|---|
| M. Sajjad et al. [2] | 5-fold | 85.57% |
| A. Bhavan et al. [4] | 10-fold | 92.45% |
| S. Kakuba et al. [5] | 10-fold | 95.93% |
| J. Zhao et al. [7] | 5-fold | 95.89% |
| Proposed model | 10-fold | 95.84% |
Table 13.
Comparison of the results of cross-validation for the proposed CLDNN model with other related researches on the IEMOCAP database.
Disclaimer/Publisher’s Note: The statements, opinions and data contained in all publications are solely those of the individual author(s) and contributor(s) and not of MDPI and/or the editor(s). MDPI and/or the editor(s) disclaim responsibility for any injury to people or property resulting from any ideas, methods, instructions or products referred to in the content. |
© 2023 by the authors. Licensee MDPI, Basel, Switzerland. This article is an open access article distributed under the terms and conditions of the Creative Commons Attribution (CC BY) license (http://creativecommons.org/licenses/by/4.0/).
Copyright: This open access article is published under a Creative Commons CC BY 4.0 license, which permit the free download, distribution, and reuse, provided that the author and preprint are cited in any reuse.


