
Submitted:
04 May 2023
Posted:
04 May 2023
You are already at the latest version
Abstract
Accurate evaluation of health status of lithium-ion batteries must be deemed as of great significance, insofar as utility and safety of batteries are of concern. Lithium plating, in particular, is notoriously known to be a chemical reaction that can cause deterioration in, or even fatal hazards to, the health of lithium-ion batteries. Electrochemical impedance spectroscopy (EIS), which has distinct advantages such as fast or non-destructive over its competitors, suffices in detecting lithium plating and thus has been attracting increasing attention in the field of battery management, but its ability of assessing quantitatively the degree of lithium plating remains largely unexplored hitherto. On this point, this work seeks to narrow that gap, by proposing an EIS-based method that can quantify the degree of lithium plating. The core conception is to eventually circumvent the reliance on state-of-health measurement, and use instead the impedance spectrum, to acquire an estimate on battery capacity loss. To do so, the effects of solid electrolyte interphase formation and lithium plating on battery capacity must be first decoupled, so that the mass of lithium plating can be quantified. Then, based on an impedance spectrum measurement, the parameters of the fractional equivalent circuit model (ECM) of the battery can be identified. These fractional ECM parameters are received as inputs by an artificial neural network, which is tasked to establish a correspondence between the model parameters and the mass of lithium plating. The empirical part of the work revolves around the data collected from an aging experiment, and the validity of the proposed method is truthfully attested by dismantling the batteries, which is otherwise not needed during the actual uptake of the method.
Keywords:
Artificial neural network
; Lithium plating quantification
; Equivalent circuit model
; Parameter identification
; Feature parameters extraction
1. Introduction
As lithium-ion batteries are becoming an increasingly popular choice for electric vehicles, power grid energy storage among other application areas, higher requirements have been placed on the detection technology of battery state. Battery aging, regardless of its cause, lowers the reliability of the battery and may eventually lead to disastrous failures. For instance, under suboptimal charging conditions, such as low temperature, high current rate, or overcharging, lithium ions can deposit on the surface of the graphite anode in the form of metallic lithium—this phenomenon is known as “lithium plating” [1]. Lithium dendrites resulting from lithium plating have the potential to penetrate the separator, which can in turn short circuit the battery and thus initiating a thermal runaway [2]. Even in the absence of lithium dendrite formation, lithium plating can cause deterioration in battery capacity [3]. Therefore, detecting and quantifying the degree of lithium plating ought to be regarded as one of the key areas of focus in research and practices pertaining to lithium-ion battery management.
Due to the aforementioned importance, numerous methods for lithium plating detection have been proposed, and surveys on that are also available [4]. These methods, based on their underlying working mechanisms and scientific principles, can be classified at least into four kinds, each with its benefits and disadvantages: (1) direct observation methods [5,6,7,8], (2) reference electrode methods [9,10], (3) voltage curve methods [11,12], and (4) electrochemical impedance spectroscopy methods [13,14,15]. These four classes of methods are to be briefly reviewed in what follows.
Direct observation methods, as the name suggests, directly analyze the internal structure and element distribution of batteries with lithium deposits, by optical and chemical means [16,17]. This class of methods has played a significant role in studying the relationship between lithium plating phenomenon and batteries operating conditions [6]. For example, electron microscopy is used to observe the morphology of the electrodes of aged batteries. And the chemical titration method has been utilized for quantitative analysis of lithium plating inside batteries by disassembling the batteries. Notwithstanding, the practicality of this method is hindered by several challenges. First and foremost, such methods typically require expensive observation equipment and tedious titration experiments that last over long periods of time, which suggest that the methods are often associated with high monetary and time costs. Aside from cost issues, many technical procedures of this class of methods necessitate the disassembly of the battery, thereby compromising its continued use, and thus disqualifying the methods as being suitable for operational purposes. These drawbacks no doubt place great emphasis on the need for developing more efficient and cost-effective techniques for studying lithium plating [18].
The reference electrode methods are techniques used to study the electrochemical behavior of battery electrodes by setting up a three-electrode system. Through introducing a reference electrode, the potential and impedance of the battery positive electrode and negative electrode can be measured separately. This makes it easier to investigate lithium plating, which primarily occurs at the negative electrode of batteries. Technique-wise, some studies have shown that when using lithium alloy as the reference electrode, the phenomenon of lithium plating occurs when the potential of the negative electrode relative to the reference electrode drops below 0 V, and the degree of lithium plating is significantly correlated with the impedance between them [19]. Be that as it may, owing to the fact that few commercial batteries would actually opt for a three-electrode structure, the application of this class of methods has been limited to laboratories hitherto. Additionally, the accuracies of these methods vary substantially across different materials and structures of the reference electrode, which implies that the universality and transferability of these methods cannot be guaranteed at any rate, inasmuch as a unified procedure for analyzing lithium plating for diverse types of batteries is to be eventually achieved.
Compared to the formerly mentioned two classes of methods, detecting lithium plating based on voltage curve attracts more pragmatism. These methods involve analyzing the voltage curve of batteries during discharging at constant current rate or after being fully charged, so as to determine the degree of lithium plating. Most of the current research focuses on examining the plateau (i.e., a flat segment) of the curve, which is believed to be caused by the mixed potential interactions between lithium metal deposition and dissolution. It has been advised that the length of the voltage plateau can be used to estimate the degree of lithium plating inside batteries. These methods have been applied when studying the effect of temperature on lithium plating and have demonstrated their effectiveness [12,19]. There are also researchers who study lithium plating based on the differentials of voltage with respect to capacity, or for short, and the discharge capacity at the peak of has been shown to be correlated with the mass of lithium plating [20]. The voltage-curve-based methods have certain practical value as they neither require the battery to be dismantled nor impose the necessity of having a third electrode. However, obtaining a voltage curve, which requires fully charging-discharging tests, takes a significant amount of time. And for batteries have an obvious discharge platform, like lithium-iron phosphate batteries, this method is not entirely suitable.
Electrochemical impedance spectroscopy (EIS) is able to reflect the impedance characteristics of the battery under various frequencies of current (voltage) excitation, and can characterize internal processes such as material diffusion or charge transfer. Due to its dual advantages of containing rich information and having a non-destructive nature, EIS has been gradually accepted as a competitive option for lithium plating detection. Some studies have found that there are strong relationships between impedance spectrum and lithium plating inside batteries. In particular, impedance at certain special frequencies is highly sensitive to the lithium deposition state, which has led to many research efforts focused on this characteristic. Some studies have also employed equivalent circuit models (ECMs) to fit the impedance spectrum and analyze the relationship between circuit components (e.g., the ohmic resistance) and lithium plating [13,14,15]. Compared to other methods, the impedance-based method has significant advantages in terms of time and cost. Nevertheless, the present literatures on EIS-based detection have yet to report in a dedicated fashion its ability of quantifying the degree of lithium plating.
Based upon the discussion thus far, an EIS-based lithium plating detection method, which is able to quantify the degree of lithium plating and therefore narrow the aforementioned research gap, is proposed. More specifically, the technical part of the work has three constituents. First, the contributions of lithium plating and solid electrolyte interface (SEI) formation on battery capacity degradation are decoupled. This is essential for establishing a quantitative relationship between capacity degradation and lithium plating. Second, considering the infeasibility of measuring capacity of online battery and long time cost, impedance spectrum is measured instead. Then, the battery is modeled using an ECM, in that, each set of ECM parameter corresponds to an impedance spectrum representing a particular capacity, which is corresponding to the degree of lithium plating. Third, an artificial neural network (ANN) is utilized as an regression tool to establish the relationship between the extracted features from ECM and the mass of lithium plating. In that, if a new set of features, extracted from the impedance spectrum of some new battery of concern, arrives, one may estimate quantitatively the degree of lithium plating of that battery. The main contribution of the study is thought two-fold:
- By decoupling the contribution of SEI formation and lithium plating on capacity loss and establishing the relationship between capacity loss and mass of lithium plating, EIS measurement is corresponded to the mass of lithium plating.
- The validity of the proposed method is partially verified through scanning electron microscope (SEM) and energy dispersive spectroscopy (EDS) analysis.
The rest of this work is organized as follows. Section 2 proceeds with elaborating an aging experiment, as to acquire necessary data required by modeling and analysis. Section 3 is devoted to methodology, in that, it is divided into three subsections, each dealing with one aspect of the lithium-plating-quantification procedure, namely, the decoupling of impacts of SEI formation and lithium plating on capacity loss in Section 3.1, the ECM and feature extraction in Section 3.2, and ANN model building in Section 3.3. The verification of the proposed model is conducted in Section 4. Finally, Section 5 concludes this work.
2. Aging experiment and data collection
It is well known that the degree of lithium plating is correlated to aging of the battery, which further affects the state of health (SoH), or the amount of capacity loss to be more precise, of the battery. In that, should one wish to establish a relationship between the degree of lithium plating and capacity loss, multiple impedance spectra must be acquired over the course of aging, as such when an arbitrary impedance spectrum becomes available, the capacity loss and thus the degree of lithium plating, which is often gauged with the mass of lithium plating, can be estimated. In this section, the technical and procedural details of aging experiment are elaborated, as to facilitate understanding of the subsequent quantification methodology.
The aging experiment is conducted using Sanyo’s cylindrical lithium cobalt oxide UR14500P batteries. The technical specifications of this model of batteries are listed in Table 1. A total of five batteries of this kind are involved in this work, among which two are dedicated to model building, whereas the remaining three are set aside for validation purposes. In what follows, the two batteries used for model building are referred to as B1 and B2, and the three batteries used for validation are named B3, B4, and B5. It should be noted that the aging experiments for B1 and B2 are identical, but differ from those for B3, B4, and B5.
2.1. Experimental procedure for B1 and B2
After purchasing the batteries, B1 and B2 are charged to full, i.e., 100% state of charge (SoC), under the constant-current-constant-voltage protocol at a current rate of 0.5C. The impedance spectrum is then measured, which is considered to be labeled as 100% state of health (SoH) and no lithium plating. With the two batteries, cyclic aging is conducted in two stages, differing by the charging cut-off voltage: 4.2 V for Stage I and 4.4 V for Stage II; both stages are carried out at current rate of 1C. The aging experiment for each of B1 and B2 is conducted over a total of 92 cycles, of which 48 belongs to Stage I and 44 belongs to Stage II. The capacity of the battery is measured after every four cycles, which implies that there are 12 and 11 measurements for Stages I and II, respectively. Impedance spectra are measured every four cycles over Stage II, but not Stage I, because, as explained below, lithium plating only takes place over Stage II. It should be highlighted that, during the course of the entire experiment, batteries are left to rest at 25 °C for 4 h before impedance spectrum measurement and all impedance spectrum are measured under the condition of 100% SoC to eliminate the its influence on measure results. In summary, the decrement of SoH (as reflected through battery capacity) with aging is shown in Figure 1. The abscissa of the plot corresponds to the measurements of SoH.
Figure 2 illustrates the changes in impedance spectrum with aging. Since the variation trends of impedance spectrum of B1 and B2 are very similar, only the impedance spectrum of B1 are shown here for the convenience of drawing. The 11 impedance spectrum measurements for B1 acquired over Stage II are labeled as B1-0, B1-2, …, B1-11, as shown in the figure. To aid visualization of how the trend of impedance spectrum changes with aging degree, the impedance spectrum at different aging stages is translated horizontally so that the intersections of the Nyquist plots with the real axis are adjusted at 70 mΩ. The figure shows that the impedance spectrum tomography of the battery exhibits a generally monotonic expansion pattern, which evidences its strong relationship with the degree of battery aging [21].
2.2. Experimental procedure for B3, B4, and B5
As mentioned earlier, three batteries of the same batch and model produced by the same manufacturer with B1 and B2 are used to verify the lithium plating quantification method proposed. More specifically, B3, B4 and B5 are set to represent batteries with no lithium plating, moderate plating, and heavy plating. In order to attain the most accurate verification results, all three batteries are dismantled after the experiment.
The experimental step for batters B3, B4, and B5 are as follows:
- The three batteries are firstly put through one discharge–charge cycle at small current rate to eliminate the influence of the initial state. The SoC of each battery is 100% after this step. B3 is taken as reference for subsequent disassembly experiments, without any other special treatment.
- Moderate lithium plating experiment is conducted on B4 by performing an overcharging experiment at current rate of 1C and setting the charging cut-off voltage to 4.4 V. The experiment is conducted for 20 cycles, and after resting, the impedance spectrum of B4 is measured and the corresponding data are recorded.
- Heavy lithium plating experiment is conducted on B5 by performing an overcharging experiment at current rate of 2C and setting the charging cut-off voltage to 4.4 V. The experiment is conducted for 20 cycles, and after resting, the impedance spectrum of B4 is measured and the corresponding data are recorded.
3. Methodology and procedure
3.1. Decoupling of SEI formation and lithium plating
The loss in capacity of lithium-ion batteries can be attributed mainly to two mechanisms, that is, SEI formation and lithium plating. Therefore, to quantitatively account for the effect of any one cause, the two sources of capacity loss must be decoupled. During the first 48 cycles of aging, since the operation condition is mild, the capacity loss is dominated by the SEI formation [22], as represented by the window labeled as Stage I in Figure 1. However, in the subsequent cycles of aging under elevated charging cut-off voltage (i.e., overcharging), whereas the SEI formation remains being a factor causing capacity loss, lithium plating formation becomes a factor that further escalates the capacity loss of batteries, as marked by the window labeled as Stage II in Figure 1.
It should be noted that the underlying mechanism of SEI formation is one of chemistry, as such, its reaction rate may be elucidated by the well-known Arrhenius formula, which relates chemical reaction rate with temperature. More specifically, the Arrhenius formula can describe the reaction rate in SEI generation, that is:
where T is the absolute temperature, with a unit of K; k corresponds to the rate of chemical reaction at temperature T; R is the molar gas constant, J/(mol·k); is the experimental activation energy, generally regarded as a constant independent of temperature; and C is a constant. As can be seen from Equation (1), the reaction rate of SEI formation k, with all else being constant, is only a function of temperature. Nonetheless, in the conducted experiments, the temperature is also kept constant at 25 °C, resulting in a constant k. Clearly then, one should observe a quasi-linear downward trend in SoH as the cycle number increases, and a straight line may be fitted to the experimental data, see the dashed red line in Figure 3; since there are two batteries (B1 and B2) involved, their SoH data over Stage I are averaged before fitting. With the acquired linear fit, one can extrapolate it to subsequent cycles in which lithium plating occurs, then, the difference between the actual curve and extrapolated fitted line ought to be attributed to the capacity loss caused by lithium plating, as shown in Figure 3. To this stage, the effects on capacity loss due to SEI formation and lithium plating have been successfully decoupled.
Figure 3.
Decoupling of SEI formation and lithium plating.
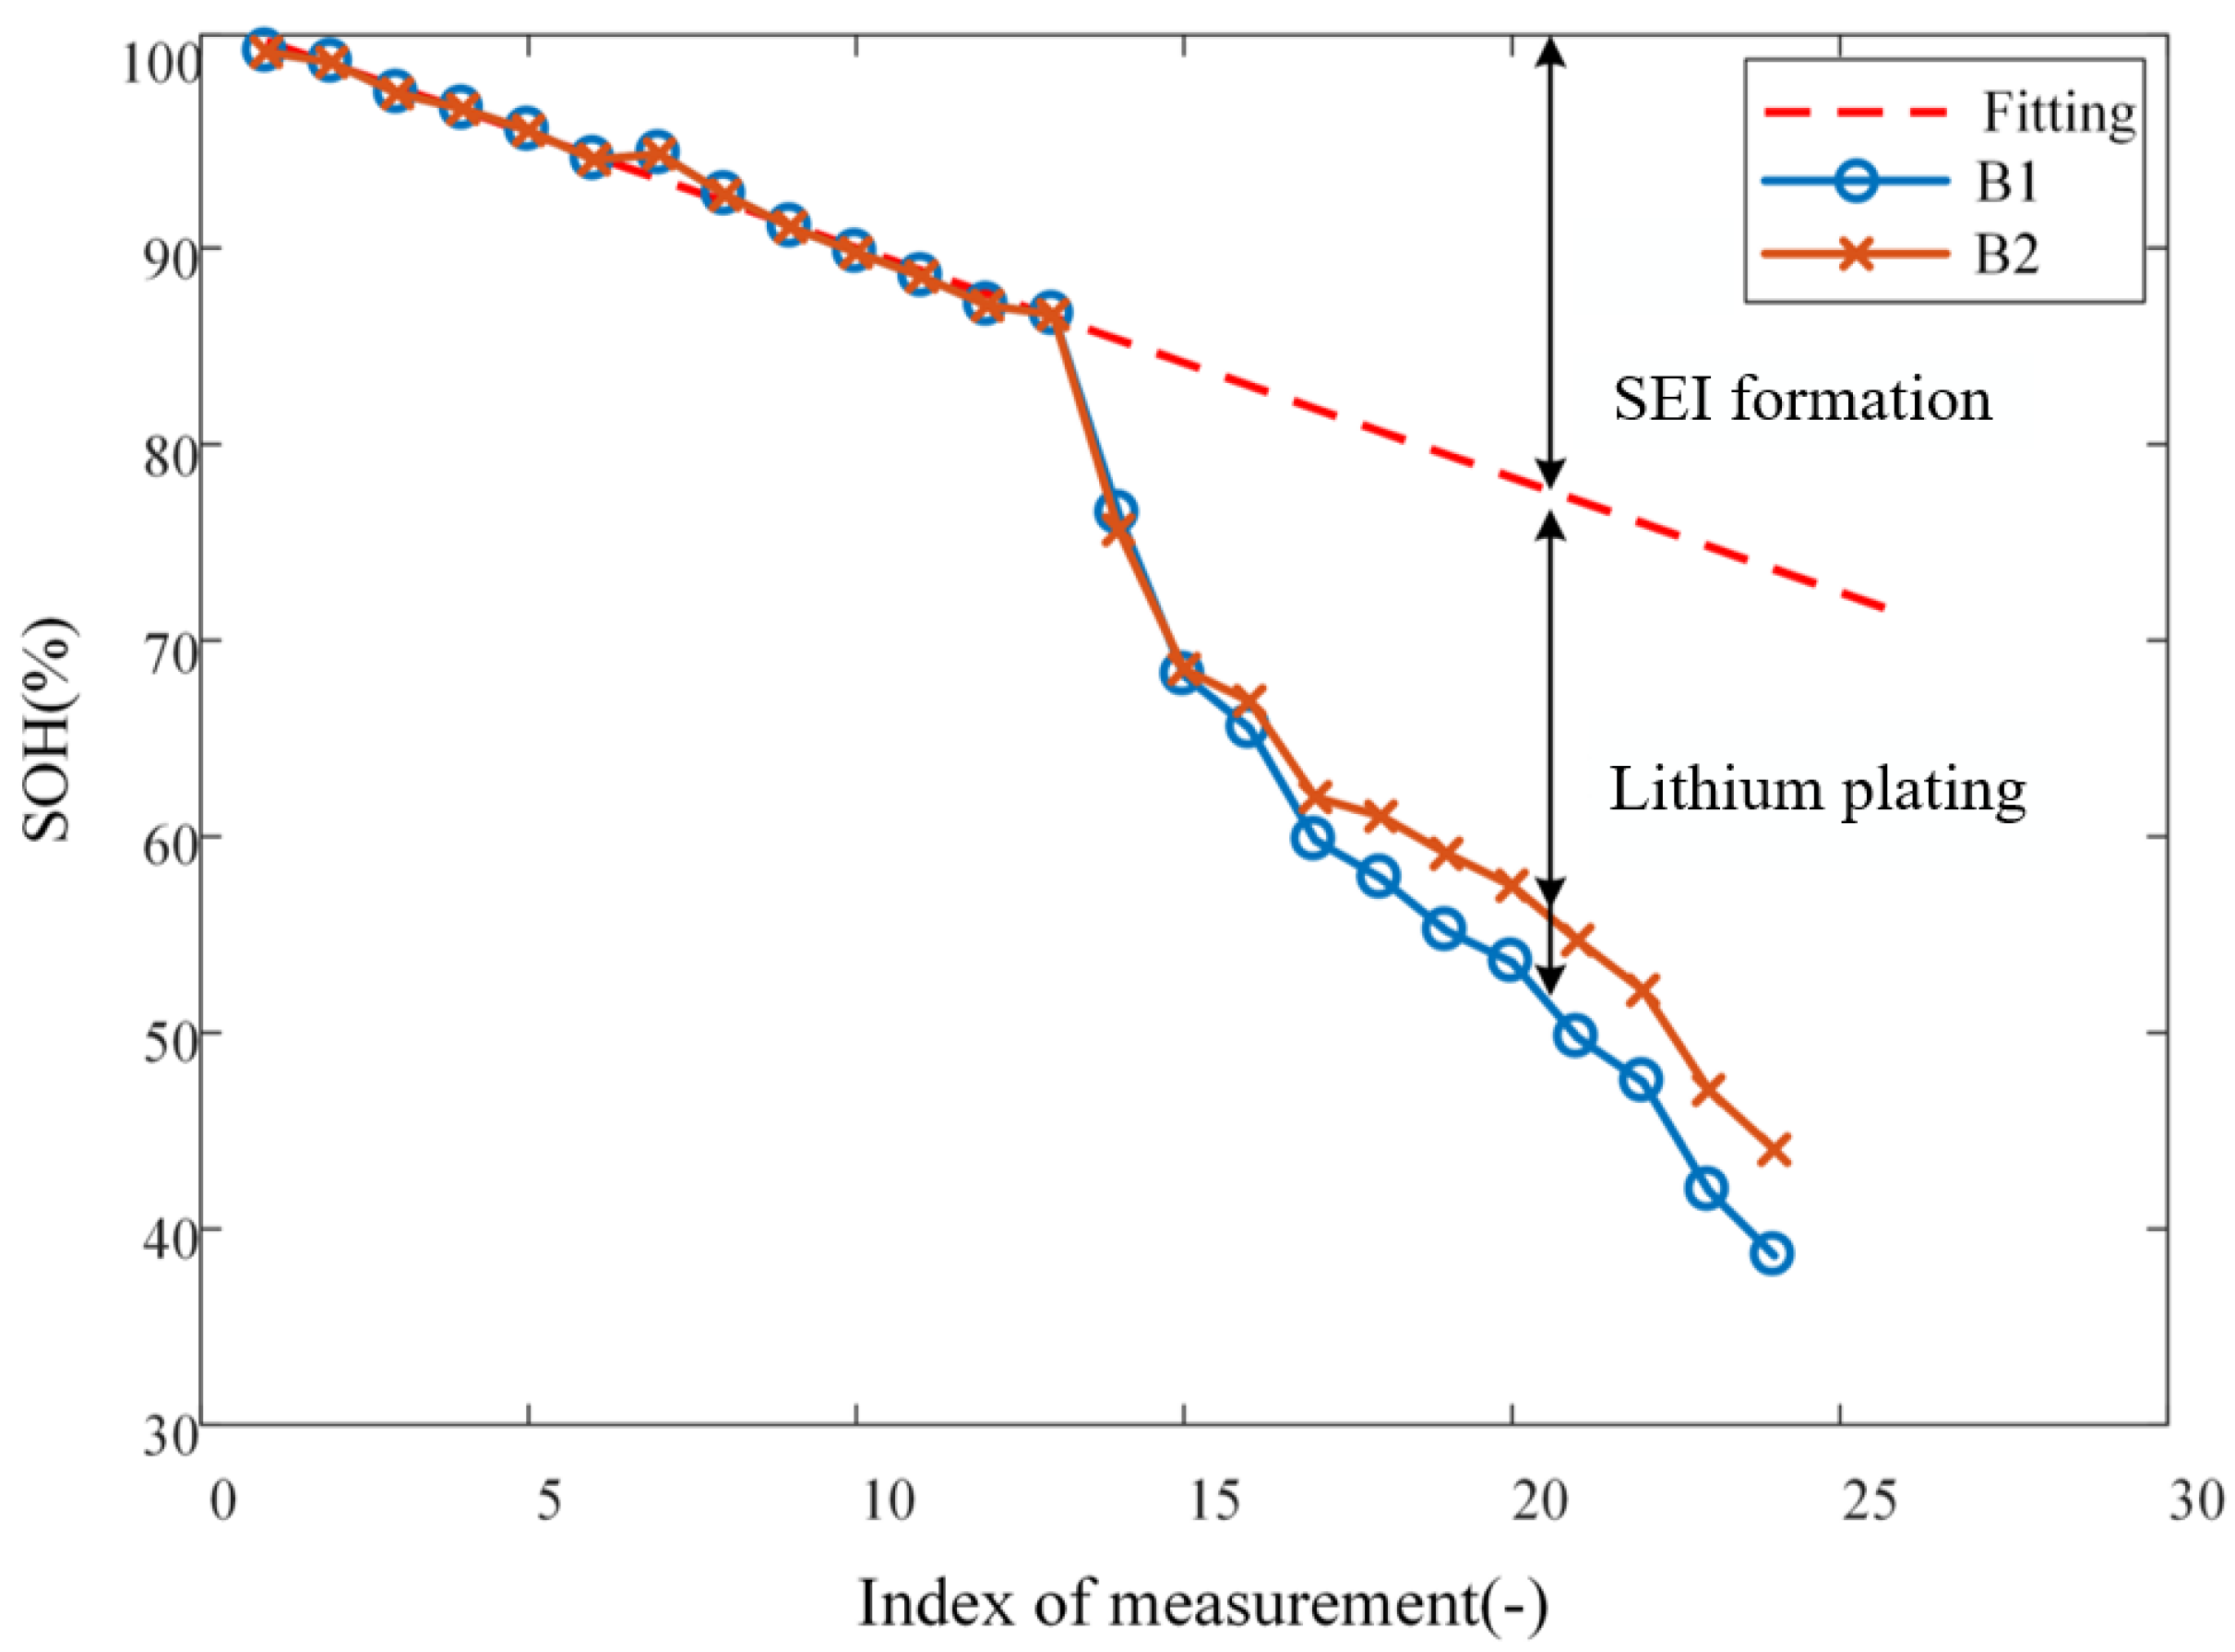
Figure 4.
Mass of lithium plating change curve with aging.
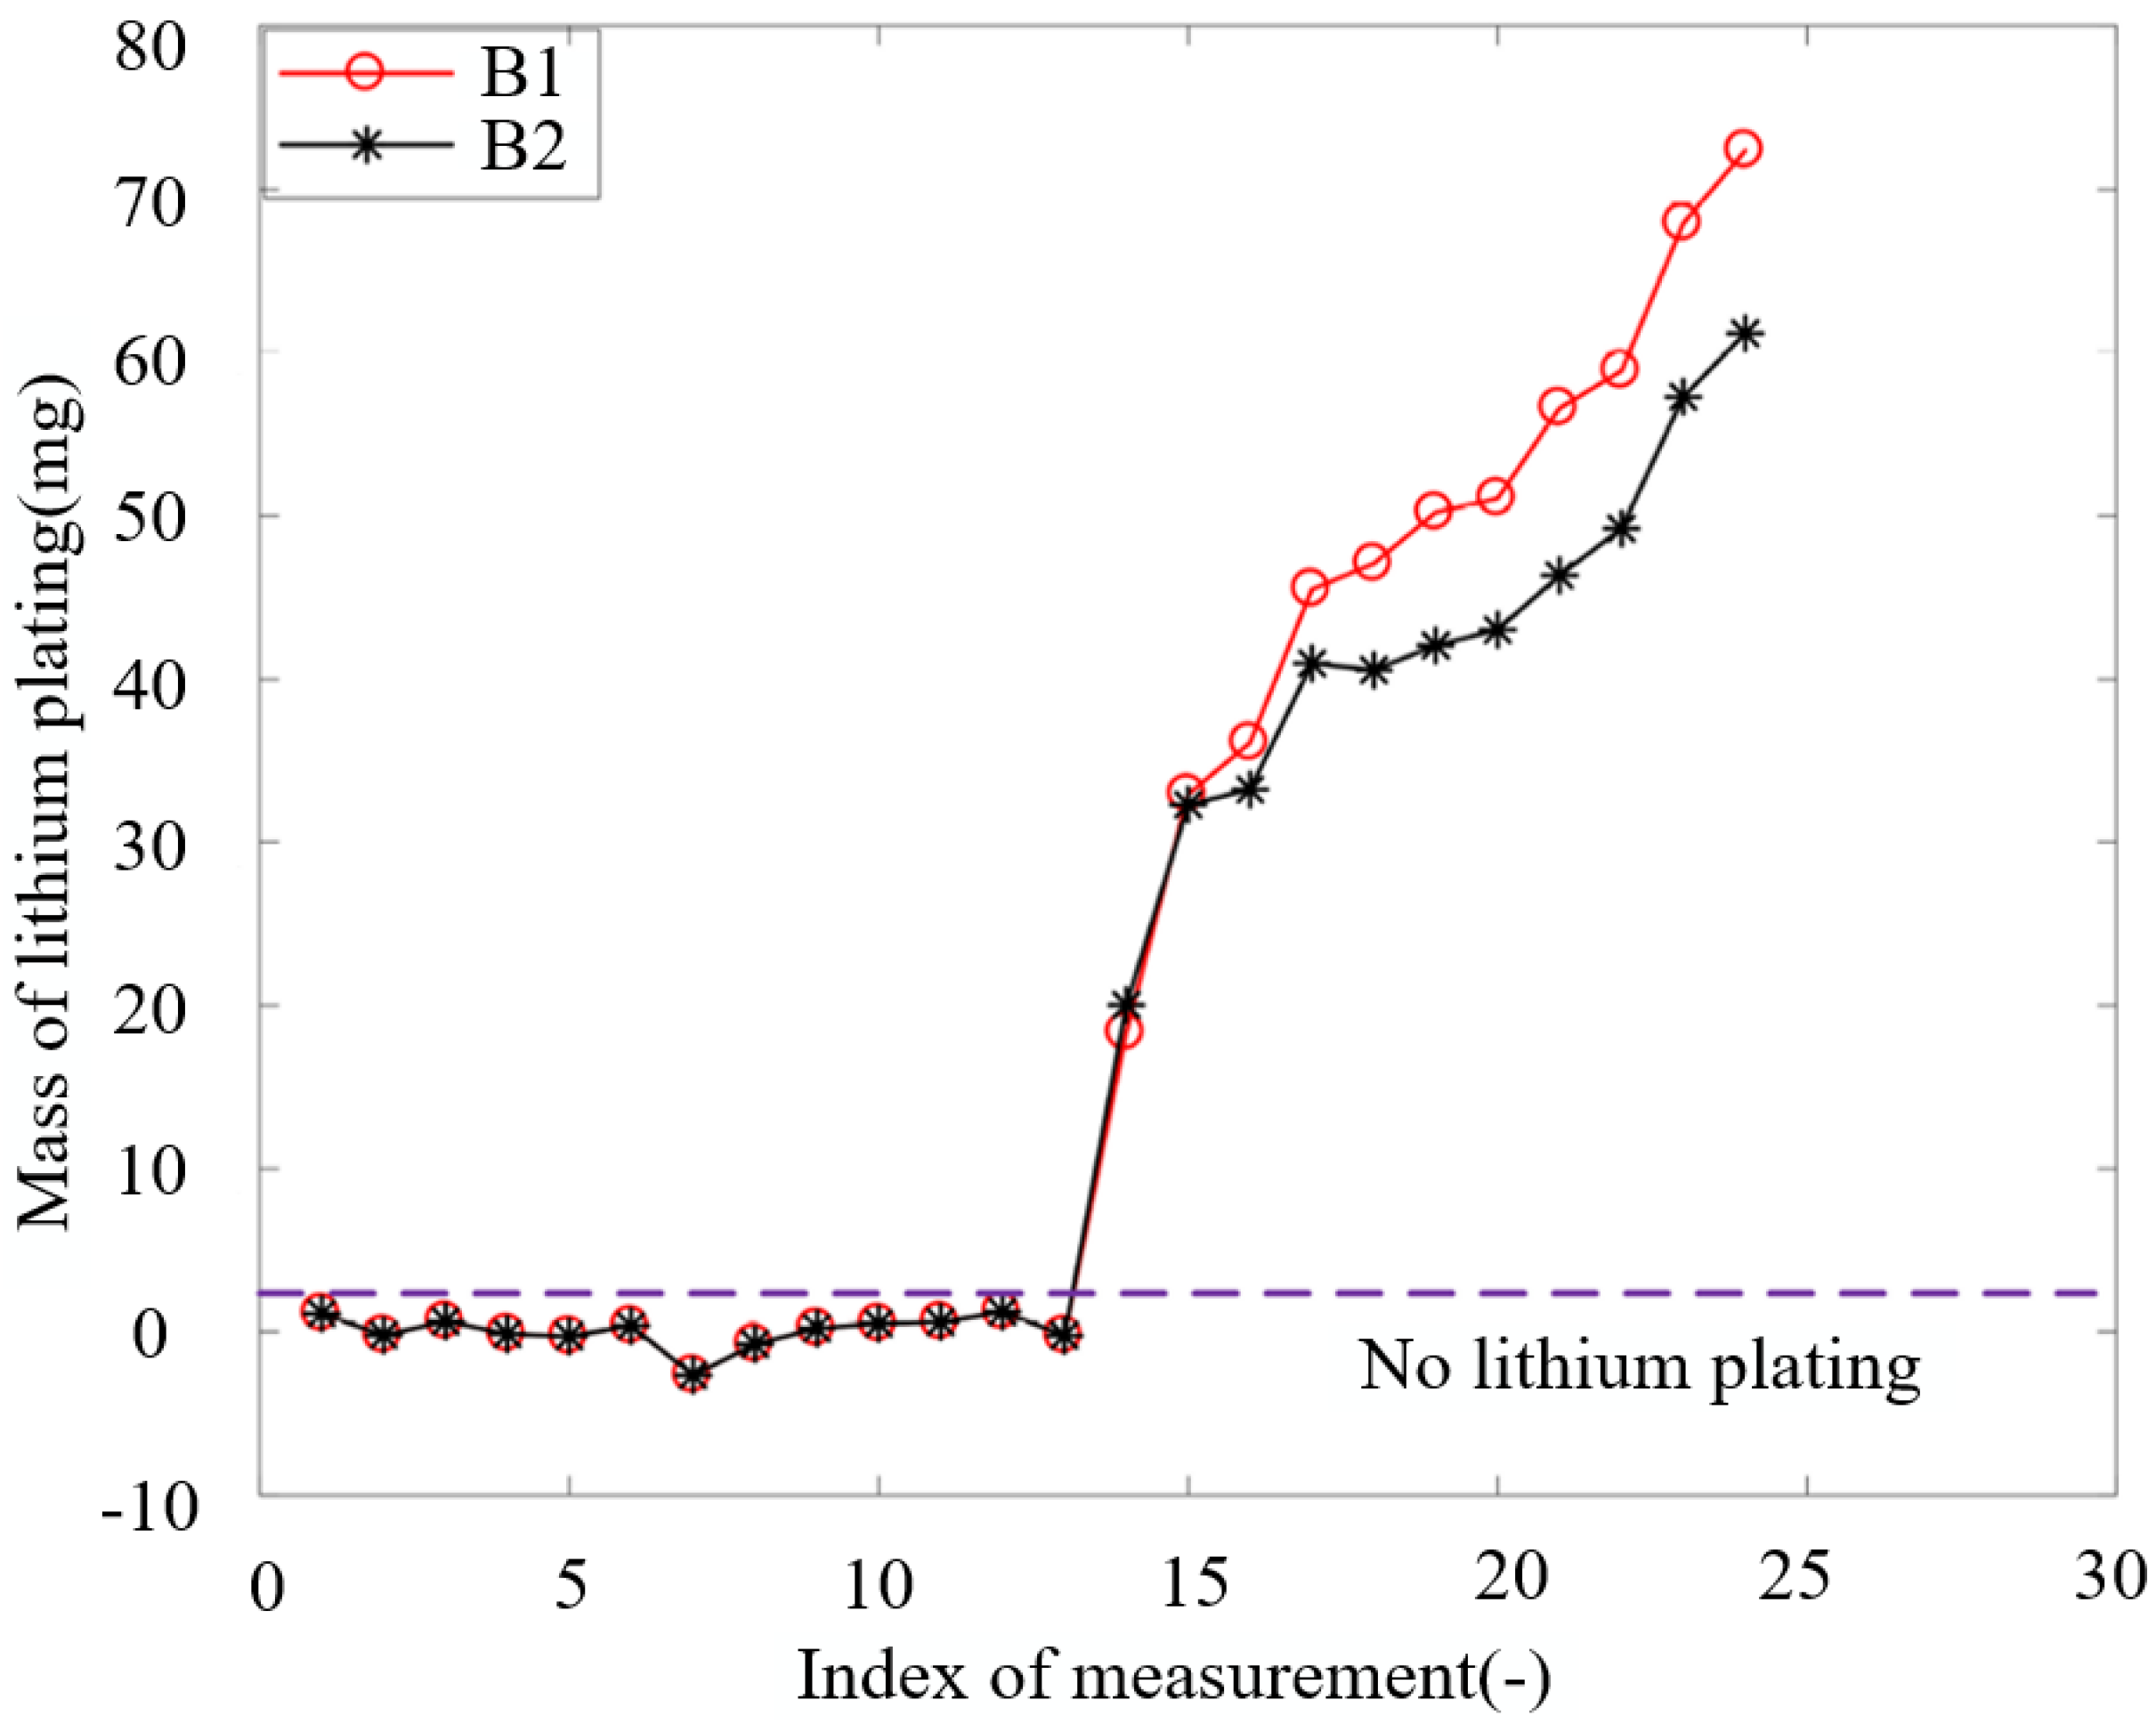
It can be derived that there is a relationship between the mass of lithium plating and the capacity loss caused by lithium plating shown as:
where is the capacity decay caused by plated lithium; is Avogadro constant; e is electron element charge; is molar mass of lithium atom, which is 6.94 g/mol; is the mass of plated lithium. The curves in Figure 4 show the variation of mass of lithium plating with aging for the two batteries.
3.2. Feature extraction based on fractional order equivalent circuit model
In order to analyze lithium plating using impedance spectrum accurately, the battery must be first described using a third-order fractional ECM, which has been studied in the prior work Lyu et al. [23]. The ECM is illustrated in Figure 5 and its associated parameters tabulated in Table 2. The corresponding impedance expression is:
where the impedance Z as a function of frequency is decomposed into four terms: the ohmic internal resistance of the battery, two resistance and constant phase element (R–CPE) parallel links, and the quasi-Warburg impedance, respectively. The allocation of the two R–CPE links is motivated by the need of characterizing the SEI formation of high-frequency segment of the battery and the charge transfer structure of medium-frequency segment of the battery. On the other hand, the quasi-Warburg impedance is devoted to characterizing the diffusion process of the low-frequency segment of the battery. In summary, the ECM is able to effectively represent those impedance- and frequency-related behaviors and characteristics of the battery.
In the process of parameter identification, the values of parameters are determined through the nonlinear least squares method. However, since multiple parameter combinations can correspond to the same impedance spectrum, the identification of initial values is of profound necessity to make sure the precise parameter values are unique for one, which ensures the validity of ANN elaborated in next subsection. In our work, the initial values of the parameters are determined based on the geometric characteristics of the measured impedance spectrum [23]. For instance, The slope of oblique line, which typically appears in the low frequency band of the impedance spectrum is used to identify the parameters of the quasi-Warburg element. Then, the initial values are applied to the nonlinear least squares method to obtain the precise parameter values.
Taking B1 at a certain aging stage as an example, Figure 6 shows the fitting result of the model on the impedance spectrum of the battery at this stage. The average relative error of amplitude between model impedance and actual impedance is 0.04%, and the average relative error of phase angle is 9.82%. Parameters of the ECM are used as inputs to the ANN model described in next section, which provides a mapping between impedance spectrum, a measurable quantity, and the mass of lithium plating.
3.3. ANN training and testing
The ANN model in this work is trained using aging experiment data of B1 and B2, as well as those identified parameters of ECM. As is the case with all regression problems, once the model is trained (or fitted), it can be used to predict the target that corresponds to a new given set of features. In the present case, the new features come from the impedance spectrum measurements of B4 and B5, whereas the targets are unequivocally the masses of lithium plating corresponding to those measurements.
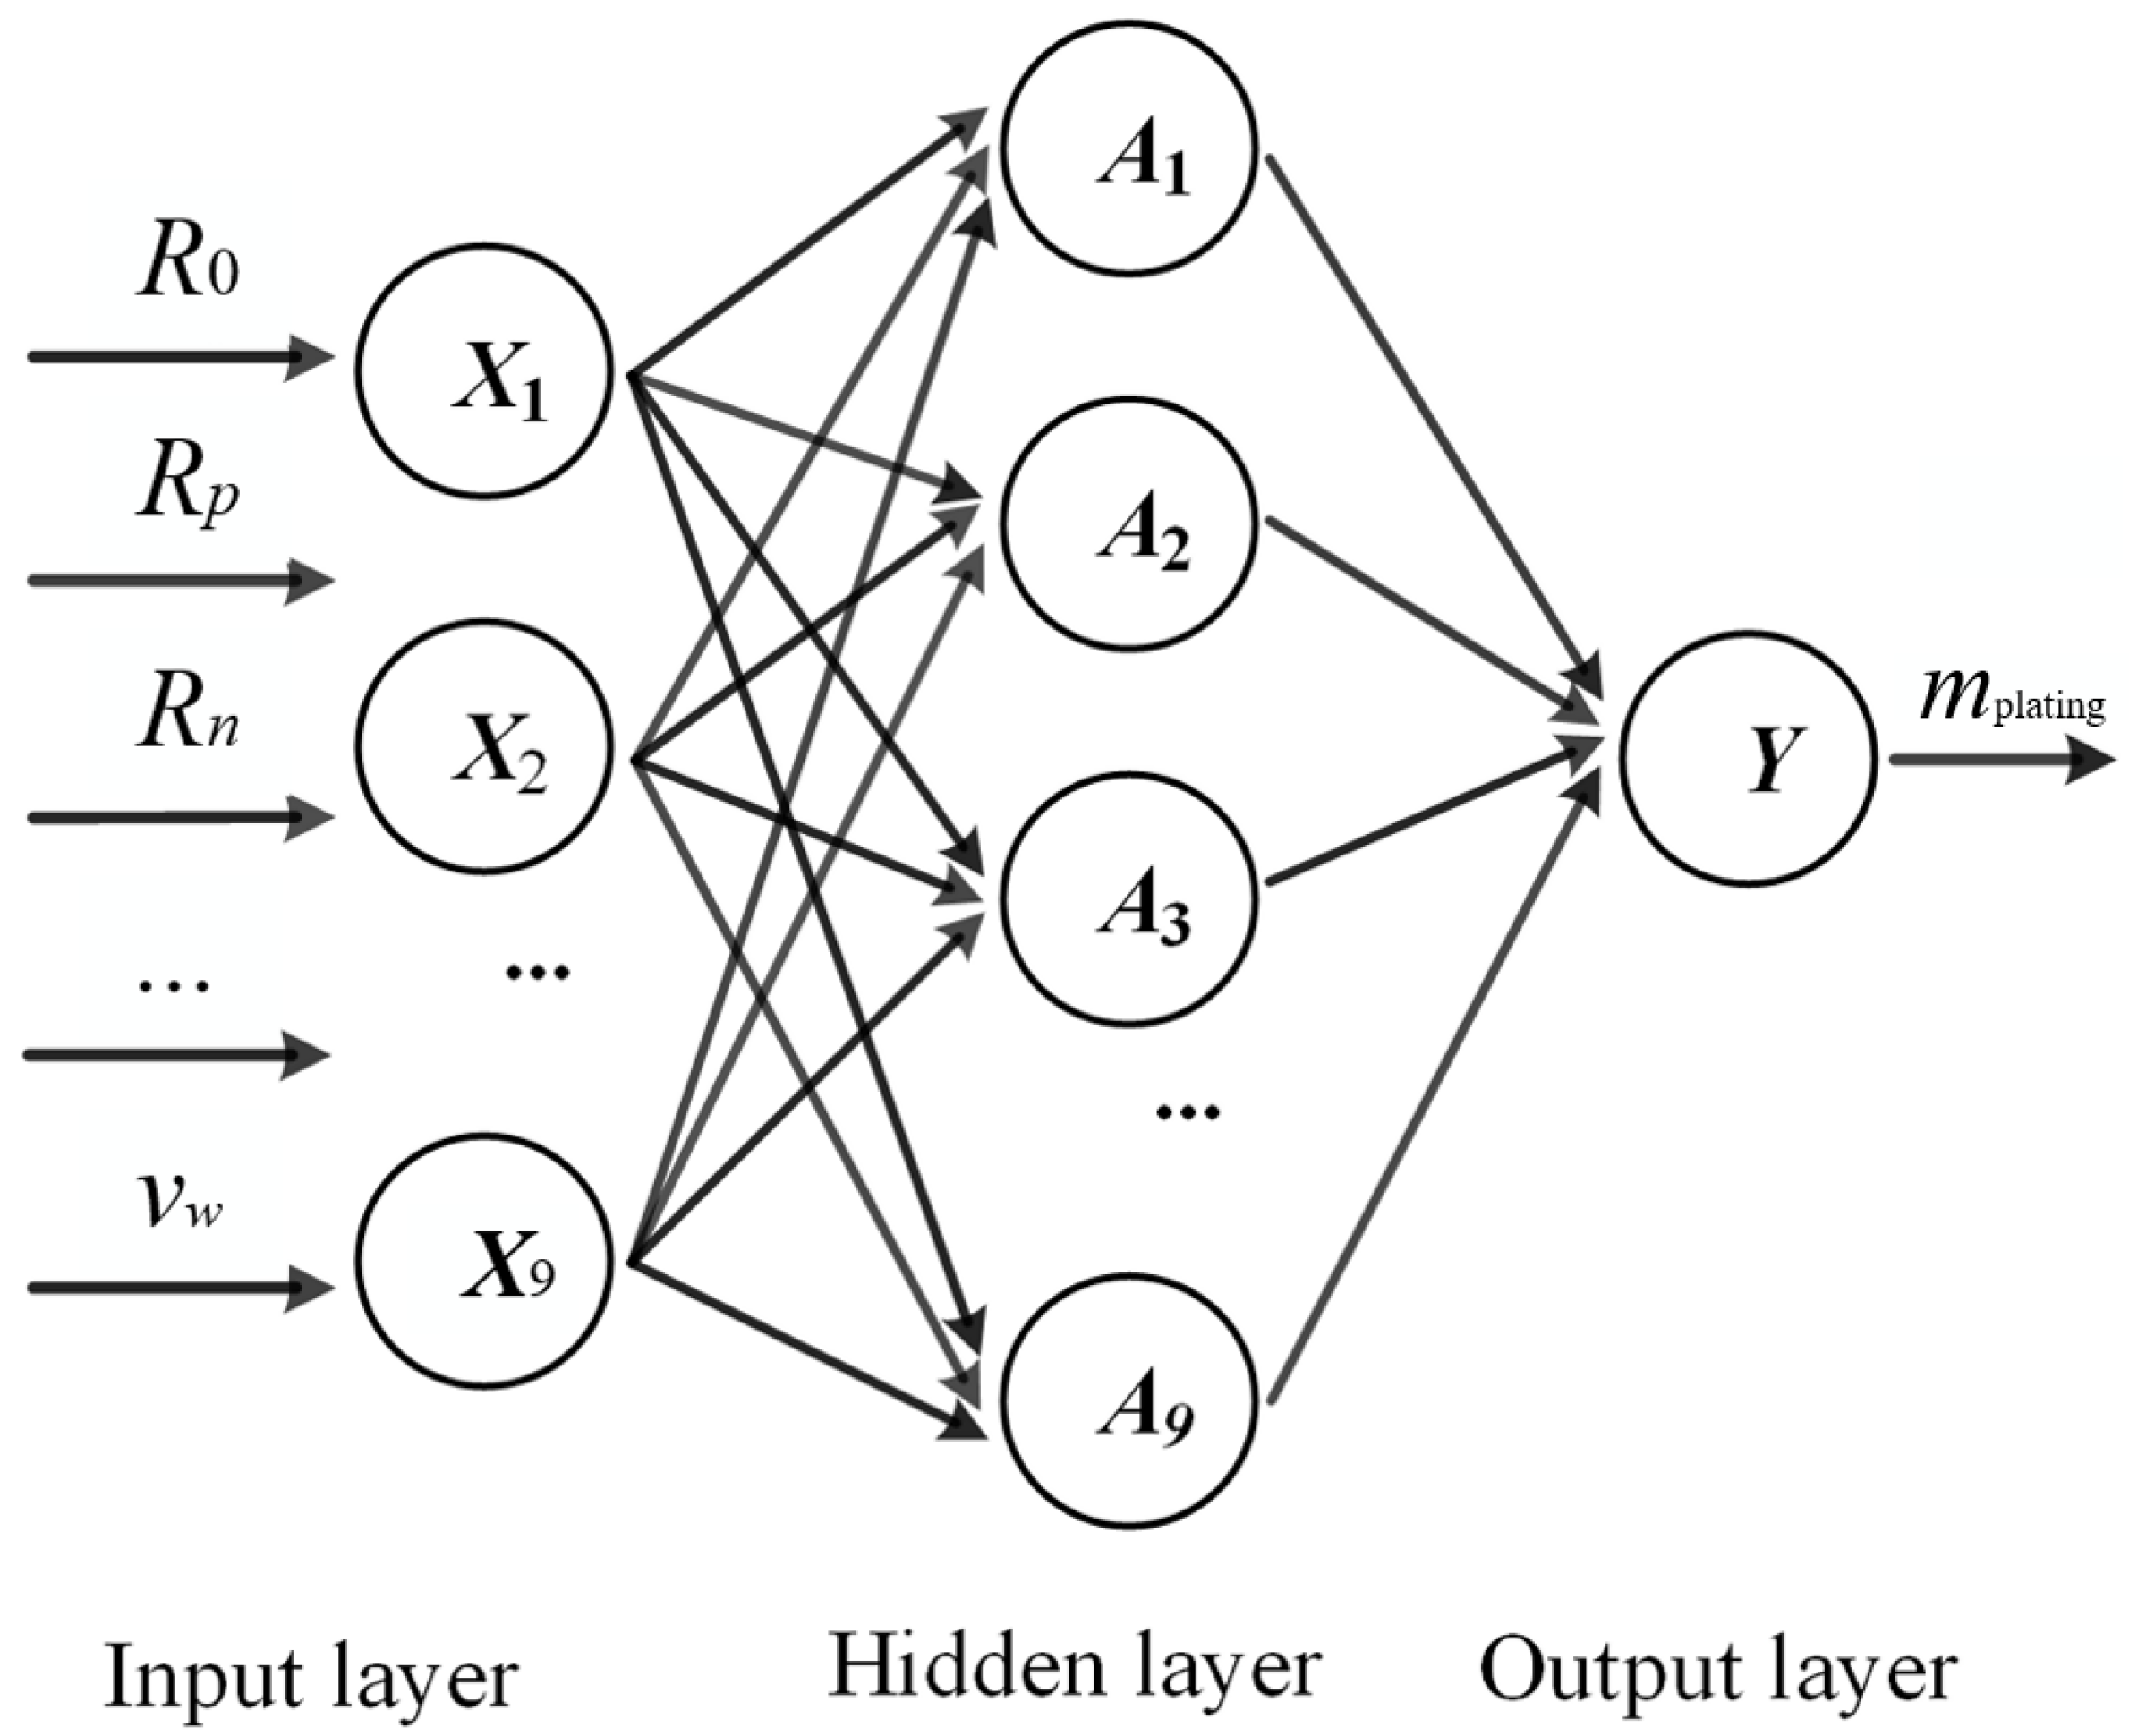
ANN is trained with the back-propagation algorithm, which is one that minimizes the mean square error between the actual output value and the expected output value by using gradient descent. The network takes an elementary form, in that, it consists of an input layer, a hidden layer, and an output layer, as shown in Figure 7, which represents the typical setup of a “shallow” network, as opposed to the more complex deep neural network (given the current data amount, the use of any network with more than one hidden layer is uncalled for). The neurons in adjacent layers are fully connected, and the weights account for the connection strength [24]. The mathematical expression for the output of the hidden layer is well known and can be expressed as:
where is the output of the neuron in the hidden layer; is the transfer function of the hidden layer; d is the number of inputs, which in this paper is the number of characteristic parameters; is the weight of the input to the hidden layer neuron. is the input; and is the offset.
Figure 6.
Model fitting result.
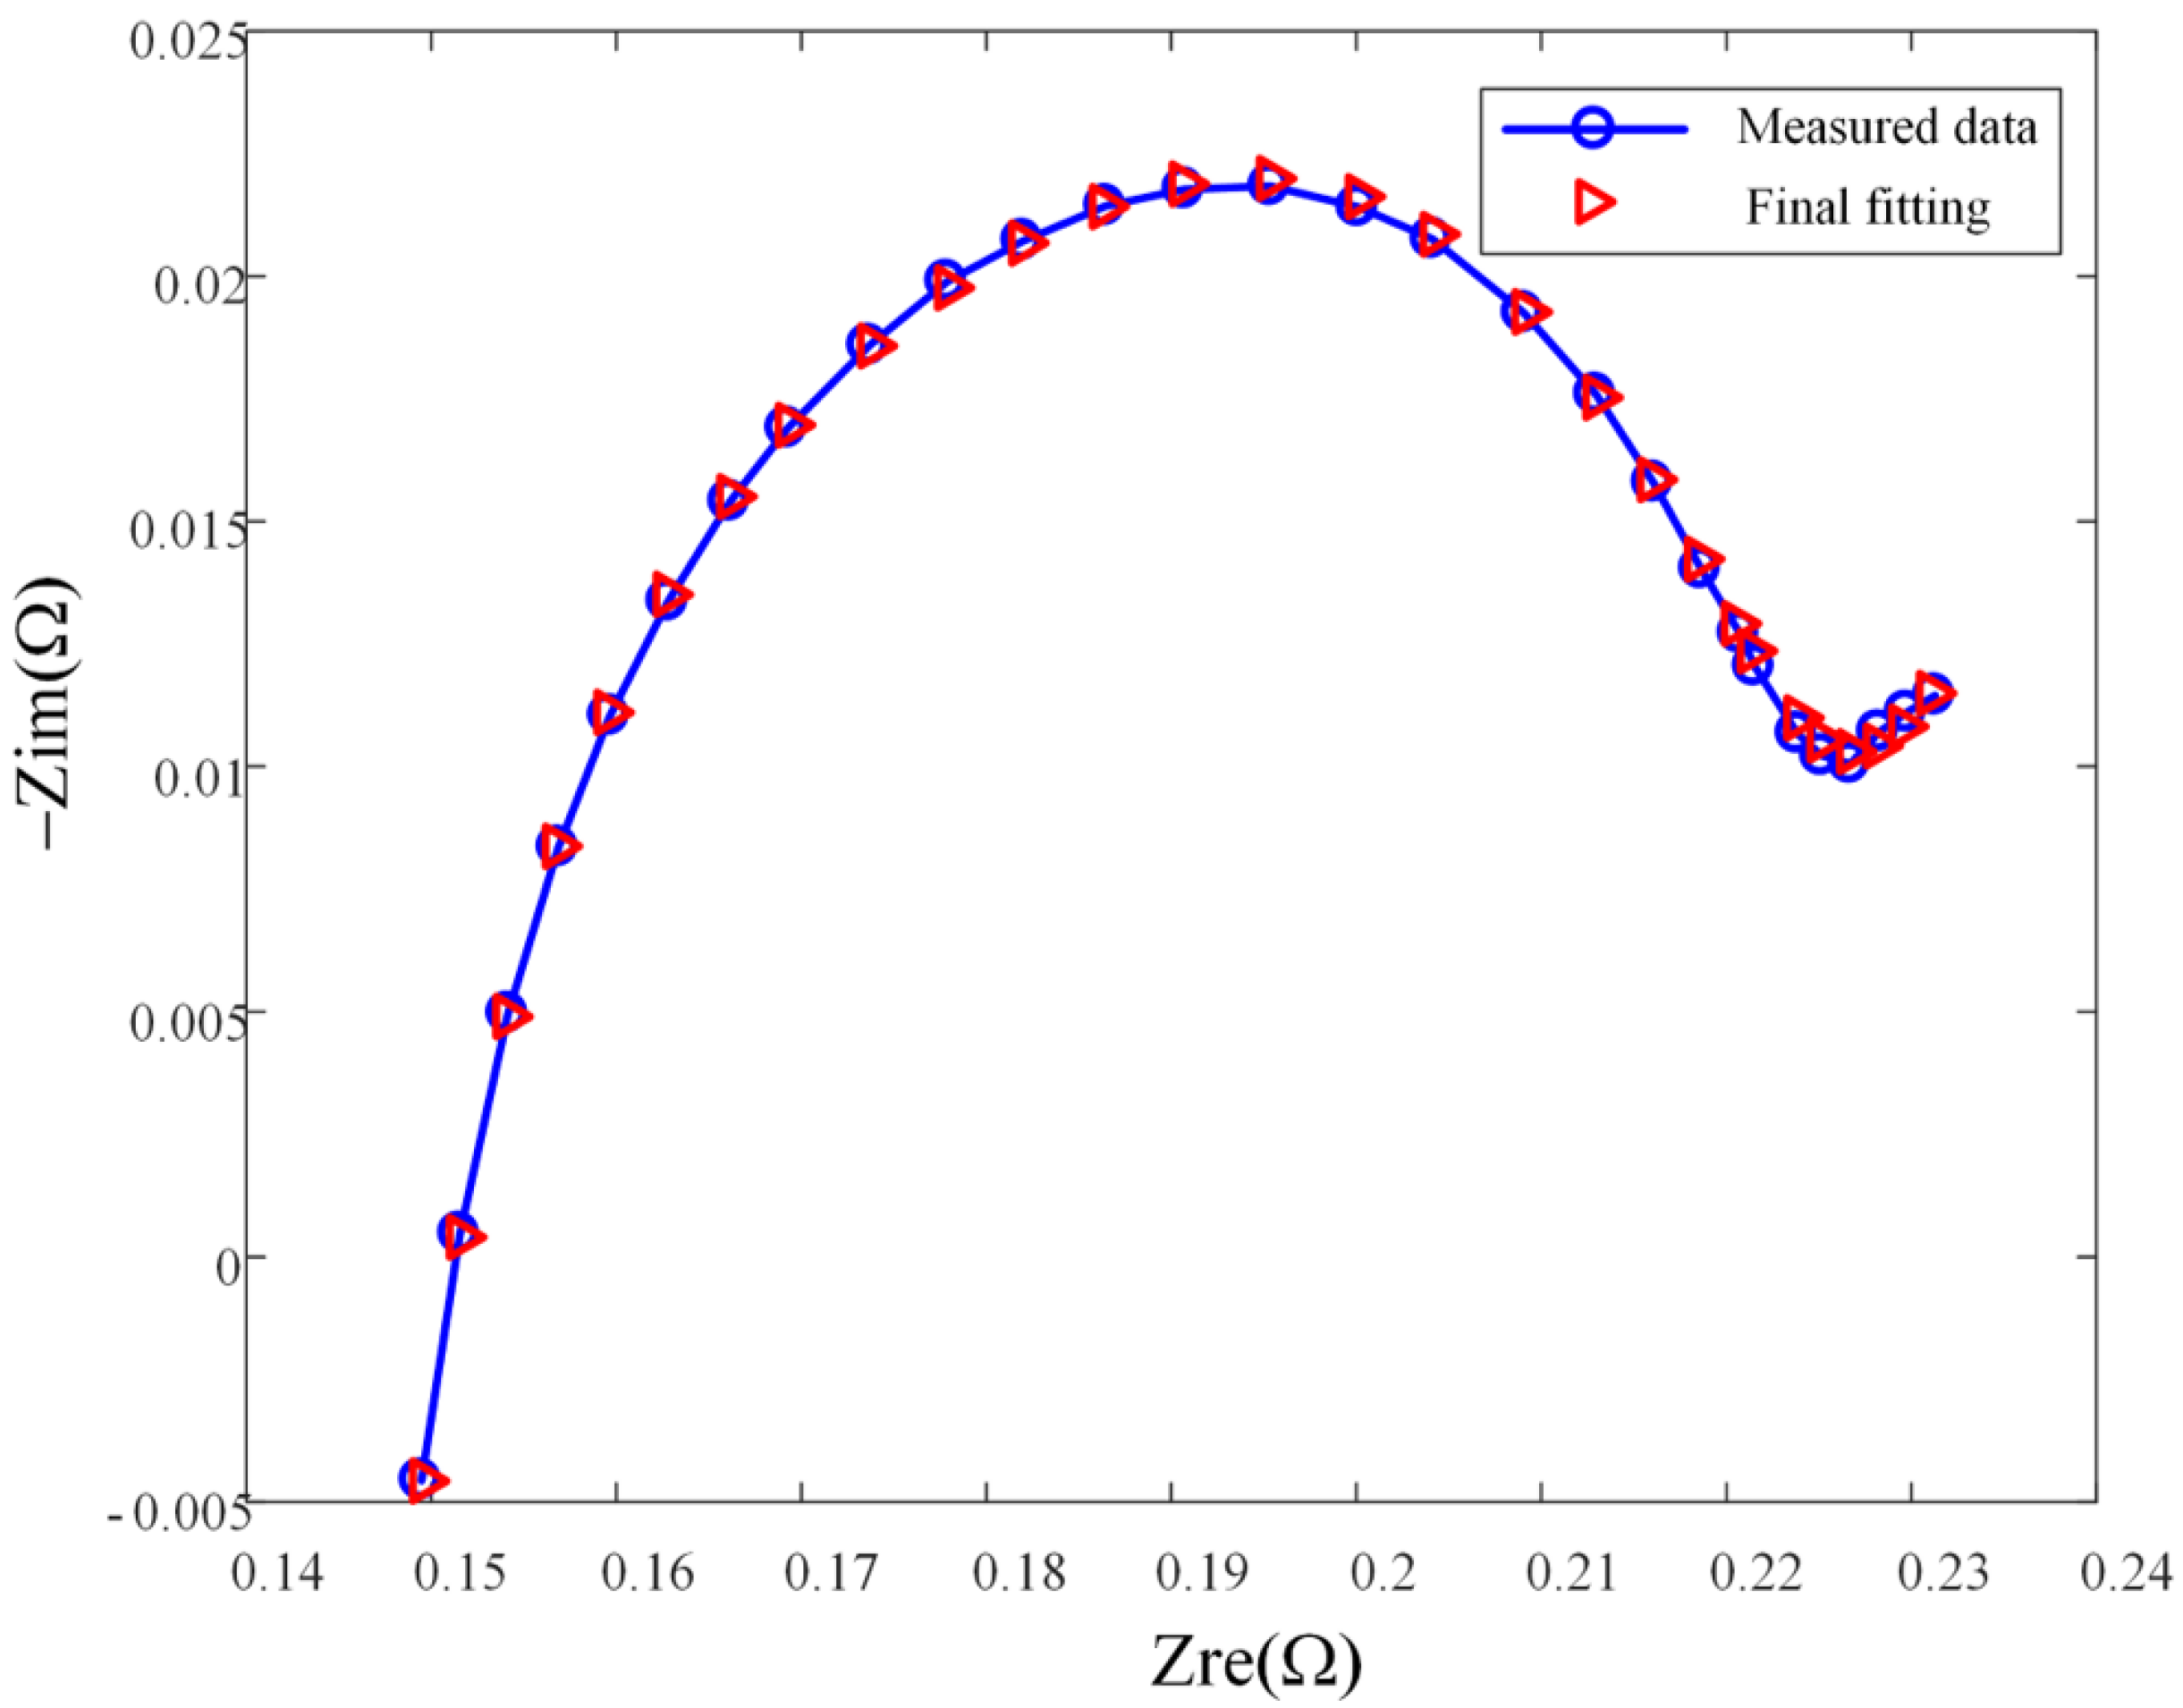
Figure 7.
Back-propagation neural network structure.
Recall that for each of B1 and B2, 11 impedance spectrum are acquired, which implies that there are a total of 22 sets of feature–target pairs available for training and testing the ANN. In that, 12 groups of data are randomly selected for training, and the remaining ones are used for testing. Without loss of generality, “tansig” is selected as hidden layer transfer function , while “purelin” is selected as output transfer function . When tuning for the number of neurons in the hidden layer, a grid search is thought apt, and the choice finalizes at 9, as it delivers the best performance of the algorithm over the testing set. The test results corresponding to this final choice are shown in Figure 8. It can be seen from the figure that the ANN performs well in estimating the mass of lithium plating of the battery, with a maximum relative error of 8.31% and an average relative error of 3.08%.
4. Verification of the proposed method
After the estimated result obtains, the batteries are dismantled and analyzed using SEM and EDS. To quantify the degrees of lithium plating, chemical method is used to convert the plated lithium into . Then, the mass of lithium plating can be obtained indirectly by measuring the content of oxygen on air-dried electrodes. The SEM and EDS scanning results of batteries are shown in Figure 9, Figure 10 and Figure 11.
Figure 9.
SEM/EDS results of B3 (no lithium plating). (a) is the SEM scanning result, (b) is the EDS scanning result and (c) is the oxygen distribution on electrodes.
Figure 9.
SEM/EDS results of B3 (no lithium plating). (a) is the SEM scanning result, (b) is the EDS scanning result and (c) is the oxygen distribution on electrodes.
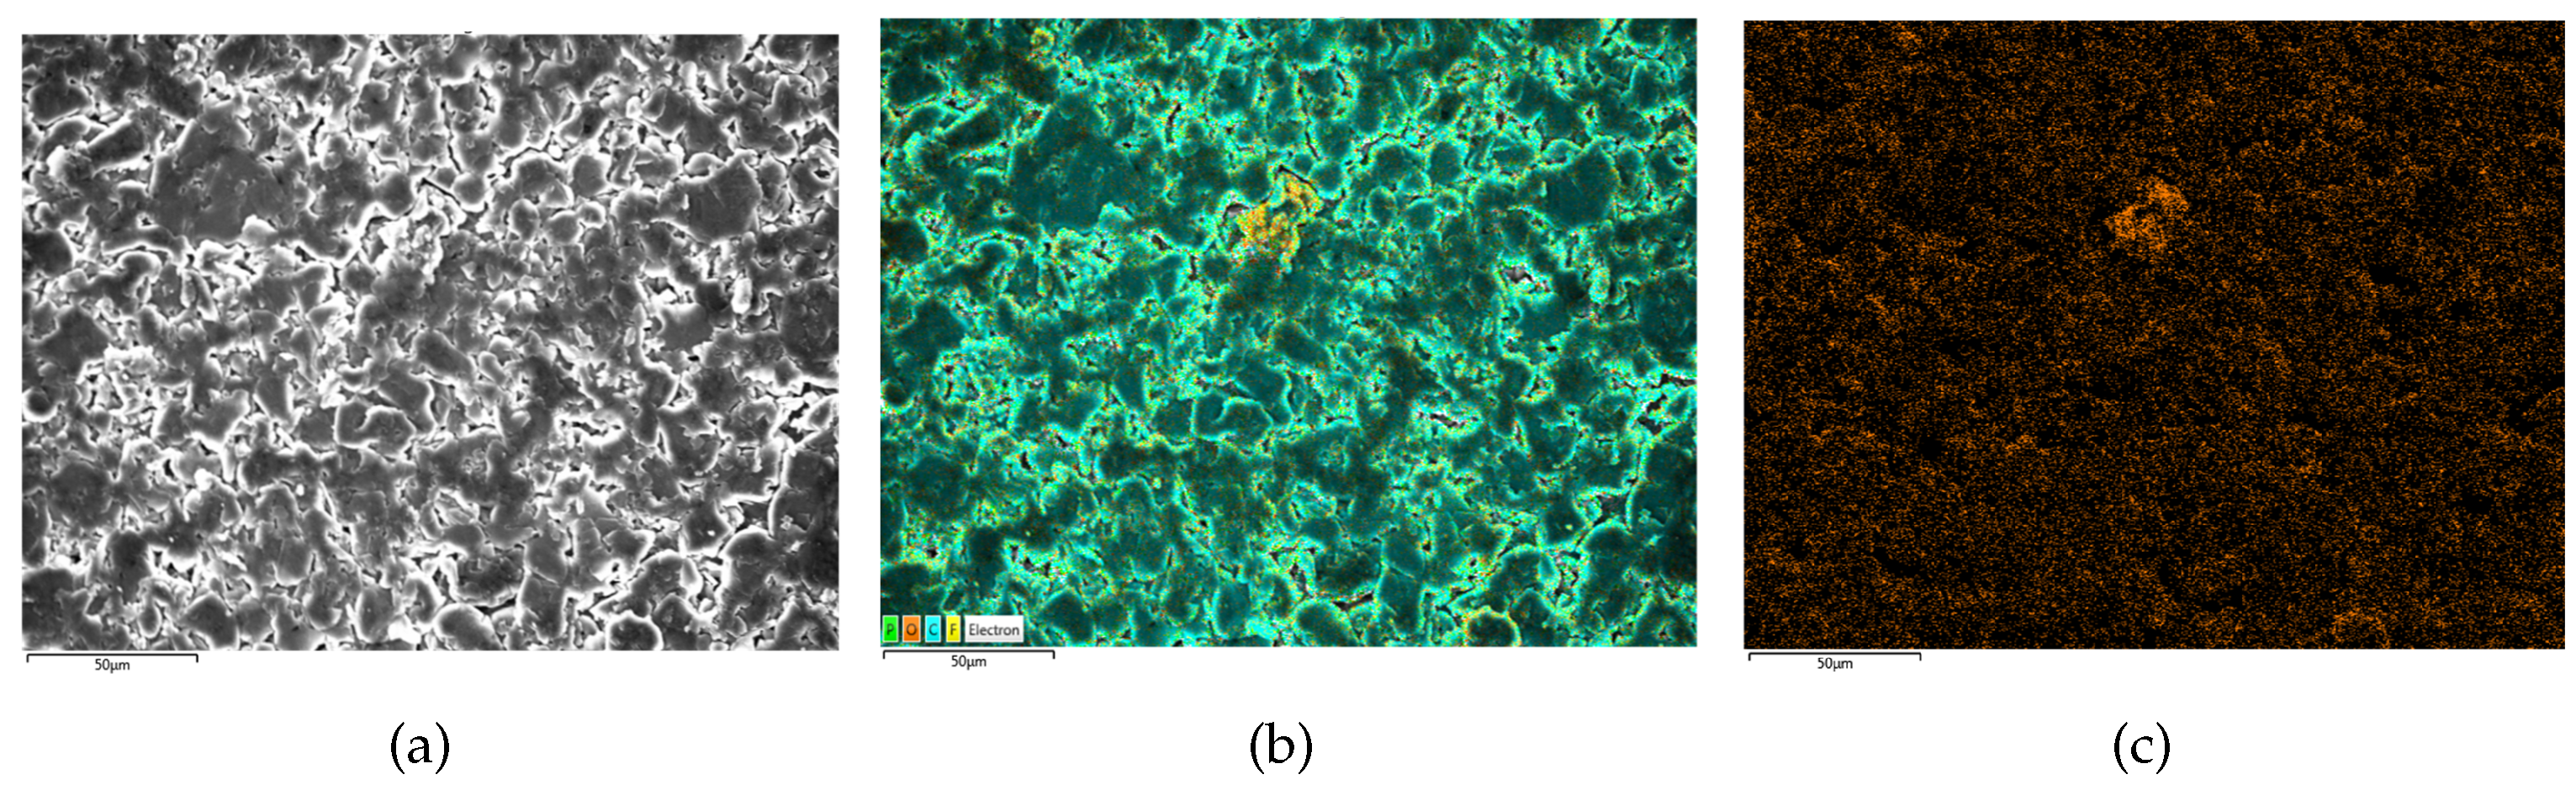
Figure 10.
SEM/EDS results of B4 (moderate lithium plating). (a) is the SEM scanning result, (b) is the EDS scanning result and (c) is the oxygen distribution on electrodes.
Figure 10.
SEM/EDS results of B4 (moderate lithium plating). (a) is the SEM scanning result, (b) is the EDS scanning result and (c) is the oxygen distribution on electrodes.
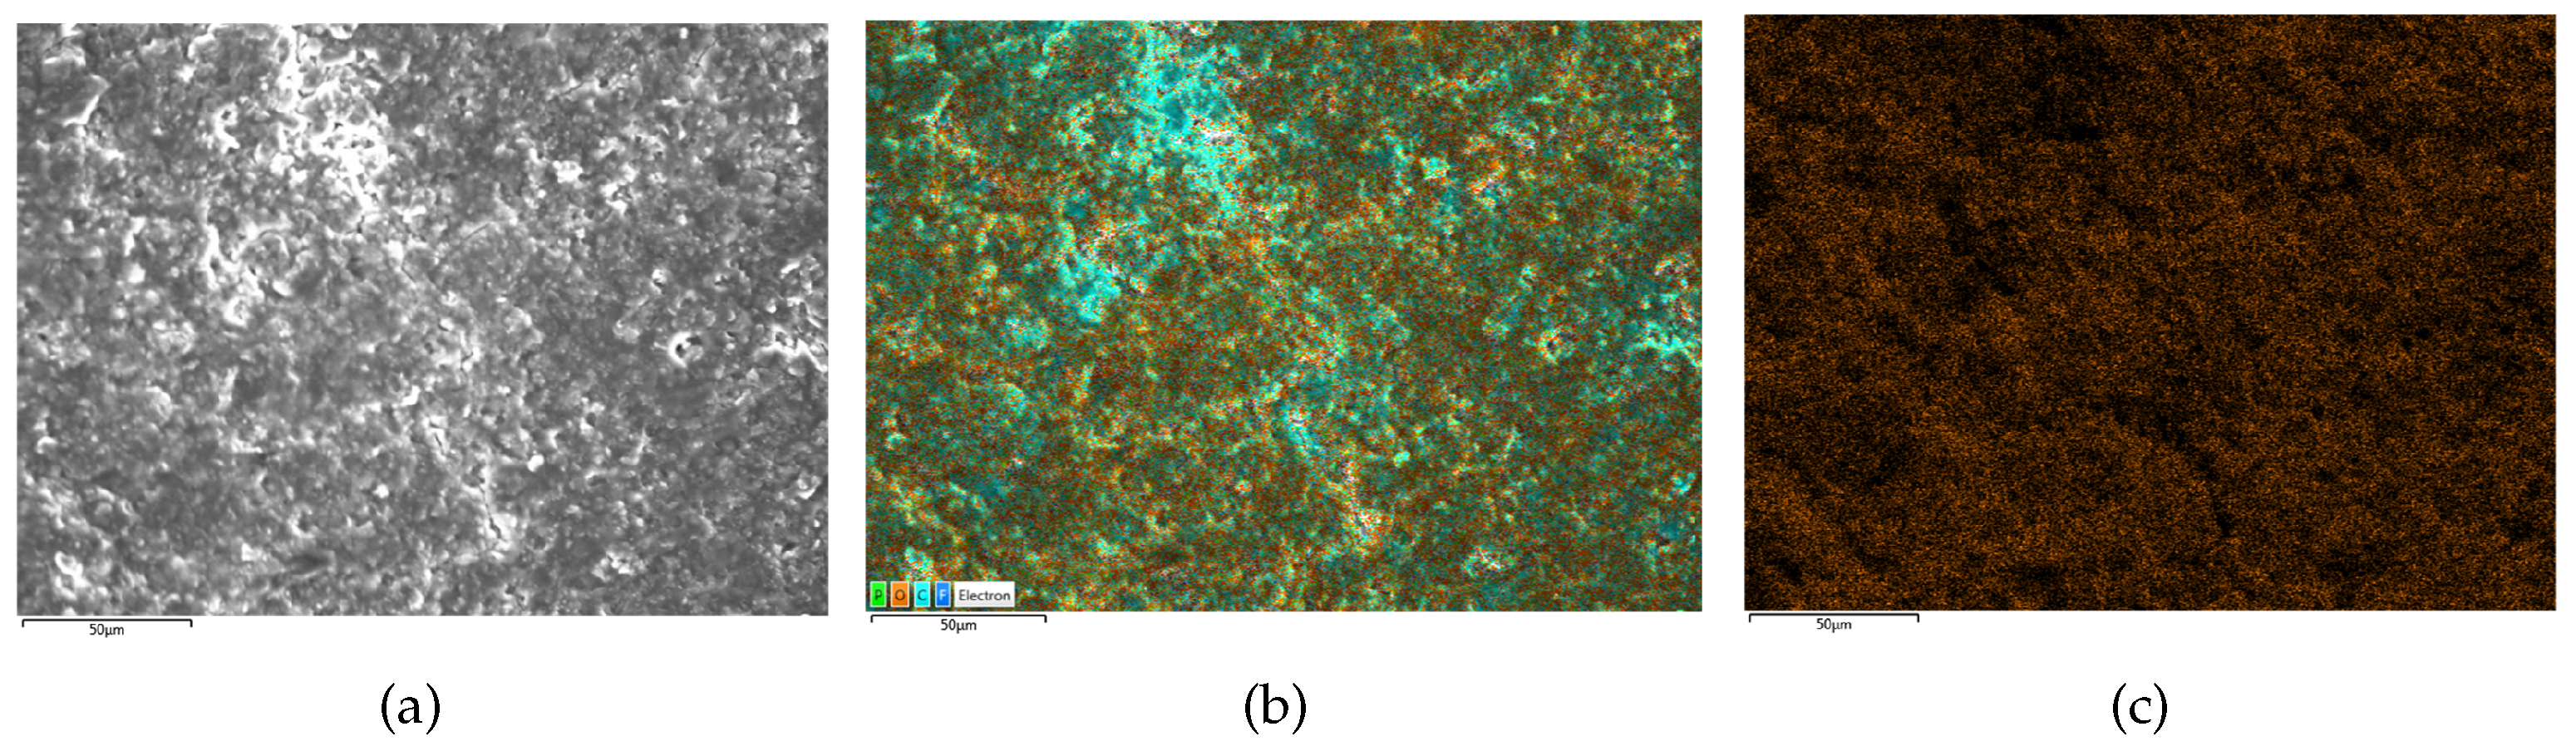
Figure 11.
SEM/EDS results of B5 (heavy lithium plating). (a) is the SEM scanning result, (b) is the EDS scanning result and (c) is the oxygen distribution on electrodes.
Figure 11.
SEM/EDS results of B5 (heavy lithium plating). (a) is the SEM scanning result, (b) is the EDS scanning result and (c) is the oxygen distribution on electrodes.
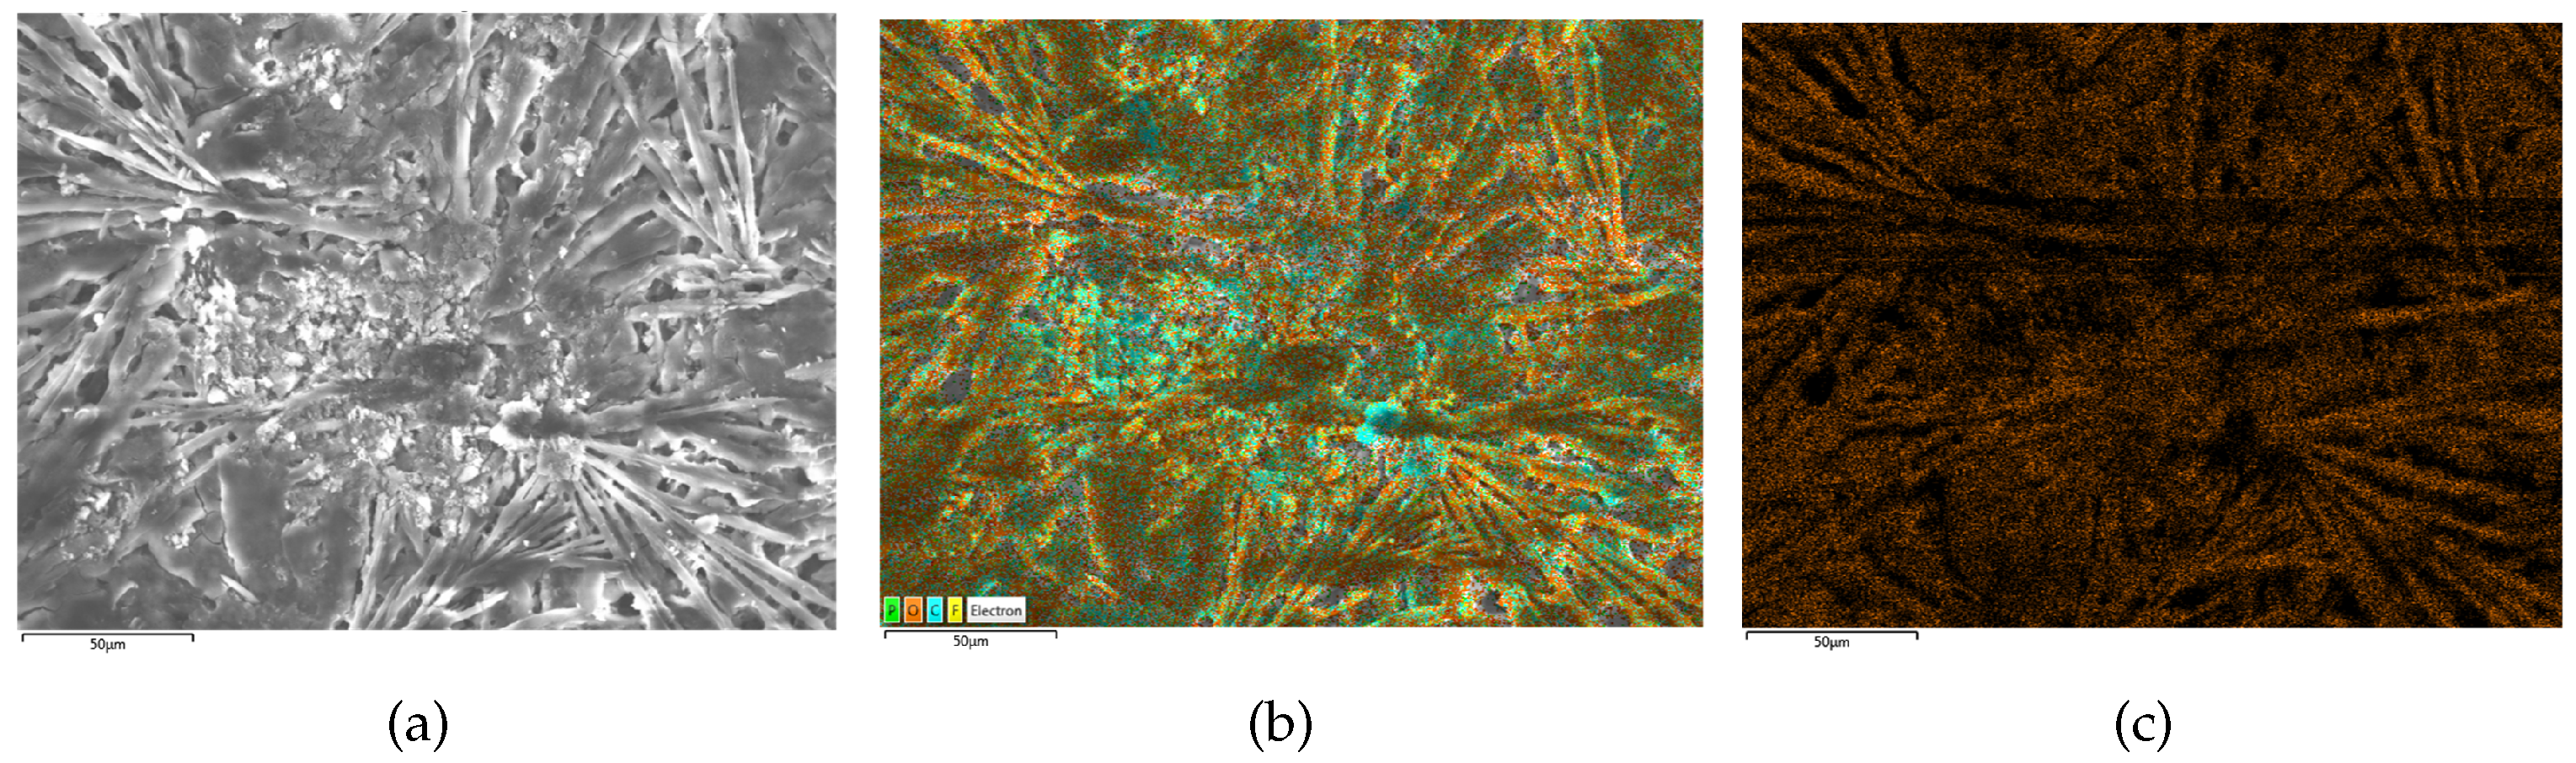
The present study investigates the surface morphology and oxygen element distribution of batteries. Specifically, the new battery B3 exhibits a relatively smooth surface with densely distributed granular objects and low oxygen element distribution, as evidenced by the SEM image presented in Figure 9. Conversely, the negative electrode surface of the medium lithium plating battery B4, as depicted in Figure 10, displays a rough surface with slight cracks and limited visibility of granular morphology. Moreover, the SEM scanning image of B5, shown in Figure 11, reveals the disappearance of negative particles and the emergence of obvious dendritic objects, indicative of significant lithium plating on the electrode. Furthermore, the oxygen element distribution of B5 is also dendritic, further supporting the observation of pronounced lithium plating.
After qualitative observation of the lithium plating state, the percentage of oxygen element on the electrode relative to the total mass of the sample is also determined through EDS analysis. Among them, this work mainly focuses on the increment of oxygen content of the aged battery relative to that of the new battery. The measurement results and the estimated value of lithium plating by the proposed method are shown in Table 3.
With B3 regarded as a new battery, its oxygen content and lithium plating mass can be regarded as the standard value when no lithium plating occurs. The increment of oxygen content in B4 and B5 battery samples can be considered to be entirely caused by lithium plating. According to the data in the table, estimated mass of lithium plating of B5 is 1.4233 times that of B4. Meanwhile, compared with the new B3 battery, the increment of oxygen of B5 is 1.170 times that of the B4. Since all the increment in oxygen comes from , which is converted from plated Lithium, the two ratios should be ideally equal. Although due to the inconsistency between B3 and B4, there is some error, which is acceptable, the result still can partially verify our method.
5. Conclusion
The detection and quantification of lithium plating are of great importance to maintaining the safe operation of lithium-ion batteries. This work proposes an impedance-spectrum-based method that is able to not just detect but also quantify lithium plating. The underlying principle of the method is to use as input the characteristic features extracted from impedance spectrum to predict the mass of lithium plating using an artificial neural network. The proposed method has three constituent parts, each carrying some significance as compared to traditional approaches. Firstly, by decoupling the effects of solid electrolyte interface formation and lithium plating on battery capacity, the mass of lithium plating can be expressed as a function of capacity loss. Secondly, because different levels of capacity loss corresponds monotonically with the shape of impedance spectrum, the latter can be used as a proxy for the former, through an equivalent circuit model (ECM). As such, the extracted ECM parameters can act as the features of a regression model, which estimates the mass of lithium plating; this work uses an ANN model for that.
In summary, this work offers a complete strategy for lithium plating detection and quantification, which is thought to be able to attract some pragmatism as compared to competitor methods, such as the direct observation methods or the reference electrode methods. In the present experimental setup, only a few batteries of a same kind are utilized in training the model. However, this does not impair one from extending the method to further contexts. The virtual of the method lies in its ability of quantifying lithium plating in absence of state-of-health measurement, although the training of a truly universal model would require as many such measurements as possible. Stated differently, in an ideal future case, an eclectic mix of battery aging experiments are to be conducted with different lithium-ion batteries. The experiments should measure both the capacity loss and impedance spectrum information, of which the former would be used as targets and the latter as to derive the input features, with which a regression model can be established. Once this step is done well and thorough, the trained model can be used to estimate the mass of lithium plating of other unseen types of batteries. Technique-wise, the regression model needs not to be confined to shallow neural networks—should the data get more numerous than the basic networks can handle, options with more intricate structures but better predictive performance may be employed.
Author Contributions
Conceptualization, C.L. and M.B.; methodology, C.L.; software, M.B.; validation, M.B.; formal analysis, M.B.; investigation, C.L.; resources, D.Y. and G.H.; data curation, M.B.; writing—original draft preparation, M.B.; writing—review and editing, C.L. and D.Y.; supervision, C.L.; project administration, C.L.; funding acquisition, C.L. All authors have read and agreed to the published version of the manuscript.
Funding
This research was funded by 2022 science and technology project of State Grid Heilongjiang Electric Power Co., Ltd., Performance evaluation of lead-acid battery in substation based on rapid impedance spectrum measurement (522449220001).
Data Availability Statement
Not appliable.
Conflicts of Interest
The authors declare no conflict of interest. The funders had no role in the design of the study; in the collection, analyses, or interpretation of data; in the writing of the manuscript; or in the decision to publish the results.
References
- Waldmann, T.; Kasper, M.; Wohlfahrt-Mehrens, M. Optimization of charging strategy by prevention of lithium deposition on anodes in high-energy lithium-ion batteries–electrochemical experiments. Electrochimica Acta 2015, 178, 525–532. [Google Scholar] [CrossRef]
- Seo, M.; Goh, T.; Park, M.; Kim, S.W. Detection method for soft internal short circuit in lithium-ion battery pack by extracting open circuit voltage of faulted cell. Energies 2018, 11, 1669. [Google Scholar] [CrossRef]
- Jiang, B.; Zhu, J.; Wang, X.; Wei, X.; Shang, W.; Dai, H. A comparative study of different features extracted from electrochemical impedance spectroscopy in state of health estimation for lithium-ion batteries. Applied Energy 2022, 322, 119502. [Google Scholar] [CrossRef]
- Lin, X.; Khosravinia, K.; Hu, X.; Li, J.; Lu, W. Lithium Plating Mechanism, Detection, and Mitigation in Lithium-Ion Batteries. Progress in Energy and Combustion Science 2021, 87, 100953. [Google Scholar] [CrossRef]
- Cheng, J.H.; Assegie, A.A.; Huang, C.J.; Lin, M.H.; Tripathi, A.M.; Wang, C.C.; Tang, M.T.; Song, Y.F.; Su, W.N.; Hwang, B.J. Visualization of lithium plating and stripping via in operando transmission X-ray microscopy. The Journal of Physical Chemistry C 2017, 121, 7761–7766. [Google Scholar] [CrossRef]
- Zhu, W.; Demers, H.; Girard, G.; Clement, D.; Zimin, F.; Guerfi, A.; Trudeau, M.; Vijh, A.; Paolella, A. Monitoring lithium metal plating/stripping in anode free//NMC811 battery by in-situ X-rays diffraction. Journal of Power Sources 2022, 546, 231941. [Google Scholar] [CrossRef]
- Chang, H.J.; Ilott, A.J.; Trease, N.M.; Mohammadi, M.; Jerschow, A.; Grey, C.P. Correlating microstructural lithium metal growth with electrolyte salt depletion in lithium batteries using 7Li MRI. Journal of the American Chemical Society 2015, 137, 15209–15216. [Google Scholar] [CrossRef]
- Bitzer, B.; Gruhle, A. A new method for detecting lithium plating by measuring the cell thickness. Journal of Power Sources 2014, 262, 297–302. [Google Scholar] [CrossRef]
- Verbrugge, M.W.; Koch, B.J. Electrochemical analysis of lithiated graphite anodes. Journal of The Electrochemical Society 2003, 150, A374. [Google Scholar] [CrossRef]
- Itou, Y.; Ukyo, Y. Performance of LiNiCoO2 materials for advanced lithium-ion batteries. Journal of Power Sources 2005, 146, 39–44. [Google Scholar] [CrossRef]
- Uhlmann, C.; Illig, J.; Ender, M.; Schuster, R.; Ivers-Tiffée, E. In situ detection of lithium metal plating on graphite in experimental cells. Journal of Power Sources 2015, 279, 428–438. [Google Scholar] [CrossRef]
- Smart, M.; Ratnakumar, B. Effects of electrolyte composition on lithium plating in lithium-ion cells. Journal of The Electrochemical Society 2011, 158, A379. [Google Scholar] [CrossRef]
- Schindler, S.; Bauer, M.; Petzl, M.; Danzer, M.A. Voltage relaxation and impedance spectroscopy as in-operando methods for the detection of lithium plating on graphitic anodes in commercial lithium-ion cells. Journal of Power Sources 2016, 304, 170–180. [Google Scholar] [CrossRef]
- Waag, W.; Käbitz, S.; Sauer, D.U. Experimental investigation of the lithium-ion battery impedance characteristic at various conditions and aging states and its influence on the application. Applied energy 2013, 102, 885–897. [Google Scholar] [CrossRef]
- Koseoglou, M.; Tsioumas, E.; Ferentinou, D.; Jabbour, N.; Papagiannis, D.; Mademlis, C. Lithium plating detection using dynamic electrochemical impedance spectroscopy in lithium-ion batteries. Journal of Power Sources 2021, 512, 230508. [Google Scholar] [CrossRef]
- Sun, F.; Zielke, L.; Markötter, H.; Hilger, A.; Zhou, D.; Moroni, R.; Zengerle, R.; Thiele, S.; Banhart, J.; Manke, I. Morphological evolution of electrochemically plated/stripped lithium microstructures investigated by synchrotron X-ray phase contrast tomography. ACS Nano 2016, 10, 7990–7997. [Google Scholar] [CrossRef]
- Key, B.; Bhattacharyya, R.; Morcrette, M.; Seznec, V.; Tarascon, J.M.; Grey, C.P. Real-time NMR investigations of structural changes in silicon electrodes for lithium-ion batteries. Journal of the American Chemical Society 2009, 131, 9239–9249. [Google Scholar] [CrossRef]
- Janakiraman, U.; Garrick, T.R.; Fortier, M.E. Lithium plating detection methods in Li-ion batteries. Journal of the Electrochemical Society 2020, 167, 160552. [Google Scholar] [CrossRef]
- Xiao, Y.; Xu, R.; Yan, C.; Huang, J.Q.; Zhang, Q.; Ouyang, M. A toolbox of reference electrodes for lithium batteries. Advanced Functional Materials 2022, 32, 2108449. [Google Scholar] [CrossRef]
- Petzl, M.; Danzer, M.A. Nondestructive detection, characterization, and quantification of lithium plating in commercial lithium-ion batteries. Journal of Power Sources 2014, 254, 80–87. [Google Scholar] [CrossRef]
- Obregon, J.; Han, Y.R.; Ho, C.W.; Mouraliraman, D.; Lee, C.W.; Jung, J.Y. Convolutional autoencoder-based SOH estimation of lithium-ion batteries using electrochemical impedance spectroscopy. Journal of Energy Storage 2023, 60, 106680. [Google Scholar] [CrossRef]
- Krämer, Y.; Birkenmaier, C.; Feinauer, J.; Hintennach, A.; Bender, C.L.; Meiler, M.; Schmidt, V.; Dinnebier, R.E.; Schleid, T. A New Method for Quantitative Marking of Deposited Lithium by Chemical Treatment on Graphite Anodes in Lithium-Ion Cells. Chemistry–A European Journal 2015, 21, 6062–6065. [Google Scholar] [CrossRef] [PubMed]
- Lyu, C.; Wei, G.; Wen, Z.; Zhang, H.; Wu, Q.; Jing, H. Research on the Performance Evaluation of Lithiumion Battery Cascade Utilization Based on Impedance Spectrum. In Proceedings of the 2020 15th IEEE Conference on Industrial Electronics and Applications (ICIEA); 2020; pp. 1714–1719. [Google Scholar] [CrossRef]
- Wen, J.; Chen, X.; Li, X.; Li, Y. SOH prediction of lithium battery based on IC curve feature and BP neural network. Energy 2022, 261, 125234. [Google Scholar] [CrossRef]
Figure 1.
SoH decrement curve at 1C current rate.
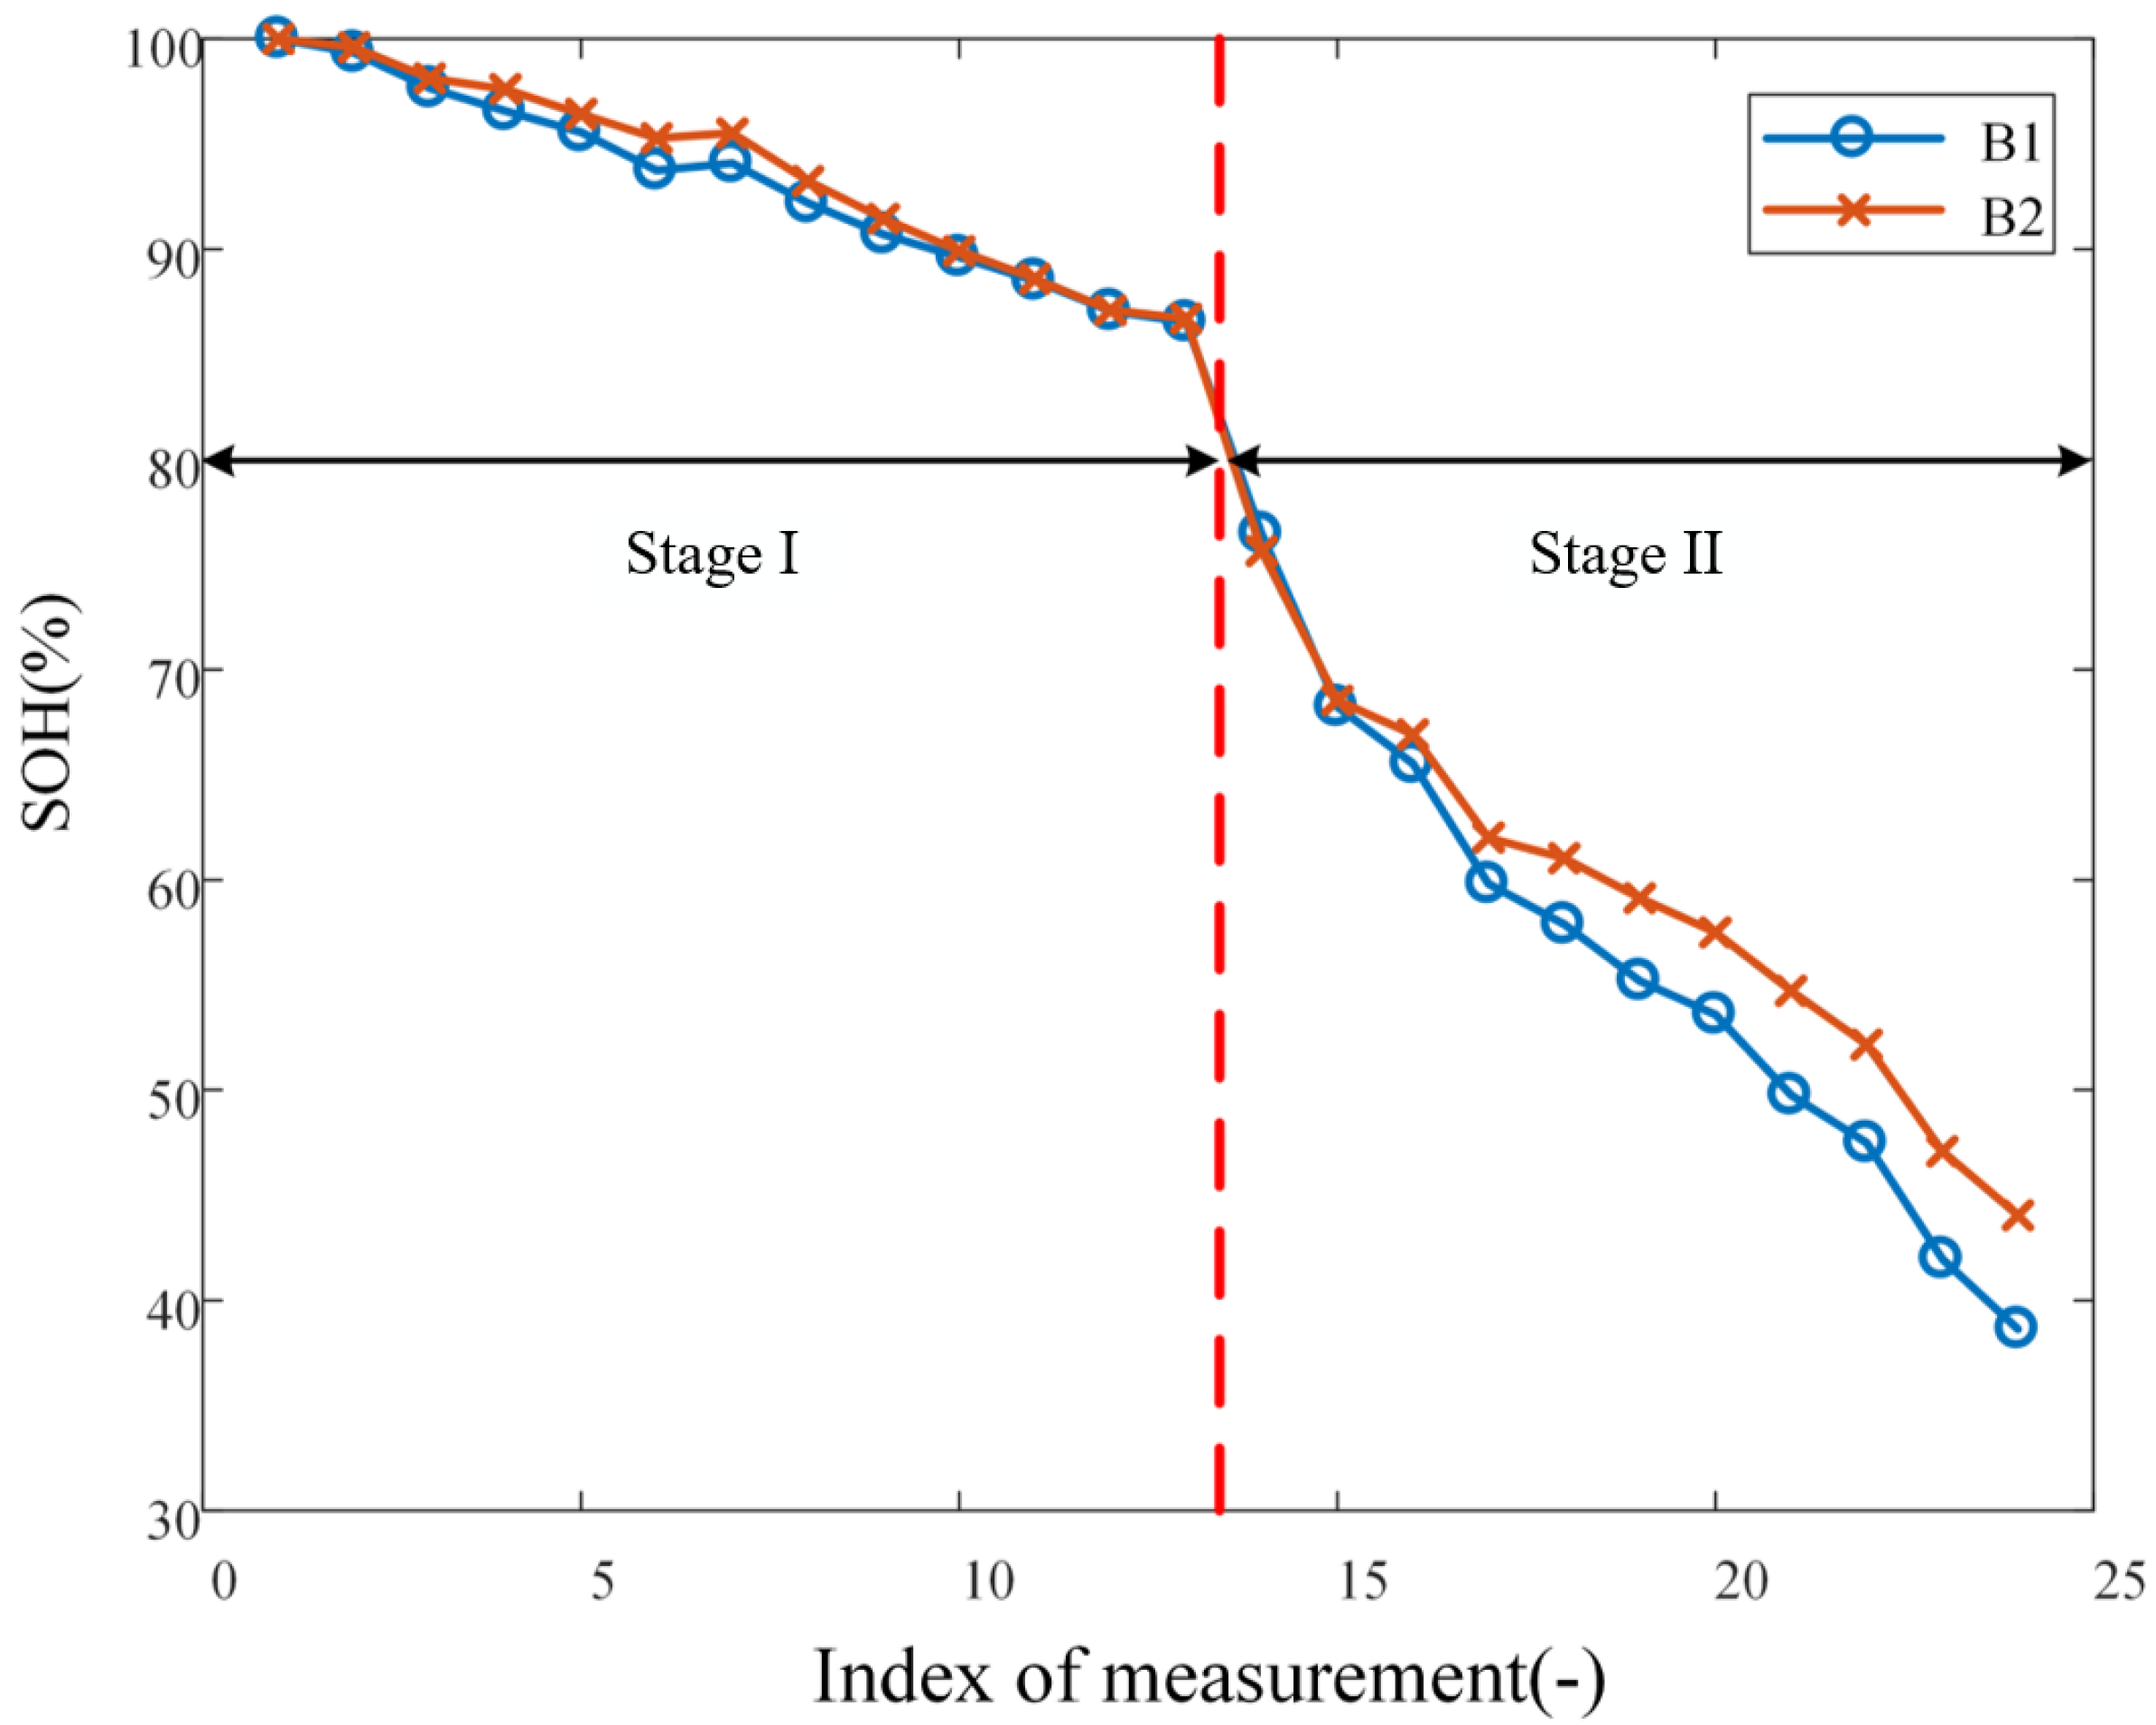
Figure 2.
Impedance spectrum of B1 in Stage II.
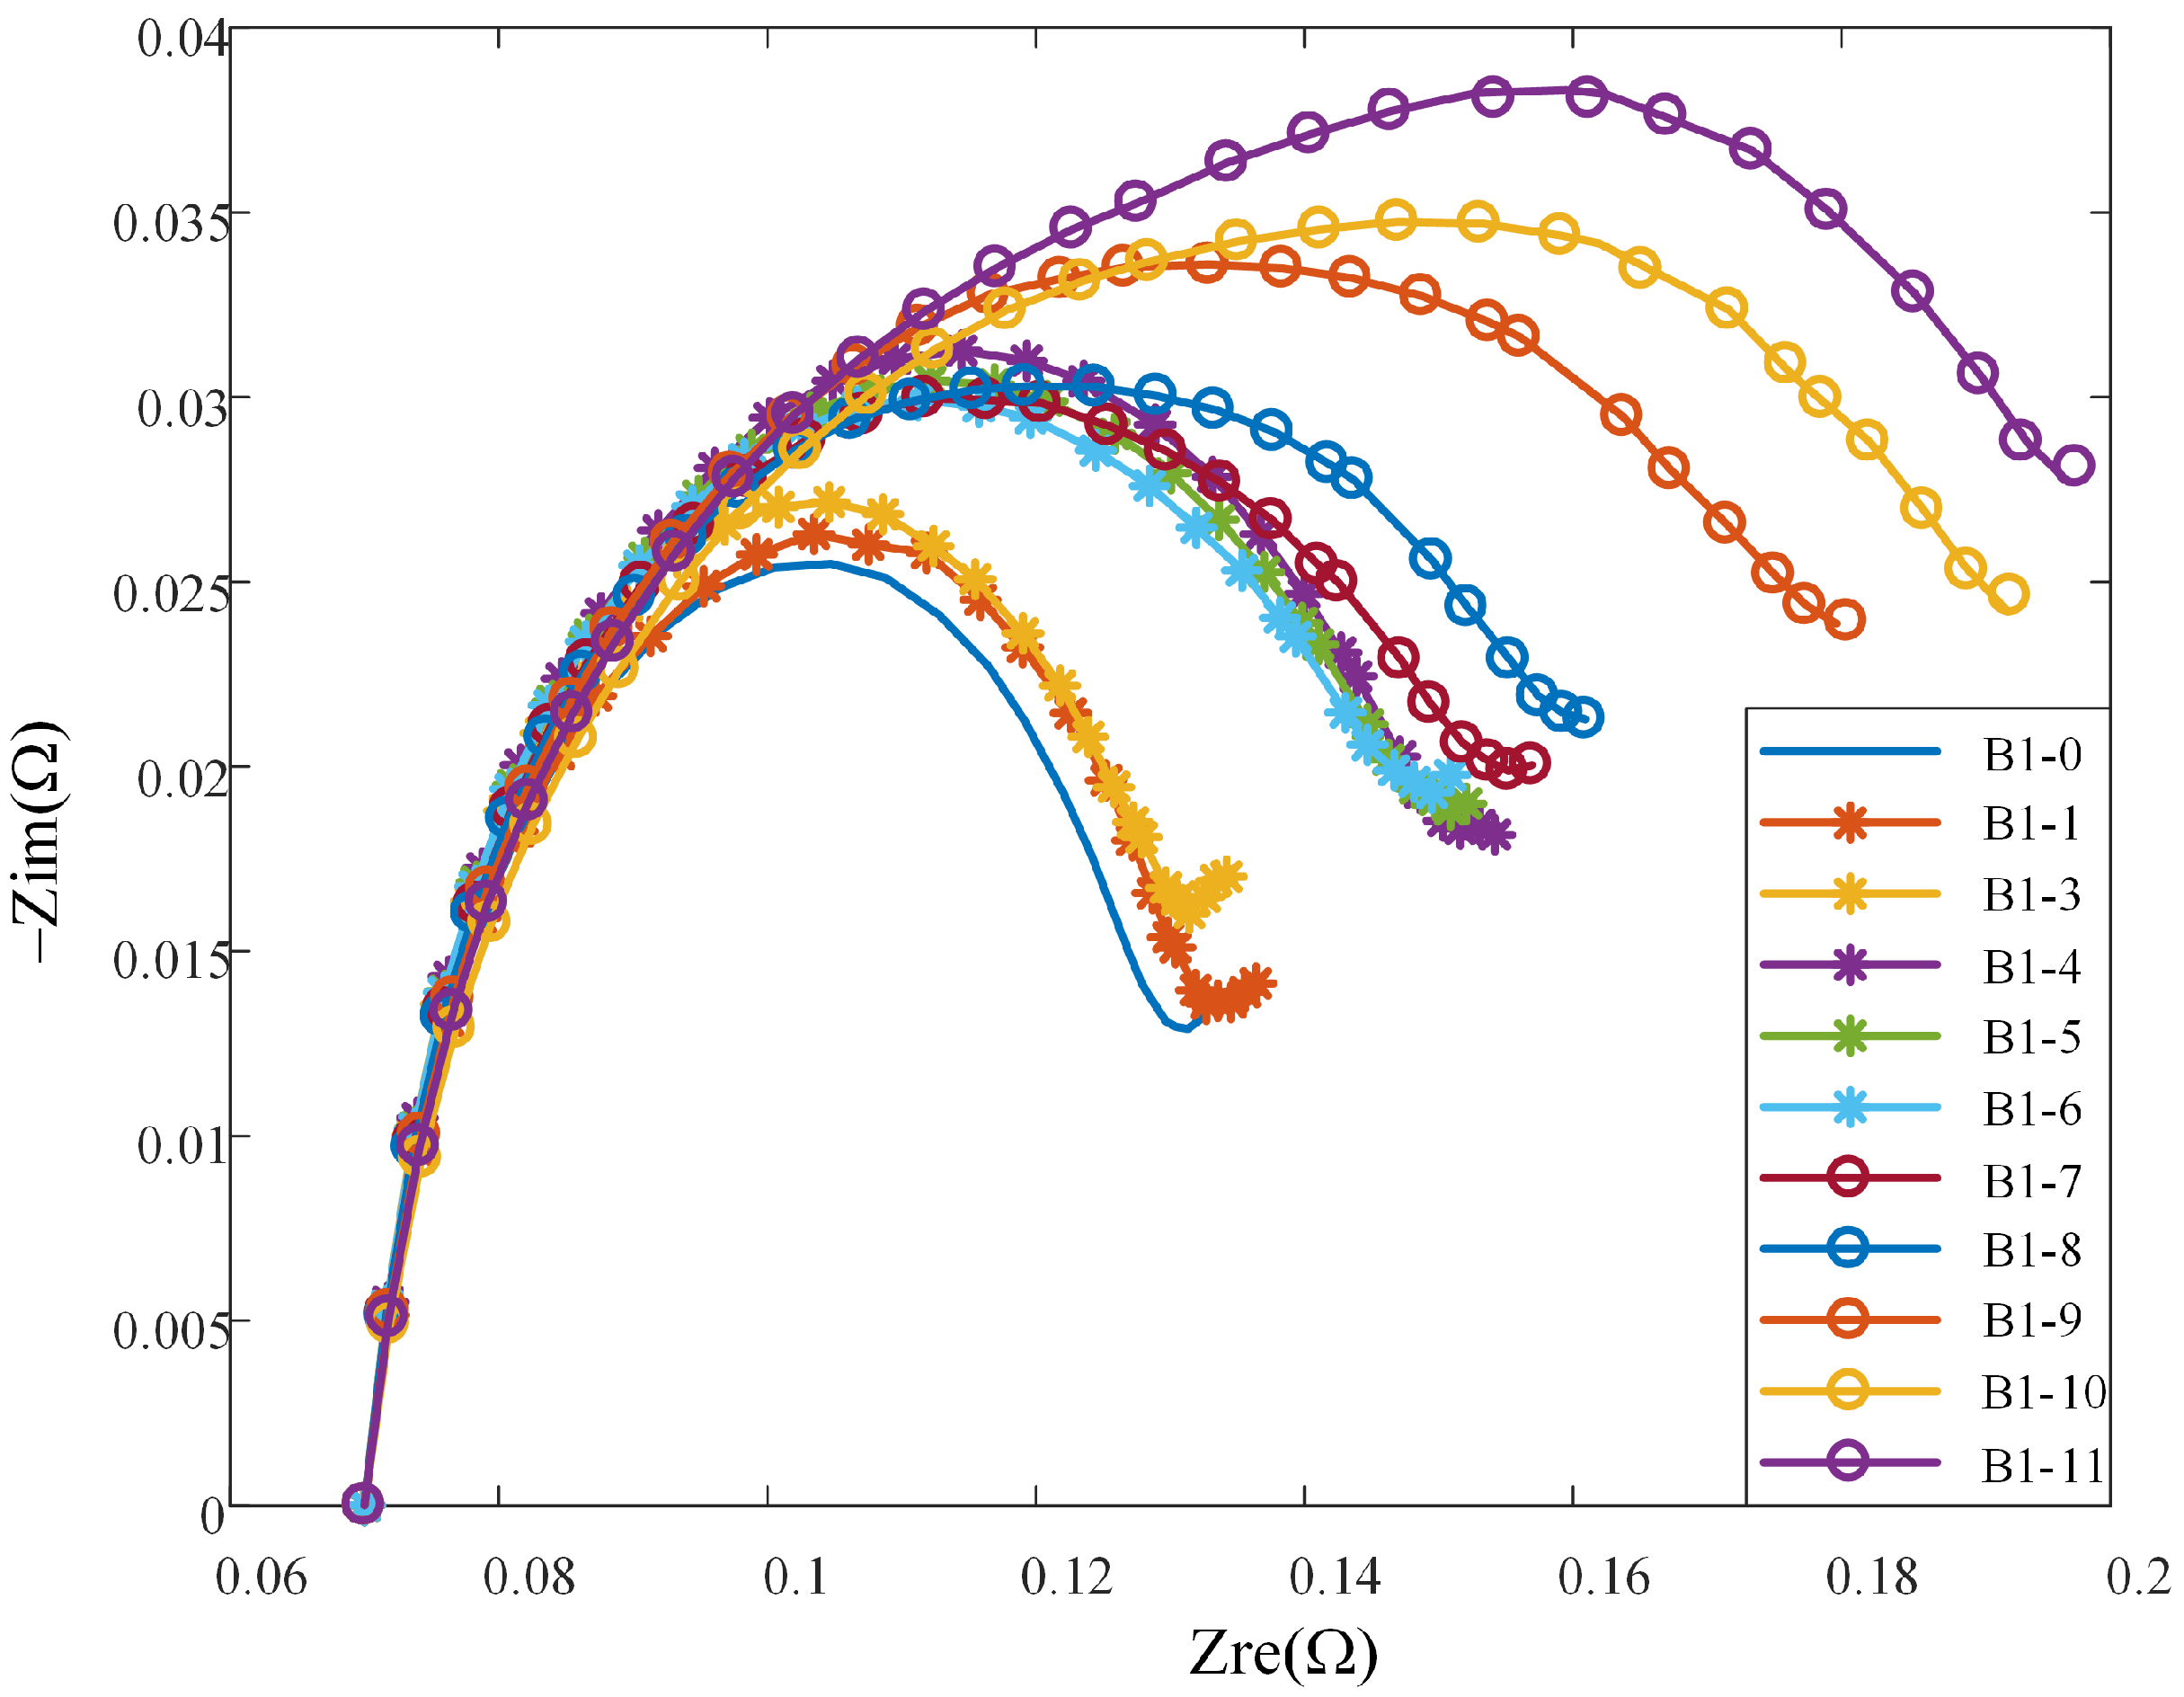
Figure 5.
Parameters of the third-order fractional equivalent circuit model.
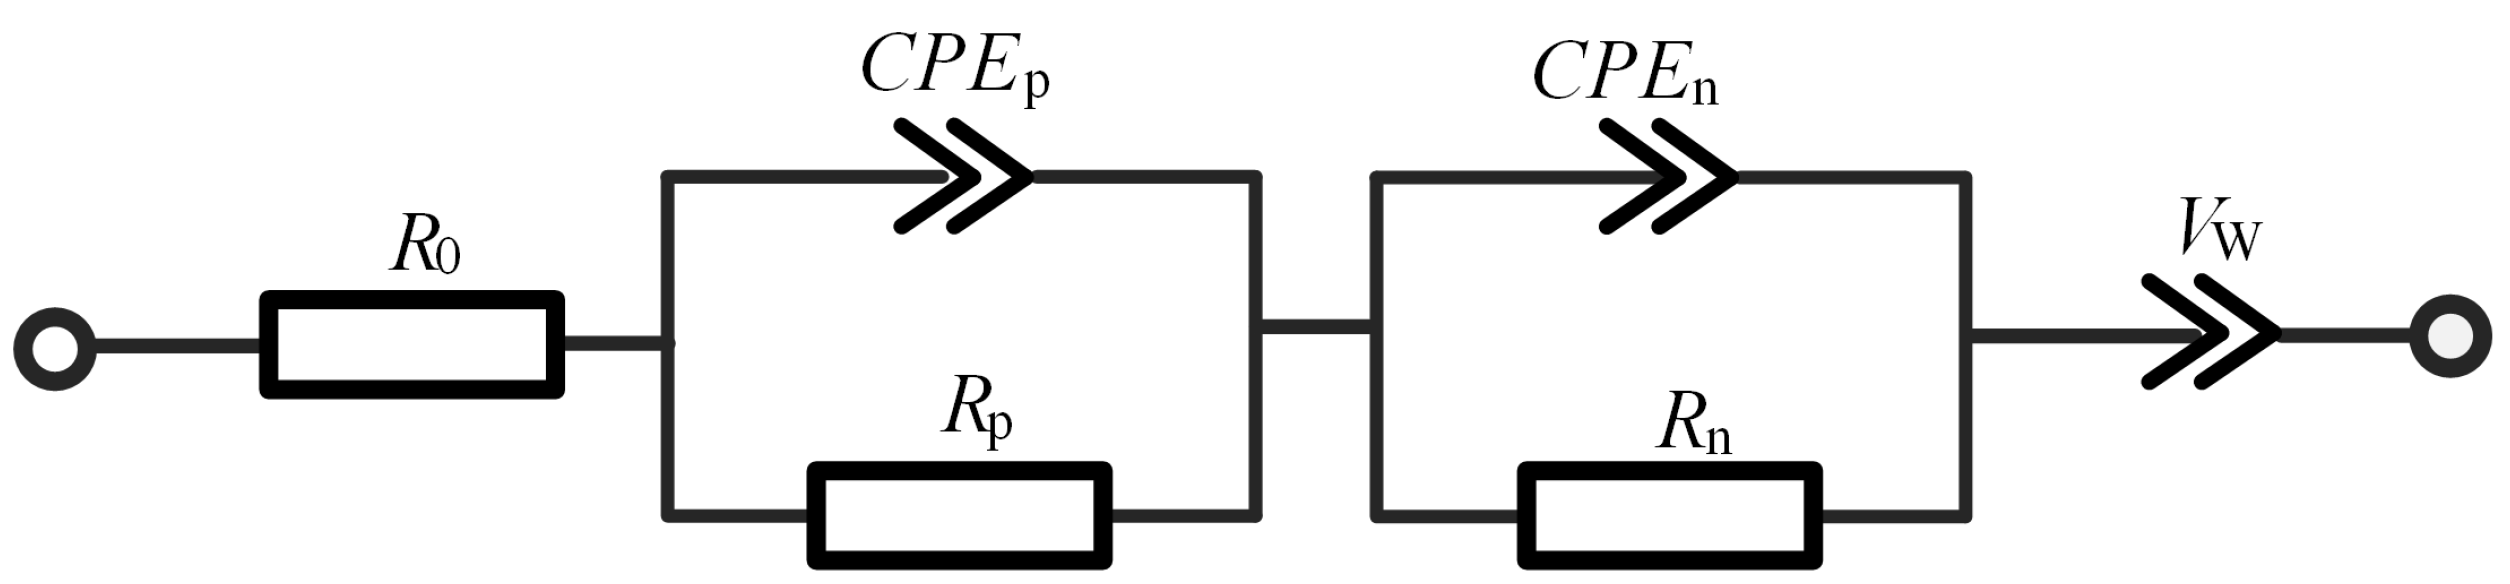
Figure 8.
Back-propagation neural network estimation results.
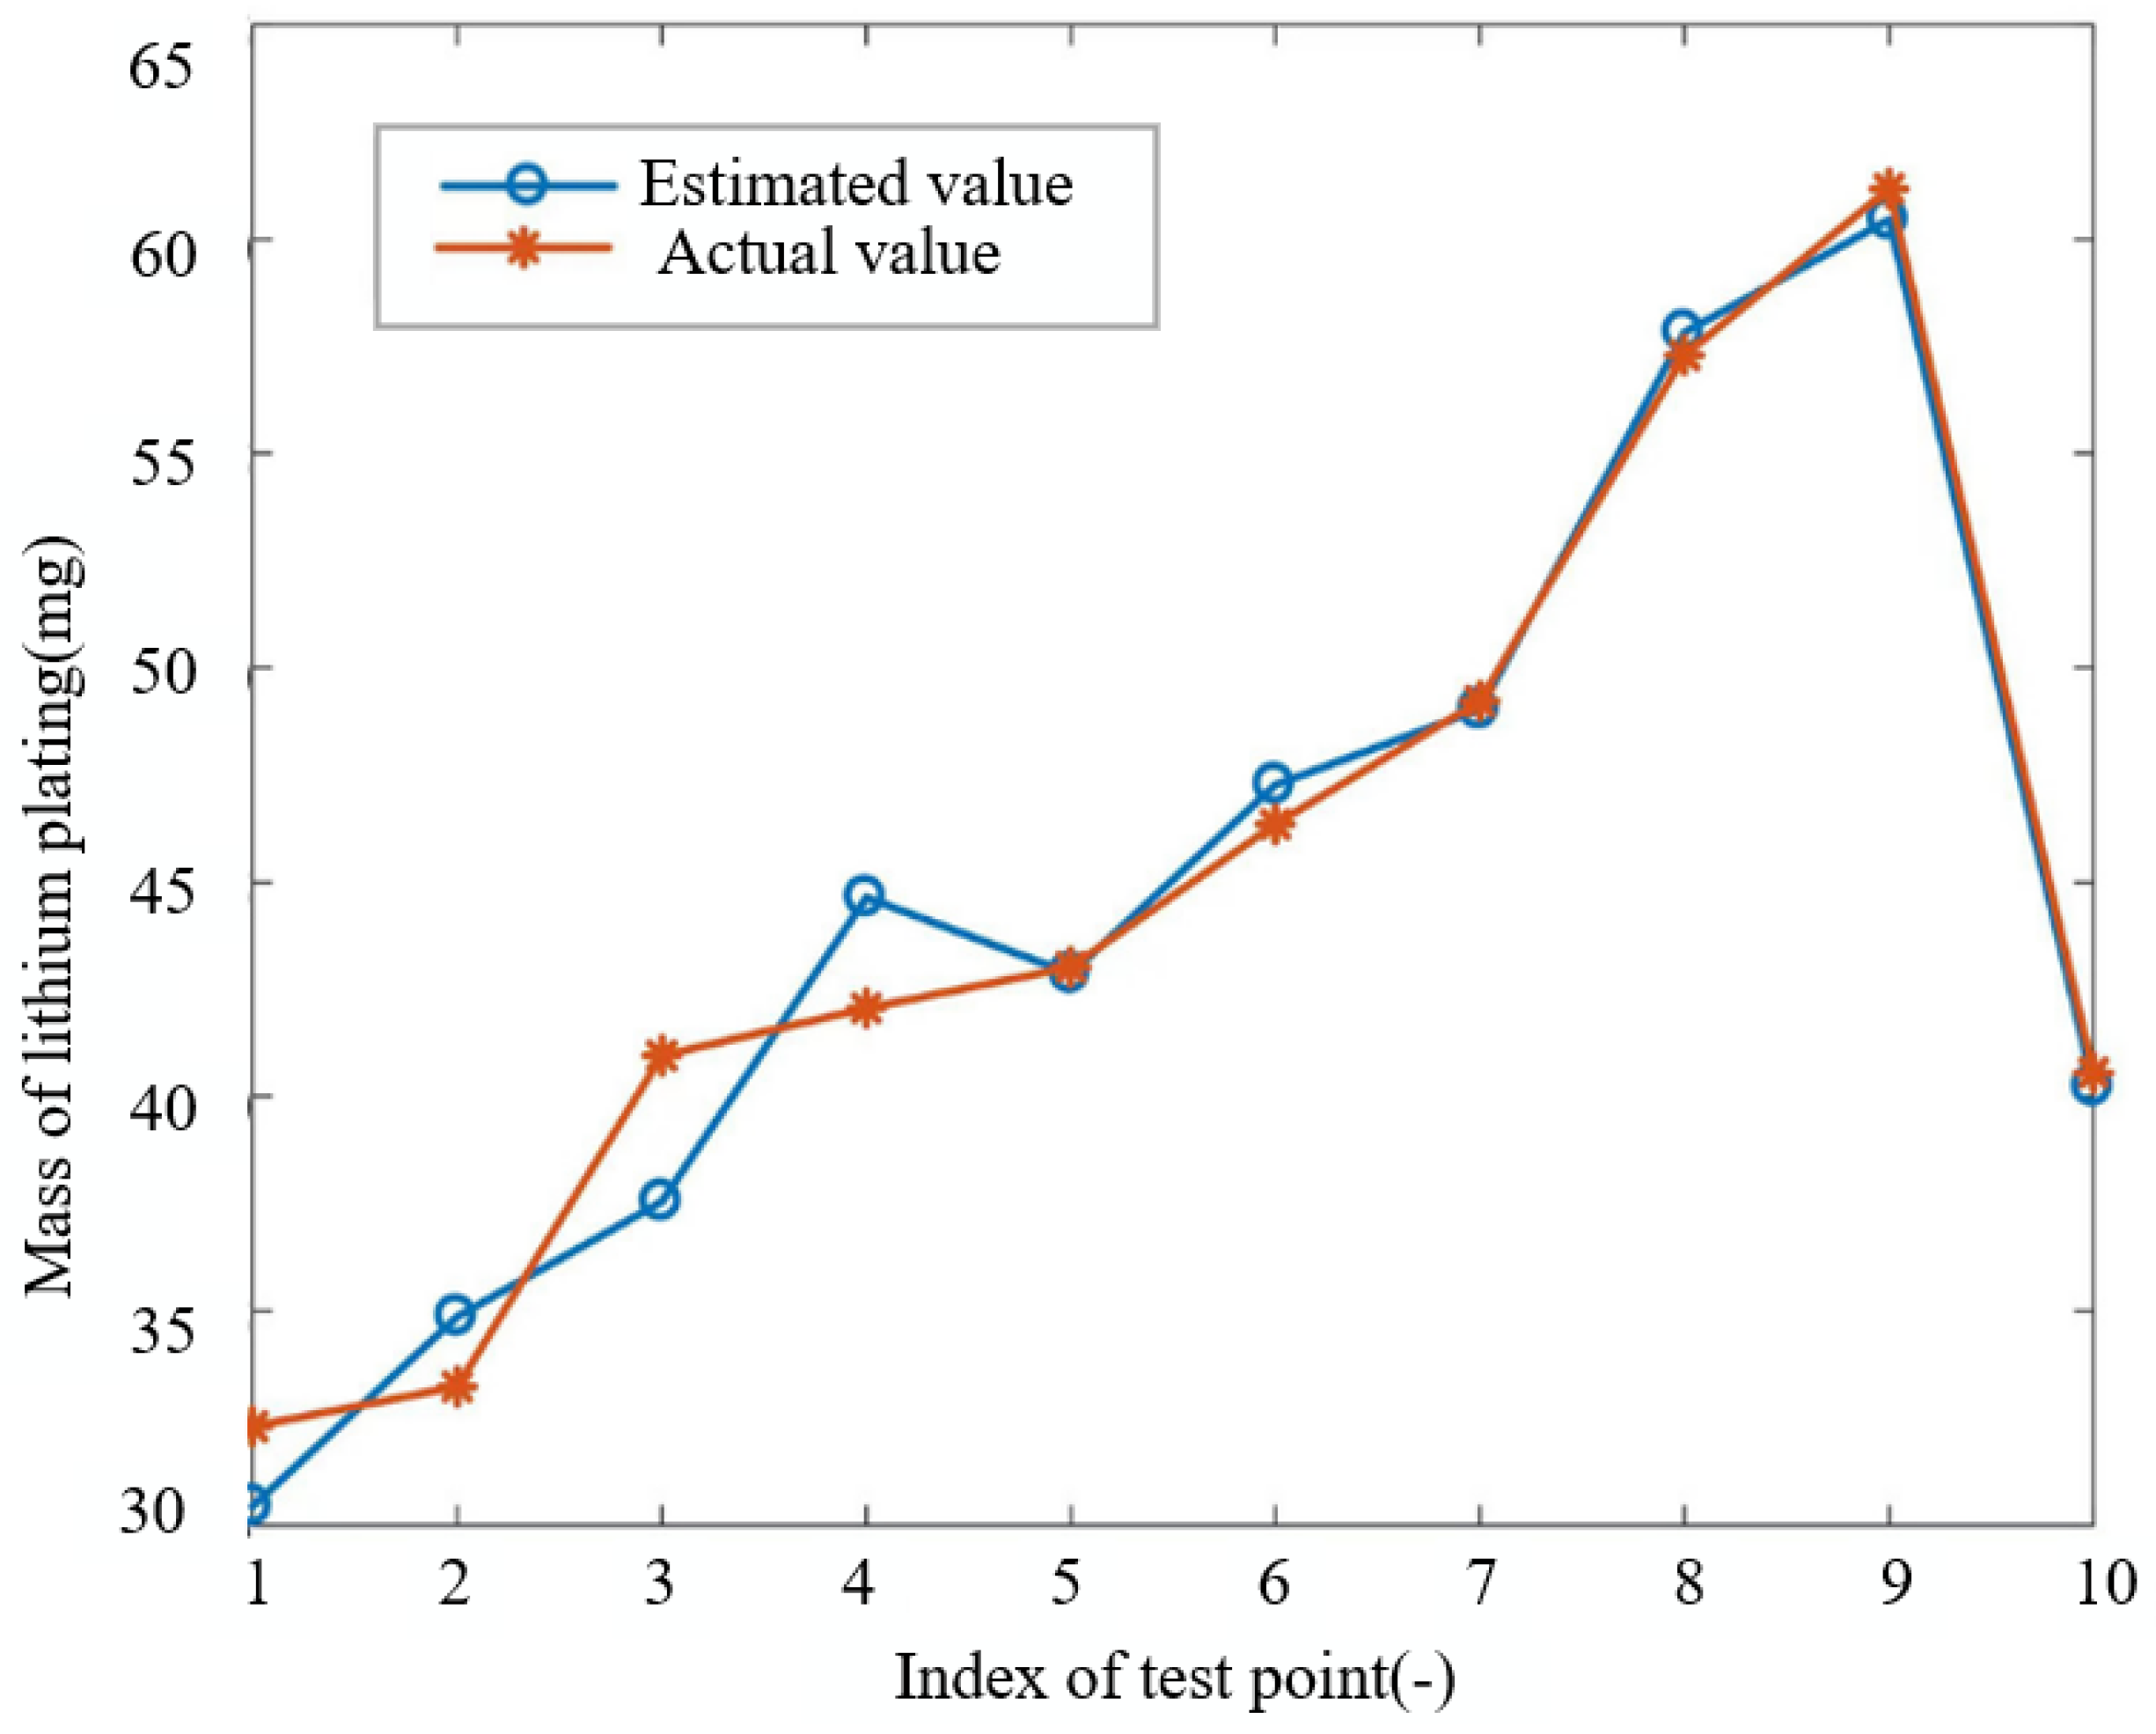

Table 1.
Specification of batteries.
| Parameter | Value |
|---|---|
| Capacity | 800 mAh |
| Weight | ≤25 g |
| Charging cut-off voltage | 4.2 V |
| Discharging cut-off voltage | 3.0 V |
| Standard charge and discharge rate | 1C |
| Max charge and discharge rate | 2C |
| Operating temperature | 0–40 °C |
Table 2.
Specification of batteries.
| Parameter symbol | Parameter name | Unit |
|---|---|---|
| Ohmic resistance | ||
| Positive electrode resistance | ||
| Negative electrode resistance | ||
| Double-layer capacitor of positive electrode | F | |
| Double-layer capacitor of negative electrode | F | |
| Capacitor of Warburg impedance | F | |
| CPE index of the positive electrode | - | |
| CPE index of the negative electrode | - | |
| CPE index of quasi-Warburg impedance | - |
Table 3.
Estimated lithium plating mass and relative oxygen content.
| Battery | Estimated lithium plating mass (mg) | Relative oxygen content (%) | Increment of oxygen content (%) |
|---|---|---|---|
| B3 | - | 20.26 | 0 |
| B4 | 43 | 63.08 | 42.82 |
| B5 | 61.2 | 70.36 | 50.10 |
Disclaimer/Publisher’s Note: The statements, opinions and data contained in all publications are solely those of the individual author(s) and contributor(s) and not of MDPI and/or the editor(s). MDPI and/or the editor(s) disclaim responsibility for any injury to people or property resulting from any ideas, methods, instructions or products referred to in the content. |
© 2023 by the authors. Licensee MDPI, Basel, Switzerland. This article is an open access article distributed under the terms and conditions of the Creative Commons Attribution (CC BY) license (http://creativecommons.org/licenses/by/4.0/).
Copyright: This open access article is published under a Creative Commons CC BY 4.0 license, which permit the free download, distribution, and reuse, provided that the author and preprint are cited in any reuse.


