1. Introduction
A significant amount of time and effort is spent ensuring newly designed physical products do not fail while performing their intended use. In addition to inadequate performance, an improperly designed product may potentially result in additional cost, time, injury, or worst case, loss of life [
1,
2]. Over the years, a considerable number of failure theories or failure criteria have been proposed to predict material failure. Depending on material behavior, such as ductile, brittle, isotropic, anisotropic, etc., different failure criteria have been developed. In this paper, the failure criteria are focused on isotropic and quasi-brittle materials like polymethyl methacrylate (PMMA).
Failure strength of an isotropic and brittle material is obtained from standard uniaxial testing. Because the number of combinations of multiaxial loading is unlimited, it is impossible to conduct tests to determine the failure loads under every different case of the combined loading. Furthermore, such testing is not feasible in the economical and practical sense. Therefore, failure criteria were developed for combined loads using the uniaxial failure strength. The maximum normal stress criterion has been the most acceptable failure criterion for isotropic and brittle materials. However, such a failure criterion as the maximum normal stress cannot be applied to a structural member containing a crack because the stress is singular at the crack tip.
To address that problem, the concept of linear elastic fracture mechanics (LEFM) was developed. Irwin and his colleagues introduced a new parameter and material property, stress intensity factor (SIF), and fracture toughness [
3,
4]. Unlike the Griffith theory [
5,
6], which does not consider the local stress at the crack tip, Irwin’s model utilizes a crack tip stress field analysis.
The LEFM cannot predict the failure of structural members with perforated holes which do not have stress singularity. Additionally, the maximum normal stress criterion grossly underpredicts the failure loads resulting from holes. As a result, additional failure criteria were proposed for failure at the hole [
7,
8,
9,
10,
11,
12]. Those failure criteria were called the theory of critical distance (TCD). The critical distance is considered a function of the material’s fracture toughness and critical stress. As previously mentioned, LEFM is based on the propagation of a pre-existing crack. Therefore, if the failure of an elastic material containing a notch needs to be determined, notched methods, such as Inglis’ work, are utilized. However, notched methods begin to provide inaccurate predictions when the notch sharpens or begins to resemble a crack. TCD uses the elastic stress information in a critical region adjacent to the notch tip and is defined by the critical distance to determine when the material will fail [
9,
12]. The point and average stress models are the two most commonly used approaches for analyzing stress information in the critical region. The point stress model assumes that failure will occur when the stress at a point, located some distance away from the notch tip, reaches the critical stress value, whereas the average stress model predicts failure will occur when the average stress in the critical region reaches the critical stress value [
13]. Furthermore, the concepts associated with TCD are also embodied in the method of finite fracture mechanics (FFM).
The FFM modifies the traditional work of Griffith’s energy balance criterion [
14]. Griffith’s work equates infinitesimal changes in potential energy to infinitesimal crack extension. The FFM modifies the relationship to only allow for finite crack extension. As a result of the modification, Griffith’s equation is expressed as
where
Gc is the critical energy release rate, and Δ
a/2 is an additional term associated with the finite change in crack length
a. The term Δ
a/2 is also related to the critical distance concept previously discussed. The critical distance does not consider the hole’s shape and size.
As stated above, different kinds of failure criteria have been used depending on whether there is a crack, hole, or none of them. Recently, a newly proposed failure criterion was proposed for brittle and quasi-brittle materials as a universal criterion that can be applied regardless of a crack, hole, or none of them [
15,
16,
17,
18]. The details of the new failure criterion are described in the subsequent section. The new criterion was validated against experiment results with various sizes and shapes of holes with remotely applied loading. However, the failure loads and paths of a notched specimen are very different depending on the loading condition. That is, the loading directly applied to the notch of a specimen such as inserted pins results in different failures as compared to the remotely applied loading. In the former case, the pin sizes also affect the failure in addition to the hole sizes.
Thus, the objective of this study is to further validate the new failure criterion against experimental results obtained using perforated PMMA specimens loaded by an inserted pin. Not only the failure stress but also the failure location and directions at initiation are compared between the experimental results and the numerical prediction using the new failure criterion. The specimen geometries as well as the pin sizes were varied in the study to examine different failure cases. The next section describes the new universal failure criterion followed by a description of the experiments and the numerical analysis models. Then, results and discussion are provided along with the summary and conclusions.
2. Universal Failure Criterion
As stated in the introduction, the universal failure criterion can predict the failure of a brittle or quasi-brittle material regardless of whether there is a discontinuity, such as a notch or crack, present in the material [
15,
16,
17]. Unlike the previously discussed models that use a critical stress value located some distance away from the site of failure initiation, the new criterion proposes analyzing the stress and stress gradient at the location of potential failure to determine if material failure is feasible. The universal failure criterion has two conditions that must simultaneously be met for material failure. The first condition states the effective stress
σeff should be equal to or greater than the failure strength of the material
σf as below
in which the failure strength
σf is obtained from uniaxial testing of the material. This is called the stress condition. The stress condition is checked at every possible failure location. If the stress condition is satisfied, the stress gradient condition as given in Eq. (3) is further checked.
where
E is elastic modulus,
Kf is another material property for failure, and
s is the failure path. For brittle or quasi-brittle isotropic materials, the maximum normal stress is selected for the effective stress, and the failure path is normal to the contour of the effective stress. If the stress gradient condition is also satisfied, then material failure occurs at that point.
The stress very near the tip of a line crack can be expressed as
for the mode I. Here,
KI is the stress intensity factor of mode I, and
s is measured from the crack tip along the normal direction to the applied load. Substitution of Eq. (4) into Eq. (3) shows that the failure constant
Kf is expressed as
Thus, the failure constant is directly related to the critical energy release rate of the material
If a structural member has zero stress gradient across its width like a uniaxial test specimen, the first condition, i.e., stress condition, controls the failure. On the other hand, if a structural member has a crack, the stress condition is explicitly satisfied because of singularity at the crack tip. Thus, the stress gradient condition determines failure. For a perforated hole, both conditions must be considered. However, for specimens with a reasonable size of a hole, previous studies showed that the stress gradient condition dictates the failure stress.
4. Numerical Analysis Models
The finite element analysis (FEA) of all the specimens was conducted using Ansys, a commercial software package [
19], and SolidWorks [
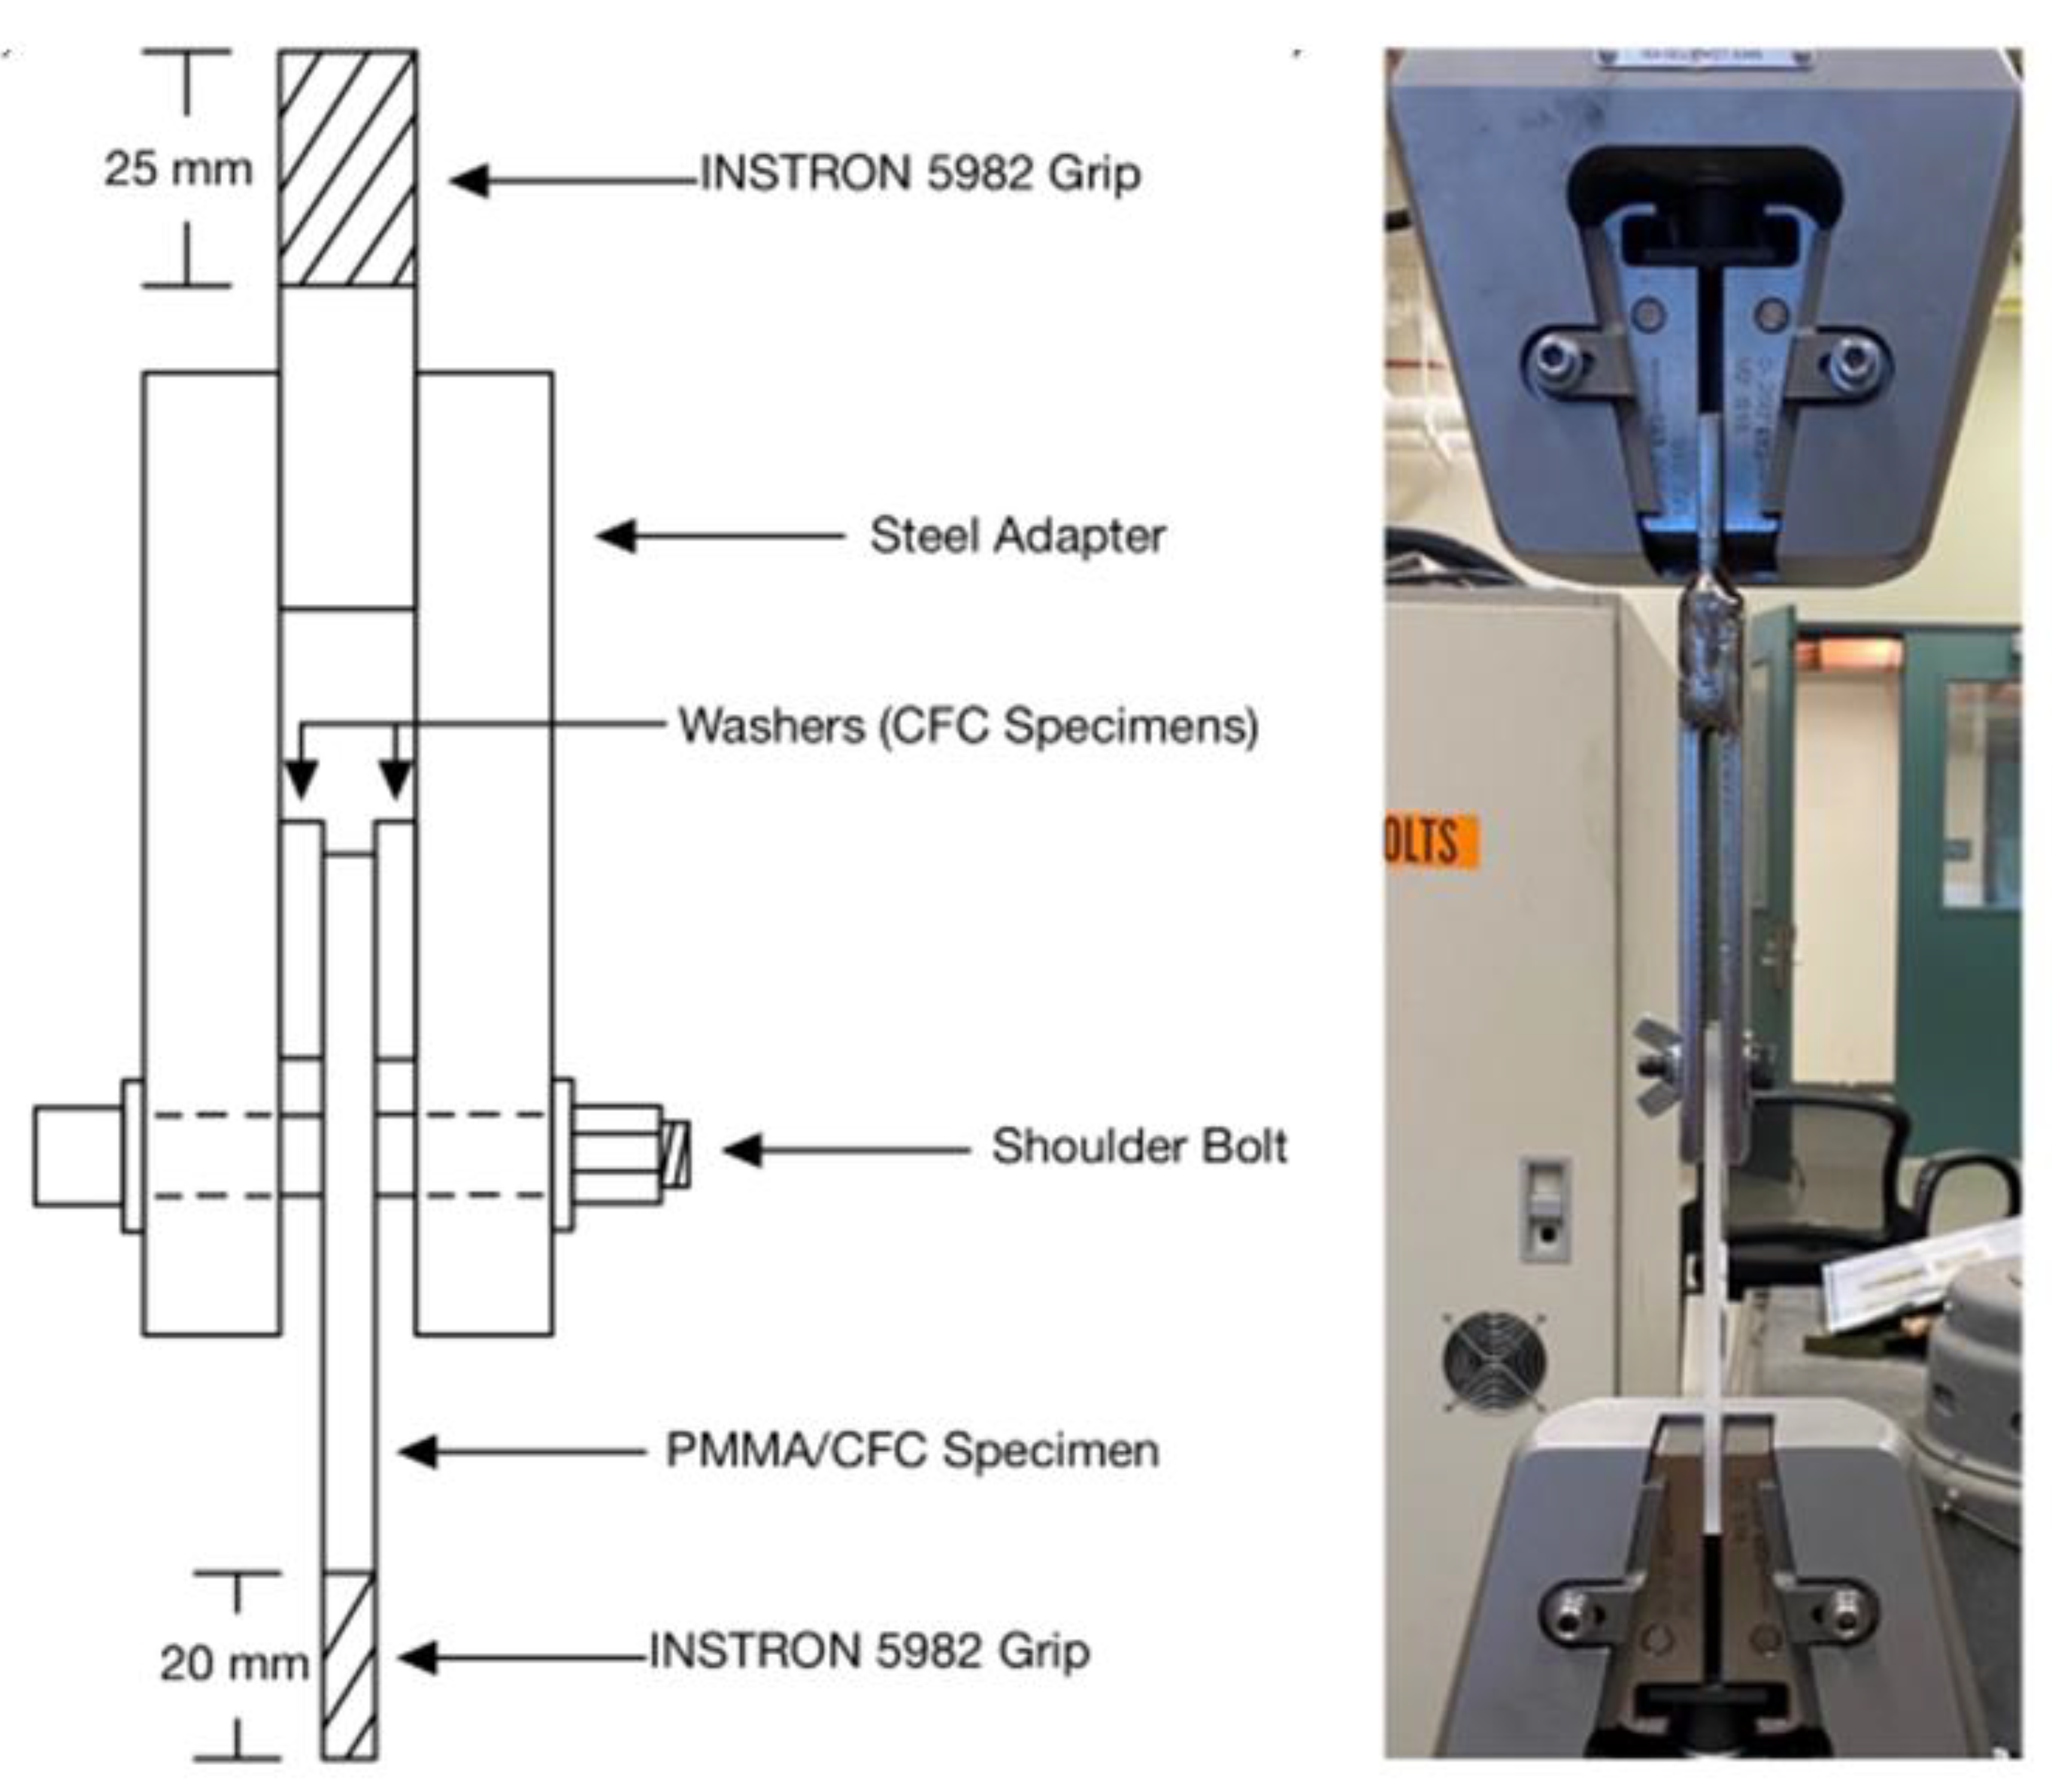
20], a 3D computer-aided design (CAD) software. Essentially, all PMMA specimens and pins used in the tensile/failure tests were initially modeled in SolidWorks and then imported into Ansys for FEA.
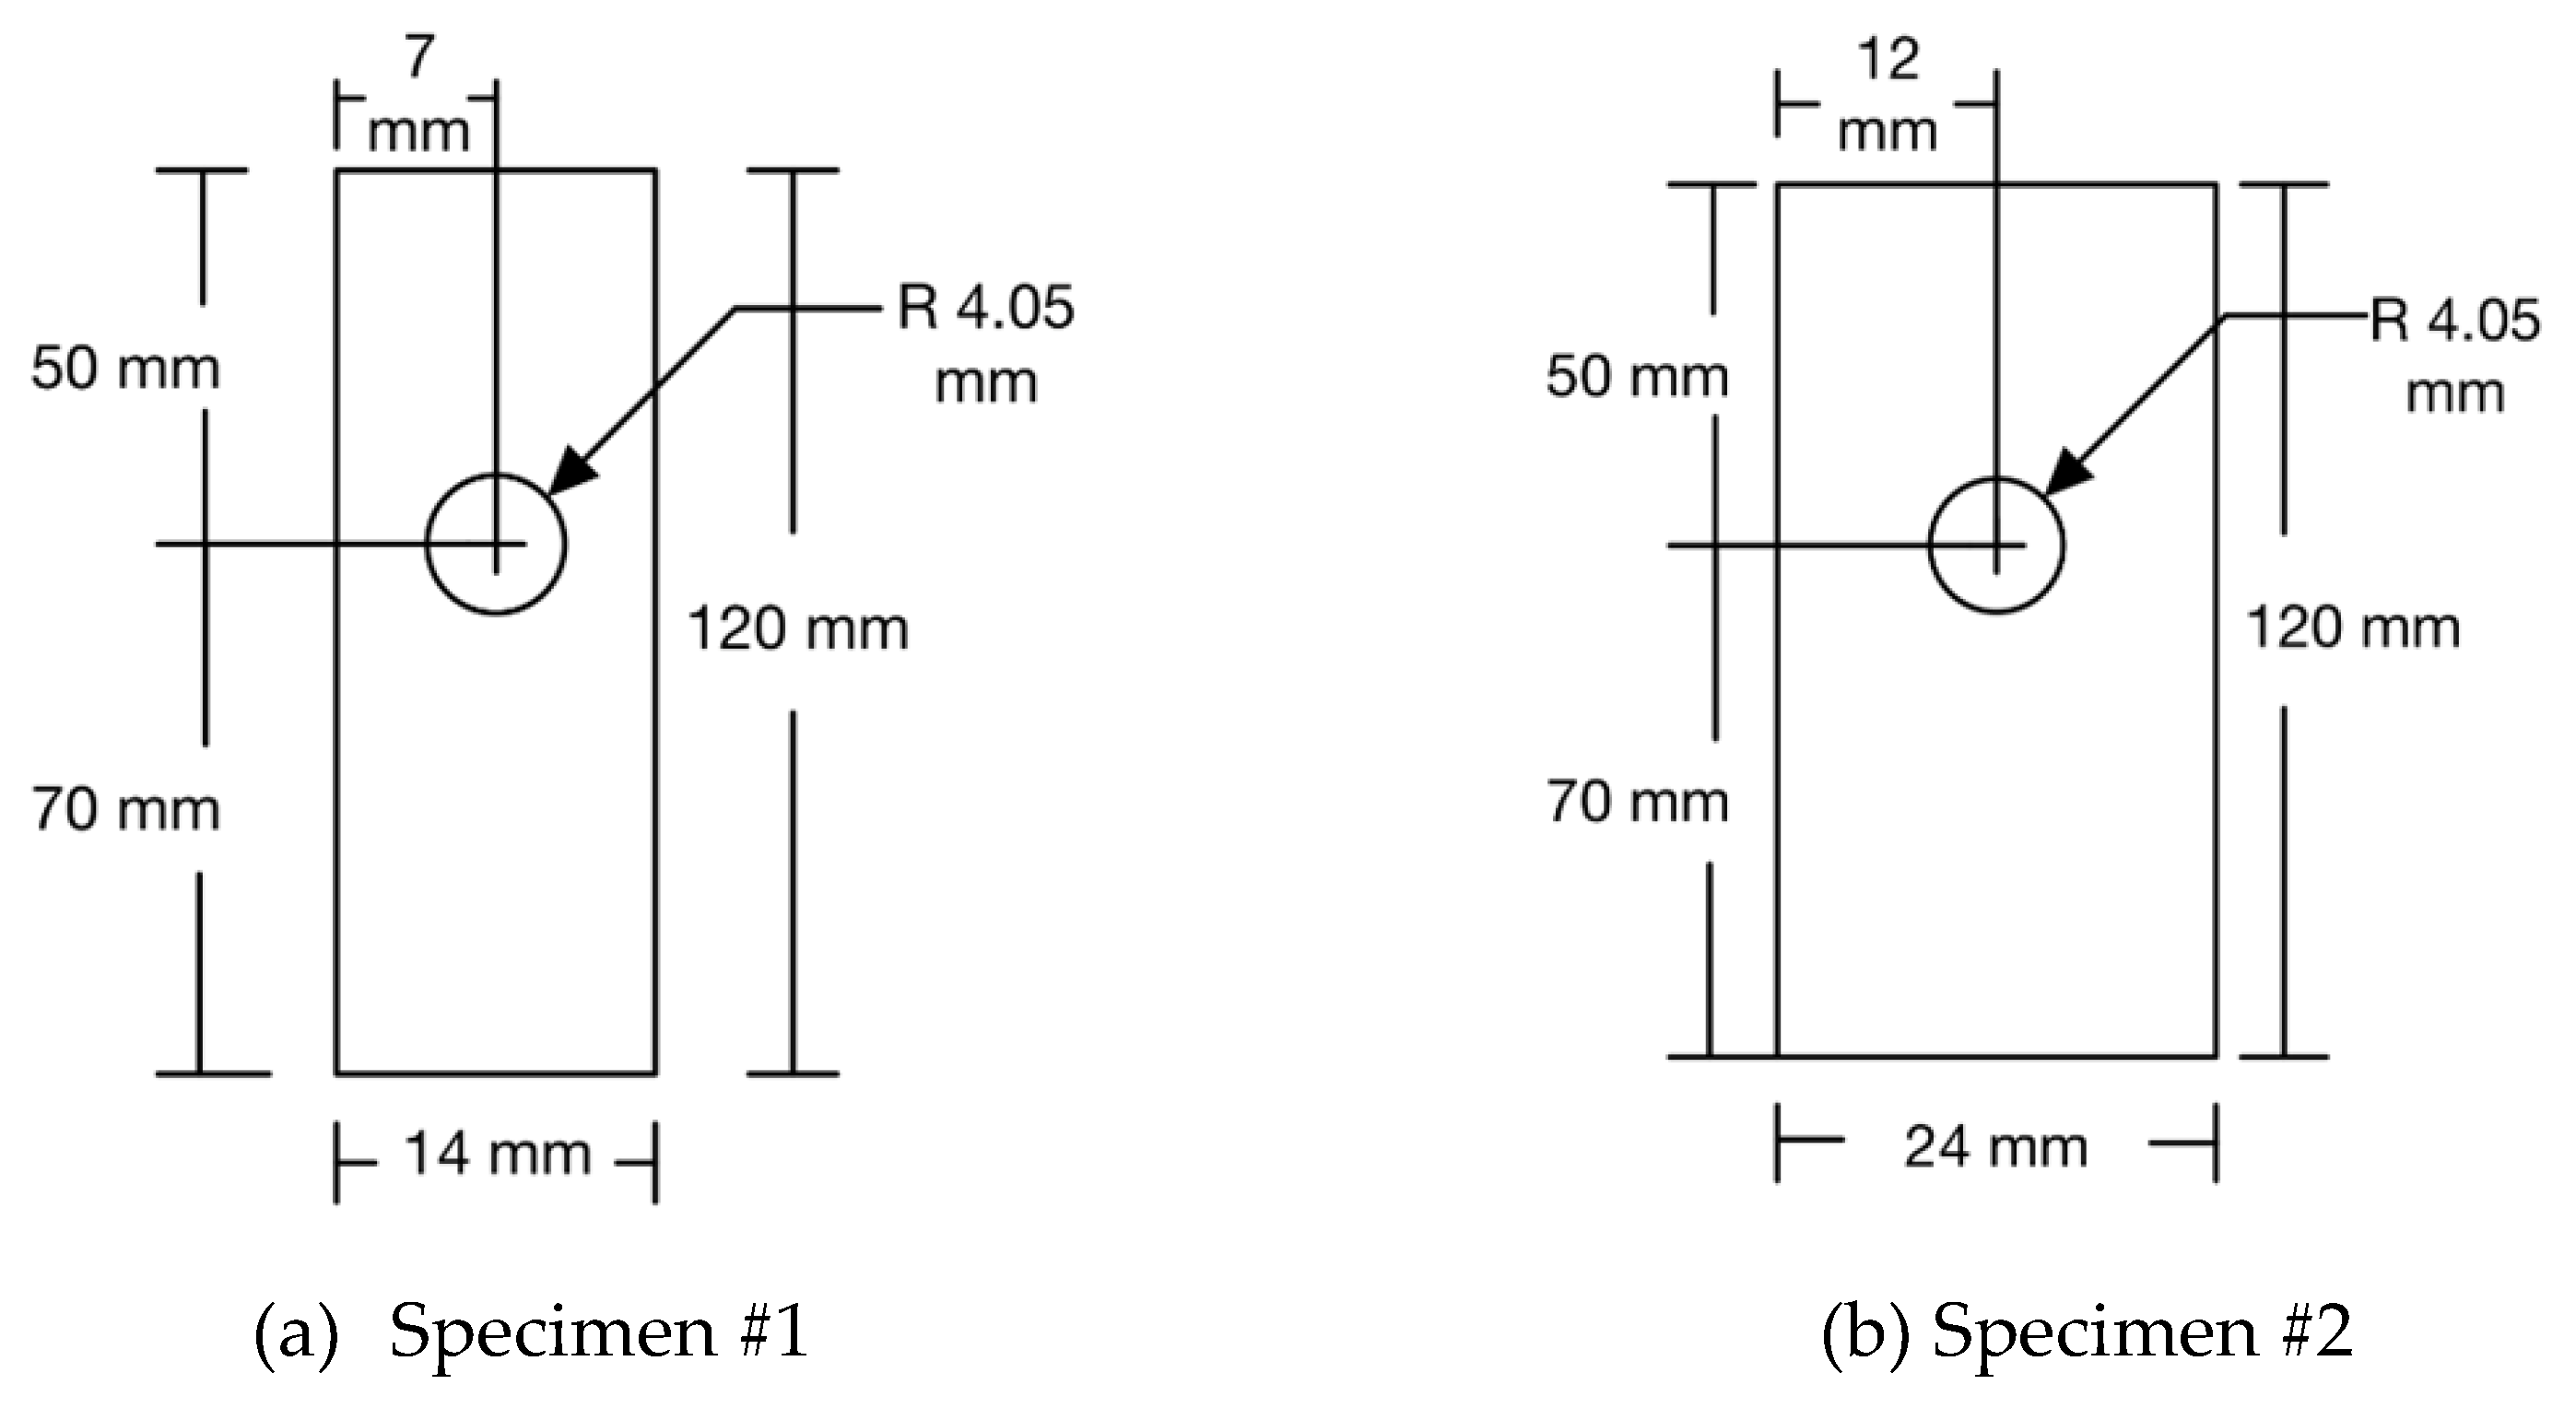
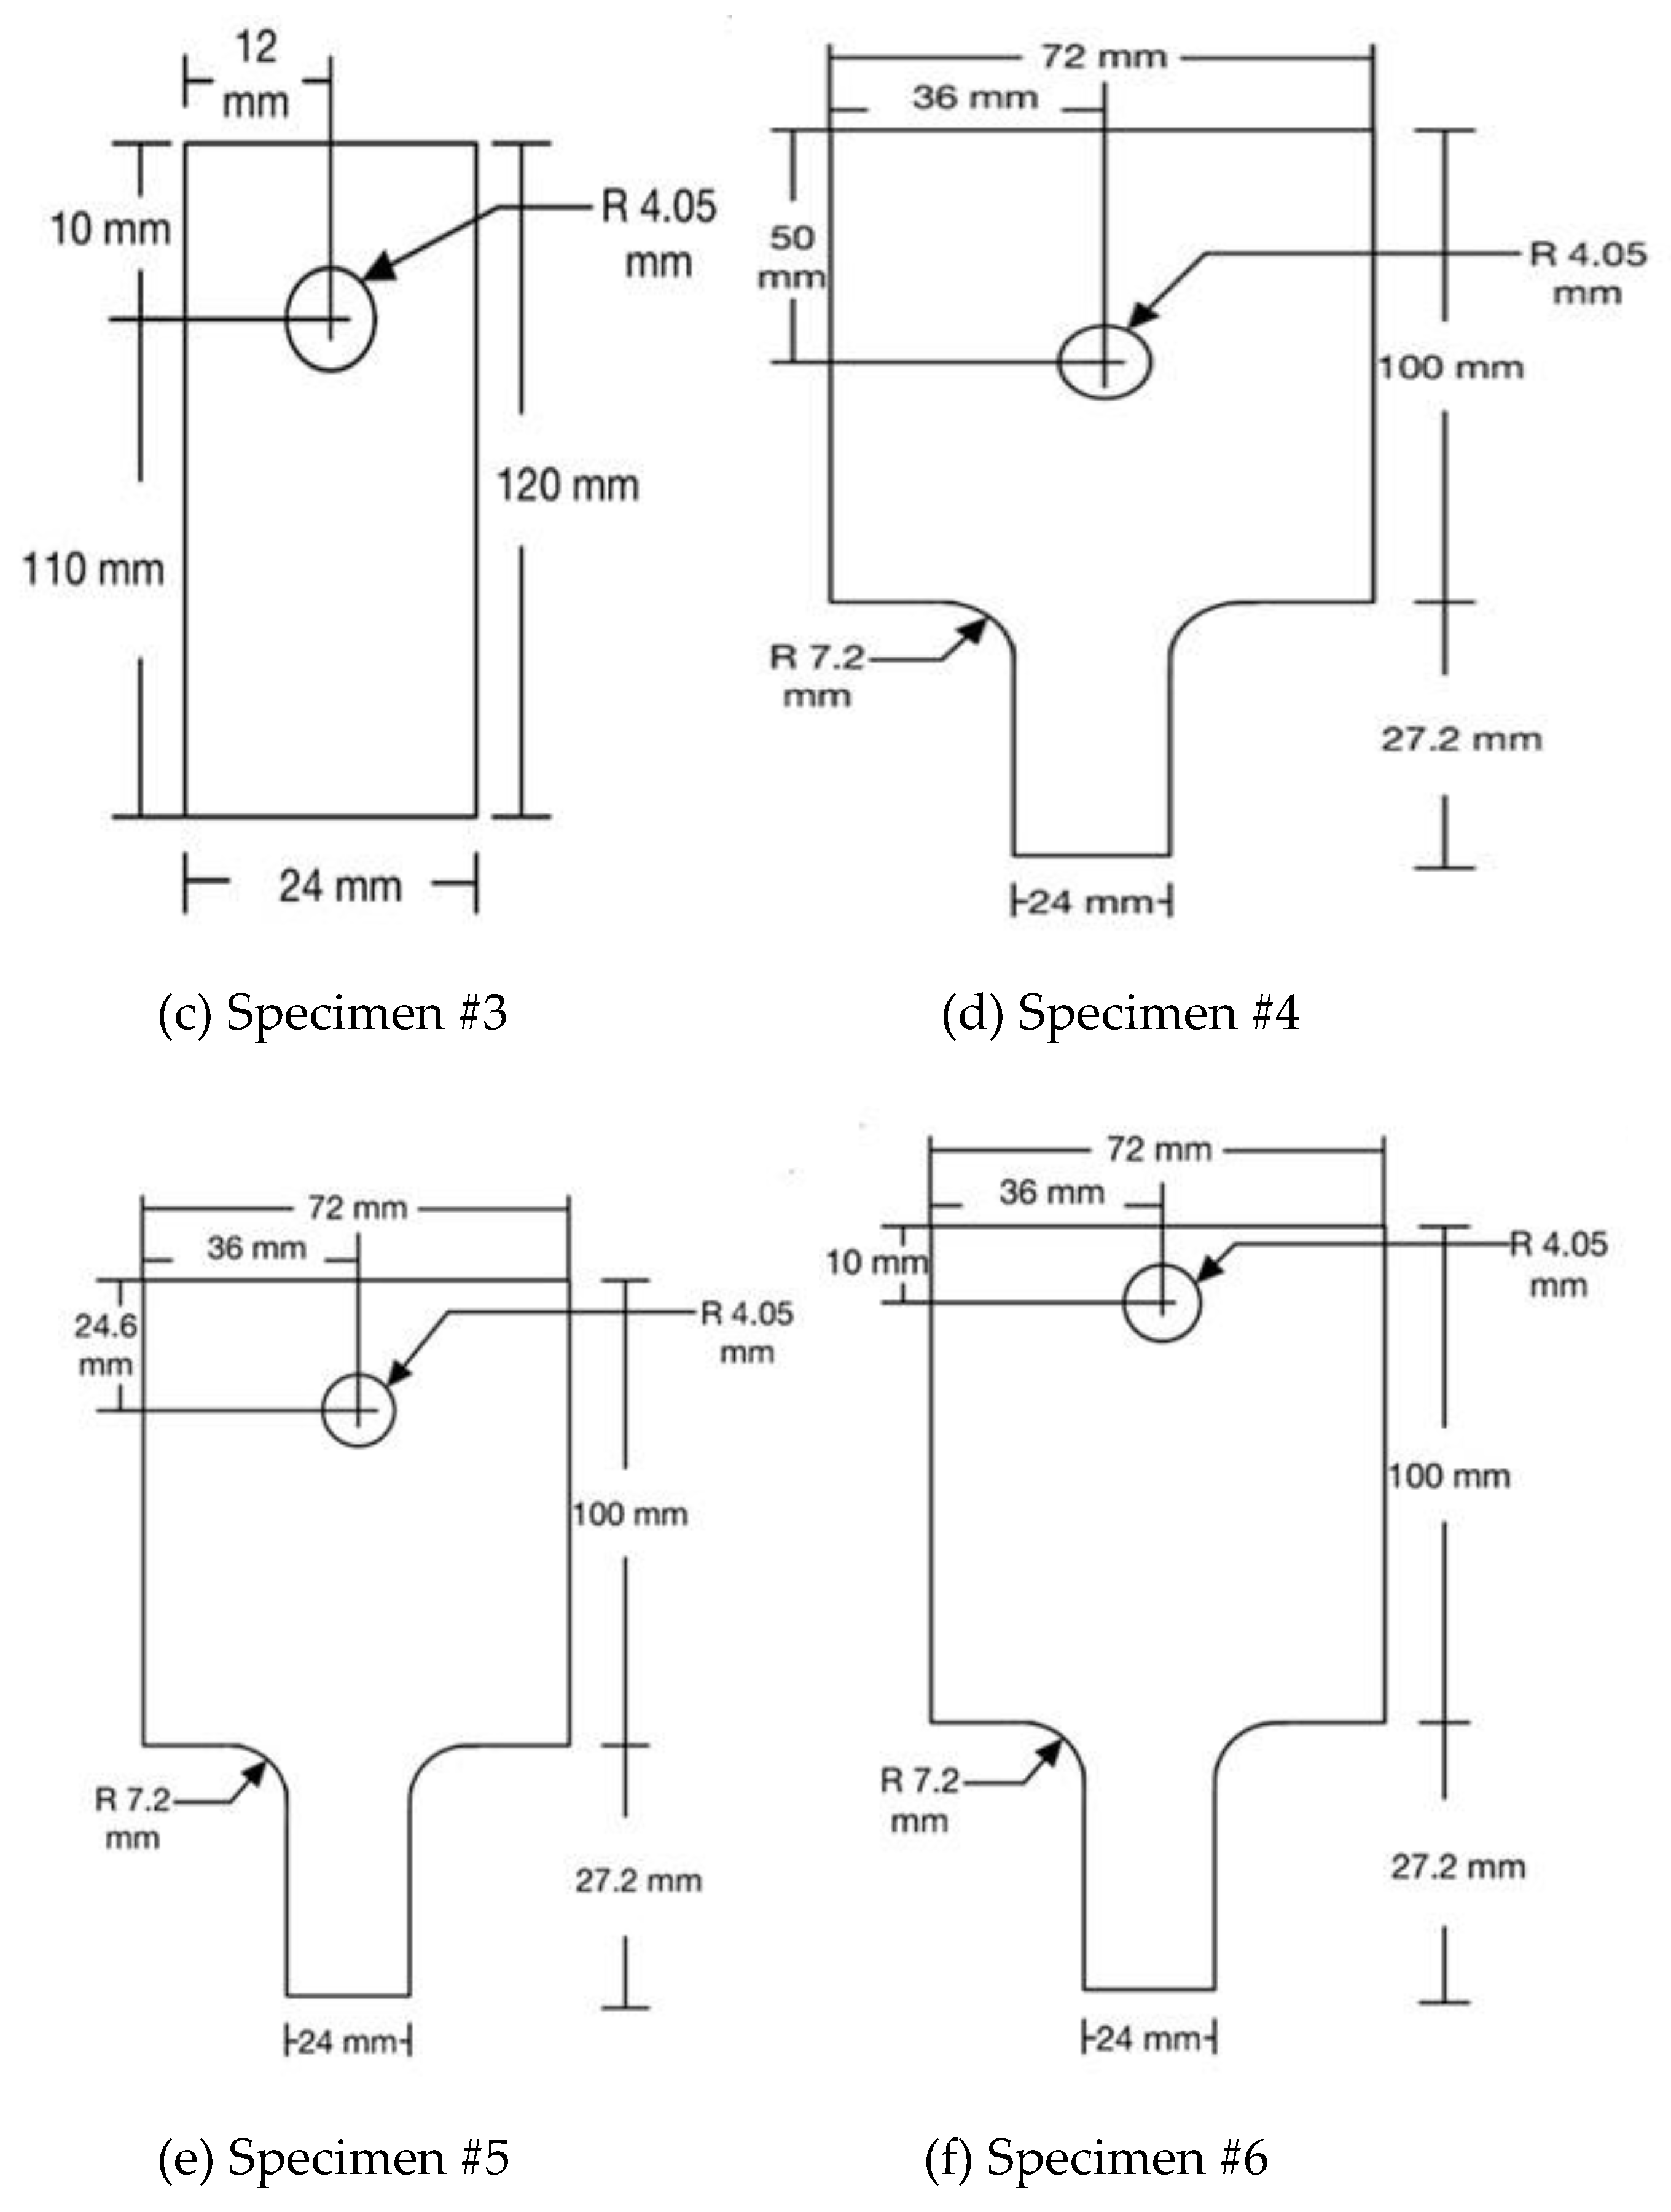
The PMMA parts were modeled with the dimensions provided in
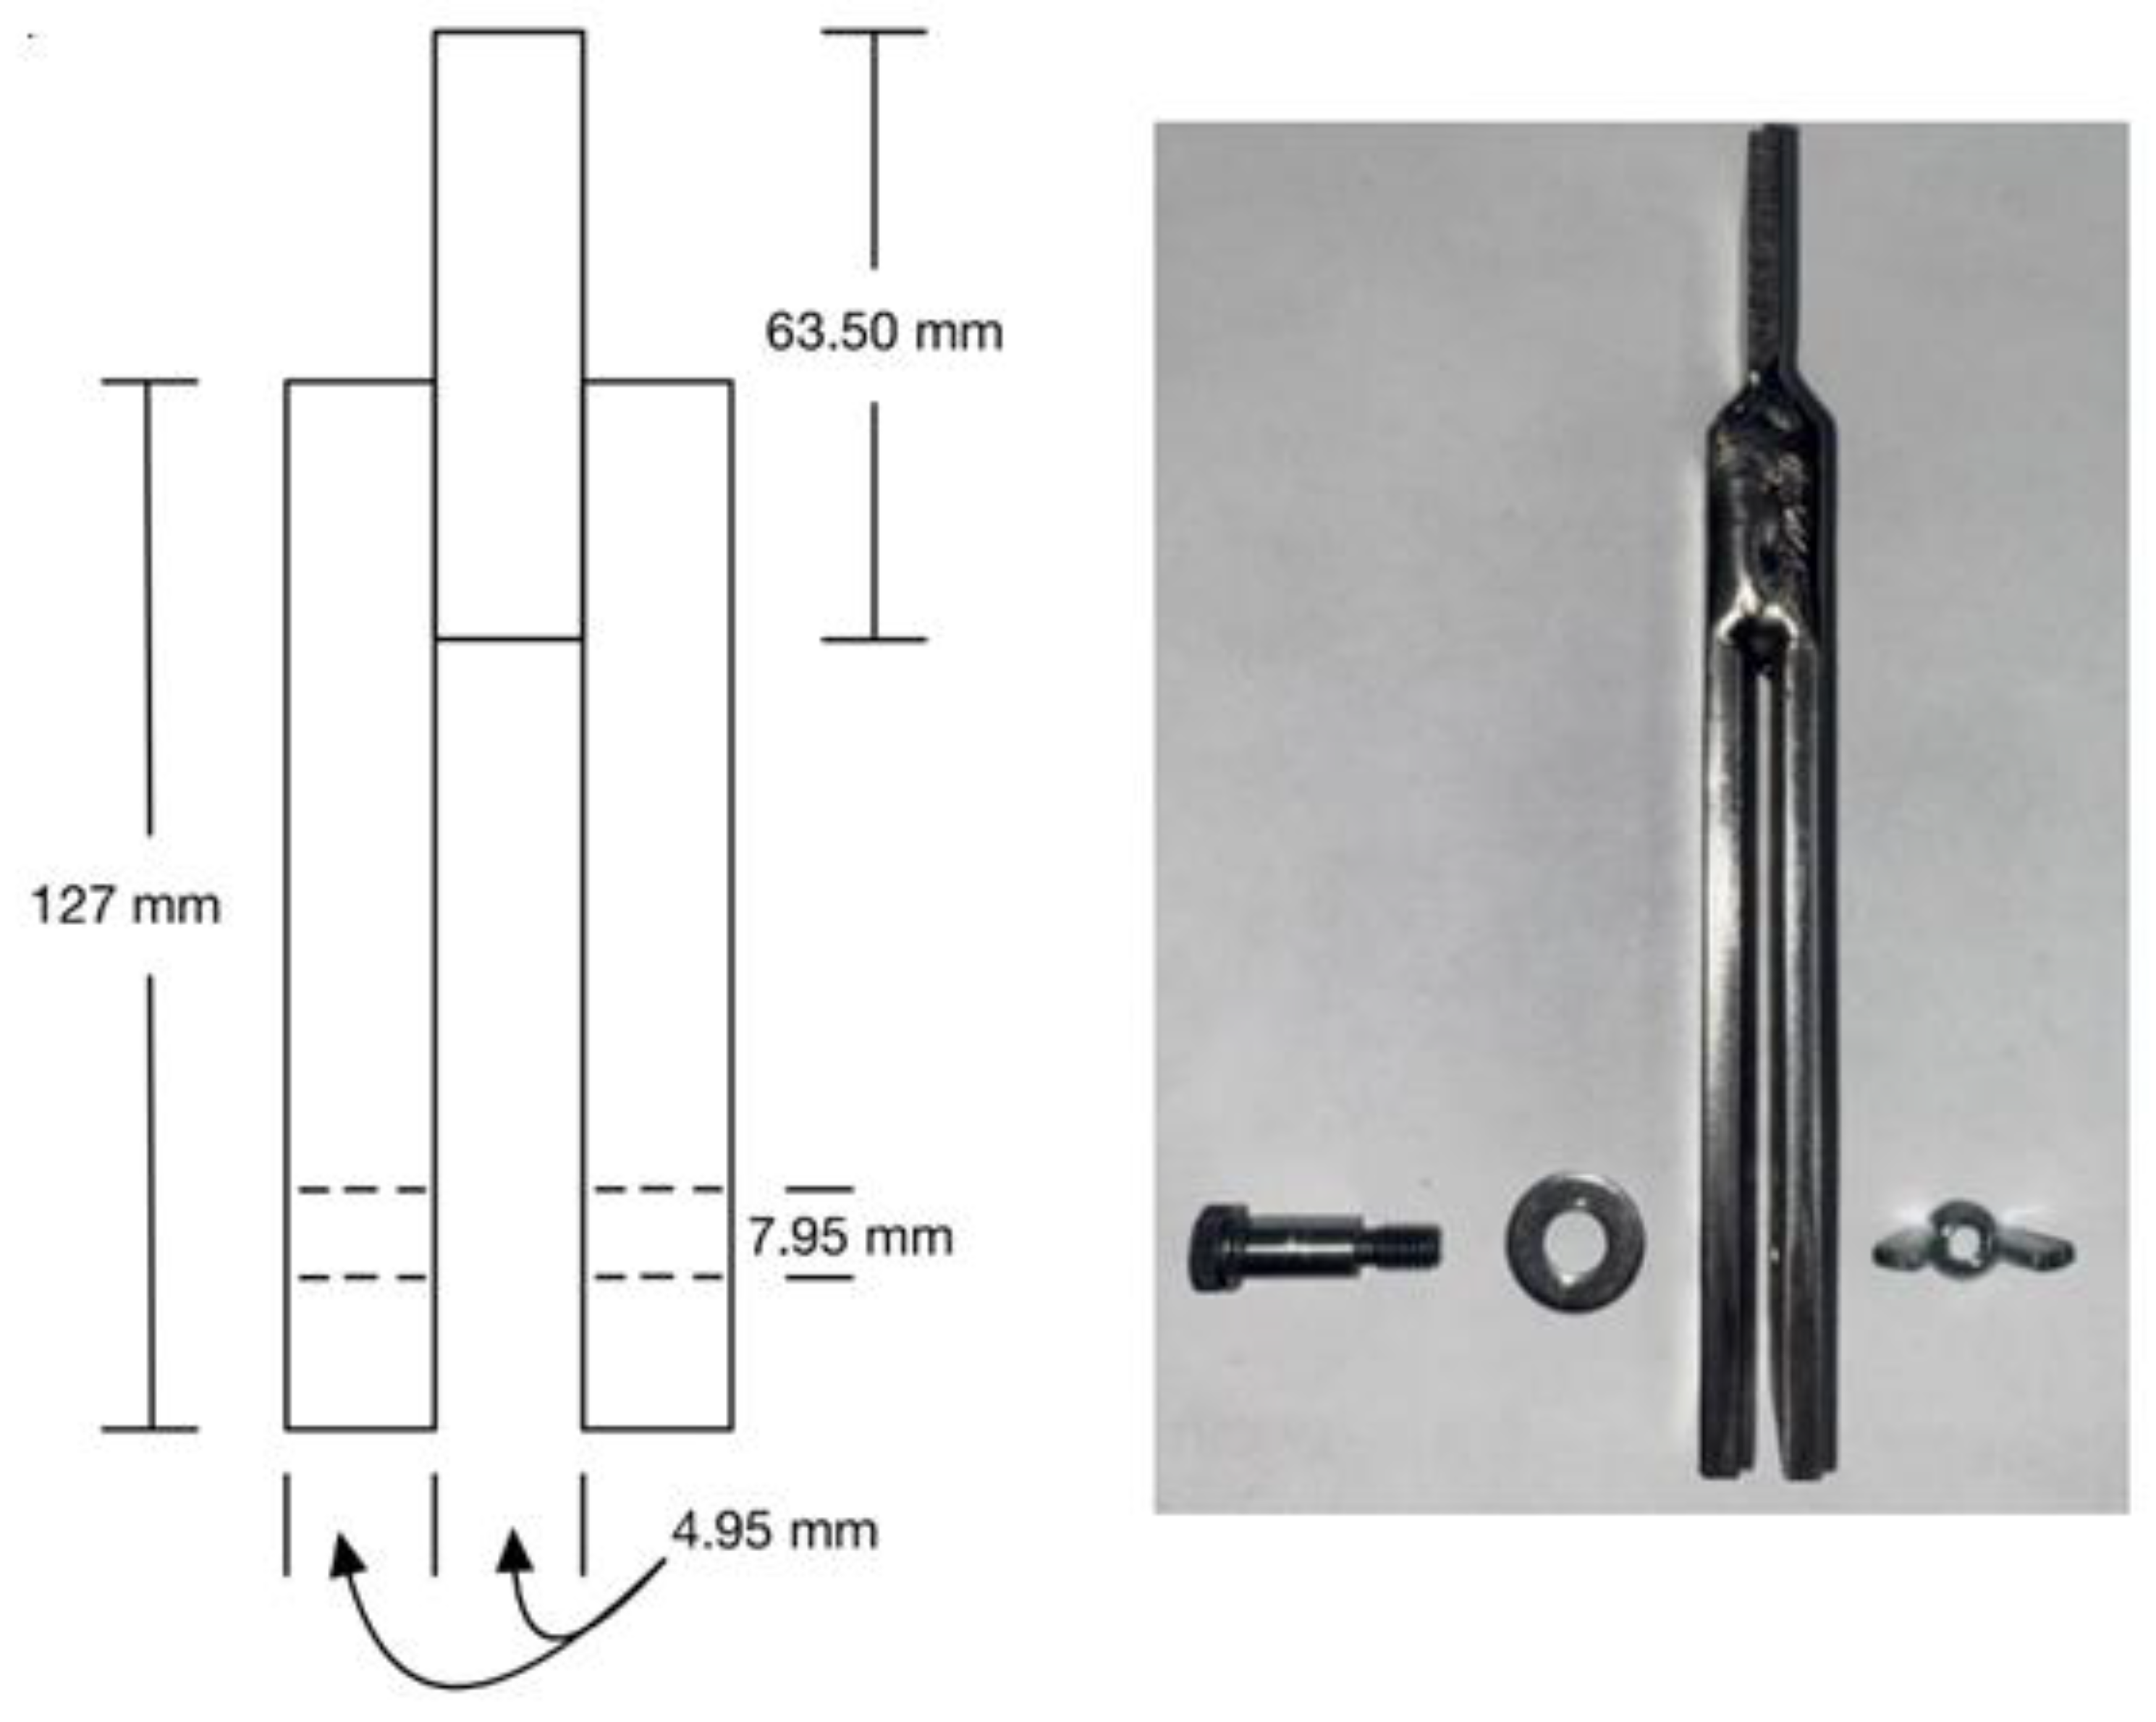
Figure 1. In addition, due to the variation in thickness amongst the specimens, a 4 mm thickness was used for all parts. The three pins of different diameters were all modeled with a length of 4.95 mm between the two vertical sections of the assembly. The nominal diameters of 8 mm, 6 mm, and 5 mm pins were modeled using their actual diameters of 7.87 mm, 5.97 mm, and 4.95 mm, respectively. The actual diameters were used in the FEA model to have a clearance between the 8 mm hole and the actual pins.
Both PMMA specimens and pins were modeled using eight-node solid finite elements. The material properties for PMMA, provided in a previous section, were used for the FEA model while pins were modeled as the structural steel with an elastic modulus of 210 GPa and Poisson’s ratio of 0.3.
A contact pair was created between the PMMA part and the pin. A frictional contact was selected, and a frictional coefficient of 0.2 was assumed [
21,
22]. Additionally, a Normal Lagrange contact formulation was utilized. Next, material constraints and loading were applied to the model. Fixed supports were added at both ends of the modeled pin, and a force was applied to the bottom face of the PMMA part which allowed only vertical motion.
Lastly, the model was solved, and the results were validated. Following solution convergence, penetration of the contact pair was examined to ensure negligible penetration between adjacent surfaces. Next, a mesh sensitivity study was conducted. Namely, more refined meshes were applied to the model until a minimal stress variation was observed. From the mesh sensitivity study, the total number of solid elements selected for each FEA model was between 100,000 and 500,000 depending on the specimen sizes.
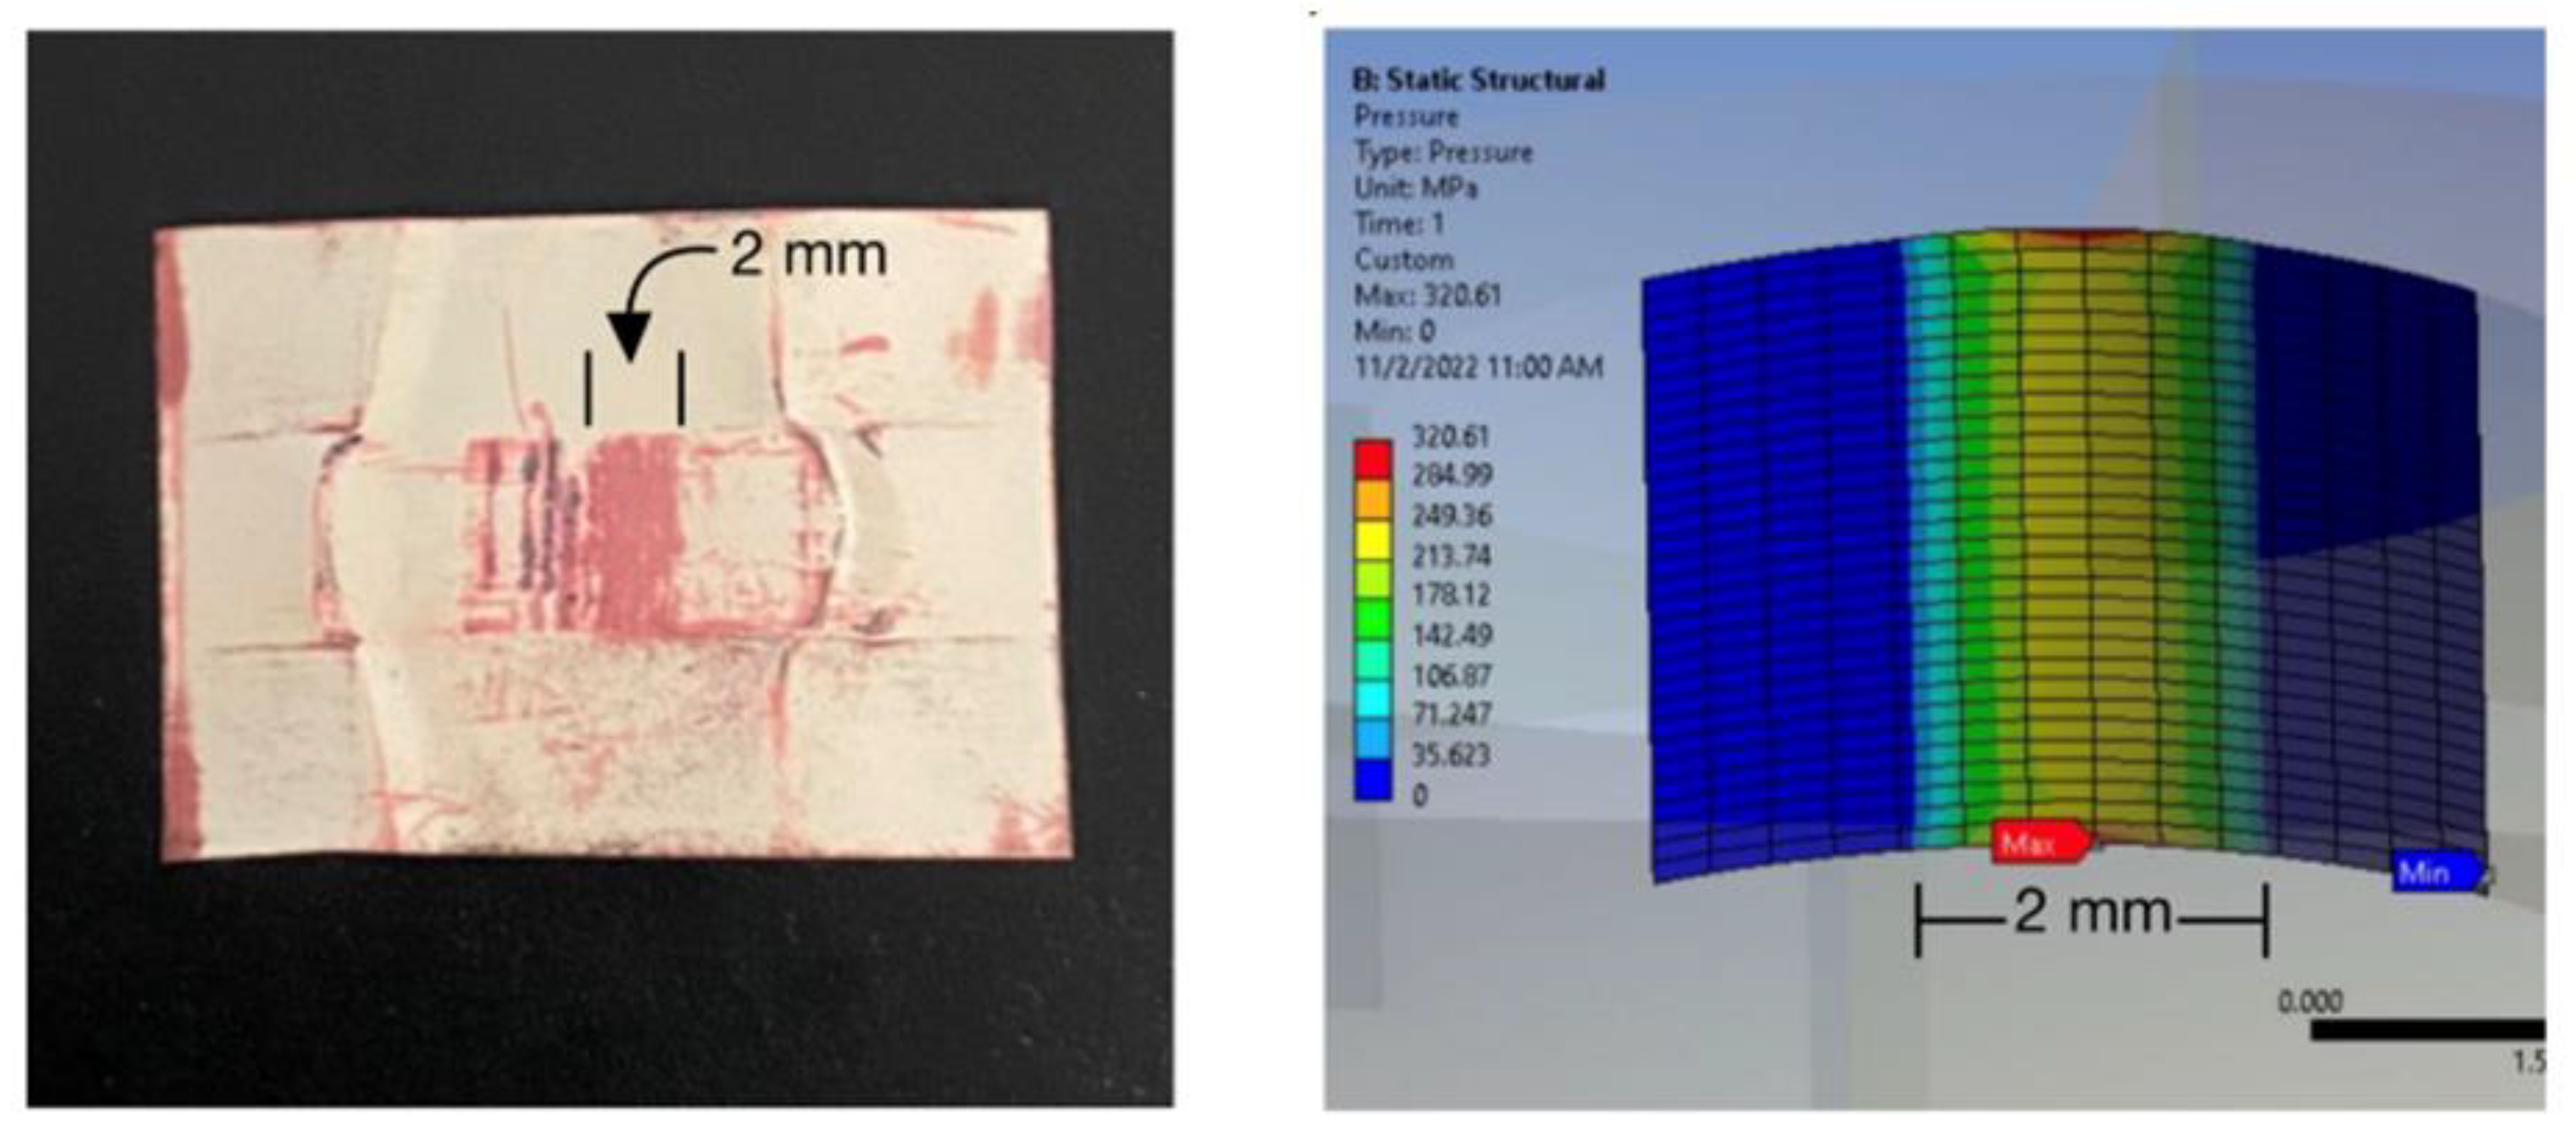
A thin film of pressure sensor [
23] was also used to capture the contact area between Specimen #6 and the 5 mm pin during tensile/failure testing. As shown in
Figure 4, the pressure sensor and the Ansys model produced similar contact areas. This confirmed that the contact model was acceptable.
5. Results and Discussion
This section compares the failure loads (or failure stresses), failure locations, and the initial paths of various PMMA specimens loaded using an inserted pin between the experimental results and the predictions made using the recently developed universal failure criteria [
15,
16,
17,
18]. The experimental values are the average of the same geometry of multiple specimens with the same size of pin unless mentioned otherwise. The experimental tests provided the failure loads of all specimens. However, the local deformation or strains near the failure zone could not be measured directly because the critical locations lie behind the test setup. As a result, the failure stresses were determined using the finite element analysis where the failure load was applied to the specimen in the same condition as the test setup.
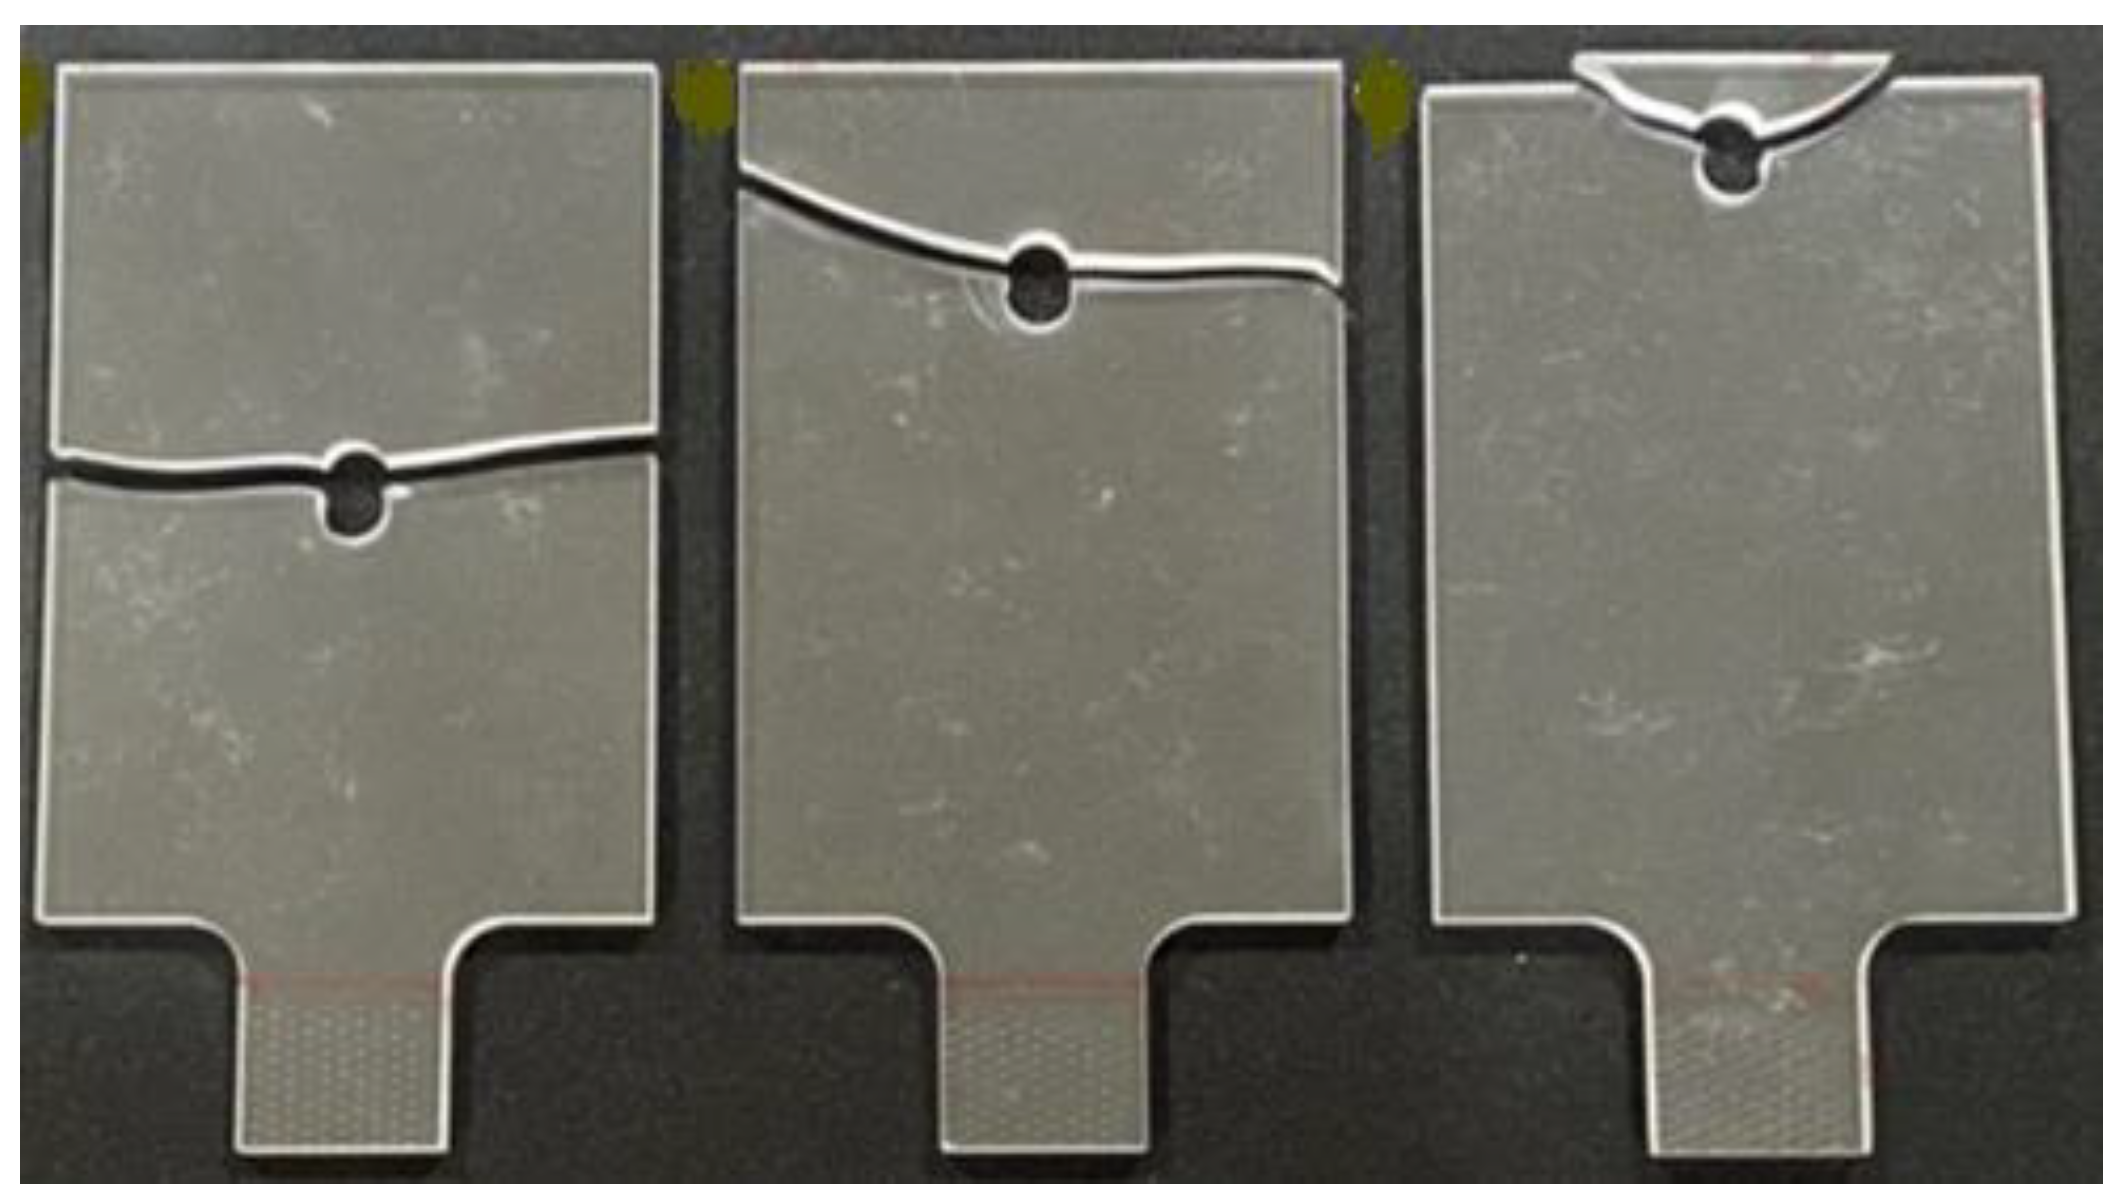
Specimens #1, #2, and #3 experienced fractures like notched samples under remote uniaxial tensile loading.
Figure 5 shows the failed Specimens #1 through #3 using the 8 mm pin. A quick visual inspection suggests that fracture initiates at the edge of the hole with the minimum cross-section. The initial fraction path was nearly perpendicular to the loading direction. This kind of fracture was also observed for perforated specimens with remote tensile loading. Additionally, the difference in pin diameters appears to have a minor effect on the site of fracture initiation and crack propagation direction.
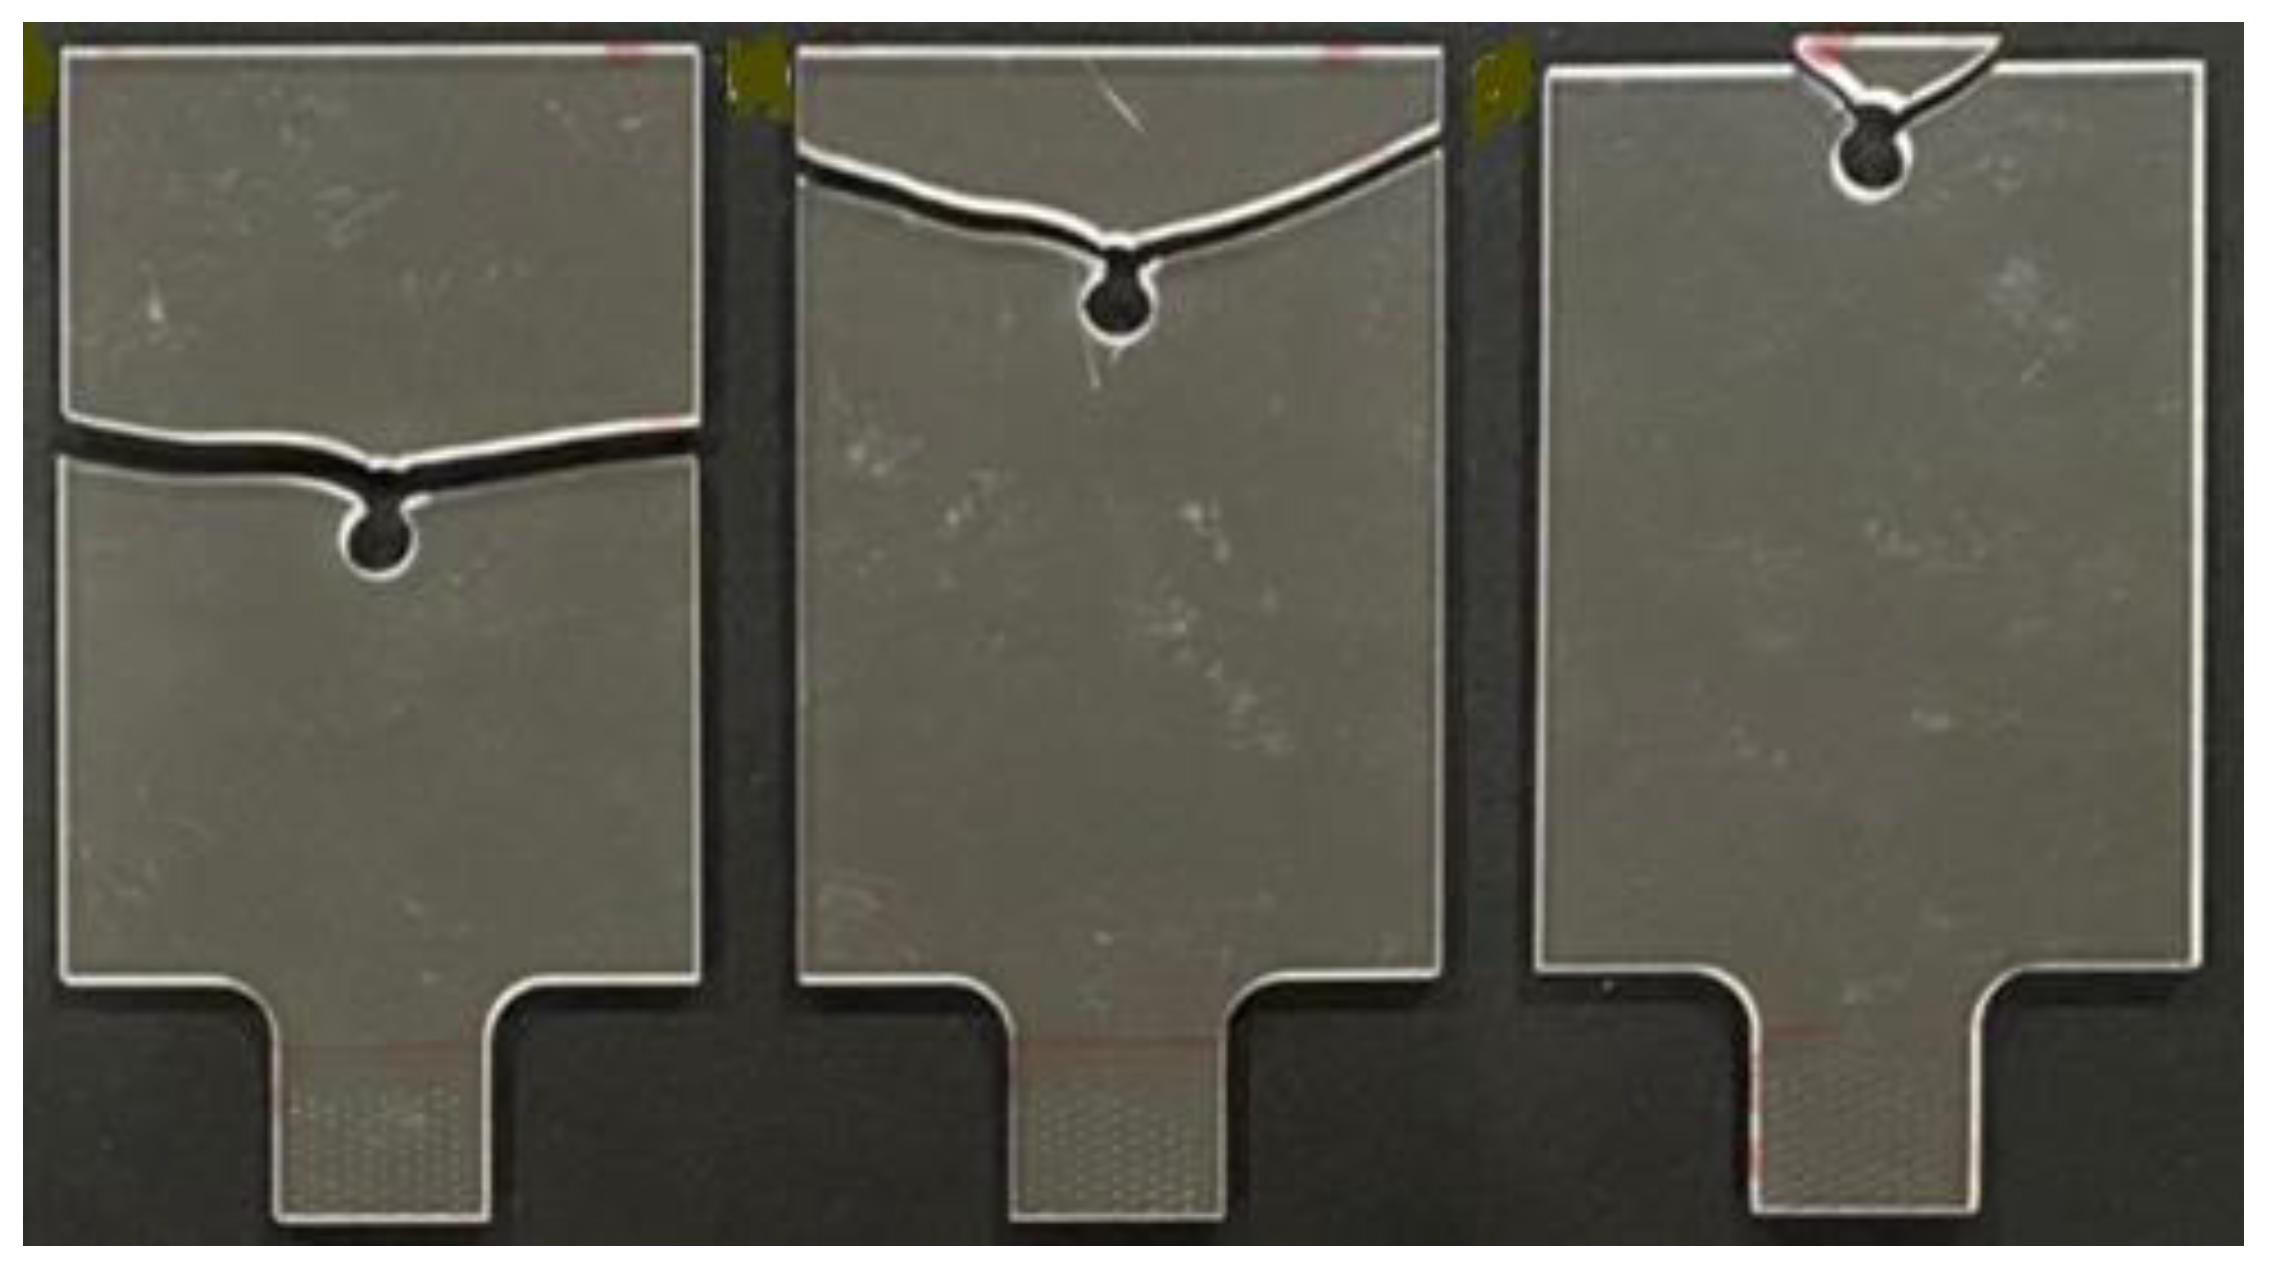
Unlike Specimens #1, #2, and #3, the fractures of Specimens #4, #5, and #6 are easily observed at a location other than the minimum cross-section across the notch as shown in
Figure 6 and
Figure 7. There is also a difference in the fracture initiation location and crack propagation path for the wider specimens loaded with the 8 mm pin versus the 5 mm pin.
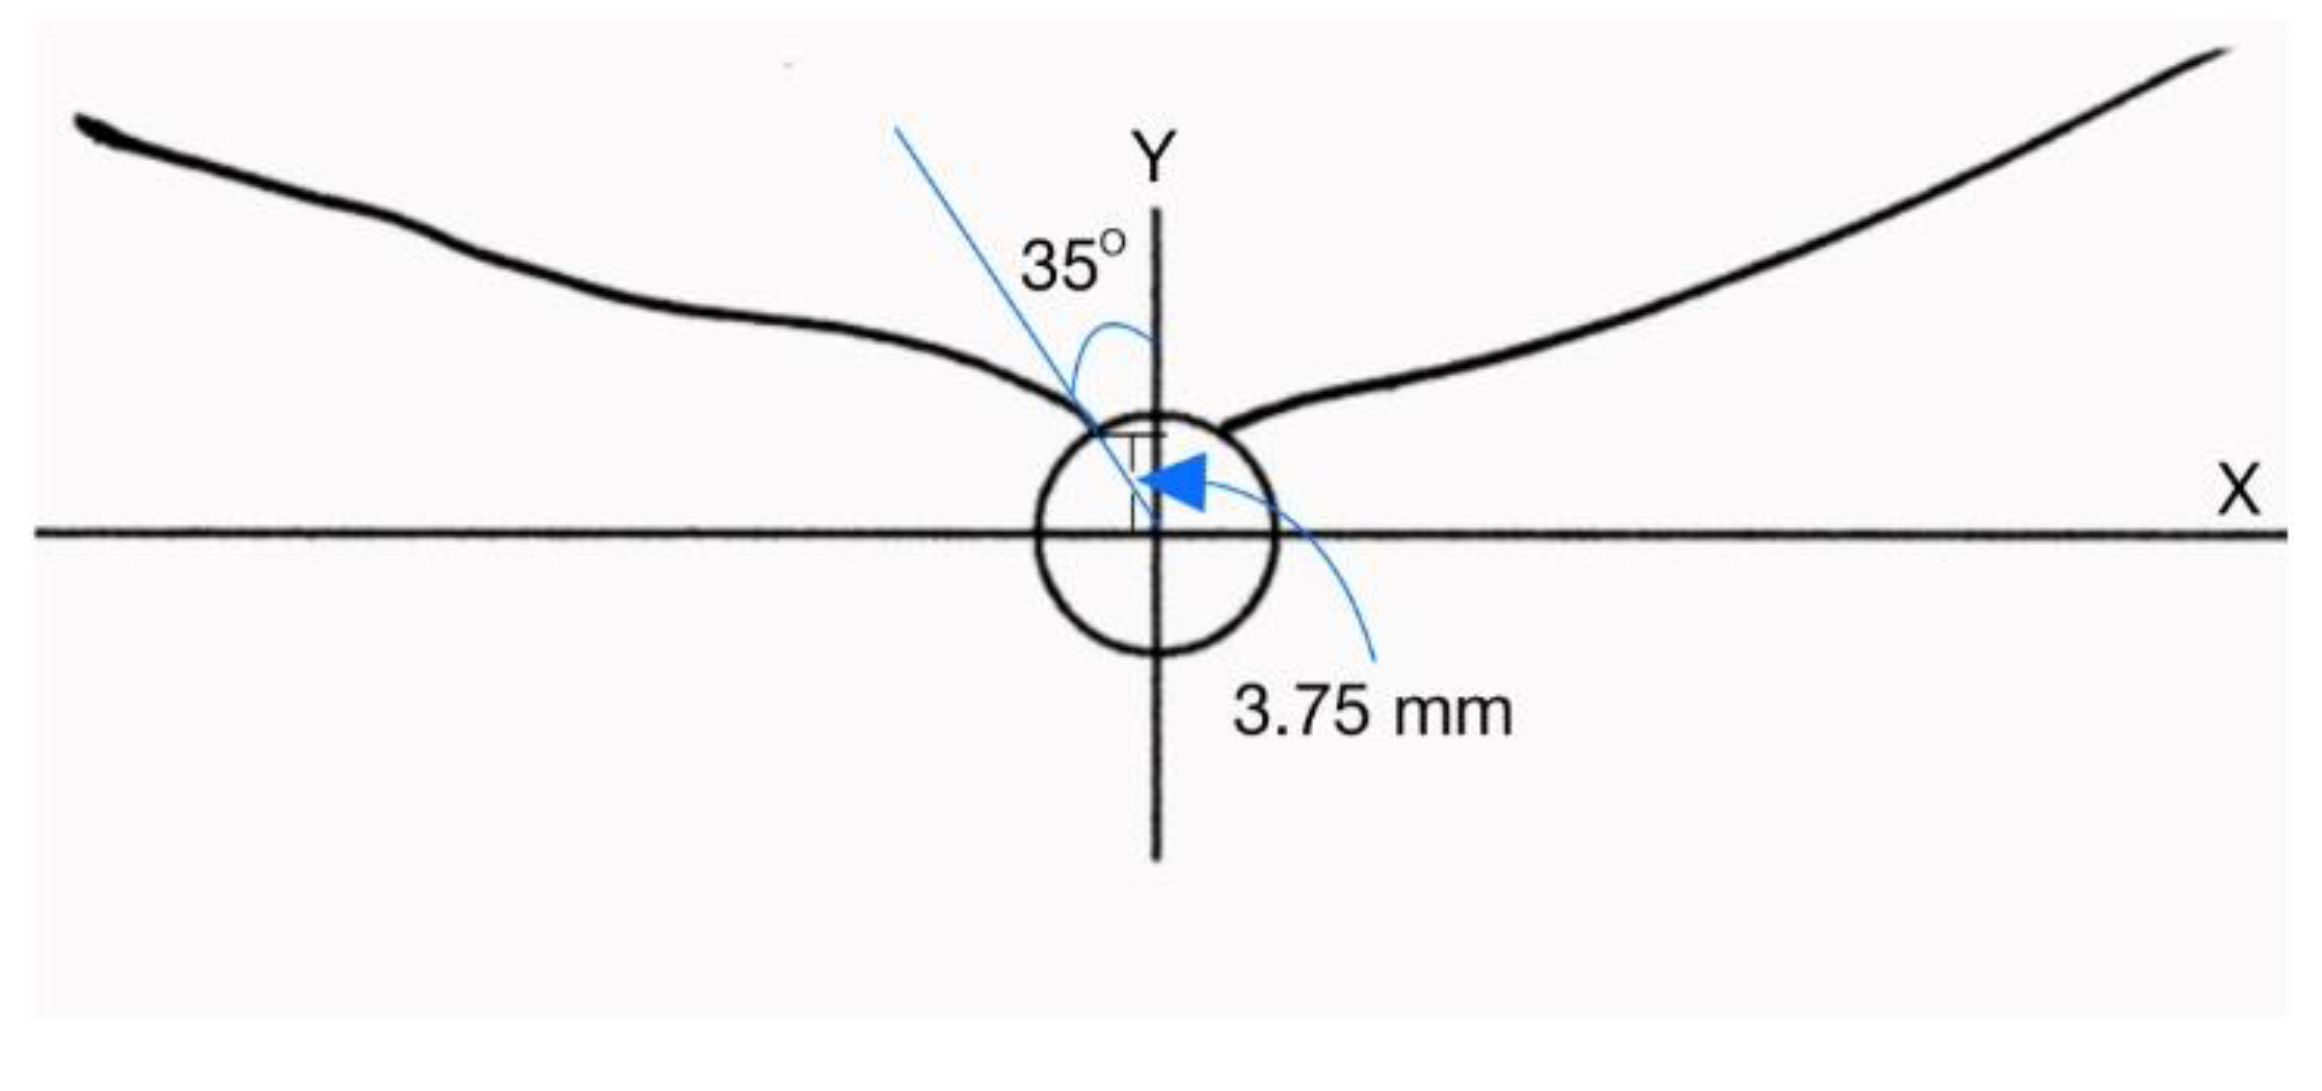
Aside from the visual inspection, a more thorough quantitative analysis of the fracture initiation location and the crack path was conducted for all specimens using templates. Templates were used so that the fracture profiles could be traced, and their measurements could be taken. As shown in
Figure 8, using a ruler and protractor, the fracture location and initial crack angle were determined with respect to the Y-axis which is along the loading direction.
Table 1 provides the results of the analysis.
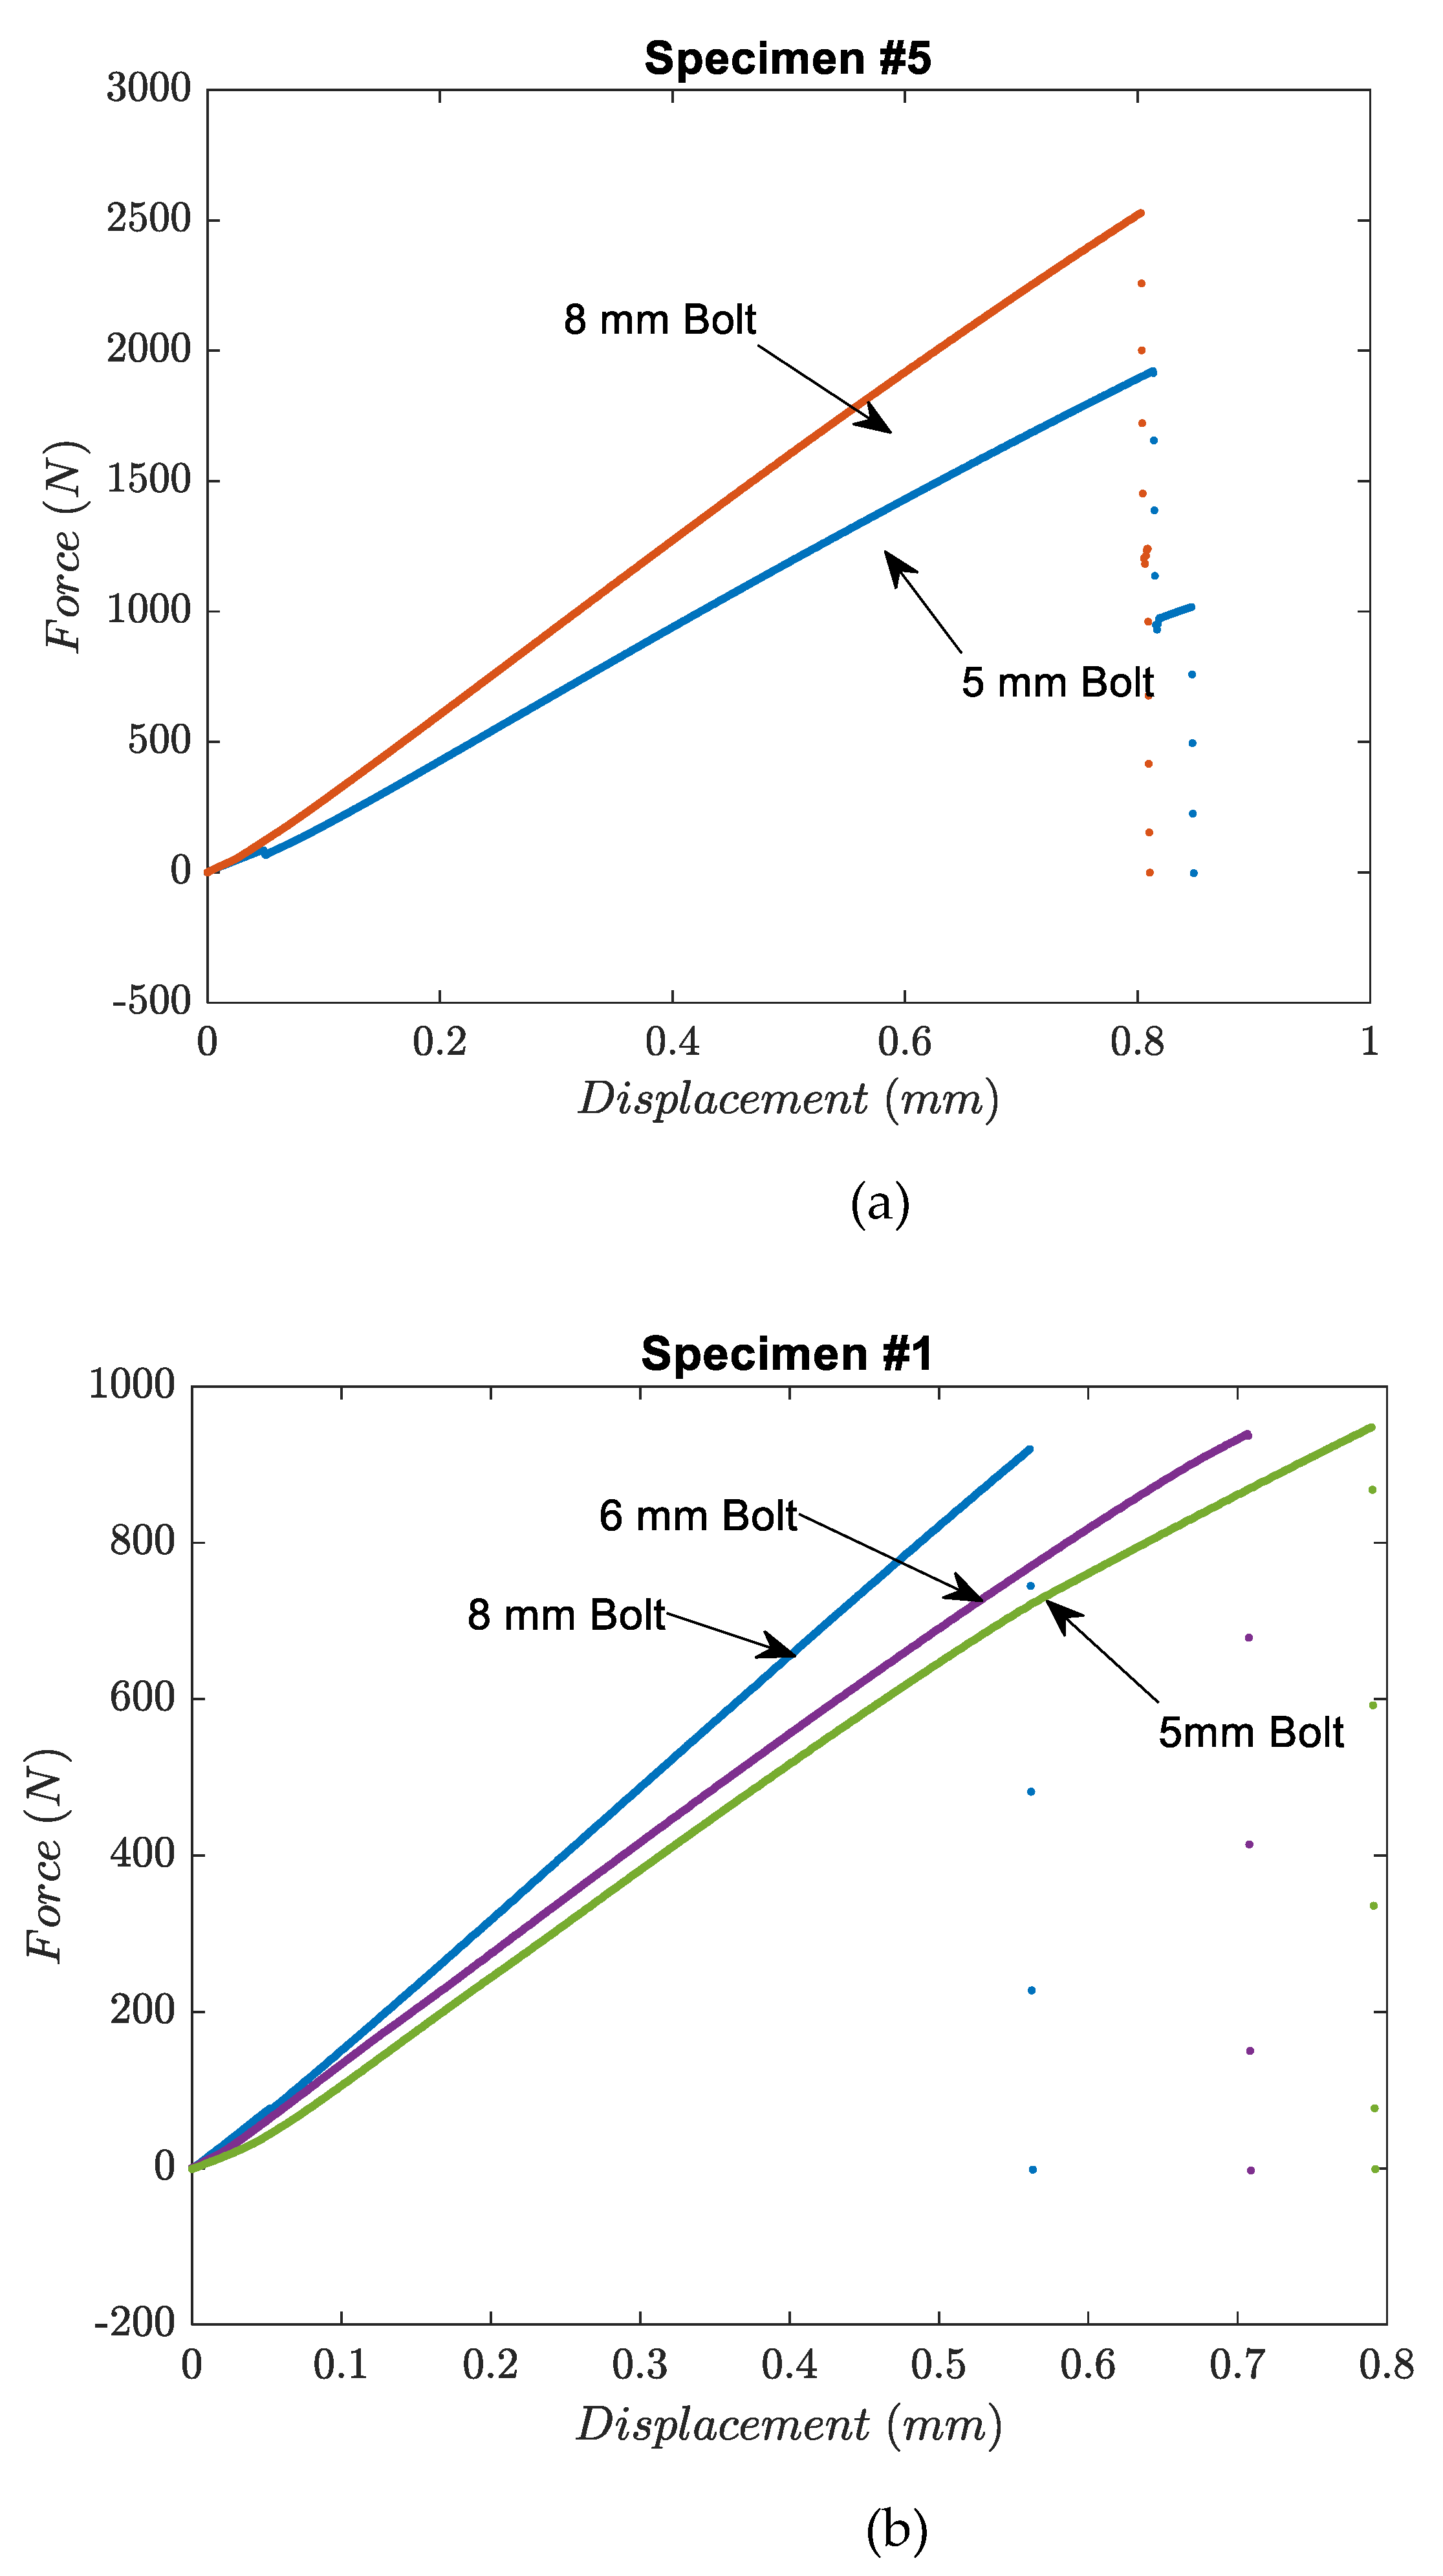
Data obtained from the tensile tests revealed that less force is required, in general, to fracture PMMA specimens when a smaller pin diameter is utilized. For the same applied force, the smaller contact area associated with a smaller pin diameter induces higher localized stresses in the material. Therefore, material failure occurs at reduced loading when the pin diameter is decreased, or the clearance is increased. It becomes readily apparent when reviewing the results for Specimen #5 that less force is required for a smaller pin diameter as shown in
Figure 9(a). However, it appears that the failure force is less dependent on the pin diameter for Specimen #1 as seen in
Figure 9(b). The discrepancy in Specimen #1 may be attributed to the small cross-sectional area adjacent to the notch which is also located a significant distance away from the boundaries normal to the loading direction. This resulted in fracture at or very close to the edge of the hole across the minimum cross-section as indicated in
Table 1. In other words, the size of the pin for Specimen #1 had a negligible effect on the location of failure initiation.
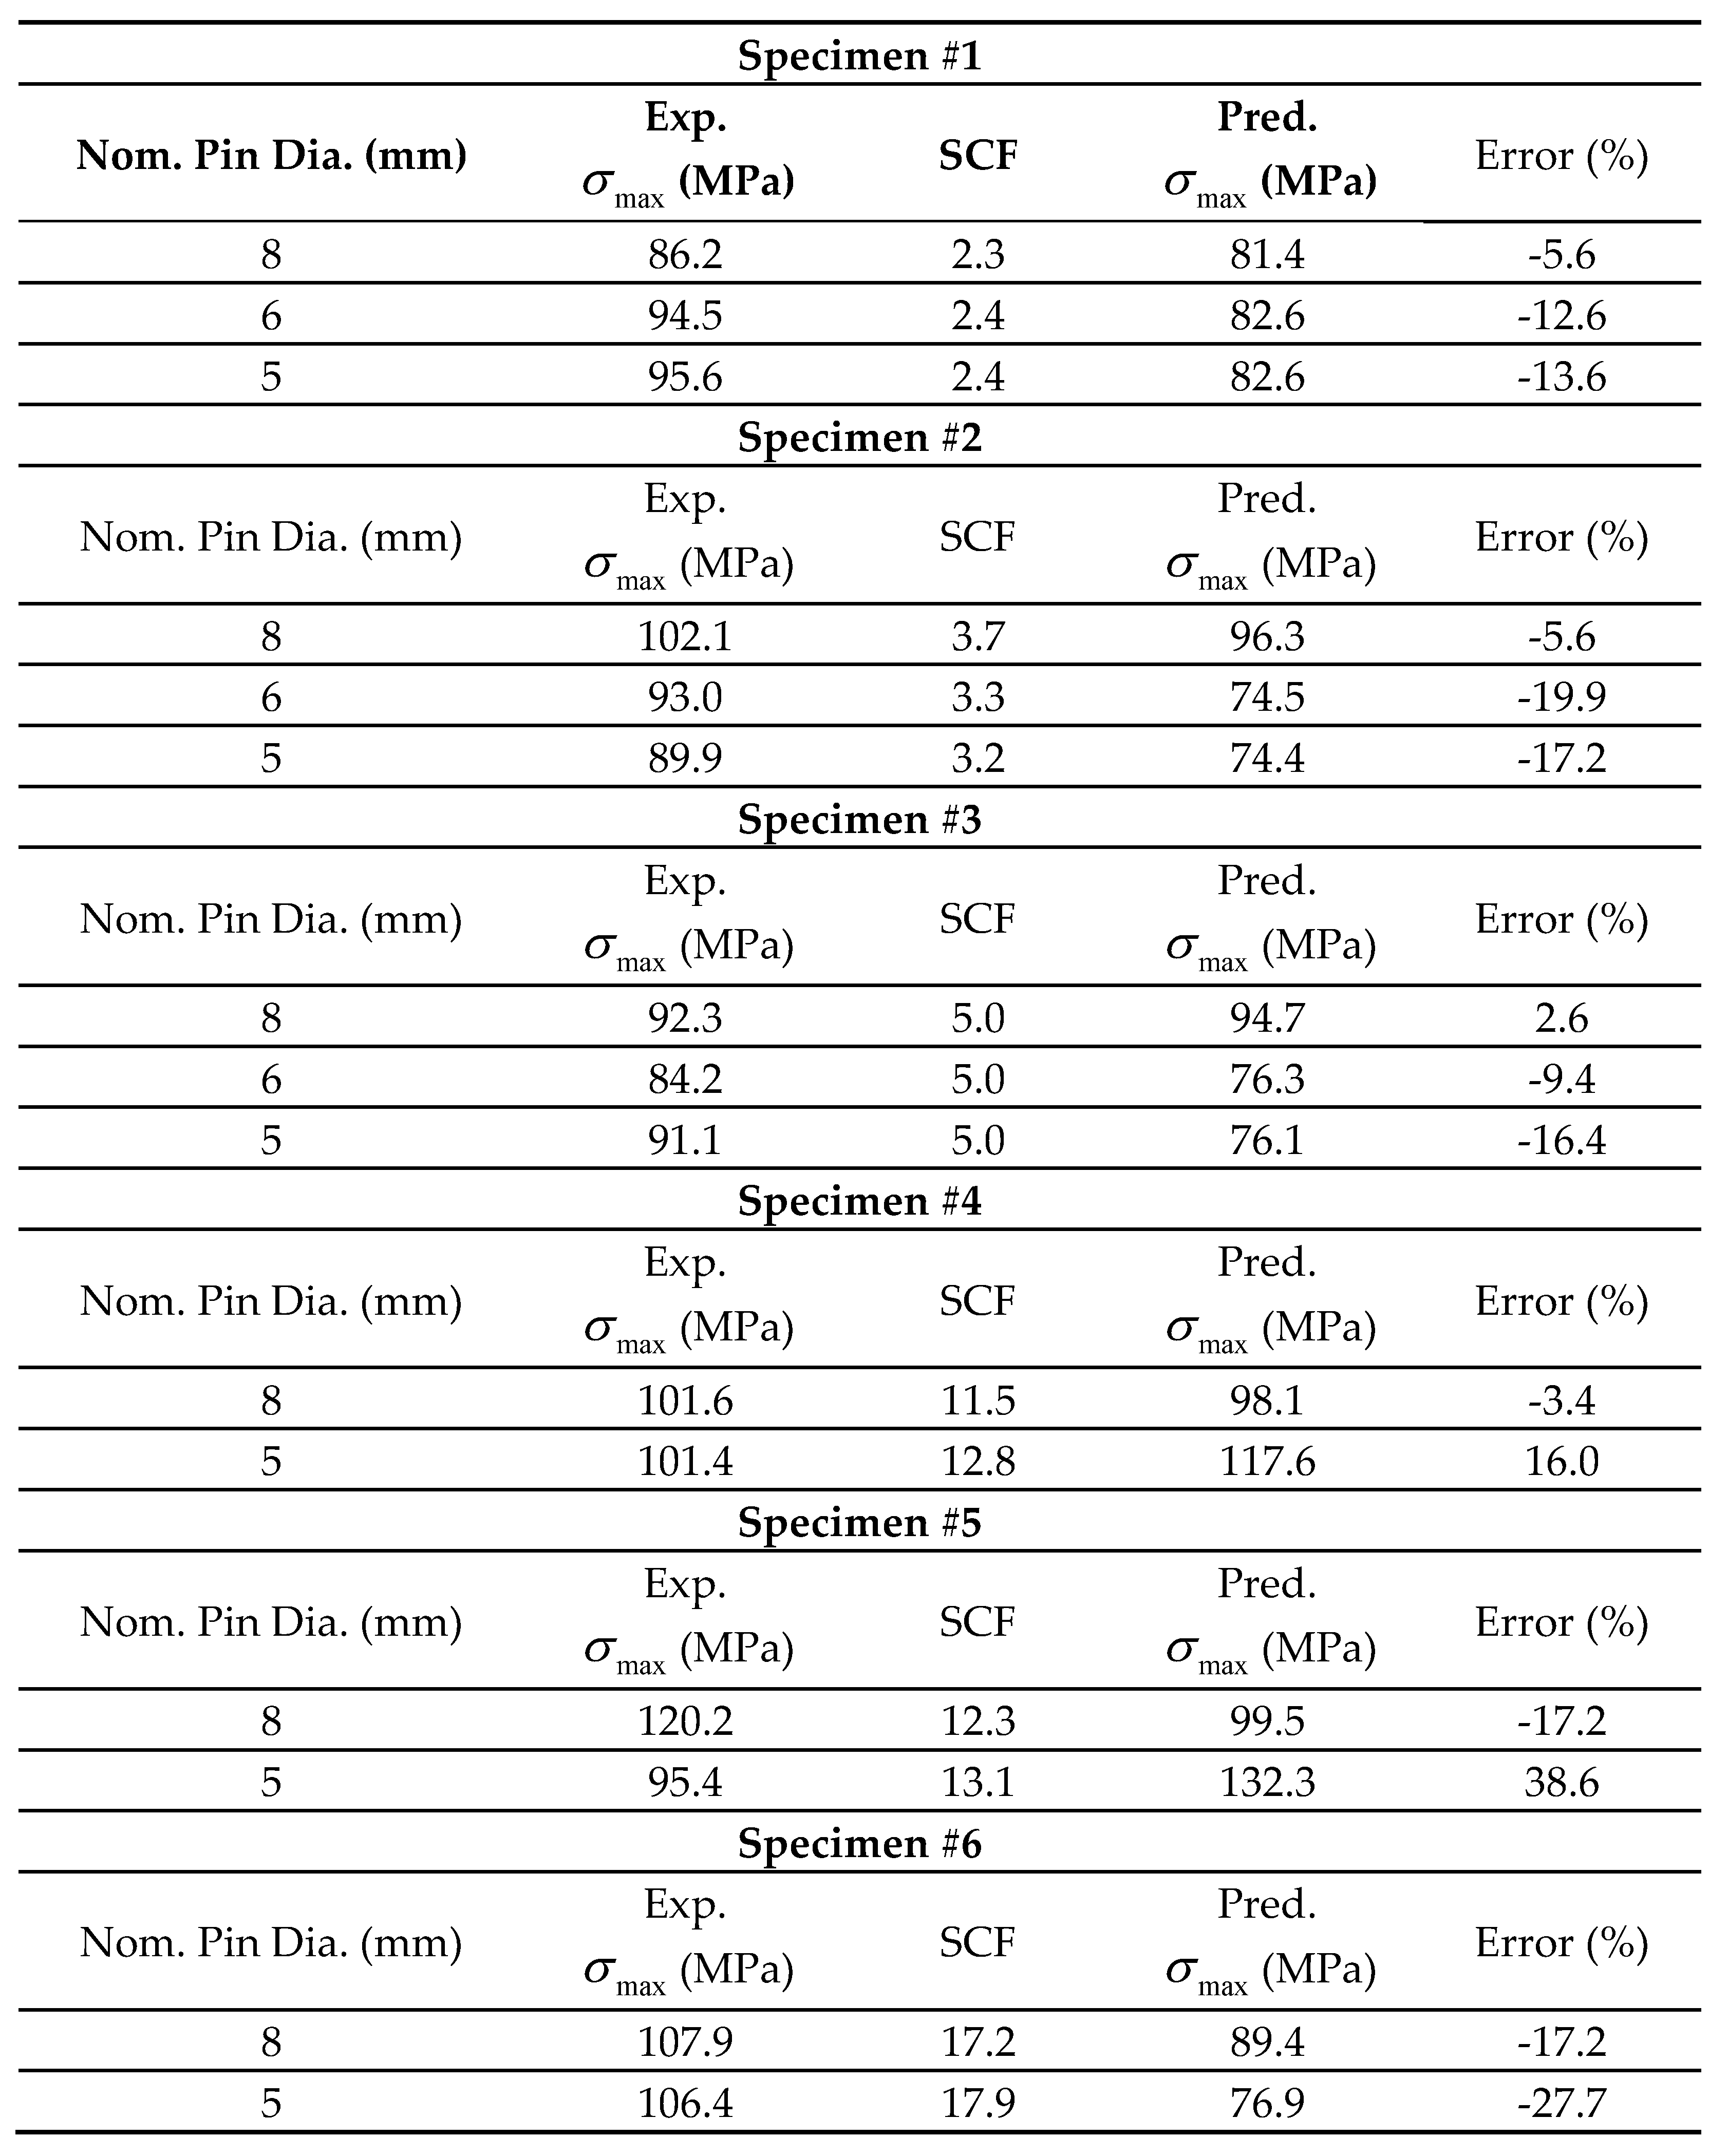
The stress distribution, especially the maximum stress, was determined from the FEA as the failure load determined from the experiment was applied to the model. From the FEA analyses, the stress concentration factor (SCF),
K, was calculated, which is given by
where
σmax is the maximum stress, and
σnom is the average stress associated with the plane that is perpendicular to applied loading and passes through the maximum stress location.
Table 2 shows the computed SCF from the FEA. The SCF for Specimen #1 is between 2.3 and 2.4. In this case, the failure location is at or very near the edge of the hole of the minimum cross-section. Therefore, the SCF was compared to that of the hole loaded using remote tensile loading. The SCF for the remote tensile loading case is 2.4 in Ref. [
24]. In addition, the computed SCF for Specimen #2 was between 3.2 and 3.7, as shown in
Table 2, depending on the pin size while Ref. [
24] gave SCF of about 3.3. However, the case in Ref. [
24] used a concentrated force at the hole instead of the contact loading by a pin. Considering the difference in the loading condition between the present case and that in Ref. [
24], the computed SCF was considered reliable.
Table 2 also shows the effect of the hole location and size relative to those of the specimen on SCF. As the specimen becomes wider as compared to the hole size, the SCF increases. Additionally, as the hole moves closer to the top boundary in
Figure 1, the SCF also increases. More importantly, the maximum stress at the failure load was much greater than the strength of the PMMA material. This suggests that the stress condition of the proposed failure criterion, Eq. (2) is already satisfied, and Eq. (2) itself cannot predict the failure load reliably. Therefore, the stress gradient was needed to predict the local failure stress. To compute the stress gradient, the failure direction should be known. The specimens tested in this study showed different locations and orientations of fracture initiation depending on the specimens as shown in
Table 1.
Fracture initiation was considered to occur at the location of the maximum normal stress because the material is quasi-brittle. The measured location of fracture initiation and the location of the calculated maximum normal stress are compared in
Table 1. Overall, the site of fracture initiation agreed well with the location of the global maximum normal stress in the model. A few items may account for the minimal discrepancy between the model and the experimental values. The specimen and adapter were not perfectly vertically aligned and centered in the test machine as assumed. In addition, there could be some small variations in the physical specimens such as the exact hole location, contact surface between the pin and the specimen, material homogeneity, etc. Regardless of such minor discrepancy, the data strongly suggest that the maximum normal stress (i.e., maximum principal stress) coincides with the site of initial material failure.
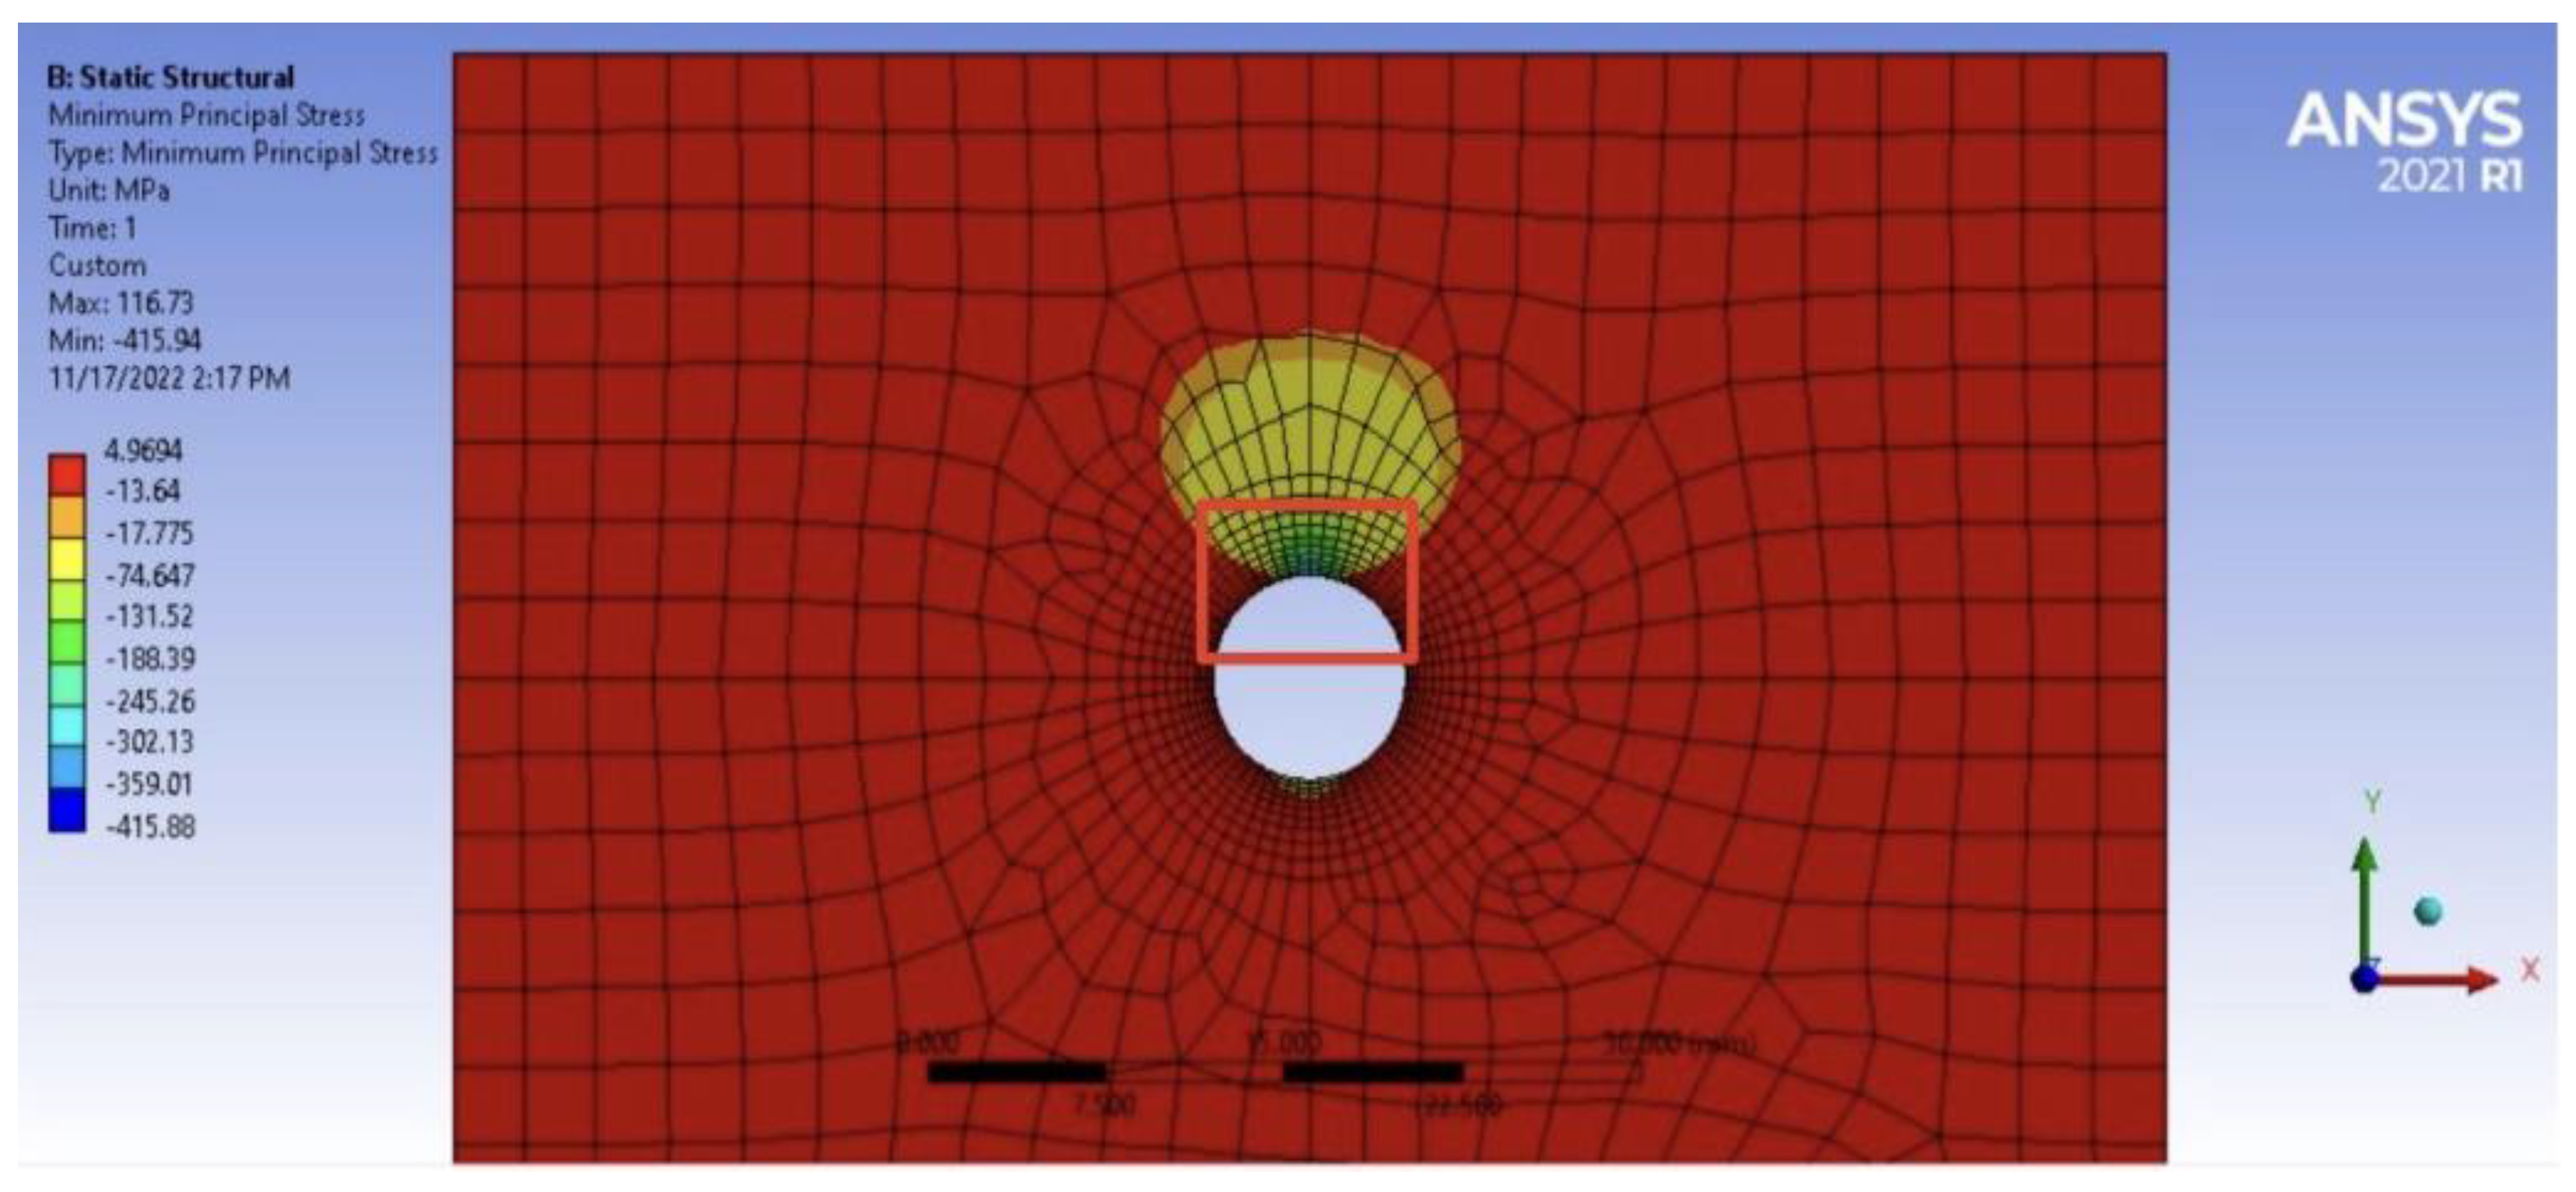
Once it was determined that the maximum normal stress coincides with the failure initiation location, their stress gradients were analyzed to find a correlation to the initial fracture direction. As seen by comparing the initial fracture path in Specimen #5 in
Figure 7 to the minimum principal stress contours in
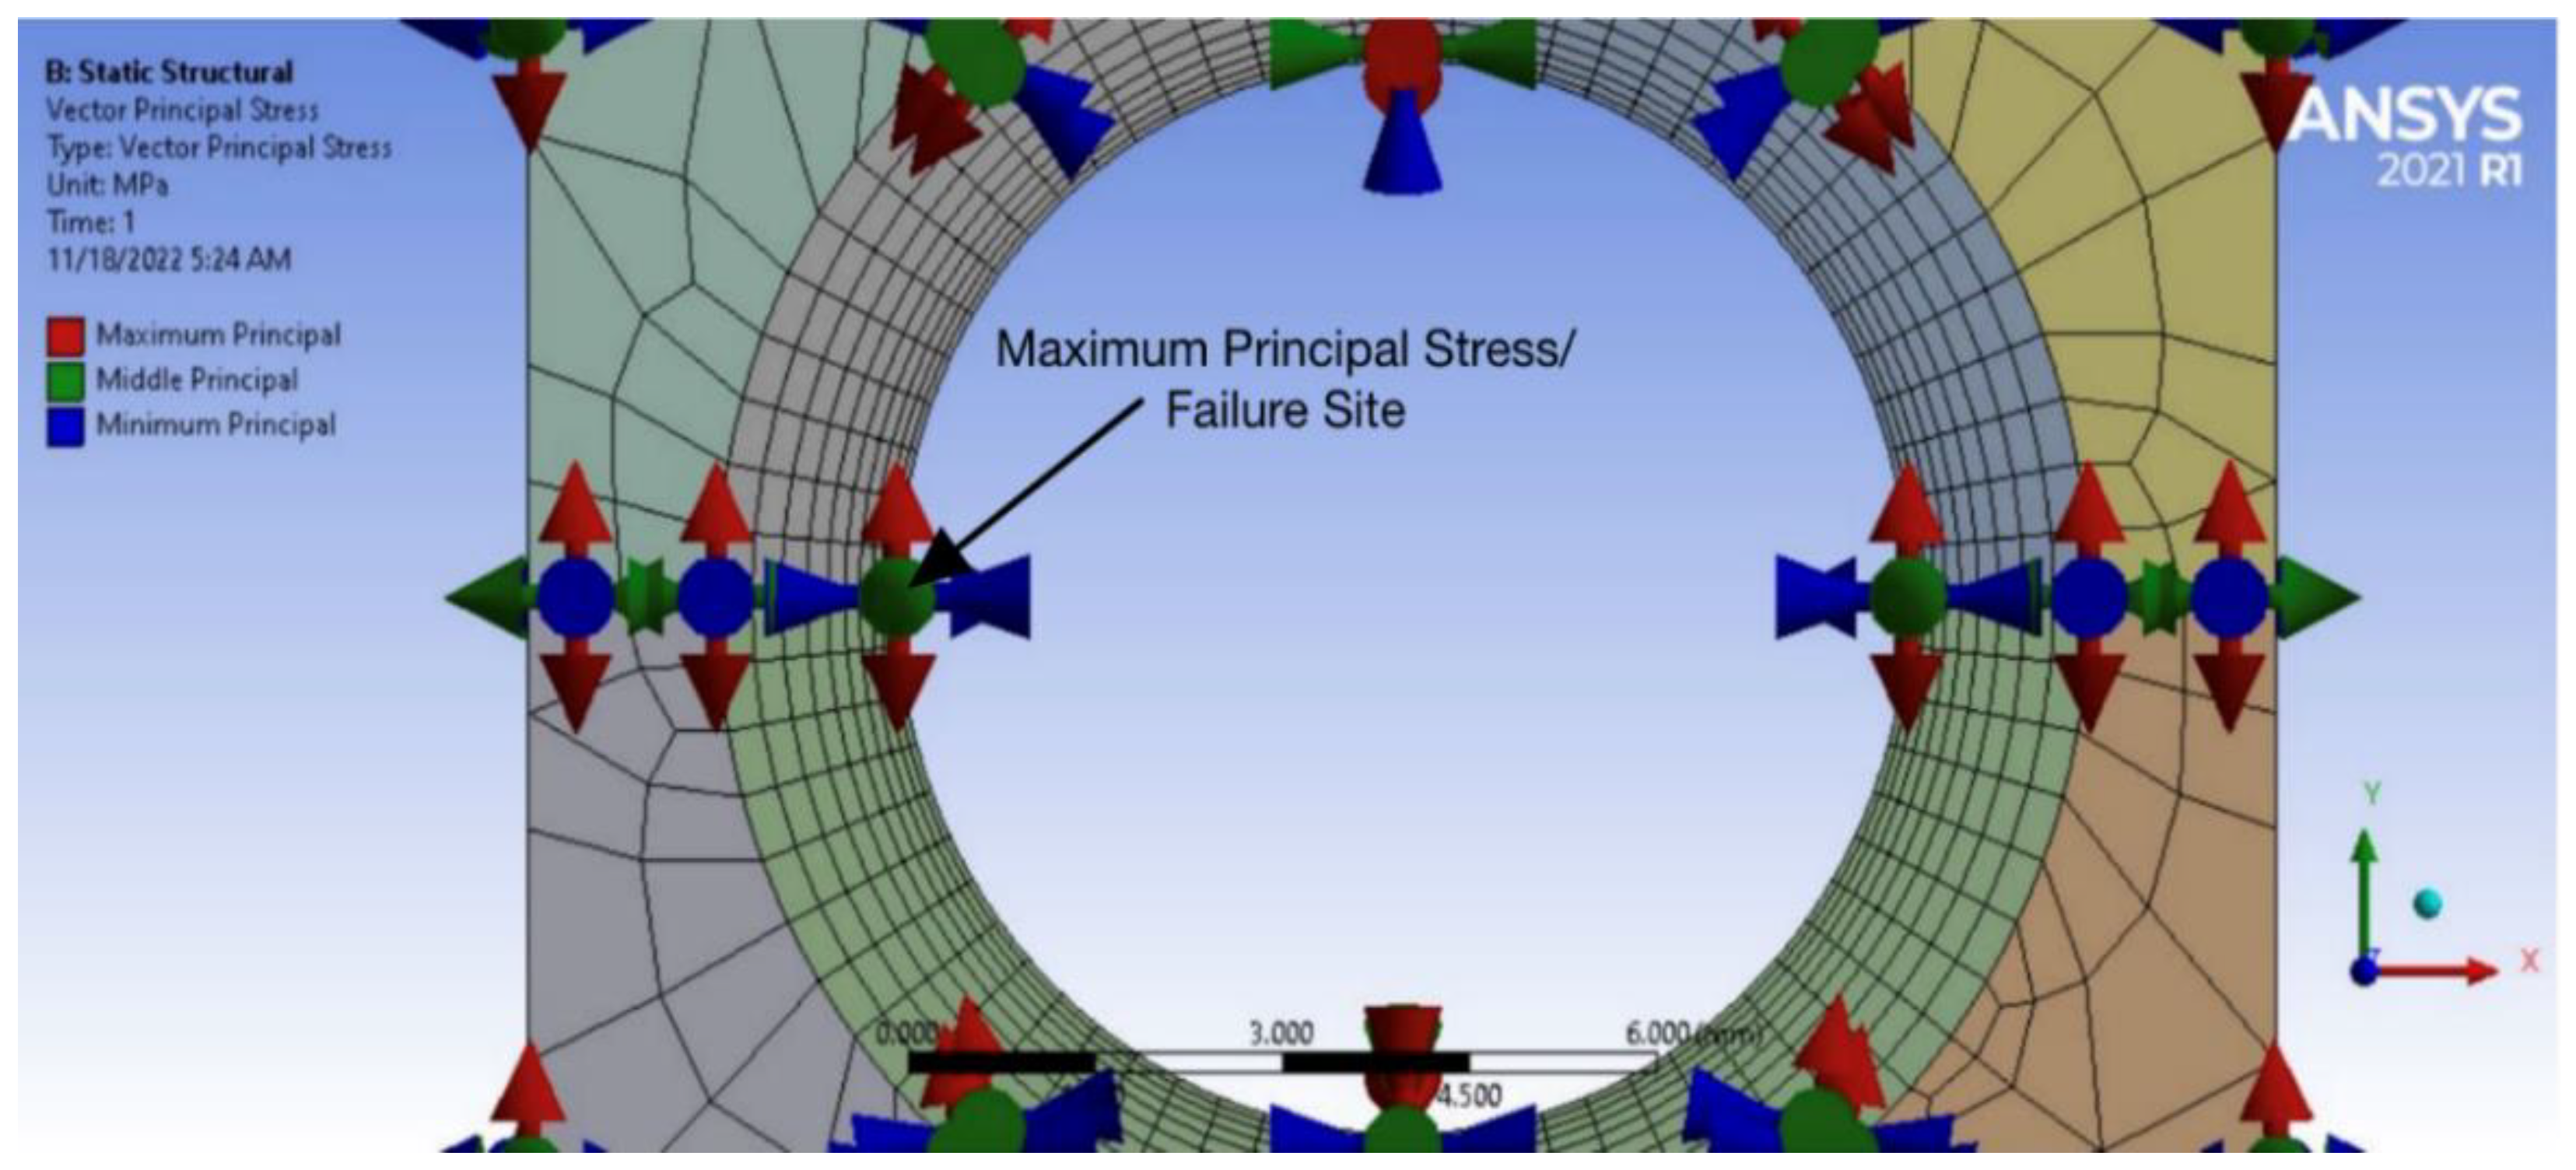
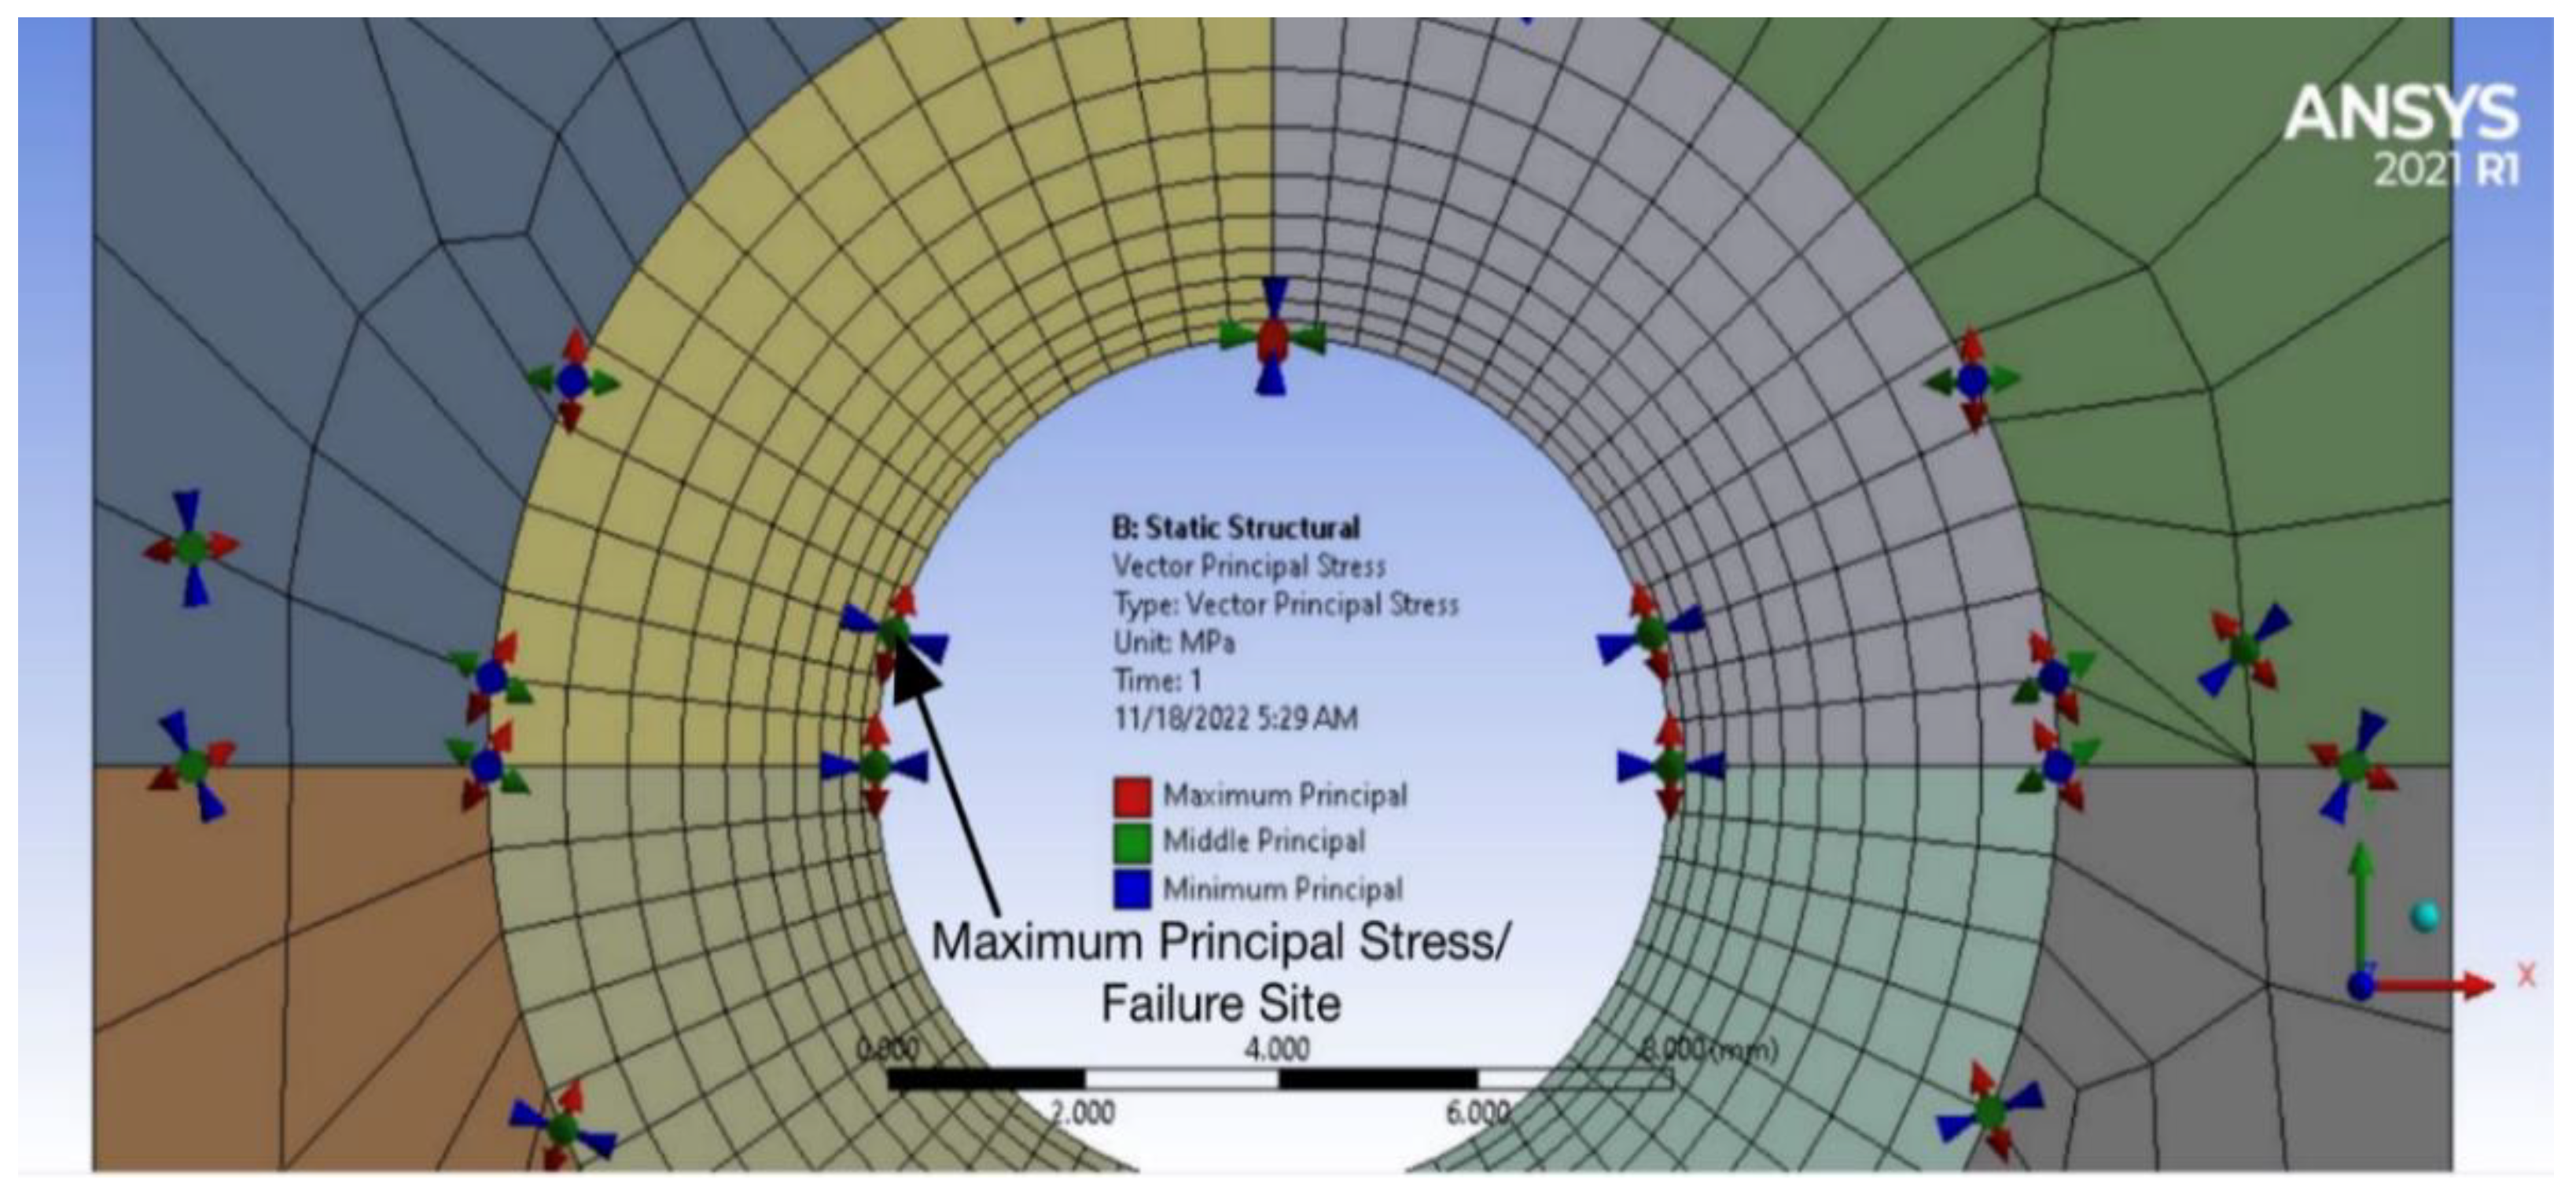
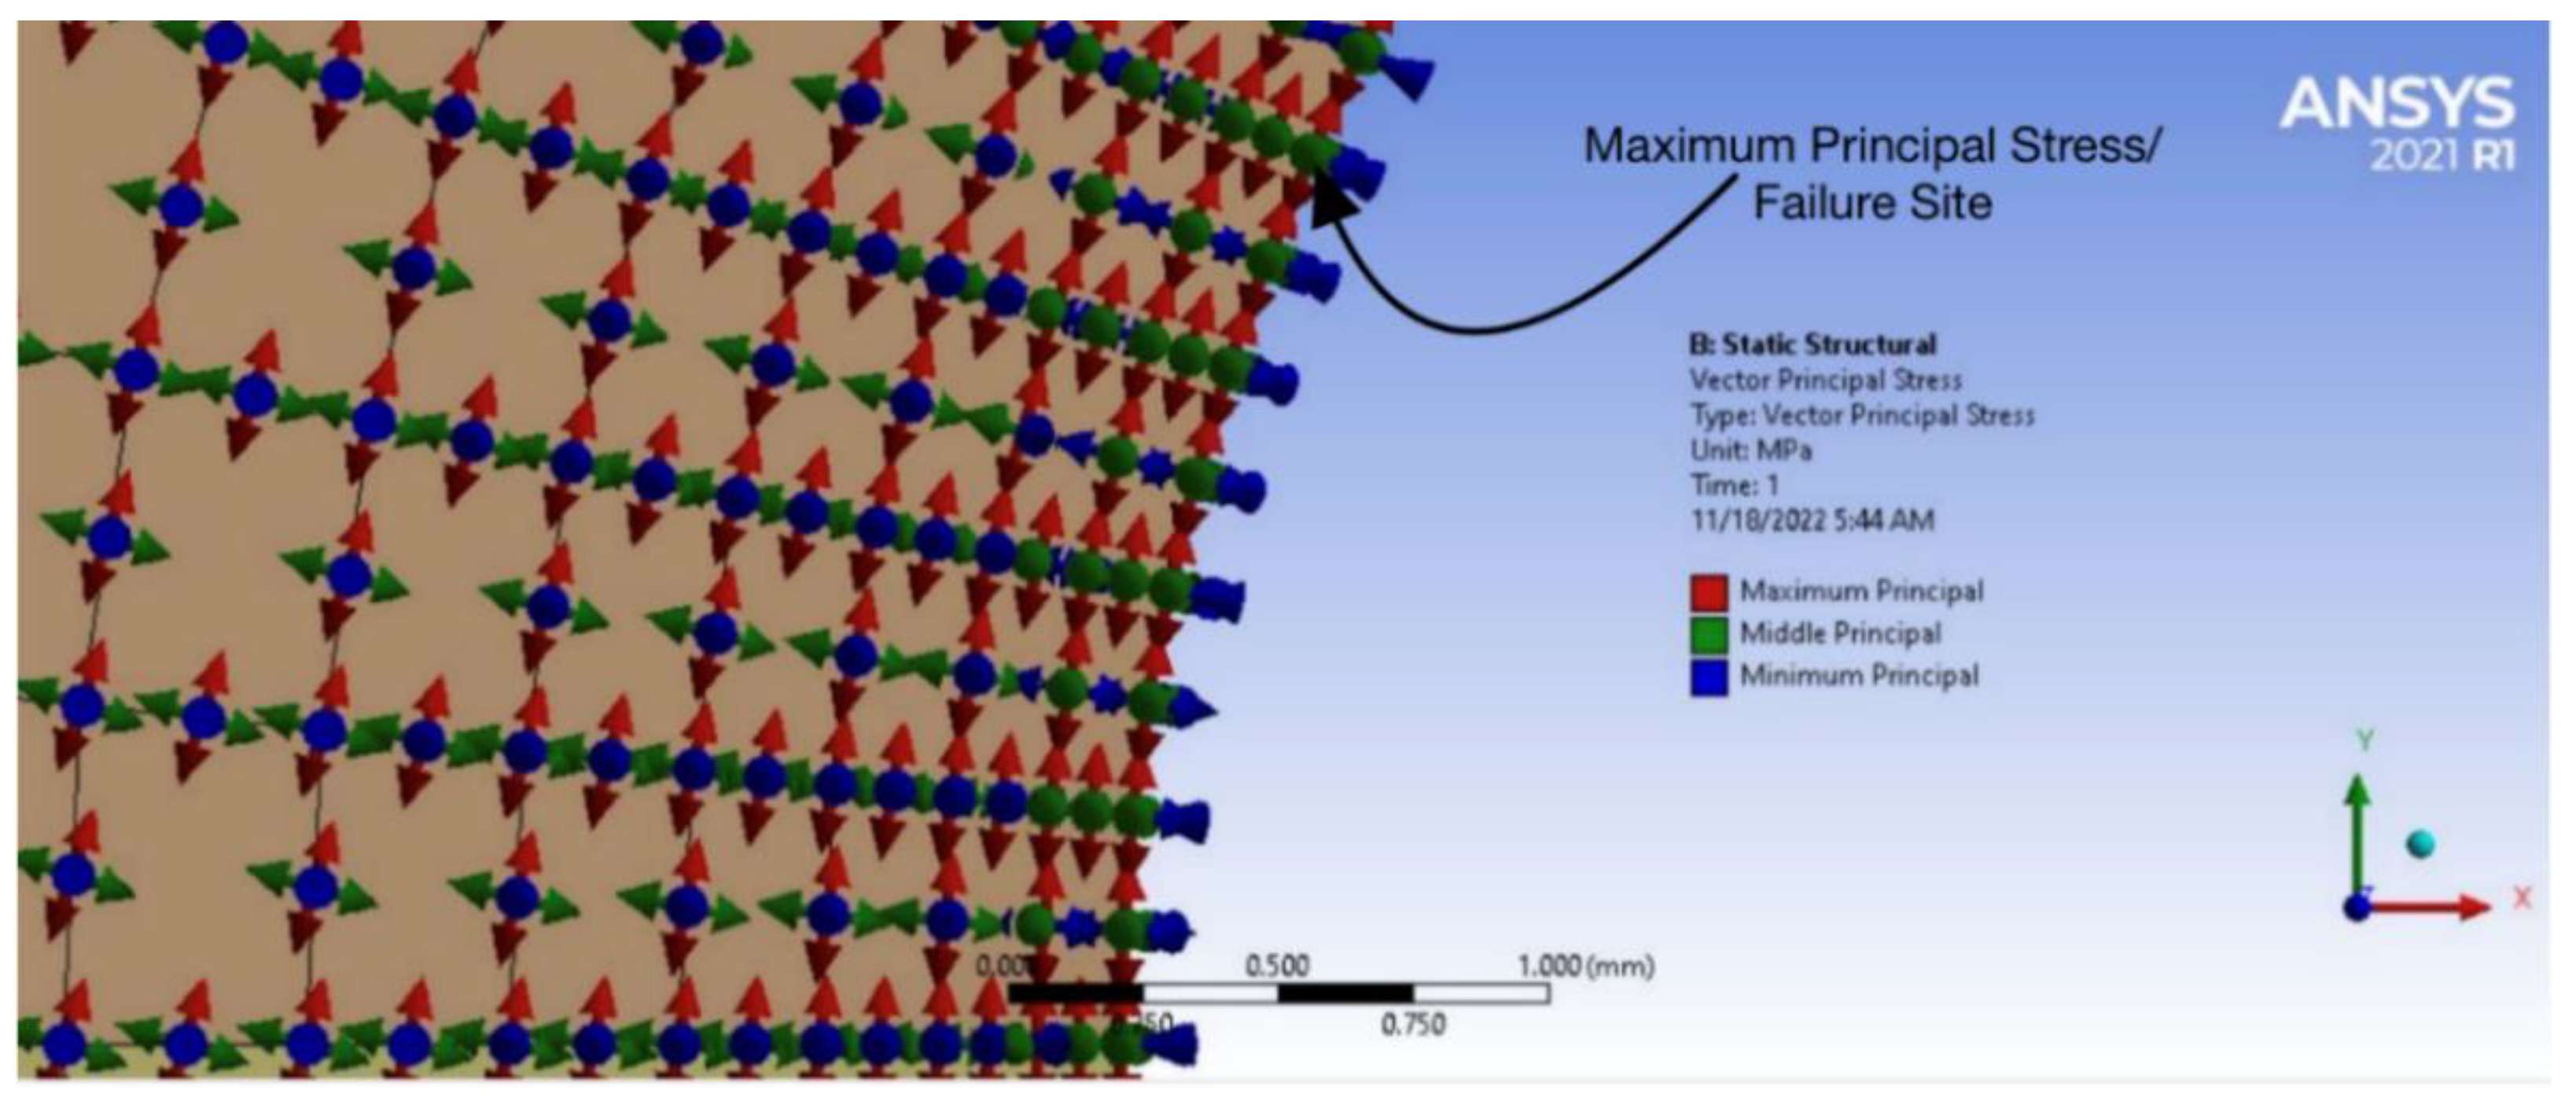
Figure 10, the minimum normal stress (i.e., minimum principal stress) contours in the model closely resemble the initial fracture path in the specimen. The same correlation was observed in the other models and specimens. Therefore, realizing that the minimum normal stress is perpendicular to the maximum normal stress, principal stress vectors were evaluated. As shown in Figures 11 through 13, principal stress vectors at the maximum principal stress or material failure initiation location are easily obtained.
Table 1.
Experimental and numerical fracture locations and angles.
Table 1.
Experimental and numerical fracture locations and angles.
| Specimen #1 |
| Nom. Pin Dia. (mm) |
Experimental |
Numerical |
| Y-Coord. (mm) |
Angle (o) |
Y-Coord. (mm) |
Angle (o) |
| 8 |
0.0 |
90 |
0.0 |
90 |
| 6 |
1.0 |
90 |
0.4 |
85 |
| 5 |
0.0 |
90 |
0.4 |
85 |
| Specimen #2 |
| Nom. Pin Dia. (mm) |
Experimental |
Numerical |
| Y-Coord. (mm) |
Angle (o) |
Y-Coord. (mm) |
Angle (o) |
| 8 |
0.0 – 1.5 |
80 - 90 |
1.6 |
65 |
| 6 |
1.0 |
75 |
1.2 |
75 |
| 5 |
0.0 |
85 |
0.8 |
80 |
| Specimen #3 |
| Nom. Pin Dia. (mm) |
Experimental |
Numerical |
| Y-Coord. (mm) |
Angle (o) |
Y-Coord. (mm) |
Angle (o) |
| 8 |
1.0 – 2.0 |
70 -80 |
1.6 |
65 |
| 6 |
1.0 |
75 |
1.3 |
70 |
| 5 |
2.0 |
55 |
1.3 |
70 |
| Specimen #4 |
| Nom. Pin Dia. (mm) |
Experimental |
Numerical |
| Y-Coord. (mm) |
Angle (o) |
Y-Coord. (mm) |
Angle (o) |
| 8 |
1.5 – 2.0 |
80 |
1.6 |
65 |
| 5 |
3.0 – 3.75 |
50 |
3.7 |
25 |
| Specimen #5 |
| Nom. Pin Dia. (mm) |
Experimental |
Numerical |
| Y-Coord. (mm) |
Angle (o) |
Y-Coord. (mm) |
Angle (o) |
| 8 |
1.5 – 2.0 |
70 |
1.6 |
65 |
| 5 |
3.5 – 3.75 |
35 |
3.9 |
20 |
| Specimen #6 |
| Nom. Pin Dia. (mm) |
Experimental |
Numerical |
| Y-Coord. (mm) |
Angle (o) |
Y-Coord. (mm) |
Angle (o) |
| 8 |
1.0 – 2.0 |
75 |
1.6 |
65 |
| 5 |
2.0 – 3.0 |
50 |
2.4 |
55 |
Table 2.
Stress Concentration Factor.
Table 2.
Stress Concentration Factor.
Figure 10.
Minimum normal stress contours for Specimen #5 with 5 mm pin.
Figure 10.
Minimum normal stress contours for Specimen #5 with 5 mm pin.
Figure 11.
Specimen #1 with 8mm [in vector principal stress model.
Figure 11.
Specimen #1 with 8mm [in vector principal stress model.
Figure 12.
Specimen #3 with 5mm pin vector principal stress model.
Figure 12.
Specimen #3 with 5mm pin vector principal stress model.
Figure 13.
Specimen #4 with 8 mm pin vector principal stress model.
Figure 13.
Specimen #4 with 8 mm pin vector principal stress model.
Principal stress vectors at the maximum principal stress or initial failure site were obtained for all models. Then, the angle between the plane perpendicular to the maximum principal stress vector and the plane bisecting the specimen vertically was determined. As listed in
Table 1, the plane perpendicular to the maximum principal stress vector closely resembles the experimental result. Therefore, in addition to material failure initiating at the location of the maximum principal stress, the data suggest that the initial fracture direction will be normal to the maximum principal stress vector at the maximum principal stress location.
Utilizing the FEA model angles in
Table 1, stress gradients were calculated, and Eq. (3) was used to predict the failure stress at the location of fracture initiation. The stress gradient was computed from the stress at nodal points using the finite difference technique at the fracture location and direction of the FEA models.
Table 2 compares the predicted failure stress using Eq. (3) to the experimental failure stress which was determined from the FEA using the experimentally determined failure load. The material failure value
Kf was obtained from a test of a specimen with a notch by applying a remote tensile load and using Eq. (3) once the failure stress is known from the failure test. The same material failure value is used for all other predictions of failure stresses.
The error of the failure stresses between the experiment and the theory varied from specimen to specimen. The smallest error was 2.7% for Specimen #3 with the 8 mm pin while the largest error was 38.6% for Specimen #5 with the 5 mm pin. In general, the agreement was better for a larger pin than a smaller pin. This is because the contact pressure has a much stiffer change along the contact surface for the smaller pin and determining that contact pressure and the resultant contact stresses are more difficult.
As seen in
Table 1, the experiment and the numerical analysis showed some differences in the locations and angles of fracture initiation even though they were not significant. However, such a variation also affects the stress gradient value which then influences the theoretical failure stress. Considering all those aspects, the new failure criterion is considered acceptable to predict the failure of pin-loaded specimens.
5. Summary and Conclusions
A series of experimental and numerical studies were conducted to predict the failure loads as well as the locations and directions of PMMA specimens with a perforated circular hole loaded by an inserted pin. The test setup was equivalent to the inplane loading of a double lap joint. Three different sizes of specimens were constructed. The width of specimens varied. Every specimen had a circular hole of 8 mm diameter, and its location was varied in the specimens: some at the center and the others closer to the top of the specimen. In addition, three different pin sizes were used to apply external loading. The nominal diameters of the pins were 8 mm, 6 mm, and 5 mm, respectively, while the actual size was slightly smaller than the nominal size. The reason for all those variations was to investigate their effects on the failure loads, failure locations, and directions.
Finite element modeling and analyses were undertaken to simulate the experimental tests. First, the numerical results were validated qualitatively and quantitatively. The qualitative validation was conducted by comparing the contact surface area between the FEA results and that obtained using a thin film of contact sensor which recorded the contact surface between the hole and the pin. The quantitative validation was obtained by comparing the SCF from FEA to the results in other literature. Once the numerical models were validated, failure loads and failure directions were predicted using the new universal failure criterion. The maximum normal stress (or maximum principal stress) was used as the effective stress for the failure criterion because the PMMA is a quasi-brittle material. Furthermore, the failure was considered along the plane normal to the maximum normal stress.
The experimental results showed that failure loads, locations of failure initiation, and their directions were influenced by specimen width, hole location, and pin size. The overall effect of the pin size on the failure characteristics was much larger for wider specimens, Specimens #4 to #6, than for narrow specimens, Specimens #1 to #3. Both experimental and numerical results showed the same trends. Variation in pin size had the smallest effect on Specimen #1 but the largest effect on Specimen #5. The behaviors of Specimen #1 were like that of previous test specimens with a remotely applied load instead of an inserted pin load.
The failure characteristics predicted using the new failure criterion had good agreement with the experimental data for most of the specimens. Both the failure location and failure angles were very comparable between the experimental and numerical results. The failure stresses at the failure locations were also comparable between the two results. The larger pin showed a smaller discrepancy between the two results than the smaller pin. This is because a smaller pin size makes a more sensitive contact surface which also results in more complex stress distributions at and near the contact surfaces.
This study assumed 0.2 for the coefficient of friction [
21,
22]. However, the actual coefficient of friction may be different and may not be uniform over every contact surface. In addition, a small misalignment in the loading also influences the stress field resulting from the contact loading. Considering all those complexities, the failure predictions of the pin-loaded specimens using the new failure criterion could be considered acceptable and reliable.

