Submitted:
04 May 2023
Posted:
05 May 2023
You are already at the latest version
Abstract
Keywords:
1. Introduction
2. Finite element modeling (FEM)
2.1. Material constitutive models
2.1.1. Concrete
2.1.2. Steel bars
2.1.3. Fe-SMA bars
2.2. Element types
2.3. Convergence criteria
2.4. Parametric study program
3. Results and discussion
3.1. Numerical model verification
3.2. Paramteric investigation
3.2.1. Effect of opening size
3.2.2. Effect of prestressing level
3.2.3. Effect of Fe-SMA reinforcement ratioTop of Form
4. Conclusion
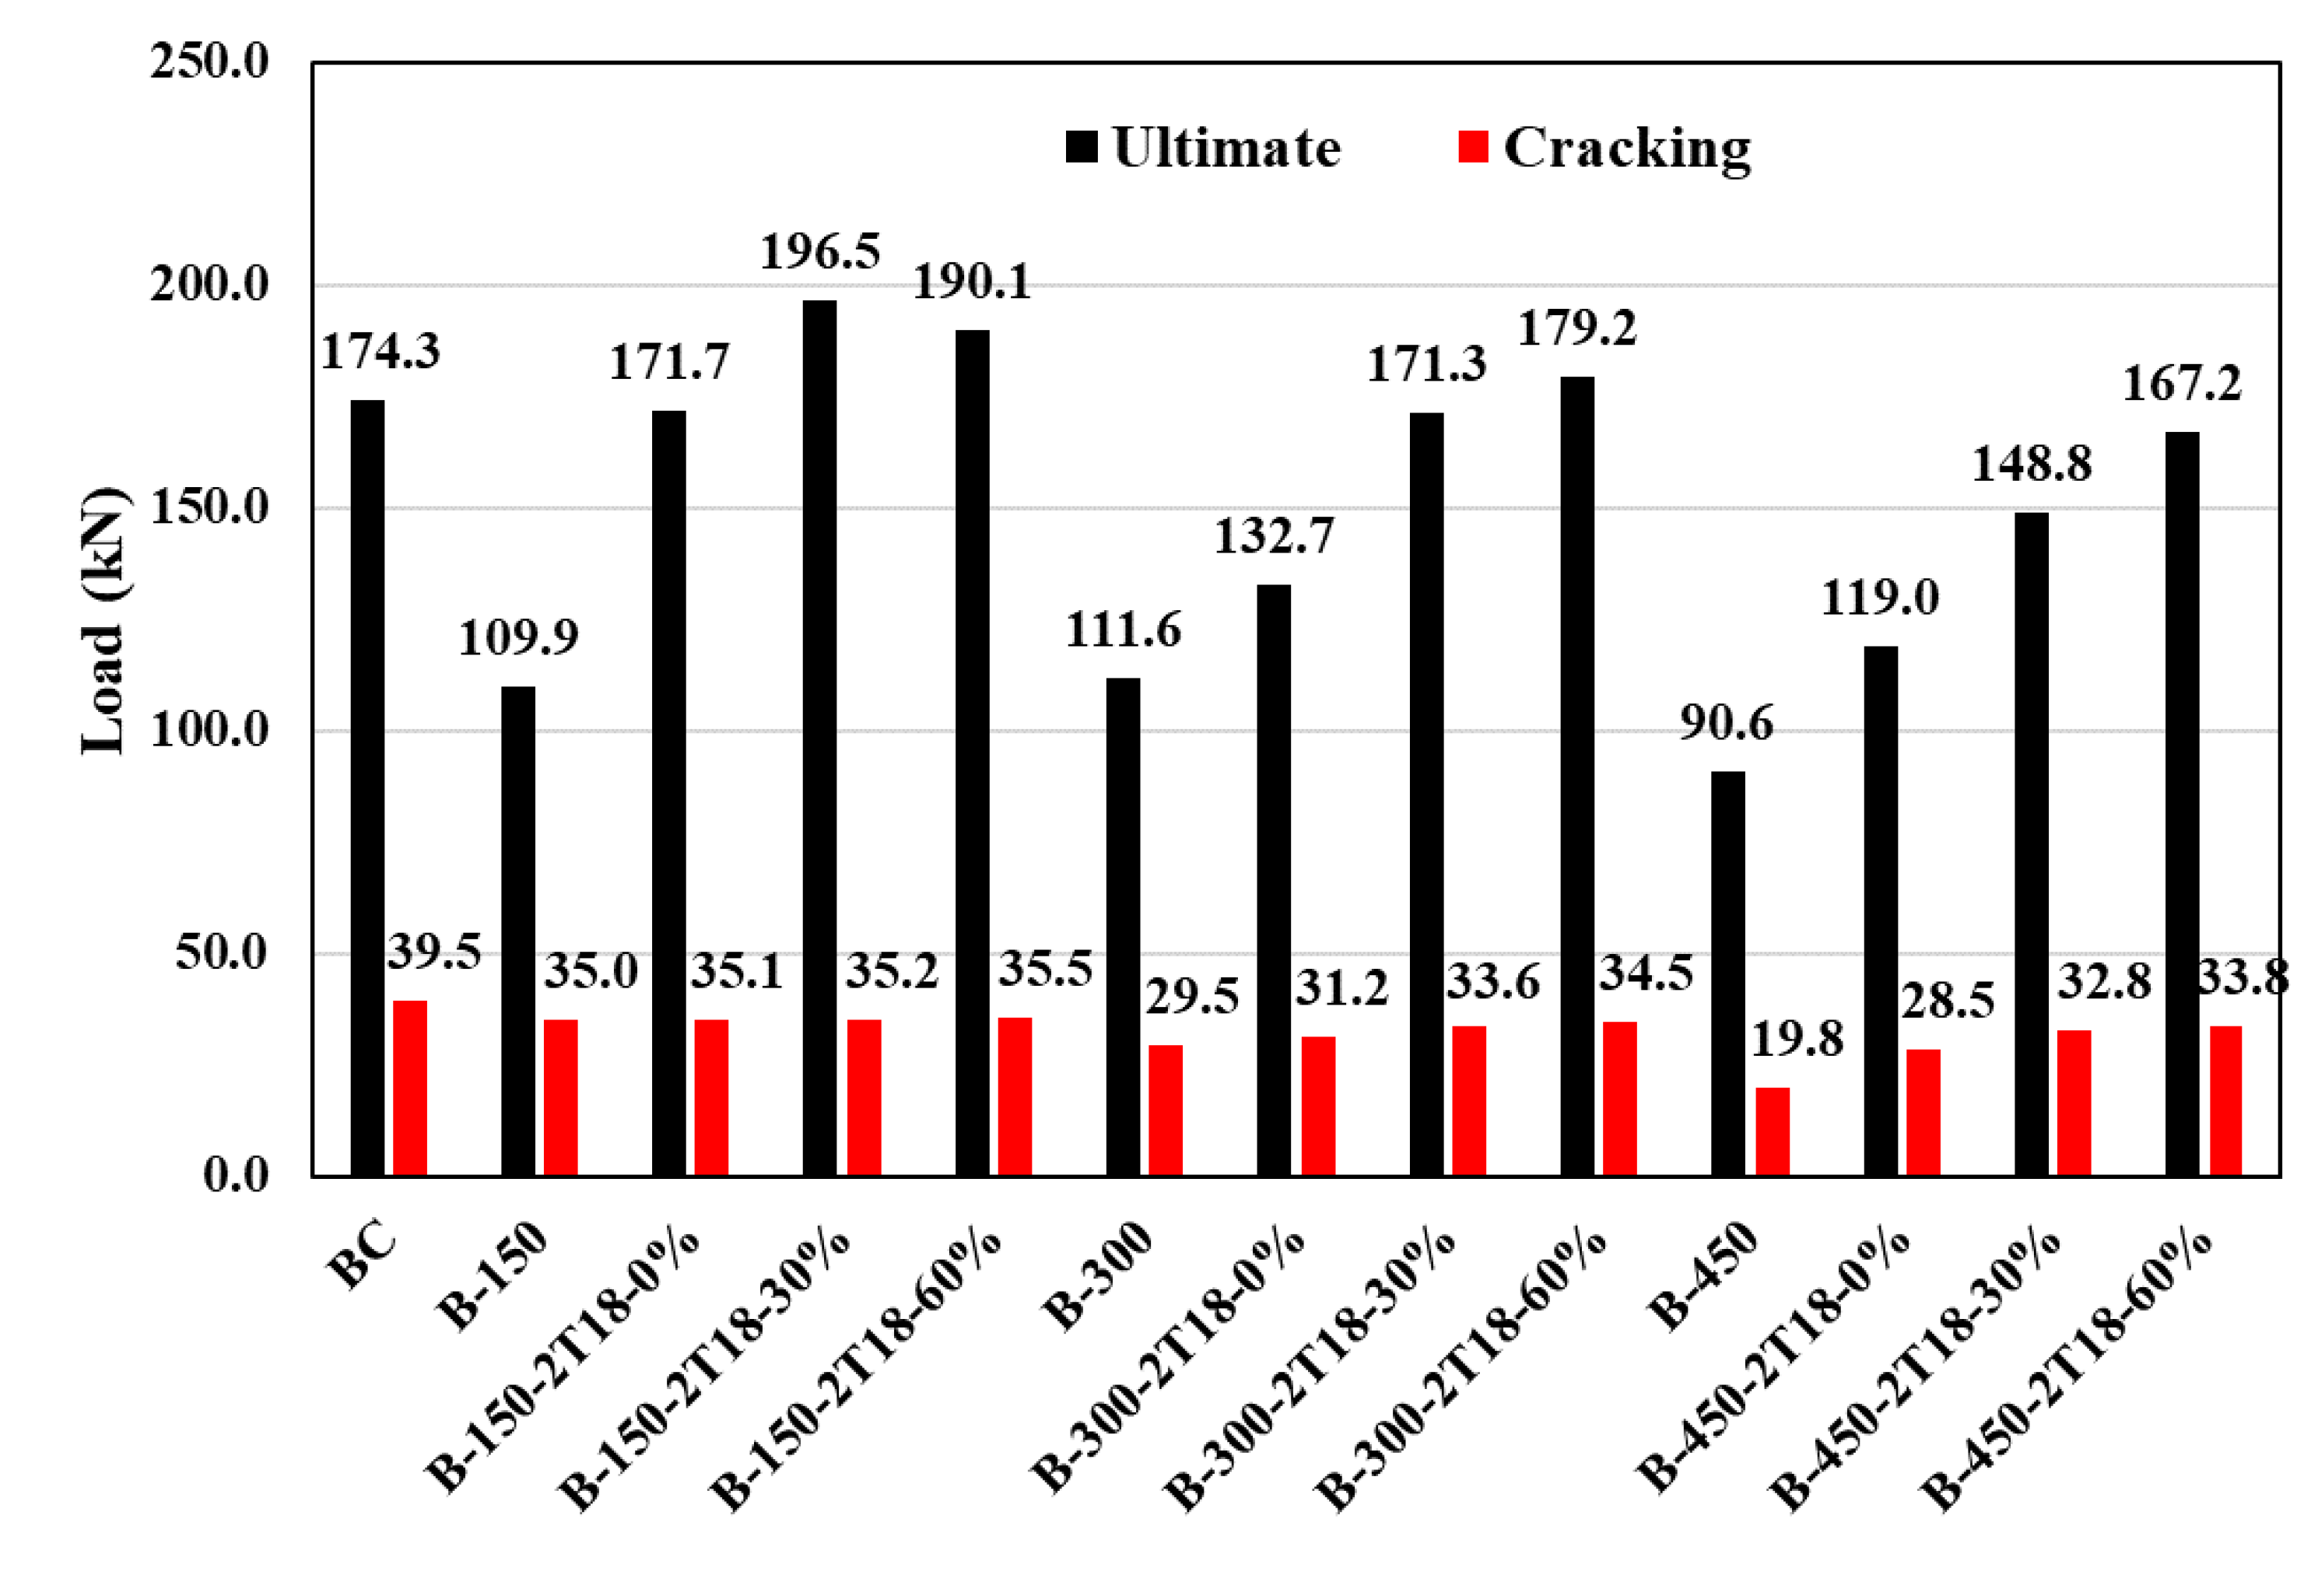
- The study investigated the effect of web openings on the load-deflection response curves of RC beams, and found that the presence of openings significantly reduced the cracking and ultimate loads of the beams by up to 50 and 48%, respectively.
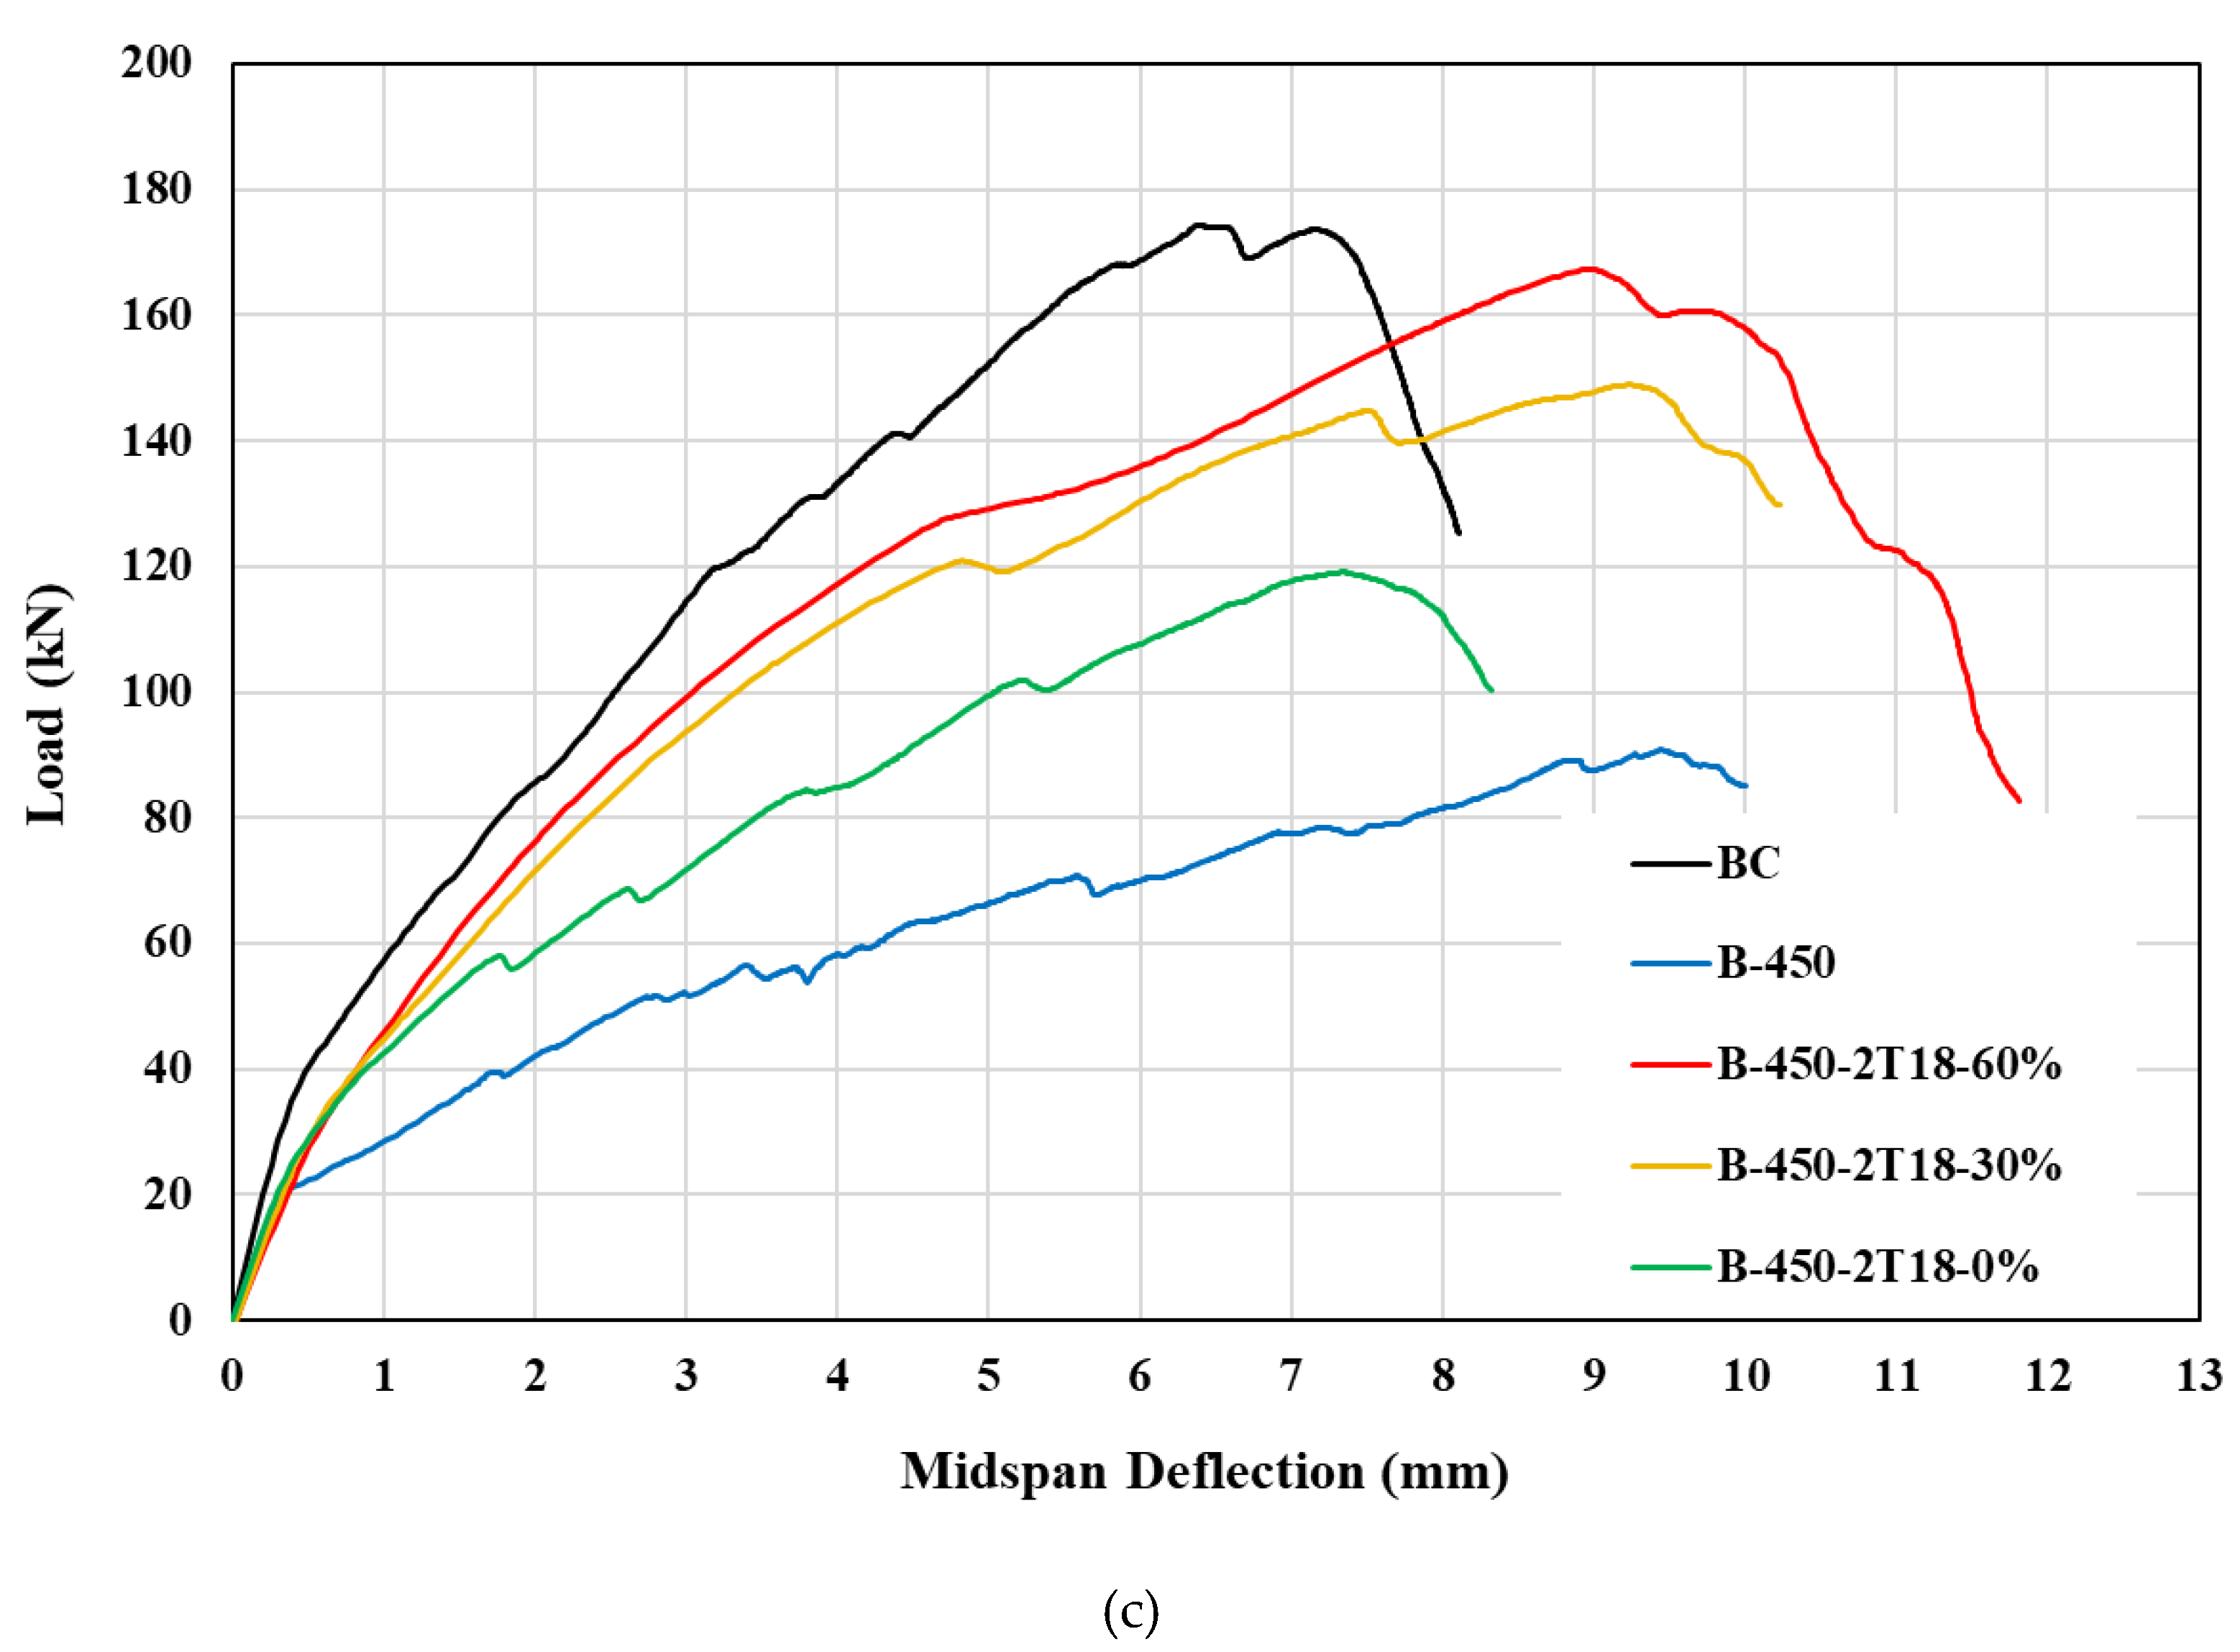
- Strengthening small-sized openings (i.e., 100x150 mm) with unactivated 2T18 mm Fe-SMA bars restored the beam’s shear capacity and behavior to that of a solid beam (BC), with comparable ultimate and cracking load values.
- Increasing the pre-stressing level of the Fe-SMA bars by 30 and 60% improved the load-carrying capacity of the beams with small openings by 12% and 9%, respectively, compared to the BC beam, while almost maintaining the same cracking loads.
- The use of activated Fe-SMA bars was most effective for beams with small and medium web openings (i.e., 100x150 mm and 100x300 mm), as it could restore both the shear strength and stiffness. However, for beams with larger web openings of 100x450 mm, using 30 and 60% activated Fe-SMA bars enabled recovery of almost 85 and 95% of the solid beam's shear strength, respectively.
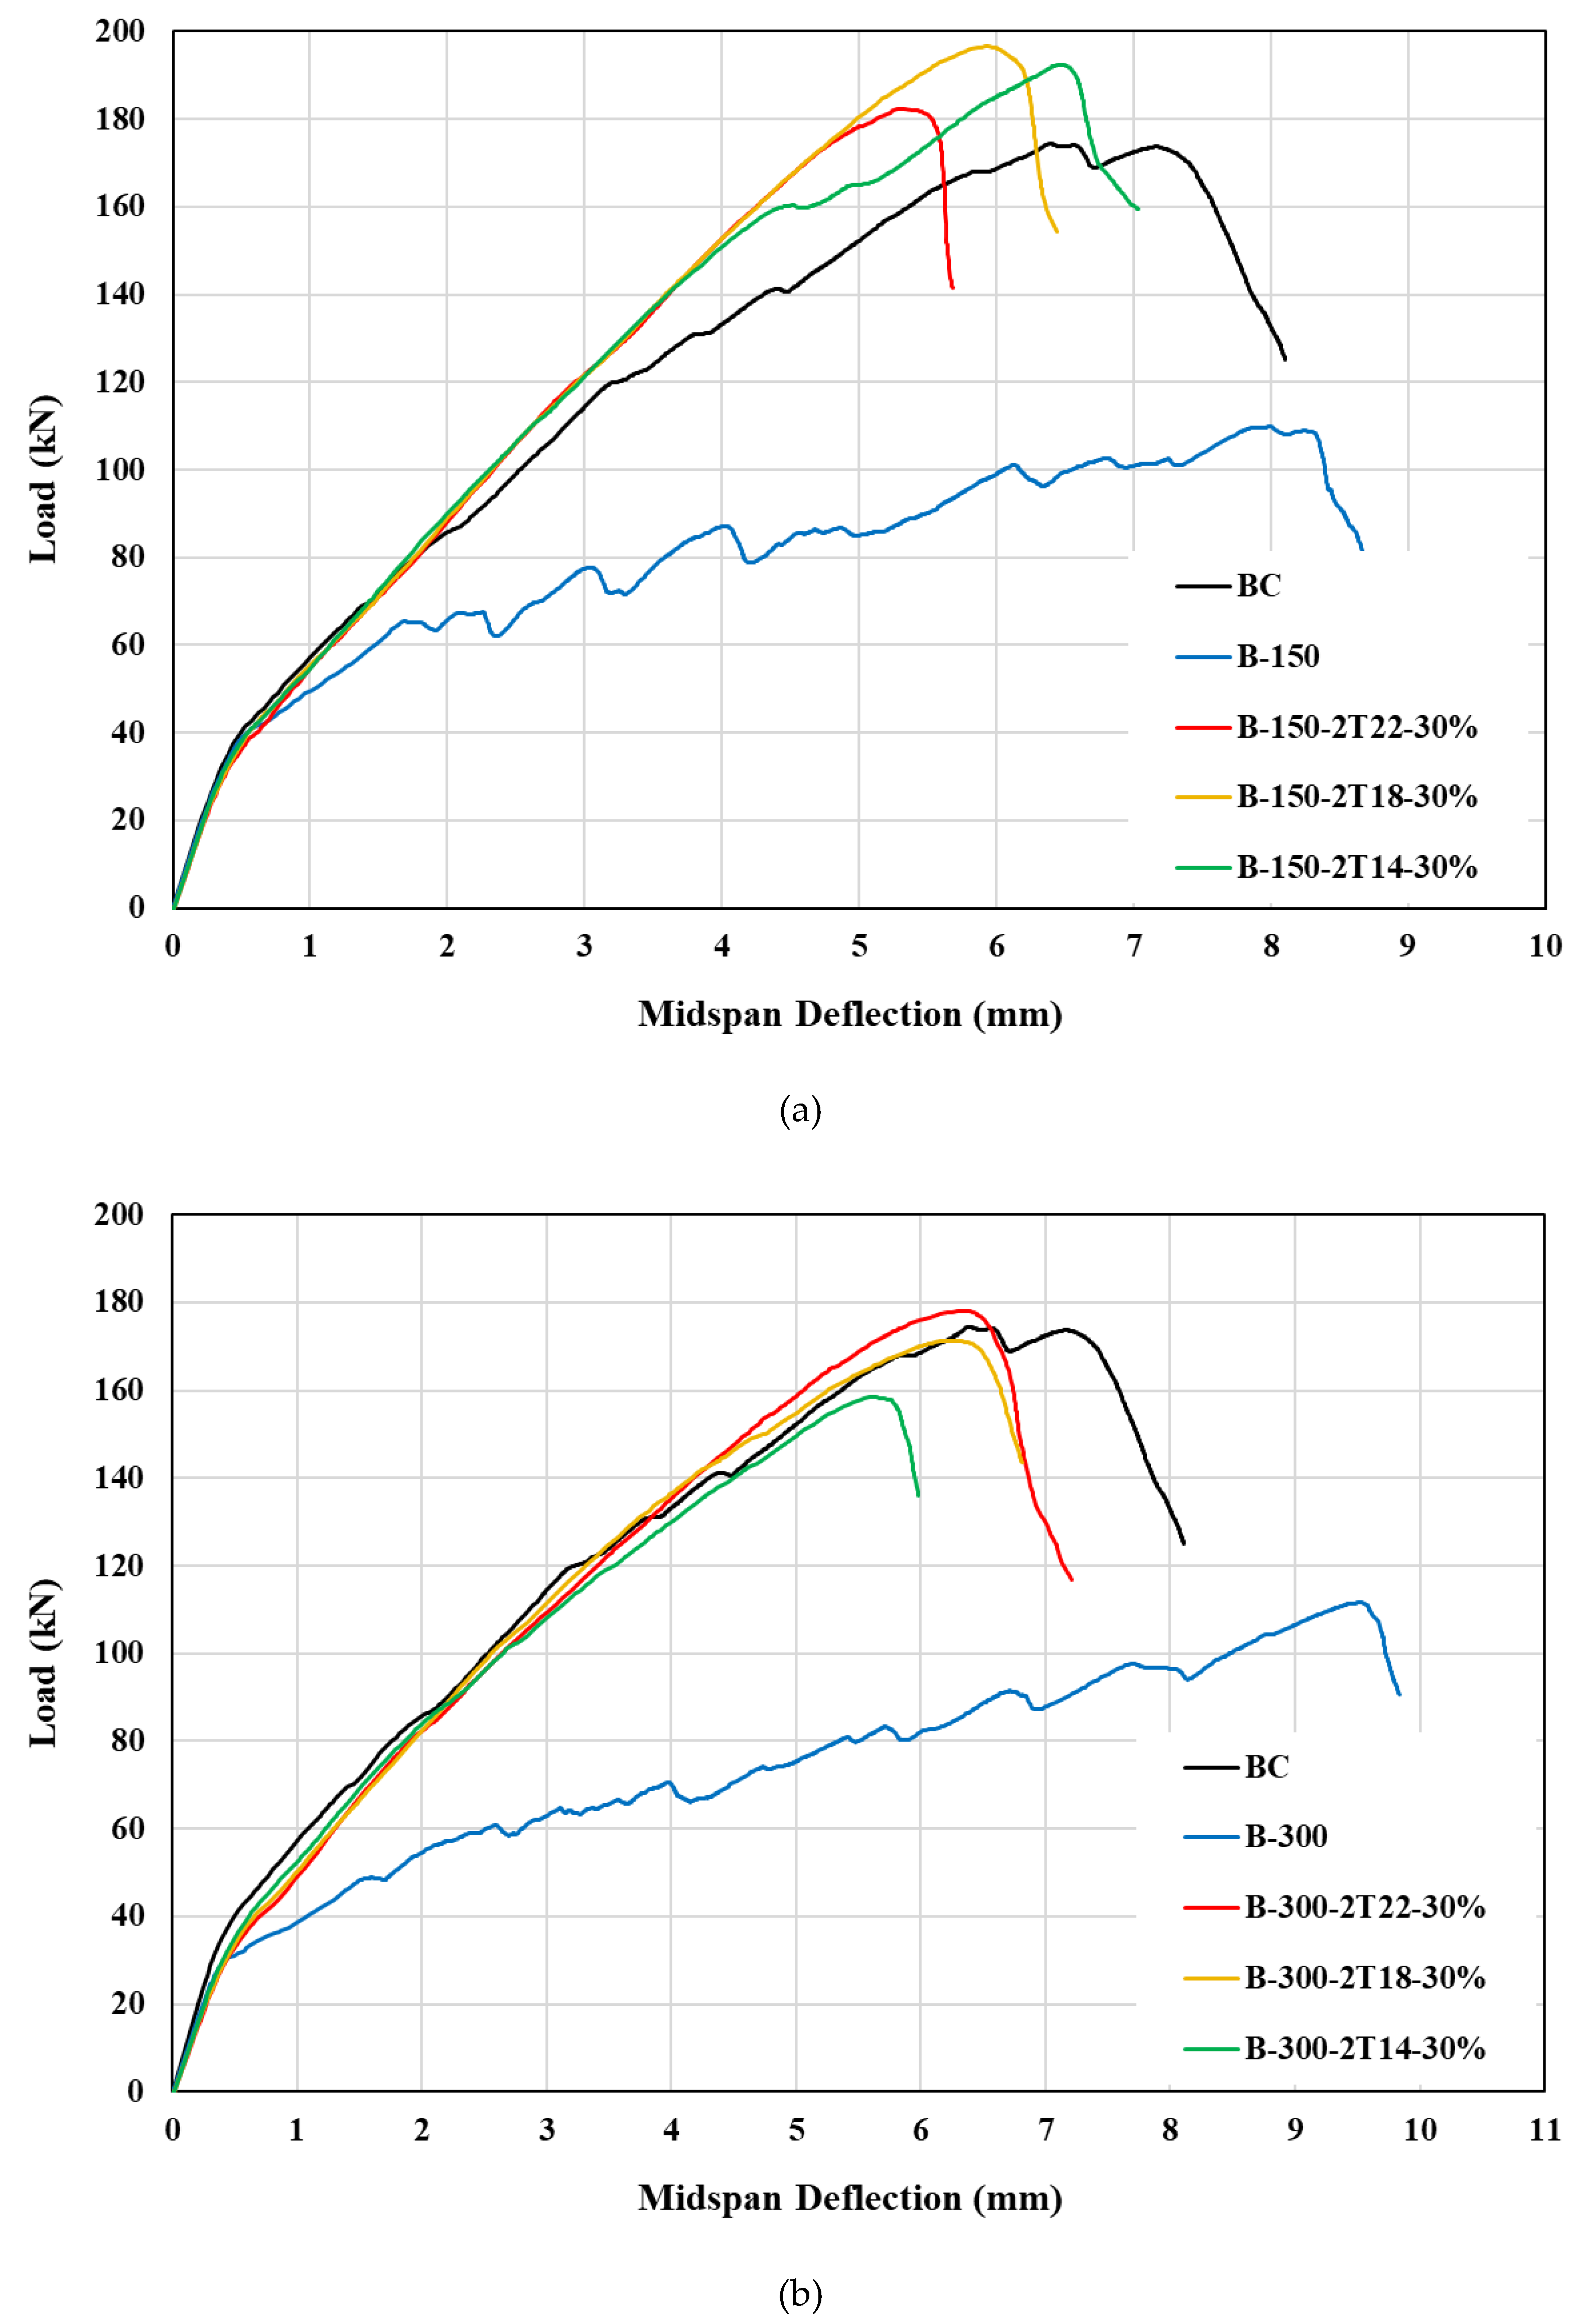
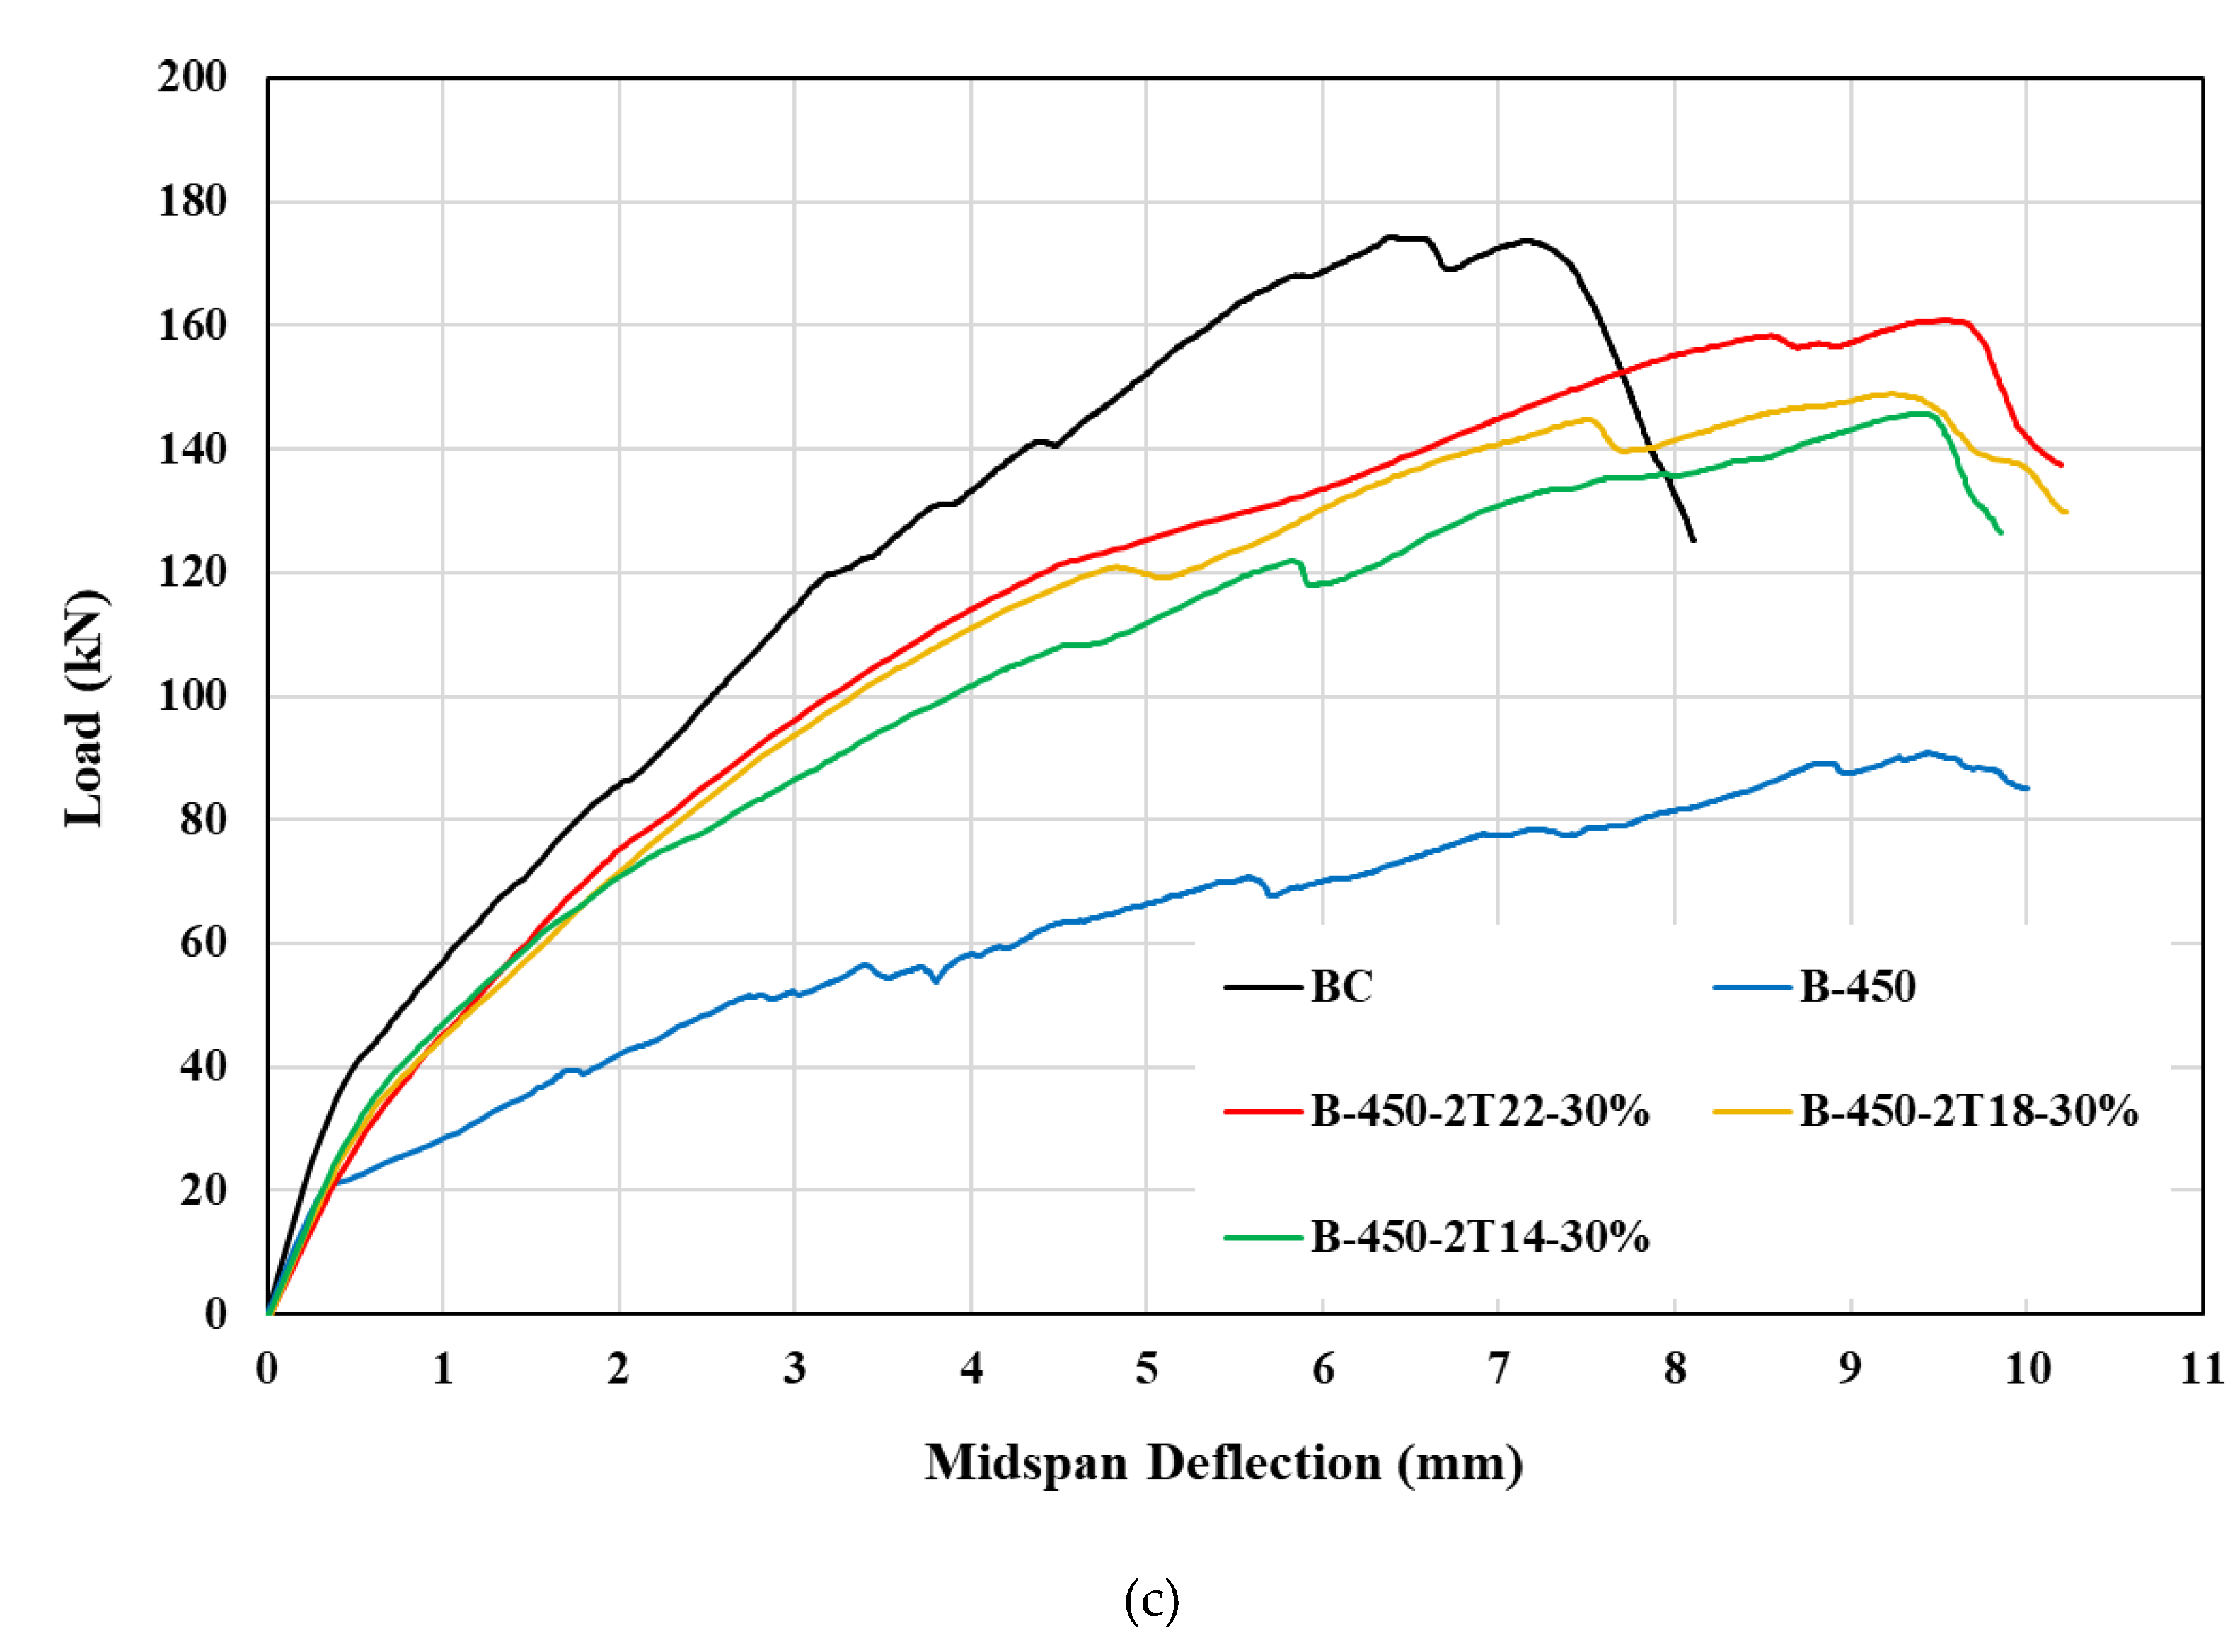
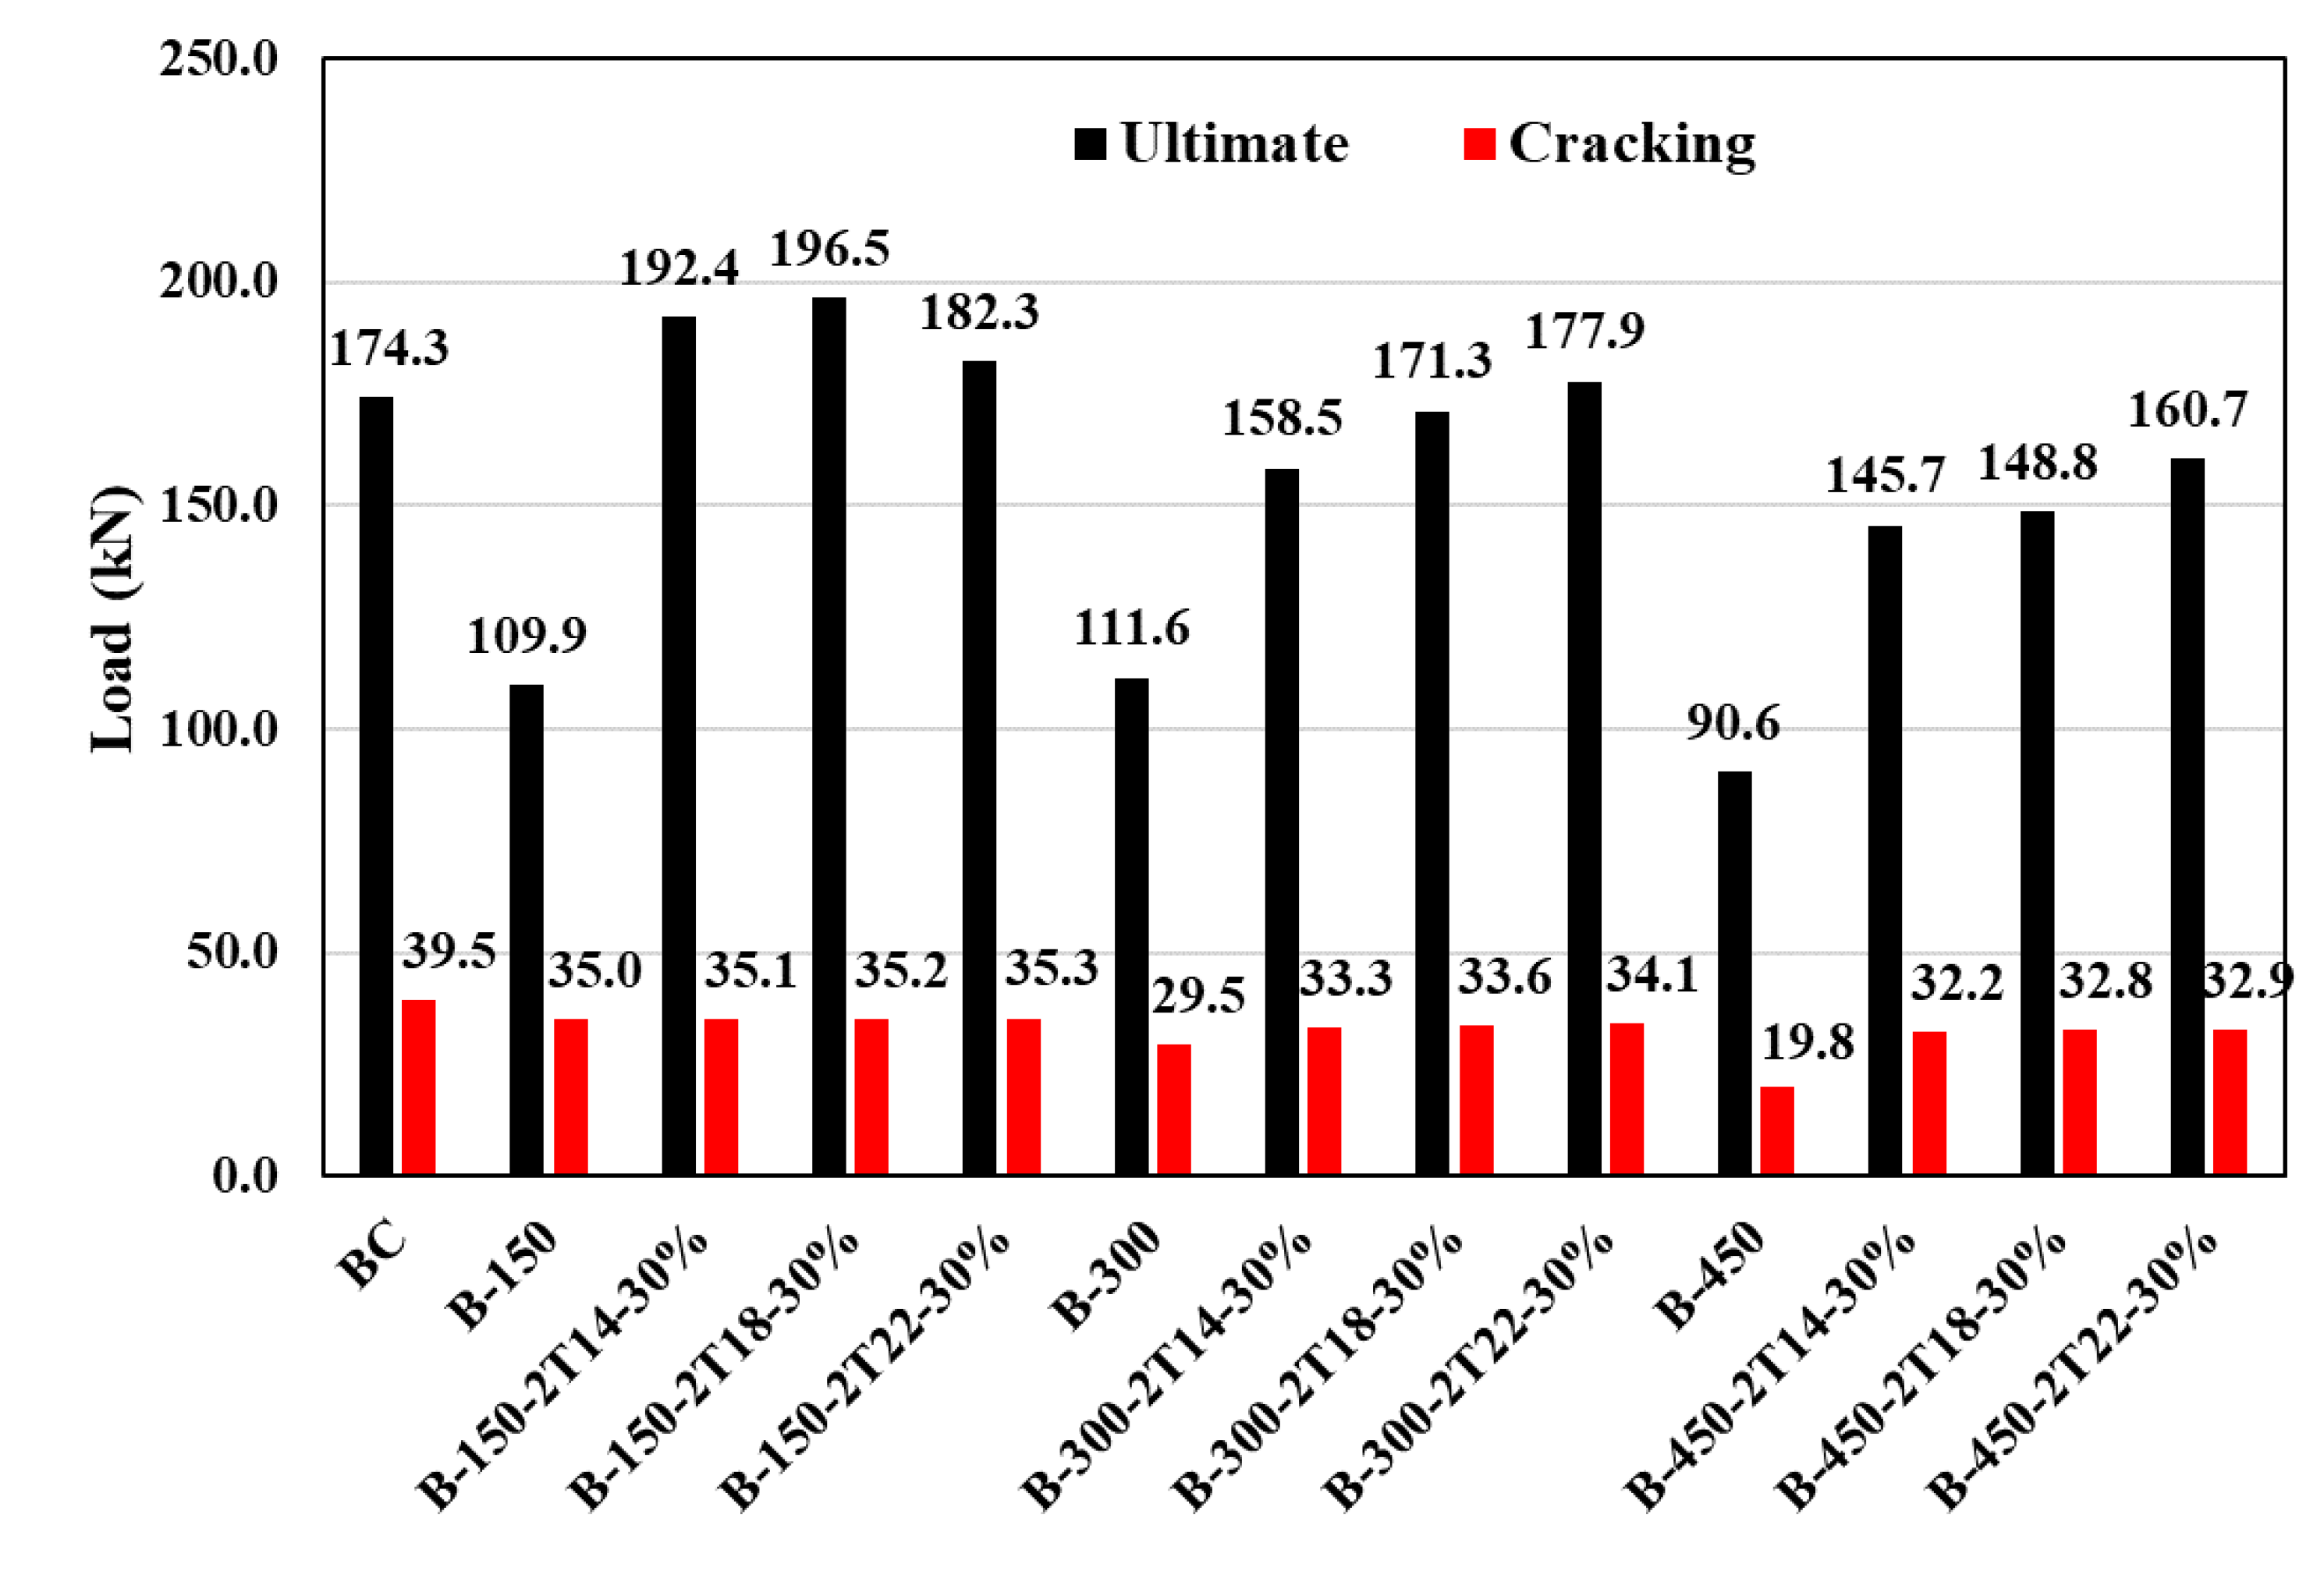
- Reinforcing small openings (100x150 mm) with Fe-SMA bars of different diameters (14, 18, and 22 mm) could enhance the beam's shear capacity and stiffness compared to the solid beam (BC).
- For beams with larger opening sizes (i.e., 450 mm), reinforcing the opening area with Fe-SMA bars can significantly improve the capacity and stiffness, but it still was unsuitable for restoring the full beam's strength and stiffness. Future studies could explore the feasibility of using higher Fe-SMA reinforcement ratios, such as 2T25, in beams with large openings to restore strength and stiffness.
- The findings provide important insights for engineers and construction professionals on strengthening beams with web openings, contributing to developing safer and more ductile structures. However, it is advisable to conduct further lab experiments in order to confirm, supplement, and expand upon the results of the numerical investigation.
Author Contributions
Funding
Data Availability Statement
Acknowledgments
Conflicts of Interest
References
- M. Sayed, “Numerical study using FE simulation on rectangular RC beams with vertical circular web openings in the shear zones,” Eng Struct, vol. 198, no. August, p. 109471, Nov. 2019. [CrossRef]
- X. F. Nie, S. S. Zhang, G. M. Chen, and T. Yu, “Strengthening of RC beams with rectangular web openings using externally bonded FRP: Numerical simulation,” Compos Struct, vol. 248, no. May, 2020. [CrossRef]
- X. F. Nie, S. S. Zhang, and T. Yu, “On the FE modelling of RC beams with a fibre-reinforced polymer (FRP)-strengthened web opening,” Compos Struct, vol. 271, no. May, 2021. [CrossRef]
- H. M. Elsanadedy, Y. A. Al-Salloum, T. H. Almusallam, A. O. Alshenawy, and H. Abbas, “Experimental and numerical study on FRP-upgraded RC beams with large rectangular web openings in shear zones,” Constr Build Mater, vol. 194, pp. 322–343, 2019. [CrossRef]
- M. J. Abed, M. M. Fayyadh, and O. R. Khaleel, “Effect of web opening diameter on performance and failure mode of CFRP repaired RC beams,” Mater Today Proc, vol. 42, pp. 388–398, 2020. [CrossRef]
- J. Jebasingh Daniel, “Experimental and numerical study on the cracking behavior and flexural strength of RC shallow beams with rectangular opening and varying length,” Structures, vol. 40, no. March, pp. 460–468, 2022. [CrossRef]
- A. El-kareim Shoeib and A. El-sayed Sedawy “Shear strength reduction due to introduced opening in loaded RC beams,” Journal of Building Engineering, vol. 13, no. February, pp. 28–40, 2017. [CrossRef]
- W. Mansour, “Numerical analysis of the shear behavior of FRP-strengthened continuous RC beams having web openings,” Eng Struct, vol. 227, no. November 2020, p. 111451, 2021. [CrossRef]
- X. F. Nie, S. S. Zhang, J. G. Teng, and G. M. Chen, “Experimental study on RC T-section beams with an FRP-strengthened web opening,” Compos Struct, vol. 185, no. February 2017, pp. 273–285, 2018. [CrossRef]
- X. F. Nie, S. S. Zhang, and T. Yu, “Behaviour of RC beams with a fibre-reinforced polymer (FRP)-strengthened web opening,” Compos Struct, vol. 252, no. July, 2020. [CrossRef]
- X. F. Nie, S. S. Zhang, and J. G. Teng, “Strengths of RC beams with a fibre-reinforced polymer (FRP)-strengthened web opening,” Compos Struct, vol. 258, no. November 2020, p. 113380, 2021. [CrossRef]
- A. A. Elansary, A. A. Abdel Aty, H. A. Abdalla, and M. Zawam, “Shear behavior of reinforced concrete beams with web opening near supports,” Structures, vol. 37, no. April 2021, pp. 1033–1041, 2022. [CrossRef]
- A. Hassan, A. M. Atta, and T. F. El-Shafiey, “Restoration of the shear capacity for RC beams with web openings using precast SHCC plates,” Structures, vol. 25, no. March, pp. 603–612, 2020. [CrossRef]
- N. F. Somes and W. G. Corley, “Circular openings in webs of continuous beams,” American Concrete Institute, ACI Special Publication, vol. SP-042, pp. 359–398, 1974.
- M. A. Mansur, “Effect of openings on the behaviour and strength of R/C beams in shear,” Cem Concr Compos, vol. 20, no. 6, pp. 477–486, 1998. [CrossRef]
- A. Ahmed, M. M. Fayyadh, S. Naganathan, and K. Nasharuddin,, “Reinforced concrete beams with web openings: A state of the art review,” Mater Des, vol. 40, pp. 90–102, 2012. [CrossRef]
- M. A. and K.-H. T. Mansur, Concrete Beams with Openings - Analysis and Design. Florida. USA.: CRC Press LLC, 1999.
- A. E.-H. Khalil, E. Etman, A. Atta, and M. Essam,“Ductility enhancement of RC beams strengthened with strain hardening cementi-tious composites,” in Proceedings of International Structural Engineering and Construction, 2017, vol. 4, no. 1. [CrossRef]
- S. C. Chin, N. Shafiq, and M. F. Nuruddin, “Strengthening of RC beams containing large opening at flexure with CFRP laminates,” International Science Index, vol. 5, no. 12, pp. 1419–1425, 2011.
- A. Pimanmas, “Strengthening R/C beams with opening by externally installed FRP rods: Behavior and analysis,” Compos Struct, vol. 92, no. 8, pp. 1957–1976, 2010. [CrossRef]
- A.E.-H. Khalil, E. Etman, A. Atta, and M. Essam, “Strengthening of RC beams subjected to cyclic load using ultra high-performance strain hardening cementitious composites,” in Proceedings of International Structural Engineering and Construction, 2017, vol. 4, no. 1. [CrossRef]
- A.A. El-Sisi, H. M. El-Emam, A. E.-M. I. El-Kholy, S. S. Ahmad, H. M. Sallam, and H. A. Salim, “Structural Behavior of RC Beams Containing Unreinforced Drilled Openings with and without CFRP Strengthening,” Polymers (Basel), vol. 14, no. 10, p. 2034, 2022. [CrossRef]
- E. Brühwiler and E. Denarié, “Rehabilitation and strengthening of concrete structures using ultra-high performance fibre reinforced concrete,” Structural Engineering International, vol. 23, no. 4, pp. 450–457, 2013. [CrossRef]
- E. H. Khalil, E. Etman, A. Atta, and M. Essam, “Behavior of RC beams strengthened with strain hardening cementitious composites (SHCC) subjected to monotonic and repeated loads,” Eng Struct, vol. 140, 2017. [CrossRef]
- A.Alyaseen, A. Poddar, J. Alissa, H. Alahmad, and F. Almohammed, “Behavior of CFRP-strengthened RC beams with web openings in shear zones: Numerical simulation,” Mater Today Proc, no. xxxx, 2022. [CrossRef]
- S. C. Chin, N. Shafiq, and M. F. Nuruddin, “Strengthening of RC beams containing large opening at flexure with CFRP laminates,” International Science Index, vol. 5, no. 12, pp. 1419–1425, 2011.
- M. Altaee, L. S. Cunningham, and M. Gillie, “Practical Application of CFRP Strengthening to Steel Floor Beams with Web Openings: A numerical Investigation,” J Constr Steel Res, vol. 155, pp. 395–408, 2019. [CrossRef]
- A.Pimanmas, “Strengthening R/C beams with opening by externally installed FRP rods: Behavior and analysis,” Compos Struct, vol. 92, no. 8, pp. 1957–1976, 2010. [CrossRef]
- T. El Maaddawy and S. Sherif, “FRP composites for shear strengthening of reinforced concrete deep beams with openings,” Compos Struct, vol. 89, no. 1, pp. 60–69, 2009. [CrossRef]
- A. Kumari and A. N. Nayak, “An experimental approach for strengthening of RC deep beams with web openings using GFRP fabrics and gas actuated fasteners,” Journal of Building Engineering, vol. 35, no. November 2020, p. 102027, 2021. [CrossRef]
- S. A. Hemzah, W. S. Alyhya, and S. A. Hassan, “Experimental investigation for structural behaviour of self-compacting reinforced concrete hollow beams with in-place circular openings strengthened with CFRP laminates,” Structures, vol. 24, no. September 2019, pp. 99–106, 2020. [CrossRef]
- M. Zeytinci, M. Şahin, M. A. Güler, and K. D. Tsavdaridis, “A practical design formulation for perforated beams with openings strengthened with ring type stiffeners subject to Vierendeel actions,” Journal of Building Engineering, vol. 43, no. June, 2021. [CrossRef]
- Czaderski, M. Shahverdi, R. Brönnimann, C. Leinenbach, and M. Motavalli, “Feasibility of iron-based shape memory alloy strips for prestressed strengthening of concrete structures,” Constr Build Mater, vol. 56, pp. 94–105, Apr. 2014. [CrossRef]
- S. Zareie, A. S. Issa, R. J. Seethaler, and A. Zabihollah, “Recent advances in the applications of shape memory alloys in civil infrastructures: A review,” Structures, vol. 27, pp. 1535–1550, Oct. 2020. [CrossRef]
- F. Azadpour and A. A. Maghsoudi, “Experimental and analytical investigation of continuous RC beams strengthened by SMA strands under cyclic loading,” Constr Build Mater, vol. 239, Apr. 2020. [CrossRef]
- S. Zareie, A. Z.-E. T. in Mechatronics, and undefined 2020, “Design and Analysis of SMA-Based Tendon for Marine Structures,” library.oapen.org.
- C. Czaderski et al., “Iron-based shape memory alloys (Fe-SMA) - a new material for prestressing concrete structures,” SMAR15 - 3rd Conference on Smart Monitoring, Assessment and Rehabilitation of Structures, 2015.
- W. Wang, C. Fang, and J. Liu, “Large size superelastic SMA bars: heat treatment strategy, mechanical property and seismic application,” Smart Mater Struct, vol. 25, no. 7, p. 075001, Jul. 2016. [CrossRef]
- M. R. Izadi, E. Ghafoori, M. Shahverdi, M. Motavalli, and S. Maalek, “Development of an iron-based shape memory alloy (Fe-SMA) strengthening system for steel plates,” Eng Struct, vol. 174, pp. 433–446, Nov. 2018. [CrossRef]
- K. Hong, S. Lee, S. Han, and Y. Yeon, “Evaluation of Fe-Based Shape Memory Alloy (Fe-SMA) as Strengthening Material for Reinforced Concrete Structures,” Applied Sciences, vol. 8, no. 5, p. 730, May 2018. [CrossRef]
- B. Schranz, J. Michels, C. Czaderski, M. Motavalli, T. Vogel, and M. Shahverdi, “Strengthening and prestressing of bridge decks with ribbed iron-based shape memory alloy bars,” Eng Struct, vol. 241, Aug. 2021. [CrossRef]
- R. Suhail, G. Amato, B. Broderick, M. Grimes, and D. McCrum, “Efficacy of prestressed SMA diagonal loops in seismic retrofitting of non-seismically detailed RC beam-column joints,” Eng Struct, vol. 245, Oct. 2021. [CrossRef]
- M. Alhamaydeh, M. Elkafrawy, and S. Banu, “Seismic Performance and Cost Analysis of UHPC Tall Buildings in UAE with Ductile Coupled Shear Walls,” Materials, vol. 15, no. 8, 2022. [CrossRef]
- M. Altaee, L. S. Cunningham, and M. Gillie, “Practical Application of CFRP Strengthening to Steel Floor Beams with Web Openings: A numerical Investigation,” J Constr Steel Res, vol. 155, pp. 395–408, 2019. [CrossRef]
- A. Alyaseen, A.Poddar, J. Alissa, H. Alahmad, and F. Almohammed, “Behavior of CFRP-strengthened RC beams with web openings in shear zones: Numerical simulation,” Mater Today Proc, no. xxxx, 2022. [CrossRef]
- M. Alhamaydeh, M. E. Elkafrawy, F. M. Amin, A. M. Maky, and F. Mahmoudi, “Analysis and Design of UHPC Tall Buildings in UAE with Ductile Coupled Shear Walls Lateral Load Resisting System,” in 2022 Advances in Science and Engineering Technology International Conferences, ASET 2022, 2022. [CrossRef]
- S. Venkatachalam, K. Vishnuvardhan, G. D. Amarapathi, S. R. Mahesh, and M. Deepasri, “Experimental and finite element modelling of reinforced geopolymer concrete beam,” Mater Today Proc, vol. 45, pp. 6500–6506, 2020. [CrossRef]
- H. Behnam, J. S. Kuang, and B. Samali, “Parametric finite element analysis of RC wide beam-column connections,” Comput Struct, vol. 205, pp. 28–44, 2018. [CrossRef]
- M. Alhamaydeh, M. E. Elkafrawy, N. G. Aswad, R. Talo, and S. Banu, “Evaluation of UHPC Tall Buildings in UAE with Ductile Coupled Shear Walls under Seismic Loading,” in 2022 Advances in Science and Engineering Technology International Conferences, ASET 2022, 2022. [CrossRef]
- M. Alhamaydeh, M. E. Elkafrawy, M. Kyaure, M. Elyas, and F. Uwais, “Cost Effectiveness of UHPC Ductile Coupled Shear Walls for High-Rise Buildings in UAE Subjected to Seismic Loading,” in 2022 Advances in Science and Engineering Technology International Conferences, ASET 2022, 2022. [CrossRef]
- M. Shahverdi, C. Czaderski, P. Annen, and M. Motavalli, “Strengthening of RC beams by iron-based shape memory alloy bars embedded in a shotcrete layer,” Eng Struct, vol. 117, pp. 263–273, 2016. [CrossRef]
- A. Khalil, M. Elkafrawy, W. Abuzaid, R. Hawileh, and M. AlHamaydeh, “Flexural Performance of RC Beams Strengthened with Pre-Stressed Iron-Based Shape Memory Alloy (Fe-SMA) Bars: Numerical Study,” Buildings, vol. 12, no. 12, p. 2228, Dec. 2022. [CrossRef]
- M. E. Elkafrawy, A. Mohsen Khalil, W. Abuzaid, R. A. Hawileh, and M. Alhamaydeh, “Nonlinear Finite Element Analysis (NLFEA) of Pre-stressed RC Beams Reinforced with Iron-Based Shape Memory Alloy (Fe-SMA),” in 2022 Advances in Science and Engineering Technology International Conferences, ASET 2022, 2022. [CrossRef]
- A.E.-H. Khalil, E. Etman, A. Atta, and M. Essam, “Nonlinear behavior of RC beams strengthened with strain hardening cementitious composites subjected to monotonic and cyclic loads,” Alexandria Engineering Journal, vol. 55, no. 2, 2016. [CrossRef]
- M. Elkafrawy, A. Alashkar, R. Hawileh, and M. Alhamaydeh, “FEA Investigation of Elastic Buckling for Functionally Graded Material (FGM) Thin Plates with Different Hole Shapes under Uniaxial Loading,” Buildings, vol. 12, no. 6, 2022. [CrossRef]
- A. Alashkar, M. Elkafrawy, R. Hawileh, and M. AlHamaydeh, “Buckling Analysis of Functionally Graded Materials (FGM) Thin Plates with Various Circular Cutout Arrangements,” Journal of Composites Science, vol. 6, no. 9, 2022. [CrossRef]
- M. Smith, “ABAQUS/Standard User’s Manual, Version 6.9,” Dassault Systèmes Simulia Corp, 2009.
- D. C. Kent and R. Park, “Flexural Members with Confined Concrete,” Journal of the Structural Division, vol. 97, no. 7, pp. 1969–1990, Jul. 1971. [CrossRef]
- L. S. Hsu and C.-T. T. Hsu, “Hsu1994,” Magazine of Concrete Research, vol. 46, no. 169, pp. 301–312, 1994.
- C.E.-I. du Beton, “CEB-FIP MODEL CODE 1990: DESIGN CODE,” Thomas Telford Publishing, 1993.
- M. P. Collins and D. Mitchell, Prestressed concrete structures, vol. 9. Prentice Hall Englewood Cliffs, NJ, 1991.
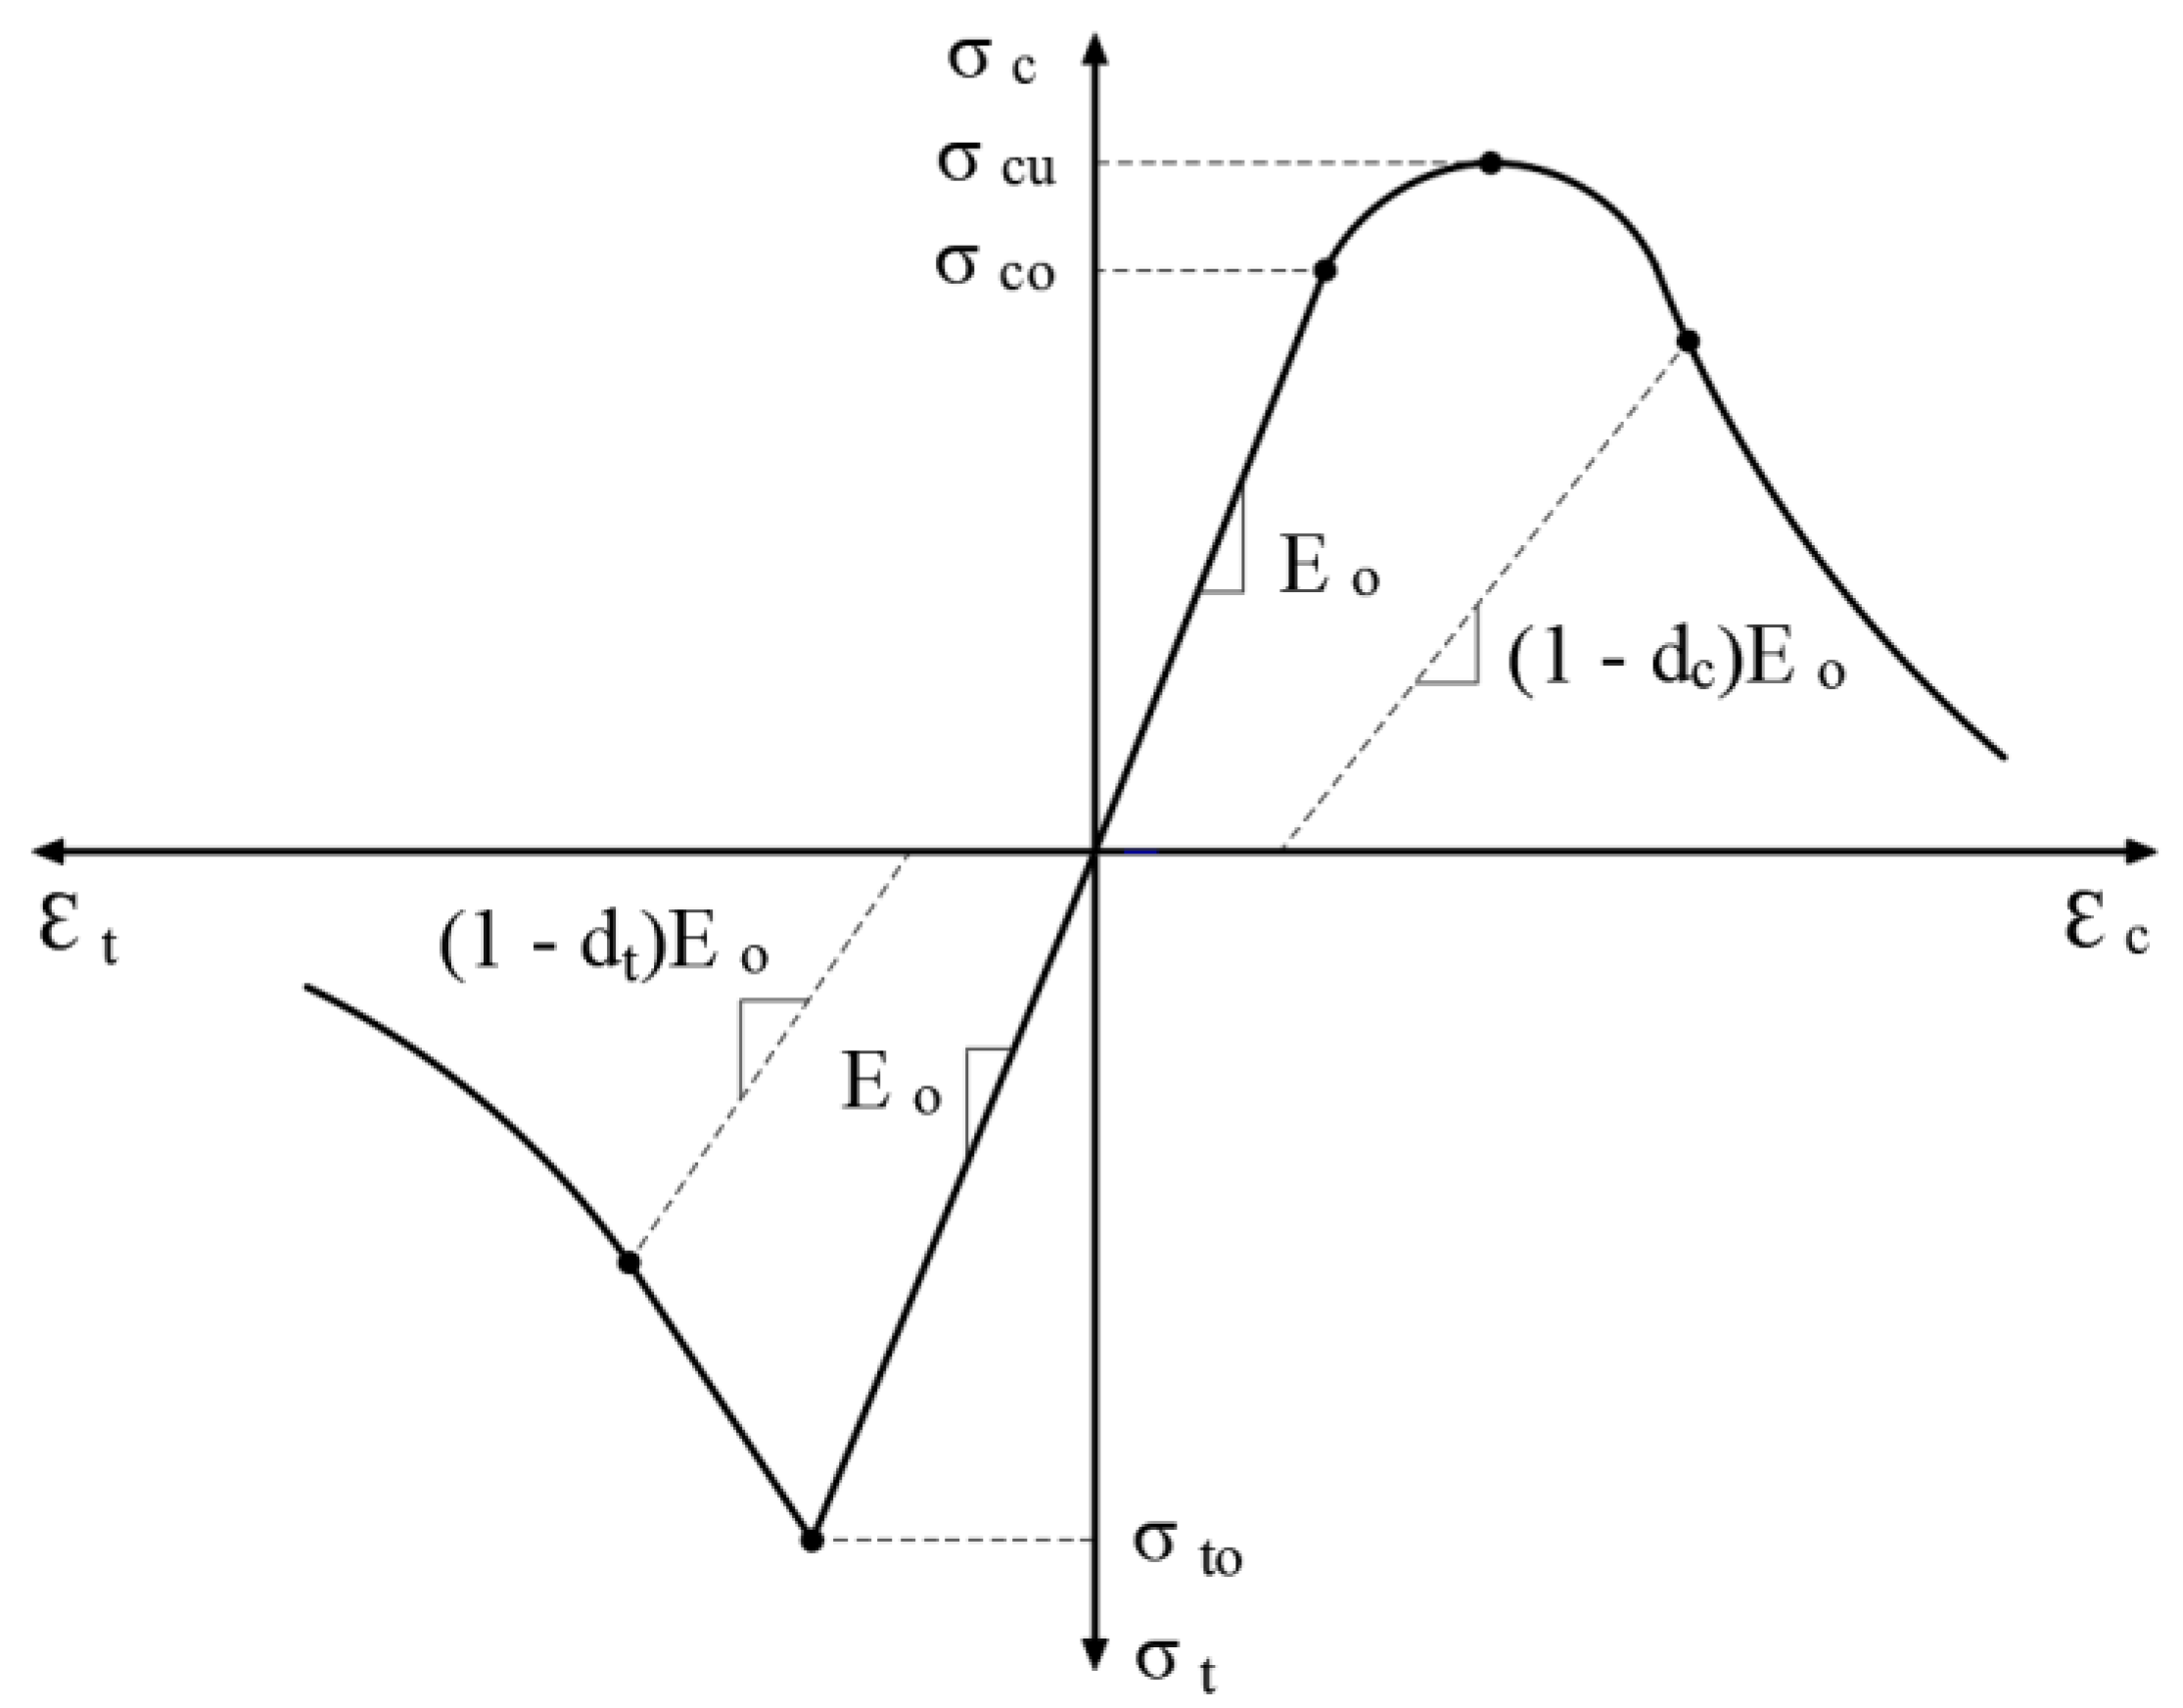
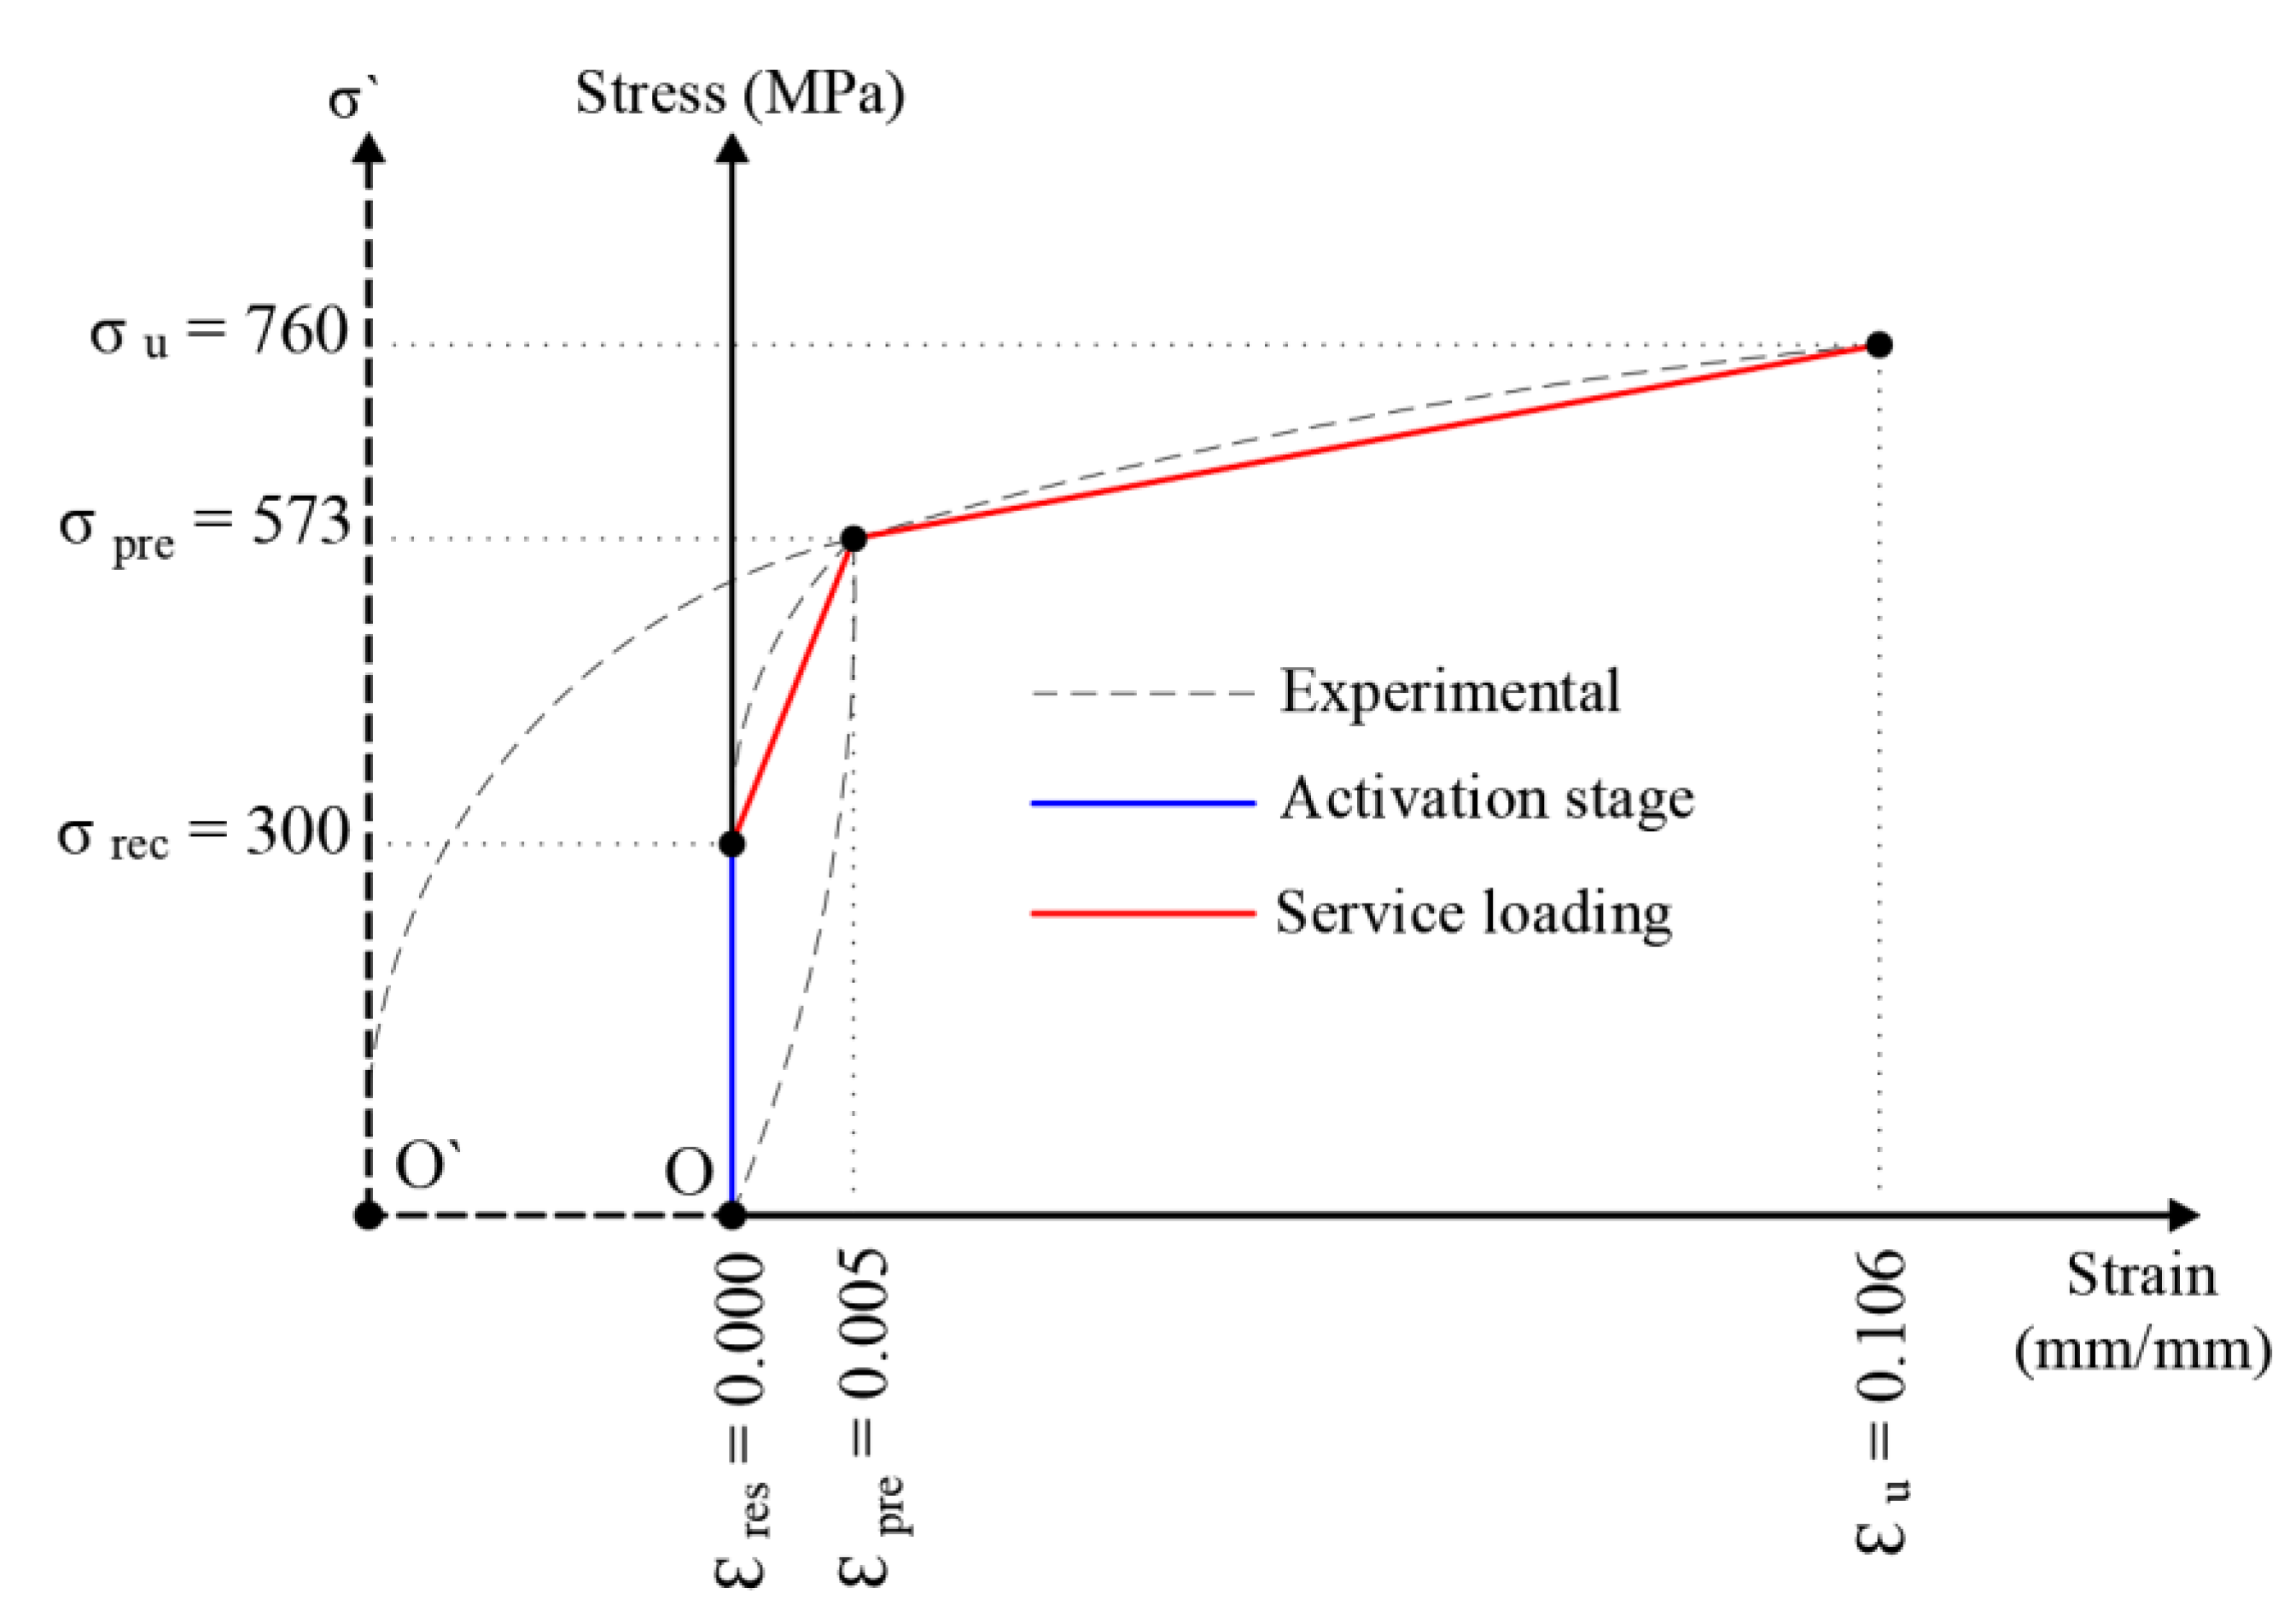

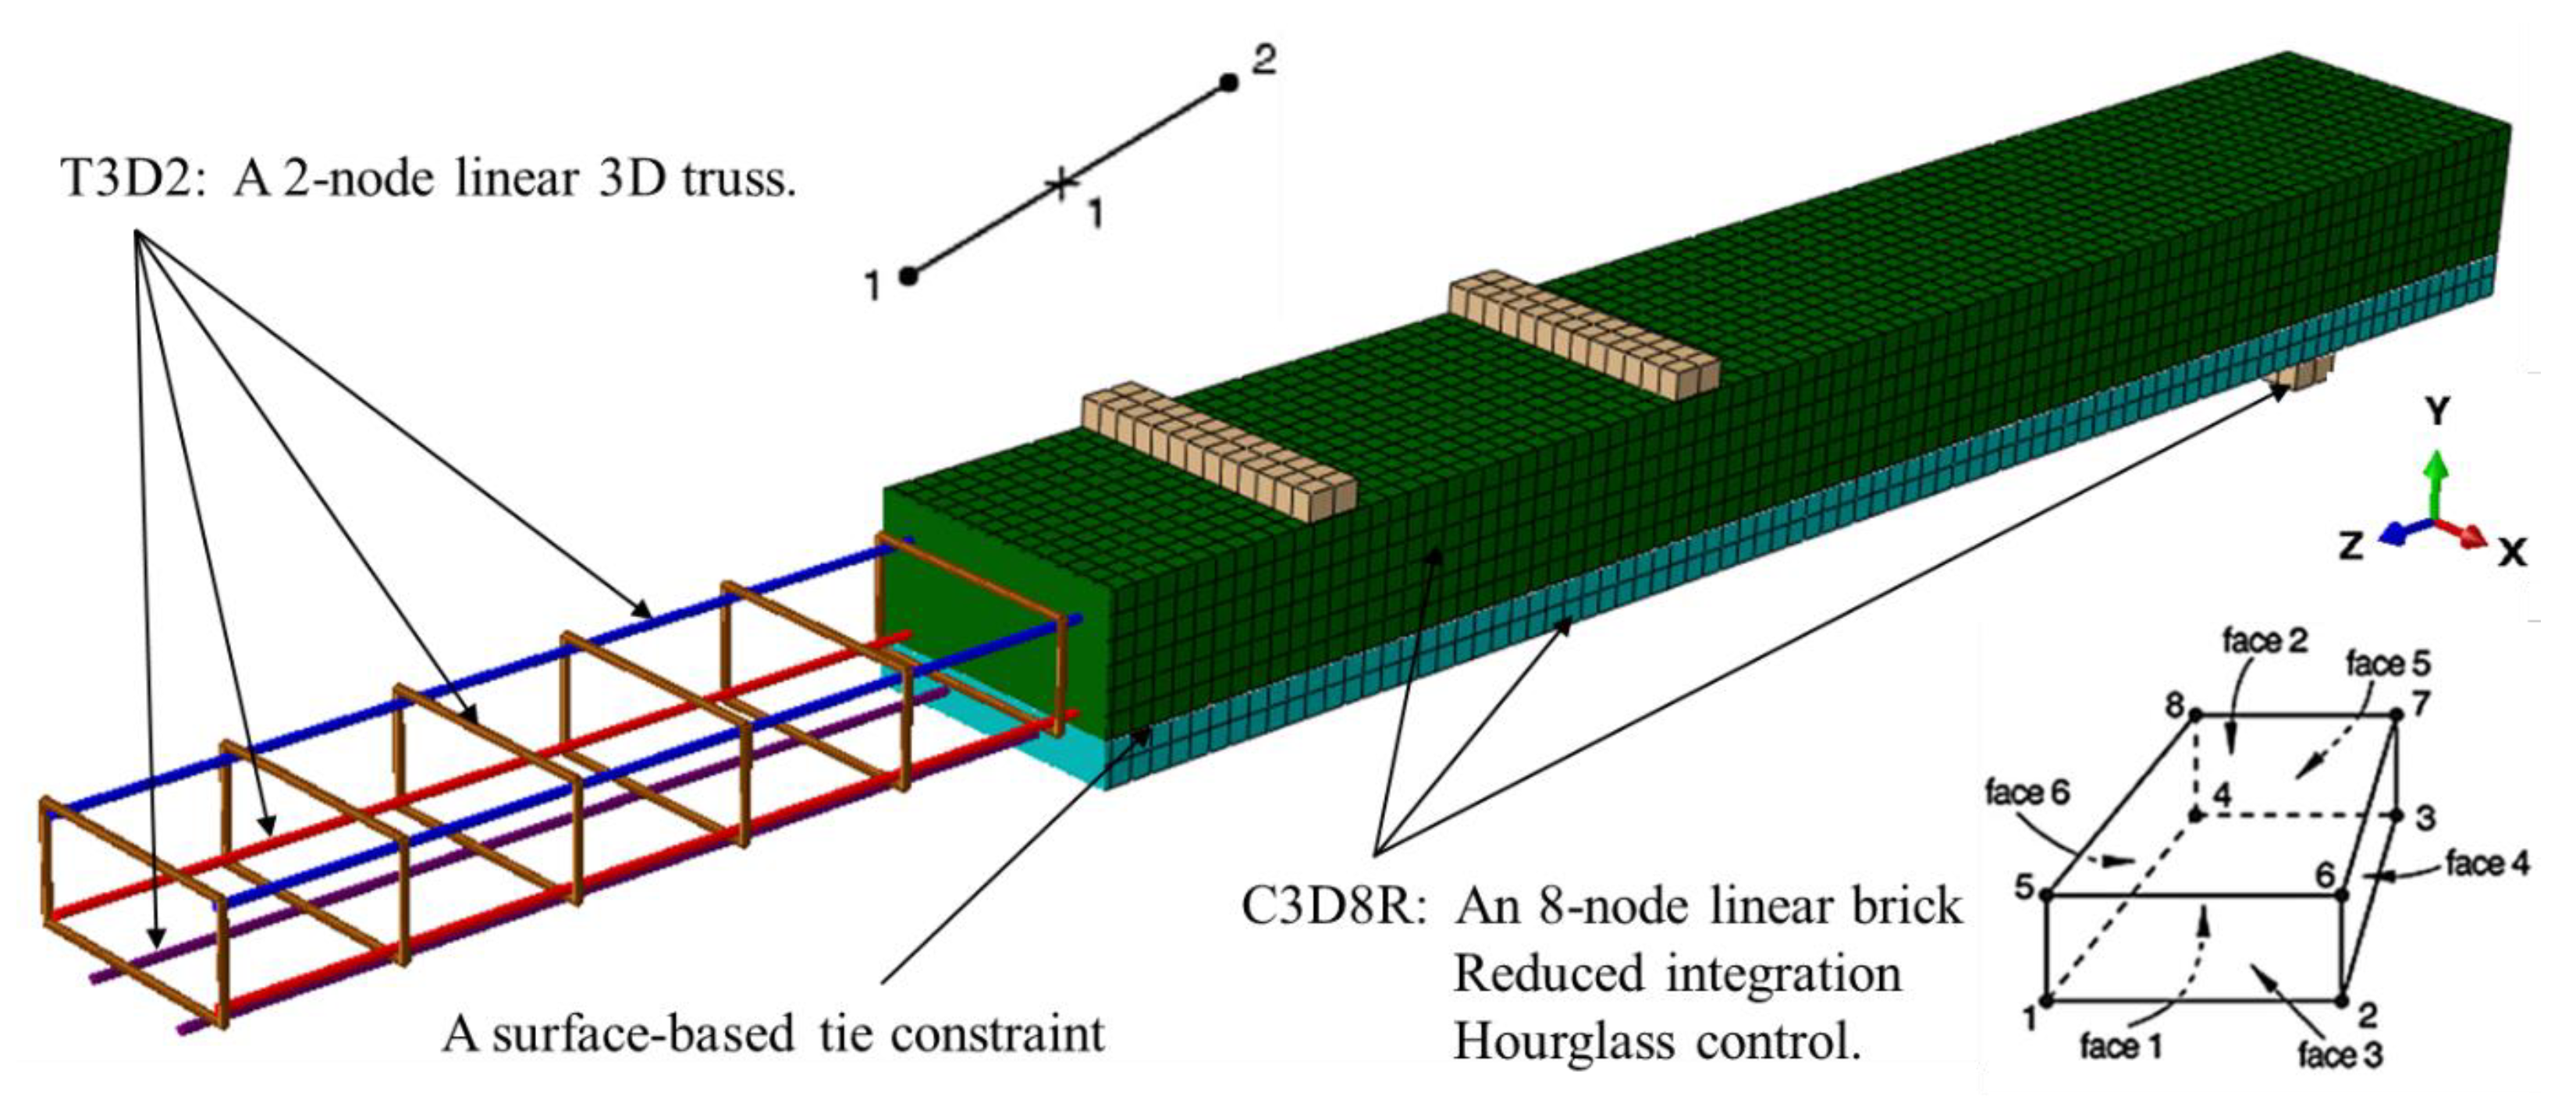
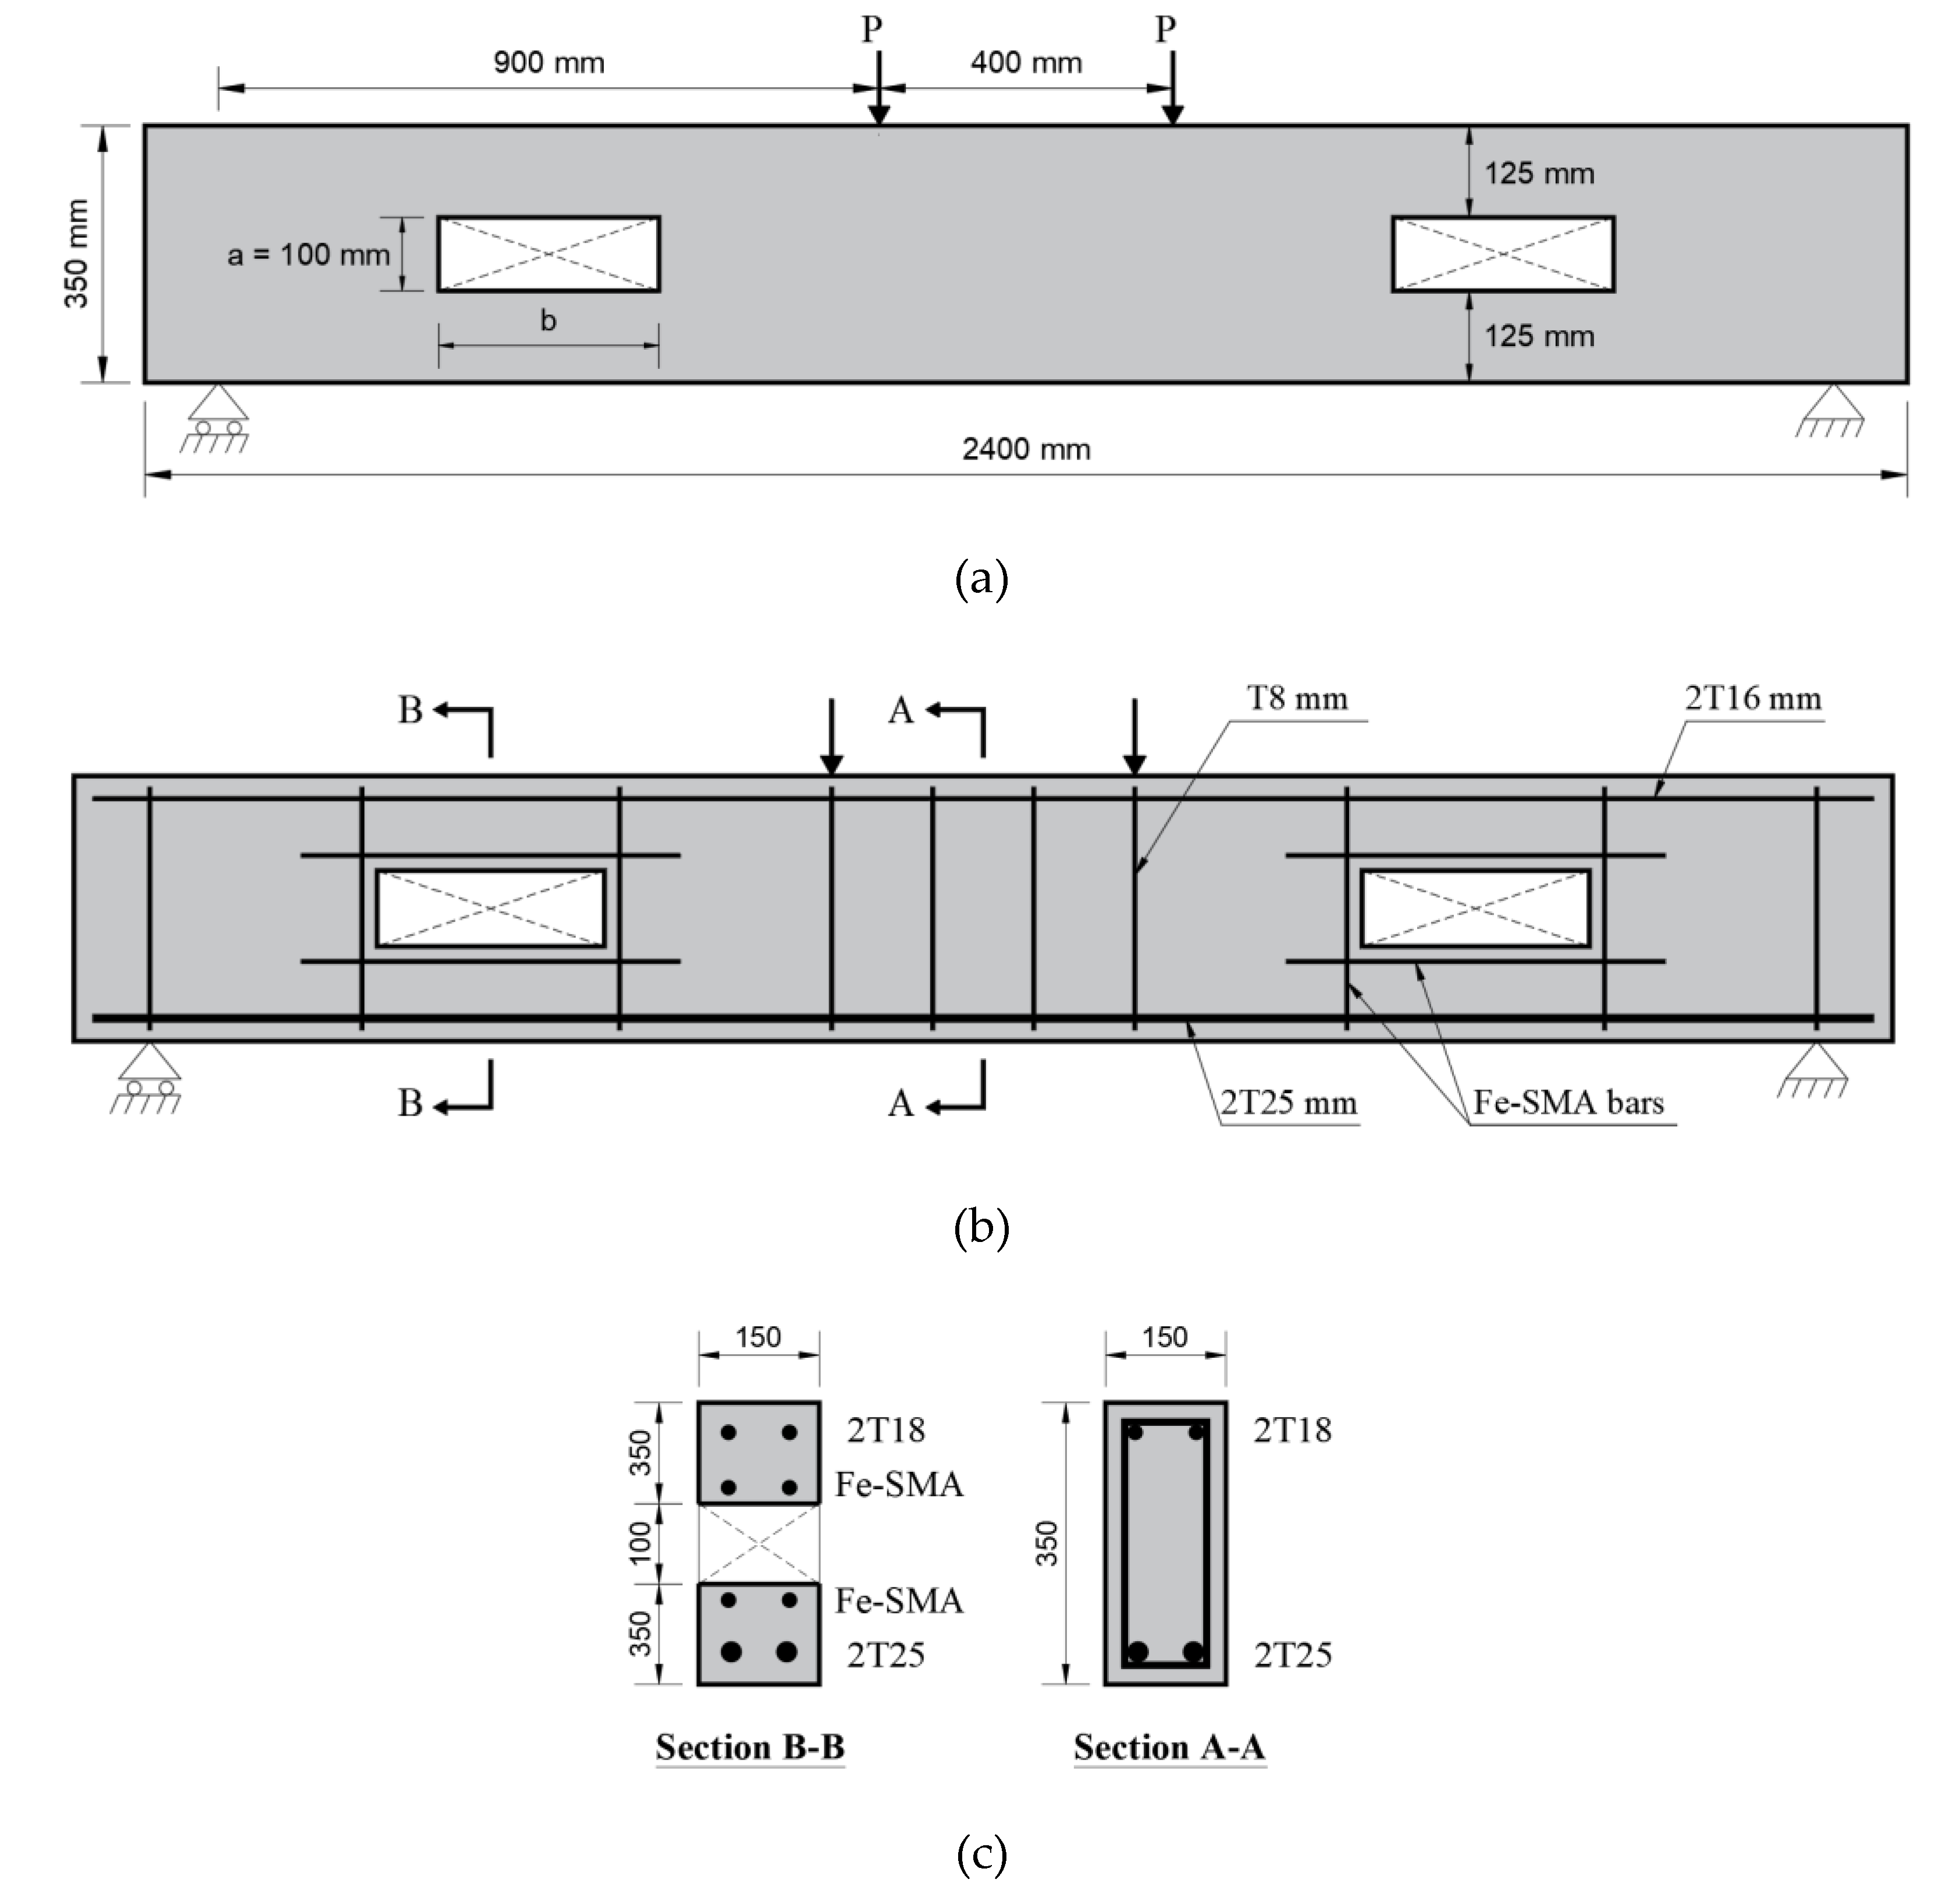
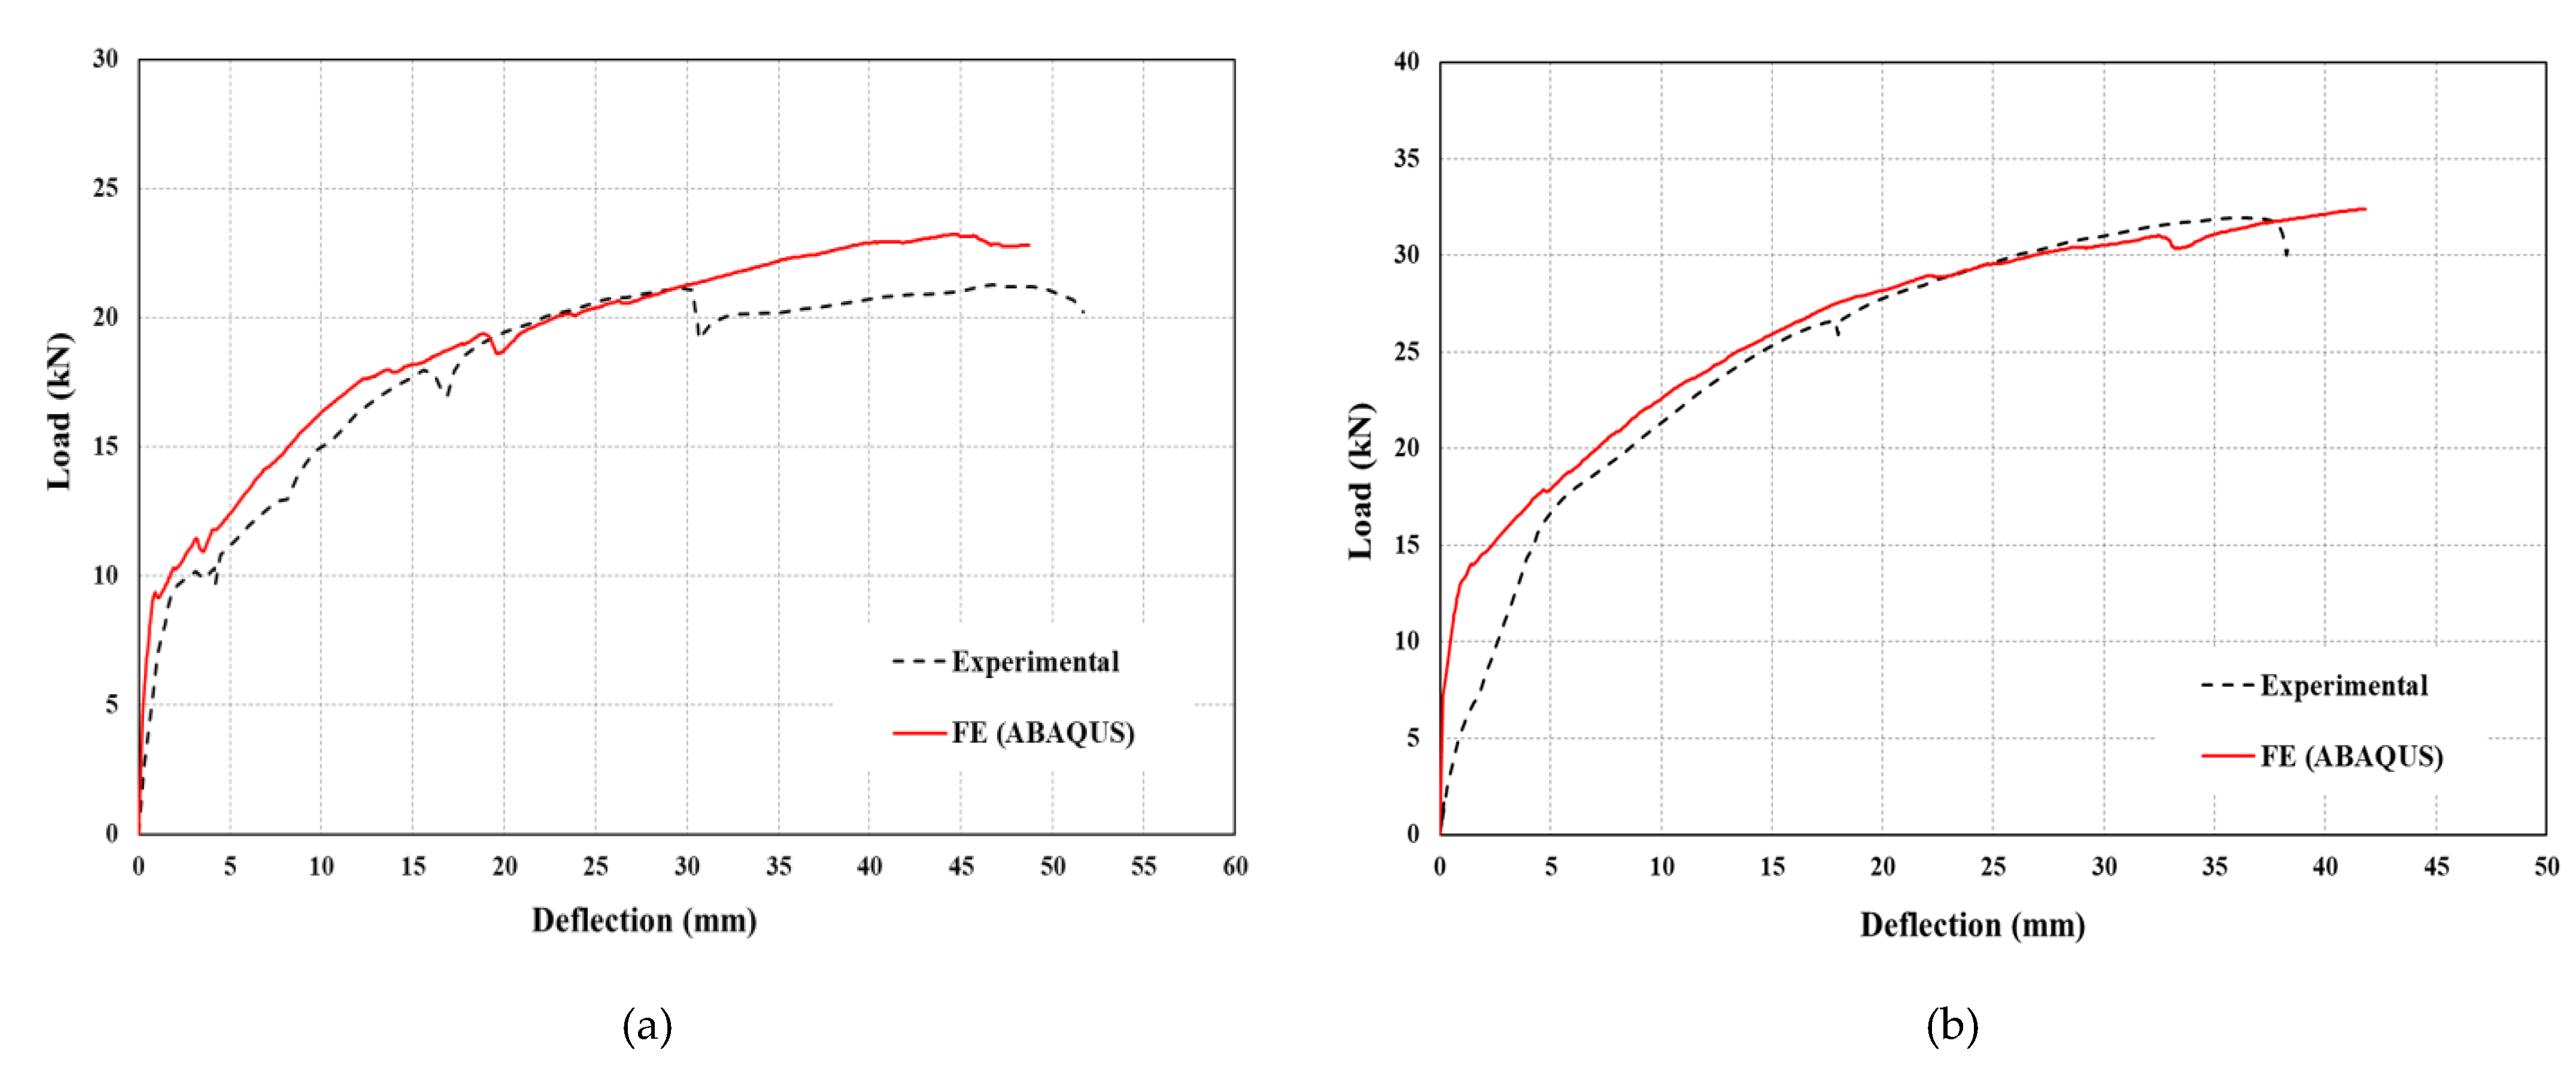
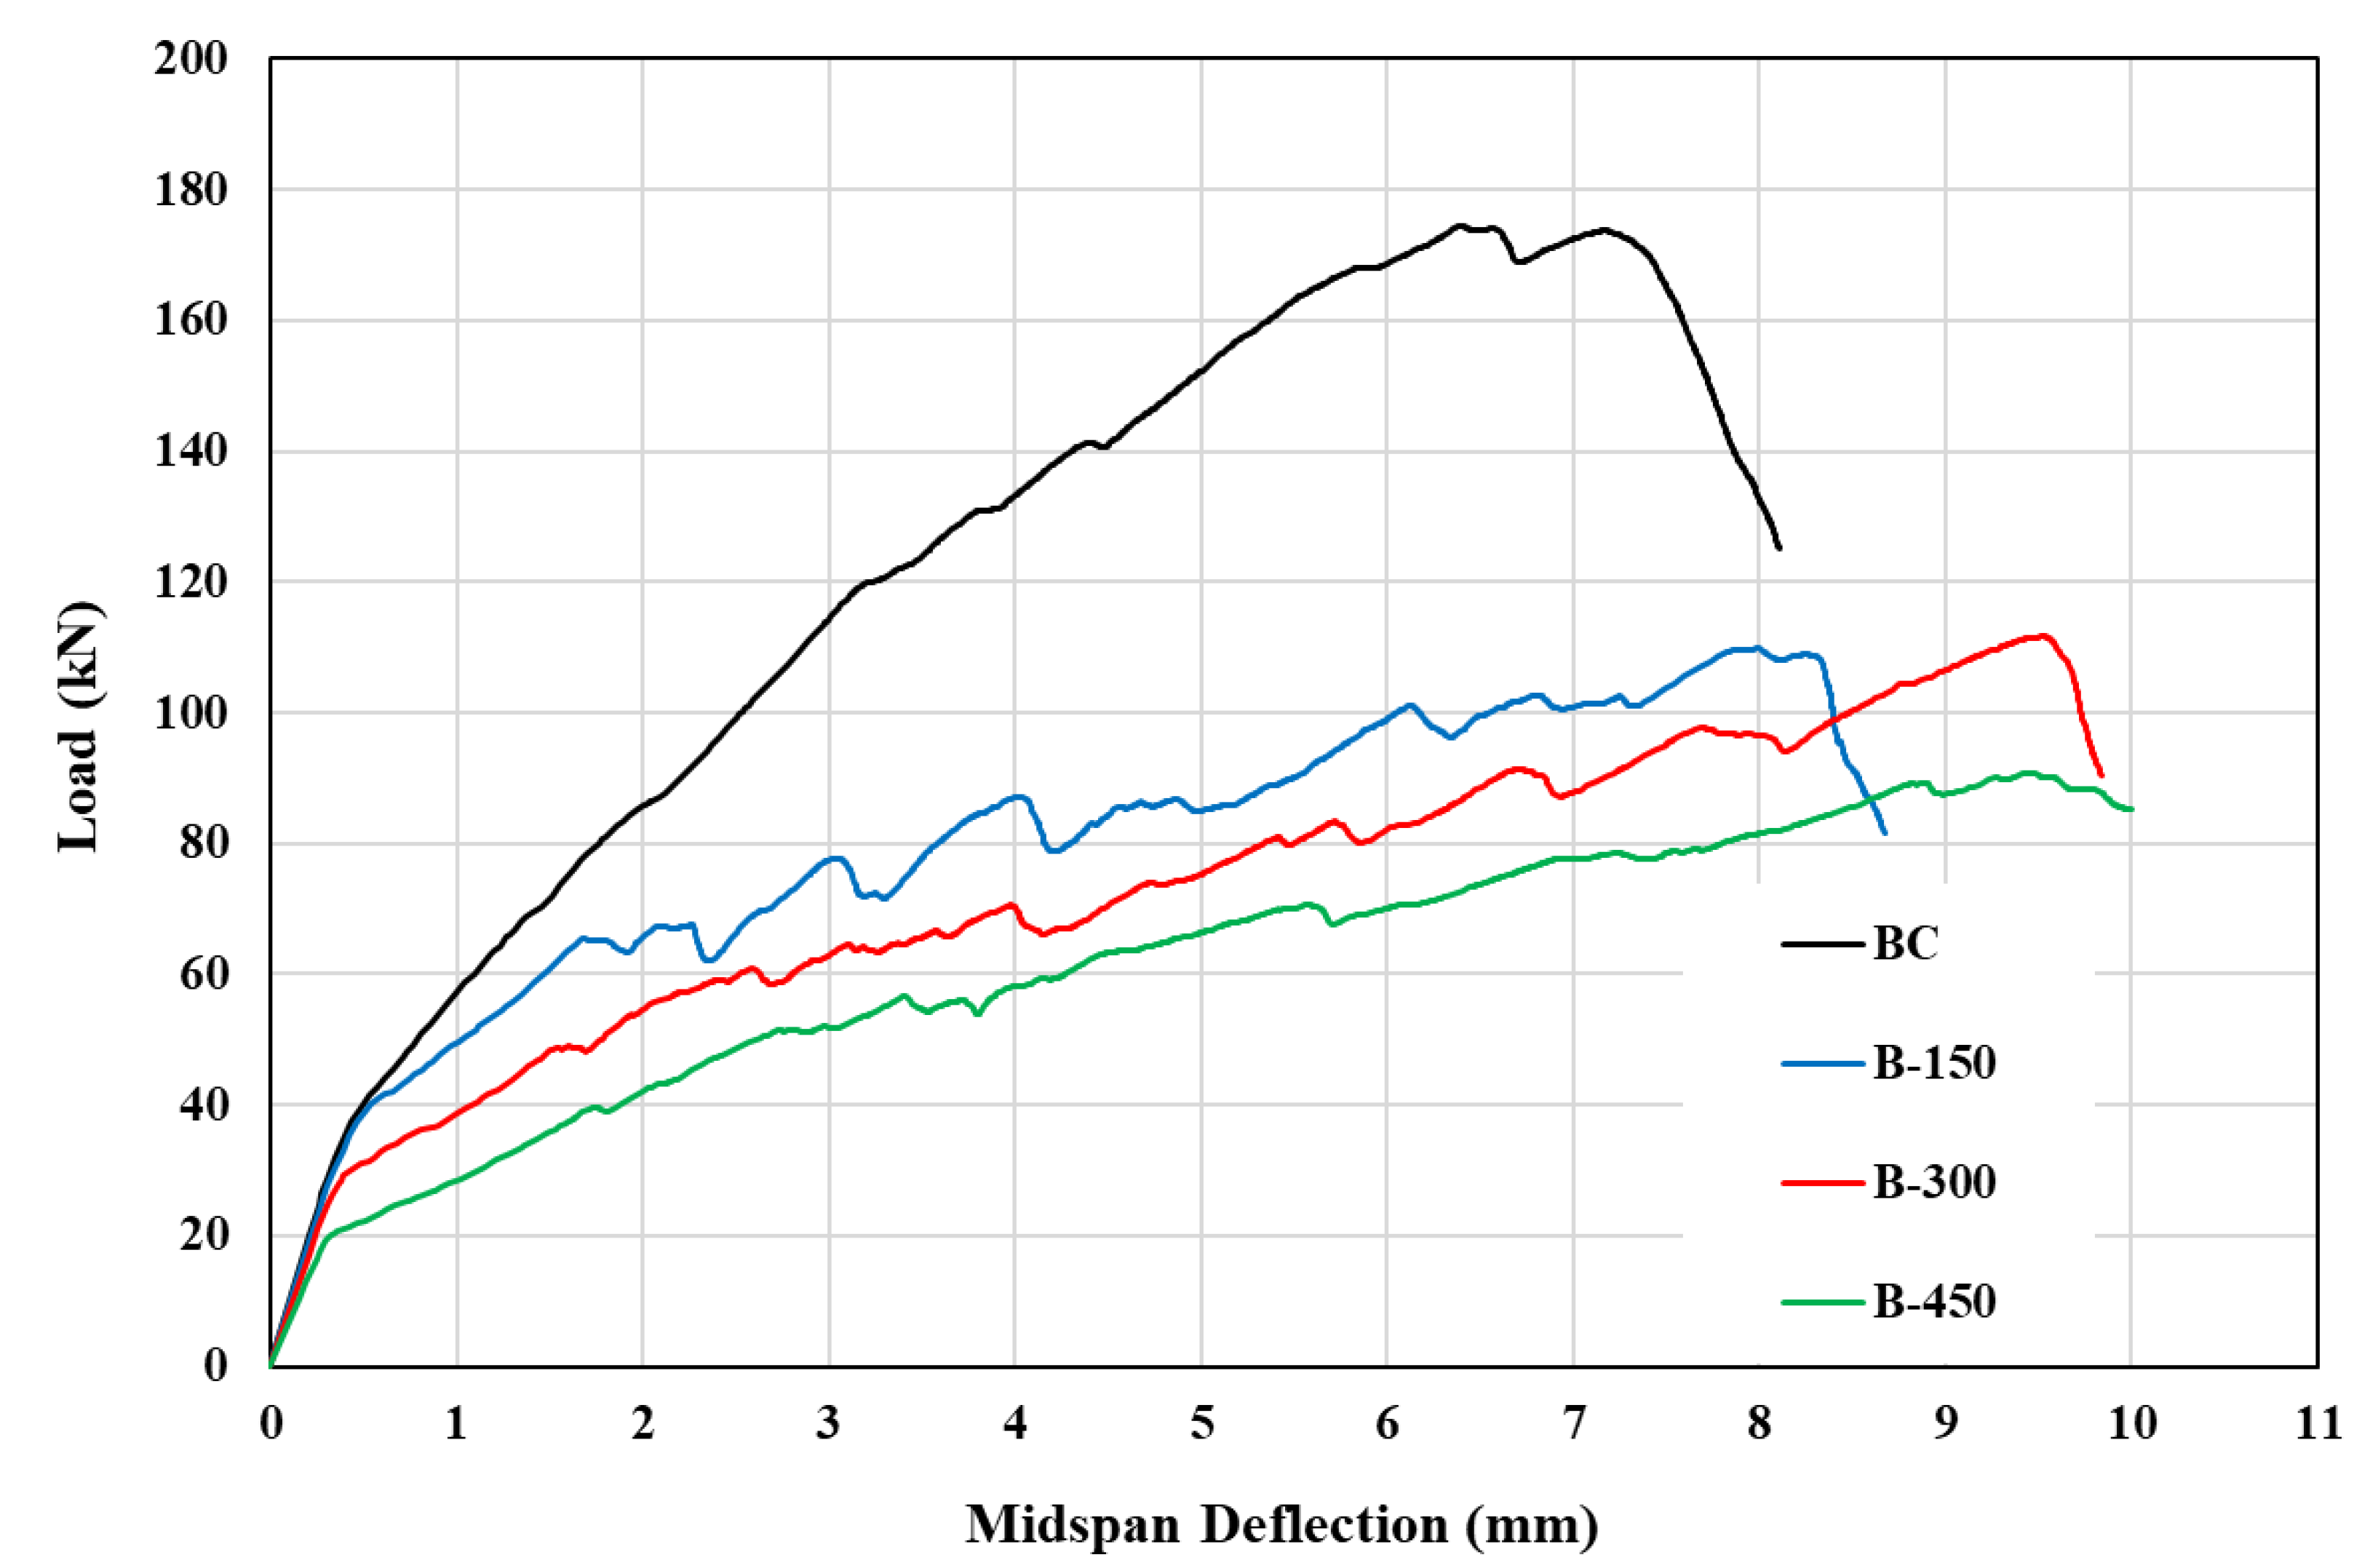
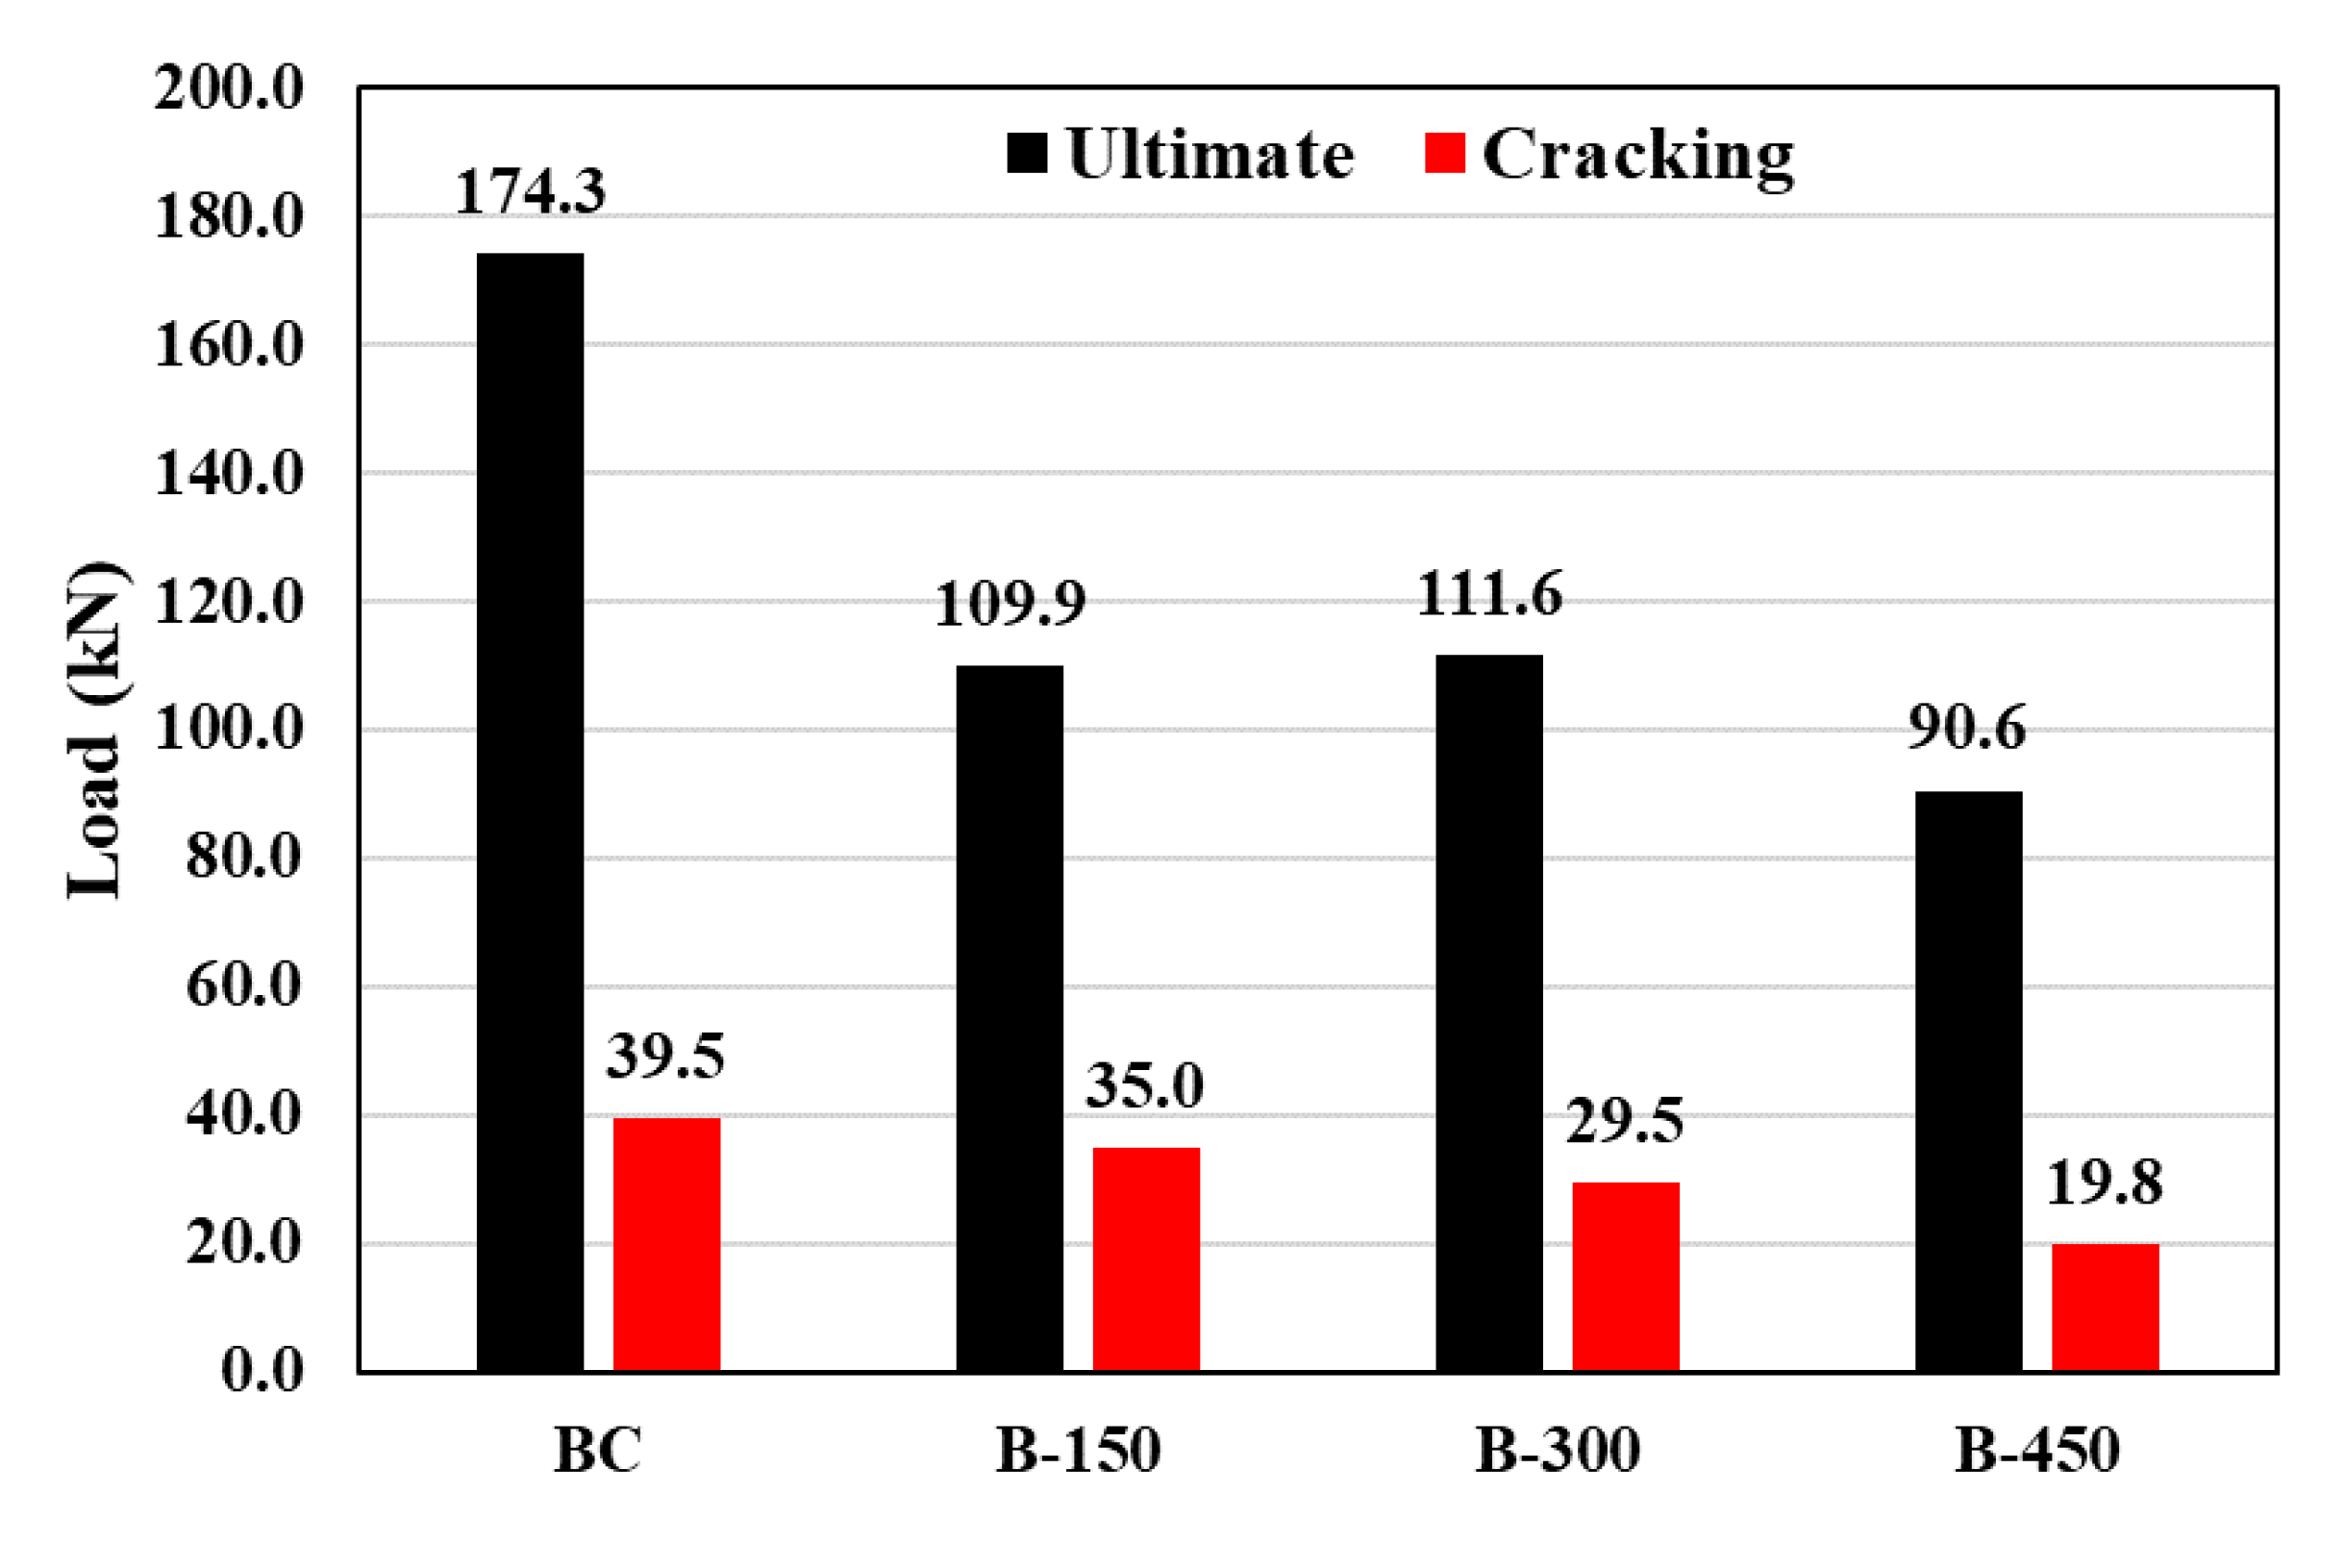
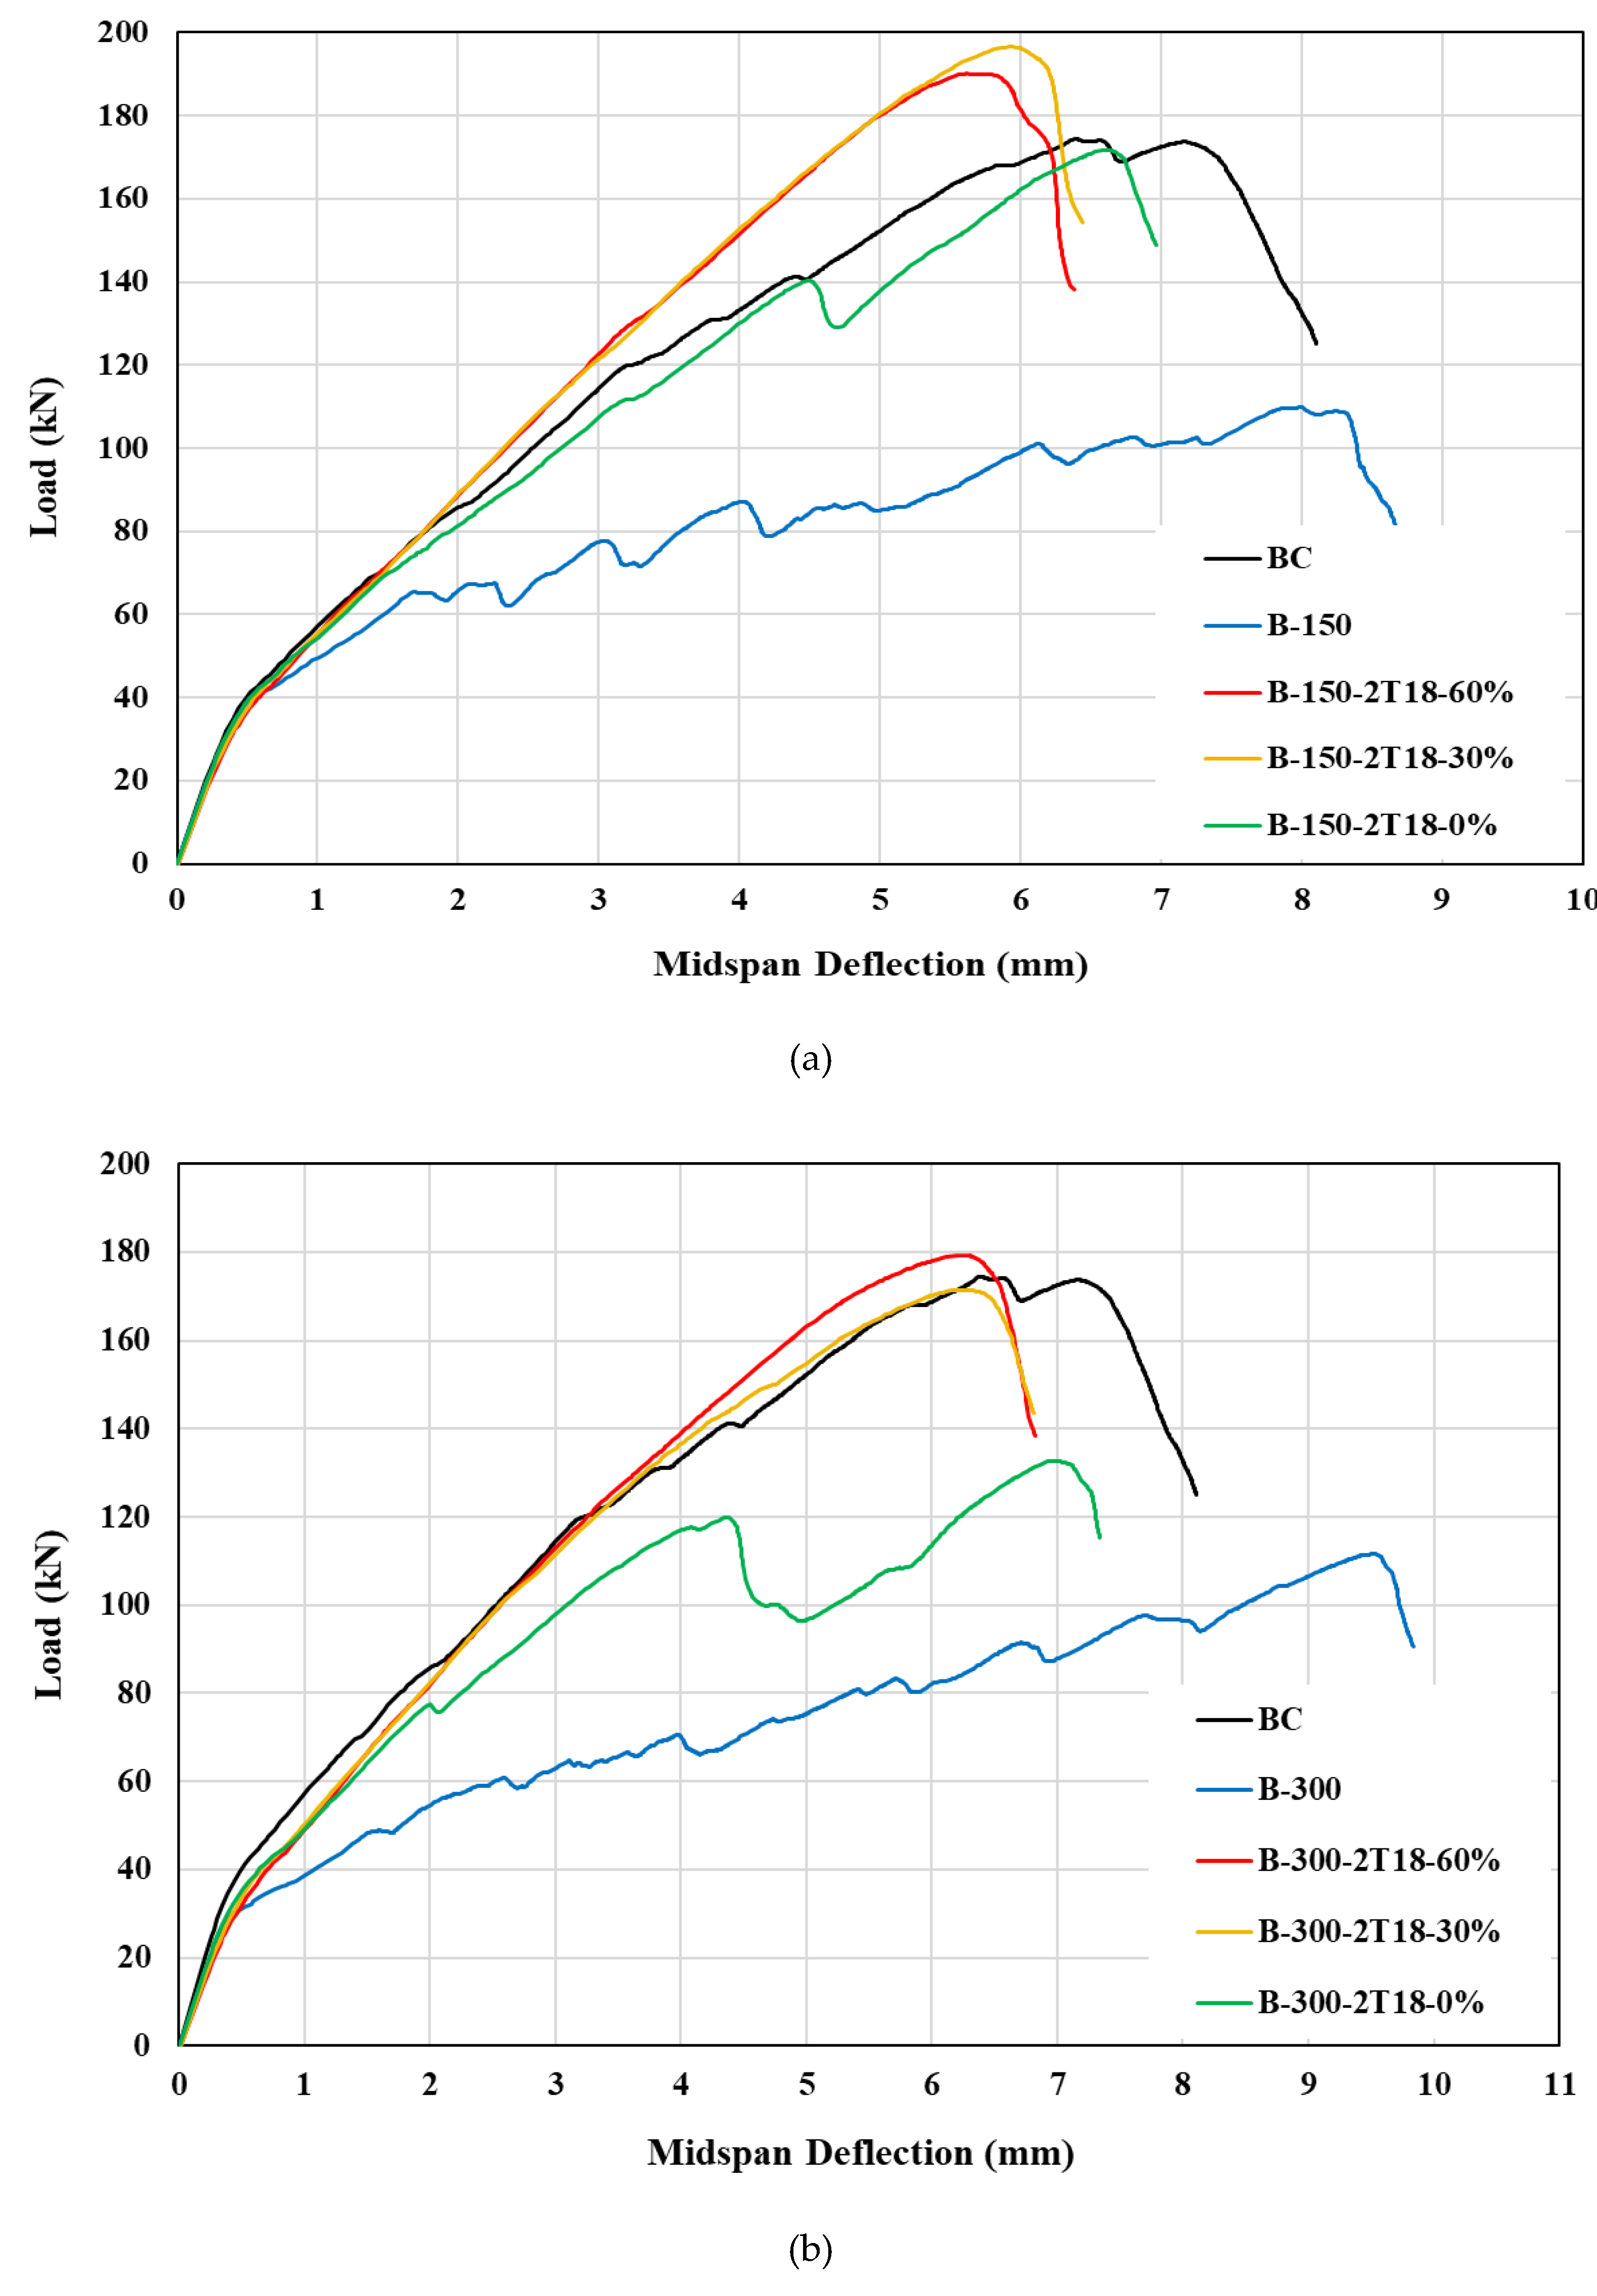
| φ | e | fb0/fc0 | K | µ |
|---|---|---|---|---|
| 55 | 0.1 | 1.16 | 0.67 | 0.0001 |
| Relationships | Output parameter | Units |
|---|---|---|
| Empirical stress-strain relationship | unitless | |
| Normalized stress | unitless | |
| Normalized strain | unitless | |
| Shape parameter | unitless | |
| Peak strain | in/in | |
| Initial tangential modulus | kip/in2 | |
| Simplified shape parameter | unitless | |
| Descending slope parameter | unitless | |
| Maximum strain | in/in |
| Relationships | Output parameter | Units |
|---|---|---|
| Tensile strength | MPa | |
| Tensile stress | MPa | |
| Maximum crack opening | mm | |
| Crack opening | mm | |
| Fracture energy | N/mm | |
| Factor accounting for the maximum aggregate size () | N/mm |
| Group | Beam ID | Opening Dimensions | Reinf. around opening | Reinf. ratio (%) | Pre-stressing level (%) | Studied parameter | |
|---|---|---|---|---|---|---|---|
| a (mm) | b (mm) | ||||||
| Control | BC | - | - | - | - | - | - |
| (I) | B-150 | 100 | 150 | - | - | - | Effect of pre-stressing level |
| B-150-2T18-0% | 2T18 mm | 2.26 | 0 | ||||
| B-150-2T18-30% | 30 | ||||||
| B-150-2T18-60% | 60 | ||||||
| (II) | B-300 | 100 | 300 | - | - | - | |
| B-300-2T18-0% | 2T18 mm | 1.13 | 0 | ||||
| B-300-2T18-30% | 30 | ||||||
| B-300-2T18-60% | 60 | ||||||
| (III) | B-450 | 100 | 450 | - | - | - | |
| B-450-2T18-0% | 2T18 mm | 0.75 | 0 | ||||
| B-450-2T18-30% | 30 | ||||||
| B-450-2T18-60% | 60 | ||||||
| (IV) | B-150* | 100 | 150 | - | - | - | Effect of reinforcement ratio |
| B-150-2T22-30% | 2T22 mm | 3.38 | 30 | ||||
| B-150-2T18-30%* | 2T18 mm | 2.26 | |||||
| B-150-2T14-30% | 2T14 mm | 1.37 | |||||
| (V) | B-300* | 100 | 300 | - | - | - | |
| B-300-2T22-30% | 2T22 mm | 1.69 | 30 | ||||
| B-300-2T18-30%* | 2T18 mm | 1.13 | |||||
| B-300-2T14-30% | 2T14 mm | 0.68 | |||||
| (VI) | B-450* | 100 | 450 | - | - | - | |
| B-450-2T22-30% | 2T22 mm | 1.13 | 30 | ||||
| B-450-2T18-30%* | 2T18 mm | 0.75 | |||||
| B-450-2T14-30% | 2T14 mm | 0.46 | |||||
| Group | Beam ID | Pult, kN | Pcr, kN | δult, mm | δcr, mm |
|---|---|---|---|---|---|
| Control | BC | 174.3 | 39.5 | 6.38 | 0.39 |
| I | B-150 | 109.9 | 35.0 | 8.00 | 0.35 |
| B-150-2T18-0% | 171.7 | 35.1 | 6.62 | 0.39 | |
| B-150-2T18-30% | 196.5 | 35.2 | 5.91 | 0.42 | |
| B-150-2T18-60% | 190.1 | 35.5 | 5.62 | 0.43 | |
| II | B-300 | 111.6 | 29.5 | 9.52 | 0.38 |
| B-300-2T18-0% | 132.7 | 31.2 | 6.94 | 0.39 | |
| B-300-2T18-30% | 171.3 | 33.6 | 6.19 | 0.43 | |
| B-300-2T18-60% | 179.2 | 34.5 | 6.20 | 0.48 | |
| III | B-450 | 90.6 | 19.8 | 9.47 | 0.29 |
| B-450-2T18-0% | 119.0 | 28.5 | 7.37 | 0.41 | |
| B-450-2T18-30% | 148.8 | 32.8 | 9.27 | 0.55 | |
| B-450-2T18-60% | 167.2 | 33.8 | 8.93 | 0.56 |
| Group | Beam ID | Pult, kN | Pcr, kN | δult, mm | δcr, mm |
|---|---|---|---|---|---|
| Control | BC | 174.3 | 39.5 | 6.38 | 0.39 |
| IV | B-150 | 109.9 | 35.0 | 8.00 | 0.35 |
| B-150-2T14-30% | 192.4 | 35.1 | 6.47 | 0.38 | |
| B-150-2T18-30% | 196.5 | 35.2 | 5.91 | 0.42 | |
| B-150-2T22-30% | 182.3 | 35.3 | 5.30 | 0.43 | |
| V | B-300 | 111.6 | 29.5 | 9.52 | 0.38 |
| B-300-2T14-30% | 158.5 | 33.3 | 5.61 | 0.42 | |
| B-300-2T18-30% | 171.3 | 33.6 | 6.19 | 0.43 | |
| B-300-2T22-30% | 177.9 | 34.1 | 6.38 | 0.45 | |
| VI | B-450 | 90.6 | 19.8 | 9.47 | 0.29 |
| B-450-2T14-30% | 145.7 | 32.2 | 9.36 | 0.52 | |
| B-450-2T18-30% | 148.8 | 32.8 | 9.27 | 0.55 | |
| B-450-2T22-30% | 160.7 | 32.9 | 9.56 | 0.57 |
Disclaimer/Publisher’s Note: The statements, opinions and data contained in all publications are solely those of the individual author(s) and contributor(s) and not of MDPI and/or the editor(s). MDPI and/or the editor(s) disclaim responsibility for any injury to people or property resulting from any ideas, methods, instructions or products referred to in the content. |
© 2023 by the authors. Licensee MDPI, Basel, Switzerland. This article is an open access article distributed under the terms and conditions of the Creative Commons Attribution (CC BY) license (http://creativecommons.org/licenses/by/4.0/).


