Preprint
Article

Genetic Mapping, Candidate Gene Identification and Marker Validation for Host Plant Resistance to the Race 4 of Fusarium oxysporum f. sp. cubense using Musa acuminata ssp. malaccensis

Altmetrics

Downloads

297

Views

225

Comments

0

A peer-reviewed article of this preprint also exists.

Submitted:

05 May 2023

Posted:

05 May 2023

You are already at the latest version

Alerts
Abstract
Fusarium wilt of banana is a devastating disease that has decimated banana production worldwide. Host resistance to Fusarium oxysporum f. sp. cubense (Foc), the causal agent of this disease, is genetically dissected in this study using two Musa acuminata ssp. malaccensis segregating populations segregating for Foc Tropical (TR4) and Subtropical (STR4) race 4 resistance. Marker loci and trait association using 11 SNP-based PCR markers allowed the candidate region to be delimited to a 12.9 cM genetic interval corresponding to a 959 kb region on Chromosome 3 of ‘DH-Pahang’ reference assembly v4. Within this region, there is a cluster of pattern recognition receptors, namely leucine rich repeat ectodomain containing receptor-like protein kinases, cysteine-rich cell wall associated protein kinases, and leaf rust 10 disease-resistance locus receptor-like proteins positioned in an interspersed arrangement. Their transcript levels were rapidly upregulated in the resistant but not in susceptible F2 progenies at the onset of infection. This suggests that one or several of these genes may control resistance at this locus. To confirm the segregation of single-gene resistance, we generated an inter-cross between the resistant parent ‘Ma850’ and a susceptible line ‘Ma848’, to show that the STR4 resistance co-segregated with marker ‘28820’ at this locus. Finally, an informative SNP marker 29730 allowed the locus specific resistance to be assessed in a collection of diploid and polyploid banana plants. Out of the 60 lines screened, 22 lines were predicted to carry resistance at this locus, including lines known to be TR4 resistant, such as ‘Pahang’, ‘SH-3362’, ‘SH-3217’, ‘Ma-ITC0250’, and ‘DH-Pahang/CIRAD 930’. Additional screening in the International Institute for Tropical Agriculture’s collection suggests that the dominant allele is common among in the elite ‘Matooke’ NARITA hybrids, as well as in other triploid or tetraploid hybrids derived from East African highland bananas. Fine-mapping and candidate gene identification will allow characterization of molecular mechanisms underlying TR4 resistance. The markers developed in this study can now aid the marker-assisted selection of TR4 resistance in breeding programs around the world.
Keywords: 
Subject: Biology and Life Sciences  -   Plant Sciences

1. Introduction

Bananas (Musa spp.) are an important horticulture crop, typically consumed as a fruit or staple food and are cultivated in the tropical and subtropical regions around the world. Musa spp. were domesticated in Southeast Asia and Melanesia and hybridization involving mainly A (Musa acuminata), B (Musa balbisiana) genome progenitors gave rise to most of the domesticated forms of dessert and plantain bananas we see today [1,2,3]. Musa acuminata have been divided into multiple subspecies [4,5]. Hybridization among them resulted in edible diploids. Restitution of gametes at meiosis led to the formation of triploid cultivars [1,6,7].
Fusarium wilt of banana (FWB), also known as Panama disease, is one of the most devastating diseases affecting banana plants. The global epidemics owing to FWB have put major constraints on banana production both historically and at the present time [8,9]. The causal agent for this disease is the soil-borne fungus Fusarium oxysporum f. sp. cubense (Foc). Foc can be classified into a race structure reflecting its banana host range [10,11,12,13] and unique vegetative compatibility groups (VCGs). Foc race 1 was the cause of the pandemic that decimated the triploid cultivar ‘Gros Michel’ (genome AAA) during the last century. Its replacement, the ‘Cavendish’ banana, is resistant to Foc race 1. Cavendish bananas are now the dominant cultivar in the market, accounting for more than 40% of a 124 M tonnes of world banana production in 2021 [14], with export markets amounting to approximately 15% of the total production [15].
During the 1990s, a previously unknown race, called the tropical race 4 (TR4) of FWB, emerged and decimated ‘Cavendish’ plantations around the world [16,17]. According to the range of banana subgroups affected, TR4 strains are collectively classified with subtropical race 4 (STR4) as members of race 4. Vegetative compatibility grouping (VCG) and multi-loci molecular phylogeny has provided distinction between the two groups of isolates [11,13,18,19]. STR4 can infect ‘Cavendish’ plants under subtropical conditions whereas TR4 is virulent on all ‘Cavendish’ and many other banana cultivars under both tropical and subtropical conditions [20]. So far, TR4 has significantly curtailed banana production in Australia [21], China [22], Indonesia [23], Malaysia [24], the Philippines [19,25], Jordan [26], Israel and other Middle east regions [27], India [28], Mayotte [29], and Africa [30], and has spread to locations as far as Colombia and Peru [31,32]. The disease poses a major threat to banana production, limiting the selection of cultivars and the land suitable for commercial production, and at the same time, putting constraints on food security of smallholders.
Foc infects banana plants through the roots, then travels through the vascular vessels to colonise the rhizome and the pseudostem of susceptible plants [33,34]. Symptoms manifested by localised necrotic lesions in and around the vascular vessels. Eventually the mycelia travel up through the xylem and establishes itself in the aerial parts of the plants. Extensive fungal colonisation blocks the water conducting vessels of the xylem, restricting water and nutrient supplies to the plant. This leads to wilting of leaves and eventually kills the plant. Once Foc is disseminated in infected soil, it can remain in the soil for decades, surviving as chlamydospores on infected planting material, or as endophytes on alternative weed hosts, and spreading through the movement of contaminated water and soil [35,36]. Disease control strategies have focused on deterrence through biosecurity measures [16], providing clean planting materials [37] and biocontrol agents such as Tricoderma spp. or endophytic F. oxysporum spp. [20,38,39].
Host genetic resistance to Foc provides a long-term solution for the management of the disease. Foc race 4 type resistance has been detected in both wild and cultivated banana plants [33,40,41,42,43,44,45]. Wild relatives or cultivated diploid varieties including M. acuminata ssp. malaccensis ‘Pahang’, ‘DH-Pahang’, M. acuminata ssp. burmannica ‘Calcutta 4’, M. itinerans, cv. ‘Tuu Gai’, and cv. ‘Rose’, are highly resistant to Foc TR4 [41,45,46]. Inter- and intra-specific hybrids such as ‘FHIA21’, ‘FHIA25’, ‘SH3142’, as well as all tested plantains and East African highland bananas (EAHBs), also exhibit high levels of TR4 resistance [43,45]. The Cavendish somaclones ‘GCTCV’ carry varying levels of TR4 resistance [33,43,45]. In some cases, TR4 resistance or susceptibility expressed by some of these somaclones appeared to be dependent on the inoculum dosage as well as the environment [42,43,45].
Forward genetic approaches have led to the identification of genes controlling plant yield, development, as well as biotic and abiotic stress tolerance [47]. Genetic mapping typically identifies major genes that control a large percentage of trait variations [48]. Such genes are useful for developing molecular markers to select favourable alleles in breeding programs [49].
In banana, forward genetics have not been frequently performed due to experimental constraints associated with sterility, polyploidy, long life cycles in population development, and phenotypic assessments [50]. Linkage maps have been traditionally constructed using restriction fragment length polymorphism (RFLP), isozymes, random amplified polymorphic DNA (RAPD) [51], microsatellites or simple sequence repeats (SSRs) and amplified fragment length polymorphisms (AFLPs) [52] on M. acuminata ssp. banksii and M. acuminata ssp. malaccensis derived populations. However, these markers are not easily transferable to other populations and large segregation distortion has been observed [51]. More recently, diversity arrays technology (DArT) has been deployed for high throughput genotyping in Musa [53]. DArTseq, a powerful genotyping-by-sequencing (GBS) approach to generate high density linkage maps, has been successfully used for genotyping large segregating populations of diploid and triploid Musa spp. [54,55,56].
Previously, we used flow cytometry and simple sequence repeat genotyping to show that wild lines of Musa spp. contained a diploid genome and were taxonomically characterised as Musa acuminata ssp. malaccensis [57]. These M. acuminata ssp. malaccensis lines were resistant against both STR4 and TR4 [57,58], and are heterozygous for single-gene resistance, with resistance dominant over susceptibility. A Quantitative Trait Locus by sequencing (QTL-seq) approach was used to identify a major locus on chromosome 3 conferring resistance to STR4 [57]. This QTL is distinct to the QTL identified on chromosome 10 for race 1 and TR4 resistance [54]. Genome ancestry analysis on our lines showed that the region on chromosome 3 has a M. acuminata ssp. malaccensis origin [57], making this region ideal for gene isolation using the M. acuminata ssp. malaccensis reference genome [46].
In this study, we performed genetic mapping in the chromosome 3 QTL region by screening a self-derived F2 population with SNP-based cleaved amplified polymorphism sequences (CAPS) markers. Individuals carrying recombination events were tested against both STR4 and TR4 strains to define and limit the candidate region. One marker carried an informative SNP that allowed chromosome 3 specific resistance to be assayed in 132 Musa accessions, including the core M. acuminata ssp. malaccensis collection from the International Musa Germplasm Transit Centre (ITC), as well as a comprehensive collection of diploid and polyploid genotypes at the International Institute for Tropical Agriculture (IITA) in Nigeria and Uganda. The validation of this marker will allow marker-assisted selection of TR4 and STR4 resistance to be deployed in breeding programs around the world.

2. Results

2.1. Foc-STR4 phenotypes and population development

Three STR4 resistant (‘Ma850’, ‘Ma851’, ‘Ma852’) and three susceptible (‘Ma845’, ‘Ma846’, ‘Ma848) M. acuminata ssp. malaccensis F1 parental lines were derived from two independent progenitors (Figure 1). 20-30 self-derived progenies of each parent were previously tested against both STR4 and TR4. The progenies of ‘Ma850’, ‘Ma851’, ‘Ma852’ segregated for single-gene resistance to both STR4 and TR4 at a 3R:1S ratio, whereas the progenies of ‘Ma845’, ‘Ma846’, ‘Ma848’ were uniformly susceptble to both races [58]. Subsequently, four F2 populations segregating for Foc-STR4 resistance were developed (Figure 1B). ‘Population 1’ comprised of two self- and one inter-cross between the R parents ‘Ma851’ and ‘Ma852’, which are known to segregate for STR4 and TR4 resistance. ‘Population 2’ was derived from an inter-cross between ‘Ma850’ and ‘Ma848’ (Figure 1B). A total of 435 F2 and 102 F3 individuals from the respective ‘Population 1’ and ‘Population 2’ were obtained from embryo germination in tissue culture and then multipled to sufficient numbers for phenotyping.

2.2. Marker development

‘Population 1’ was used for genetic mapping. Eleven CAPS markers were developed to anchor the region underlying the STR4 QTL (Table 1). The most proximal (27960) and distal (30000) markers defined a 1.45 Mb region in ‘DH-Pahang’ v4 (Table 2). The markers are named according to their unique identifiers in ‘DH-Pahang’ v1 and their corresponding v4 gene models as well as their predicted proteins are listed (Table 2).

2.3. Genetic mapping

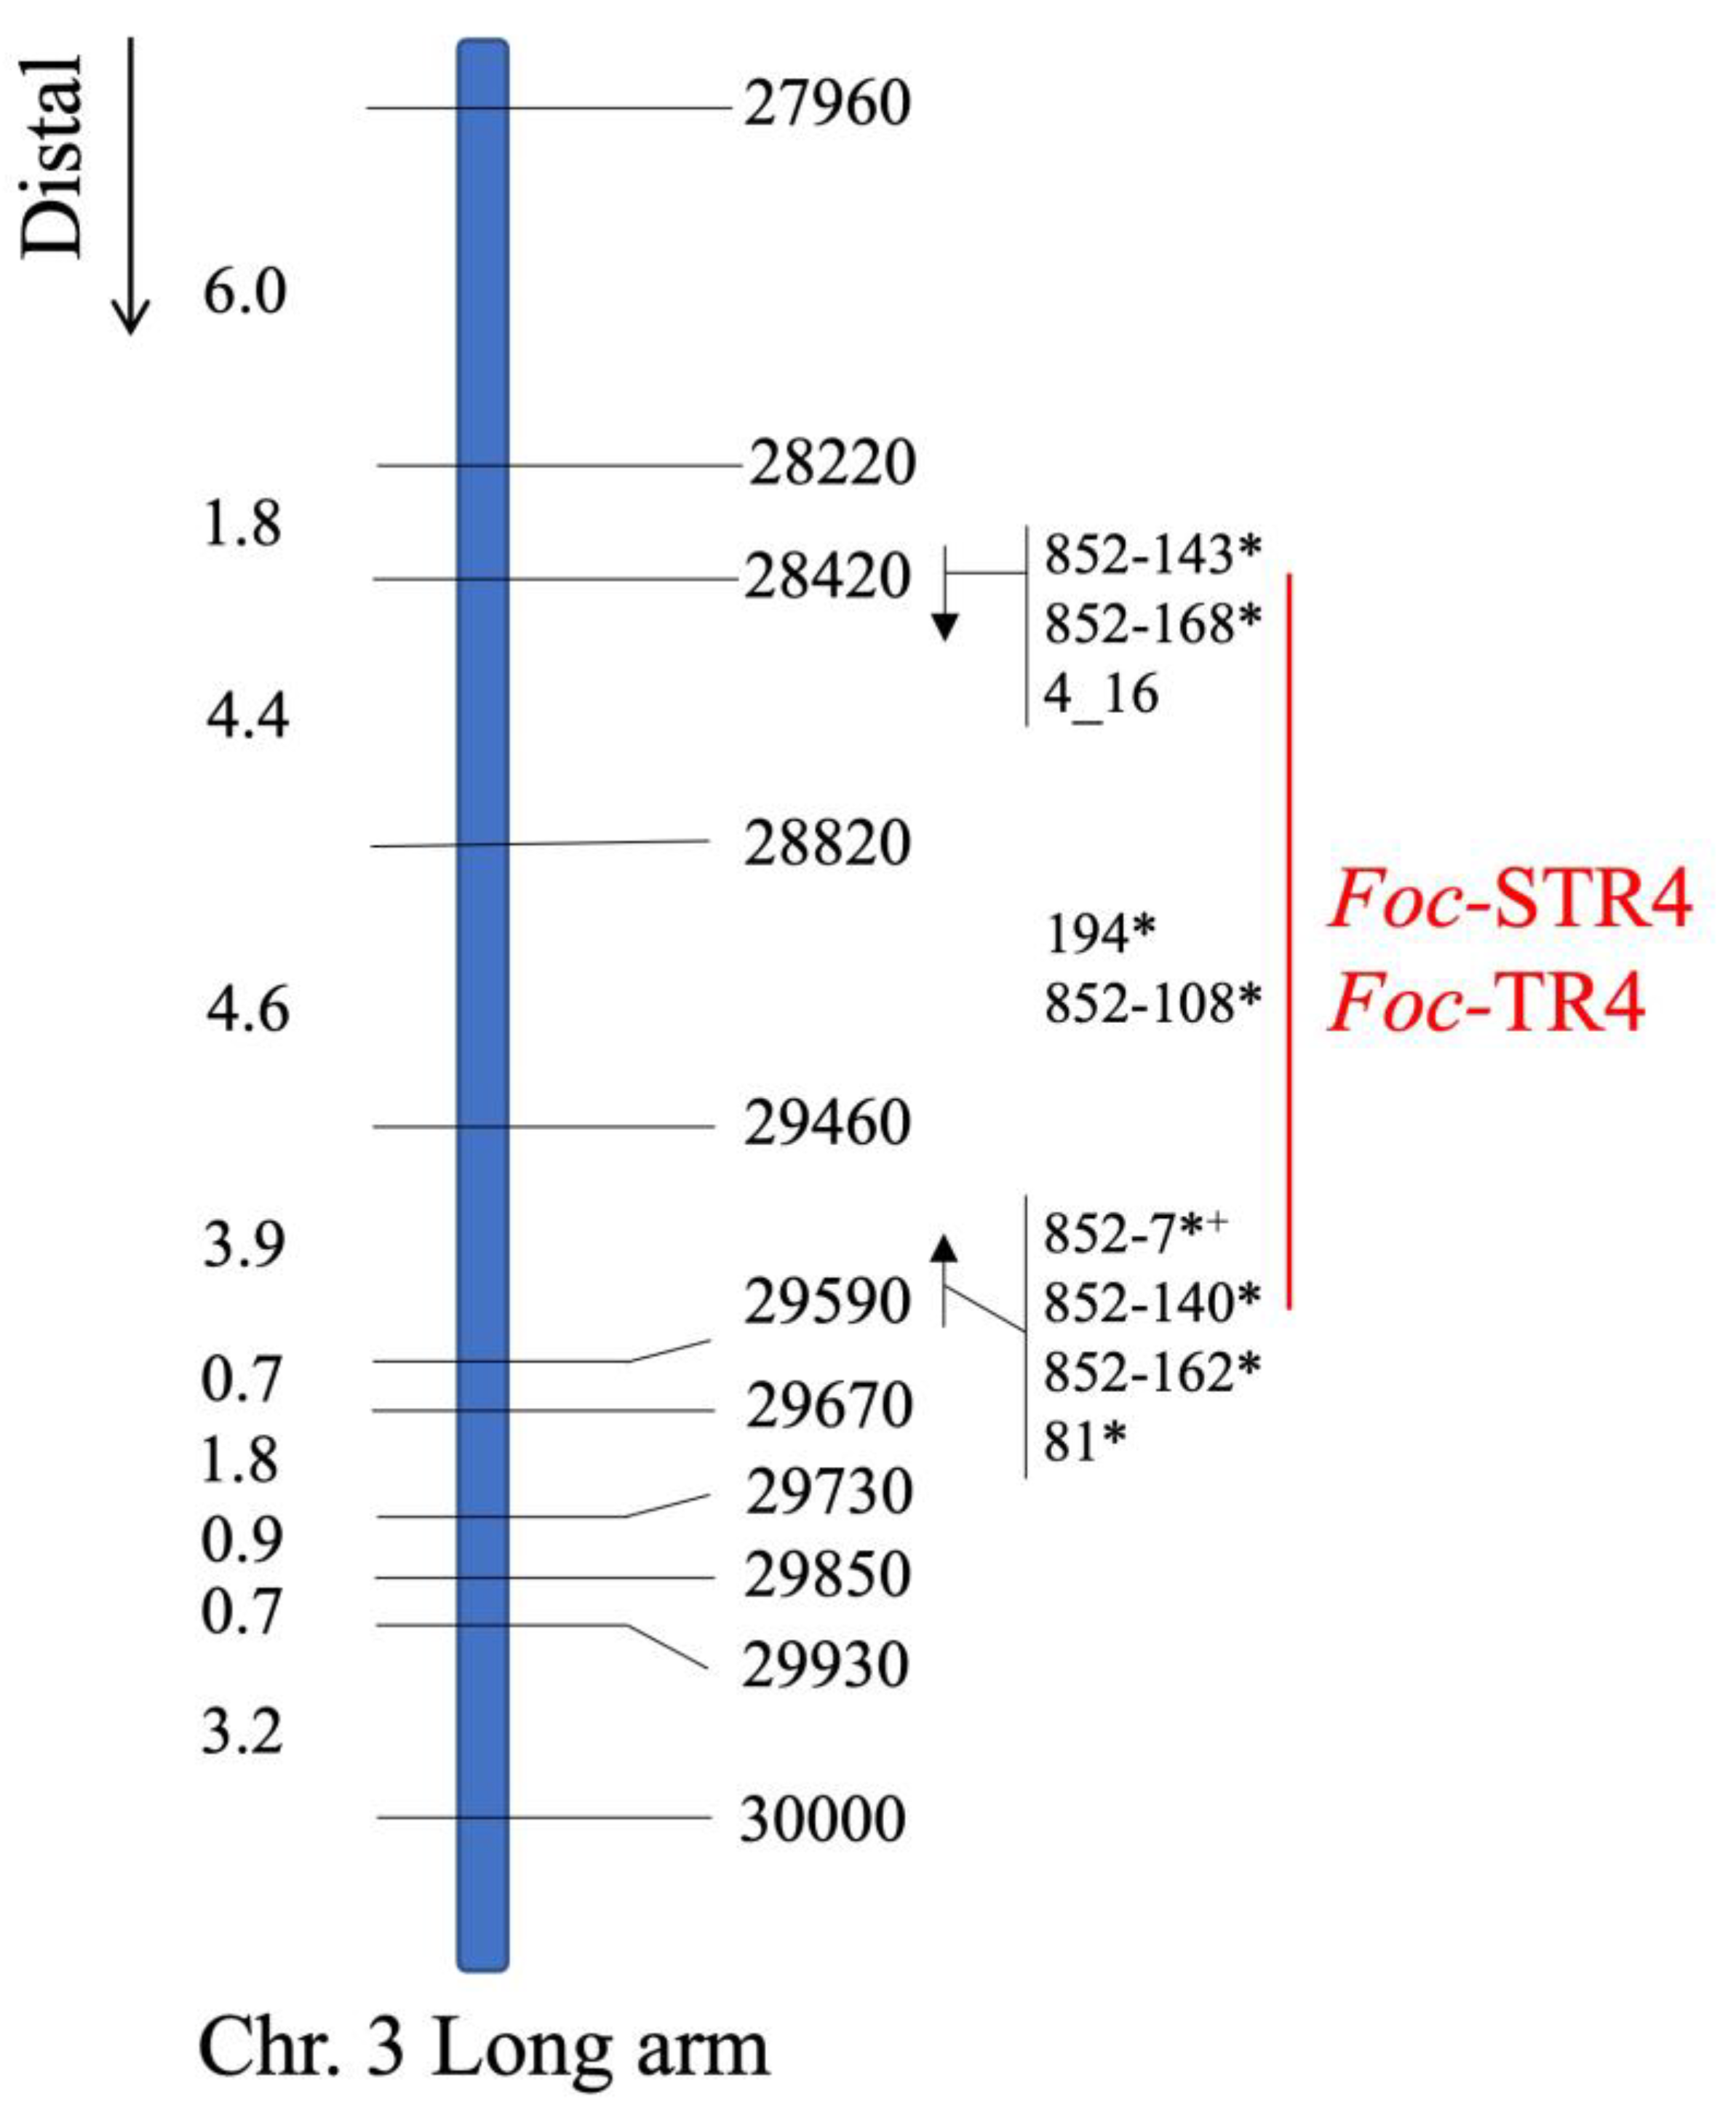
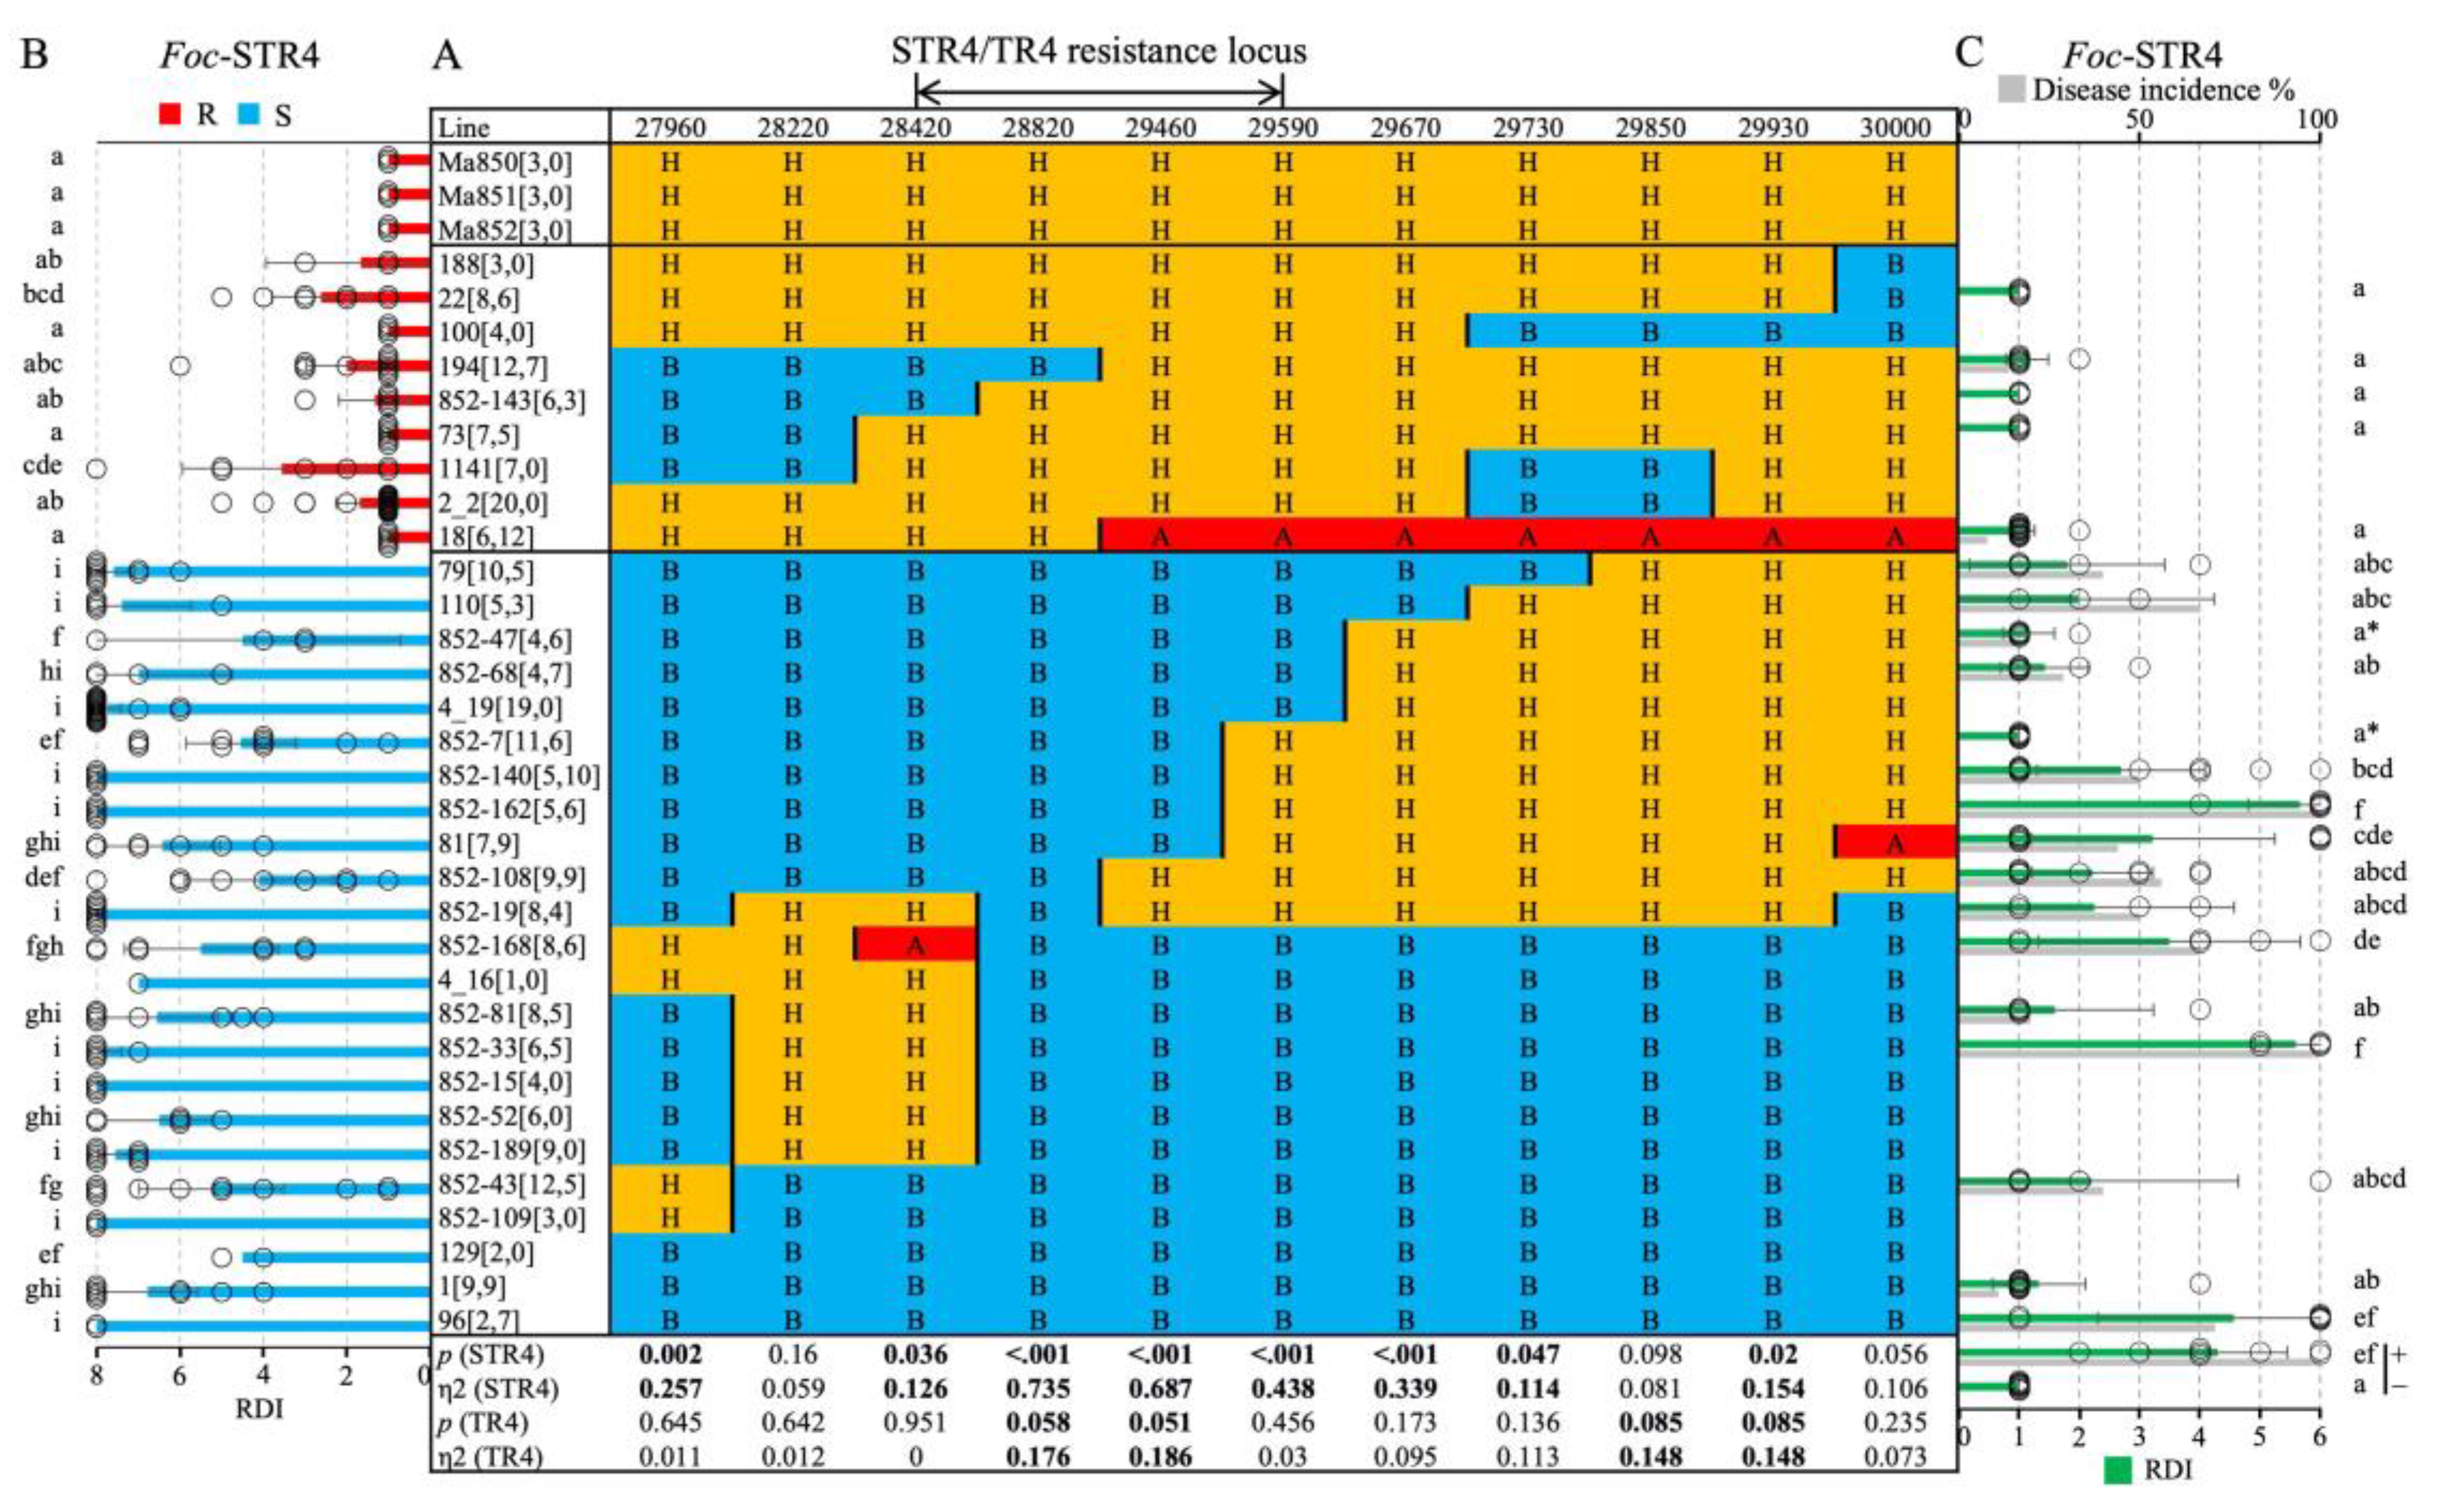
The 11 co-dominant CAPS markers were mapped in 435 F2 individuals of ‘Population 1’. The genetic distance in centiMorgan (cM) was calculated as the number of progenies carrying a cross-over event between a pair of adjacent markers over the total number of individuals (Figure 2). Overall, the order of the genetic linkage map is consistent with the physical positions of these genes on chromosome 3 in ‘DH-Pahang’ v4 indicating the absence of large structural rearrangements in this region between the parental M. acuminata ssp. malaccensis lines and ‘DH-Pahang’ v4. A set of 32 lines carrying cross-over events in this region were phenotyped to further delimit this region (Figure 3A). Resistance is completely dominant over susceptibility at this locus. Therefore, only recombinants carrying a homozygous-B to heteroyzgous-H (B/H) or a H/B cross-over were tested. Recombinants carrying A/H or H/A cross-overs were not tested as ‘A’ can not be differentiated phenotypically from ‘H’. The recombinants were grouped according to their Foc-STR4 resistance and susceptibility (Figure 3B). In the Foc-STR4 resistant phenotypic group, the three M. acuminata ssp. malaccensis parents, ‘Ma850’, ‘Ma851’, and ‘Ma852’, along with nine recombinants, showed resistant phenotypes that are clearly separated from the susceptible progenies by least significant difference (LSD) (Figure 3B). Among them, the H/A recombinant line ‘18’ showed a resistant phenotype but it is not informative as individuals carrying homozygous alleles for resistance (A) as it can not be phenotypically differentiated from the heterozygotes (H). On the other hand, 23 recombinants showed Foc-STR4 susceptible phenotypes (Figure 3B). The susceptibility of these recombinants seemed to be highly elevated with the majority of the clones exhibiting with a RDI of 8 (plant death) by the time of harvest. The STR4 resistance locus is defined by three proximal recombinants (852-143, 852-168, 4_16) with marker-phenotypes all suggesting that the locus is distal to marker 28420, and three distal recombinants (852-7, 852-140, 852-162, 81) collectively suggesting that the locus is proximal to marker 29590 (Figure 3A,B). This defined the locus within a genetic interval of 12.9 cM between 28420 and 29590 (Figure 2). Furthermore, the marker phenotype of recombinant lines 194 and 852-108 indicated that the locus can potentially be refined to between markers 28820 and 29460 (Figure 3A,B), although additional recombinant lines are required to validate this interval. However, eta-squared (η2) values of marker-trait association are the highest at markers 28820 and 29460 (p = 0.05), confirming that they are positioned closest to the trait locus (Figure 3A).
TR4 phenotyping of a subset of critical recombinants produced a similar result (Figure 3C). The rhizome discolouration was scored according to a 1 to 6 scale, with 1 being a healthy plant, and 2 to 6 corresponding to the proportion of discoloured rhizomes of ≤20%, ≤40%, ≤60%, ≤80%, and ≤100%, respectively. The phenotypic difference between the R and S recombinants were reduced in comparison to the STR4 phenotype (Figure 3C). The marker-defined susceptible lines were generally more resistant to TR4 than STR4, with more clones per line that did not show any rhizome discolouration. The positive control ‘Williams’ showed an average RDI of greater than 60%, indicating that the inoculation method worked as intended. Seperation of the means using Duncan’s multiple range test produced subsets that are more overlapping than that of STR4. Two S recombinants, 852-7 and 852-47 did not produce the expected symptoms, and their means are clustered together with the resistant recombinants and the uninoculated ‘Williams’ (Figure 3C). This suggests that sensitivity to TR4 in M. acuminata ssp. malaccensis was not optimally detected at the current inoculum dosage. However, all susceptible recombinants except 852-7, 852-47 and 1 showed a disease incidence (number of plants that developed disease over the total number of clones or n screened per genotype) between 20-100%. The critical recombinant phenotypes (all except 852-7) correctly associated with the direction of the trait locus between 28420 and 29590 (Figure 3A,C). The recombinants 194 and 852-108 also showed the expected association with the closest flanking markers 28820 and 29460. Likewise, this region is also associated with the highest η2 values, at 0.17-0.18, p = 0.1 (Figure 3A). The phenotypic variation explained by TR4 at this locus is smaller than that controlled by STR4 (η2: 0.68-0.73).

2.4. Candidate R gene expression profiling

A set of 24 ‘population 1’ progenies that are homozgyous for the resistant ‘A’ or susceptible ‘B’ for all eleven markers across this regionwere used to perform a transcriptome analysis with RNAseq. The phenotype of each of these lines was confirmed in a pot trial prior to the start of this experiment. The experiment was designed to identify a narrow transcriptome response that is specifically controlled by the resistance locus in this region. Genetic effects unlinked to this locus are accounted for by the segregation of these genes in the genetic background.
Our previous study identified multiple classes of R genes present in the candidate region [57]. Differential gene expression analysis was performed in a pair-wise (R vs S) manner at four time points, namely 0, 1, 3, 7 days post inoculation (dpi). Markers 28420 and 29590 flanked a 959 kb region containing 125 predicted gene models in ‘DH Pahang’ v4 (Table S1). Gene Ontology (GO) enrichment analysis of this region revealed 2 significantly enriched GO terms (p-adj < 0.05) that are associated with plant defense under the ontology of ‘Biological Process’, namely ‘defense response to bacterium’ (GO:0042742, 7 genes), and ‘defense response to fungus’ (GO:0050832, 5 genes) (Table S2). Under ‘Molecular Function’, GO terms were significantly enriched for ‘polysaccharide binding’ (GO:0030247) and ‘endoribonucleae activity’ (p-adj < 0.05).
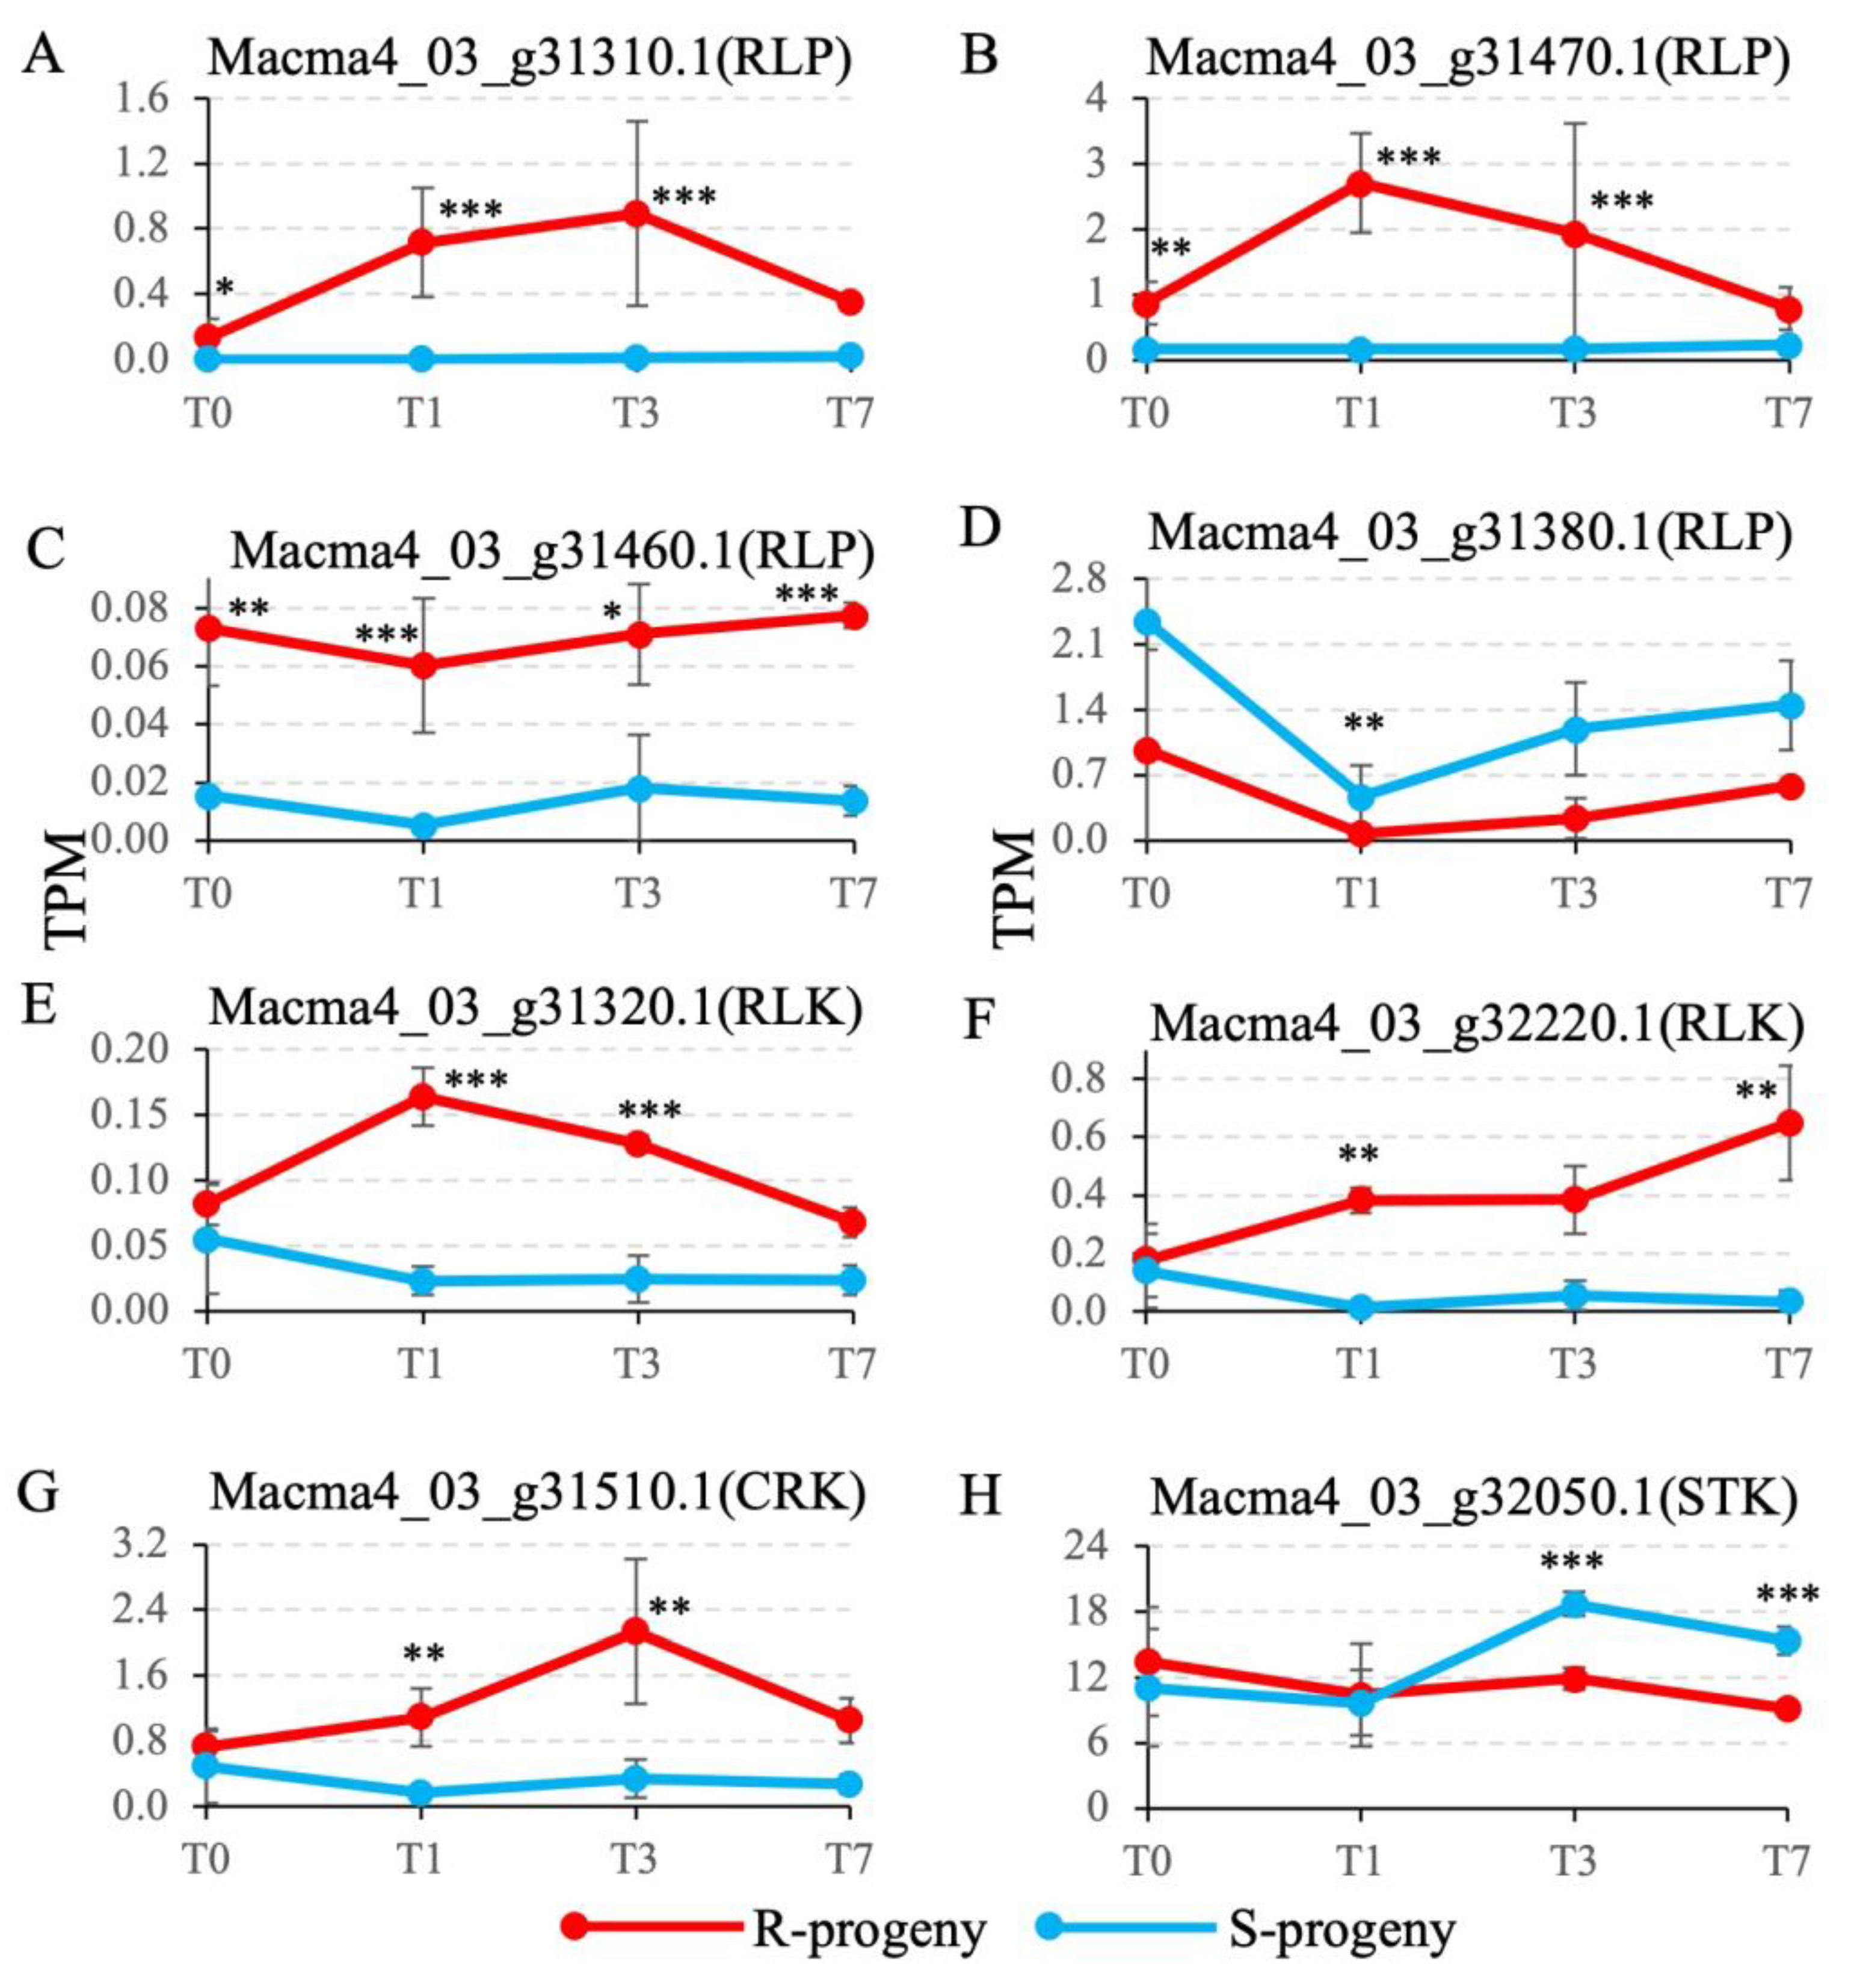
Out of all the R genes predicted in this region, eight genes showed differential expression profiles between R and S at two or more time points at p-adj < 0.05 (Figure 4). Out of the four receptor-like proteins (RLP), expression of 31310 and 31470 is upregulated at 1 and 3 dpi in R progenies before getting downregulated at 7 dpi, but remained relatively low in the S progenies throughout the time course (Figure 4A,B). Transcript levels of the RLP 31460 were significantly higher in R relative to S at all time points (p-adj < 0.05) (Figure 4C). Foc-STR4 did not induce significant changes in the transcript levels of 31460 in S and R lines but rather the transcripts were constitutively maintained higher in R than S. In contrast, transcripts of the RLP 31380 were readily down-regulated at 1 dpi before a slight recovery at 3 and 7 dpi in both S and R progenies, and with R transcripts significantly higher (p-adj < 0.01) than S transcripts at 1 dpi (Figure 4D). The receptor-like protein kinase (RLK) 31320 showed a similar profile to RLP 3130 and 31470 in that Foc-STR4 rapidly induced an expression peak at 1 dpi, followed by a gradual down-regulation at 3 dpi before returning to a pre-treatment level at 7 dpi (Figure 4E). The 31320 transcripts in S genotypes were maintained at a low level throughout the experiment. Transcript levels of the other RLK gene 32220, a LRK10L homolog, were significantly upregulated at 1 dpi in R, and were then upregulated further at 7 dpi (Figure 4F). Its transcripts in S remained relatively low at all time points. The cysteine-rich protein kinase (CRK) 31510 had an expression peak at 3 dpi in R before a sharp downregulation to a level comparable to the control at 7 dpi (Figure 4G). Again the S transcripts were maintained at a relatively low level. Lastly, the serine/threonine protein kinase (STK) 32050 showed a strong upregulation in S at 3 and 7 dpi (Figure 4H), whereas the R transcripts started off at a similar level to S but were gradually downregulated throughout the time course to a low level. No intracellular R proteins were differentially expressed at more than two time points between R and S in this region.

2.5. Foc-STR4 resistance and marker validation in ‘population 2’

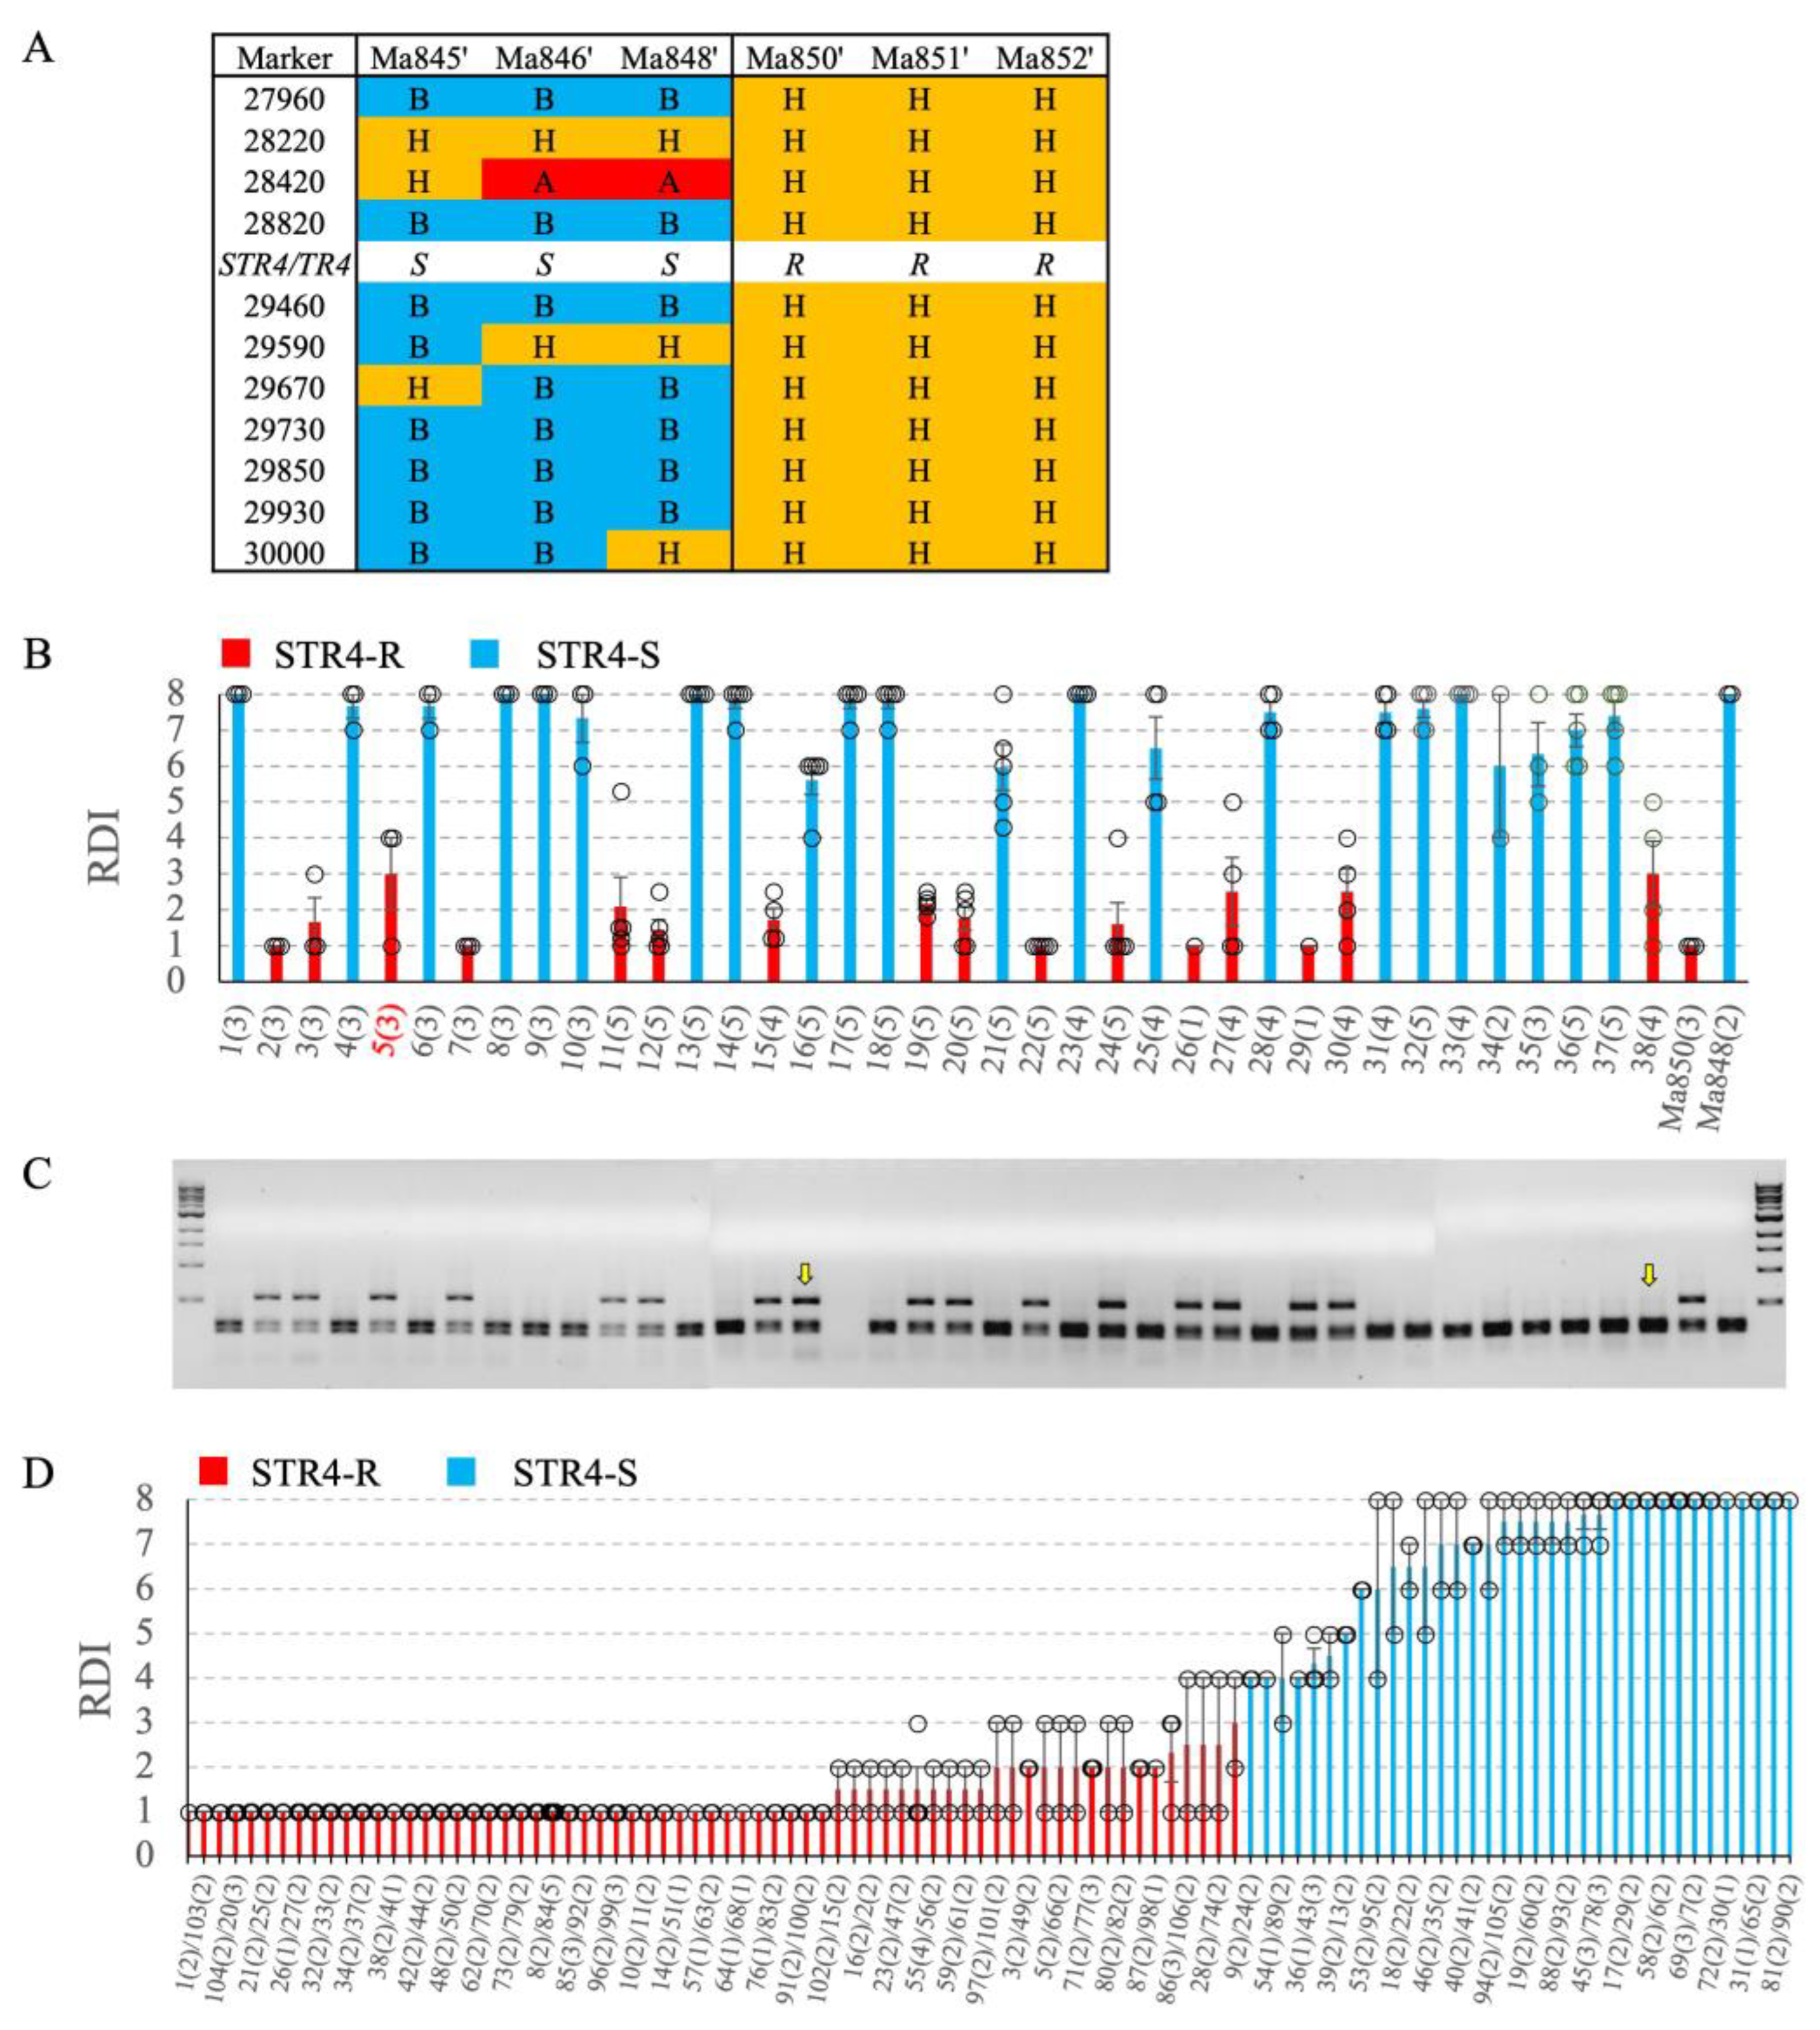
Haplotype analysis across the QTL region shows that the marker loci are all heterozygous in the R parents and are susceptible ‘B’ haplotype interrupted by heterozygous segments in the S parents (Figure 5A). The candidate region ‘B’ for susceptiblity defined by 28820/29460 in the S parents is flanked by heterozygous segments at the proximal (28220-28420) and distal (29590-29670) ends (Figure 5A). Therefore, the marker haplotypes of the S parents are consistent with the location of the STR4/TR4 locus as defined by ‘population 1’.
To validate the segregation of resistance observed in ‘population 1’, 38 F2 progenies of the ‘Ma848’ × ‘Ma850’ cross were screened for STR4 resistance (Figure 5B). 16 R and 22 S phenotypes were observed while the parents ‘Ma848’ and ‘Ma850’ showed the expected STR4 susceptibility and resistance, respectively. Mapping of 28820 in the F1 individuals showed that the dominant allele of 28820 closely segregated with resistance (Figure 5C). Decoupling of the marker with trait occurred in F2 individuals ‘16’ and ‘34’, suggesting that recombination has occurred between the resistance gene and the marker locus. An F3 population was developed using a self-cross of the STR4 resistant F2 individual ‘5‘. Out of the 102 F3 individuals screened for STR4 resistance, 67 individuals were resistant (mean RDI < 4) and 35 individuals were susceptible (mean RDI ≥ 4) (Figure 5D), with goodness of fit statistics showing significant deviation from an expected segregation ratio of 3R:1S (χ2 = 4.71, p = 0.029, df = 1, α = 0.05).

2.6. Validation of Marker 29730 for Marker-assisted selection of TR4 and STR4

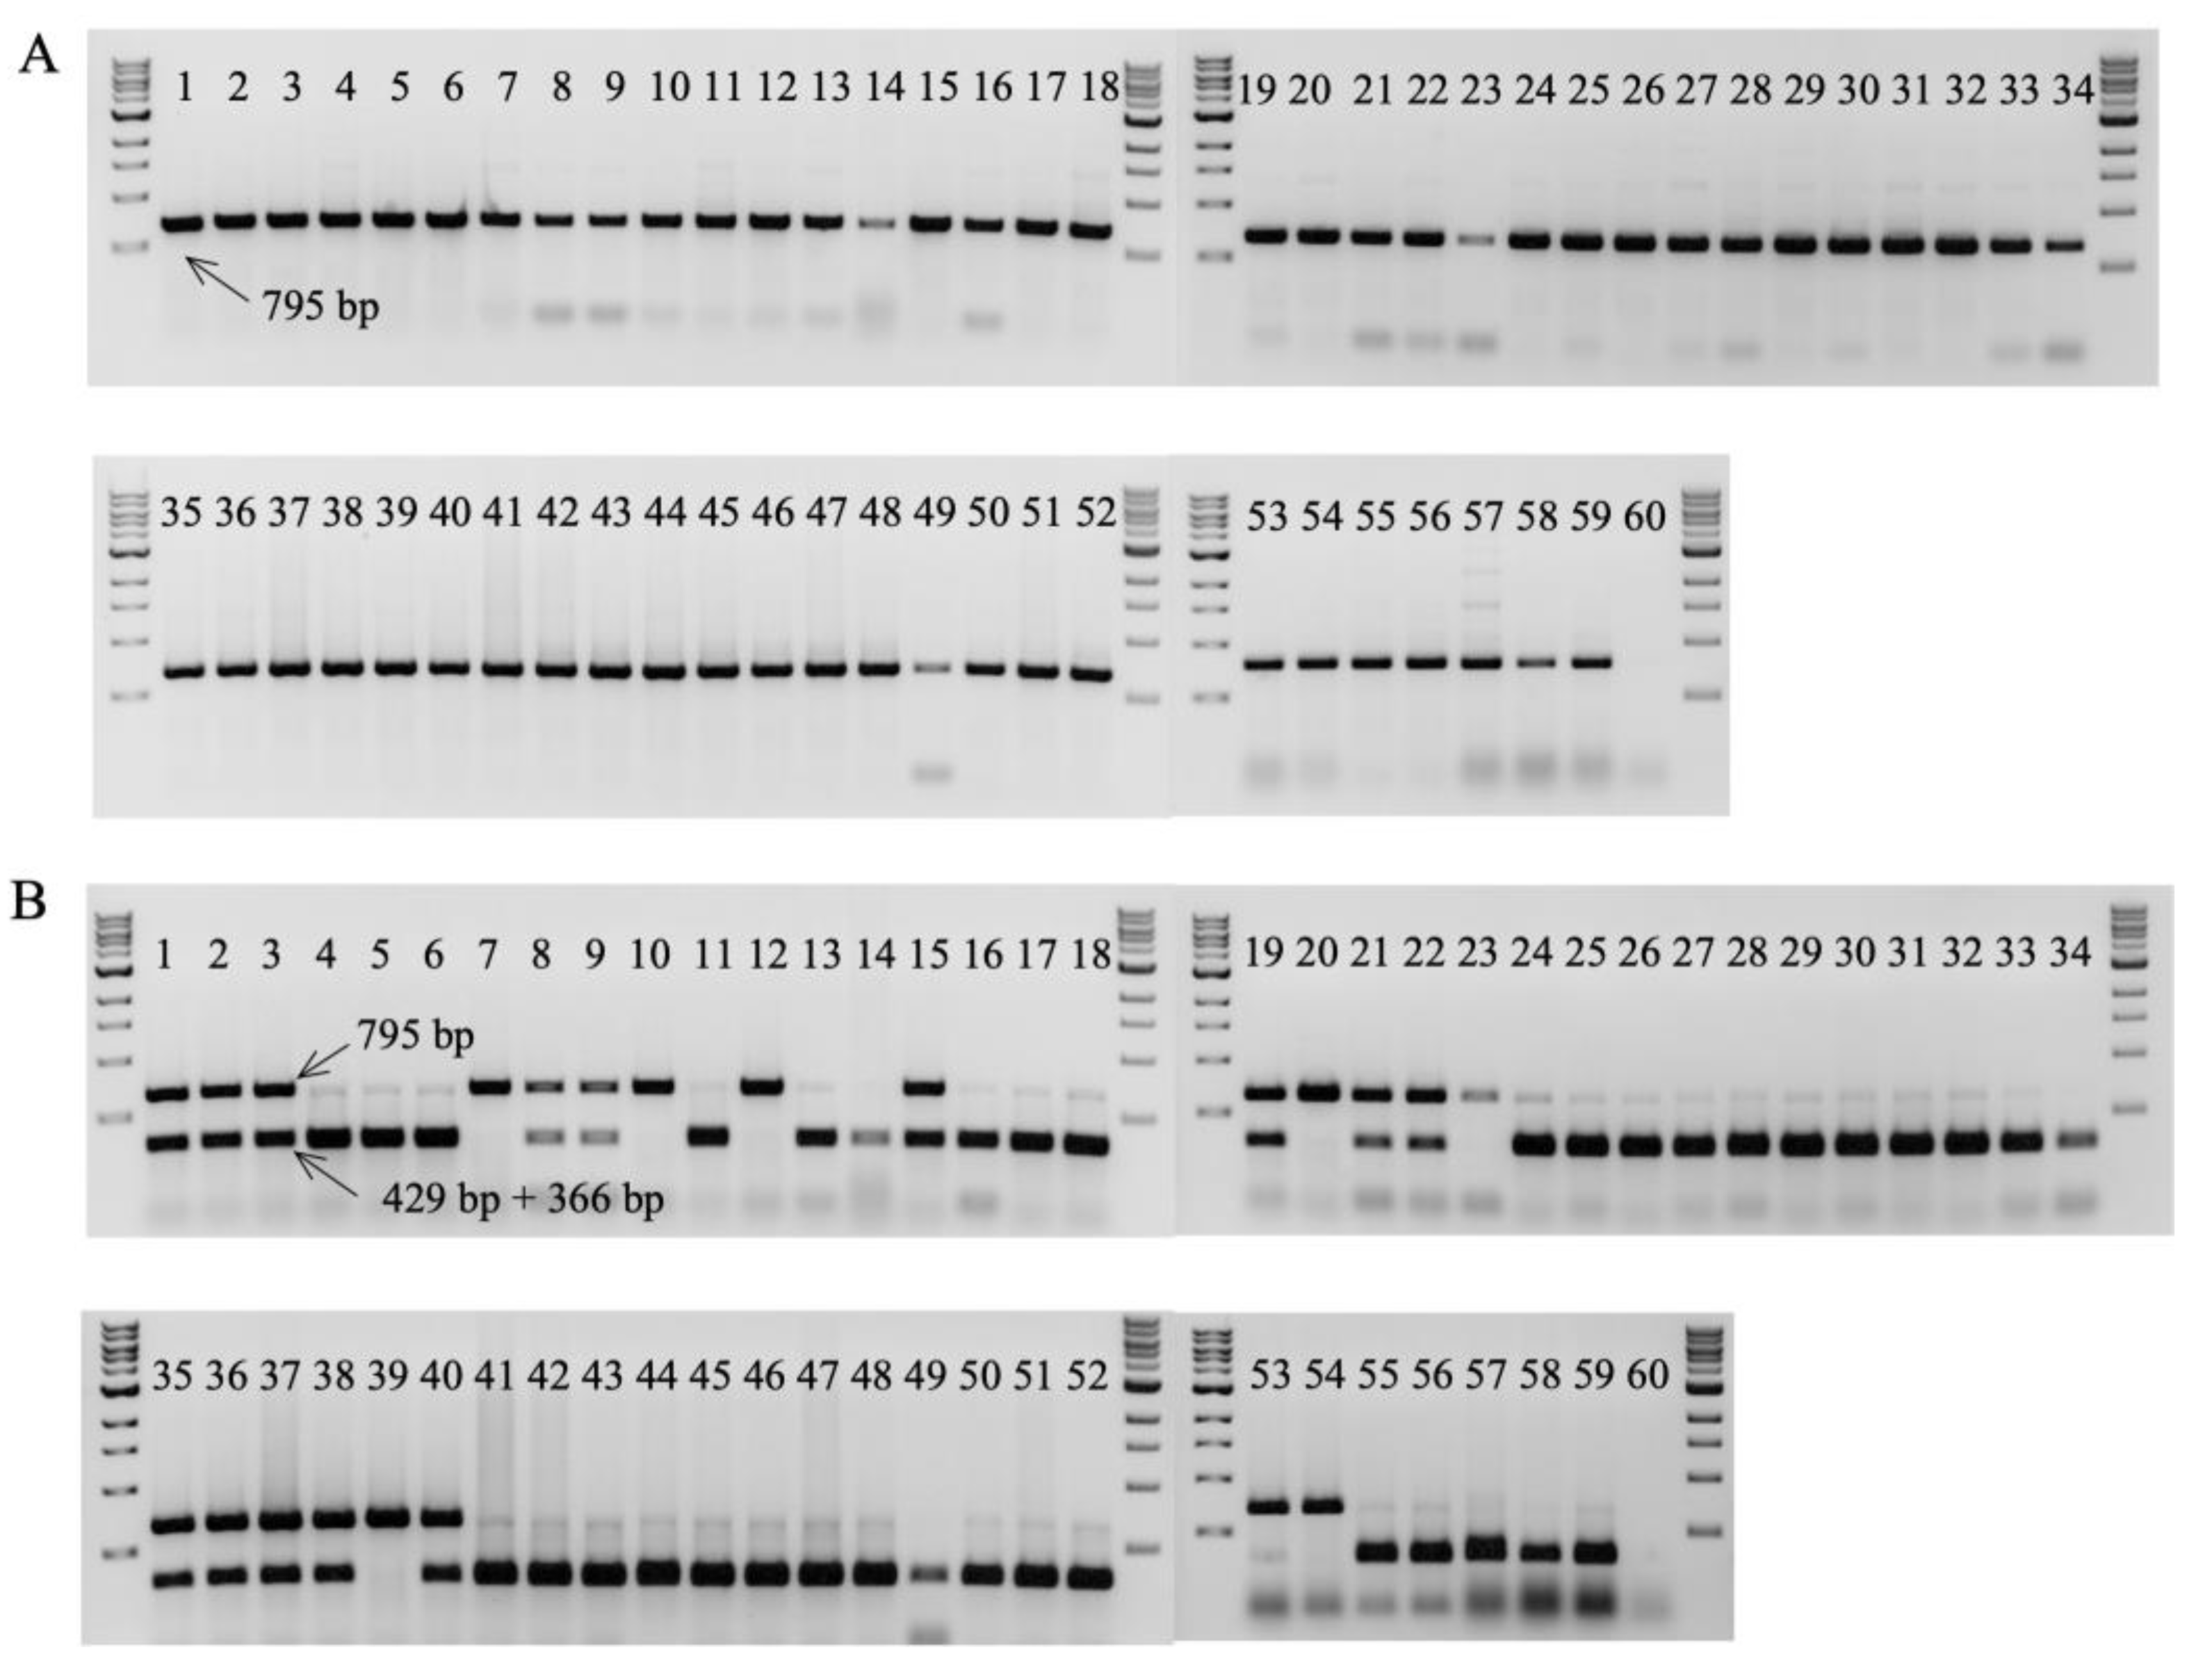
To identify SNPs that may be used in detecting the resistance locus outside of our mapping population, we first interrogated the SNPs in the CAPS markers for their association with resistance in a small set of accessions (namely all our Musa acuminata ssp. malaccensis parents, ‘DH-Pahang’, ‘Pahang’, ‘SH3362’, ‘FHIA25’, ‘Pisang Jari Buaya’, ‘Calcutta 4’) that are known to carry STR4/TR4 resistance. Out of all the markers tested, only one marker, 29730, showed an association with STR4/TR4 resistance in a subset of these genotypes. All the other SNPs interrogated were not correlated to the resistance/susceptibility of accessions outside of the mapping populations. A-genome (M. acuminata) specific primers for 29730 were subsequently developed (Table 1) and used to amplify an A-genome specific product of 795 bp in a set of 60 banana wild and cultivated accessions (Figure 6A). This product was then digested with BcoDI to produce the bi-allelic forms, an undigested dominant band that is putatively associated with resistance, and digested products of 429 bp and 366 bp linked to susceptiblity (Figure 6B). Heterozygotes carry both variants. The dominant marker allele was detected in the parents ‘Ma850’, ‘Ma851’, ‘Ma852’, and six other Musa acuminata ssp. malaccensis accesssions ‘Pahang’, ‘CIRAD 930/DH Pahang’, ‘Malaccensis ITC250’, ‘Malaccensis ITC0399’, ‘Pa Musore no2’ and ‘Kluai Pal’ (Figure 6B, Table 3). Hybrids and cultivars that have the resistant band includes ‘SH3361’, ‘SH3362’, ‘SH3217’, ‘TMB2×7197-2’, ‘5610S-1’, ‘FHIA3’ and ‘FHIA25’. Other known resistant lines, such as ‘cv. Rose’, ‘SH-3142’, ‘IV9 Calcutta4’, ‘Pisang Jari Buaya’, as well as the negative control M. balbisiana did not produce the dominant band (Figure 6B, Table 3). This suggests that the resistance source is prevalent among M. acuminata ssp. malaccensis and its derivatives. Its absence in ‘cv. Rose’, a M. acuminata ssp. malaccensis known to be resistant to TR4, and other TR4 resistant lines that are not of M. acuminata ssp. malaccensis origin suggests the presence of resistance sources elsewhere in the genome.
To further test this marker and aid the marker-assisted selection of Foc-STR4 and Foc-TR4 resistant lines, we screened 72 accessions from the IITA collection (Uganda) and 46 accessions from the IITA’s M. acuminata ssp. bankii collection (Nigeria). Out of the 11 ‘Matooke’ tetraploid parents screened, two of them, ‘1438K-1’ and ‘376K-7’ were positive for the resistant band (Table S3). Out of all the ‘NARITA’ triploids that have been assessed for yield stability in Uganda and Tanzania [63], lines number 1, 5, 6, 7, 8, 9, 13, 15, 16, 17, 19, 22, 23, 25 carried the dominant allele. In the ‘NARITA’s and the other triploid hybrids screened, the presence of the dominant allele in heterozygous state (H) was most likely inherited from their male diploid parents, namely ‘SH3362’, ‘5610S-1’, ‘TMB2×7197-2’, ‘SH3217’, ‘Malaccensis_250’ (Table S3). Heterozygotes were detected in six out of the 18 hybrid triploids that used ‘Malaccensis_250’ as the male parent. This is consistent with the heterozygous genotype of ‘Malaccensis_250’ at this locus. The screening of 46 accessions from a cultivated and wild M. acuminata ssp. banksii collection did not detect the dominant allele, with the positive control being ‘SH3362’ (Table S4).

3. Discussion

Conventional breeding is typically constrained in banana because polyploid cultivars are sterile and parthenocarpic [64]. Development of large segregating populations can be achieved using highly fertile banana diploids. The underlying genetics in banana are still challenging due to long growth cycles, logistics of performing high-throughput screenings and the high variability in the phenotypic data as reflected in this study. Despite these difficulties, the availability of the Musa draft genome assemblies and lower whole genome genotyping/sequencing costs have facilitated studies in SNP discovery, genome evolution, and population genetics in banana [65,66,67,68,69]. With Foc-TR4 edging closer to the major banana growing regions of Latin America [70], it becomes ever more important to dissect host resistance against Foc-TR4, and in doing so, identify potential resistance genes that underpin the Foc-TR4 resistance per se. This would allow resistance to be deployed in elite cultivars by gene editing or a transgenic approach. Molecular markers that are closely linked to TR4 resistance QTLs can fast-track resistant alleles in banana breeding programs.
By using transcriptome sequencing on S or R progenies carrying contrasting haplotypes in the QTL region, candidate R genes underlying resistance were identified. Segregant analysis is a powerful approach when combined with the positional information from genetic mapping. Firstly, the candidate region was confirmed in ‘population 1’. Marker haplotype in the susceptible parents and the segregation of Foc-STR4 further independently confirmed the candidate region in ‘population 2’. The closely linked marker 28820 segregated with STR4 resistance, although not completely, but the phenotypic variation explained at marker loci 28820 and 29460 was the highest in this genetic interval for both STR4 and TR4. Within this region, 32220, a leaf rust 10 disease-resistance locus receptor-like protein kinase-like protein 2.1 (LRK10L-2.1) is related to the wheat LRK10 gene [71]. Transcripts of 32220 were gradually and consistently upregulated in R-progenies during the time course, peaking at 7 dpi. This response was not detected in the S-progenies. The 32220 predicted protein belongs to the LRK10L-2 subfamily of receptor-like kinases [72,73] and has an ectodomain that is cysteine-rich, a transmembrane domain, a predicted intracellular serine/threonine kinase at its C-terminus. Members of this class of RLKs have been shown to be important for mediating resistance responses to stripe rust fungus, and powdery mildew in wheat [74,75], and are involved in ABA-mediated signaling and drought resistance in Arabidopsis [76].
The genetic interval closest to the STR4 resistance locus is between 28820 and 29590. It is not well defined at this stage. Only two individuals were identified with crossovers between these markers. More recombinants are needed to narrow down this interval more precisely. In the larger region between markers 28840 and 29590, multiple recombinants consistently confirmed the direction of the trait locus on either side. Although one critical recombinant (852-7) did not produce any symptoms in the TR4 screening, the phenotypic data are generally concordant with the genetic interval defined for both STR4 and TR4 resistance locus. Within this interval, there is a cluster of receptor-like kinases (LRR XII subfamily) and receptor-like proteins (LRR RLP subfamily) positioned in an interspersed arrangement [57]. They respectively belong to the LRR XII and LRR RLP subfamilies of pattern recognition receptors [72,77]. Two RLPs showed a very rapid upregulation of transcripts at 1 dpi, consistent with their roles in recognition of pathogen effectors at the onset of infection [78]. These RLPs are similar to the tomato LeEIX1 and LeEIX2 resistance proteins that directly interact with an ethylene inducible xylanase (Eix) effector protein from Trichoderma viride [79]. Similarly, Eix-like effector (VdEIX3) from Verticillium dahlia was recognised by the Nicotiana benthamiana LRR RLP NbEIX2 [80], inducing an innate immunity response and increasing resistance to other oomycete and fungal pathogens in N. benthamiana.
A gene encoding a cysteine-rich protein kinase is also strongly upregulated during the onset of infection in R but not in S genotypes. Cysteine-rich protein kinases contain DUF domains and a kinase domain. Such genes have been found to confer resistance against Septoria tritici blotch and leaf rust in wheat [81,82]. Overexpression of an Arabidopsis CRK homolog led to enhanced resistance against Pseudomonas syringae [83]. In addition, an LRR RK gene (Macma4_03_g31320.1) is differentially expressed between S and R genotypes and exhibits an expression peak at 1 dpi in R, similar to the profiles of the three LRR RLPs. Plants in general have an abundant amount of RLKs and RLPs as part of their surveillance system to cope with the evolution and detection of pathogens [84]. The LRR ectodomain of pattern recognition receptors binds to proteins and peptides through pathogen-associated molecular patterns (PAMPs) or damage-associated molecular patterns (DAMNs) and is important for the recognition function. In Arabidopsis, FLAGELLIN SENSING2 (FLS2) recognises an elicitor epitope from the bacterial flagellin [85] and PEP RECEPTOR 1 (PEPR1) and PEPR2 recognise peps or plant elicitor peptides to activate defense against Pythium irregulare [86,87]. In rice, LRR RK Xa21 recognises a highly conserved protein, RaxX, from Xanthomonas species to trigger immune responses [88].
Overall, there are multiple resistance genes differentially expressed between S and R banana progenies with similar temporal expression profiles. All of them are indicative of a rapid response in the induction of resistance gene transcripts at the onset of STR4 infection. This suggests that these genes may act in close proximity to one another or even belong to the same gene network. Co-expression gene networks will be constructed from RNA sequencing data to identify co-expression modules. This information can then be integrated with the QTL region to characterize the candidate genes [89].
In this study, we demonstrated that SNP loci/trait associations can produce markers useful for marker-assisted selection. Unlike traditional bi-parental mapping, the wild subspecies of Musa, are highly heterozygous, which is challenging for genetics to be undertaken. The resistance source identified in this population is dominant, which is consistent with the mode of inheritance of a race 1 and to a lesser extent TR4 resistance QTLs located on chromosome 10 of a different Musa acuminata ssp. malaccensis [54]. The dominance of these loci can offer full TR4 protection which is a desirable genetic solution to the TR4 pandemic since only one copy of the gene(s) is required to confer full resistance against TR4/STR4. Resistances that are not completely dominant may not be useful since partial resistance cannot offer protection against TR4 in the long term [90].
In marker-assisted selection, we used a marker closely linked to the resistance locus to detect lines potentially carrying this locus from several germplasm collections. Initial screening clearly suggested that this marker can identify some of the resistant individuals in the diploid collection, specifically detecting resistance in wild relatives or derivatives of M. acuminata ssp. malaccensis origin (Figure 6, Table 3). The power of detection does not extend to other M. acuminata subspecies or derivatives that are not of M. acuminata ssp. malaccensis origin. This is evident in that this marker failed to detect resistance in the M. acuminata ssp. banksii collection (Table S4). Furthermore, the M. acuminata ssp. burmannica genotype ‘Calcutta 4’ has been reported to be highly resistant not only to STR4/TR4 [33,43] but also to the Sigatoka leaf spot disease [91]. ‘Calcutta 4’, as a source of resistance, has already been used extensively in IITA-NARO’s breeding program. It was used as a male parent to derive seven tetraploid ‘Matooke’ hybrids, which were used to derive the triploid ‘Matooke’ NARITAs [92,93] (Table S3). Despite being TR4 resistant, ‘Calcutta 4’ was not detected as resistant in the marker screening in our study. Taken together, this highlights the presence of other sources of resistance in the germplasm collection as well as the limitation of this marker to detect resistance sources outside of M. acuminata ssp. malaccensis, possibly reflecting the phylogenetic divergence of the M. acuminata subspecies in the core Musa collection [59]. Overall, the marker was positive in 35 out of 72 individuals in the IITA collection, giving a detection frequency of 47.9%. This predicts that the chromosome 3 resistance source is already present in the IITA-NARO’s breeding program.
The genotype screen also produced consistent results in the diploids, specifically ‘Pahang’, ‘DH-Pahang’, ‘Malaccensis-ITC0250’. These are known TR4/STR4 resistant genotypes. In the hybrids, ‘SH3362’ and ‘SH3217’ are positives for the dominant band. ‘SH3362’ was derived from crossing ‘SH3217’ and ‘SH3142’, with the latter derived from a cross between two ‘Pisang Jari Buaya’s ‘https://www.promusa.org/NARITA+16’ (accessed on 12 March 2023). Despite being resistant to TR4, ‘Pisang Jari Buaya’ was a negative in our marker screen. The parentage of ‘SH3217’ can be further traced back to a cross between ‘SH2095’ and ‘SH2766’. ‘SH2095’ was derived from a cross between 'Sinwobogi' (AA) and 'Tjau Lagada' (AA), whereas ‘SH2766’ was derived from ‘Tjau Lagada' (AA) and the progeny of a cross between M. acuminata ssp. malaccensis and 'Guyod' (AA) ‘https://www.promusa.org/NARITA+16’ (accessed on 12 March 2023). Therefore, the source of resistance can potentially be traced back to a M. acuminata ssp. malaccensis origin although validation is not possible without these progenitors or their DNA. ‘SH3362’ and its progenitor ‘SH3217’ were the male parents of 13 hybrids in the IITA collection (Table S3). Ten out of these 13 hybrids were heterozygous for the STR4/TR4 marker locus. Despite the common presence of this resistance source in the IITA-NARO’s breeding program, further phenotypic screening in the IITA germplasm is required to validate this marker. Breeding programs around the world can now use this as a tool to identify potentially TR4 resistant genotypes in their collections. This is a first-ever report on PCR-based marker-assisted selection in a banana breeding program. It will assist efforts towards curbing the TR4 pandemic.
The genetic mapping using 435 individuals of ‘population 1’ delimited the QTL to a 959 kb region containing 125 predicted gene models between 28420 and 29590 in ‘DH Pahang’ v4 (Table S1). Due to the sheer volume of the population and the number of clones that would have to be multiplied in vitro, phenotyping the entire population was never the goal. A targeted strategy was used to define the QTL region and only recombinants were tested. It allowed ‘walking’ along the chromosome to define the direction of the marker-trait association. Validation was achieved through testing multiple independent recombinants defining a single marker interval. Technical bottlenecks included slow multiplication of clones in the diploid (AA) lines as they sometimes have reduced shoot proliferation potentials compared to the triploids. Furthermore, the dominant mode of inheritance means that phenotypic distinction can only be made between H/A to B and vice versa. Individuals containing cross-over events between A to H marker alleles cannot be used unless progeny testing is performed at the next generation. Important A/H recombinants can be tested this way, although it is a labor-intensive task.
Given that it takes 3 months for sufficient clones to be multiplied, 1 month for the plants to be hardened off in a glasshouse and a further 3 months post inoculation for symptoms to develop, this type of screening where genotypes are consistently processed in batches in an optimized and high-throughput manner is just not achievable with field-based trials. Future work will focus on optimizing high throughput setups in glasshouses [94] or growth chambers where relatively young plants in small pots and trays can be screened with Foc. Screening in a controlled environment can reduce variance in symptoms. Lab-based soil-free hydroponic systems have been explored for TR4 screening [95,96] and have been used to assay Fusarium root rot in other plant species such as alfalfa [97]. High throughput screening methodology from other plant/Fusarium pathosystems such as Medicago truncatula/F. oxysporum f. sp. medicaginis can potentially be adopted to screen for TR4 resistance in banana seedlings [98].
The STR4 screening produced clear cut phenotypic differences between resistant and susceptible individuals. A hybrid inoculation method was used with spore suspension and an extra layer of millet added on top of the soil. It was done to increase the inoculum dosage and achieve uniformity with the infection. This allowed genotypic sensitivity to Foc to be detected reliably and the genetic interval to be defined. The TR4 screening also produced consistent results and identified the same genetic interval, though the plants in general did not produce symptoms as severe as STR4. The TR4 symptoms were slow to manifest, indicating that M. acuminata ssp. malaccensis are generally more resistant to TR4 than STR4 in pot trials. The lowered correlation could be due to the presence of the chromosome 10 QTL for TR4 resistance in a fixed state in our resistant parents [54], which may also explain the segregation distortion we observed in the analysis of the F3 progenies from the ‘population 2’. Image-based detection of symptoms can assist in the quantification of rhizome discolouration [40]. The issue with the TR4 screening was not the subtle differences in the level of discolouration but rather getting false negatives when symptoms were expected. Symptom severity can be elevated by increasing the inoculum dosage. That would in turn reduce the variance in symptom development. Overall, this highlights the challenge of detecting a plant’s sensitivity to Foc in a reliable manner.

4. Materials and Methods

4.1. Musa acuminata ssp. malaccensis populations

Three Foc race 4 resistant and three susceptible M. acuminata ssp. malaccensis parents were used in this study. The progenies of the R (resistant) parents ‘Ma850’, ‘Ma851’, and ‘Ma852’ segregated for Foc-STR4 and Foc-TR4 resistance [57,58] whereas the S (susceptible) parents ‘Ma845’, ‘Ma846’, and ‘Ma848’ are uniformly susceptible to Foc-STR4 (Figure 1A). Three close-pollinated F2 populations, collectively called ‘population 1’ consisting of 435 individuals, were developed for mapping. They consisted of two self-cross of ‘Ma851’ and ‘Ma852’ as well as an inter-cross between these two lines (Figure 1B). Segregation of STR4 resistance was further validated in ‘Population 2’ (38 F2 and 102 F2 individuals), which was derived from an inter-cross between ‘Ma850’ and ‘Ma848’.

4.2. Fungal isolates

For the Foc-STR4 screening, three monoconidial VCG0120 isolates (BRIP63488, BRIP43781, and BRIP42331) from the Queensland Plant Pathology Herbarium were used as a combined inoculum at the University of Queensland. For the Foc-TR4 screening, a VCG01213/16 isolate from the culture collection of Stellenbosch University’s Department of Plant Pathology was used.

4.3. Foc-STR4 pot trial

Foc-STR4 pot trials were conducted in temperature-controlled glasshouses at the University of Queensland, St Lucia campus, QLD, Australia. The temperatures were controlled at 26 °C day /22 °C night for the entire duration of the experiments. Humidity was maintained at 60%. 50mL of 2.0 × 10⁶ conidia/mL solution was poured directly into potted plants with a stem height of 30 cm and followed by spreading a layer of Foc-STR4 infested millet (20-30 g) on the surface of the soil. Protocols for preparing Foc infested millet and conidia suspensions were previously described [33,99]. The soil surface was then topped with a thin layer of potting mix. The plants were watered lightly. Internal disease symptoms were scored 3 months post inoculation. A 1-8 rhizome scale was used to score internal rhizome discolouration [33].

4.4. Foc-TR4 pot trial

Foc-TR4 pot trials were performed in a quarantined glasshouse at the University of Stellenbosch. Plants were hardened off for 2-3 months before the screening. The experimental setup for the pot trial was as per previously described [100]. A millet inoculation technique was used and disease incidences and internal discolouration of the rhizome (1-6 scale) were scored as per previous study [101]. The positive and negative controls were uninoculated and Foc-TR4 inoculated ‘Williams’.

4.5. Molecular marker development

SNPs were initially identified using a sequencing approach. 100 bp paired end sequencing was performed using the Illumina Genome Analyzer IIx platform (Australian Genome Research Facility, VIC, Australia) to produce 10× coverage for individually sequenced S and R libraries. Six S libraries were prepared, consisting of each of the three susceptible parents, ‘Ma845’, ‘Ma846’, ‘Ma848’, as well as a pool of 34 susceptible progenies of ‘Ma845’, a pool of three susceptible progenies of ‘Ma851’ and a pool of eight susceptible progenies of ‘Ma852’. Six R libraries were prepared. They consisted of each of the three resistant parents, ‘Ma850’, ‘Ma851’, ‘Ma852’ and 3 DNA pools of 11, 17 and 24 resistant progenies (either homozygous or heterozygous for resistance), respectively derived from ‘Ma850’, ‘Ma851’ and ‘Ma852’. Data generated from individual libraries were used to align to ‘DH Pahang’ v1 using SOAPaligner v2.21 [102] and SNPs were called using SGSautoSNP (Second-Generation Sequencing AutoSNP) [103]. SNP profiles were visualised in an aligned format using the Integrative Genomics Viewer [104] and gene models from ‘DH-Pahang’ v1 ‘https://banana-genome-hub.southgreen.fr’ (accessed on 5 March 2023) were used to identify genes and SNPs suitable for marker development. Restriction enzyme cutting sites covering the SNP site were identified using ‘NEB cutter v2.0’ ‘https://nc2.neb.com/NEBcutter2/’ (accessed on 5 March 2023). Enzymes that have multiple restriction sites within a 400 bp region flanking the SNP on each side are avoided. Primers flanking a 344-795 bp amplicon were designed using ‘Primer 3’ [105] and further checked for binding specificity using ‘Oligoanalyzer’ ‘https://sg.idtdna.com/calc/analyzer’ (accessed on 5 March 2023).

4.6. DNA extraction and PCR

DNA extraction was performed using a hexadecyltrimethylammonium bromide (CTAB) based method [106] with the following modifications. At the washing step, the DNA pellet was washed three times with 8 mL of 70% ethanol to reduce residual salt contaminants and finally resuspended in 400 μL of nuclease free water. The DNA was quantified on a NanoDrop UV/Visible spectrophotometer for a single absorbance peak at 260 nm with a 260 nm/280 nm absorbance ratio of 1.8 to 2.0. DNA was then checked using the broad range Bradford assay on a Qubit machine and finally visualised on a 0.7% (w/v) agarose gel to check for band shearing and/or contamination with either RNA or polysaccharide.
PCR was performed using 80-100 ng of DNA template and Dreamtaq (Thermo Fisher Scientific, Waltham, MA, USA). Running conditions were set according to the manufacturer’s recommendations. The primers and the corresponding annealing temperatures were optimized (Table 1). Forty cycles of PCR were used per reaction. Restriction enzyme digest was performed on 10 μL PCR product and 2 μL enzymatic mix consisting of 2 units of the enzyme and an appropriate 10x buffer (Table 1). The digested products were visualised on a 2% agarose gel with a 1 Kb ladder (New England Biolabs, VIC, Australia). The markers were scored in a co-dominant manner, with restriction band patterns differentiating one homozygous allele from the other. The heterozygotes contain both allelic forms.

4.7. Digital gene expression analysis on candidate genes

A transcriptome study was performed by using 12 R and 12 S progenies from the ‘population 1’. These progenies were tested against STR4 and their resistance/susceptible phenotypes were confirmed prior to the start of this experiment. A root dipping method using Foc spore suspension was used to inoculate the plants [33], and whole roots in triplicates (n = 3) were harvested at 0, 1, 3, 7 days post inoculation (dpi). Samples were snap-frozen in liquid nitrogen and then ground to powder using a mortar and pestle. SpectrumTM Plant Total RNA kit (Sigma-Aldrich, NSW, Australia) was used to extract RNA. Twenty-four cDNA libraries corresponding to the R and S progenies harvested at the four time points were prepared and then sequenced using the Hiseq 4000 platform (Genewiz, Suzhou, China), generating approximately 48 Mb of 150 bp paired end reads for each sample. Adaptor sequences and low quality reads were filtered out using ‘Fastp’ [107]. Clean paired end reads were then aligned to ‘DH-Pahang’ v4 reference genome using ‘STAR’ v2.7.10a and default parameters for all except ‘-outFilterMismatchNmax 6’ and ‘-alignIntronMax 10000’ [108]. Non-normalized read counts were tabulated with ‘FeatureCounts’ software (option: -M -g ID -t gene -p) [109] and normalized to transcripts per million (TPM), from the measure of abundance estimated as the fraction of transcripts made up by a given gene and then multiplied by 106 [110]. DEGs were identified from pairwise comparisons between resistant and susceptible progenies at each time point using the ‘DESeq2’ R package [111]. Multiple testing is corrected using the Benjamini and Hochberg’s method [112]. The p-values are adjusted (p-adj) to have a false discovery rate (FDR) cut-off of 0.05.

4.8. Statistical analyses

The statistical software SPSS v28.0.1.0 (142) (IBM Corp., Armonk, N.Y., USA) was used to perform the statistical analysis described in this study. One-way ANOVA was performed in a pair-wise manner, with phenotype set as a dependent, and marker defined genotypes (B/H) as factors, to compare the means of STR4 and TR4 sensitivity at these loci. Any ‘A’ alleles were considered as a ‘H’ for the purpose of statistical analysis as resistance is completely dominant over susceptibility at this locus. The eta-squared (η2) values on the phenotype were estimated based on the fixed effect model and reflect the phenotypic variation explained at each marker-defined locus. To analyze the STR4 and TR4 phenotypes of the recombinants, Waller-Duncan’s multiple range testing was performed as a post-hoc test to separate the means of the recombinants into subsets by least significant difference (LSD). Recombinants with n < 2 were excluded from the analysis. The hormonic mean sample size was estimated and used to account for the unequal variance associated with the uneven sample size (n) of the recombinants. The type 1/type 2 error seriousness ratio (k-ratio) was set to 100 (α= 0.05).

5. Conclusions

This study is the first-ever report of marker-assisted selection of STR4 and TR4 resistant Musa accessions. The availability of molecular makers closely linked to the resistance locus can now facilitate rapid screening of potentially TR4 resistant genotypes and thereby reduce the generation time required for phenotypic and field trials. However, this marker can only detect resistances originating from M. acuminata ssp. malaccensis at this locus. Given the prevalence of TR4 now threatening the entire banana industry worldwide, identification of candidate receptor like proteins and kinases with strong transcriptional evidence linking them to resistance at this locus provides the first step towards molecular dissection of resistance mediated by these R genes in banana.

Supplementary Materials

The following supporting information can be downloaded at the website of this paper posted on Preprints.org. Table S1: ‘DH Pahang’ v4 gene models within the candidate region. Table S2: Enrichment of Gene Ontology (GO) terms detected in the candidate region using p and q cutoffs of 0.05 and 0.1, respectively. Table S3: Screening of the IITA germplasm collection using the A-genome specific marker A-29730; Table S4: IITA banksii collection from Ibadan, Nigeria, screened with the A-genome specific marker, A-29730.

Author Contributions

Conceptualization, A.C. and E.A.B.A.; methodology, A.C., E.A.B.A., A.V., D.M., S.B., J.B. and D.E.; validation, A.C., J.S., R.L., L.M., P.C., A.V., D.M. and Y.X.; formal analysis, A.C., A.V., G.M., N.Y. and A.D.; investigation, A.C., J.S., R.L., L.M., N.C., D.M., S.B., Y.X., E.H., P.C., J.D., S.P. and A.F.B.; resources, E.A.B.A., A.C., N.C., S.B., E.H., P.C., J.D., B.U., D.A., A.F.B. and L.C.; writing—original draft preparation, A.C.; writing—review and editing, E.A.B.A., R.L., P.C., A.V., Y.X., R.S., B.U., D.A., S.P., J.B., D.E., G.M., N.Y., A.D., A.C. and J.S.; supervision, E.A.B.A., A.C., R.S., S.P., J.B., E.D. and L.C.; project administration, E.A.B.A.; funding acquisition, E.A.B.A. and A.C. All authors have read and agreed to the published version of the manuscript.

Funding

This research was funded by Bill and Melinda Gates Foundation, grant number (OPP1213871) and the APC was funded by (OPP1213871/INV-002979). This work was supported, in part, by the Bill and Melinda Gates Foundation (OPP1213871) through a program with the International Institute of Tropical Agriculture. Research funding support was also provided in part by Hort Innovation Australia (BA 17006) and by Bayer Crop Science through a technical assistance grant ‘Acceleration of the identification of the resistance genes in banana and the generation of markers for the banana breeding program’. Jiaman Sun is supported by Guangxi Science and Technology Planning Project (Guike AA21196005) and Guangxi Natural Science Foundation (2021GXNSFAA196014). Under the grant conditions of the foundation, a Creative Commons Attribution 4.0 Generic License has already been assigned to the author-accepted manuscript version that might arise from this submission.

Data Availability Statement

All data analysed during this study are included in this article and its supplementary files. The RNAseq data described in this study are available on request from the corresponding author. It is not publicly available due to confidentiality of genetic information pertaining gene discovery.

Acknowledgments

Musa acuminata ssp. malaccensis accessions ‘Ma845’, ‘Ma846’, ‘Ma848’, ‘Ma850’, ‘Ma851’, and ‘Ma852’ were kindly obtained from Sharon Hamill, through the Australian in-vitro banana cultivar collection that is maintained in the Quality Banana Approved Nursery (QBAN) scheme accredited Plant Biotechnology Laboratory located at the Maroochy Research Facility, Department of Agriculture and Fisheries, Nambour, Queensland, Australia. Foc VCG0120 isolates BRIP63488, BRIP43781, and BRIP42331 were kindly obtained from the Queensland Plant Pathology Herbarium at the EcoSciences Precinct, Department of Agriculture and Fisheries, Brisbane, Queensland, Australia. We thank Harry Cosgrove, Xueying Li, Yuhan Liu, Amelie Soper, Siyuan Gao and Angie Mitchell for technical assistance in plant tissue culture. We wish to acknowledge The University of Queensland's Research Computing Centre (RCC) for its support in this research.

Conflicts of Interest

The authors declare no conflict of interest. The authors declare that this study received funding from Bill and Melinda Gates Foundation (OPP1213871). The funder was not involved in the study design, collection, analysis, interpretation of data, the writing of this article or the decision to submit it for publication.

References

  1. Perrier, X.; De Langhe, E.; Donohue, M.; Lentfer, C.; Vrydaghs, L.; Bakry, F.; Carreel, F.; Hippolyte, I.; Horry, J.P.; Jenny, C.; et al. Multidisciplinary perspectives on banana (Musa spp.) domestication. Proc. Natl. Acad. Sci. USA 2011, 108, 11311–11318. [Google Scholar] [CrossRef] [PubMed]
  2. Němečková, A.; Christelová, P.; Čížková, J.; Nyine, M.; Van den Houwe, I.; Svačina, R.; Uwimana, B.; Swennen, R.; Doležel, J.; Hřibová, E. Molecular and cytogenetic study of East African highland banana. Front. Plant Sci. 2018, 9, 1371. [Google Scholar] [CrossRef] [PubMed]
  3. Simmonds, N.W. The evolution of the bananas. In The Evolution of the Bananas; Longman, 1962. [Google Scholar]
  4. Simmonds, N.W.; Shepherd, K. The taxonomy and origins of the cultivated bananas. Bot. J. Linn. Soc. 1955, 55, 302–312. [Google Scholar] [CrossRef]
  5. Sheperd, K. Cytogenetics of the genus Musa. International Network for the Improvement of Banana and Plantain: Montpellier, France, 1999. [Google Scholar]
  6. Dodds, K. Genetical and cytological studies of Musa: V. Certain edible diploids. J. Genet. 1943, 45, 113–138. [Google Scholar] [CrossRef]
  7. Rekha, A.; Hiremath, S. Chromosome studies and karyotype analysis of some triploid banana (Musa species) cultivars of AAA genomic group. J. Hortic. Sci. 2008, 3, 30–34. https://jhs.iihr.res.in/index.php/jhs/article/view/590 (accessed on 26 April 2023). [CrossRef]
  8. Ploetz, R.C. Panama disease: An old nemesis rears its ugly head part 2. The Cavendish era and beyond. Pl. Health Prog. 2005, 23, 1–17. [Google Scholar] [CrossRef]
  9. Ploetz, R.C. Fusarium wilt of banana. Phytopathology 2015, 105, 1512–1521. [Google Scholar] [CrossRef]
  10. Kistler, H.C.; Alabouvette, C.; Baayen, R.P.; Bentley, S.; Brayford, D.; Coddington, A.; Correll, J.; Daboussi, M.J.; Elias, K.; Fernandez, D.; et al. Systematic numbering of vegetative compatibility groups in the plant pathogenic fungus Fusarium oxysporum. Phytopathology 1998, 88, 30–32. [Google Scholar] [CrossRef]
  11. Moore, N.; Pegg, K.; Allen, R.; Irwin, J. Vegetative compatibility and distribution of Fusarium oxysporum f. sp. cubense in Australia. Aust. J. Exp. Agric. 1993, 33, 797–802. [Google Scholar] [CrossRef]
  12. Ploetz, R.C.; Correll, J.C. Vegetative compatibility among races of Fusarium oxysporum f. sp. cubense. Plant Dis. 1988, 72, 325–328. [Google Scholar] [CrossRef]
  13. Stover, R.H. Fusarium wilt of Banana: Some history and current Status of the Disease. In Fusarium wilt of banana; Ploetz, R.C., Ed.; APS Press: St. Paul, MN, USA, 1990; pp. 1–7. [Google Scholar]
  14. FAOSTAT. 2023. Available online: https://www.fao.org/faostat/.
  15. FAO. Banana market review—Preliminary results for 2022. Rome. Available online: https://www.fao.org/3/cc3421en/cc3421en.pdf (accessed on 27 April 2023).
  16. Pegg, K.G.; Coates, L.M.; O’Neill, W.T.; Turner, D.W. The epidemiology of Fusarium wilt of banana. Front. Plant Sci. 2019, 10. [Google Scholar] [CrossRef] [PubMed]
  17. Thangavelu, R.; Loganathan, M.; Arthee, R.; Prabakaran, M.; Uma, S. Fusarium wilt: a threat to banana cultivation and its management. CABI Reviews 2020, 1–24. [Google Scholar] [CrossRef]
  18. Czislowski, E.; Fraser-Smith, S.; Zander, M.; O’Neill, W.T.; Meldrum, R.A.; Tran-Nguyen, L.T.T.; Batley, J.; Aitken, E.A.B. Investigation of the diversity of effector genes in the banana pathogen, Fusarium oxysporum f. sp. cubense, reveals evidence of horizontal gene transfer. Mol. Plant Pathol. 2018, 19, 1155–1171. [Google Scholar] [CrossRef] [PubMed]
  19. Ordonez, N.; Seidl, M.F.; Waalwijk, C.; Drenth, A.; Kilian, A.; Thomma, B.P.H.J.; Ploetz, R.C.; Kema, G.H.J. Worse comes to worst: bananas and Panama disease—when plant and pathogen clones meet. PLoS Pathog. 2015, 11, e1005197. [Google Scholar] [CrossRef] [PubMed]
  20. Dita, M.; Barquero, M.; Heck, D.; Mizubuti, E.S.G.; Staver, C.P. Fusarium wilt of banana: current knowledge on epidemiology and research needs toward sustainable disease management. Front. Plant Sci. 2018, 9. [Google Scholar] [CrossRef] [PubMed]
  21. O’Neill, W.T.; Henderson, J.; Pattemore, J.A.; O’Dwyer, C.; Perry, S.; Beasley, D.R.; Tan, Y.P.; Smyth, A.L.; Goosem, C.H.; Thomson, K.M.; et al. Detection of Fusarium oxysporum f. sp. cubense tropical race 4 strain in northern Queensland. Australas. Plant Dis. Notes 2016, 11, 33. [Google Scholar] [CrossRef]
  22. Li, C.; Mostert, G.; Zuo, C.; Beukes, I.; Yang, Q.; Sheng, O.; Kuang, R.; Wei, Y.; Hu, C.; Rose, L. Diversity and distribution of the banana wilt pathogen Fusarium oxysporum f. sp. cubense in China. Fungal Genom. Biol. 2013, 3. [Google Scholar] [CrossRef]
  23. Hermanto, C.; Sutanto, A.; Jumjunidang; Edison, H.S.; Daniells, J.W.; O’Neill, W.T.; Sinohin, V.G.O.; Molina, A.B.; Taylor, P. Incidence and distribution of Fusarium wilt disease of banana in Indonesia. Acta. Hortic. 2011, 897, 313–322. [Google Scholar] [CrossRef]
  24. Molina, A.B.; Fabregar, E.; Sinohin, V.G.; Yi, G.; Viljoen, A. Recent occurrence of Fusarium oxysporum f. sp. cubense tropical race 4 in Asia. Acta. Hortic. 2009, 828, 109–116. [Google Scholar] [CrossRef]
  25. Ploetz, R.C. Fusarium wilt of banana is caused by several pathogens referred to as Fusarium oxysporum f. sp. cubense. Phytopathology 2006, 96, 653–656. [Google Scholar] [CrossRef]
  26. García-Bastidas, F.; Ordóñez, N.; Konkol, J.; Al-Qasim, M.; Naser, Z.; Abdelwali, M.; Salem, N.; Waalwijk, C.; Ploetz, R.C.; Kema, G.H.J. First report of Fusarium oxysporum f. sp. cubense tropical race 4 associated with Panama disease of banana outside Southeast Asia. Plant Dis. 2014, 98, 694. [Google Scholar] [CrossRef] [PubMed]
  27. Maymon, M.; Sela, N.; Shpatz, U.; Galpaz, N.; Freeman, S. The origin and current situation of Fusarium oxysporum f. sp. cubense tropical race 4 in Israel and the Middle East. Sci. Rep. 2020, 10, 1590. [Google Scholar] [CrossRef] [PubMed]
  28. Thangavelu, R.; Mostert, D.; Gopi, M.; Devi, P.G.; Padmanaban, B.; Molina, A.; Viljoen, A. First detection of Fusarium oxysporum f. sp. cubense tropical race 4 (TR4) on Cavendish banana in India. Eur. J. Plant Pathol. 2019, 154, 777–786. [Google Scholar] [CrossRef]
  29. Aguayo, J.; Cerf-Wendling, I.; Folscher, A.B.; Fourrier-Jeandel, C.; Ioos, R.; Mathews, M.C.; Mostert, D.; Renault, C.; Wilson, V.; Viljoen, A. First report of Fusarium oxysporum f. sp. cubense tropical race 4 (TR4) causing banana wilt in the Island of Mayotte. Plant Dis. 2021, 105, 219. [Google Scholar] [CrossRef] [PubMed]
  30. Viljoen, A.; Mostert, D.; Chiconela, T.; Beukes, I.; Fraser, C.; Dwyer, J.; Murray, H.; Amisse, J.; Matabuana, E.L.; Tazan, G.; et al. Occurrence and spread of the banana fungus Fusarium oxysporum f. sp. cubense TR4 in Mozambique. S. Afr. J. Sci. 2020, 116, 1–11. [Google Scholar] [CrossRef] [PubMed]
  31. Acuña, R.; Rouard, M.; Leiva, A.M.; Marques, C.; Olortegui, J.A.; Ureta, C.; Cabrera-Pintado, R.M.; Rojas, J.C.; Lopez-Alvarez, D.; Cenci, A.; et al. First report of Fusarium oxysporum f. sp. cubense tropical race 4 causing Fusarium wilt in Cavendish bananas in Peru. Plant Dis. 2022, 106, 2268. [Google Scholar] [CrossRef] [PubMed]
  32. García-Bastidas, F.A.; Quintero-Vargas, J.C.; Ayala-Vasquez, M.; Schermer, T.; Seidl, M.F.; Santos-Paiva, M.; Noguera, A.M.; Aguilera-Galvez, C.; Wittenberg, A.; Hofstede, R.; et al. First report of Fusarium wilt tropical race 4 in Cavendish Bananas caused by Fusarium odoratissimum in Colombia. Plant Dis. 2020, 104, 994–994. [Google Scholar] [CrossRef]
  33. Chen, A.; Sun, J.; Matthews, A.; Armas-Egas, L.; Chen, N.; Hamill, S.; Mintoff, S.; Tran-Nguyen, L.T.T.; Batley, J.; Aitken, E.A.B. Assessing variations in host resistance to Fusarium oxysporum f sp. cubense Race 4 in Musa species, with a focus on the subtropical race 4. Front. Microbiol. 2019, 10, 1062. [Google Scholar] [CrossRef]
  34. Warman, N.M.; Aitken, E.A.B. The movement of Fusarium oxysporum f.sp. cubense (sub-tropical race 4) in susceptible cultivars of Banana. Front. Plant Sci. 2018, 9, 1748. [Google Scholar] [CrossRef]
  35. Ploetz, R.C. Management of Fusarium wilt of banana: A review with special reference to tropical race 4. Crop Prot. 2015, 73, 7–15. [Google Scholar] [CrossRef]
  36. Salacinas, M.; Meijer, H.J.G.; Mamora, S.H.; Corcolon, B.; Mirzadi Gohari, A.; Ghimire, B.; Kema, G.H.J. Efficacy of disinfectants against tropical race 4 causing Fusarium wilt in Cavendish bananas. Plant Dis. 2022, 106, 966–974. [Google Scholar] [CrossRef] [PubMed]
  37. Hamill, S.D.; Moisander, J.A.; Smith, M.K. Micropropagation of vegetatively propagated crops: accelerating release of new cultivars and providing an important source of clean planting material. Acta Hortic. 2009, 829, 213–218. [Google Scholar] [CrossRef]
  38. Bubici, G.; Kaushal, M.; Prigigallo, M.I.; Gómez-Lama Cabanás, C.; Mercado-Blanco, J. Biological control agents against Fusarium wilt of banana. Front. Microbiol. 2019, 10. [Google Scholar] [CrossRef] [PubMed]
  39. Chaves, N.P.; Staver, C.; Dita, M.A. Potential of Trichoderma asperellum for biocontrol of Fusarium wilt in banana. Acta. Hortic. 2016, 1114, 261–266. [Google Scholar] [CrossRef]
  40. García-Bastidas, F.A.; Van der Veen, A.J.; Nakasato-Tagami, G.; Meijer, H.J.; Arango-Isaza, R.E.; Kema, G.H. An improved phenotyping protocol for Panama disease in banana. Front. Plant Sci. 2019, 10, 1006. [Google Scholar] [CrossRef] [PubMed]
  41. Houbin, C.; Chunxiang, X.; Qirui, F.; Guibing, H.; Jianguo, L.; Zehuai, W.; Molina, A.B., Jr. Screening of banana clones for resistance to Fusarium wilt in China. In Proceedings of the 3rd BAPNET meeting: advancing banana and plantain R&D in Asia and the Pacific; 2004; pp. 165–174. [Google Scholar]
  42. Hwang, S.C.; Ko, W.H. Cavendish banana cultivars resistant to Fusarium wilt acquired through somaclonal variation in Taiwan. Plant Dis. 2004, 88, 580–588. [Google Scholar] [CrossRef] [PubMed]
  43. Mintoff, S.J.; Nguyen, T.V.; Kelly, C.; Cullen, S.; Hearnden, M.; Williams, R.; Daniells, J.W.; Tran-Nguyen, L.T. Banana cultivar field screening for resistance to Fusarium oxysporum f. sp. cubense tropical race 4 in the Northern Territory. J. Fungi 2021, 7, 627. [Google Scholar] [CrossRef]
  44. Smith, M.; Langdon, P.; Pegg, K.; Daniells, J. Growth, yield and Fusarium wilt resistance of six FHIA tetraploid bananas (Musa spp.) grown in the Australian subtropics. Sci. Hortic. 2014, 170, 176–181. [Google Scholar] [CrossRef]
  45. Zuo, C.; Deng, G.; Li, B.; Huo, H.; Li, C.; Hu, C.; Kuang, R.; Yang, Q.; Dong, T.; Sheng, O. Germplasm screening of Musa spp. for resistance to Fusarium oxysporum f. sp. cubense tropical race 4 (Foc TR4). Eur. J. Plant Pathol. 2018, 151, 723–734. [Google Scholar] [CrossRef]
  46. D’hont, A.; Denoeud, F.; Aury, J.-M.; Baurens, F.-C.; Carreel, F.; Garsmeur, O.; Noel, B.; Bocs, S.; Droc, G.; Rouard, M. The banana (Musa acuminata) genome and the evolution of monocotyledonous plants. Nature 2012, 488, 213–217. [Google Scholar] [CrossRef]
  47. Colasuonno, P.; Marcotuli, I.; Gadaleta, A.; Soriano, J.M. From genetic maps to QTL cloning: An overview for durum wheat. Plants 2021, 10, 315. [Google Scholar] [CrossRef] [PubMed]
  48. Remington, D.L.; Ungerer, M.C.; Purugganan, M.D. Map-based cloning of quantitative trait loci: progress and prospects. Genet. Res. 2001, 78, 213–218. [Google Scholar] [CrossRef] [PubMed]
  49. Hasan, N.; Choudhary, S.; Naaz, N.; Sharma, N.; Laskar, R.A. Recent advancements in molecular marker-assisted selection and applications in plant breeding programmes. J. Genet. Eng. Biotechnol. 2021, 19, 128. [Google Scholar] [CrossRef] [PubMed]
  50. Heslop-Harrison, J.S.; Schwarzacher, T. Domestication, genomics and the future for banana. Ann. Bot. 2007, 100, 1073–1084. [Google Scholar] [CrossRef] [PubMed]
  51. Fauré, S.; Noyer, J.L.; Horry, J.P.; Bakry, F.; Lanaud, C.; Gońzalez de León, D. A molecular marker-based linkage map of diploid bananas (Musa acuminata). Theor. Appl. Genet. 1993, 87, 517–526. [Google Scholar] [CrossRef] [PubMed]
  52. Kayat, F.; Bonar, N.; Waugh, R.; Rajinder, S.; Rahimah, A.R.; Rashid, K.A.; Othman, R.Y. Development of a genetic linkage map for genes associated with resistance and susceptibility to Fusarium oxysporum f. sp. cubense from an F1 hybrid population of Musa acuminata ssp. malaccensis. Acta. Hortic. 2009, 828, 333–340. [Google Scholar] [CrossRef]
  53. Risterucci, A.M.; Hippolyte, I.; Perrier, X.; Xia, L.; Caig, V.; Evers, M.; Huttner, E.; Kilian, A.; Glaszmann, J.C. Development and assessment of Diversity Arrays Technology for high-throughput DNA analyses in Musa. Theor. Appl. Genet. 2009, 119, 1093–1103. [Google Scholar] [CrossRef]
  54. Ahmad, F.; Martawi, N.M.; Poerba, Y.S.; de Jong, H.; Schouten, H.; Kema, G.H.J. Genetic mapping of Fusarium wilt resistance in a wild banana Musa acuminata ssp. malaccensis accession. Theor. Appl. Genet. 2020, 133, 3409–3418. [Google Scholar] [CrossRef]
  55. Hippolyte, I.; Bakry, F.; Seguin, M.; Gardes, L.; Rivallan, R.; Risterucci, A.M.; Jenny, C.; Perrier, X.; Carreel, F.; Argout, X.; et al. A saturated SSR/DArT linkage map of Musa acuminata addressing genome rearrangements among bananas. BMC Plant Biol. 2010, 10, 65. [Google Scholar] [CrossRef]
  56. Uwimana, B.; Mwanje, G.; Batte, M.; Akech, V.; Shah, T.; Vuylsteke, M.; Swennen, R. Continuous mapping identifies loci associated with weevil resistance [Cosmopolites sordidus (Germar)] in a triploid banana population. Front. Plant Sci. 2021, 12. [Google Scholar] [CrossRef]
  57. Chen, A.; Sun, J.; Martin, G.; Gray, L.-A.; Hřibová, E.; Christelová, P.; Yahiaoui, N.; Rounsley, S.; Lyons, R.; Batley, J.; et al. Identification of a major QTL-controlling resistance to the subtropical race 4 of Fusarium oxysporum f. sp. cubense in Musa acuminata ssp. malaccensis. Pathogens 2023, 12, 289. [Google Scholar] [CrossRef] [PubMed]
  58. Fraser-Smith, S.; Czislowski, E.; Daly, A.; Meldrum, R.; Hamill, S.; Smith, M.; Aitken, E.A.B. Single gene resistance to Fusarium oxysporum f. sp. cubense race 4 in the wild banana Musa acuminata subsp. malaccensis. Acta. Hortic. 2016, 1114, 95–100. [Google Scholar] [CrossRef]
  59. Christelová, P.; De Langhe, E.; Hřibová, E.; Čížková, J.; Sardos, J.; Hušáková, M.; Van den houwe, I.; Sutanto, A.; Kepler, A.K.; Swennen, R.; et al. Molecular and cytological characterization of the global Musa germplasm collection provides insights into the treasure of banana diversity. Biodivers. Conserv. 2017, 26, 801–824. [Google Scholar] [CrossRef]
  60. Zhang, L.; Yuan, T.; Wang, Y.; Zhang, D.; Bai, T.; Xu, S.; Wang, Y.; Tang, W.; Zheng, S.-J. Identification and evaluation of resistance to Fusarium oxysporum f. sp. cubense tropical race 4 in Musa acuminata. Pahang. Euphytica 2018, 214, 106. [Google Scholar] [CrossRef]
  61. Moore, N.Y.; Pegg, K.; Smith, L.; Langdon, P.W.; Bentley, S.; Smith, M.K. Fusarium wilt of banana in Australia. In Banana Fusarium Wilt Management: Towards Sustainable Cultivation; Malaysia, 2001; pp. 64–75. [Google Scholar]
  62. Li, W.M.; Dita, M.; Wu, W.; Hu, G.B.; Xie, J.H.; Ge, X.J. Resistance sources to Fusarium oxysporum f. sp. cubense tropical race 4 in banana wild relatives. Plant Pathol. 2015, 64, 1061–1067. [Google Scholar] [CrossRef]
  63. Madalla, N.A.; Swennen, R.; Brown, A.F.; Massawe, C.; Shimwela, M.; Mbongo, D.; Kindimba, G.; Kubiriba, J.; Tumuhimbise, R.; Okurut, A.W.; et al. Yield stability of East African highland cooking banana ‘Matooke’ hybrids. J. Am. Soc. Hortic. Sci. 2022, 147, 334–348. [Google Scholar] [CrossRef]
  64. Wang, X.; Yu, R.; Li, J. Using genetic engineering techniques to develop banana cultivars with Fusarium wilt resistance and ideal plant architecture. Front. Plant Sci. 2021, 11. [Google Scholar] [CrossRef]
  65. Martin, G.; Carreel, F.; Coriton, O.; Hervouet, C.; Cardi, C.; Derouault, P.; Roques, D.; Salmon, F.; Rouard, M.; Sardos, J.; et al. Evolution of the banana genome (Musa acuminata) is impacted by large chromosomal translocations. Mol. Biol. Evol. 2017, 34, 2140–2152. [Google Scholar] [CrossRef]
  66. Rijzaani, H.; Bayer, P.E.; Rouard, M.; Doležel, J.; Batley, J.; Edwards, D. The pangenome of banana highlights differences between genera and genomes. Plant Genome 2022, 15, e20100. [Google Scholar] [CrossRef]
  67. Rouard, M.; Droc, G.; Martin, G.; Sardos, J.; Hueber, Y.; Guignon, V.; Cenci, A.; Geigle, B.; Hibbins, M.S.; Yahiaoui, N.; et al. Three new genome assemblies support a rapid radiation in Musa acuminata (wild banana). Genome Biol. Evol. 2018, 10, 3129–3140. [Google Scholar] [CrossRef]
  68. Rouard, M.; Sardos, J.; Sempéré, G.; Breton, C.; Guignon, V.; Van den Houwe, I.; Carpentier, S.C.; Roux, N. A digital catalog of high-density markers for banana germplasm collections. Plants people planet 2022, 4, 61–67. [Google Scholar] [CrossRef]
  69. Sardos, J.; Rouard, M.; Hueber, Y.; Cenci, A.; Hyma, K.E.; van den Houwe, I.; Hribova, E.; Courtois, B.; Roux, N. A genome-wide association study on the seedless phenotype in banana (Musa spp.) reveals the potential of a selected panel to detect candidate genes in a vegetatively propagated crop. PLoS One 2016, 11, e0154448. [Google Scholar] [CrossRef] [PubMed]
  70. Martínez, G.; Olivares, B.O.; Rey, J.C.; Rojas, J.; Cardenas, J.; Muentes, C.; Dawson, C. The advance of Fusarium wilt tropical race 4 in Musaceae of Latin America and the Caribbean: Current Situation. Pathogens 2023, 12, 277. [Google Scholar] [CrossRef] [PubMed]
  71. Feuillet, C.; Schachermayr, G.; Keller, B. Molecular cloning of a new receptor-like kinase gene encoded at the Lr10 disease resistance locus of wheat. Plant J. 1997, 11, 45–52. [Google Scholar] [CrossRef] [PubMed]
  72. Dardick, C.; Schwessinger, B.; Ronald, P. Non-arginine-aspartate (non-RD) kinases are associated with innate immune receptors that recognize conserved microbial signatures. Curr. Opin. Plant Biol. 2012, 15, 358–366. [Google Scholar] [CrossRef] [PubMed]
  73. Shiu, S.-H.; Bleecker, A.B. Expansion of the Receptor-Like Kinase/Pelle Gene Family and Receptor-Like Proteins in Arabidopsis. Plant Physiol. 2003, 132, 530–543. [Google Scholar] [CrossRef] [PubMed]
  74. Xia, T.; Yang, Y.; Zheng, H.; Han, X.; Jin, H.; Xiong, Z.; Qian, W.; Xia, L.; Ji, X.; Li, G.; et al. Efficient expression and function of a receptor-like kinase in wheat powdery mildew defence require an intron-located MYB binding site. Plant Biotechnol. J. 2021, 19, 897–909. [Google Scholar] [CrossRef] [PubMed]
  75. Zhou, H.; Li, S.; Deng, Z.; Wang, X.; Chen, T.; Zhang, J.; Chen, S.; Ling, H.; Zhang, A.; Wang, D.; et al. Molecular analysis of three new receptor-like kinase genes from hexaploid wheat and evidence for their participation in the wheat hypersensitive response to stripe rust fungus infection. Plant J. 2007, 52, 420–434. [Google Scholar] [CrossRef]
  76. Lim, C.W.; Yang, S.H.; Shin, K.H.; Lee, S.C.; Kim, S.H. The AtLRK10L1.2, Arabidopsis ortholog of wheat LRK10, is involved in ABA-mediated signaling and drought resistance. Plant Cell Rep. 2015, 34, 447–455. [Google Scholar] [CrossRef]
  77. Zipfel, C. Plant pattern-recognition receptors. Trends Immunol. 2014, 35, 345–351. [Google Scholar] [CrossRef]
  78. Hammond-Kosack, K.E.; Tang, S.; Harrison, K.; Jones, J.D. The tomato Cf-9 disease resistance gene functions in tobacco and potato to confer responsiveness to the fungal avirulence gene product avr9. Plant Cell 1998, 10, 1251–1266. [Google Scholar] [CrossRef] [PubMed]
  79. Ron, M.; Avni, A. The receptor for the fungal elicitor ethylene-inducing xylanase is a member of a resistance-like gene family in tomato. Plant Cell 2004, 16, 1604–1615. [Google Scholar] [CrossRef] [PubMed]
  80. Yin, Z.; Wang, N.; Pi, L.; Li, L.; Duan, W.; Wang, X.; Dou, D. Nicotiana benthamiana LRR-RLP NbEIX2 mediates the perception of an EIX-like protein from Verticillium dahliae. J. Integr. Plant Biol. 2021, 63, 949–960. [Google Scholar] [CrossRef] [PubMed]
  81. Saintenac, C.; Cambon, F.; Aouini, L.; Verstappen, E.; Ghaffary, S.M.T.; Poucet, T.; Marande, W.; Berges, H.; Xu, S.; Jaouannet, M.; et al. A wheat cysteine-rich receptor-like kinase confers broad-spectrum resistance against Septoria tritici blotch. Nat. Commun. 2021, 12, 433. [Google Scholar] [CrossRef] [PubMed]
  82. Gu, J.; Sun, J.; Liu, N.; Sun, X.; Liu, C.; Wu, L.; Liu, G.; Zeng, F.; Hou, C.; Han, S.; et al. A novel cysteine-rich receptor-like kinase gene, TaCRK2, contributes to leaf rust resistance in wheat. Mol. Plant Pathol. 2020, 21, 732–746. [Google Scholar] [CrossRef]
  83. Acharya, B.R.; Raina, S.; Maqbool, S.B.; Jagadeeswaran, G.; Mosher, S.L.; Appel, H.M.; Schultz, J.C.; Klessig, D.F.; Raina, R. Overexpression of CRK13, an Arabidopsis cysteine-rich receptor-like kinase, results in enhanced resistance to Pseudomonas syringae. Plant J. 2007, 50, 488–499. [Google Scholar] [CrossRef]
  84. Tang, D.; Wang, G.; Zhou, J.M. Receptor kinases in plant-pathogen interactions: more than pattern recognition. Plant Cell 2017, 29, 618–637. [Google Scholar] [CrossRef]
  85. Gómez-Gómez, L.; Boller, T. FLS2: an LRR receptor-like kinase involved in the perception of the bacterial elicitor flagellin in Arabidopsis. Mol. Cell 2000, 5, 1003–1011. [Google Scholar] [CrossRef]
  86. Huffaker, A.; Pearce, G.; Ryan, C.A. An endogenous peptide signal in Arabidopsis activates components of the innate immune response. Proc. Natl. Acad. Sci. USA 2006, 103, 10098–10103. [Google Scholar] [CrossRef]
  87. Huffaker, A.; Ryan, C.A. Endogenous peptide defense signals in Arabidopsis differentially amplify signaling for the innate immune response. Proc. Natl. Acad. Sci. USA 2007, 104, 10732–10736. [Google Scholar] [CrossRef]
  88. Pruitt, R.N.; Schwessinger, B.; Joe, A.; Thomas, N.; Liu, F.; Albert, M.; Robinson, M.R.; Chan, L.J.; Luu, D.D.; Chen, H.; et al. The rice immune receptor XA21 recognizes a tyrosine-sulfated protein from a Gram-negative bacterium. Sci. Adv. 2015, 1, e1500245. [Google Scholar] [CrossRef] [PubMed]
  89. van Dam, S.; Võsa, U.; van der Graaf, A.; Franke, L.; de Magalhães, J.P. Gene co-expression analysis for functional classification and gene–disease predictions. Brief. Bioinform. 2017, 19, 575–592. [Google Scholar] [CrossRef] [PubMed]
  90. van Westerhoven, A.C.; Meijer, H.J.G.; Seidl, M.F.; Kema, G.H.J. Uncontained spread of Fusarium wilt of banana threatens African food security. PLoS Pathog. 2022, 18, e1010769. [Google Scholar] [CrossRef] [PubMed]
  91. Pinheiro, T.D.M.; Rego, E.C.S.; Alves, G.S.C.; Fonseca, F.C.A.; Cotta, M.G.; Antonino, J.D.; Gomes, T.G.; Amorim, E.P.; Ferreira, C.F.; Costa, M.; et al. Transcriptome profiling of the resistance response of Musa acuminata subsp. burmannicoides, var. Calcutta 4 to Pseudocercospora musae. Int. J. Mol. Sci. 2022, 23, 3589. [Google Scholar] [CrossRef]
  92. Wilberforce, T.; Batte, M.; Nyine, M.; Tumuhimbise, R.; Alex, B.; Ssali, R.; Talengera, D.; Kubiriba, J.; Lorenzen, J.; Swennen, R.; et al. Performance of NARITA banana hybrds in the preliminary yield trial for three cycles in Uganda. 2017. [Google Scholar] [CrossRef]
  93. Batte, M.; Nyine, M.; Uwimana, B.; Swennen, R.; Akech, V.; Brown, A.; Hovmalm, H.P.; Geleta, M.; Ortiz, R. Significant progressive heterobeltiosis in banana crossbreeding. BMC Plant Biol. 2020, 20, 489. [Google Scholar] [CrossRef] [PubMed]
  94. Thangavelu, R.; Saraswathi, M.S.; Uma, S.; Loganathan, M.; Backiyarani, S.; Durai, P.; Raj, E.E.; Marimuthu, N.; Kannan, G.; Swennen, R. Identification of sources resistant to a virulent Fusarium wilt strain (VCG 0124) infecting Cavendish bananas. Sci. Rep. 2021, 11, 3183. [Google Scholar] [CrossRef]
  95. Noordin, N.; Hassan, A.A.; Mahadevan, A.N.M.F.; Ahmad, Z.; Ariffin, S. Lab-based screening using hydroponic system for the rapid detection of Fusarium wilt TR4 tolerance/resistance of banana. In Efficient Screening Techniques to Identify Mutants with TR4 Resistance in Banana: Protocols; Jankowicz-Cieslak, J., Ingelbrecht, I.L., Eds.; Springer: Berlin, Heidelberg, 2022; pp. 79–95. [Google Scholar]
  96. Wu, Y.; Huang, B.; Peng, X.; Zhang, J. Development of an in vitro hydroponic system for studying the interaction between banana plantlet and Fusarium oxysporum f. sp. cubense. Plant Cell, Tissue Organ Cult. 2021, 146, 107–114. [Google Scholar] [CrossRef]
  97. Cong, L.L.; Sun, Y.; Wang, Z.; Kang, J.M.; Zhang, T.J.; Biligetu, B.; Yang, Q.C. A rapid screening method for evaluating resistance of alfalfa (Medicago sativa L.) to Fusarium root rot. Can. J. Plant Pathol. 2018, 40, 61–69. [Google Scholar] [CrossRef]
  98. Thatcher, L.F.; Kidd, B.N.; Singh, K.B. Tools and strategies for genetic and molecular dissection of Medicago truncatula resistance against Fusarium wilt disease. In The Model Legume Medicago truncatula; 2020; pp. 331–339. [Google Scholar]
  99. Prasath, D.; Matthews, A.; O’Neill, W.T.; Aitken, E.A.B.; Chen, A. Fusarium yellows of ginger (Zingiber officinale Roscoe) caused by Fusarium oxysporum f. sp. zingiberi is associated with cultivar-specific expression of defense-responsive genes. Pathogens 2023, 12, 141. [Google Scholar] [CrossRef]
  100. Ndayihanzamaso, P.; Mostert, D.; Matthews, M.C.; Mahuku, G.; Jomanga, K.; Mpanda, H.J.; Mduma, H.; Brown, A.; Uwimana, B.; Swennen, R.; et al. Evaluation of Mchare and Matooke bananas for resistance to Fusarium oxysporum f. sp. cubense race 1. Plants 2020, 9, 1082. [Google Scholar] [CrossRef] [PubMed]
  101. Viljoen, A.; Mahuku, G.; Ssali, R.; Kimunye, J.; Mostert, D.; Ndayihanzamaso, P.; Coyne, D. Banana diseases and pests: field guide for diagnostics and data collection; International Institute of Tropical Agriculture: Ibadan, Nigeria, 2017. [Google Scholar]
  102. Li, R.; Yu, C.; Li, Y.; Lam, T.W.; Yiu, S.M.; Kristiansen, K.; Wang, J. SOAP2: an improved ultrafast tool for short read alignment. Bioinformatics 2009, 25, 1966–1967. [Google Scholar] [CrossRef] [PubMed]
  103. Lorenc, M.T.; Hayashi, S.; Stiller, J.; Lee, H.; Manoli, S.; Ruperao, P.; Visendi, P.; Berkman, P.J.; Lai, K.; Batley, J. Discovery of single nucleotide polymorphisms in complex genomes using SGSautoSNP. Biol. 2012, 1, 370–382. [Google Scholar] [CrossRef] [PubMed]
  104. Robinson, J.T.; Thorvaldsdóttir, H.; Winckler, W.; Guttman, M.; Lander, E.S.; Getz, G.; Mesirov, J.P. Integrative genomics viewer. Nat. Biotechnol. 2011, 29, 24–26. [Google Scholar] [CrossRef] [PubMed]
  105. Untergasser, A.; Cutcutache, I.; Koressaar, T.; Ye, J.; Faircloth, B.C.; Remm, M.; Rozen, S.G. Primer3--new capabilities and interfaces. Nucleic Acids Res. 2012, 40, e115. [Google Scholar] [CrossRef] [PubMed]
  106. Healey, A.; Furtado, A.; Cooper, T.; Henry, R.J. Protocol: a simple method for extracting next-generation sequencing quality genomic DNA from recalcitrant plant species. Plant Methods 2014, 10, 21. [Google Scholar] [CrossRef]
  107. Chen, S.; Zhou, Y.; Chen, Y.; Gu, J. fastp: an ultra-fast all-in-one FASTQ preprocessor. Bioinformatics 2018, 34, i884–i890. [Google Scholar] [CrossRef]
  108. Dobin, A.; Gingeras, T.R. Mapping RNA-seq reads with STAR. Curr. Protoc. Bioinformatics. 2015, 51, 11.14.11–11.14.19. [Google Scholar] [CrossRef]
  109. Liao, Y.; Smyth, G.K.; Shi, W. featureCounts: an efficient general purpose program for assigning sequence reads to genomic features. Bioinformatics 2013, 30, 923–930. [Google Scholar] [CrossRef]
  110. Zhao, Y.; Li, M.-C.; Konaté, M.M.; Chen, L.; Das, B.; Karlovich, C.; Williams, P.M.; Evrard, Y.A.; Doroshow, J.H.; McShane, L.M. TPM, FPKM, or Normalized Counts? A Comparative Study of Quantification Measures for the Analysis of RNA-seq Data from the NCI Patient-Derived Models Repository. J. Transl. Med. 2021, 19, 269. [Google Scholar] [CrossRef]
  111. Love, M.I.; Huber, W.; Anders, S. Moderated estimation of fold change and dispersion for RNA-seq data with DESeq2. Genome Biol. 2014, 15, 550. [Google Scholar] [CrossRef] [PubMed]
  112. Benjamini, Y.; Hochberg, Y. Controlling the false discovery rate: a practical and powerful approach to multiple testing. J. R. Stat. Soc. B Stat. Methodol. 1995, 57, 289–300. [Google Scholar] [CrossRef]
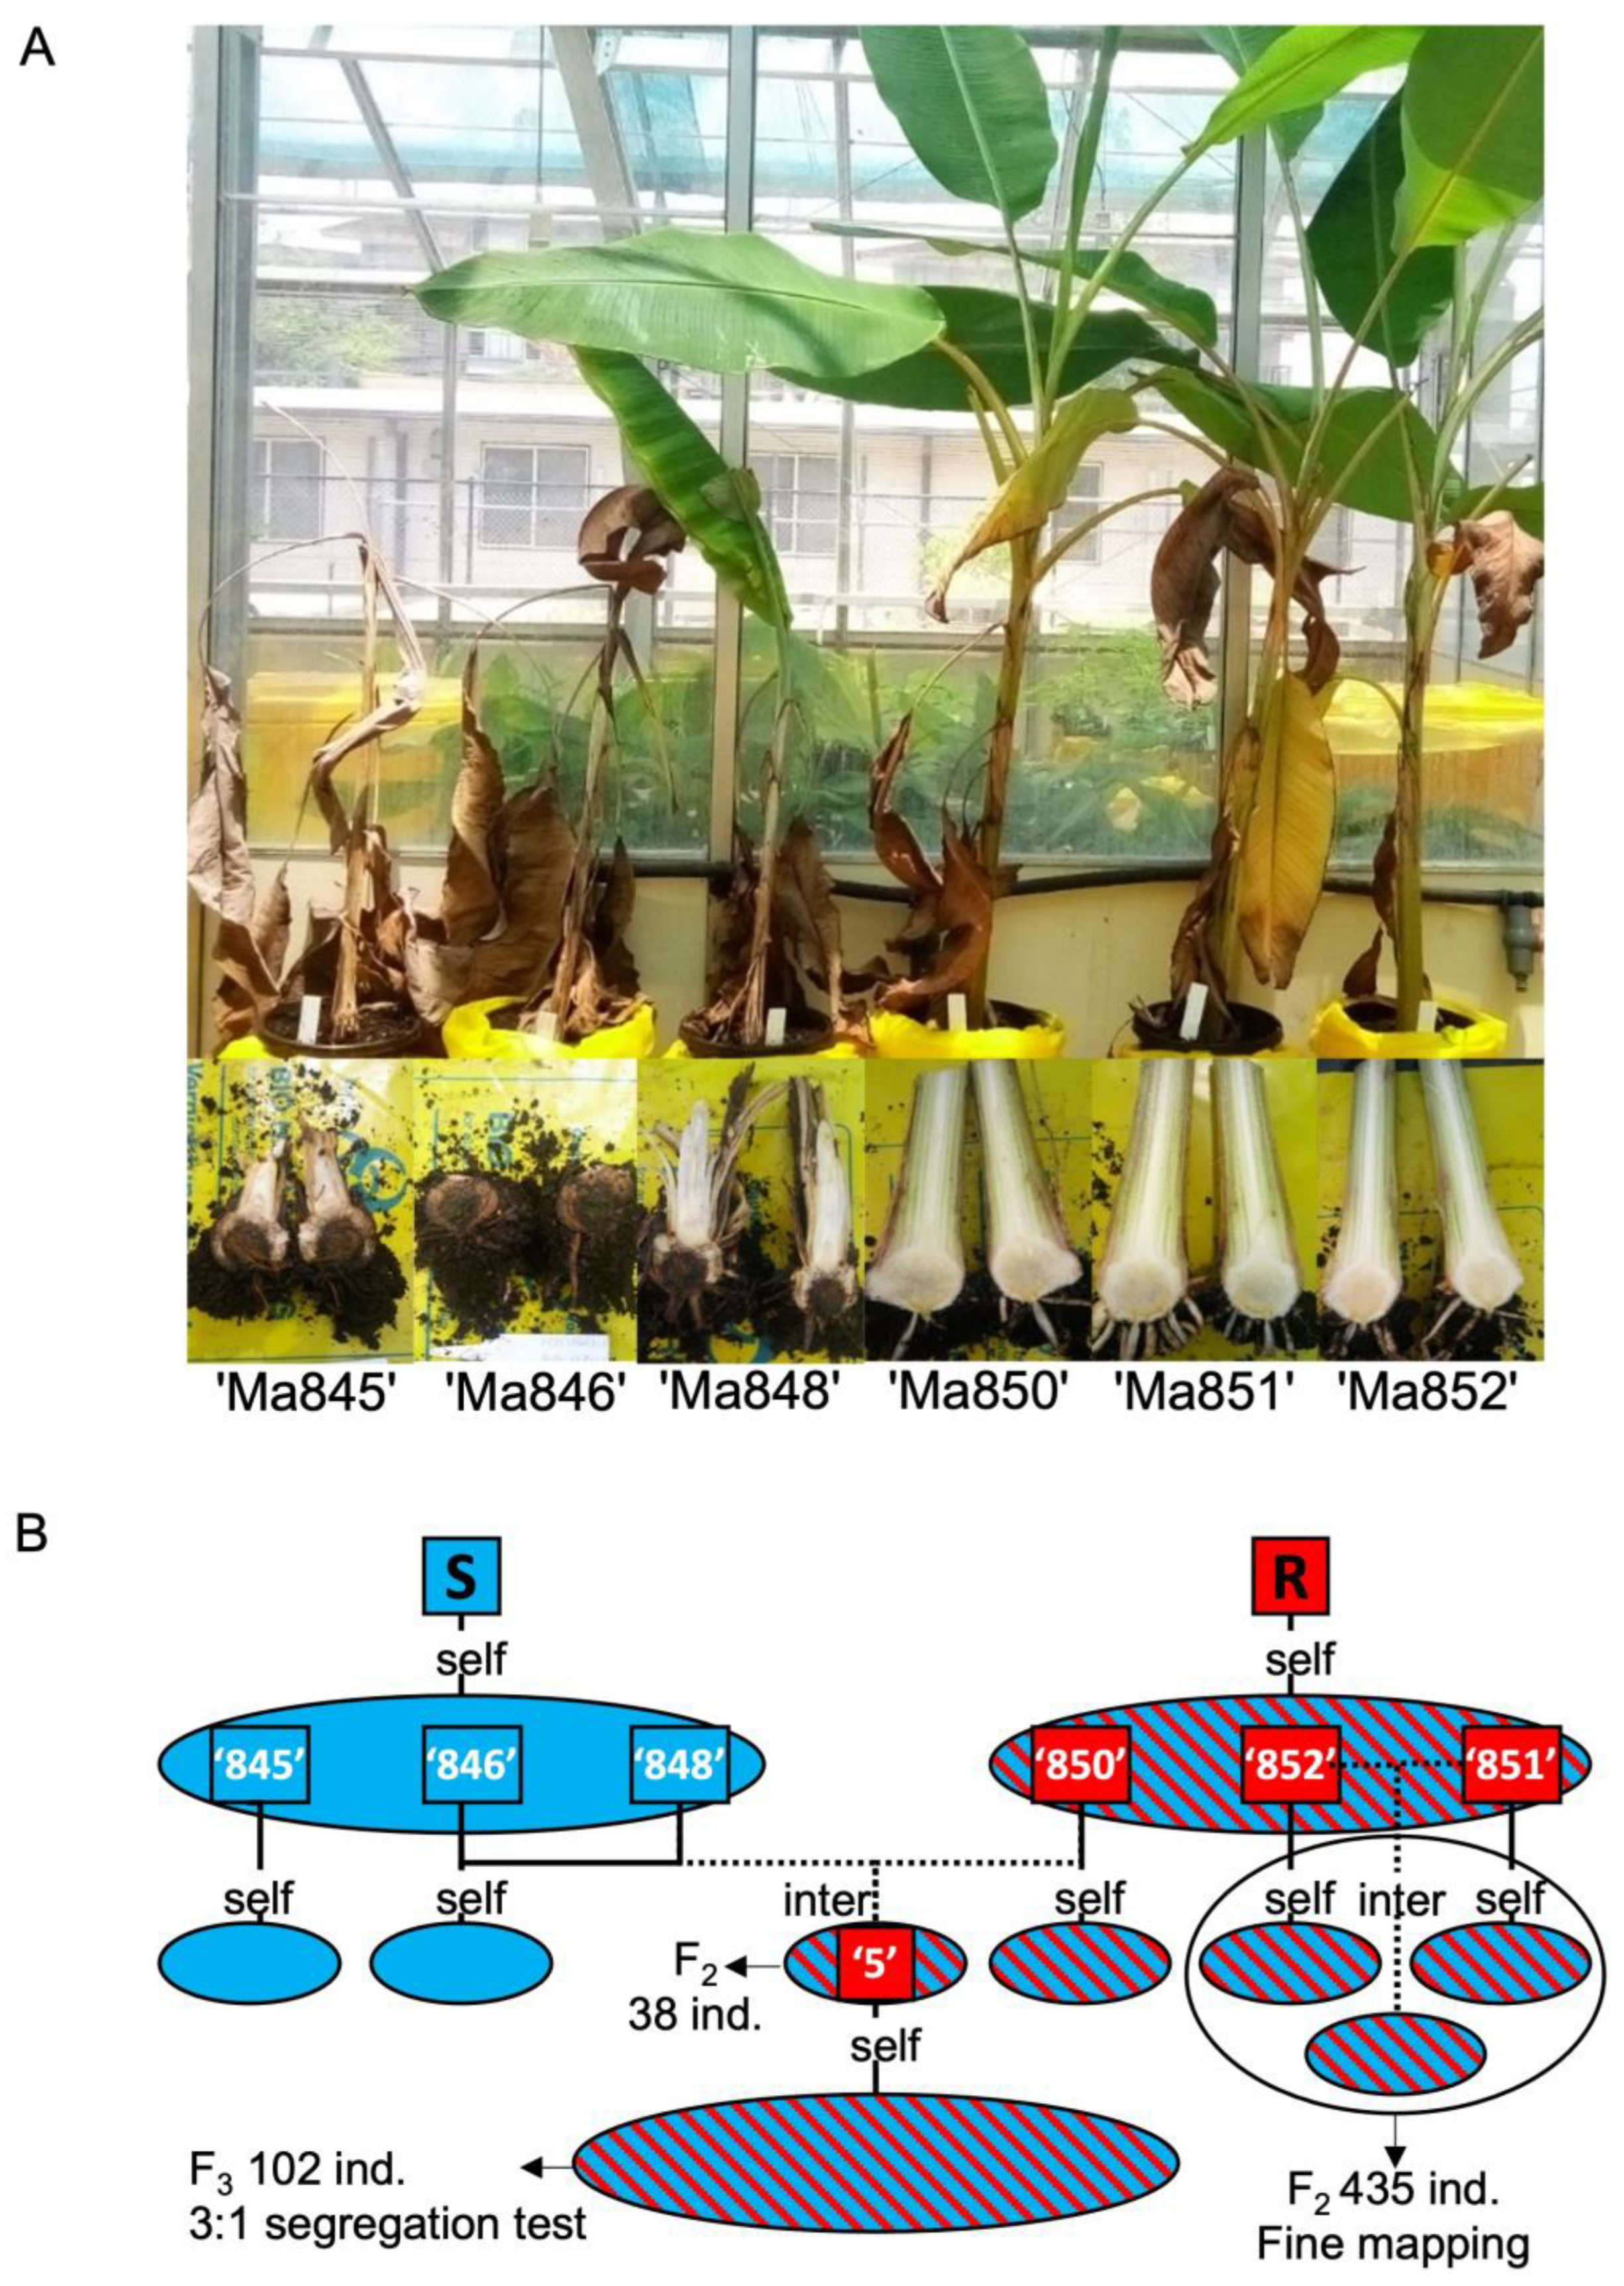
Figure 1. Foc-STR4 resistance or susceptiblity in the diploid M. acuminata ssp. malaccensis parents ‘Ma845’, ‘Ma846’, ‘Ma848’, and ‘Ma850’, ‘Ma581’, ‘Ma852’ and the F2 population development. (A) Representative plants of six genotypes following infection with Foc-STR4. Foc-STR4 susceptible individuals ‘Ma845’, ‘Ma846’, and ‘Ma848’ displayed vascular wilting and plant death, and brown discolourations associated with the colonisation of the fungus inside the rhizomes. The ‘Ma850’, ‘Ma851’, and ‘Ma852’ parents were completely resistant to Foc-STR4 and did not show any internal or external symptoms. (B) The development of Musa acuminata ssp. malaccensis populations used in this study. The ‘R’ progenitor is the original Foc race 4 resistant parent which gave rise after selfing to three F1 plants, ‘Ma850’, ‘Ma851’ and ‘Ma852’, segregating for both Foc-TR4 and Foc-STR4 resistance. A susceptible ‘S’ progenitor that is not related to the ‘R’ progenitor, gave rise to three self-crossed progenies, ‘Ma845’, ‘Ma846’ and ‘Ma848’, all of which are Foc race 4 susceptible. The genetic analysis carried out in this study used self-derived F2 progenies of Ma851 and Ma852 as well as progenies derived from an inter-cross between the two (population 1). The segregation of resistance was further validated using an inter-cross between ‘Ma850’ and ‘Ma848’ (population 2). The F2 line #5 from this cross was selfed to generate an F3 population segregating for STR4 resistance. Rectangles indicate parental lines. Ovals indicate progenies derived from the same parent(s). Parents are coloured according to resistant (red) or susceptible (blue) Foc race 4 phenotypes. Progenies (ovals) are shaded blue to indicate the absence of resistance amongst all progenies tested, or red/blue stripes to indicate the segregation of Foc race 4 resistance within the population. Solid lines indicate self-cross pollinations. A dashed line indicates an inter-cross.
Preprints 72761 g001
Figure 2. A genetic map constructed using CAPS markers developed in the QTL region at the distal end of the long arm of Chromosome 3. The marker names correspond to the numeric part of the DH-Pahang v1 gene names. The centiMorgan (cM) distance between markers on the left is calculated from 435 F2 individuals derived from the self-cross of ‘Ma851’ × ‘Ma851’, ‘Ma852’ × ‘Ma852’ and the inter-cross of ‘Ma851’ × ‘Ma852’, collectively referred to as population 1. The candidate region is mapped to a 12.9 cM genetic interval between markers 28420 and 29590. The Foc-STR4/Foc-TR4 resistance locus is highlighted in red. This locus is defined by multiple critical lines carrying recombination events between markers 28420 and 28820, 29460 and 29590. The markers most closely linked to the locus are 28820 and 29460. The directions of the marker-trait association are indicated with an arrow. All lines were tested against Foc-STR4. Asteriks (*) indicates that these lines were additionally tested against Foc-TR4. Plus (+) indicates that the Foc-TR4 phenotype of this line is not in agreement with all the other lines tested at the same recombined position.
Preprints 72761 g002
Figure 3. Fine mapping of the STR4/TR4 resistance locus. (A) A genetic map constructed using mostly homozygous B/H (B = marker allele homozygous for susceptibility, H = marker allele heterozygous) recombinants in the QTL region. A = marker allele homozygous for resistance. Unique line names are indicated in the column on the left. The n or number of individual clones tested per line is indicated in square brackets in the format of [STR4, TR4]. The marker names are displayed at the top, corresponding to the numeric part of the DH-Pahang v1 gene accessions. Recombinations between adjacent markers are indicated by a solid vertical bar. One-way ANOVA probability (p) and eta-squared (η2) values are displayed at the bottom for each marker-phenotype comparison. Statistically significant comparisons at p < 0.05 for Foc-STR4, and p < 0.1 for Foc-TR4 are highlighted in bold. (B) Foc-STR4 phenotypes of the recombinants scored as rhizome discolouration index (RDI). Red/blue bars indicate Foc-STR4 resistant/susceptible phenotypes, respectively. (C) Foc-TR4 sensitivity scored as RDI in a subset of the critical recombinants. Disease incidence (grey) is indicated as a percentage of the number of individuals showing symptoms over the total number of clones or n screened per genotype on a scale at the top. Asteriks (*) = resistance was observed where a susceptible phenotype was expected. The respective +/- controls in the Foc-TR4 screening were the Cavendish cultivar ‘Williams’ with or without the pathogen. RDI was scored according to a 1-8 scale [33] for Foc-STR4 and a 1-6 scale for Foc-TR4 [28]. 95% confidence interval of the means are plotted as error bars for lines with n > 2. Significant differences at p < 0.05 between groups were determined using one-way ANOVA. The means were separated by least significant difference at p ≤ 0.05. The subsets are indicated by letters in superscript.
Preprints 72761 g003
Figure 4. Differential gene expression of candidate genes. TPM (transcripts per million) were selected from a RNAseq study of a 7 day Foc-STR4 infection time course using R- and S-progenies of ‘population 1’. (A) Macma4_03_g31310.1, a putative LRR RLP protein. (B) Macma4_03_g31320.1, a putative LRR receptor-like serine/threonine-protein kinase. (C) Macma4_03_g31470.1, a putative LRR RLP protein. (D) Macma4_03_g31510.1, a putative cysteine-rich receptor-like protein kinase 6. (E) Macma4_03_g32220.1, a putative leaf rust 10 disease-resistance locus receptor-like protein kinase like protein (LRK10L). (F) Macma4_03_g31460.1, a putative LRR RLP protein. (G) Macma4_03_g31380.1, a putative LRR RLP protein. (H) Macma4_03_g32050.1, a putative serine/threonine-protein kinase/endoribonuclease IRE1a. n or replicates per genotype per time point is 3. Significantly differential expression between R- and S-progenies was indicated at p-adj < 0.05 (*), p-adj < 0.01 (**), and p-adj < 0.001 (***). T = time in days. RLP = receptor like protein. RLK = receptor like kinase, CRK = cysteine rich kinase, STK = serine/theonine protein kinase. Error bars indicate standard errors of the means (n = 3).
Preprints 72761 g004
Figure 5. Foc-STR4 resistance and marker validation in the ‘Ma850’ × ‘Ma848’ population. (A) Marker haplotypes of the six parental Musa acuminata ssp. malaccensis in the QTL region. Marker allele annotations are described as per Figure 3A. The position of the Foc-STR4 and Foc-TR4 resistance locus is indicated. Parental Foc sensitivity, S = susceptible, R = resistant. (B) ‘Ma850’ × ‘Ma848’ F1 individuals screened with Foc-STR4. Foc-STR4 resistant and susceptible phenotypes are differentiated by red/blue coded bars, respectively. RDI = rhizome discolouration index. The line (number 5) with red highlight was used to generate the self-crossed F2 population. (C) A CAPS marker screening was performed on the ‘Ma850’ × ‘Ma848’ F1 individuals using the primers ‘28820-SNP8-F2’ and ‘28820-SNP8-R1’ targeting a SNP in gene model GSMUA_Achr3G28820 (‘DH-Pahang’ v1.0) and PCR conditions as described (Table 1). The dominant band (544 bp) after a BstZ17I digest is associated with Foc-STR4 resistance. Yellow arrows indicate de-coupling of the dominant marker band with Foc-STR4 resistance. (D) ‘Ma850’ × ‘Ma848’ F2 individuals screened with Foc-STR4. Individuals with a RDI score of <4 are considered resistant (R), and those with a RDI score of ≥4 (greater than 20% discolouration) are considered susceptible (S). Individual x-axis labels are staggered every two lines. The number of clones (n) tested per line is indicated in brackets.
Preprints 72761 g005
Figure 6. Marker validation for marker assisted selection of Foc race 4 resistance in the diploid (AA) wild relatives and hybrids from the IITA collection. The SNP marker generated from GSMUA_Achr3G29730 in ‘DH-Pahang’ reference genome v1 was converted to amplify A-genome specific products based on A/B genome discriminating SNPs at the 3’ termini of the primer pair (Table 1). (A) PCR amplifcation using 29730-A-SNP1-F2 and 29730-A-SNP1-R2 amplified a single 795 bp product in 59 genotypes as per Table 3. Lane or L60 is the Musa balbisiana (BB) which served as a negative control for the A-genome specific PCRs. (B) This product is subsequently digested with BcoDI to reveal a dominant uncut band (795 bp) putatively associated with resistance. The alternatively cut allele (429 bp and 366 bp) may indicate the presence of the Foc susceptible allele. Accessions heterozygous for the marker locus are predicted to be resistant to Foc-STR4 and Foc-TR4 due to the complete dominance of the R allele over the S allele at this resistance locus. Resistances are detected in ‘Ma850’ (L1), ‘Ma851’ (L2), ‘Ma852’ (L3), ‘Pahang’ (L7, 20), ‘SH-3362’ (L8, 9, 37), ‘Madang Gaudelope’ (L10), ‘SH-3217’ (L12), ‘Malaccensis-ITC0250’ (15, 38), ‘Malaccensis-ITC0399’ (L19), ‘Pa Musore no2’ (L21), ‘Kluai Pal’ (L22), ‘CIRAD 930/DH Pahang’ (L23), ‘TMB2X7197-2’ (L35), ‘5610S-1’ (L36), ‘SH-3217’ (L39), ‘SH-3361’ (L40), ‘FHIA 3’ (L53), and ‘FHIA 25’ (L54). Resistances are not detected in other known Foc resistant M. acuminata ssp. such as M. acuminata ssp. burmannica ‘Calcutta 4’ accessions (L11, 13) or cultivated diploid AA varieties such as ‘Pisang Jari Buaya’ (L14), and ‘cv. Rose’ (L44). A 1kb DNA ladder from NEB was used as a reference to the size of the amplicons.
Preprints 72761 g006
Table 1. CAPS marker information. The numeric identifier in primer names corresponds to the gene models of ‘DH Pahang’ assembly v1 without the prefix ‘GSMUA_Achr3G’. T is the annealing temperature used in the PCR. Frag or fragment is the PCR amplicon size in base pairs (bp). In the ‘Cut sizes’ column, lengths of the digested products are shown for the R and S marker alleles. Superscript ‘m’ indicates a monomorphic SNP cutting site. The SNP position (R to S nucleotide change) is calculated from the predicted translation start site AUG or ‘ATG’ in the genomic sequence of ‘DH-Pahang’ v4 gene models (SNPATG).
Primer name Primer sequence (5' to 3') T (°C) Frag (bp) Cut by Cut sizes (bp) SNPATG
27960-SNP1-F1 GACCAGCAGCAGAAGGACCAGACC 58 764 BsaI R:764 Exon1
27960-SNP1-R1 AGAATGAGTGGTATGGGAT S:394,370 T1152C
28220-SNP8-F1 CCTGATTGTAAATGGGAAGTTTCTC 56 546 MnlI R:292,223,31m Intron2
28220-SNP8-R1 ATCGCCCAGCAGTGATTTGA S:515,31m G3100A
28420-SNP1-F1 CAAATATGCTGCTCCATCTG 54 740 NsiI R:740 Intron4
28420-SNP1-R1 CTTGGAAGAAACTAACGAGTGT S:403,337 A2547G
28820-SNP8-F2 CAGGTAACCATTTAGACTGACAA 55 544 BstZ17I R:544 Exon3
28820-SNP8-R1 AATCAAGGAAATAGGGTGGCAC S:300,244 C3274T
29460-SNP21-F2 GGATACTTGGACCCTGAGTACCAT 58 344 XhoI R:313,31m Exon4
29460-SNP21-R1 CCATCGCTCTCTATTGCTTGC S:178,135,31m T6353C
29590-SNP1-F1 GCTCAGATGTCTCAGTCCAGA 55 457 BstNI R:457 Exon1
29590-SNP1-R1 CTTCTTCCATCCTCTTCTCC S:317,140 A137G
29670-SNP8-F1 AAGAGATGTCATGTTGGTTCATTTG 56 628 BspCNI R:628 Intron5
29670-SNP8-R1 CACTCACTCCTGCTATGCGGTTG S:345,283 G5078C
29730-SNP1-F1 ATGGCACAGGTGATGTCAGT 58 686 BcoDI R:686 Intron1
29730-SNP1-R1 ACTAGATGACTCAGATTAGTAGG S:359,327 T544C
29730-A-SNP1-F2 GCAATGAGTACCTCTAAGCA 56 795 BcoDI R:795 Intron1
29730-A-SNP1-R2 TAAGTTCTAGTATCAAGTACAA S:429,366 T544C
29850-SNP13-F2 CTTGTTCCTGTTACCTATTAG 56 363 StyI R:363 Intron5
29850-SNP13-R1 CCTTGTGCCTAGATGCTTGG S:192,171 A4287G
29930-SNP1-F2 GTTCACACCCTTGACATCCTA 54 493 MseI R:190,64,99m,49m,36m,30m,25m Intron4
29930-SNP1-R1 TAAGCATTCATTAGCAAACGG S:254,99m,49m,36m,30m,25m A3401G
30000-SNP2-F2 CTTAAAACTTGGCGGAAGG 56 468 NsiI R:251,217 Exon14
30000-SNP2-R2 CTGAAGCACAACTGTCCTTG S:468 A6749G
Table 2. The ‘DH-Pahang’ reference genome v1 and v4 gene models for the CAPS markers developed in this study. The prefix of the v1 and v4 gene models are shown in brackets. The coordinates of the gene models defined on chromosome 3 of the ‘DH-Pahang’ v4 are shown in base pair (bp) ‘https://banana-genome-hub.southgreen.fr/’ (accessed on 23 February 2023). A plus (+) or minus (-) symbol, respectively, indicates the positive and negative DNA strand designation in the reference genome with respect to the transcriptional start of the gene models.
‘DH-Pahang’ v1(GSMUA_Achr3G) ‘DH-Pahang’ v4(Macma4_03_g) ‘DH-Pahang’ v4 Position (bp) Description
27960 30750 40,893,205–40,895,172 (-) MHD domain-containing protein
28220 31030 41,068,780–41,075,115 (-) Uncharacterized membrane protein At1g16860-like
28420 31200 41,183,294–41,197,461 (-) F-box domain-containing protein
28820 31680 41,695,490–41,699,989 (+) Bifunctional nuclease 2
29460 32270 42,052,018–42,058,909 (+) Leaf rust 10 disease-resistance locus receptor-like protein kinase-like 1.3
29590 32440 42,138,268–42,142,592 (-) Pentatricopeptide repeat-containing protein At4g28010
29670 32510 42,186,029–42,193,520 (-) Cycloartenol-C-24-methyltransferase 1
29730 32560 42,210,035–42,215,274 (-) Nuclear transcription factor Y subunit A-1
29850 32690 42,283,482–42,289,346 (+) WRKY transcription factor SUSIBA2
29930 32770 42,323,762–42,327,884 (-) Hypothetical protein
30000 32830 42,349,497–42,357,604 (-) Long chain base biosynthesis protein 2d
Table 3. Validation of marker 29730 for Marker assisted selection. Collection of diploids, improved diploids, cultivated diploids, and synthetic polyploids screened for the A-genome specific marker 29730 (GSMUA_Achr3G29730) linked to both Foc-STR4 and Foc-TR4 resistance on chromosome 3 of M. acuminata ssp. malaccensis (Figure 6). The subspecies of M. acuminata or genome group is indicated in brackets next to the names. Het = heterozygous for the marker locus. Samples that form part of a collection are annotated as the following; a Diploid and cultivated varieties, and d polyploid varieties from the Maroochy Research Facility, Department of Agriculture and Fisheries, Nambour, Queensland, Australian; b M. acuminata ssp. malaccensis accessions that form part of the core Musa collection used in a diversity study [59]; c Improved diploids and a selected number of breeding lines from IITA, Uganda. Musa balbisiana (BB genome) served as a negative control for A-genome specific amplification of 29730. In the Foc-STR4 and Foc-TR4 columns, resistances were generally defined as R = resistant, SS = slightly susceptible, S = susceptible. n/a = data not available. Phenotypic data was referenced from multiple studies performed as either pot or field trials. ITC numbers are indicated on accessions where available, while other numbers correspond to accessions in their respective germplasm collections (MMC—NARO, Uganda; MRF—Maroochy Research Facility, QLD, AUS; MUSA—INIVIT, Cuba).
Line Name (Subspecies/genome) Accession 29730 marker locus Foc-STR4 Foc-TR4
1a 'Ma850' (malaccensis) MRF850 + (Het) R [33] R [33,58]
2a 'Ma851' (malaccensis) MRF851 + (Het) R [33] R [58]
3a 'Ma852' (malaccensis) MRF852 + (Het) R [33] R [58]
4a 'Ma845' (malaccensis) MRF845 - n/a n/a
5a 'Ma846' (malaccensis) MRF846 - S [33] n/a
6a 'Ma848' (malaccensis) MRF848 - S [33] S [33,58]
7a 'Pahang' (malaccensis) MRF1649 + R [33] R [33,45]
8a 'SH-3362' (AA) MRF2010 + (Het) R [33] R [33,43]
9a 'SH-3362' (AA) MRF2013 + (Het) R [33] R [33,43]
10a ‘Madang Guadeloupe’(malaccensis) MRF655 + R [33] R [33]
11a 'Calcutta 4' (burmannica) MRF1642 - R [33] R [33,45]
12a 'SH-3217' (AA) MRF2005 + R [33] R [33,43]
13a 'IV9 Calcutta4' (AA) MRF526 - R [33] R [33]
14a 'Pisang Jari Buaya' (AA) MRF1244 - R [33] R [33,45]
15a 'Ma-ITC0250' (malaccensis) MRF826 + (Het) R [33] R [33]
16a 'M61 Guadeloupe' (AA) MRF654 - SS [33] R [33]
17a 'CAM-020' (AA) MRF1657 - S [33] R [33]
18a 'SH-3142' (AA) MRF1984 - R [33] R [33,43]
19a M. a. malaccensis ITC0399 + (Het) n/a n/a
20a 'Pahang' (malaccensis) ITC0609 + R [33] R [33,40,45,60]
21b 'Pa Musore no2' (M. acuminata spp.) ITC0668 + (Het) n/a n/a
22b 'Kluai Pal' (malaccensis) ITC0979 + (Het) n/a n/a
23b 'DH Pahang' (malaccensis) ITC1511 + n/a R [45,46]
24b M a. malaccensis ITC0074 - n/a n/a
25b 'Pa Musore no3' (M. acuminata spp.) ITC0406 - n/a n/a
26b 'Pa_Songkhla' (M. acuminata spp.) ITC0408 - n/a n/a
27b 'Selangor 2' (malaccensis) ITC0629 - n/a n/a
28b 'Pisang Raja Udang' (AA) ITC0976 - n/a n/a
29b 'THA018' (malaccensis) ITC1067 - n/a n/a
30b 'Pisang Kra' (malaccensis) ITC1345 - n/a n/a
31b 'Pisang Serun 403' (malaccensis) ITC1347 - n/a n/a
32b 'Pisang Serun 404' (malaccensis) ITC1348 - n/a n/a
33b 'Pisang Serun 400' (malaccensis) ITC1349 - n/a n/a
34b 'IB-99' ITC1447 - n/a n/a
35c 'TMB2×7197-2' (AA) - + (Het) n/a n/a
36c '5610S-1' (AA) - + (Het) n/a n/a
37c 'SH-3362' (AA) MUSA214 + (Het) R [33] R [33]
38c 'Malaccensis 250' (malaccensis) ITC0250 + (Het) R [33] n/a
39c 'SH-3217' (AA) MMC218 + R [33] R [43]
40c 'SH-3361' (AA) - + (Het) n/a n/a
41c 'TMB2×8075-7' (AA) - - n/a n/a
42c 'Hutishamba' (AA) MMC486 - n/a n/a
43c 'Mshare Laini' (AA) - - n/a n/a
44c 'cv. Rose' (AA) ITC0712 - n/a R [40,41]
45c 'Mularu' (AA) MMC465 - n/a n/a
46c 'Kamunyila' (AA) MMC479 - n/a n/a
47c 'Mlelembo' (AA) ITC1544 - n/a n/a
48c 'Njuru' (AA) MMC418 - n/a n/a
49c 'Kahuti' (AA) ITC1468 - n/a n/a
50c 'Mbwazirume' (AAA) ITC0084 - n/a R [45]
51c 'Sukari Ndiizi' (AAB) MMC167 - n/a n/a
52c 'Nshonowa' (AA) ITC1466 - n/a n/a
53d 'FHIA-3' (AABB) MRF1941 + (Het) S [33,61] SS [33] S [41] R [43]
54d 'FHIA-25' (AAB) MRF1960 + R [33] R [33,43,45]
55d 'FHIA-21' (AAAB) MRF1205 - n/a S [41],R [45]
56d 'FHIA-23' (AAAA) MRF1207 - S [33] SS [33], S [41]
57d 'GCTCV-119' (AAA) MRF1860 - R [33] R [33,41]
58d 'FHIA-2' (AAAB) MRF1933 - S [33,61] R [33,43] S [41]
59d 'FHIA-1'/'Goldfinger' (AAAB) MRF1959 - R [33] R [33,43] S [62]
60d Musa balbisiana (BB) MRF1593 - S [33] S [62]
Disclaimer/Publisher’s Note: The statements, opinions and data contained in all publications are solely those of the individual author(s) and contributor(s) and not of MDPI and/or the editor(s). MDPI and/or the editor(s) disclaim responsibility for any injury to people or property resulting from any ideas, methods, instructions or products referred to in the content.
Copyright: This open access article is published under a Creative Commons CC BY 4.0 license, which permit the free download, distribution, and reuse, provided that the author and preprint are cited in any reuse.
Prerpints.org logo

Preprints.org is a free preprint server supported by MDPI in Basel, Switzerland.

Subscribe

© 2024 MDPI (Basel, Switzerland) unless otherwise stated