Submitted:
05 May 2023
Posted:
05 May 2023
You are already at the latest version
Abstract
Keywords:
1. Introduction
2. Materials and Methods
3. Results and discussion
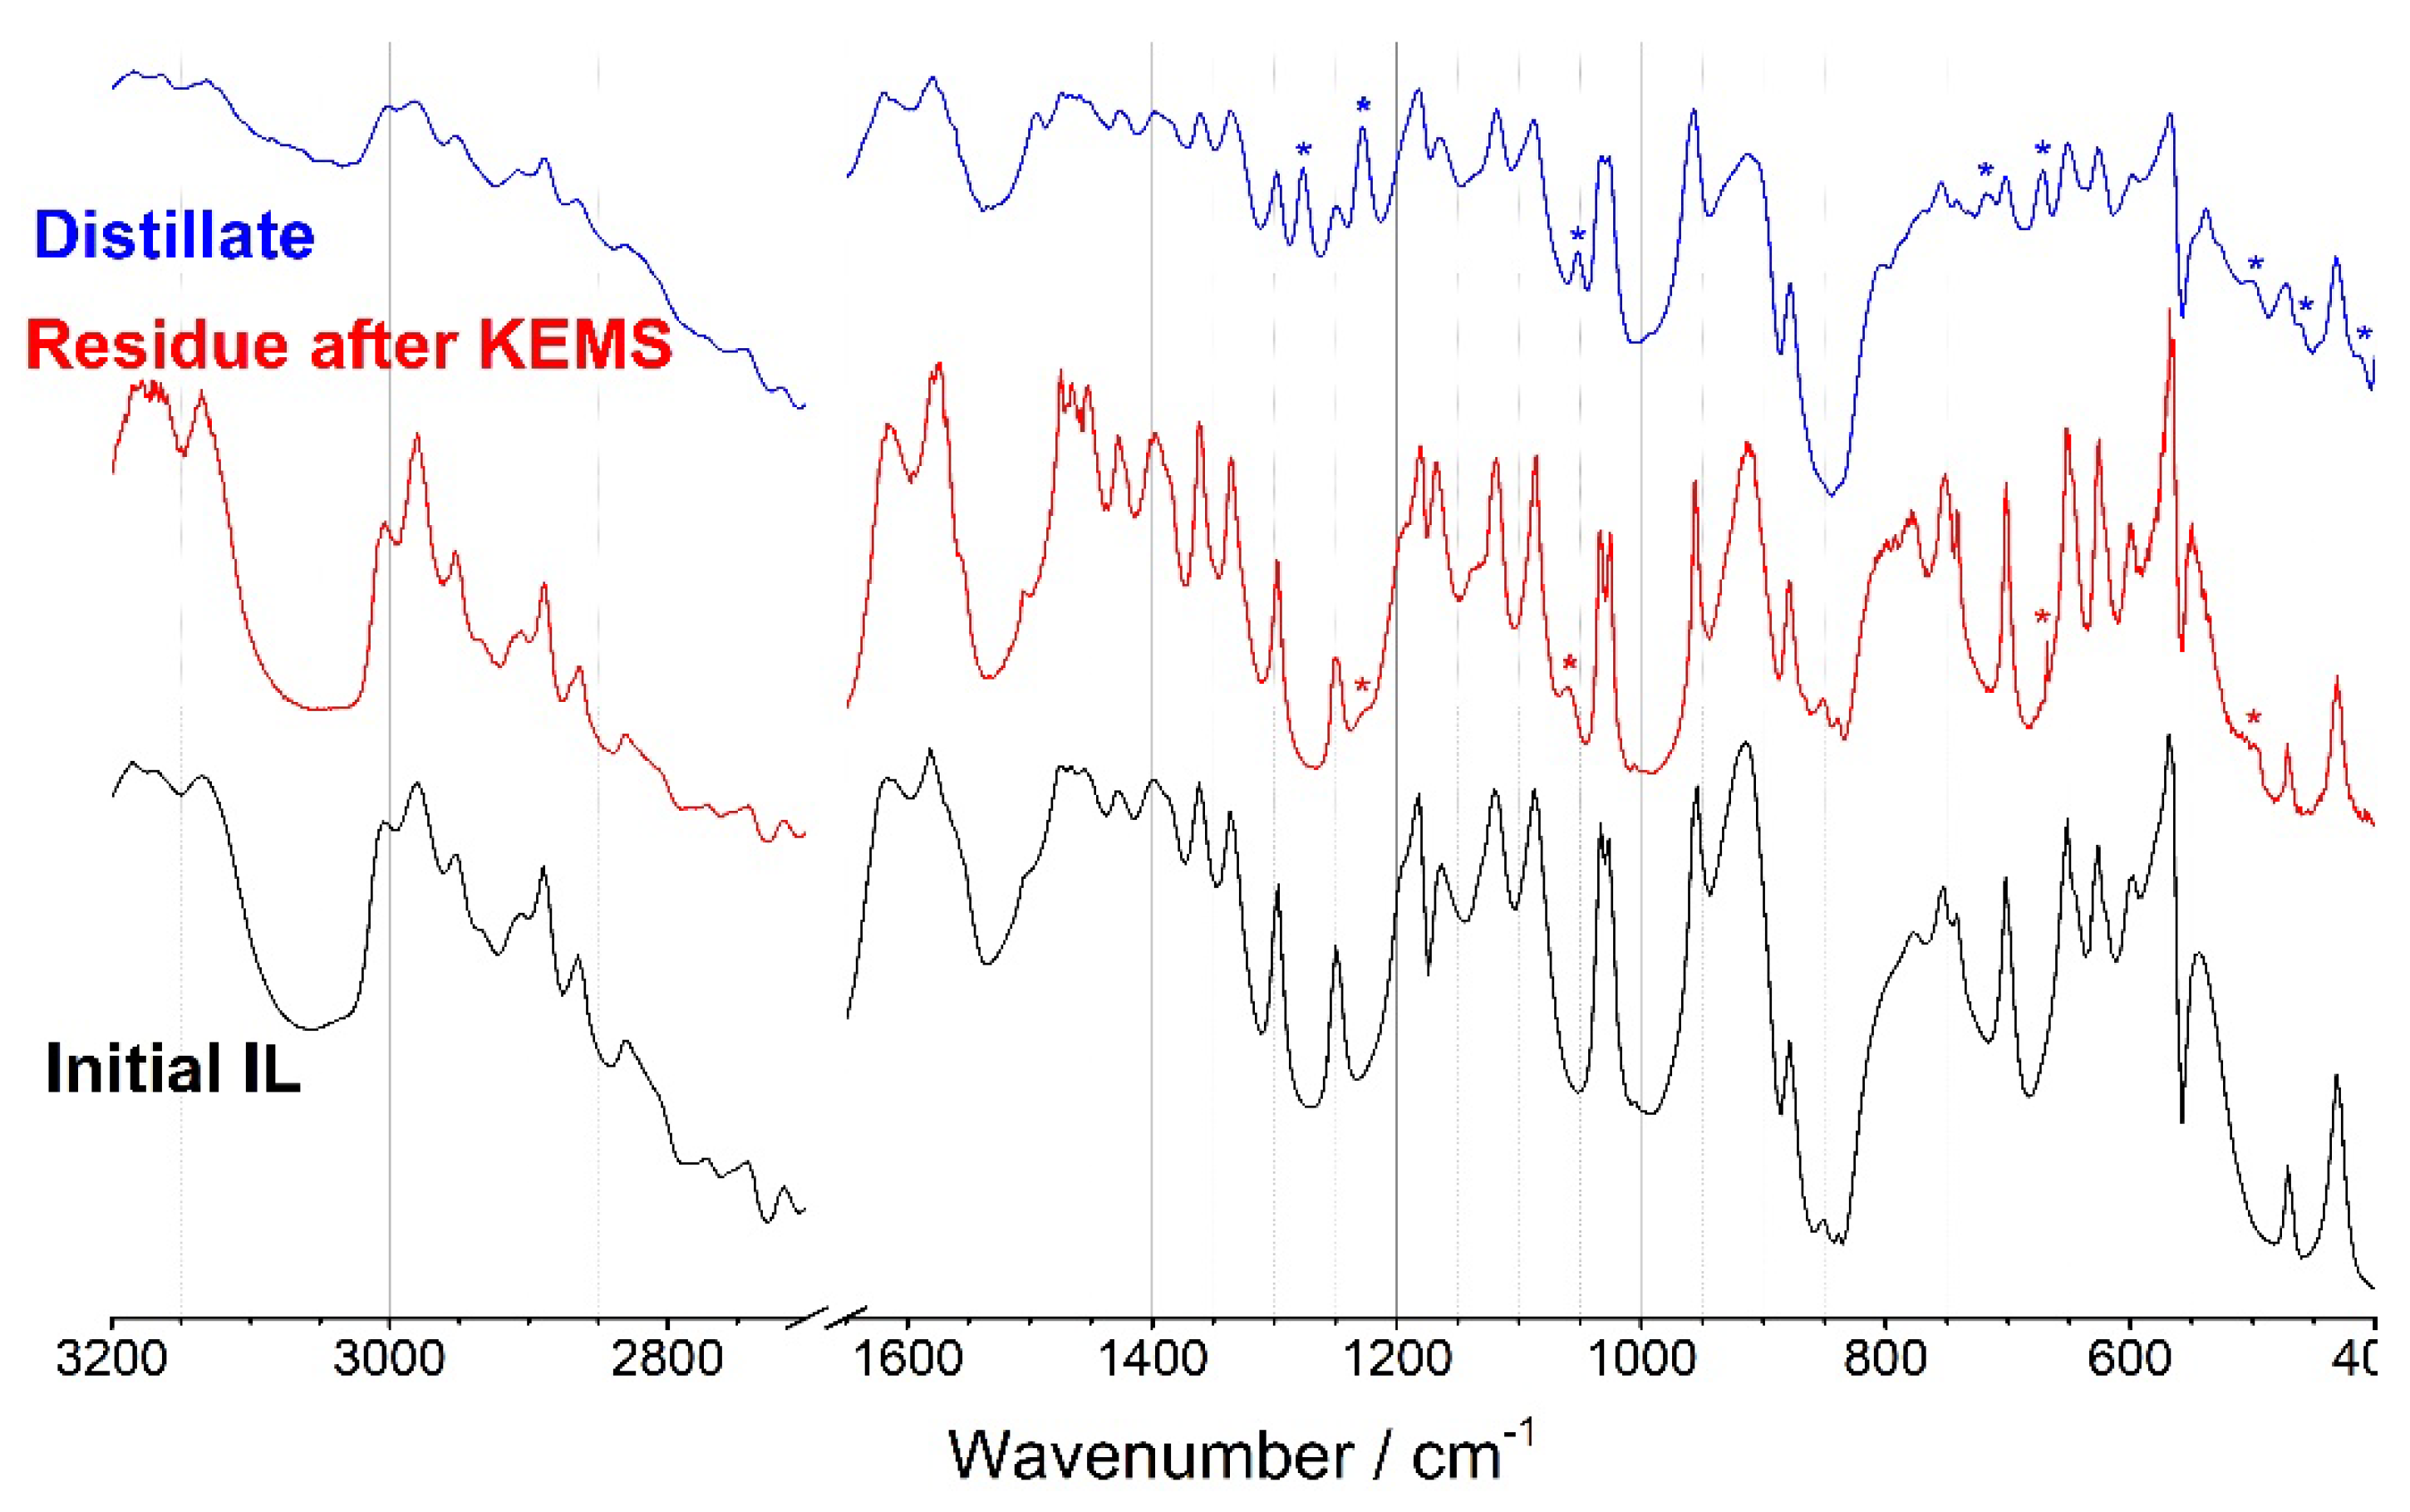
3.1. IR spectroscopy
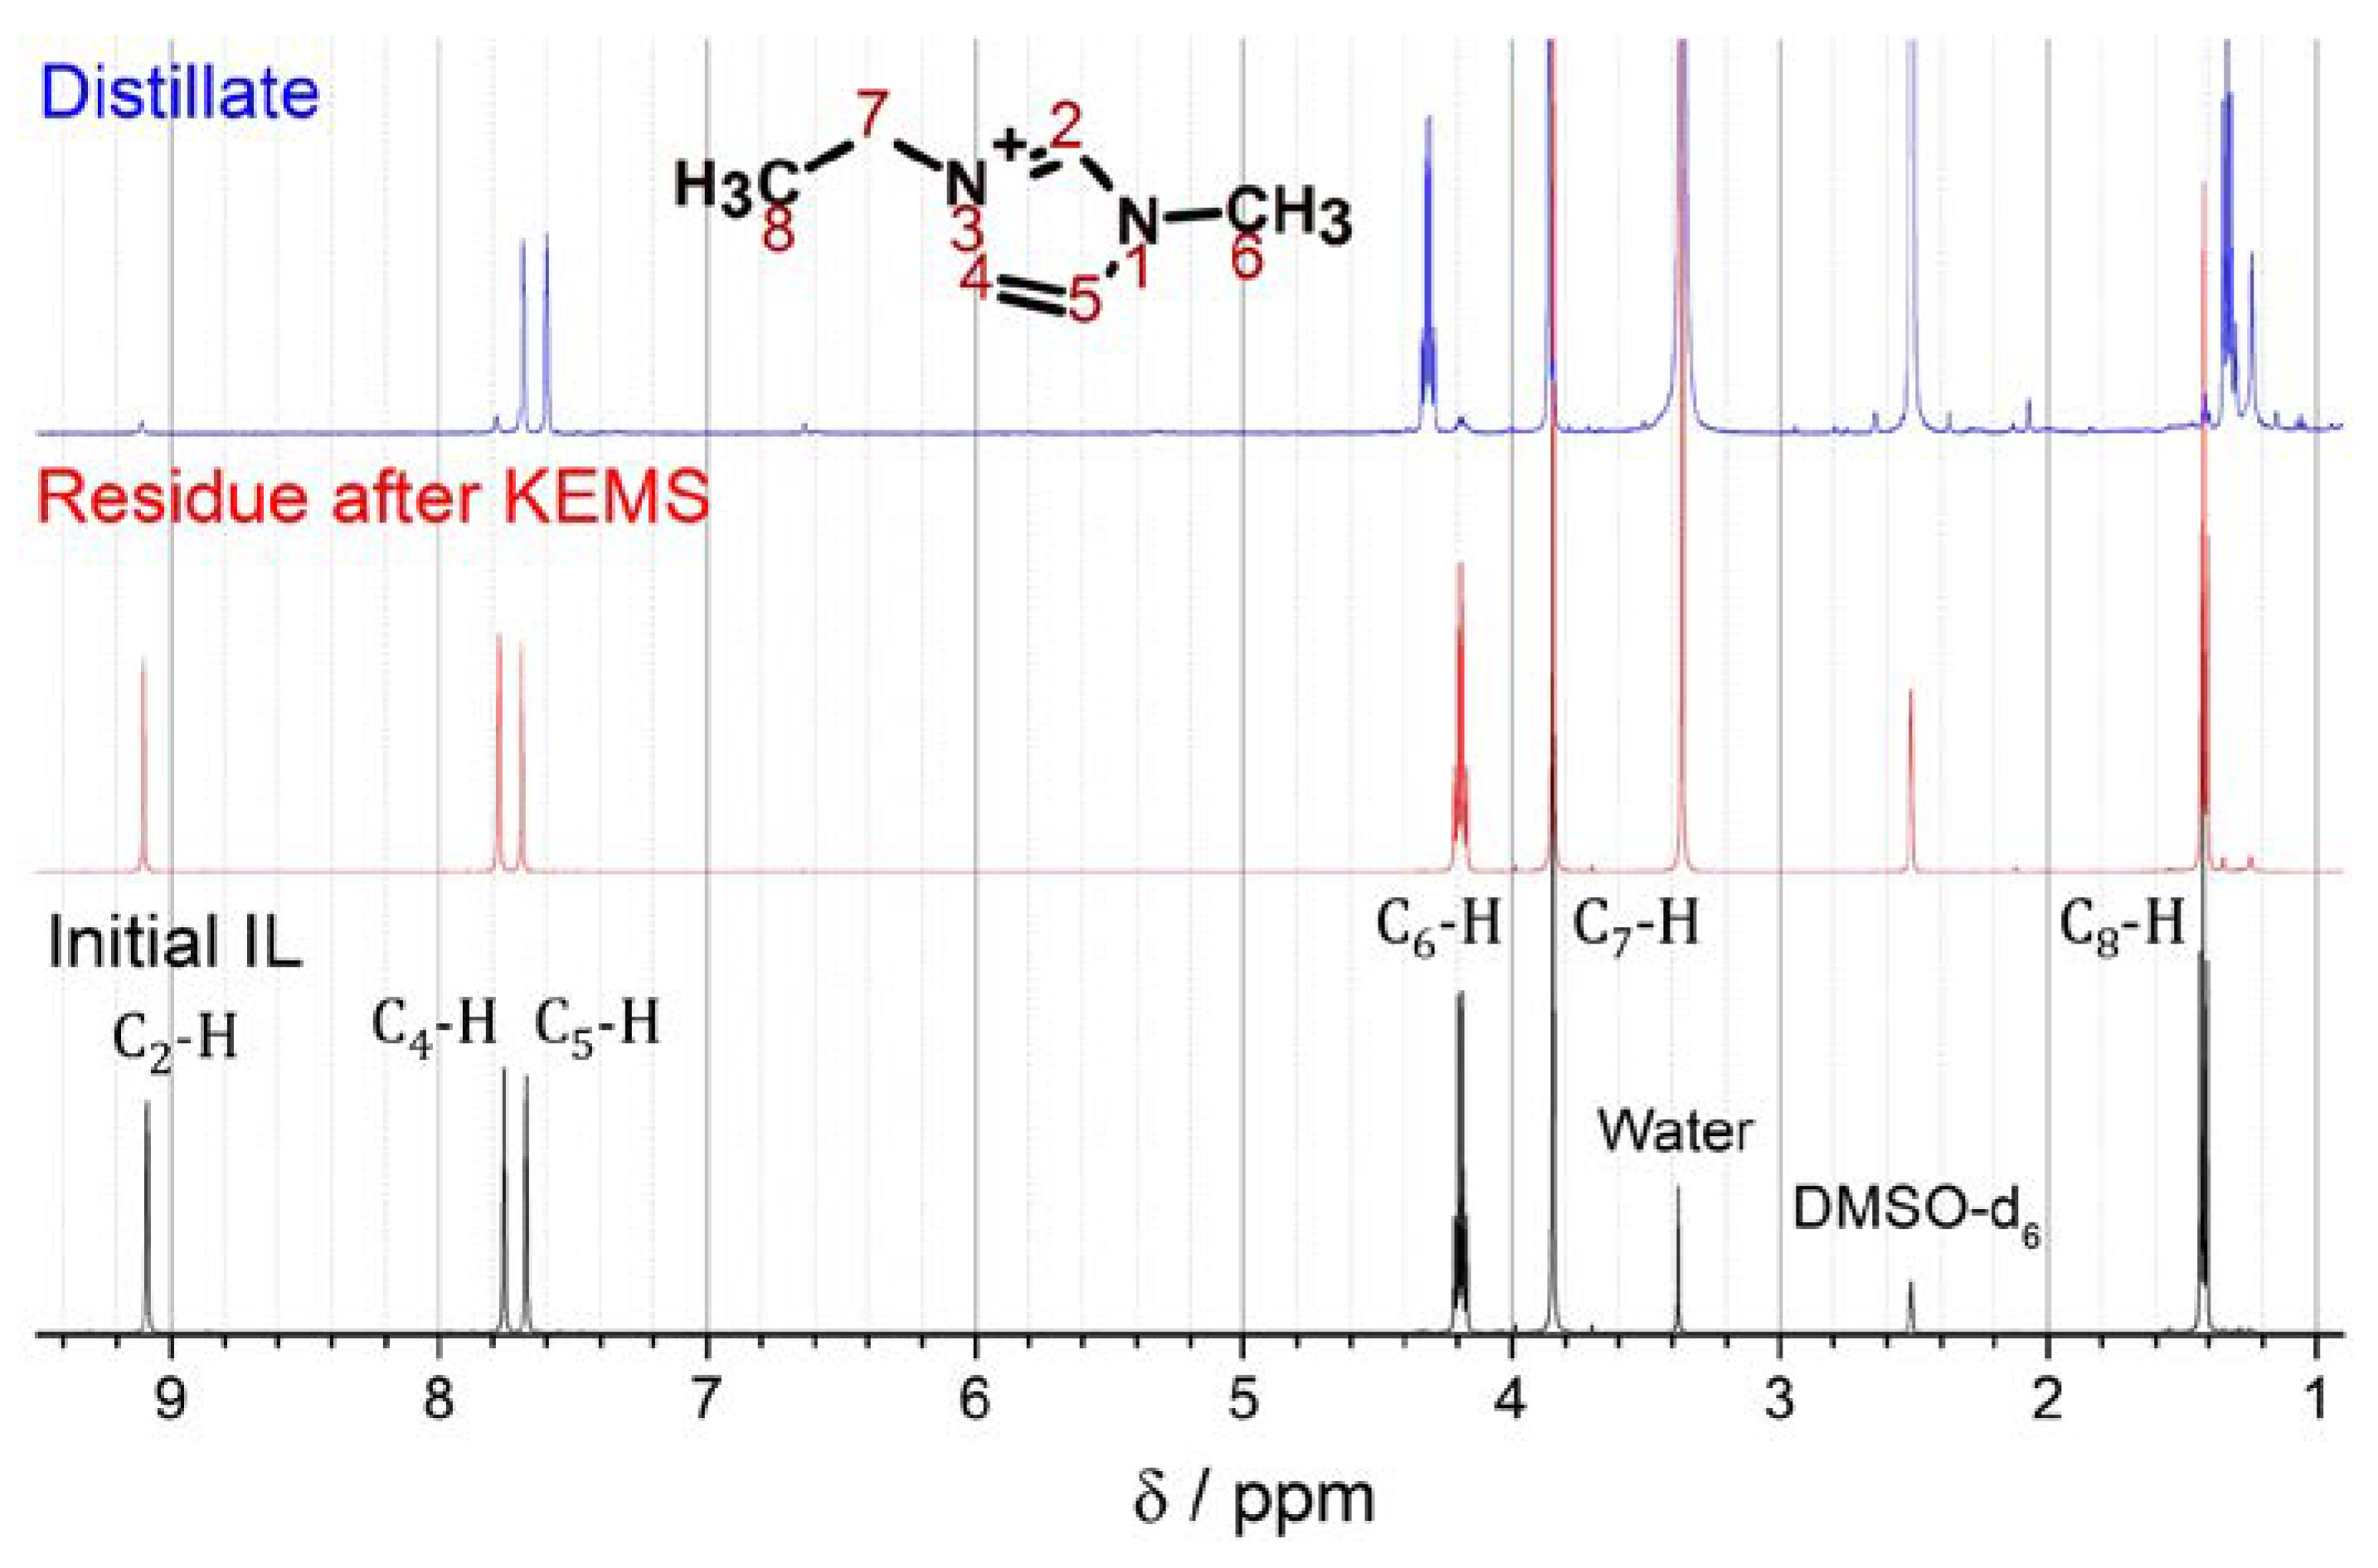
3.2. NMR-analysis
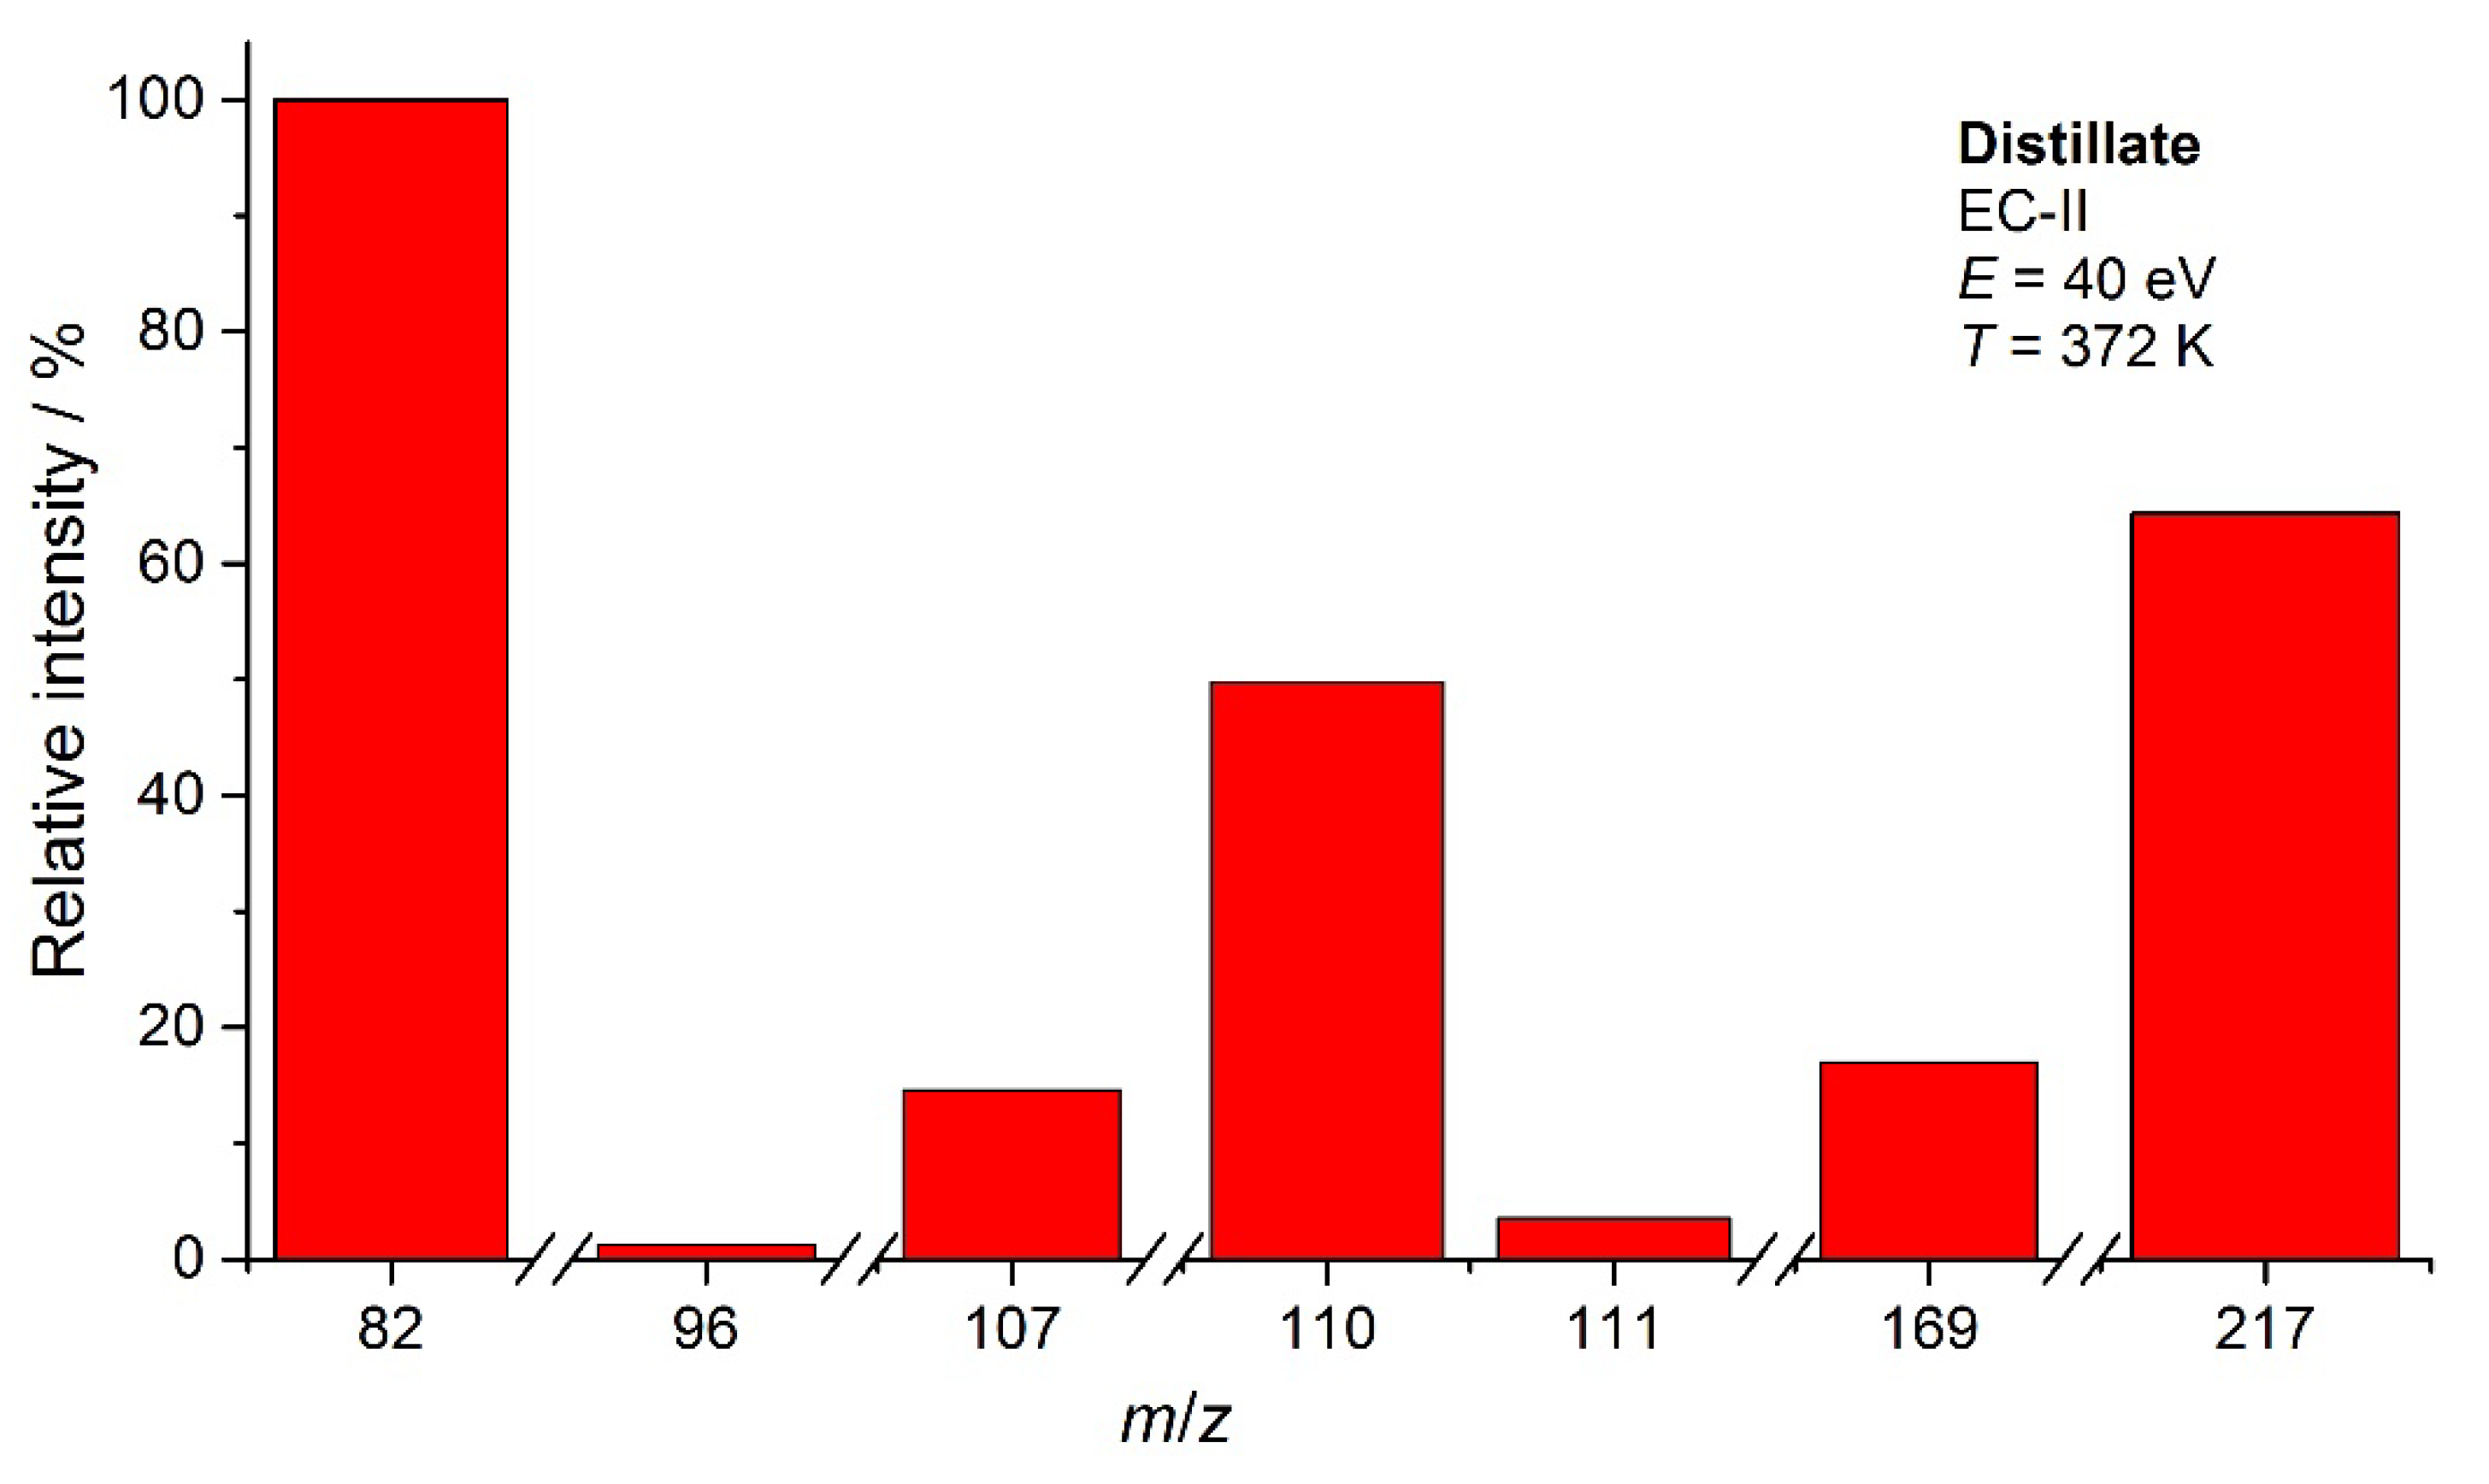
3.3. KEMS

5. Conclusions
Supplementary Materials
Author Contributions
Funding
Data Availability Statement
Acknowledgments
Conflicts of Interest
References
- Taylor, A.W.; Lovelock, K.R.J.; Jones, R.G.; Licence, P. Borane-substituted imidazol-2-ylidenes: syntheses in vacuo. Dalton Trans. 2011, 40, 1463–1470. [Google Scholar] [CrossRef] [PubMed]
- Dunaev, A.M.; Motalov, V.B.; Kudin, L.S. The Composition of Saturated Vapor Over 1-Butyl-3-Methylimidazolium Tetrafluoroborate Ionic Liquid: A Multi-Technique Study of the Vaporization Process. Entropy 2021, 23, 1478. [Google Scholar] [CrossRef] [PubMed]
- Dunaev, A.M.; Motalov, V.B.; Kudin, L.S.; Zhabanov, Yu.A.; Aleksandriiskii, V.V.; Govorov, D.N. Evaporation Thermodynamics of 1-Butyl-3-methylimidazolium Tetrafluoroborate Ionic Liquid. J. Mol. Liq. 2023, 380, 121626. [Google Scholar] [CrossRef]
- Clarke, C.J.; Puttick, S.; Sanderson, T.J.; Taylor, A.W.; Bourne, R.A.; Lovelock, K.R.J.; Licence, P. Thermal stability of dialkylimidazolium tetrafluoroborate and hexafluorophosphate ionic liquids: ex situ bulk heating to complement in situ mass spectrometry. Phys. Chem. Chem. Phys. 2018, 20, 16786–16800. [Google Scholar] [CrossRef] [PubMed]
- Chambreau, S.D.; Schenk, A.C.; Sheppard, A.J.; Yandek, G.R.; Vaghjiani, G.L.; Maciejewski, J.; Koh, C.J.; Golan, A.; Leone, S.R. Thermal Decomposition Mechanisms of Alkylimidazolium Ionic Liquids with Cyano-Functionalized Anions. J. Phys. Chem. A. 2014, 118, 11119–11132. [Google Scholar] [CrossRef]
- Volpe, V.; Brunetti, B.; Gigli, G.; Lapi, A.; Vecchio Ciprioti, S.; Ciccioli, A. Toward the Elucidation of the Competing Role of Evaporation and Thermal Decomposition in Ionic Liquids: A Multitechnique Study of the Vaporization Behavior of 1-Butyl-3-methylimidazolium Hexafluorophosphate under Effusion Conditions. J. Phys. Chem. B. 2017, 121, 10382–10393. [Google Scholar] [CrossRef]
- Zaitsau, D.H.; Yermalayeu, A.V.; Emel’yanenko, V.N.; Butler, S.; Schubert, T.; and Verevkin, S.P. Thermodynamics of Imidazolium-Based Ionic Liquids Containing PF6 Anions J. Phys. Chem. B. 2016, 120, 7949–7957. [Google Scholar] [CrossRef]
- Vila, J.; Fernandez-Castro, B.; Rilo, E.; Carrete, J.; Dominguez-Perez, M.; Rodriguez, J. R.; Garcia, M.; Varela, L. M.; Cabeza, O. Liquid-solid-liquid phase transition hysteresis loops in the ionic conductivity of ten imidazolium-based ionic liquids. Fluid Phase Equilib 2012, 320, 1–10. [Google Scholar] [CrossRef]
- Dunaev, A.M; Kryuchkov, A.S.; Kudin, L.S.; Butman, M.F. Automatic complex for high temperature investigation on basis of mass spectrometer MI1201. Izv. Vyssh. Uchebn. Zaved. Khim. Khim. Tekhnol 2011, 54, 73–77. (in Russian). [Google Scholar]
- Sergeev, D.N.; Dunaev, A.M.; Ivanov, D.A.; Golovkina, Y.A.; Gusev, G.I. Automatization of mass spectrometer for the obtaining of ionization efficiency functions. Pribory i Tekhnika Eksperimenta 2014, 1, 139–140. (in Russian). [Google Scholar] [CrossRef]
- Dunaev, A.M.; Motalov, V.B.; Kudin, L.S. A high-temperature mass-spectrometric method for determination of the electron work function of ionic crystals: Lanthanum, cerium, and praseodymium triiodides. Russ. J. Gen. Chem. 2017, 87, 632–638. [Google Scholar] [CrossRef]
- Gaussian 16, Revision C.01, Frisch, M. J.; Trucks, G. W.; Schlegel, H. B.; Scuseria, G. E.; Robb, M. A.; Cheeseman, J. R.; Scalmani, G.; Barone, V.; Petersson, G. A.; Nakatsuji, H.; Li, X.; Caricato, M.; Marenich, A. V.; Bloino, J.; Janesko, B. G.; Gomperts, R.; Mennucci, B.; Hratchian, H. P.; Ortiz, J. V.; Izmaylov, A. F.; Sonnenberg, J. L.; Williams-Young, D.; Ding, F.; Lipparini, F.; Egidi, F.; Goings, J.; Peng, B.; Petrone, A.; Henderson, T.; Ranasinghe, D.; Zakrzewski, V. G.; Gao, J.; Rega, N.; Zheng, G.; Liang, W.; Hada, M.; Ehara, M.; Toyota, K.; Fukuda, R.; Hasegawa, J.; Ishida, M.; Nakajima, T.; Honda, Y.; Kitao, O.; Nakai, H.; Vreven, T.; Throssell, K.; Montgomery, J. A., Jr.; Peralta, J. E.; Ogliaro, F.; Bearpark, M. J.; Heyd, J. J.; Brothers, E. N.; Kudin, K. N.; Staroverov, V. N.; Keith, T. A.; Kobayashi, R.; Normand, J.; Raghavachari, K.; Rendell, A. P.; Burant, J. C.; Iyengar, S. S.; Tomasi, J.; Cossi, M.; Millam, J. M.; Klene, M.; Adamo, C.; Cammi, R.; Ochterski, J. W.; Martin, R. L.; Morokuma, K.; Farkas, O.; Foresman, J. B.; Fox, D. J. Gaussian, Inc., Wallingford CT, 2016.
- Curtiss, L. A.; Redfern, P. C.; and Raghavachari, K. Gaussian-4 theory. J. Chem. Phys. 2007, 126, 084108. [Google Scholar] [CrossRef]
- Govorov, D. N.; Dunaev, A. M.; Motalov, V. B.; Kudin, L. S. Quantum chemical calculations of formation enthalpies of cations and anions of ionic liquids J. Mol. Liq. 2022, 364, 119996. [Google Scholar] [CrossRef]
- Dunaev, A.M.; Kudin, L.S. Statthermo® – new software for calculation of thermodynamic functions Izv. Vyssh. Uchebn. Zaved. Khim. Khim. Tekhnol. 2017, 60, 40–46. [Google Scholar] [CrossRef]
- Chao, J.; Hall, K.R.; Marsh, K.N.; Wilhoit, R.C. Thermodynamic properties of key organic oxygen compounds in the carbon range C1 to C4. Part 2. Ideal gas properties J. Phys. Chem. Ref. Data. 1986, 15, 1369–1436. [Google Scholar] [CrossRef]
- Katsyuba, S.A.; Zvereva, E.E.; Vidiš, A.; Dyson, P.J. Application of Density Functional Theory and Vibrational Spectroscopy Toward the Rational Design of Ionic Liquids J. Phys. Chem. A. 2007, 111, 352–370. [Google Scholar] [CrossRef]
- Deyko, A.; Lovelock, K.R.J.; Licence, P.; Jones, R.G. The vapour of imidazolium-based ionic liquids: a mass spectrometry study. Phys. Chem. Chem. Phys. 2011, 13, 16841–16850. [Google Scholar] [CrossRef]
- Dunaev, A.M.; Motalov, V.B.; Govorov, D.N.; Kudin, L.S. Dimer neutral ion pairs and associative ions in saturated vapor of 1-ethyl-3-methylimidazolium trifluoromethanesulfonate ionic liquid Calphad 2019, 65, 127–131. [CrossRef]
- "Ion Energetics Data" by Sharon G. Lias, John E. Bartmess, Joel F. Liebman, John L. Holmes, Rhoda D. Levin, and W. Gary Mallardin NIST Chemistry WebBook, NIST Standard Reference Database Number 69, Eds. P.J. Linstrom and W.G. Mallard, National Institute of Standards and Technology, Gaithersburg MD, 20899. [CrossRef]
- Motalov, V.B.; Korobov, M.A.; Dunaev, A.M.; Dunaeva, V.V.; Kudin, L.S. Vapor pressure and thermodynamics of L-tryptophan sublimation Russ. J. Gen. Chem. 2021, 91, 1938–1945. [Google Scholar] [CrossRef]
- Serra, P. B. P. Thermal behaviour and heat capacity of ionic liquids: benzilimidazolium and alkylimidazolium derivatives M.Sc. Thesis, Universidade do Porto, 2013.
- Serra, P.B.P.; Ribeiro, F.M.S.; Rocha, M.A.A.; Fulem, M.; Růžička, K.; Coutinho, J.A.P.; Santos, L.M.N.B.F. Solid-liquid equilibrium and heat capacity trend in the alkylimidazolium PF6 series J. Mol. Liq. 2017, 248, 678–687. [Google Scholar] [CrossRef]
- Holbrey, J. D.; Reichert, W. M.; Reddy, R. G.; Rogers, R. D. Heat Capacities of Ionic Liquids and Their Applications as Thermal Fluids. In Ionic Liquids as Green Solvents. American Chemical Society: Washington D. C., 2003; Volume 856, Ch. 11, pp. 121-133. [CrossRef]
- Glasser, L.; Jenkins, H. D. B. Predictive thermodynamics for ionic solids and liquids Phys. Chem. Chem. Phys. 2016, 18, 21226. [Google Scholar] [CrossRef] [PubMed]
- Fuller, J.; Carlin, R.T.; De Long, H.C.; Haworth, D. Structure of 1-ethyl-3-methylimidazolium hexafluorophosphate: model for room temperature molten salts J. Chem. Soc., Chem. Commun. 1994, 3, 299–300. [Google Scholar] [CrossRef]
- Belov, G.V.; Iorish, V.S.; Yungman, V.S. IVTANTHERMO for Windows – database on thermodynamic properties and related software CALPHAD: Comput. Coupling Phase Diagrams Thermochem. 1999, 23, 173–180. [Google Scholar] [CrossRef]
- Lemmon, E. W.; McLinden, M. O.; Friend, D. G. NIST Chemistry WebBook, NIST Standard Reference Database, 2017. [CrossRef]
- Acree, W. Jr.; Chickos, J.S. Phase Transition Enthalpy Measurements of Organic and Organometallic Compounds. Sublimation, Vaporization and Fusion Enthalpies From 1880 to 2015. Part 1. C1 − C10 J. Phys. Chem. Ref. Data. 2016, 45, 033101. [CrossRef]
- Zaitsau, D.H.; Kabo, G.J.; Strechan, A.A.; Paulechka, Y.U.; Tschersich, A.; Verevkin, S. P.; and Heintz, A. Experimental Vapor Pressures of 1-Alkyl-3-methylimidazolium Bis(trifluoromethylsulfonyl)imides and a Correlation Scheme for Estimation of Vaporization Enthalpies of Ionic Liquids J. Phys. Chem. A. 2006, 110(22), 7303–7306. [Google Scholar] [CrossRef]


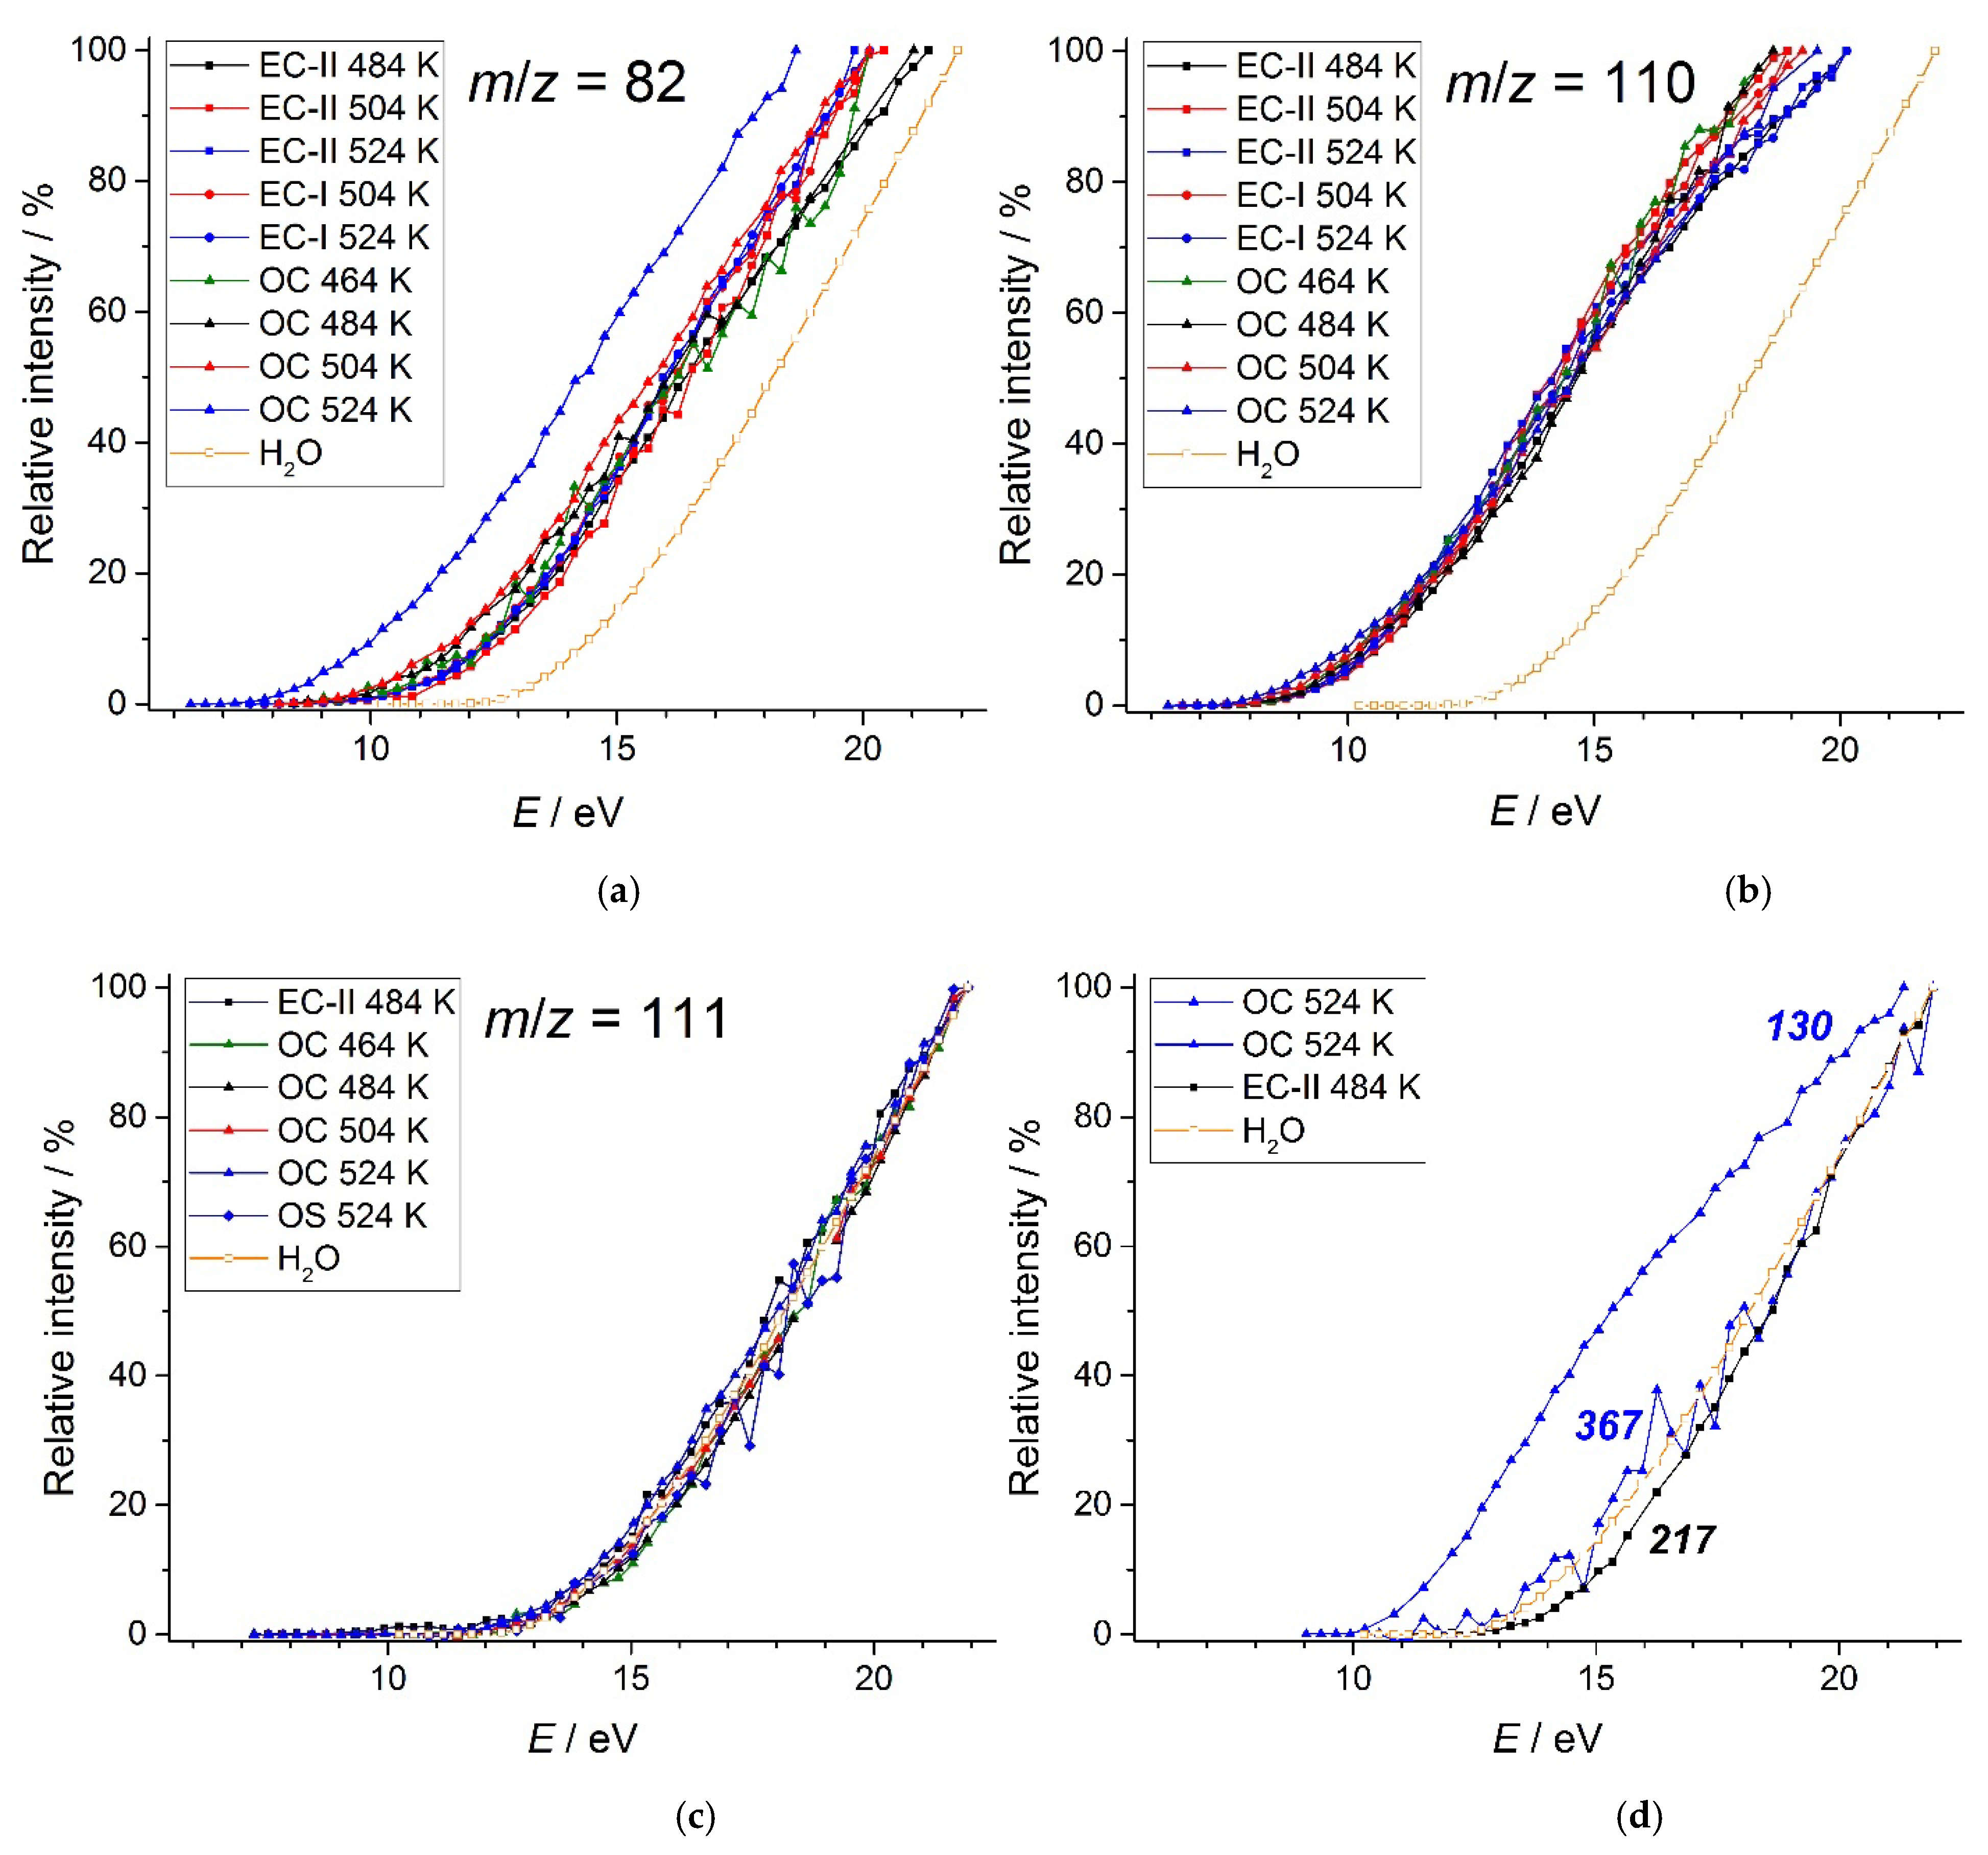
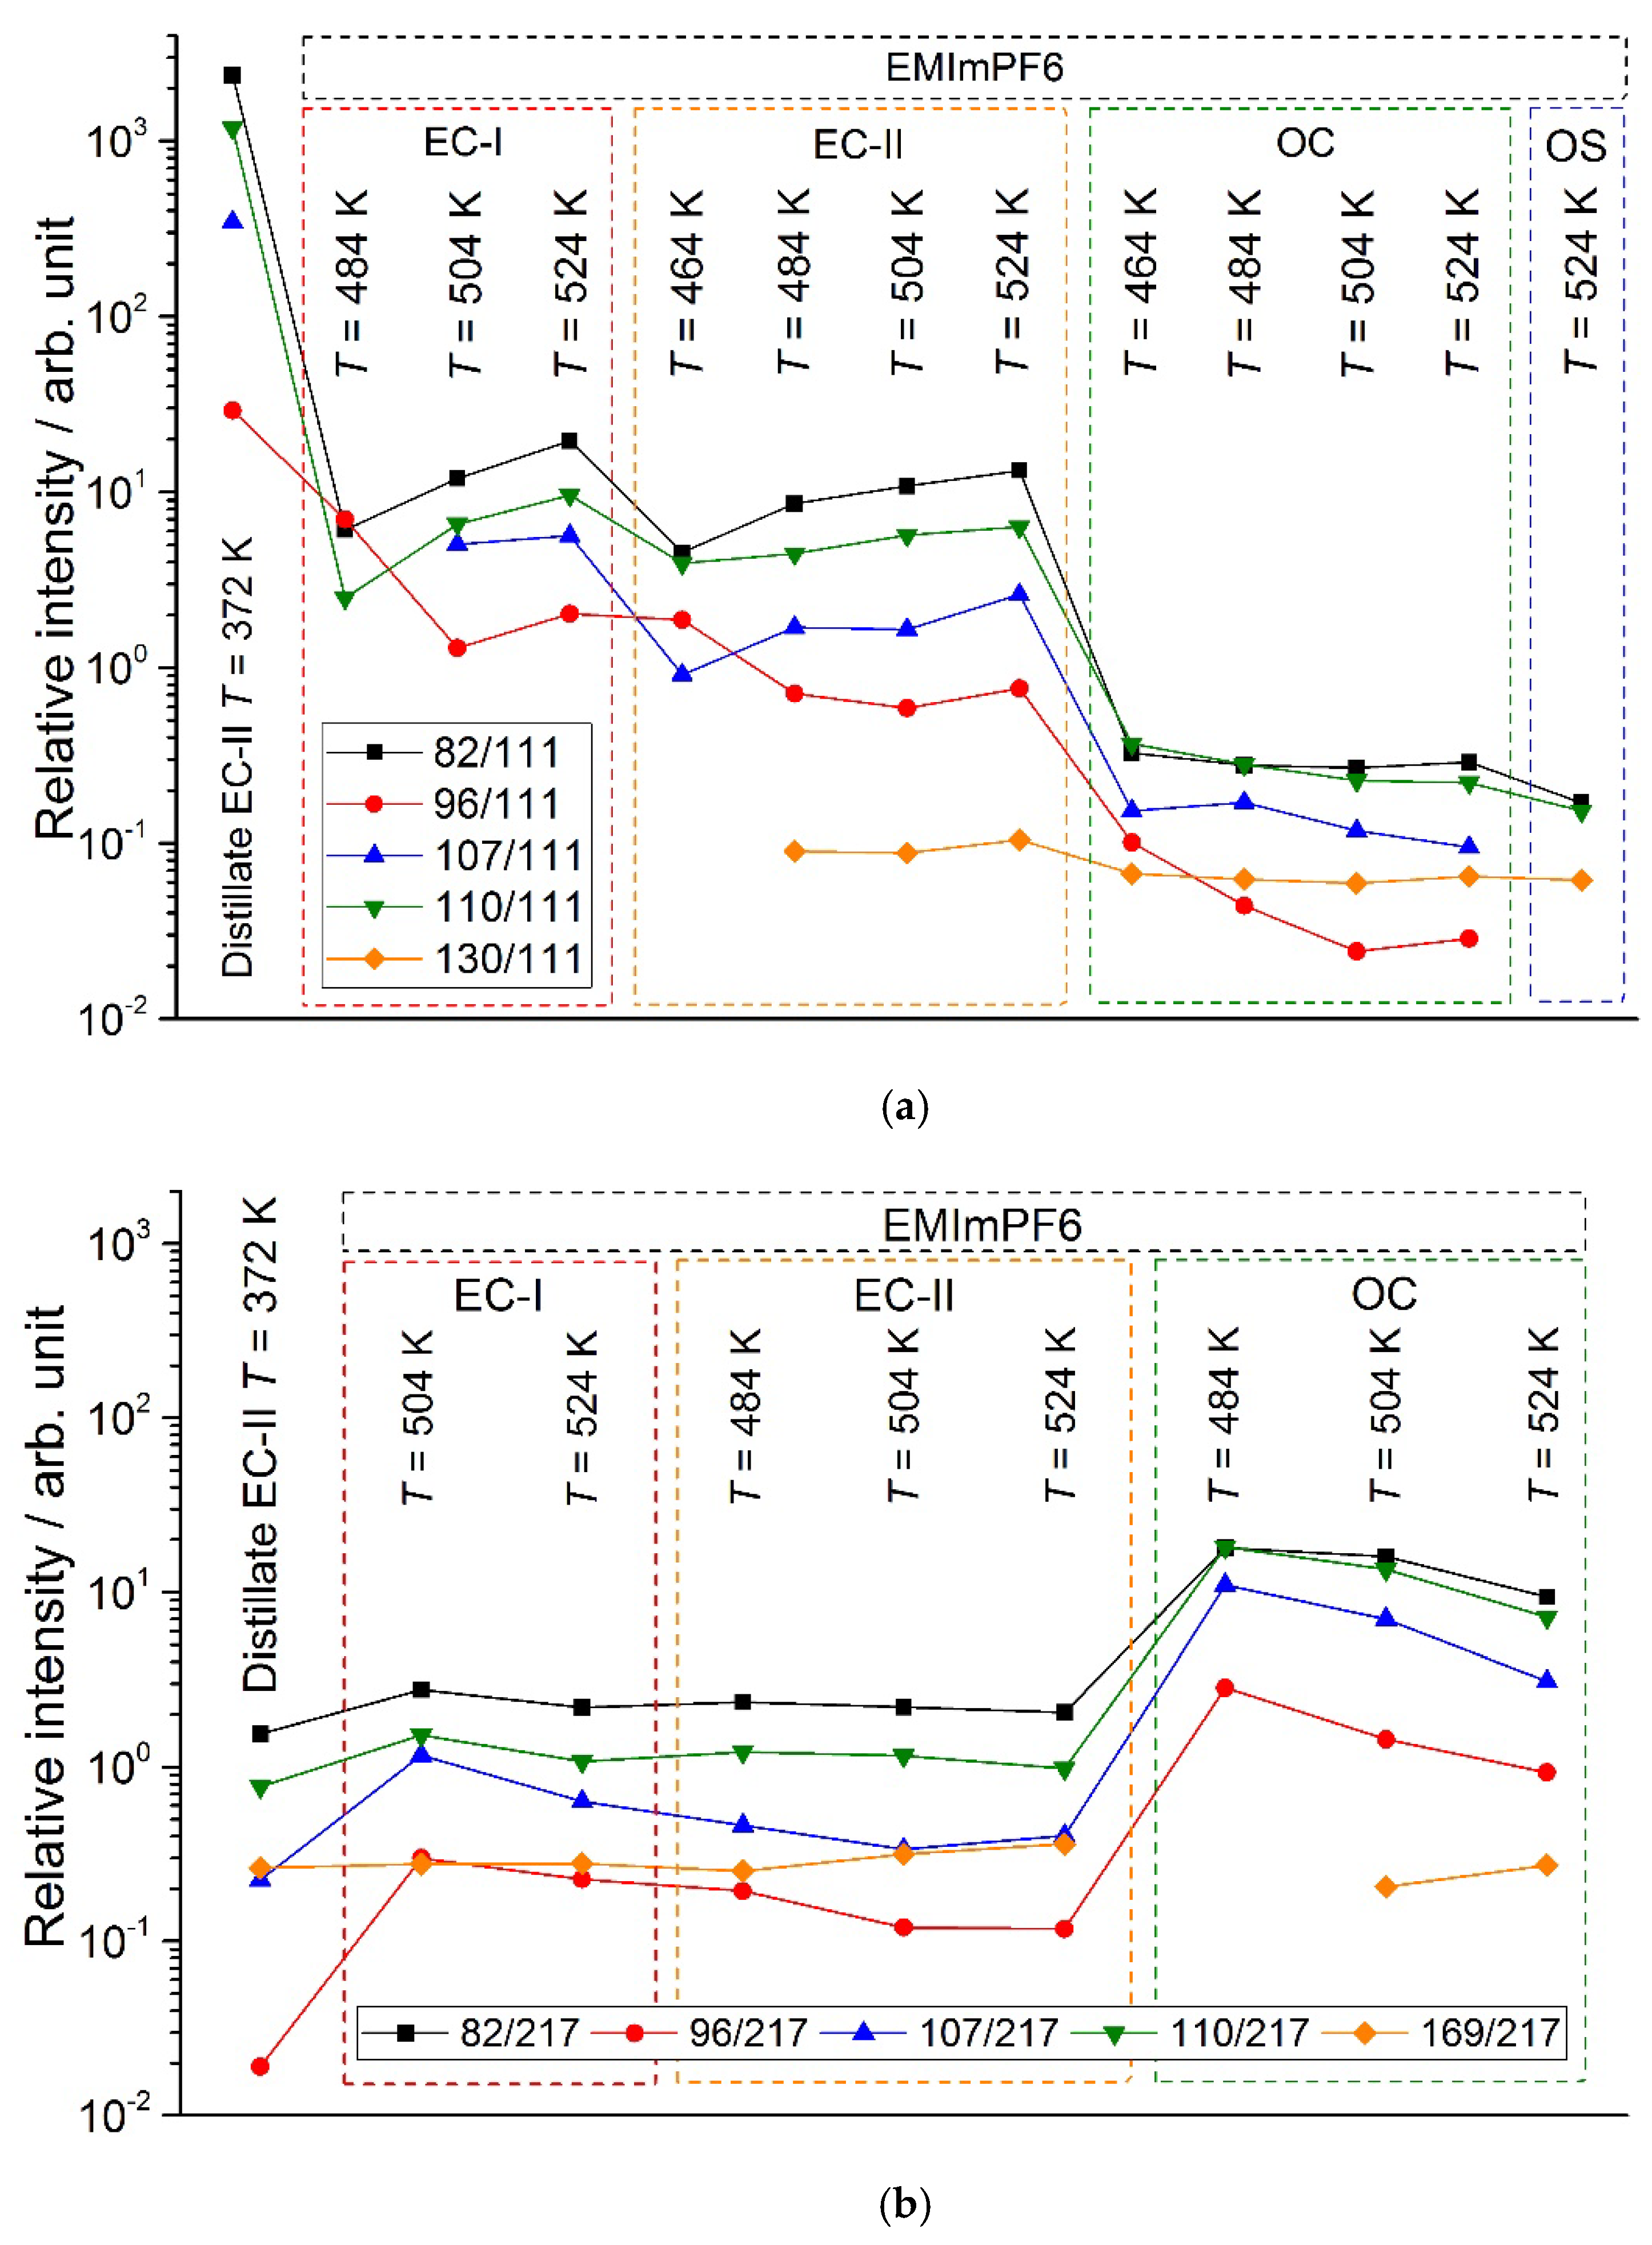
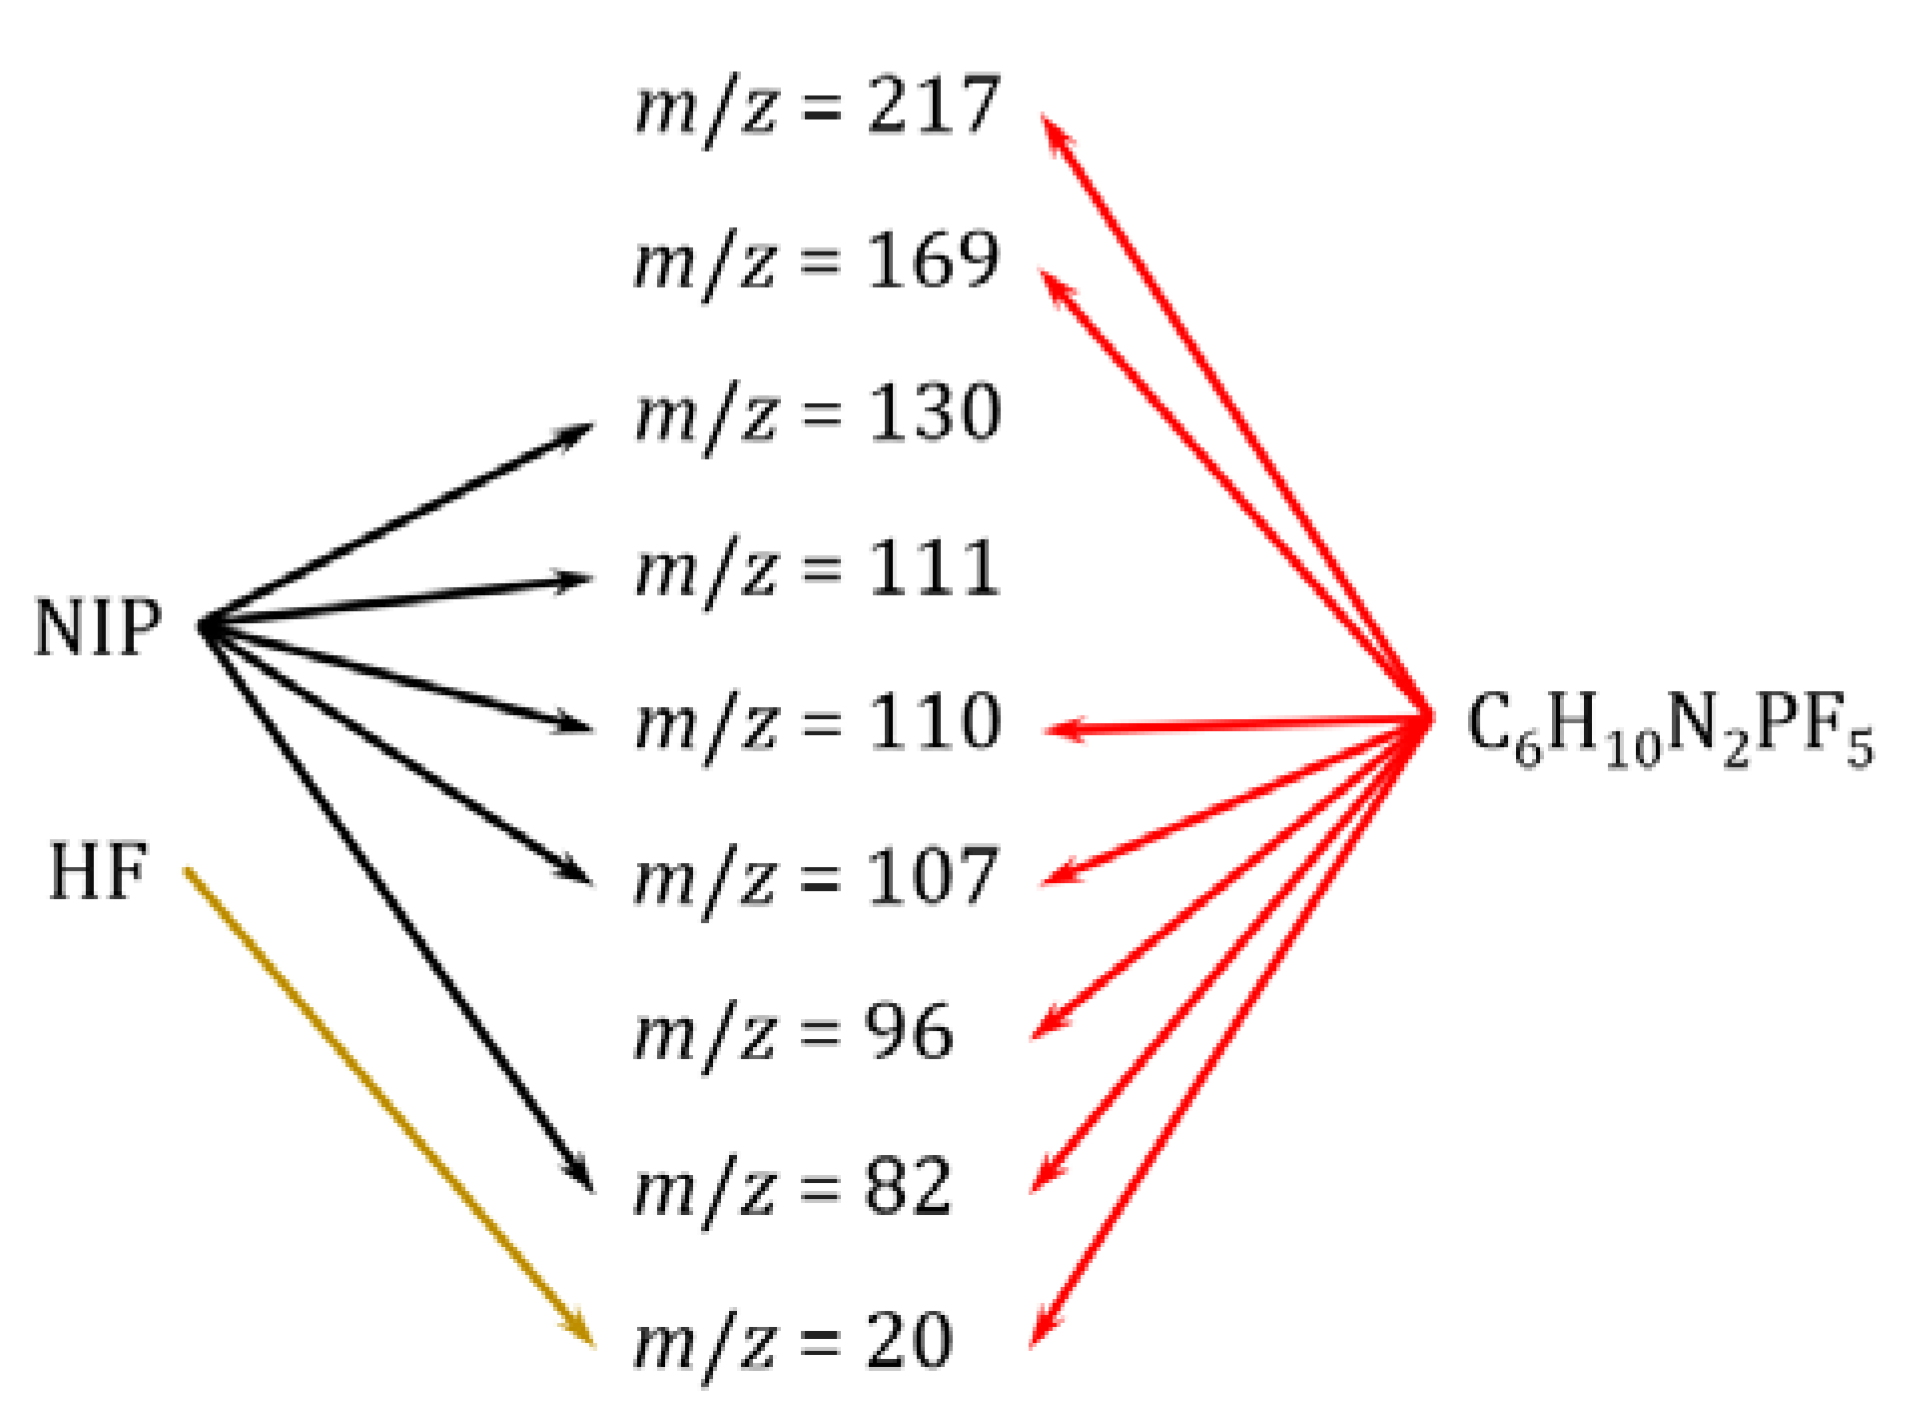

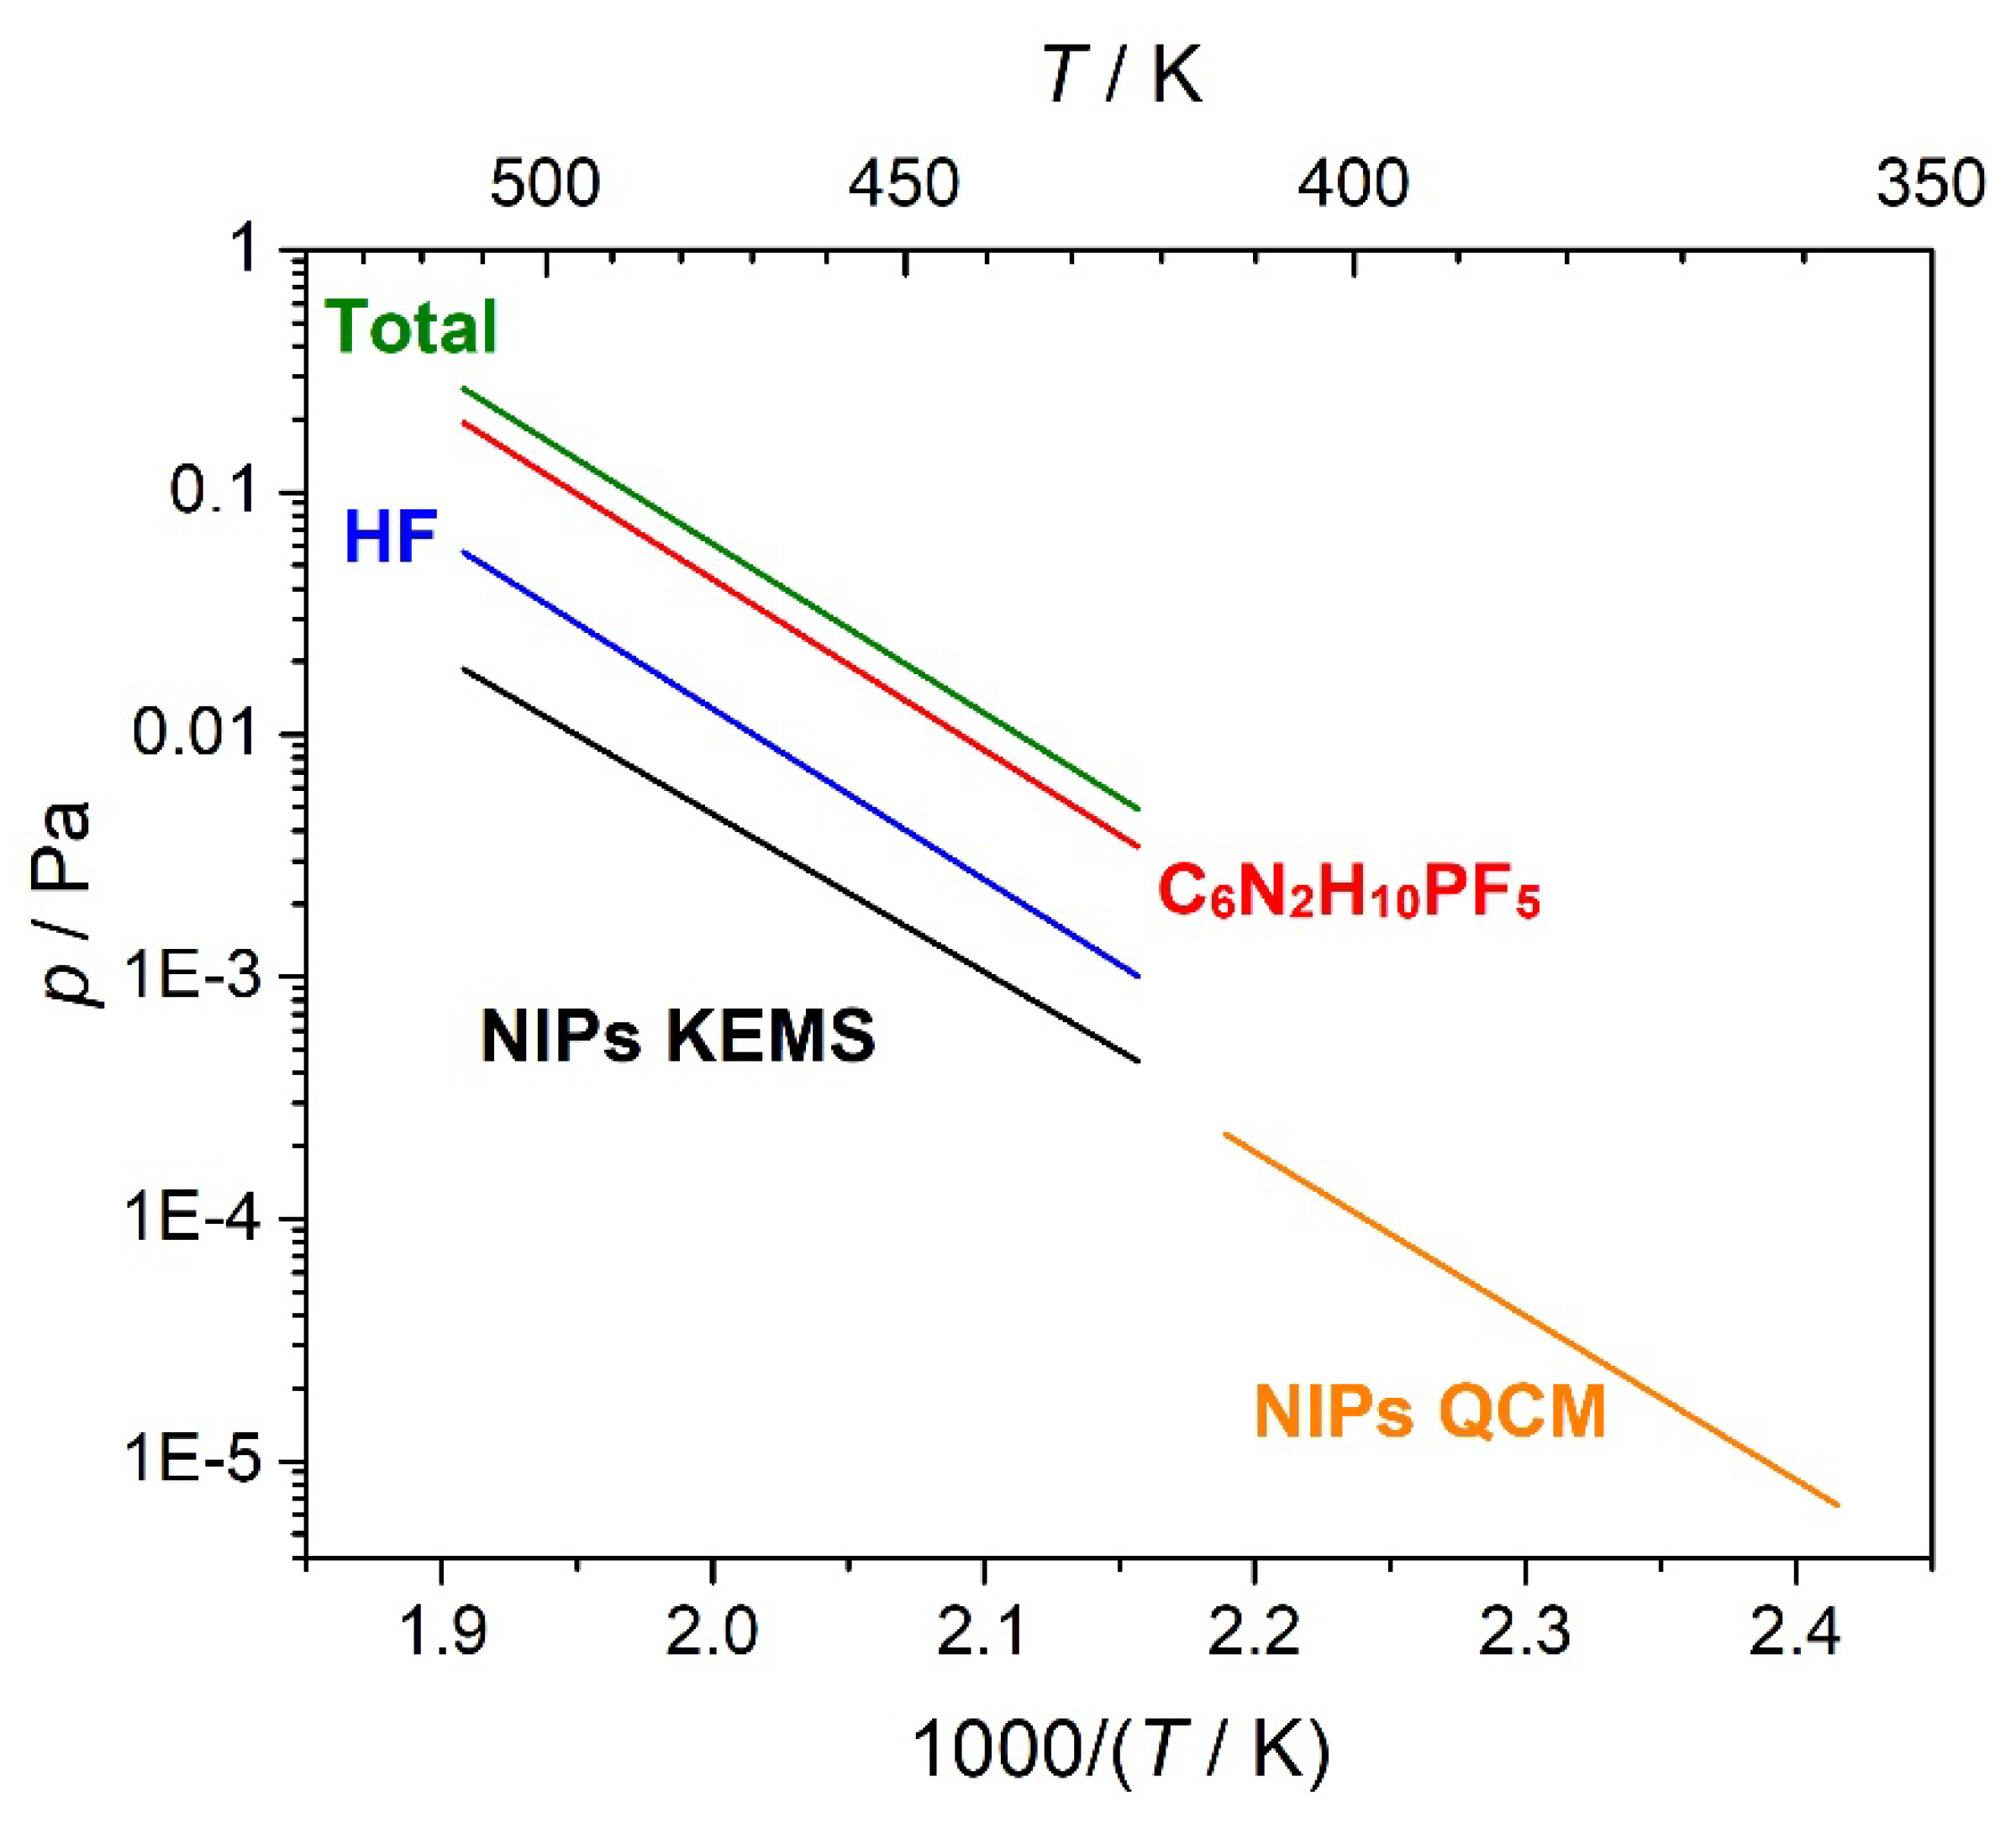
| Conditions | T / K | m/z | ||
|---|---|---|---|---|
| 82 | 110 | 111 | ||
| IL | ||||
| EC-I | 504 | 10.0 | 8.5 | |
| 524 | 10.0 | 8.5 | ||
| EC-II | 484 | 9.8 | 8.8 | 12.1 |
| 504 | 10.2 | 8.8 | ||
| 524 | 10.1 | 8.6 | ||
| OC | 464 | 9.5 | 8.6 | 12.4 |
| 484 | 9.5 | 8.6 | 12.4 | |
| 504 | 9.4 | 8.3 | 12.3 | |
| 524 | 7.9 | 8.0 | 12.0 | |
| OS | 524 | 11.9 | ||
| Distillate | ||||
| EC-II | 374 | 11.4 | 9.6 | |
| Conditions | EC-I | EC-II | OC |
|---|---|---|---|
| ΔT / K | 474-511 | 463-523 | 454-525 |
| m/z | |||
| 82 | -16.457±0.763 | -17.349±0.498 | -15.240±0.379 |
| 110 | -15.636±0.544 | -14.732±0.375 | -14.702±0.232 |
| 111 | -14.049±0.227 | -14.910±0.209 | -14.634±0.245 |
| 130 | -14.242±0.234 | ||
| 217 | -16.839±1.097 | -16.248±0.943 |
| T / K | NIPs | C6N2H10PF5 | HF |
|---|---|---|---|
| 524 | 16.0 | 157 | 45.6 |
| 514 | 10.3 | 117 | 34.0 |
| 505 | 6.60 | 79.0 | 23.0 |
| 494 | 3.51 | 30.9 | 8.99 |
| 484 | 1.73 | 16.1 | 4.70 |
| 474 | 0.93 | 6.93 | 2.02 |
| 464 | 0.37 | 4.84 | 1.41 |
| 469 | 0.63 | 3.92 | 1.14 |
| 479 | 1.30 | 8.01 | 2.33 |
| 488 | 2.51 | 17.3 | 5.04 |
| 499 | 4.44 | 41.6 | 12.1 |
| Vapor species | a | b |
|---|---|---|
| Ionic liquid (464-524 K) | ||
| NIPs | -14.977±0.380 | 24.592±0.776 |
| C6N2H10PF5 | -16.184±0.867 | 29.239±1.772 |
| HF | -16.184±0.867 | 28.005±1.772 |
| Distillate (332-374 K) | ||
| C6N2H10PF5 | -10.384±0.166 | 25.892±0.475 |
| Compound | ΔT / K | a | b, ·10–3 | c | d, ·103 | e, ·104 | f, ·104 |
|---|---|---|---|---|---|---|---|
| EMImPF6, s | 298.15-334 | 1998 | -1035 | 170.5 | 154.2 | -240.3 | 1340 |
| EMImPF6, s | 334-600 | 9.847 | -8.787 | 5.077 | 8.156 | -2.304 | -5.235 |
| EMImPF6, g | 298.15-600 | -74.95 | 7.229 | 2.427 | 7.009 | -2.240 | 4.391 |
| C6N2H10PF5, g | 298.15-600 | -63.76 | 5.581 | 2.336 | 6.232 | -1.911 | 3.562 |
| ΔT | T | N | ΔrH°(T) | ΔrH°(298.15 K) | ΔrS°(T) | Method3 | Conditions | Ref. | |||
| II law1 | III law2 | II law1 | III law2 | ||||||||
| EMImPF6, s,l = EMImPF6, g | |||||||||||
| 464-524 | 490 | 11 | 125±3 | 156±4 | 152±14 | 109±4 | 102±18 | KEMS | EC-II | this work | |
| 414-457 | 436 | 18 | 130±1 | 158±2 | 153±14 | 118±1 | 108±18 | QCM | OS | [7] | |
| EMImPF6, g = C6N2H10PF5, g + HF, g | |||||||||||
| 464-524 | 490 | 11 | 145±8 | 144±9 | 112±14 | 176±24 | 110±18 | KEMS | EC-II | this work | |
Disclaimer/Publisher’s Note: The statements, opinions and data contained in all publications are solely those of the individual author(s) and contributor(s) and not of MDPI and/or the editor(s). MDPI and/or the editor(s) disclaim responsibility for any injury to people or property resulting from any ideas, methods, instructions or products referred to in the content. |
© 2023 by the authors. Licensee MDPI, Basel, Switzerland. This article is an open access article distributed under the terms and conditions of the Creative Commons Attribution (CC BY) license (http://creativecommons.org/licenses/by/4.0/).


