Submitted:
05 May 2023
Posted:
06 May 2023
You are already at the latest version
Abstract
Keywords:
1. Introduction
2. Results
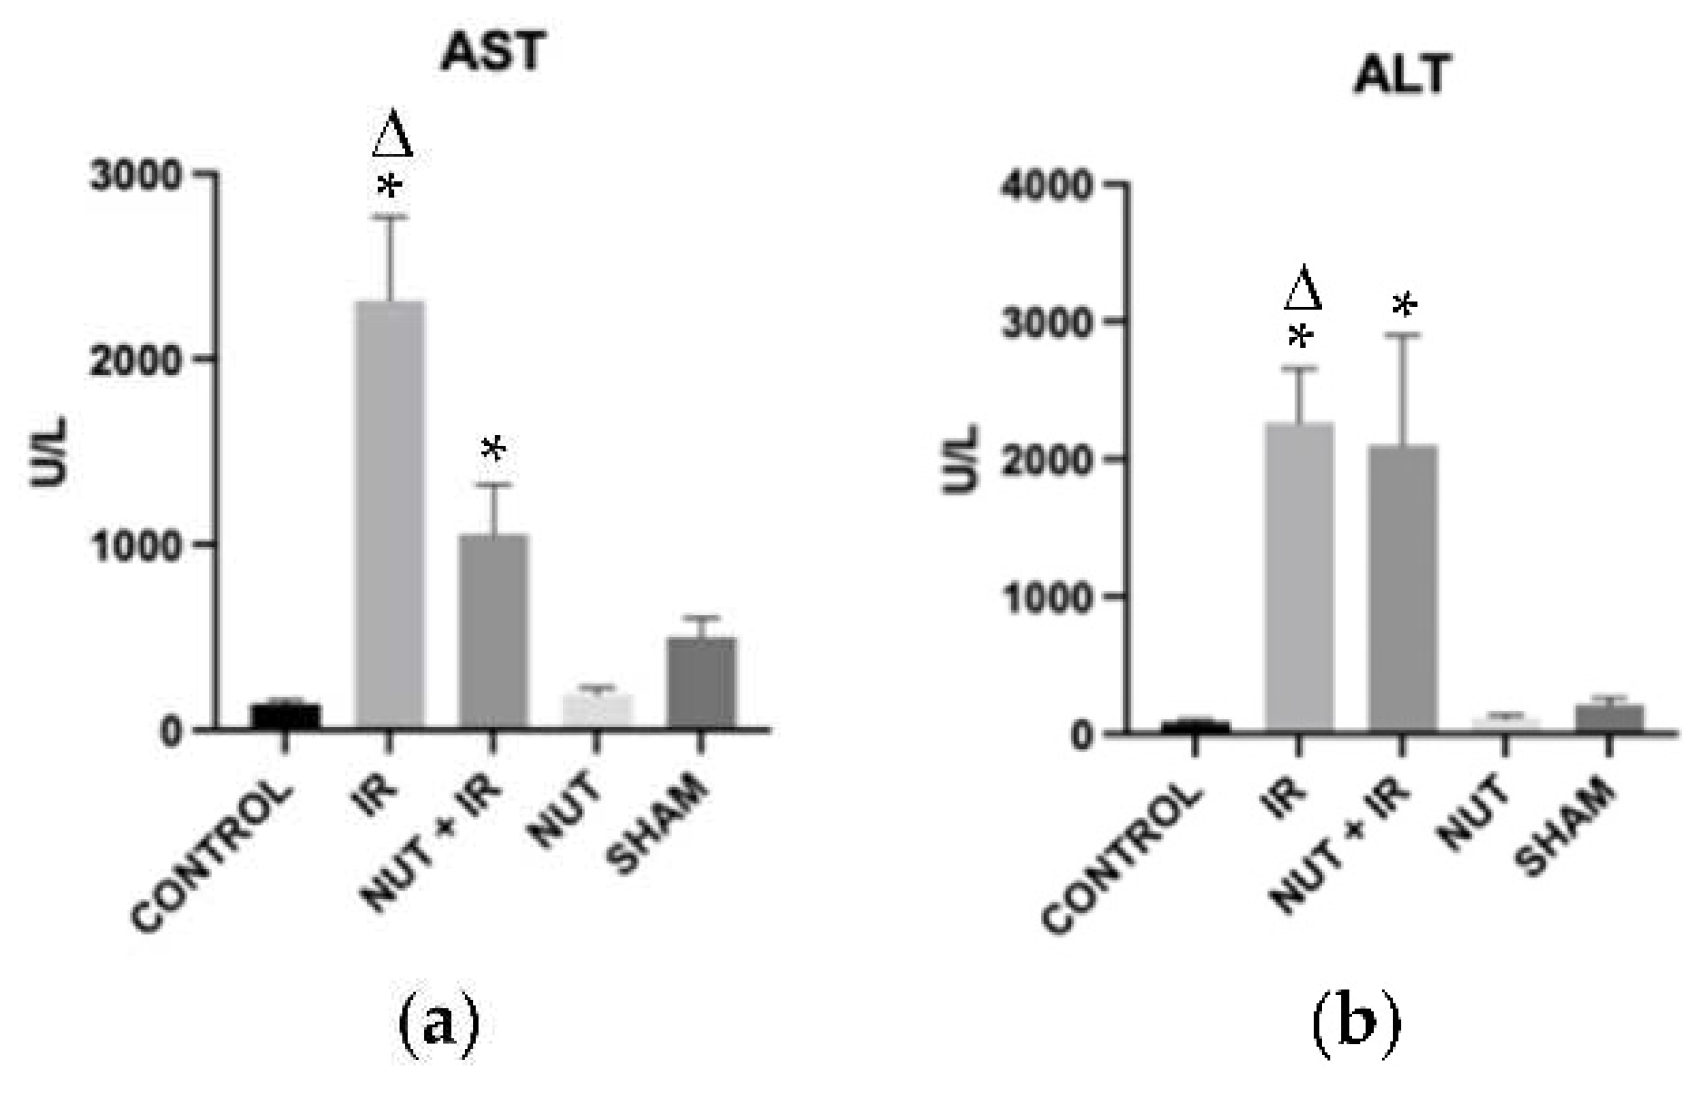
2.1. Hepatocellular Injury
2.2. Inflammatory Mediators
2.3. Lipid Peroxidation
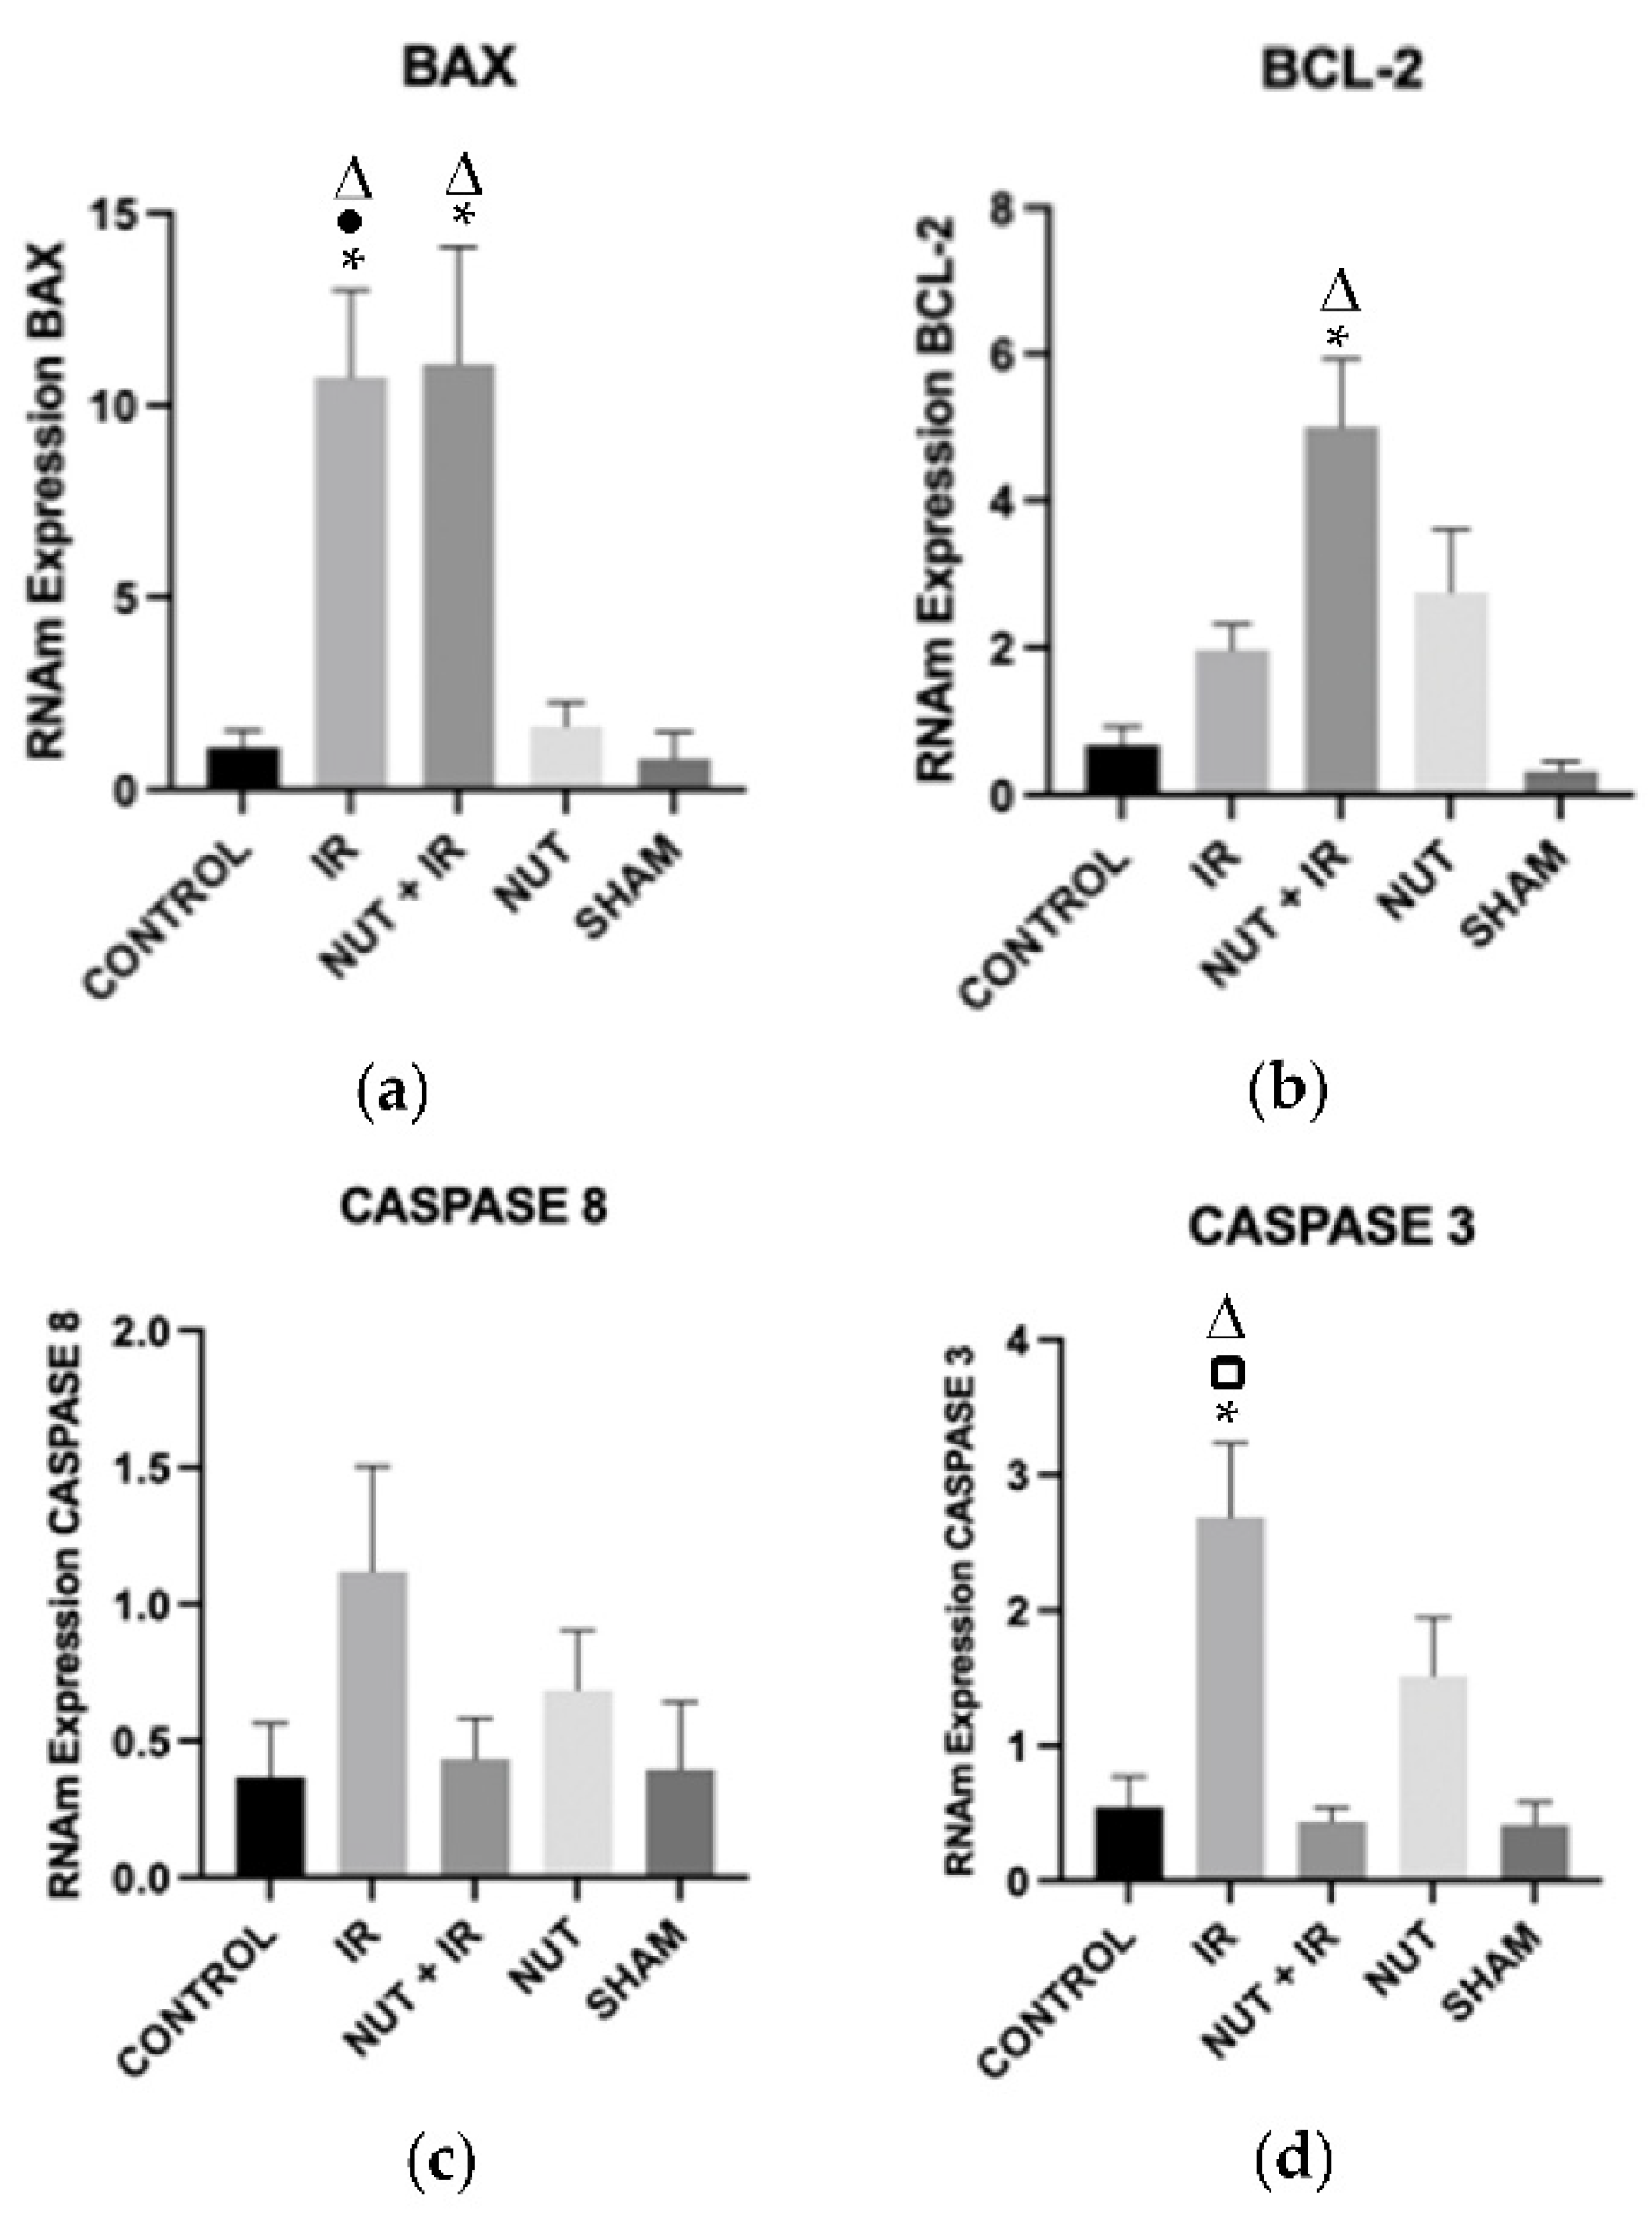
2.4. Gene Expression of Apoptosis: BAX, BCL-2, CASPASE 8, and CASPASE 3
2.5. Immunohistochemistry: Apoptosis, Cleaved Caspase 3, and TNF-α Proteins in the Liver
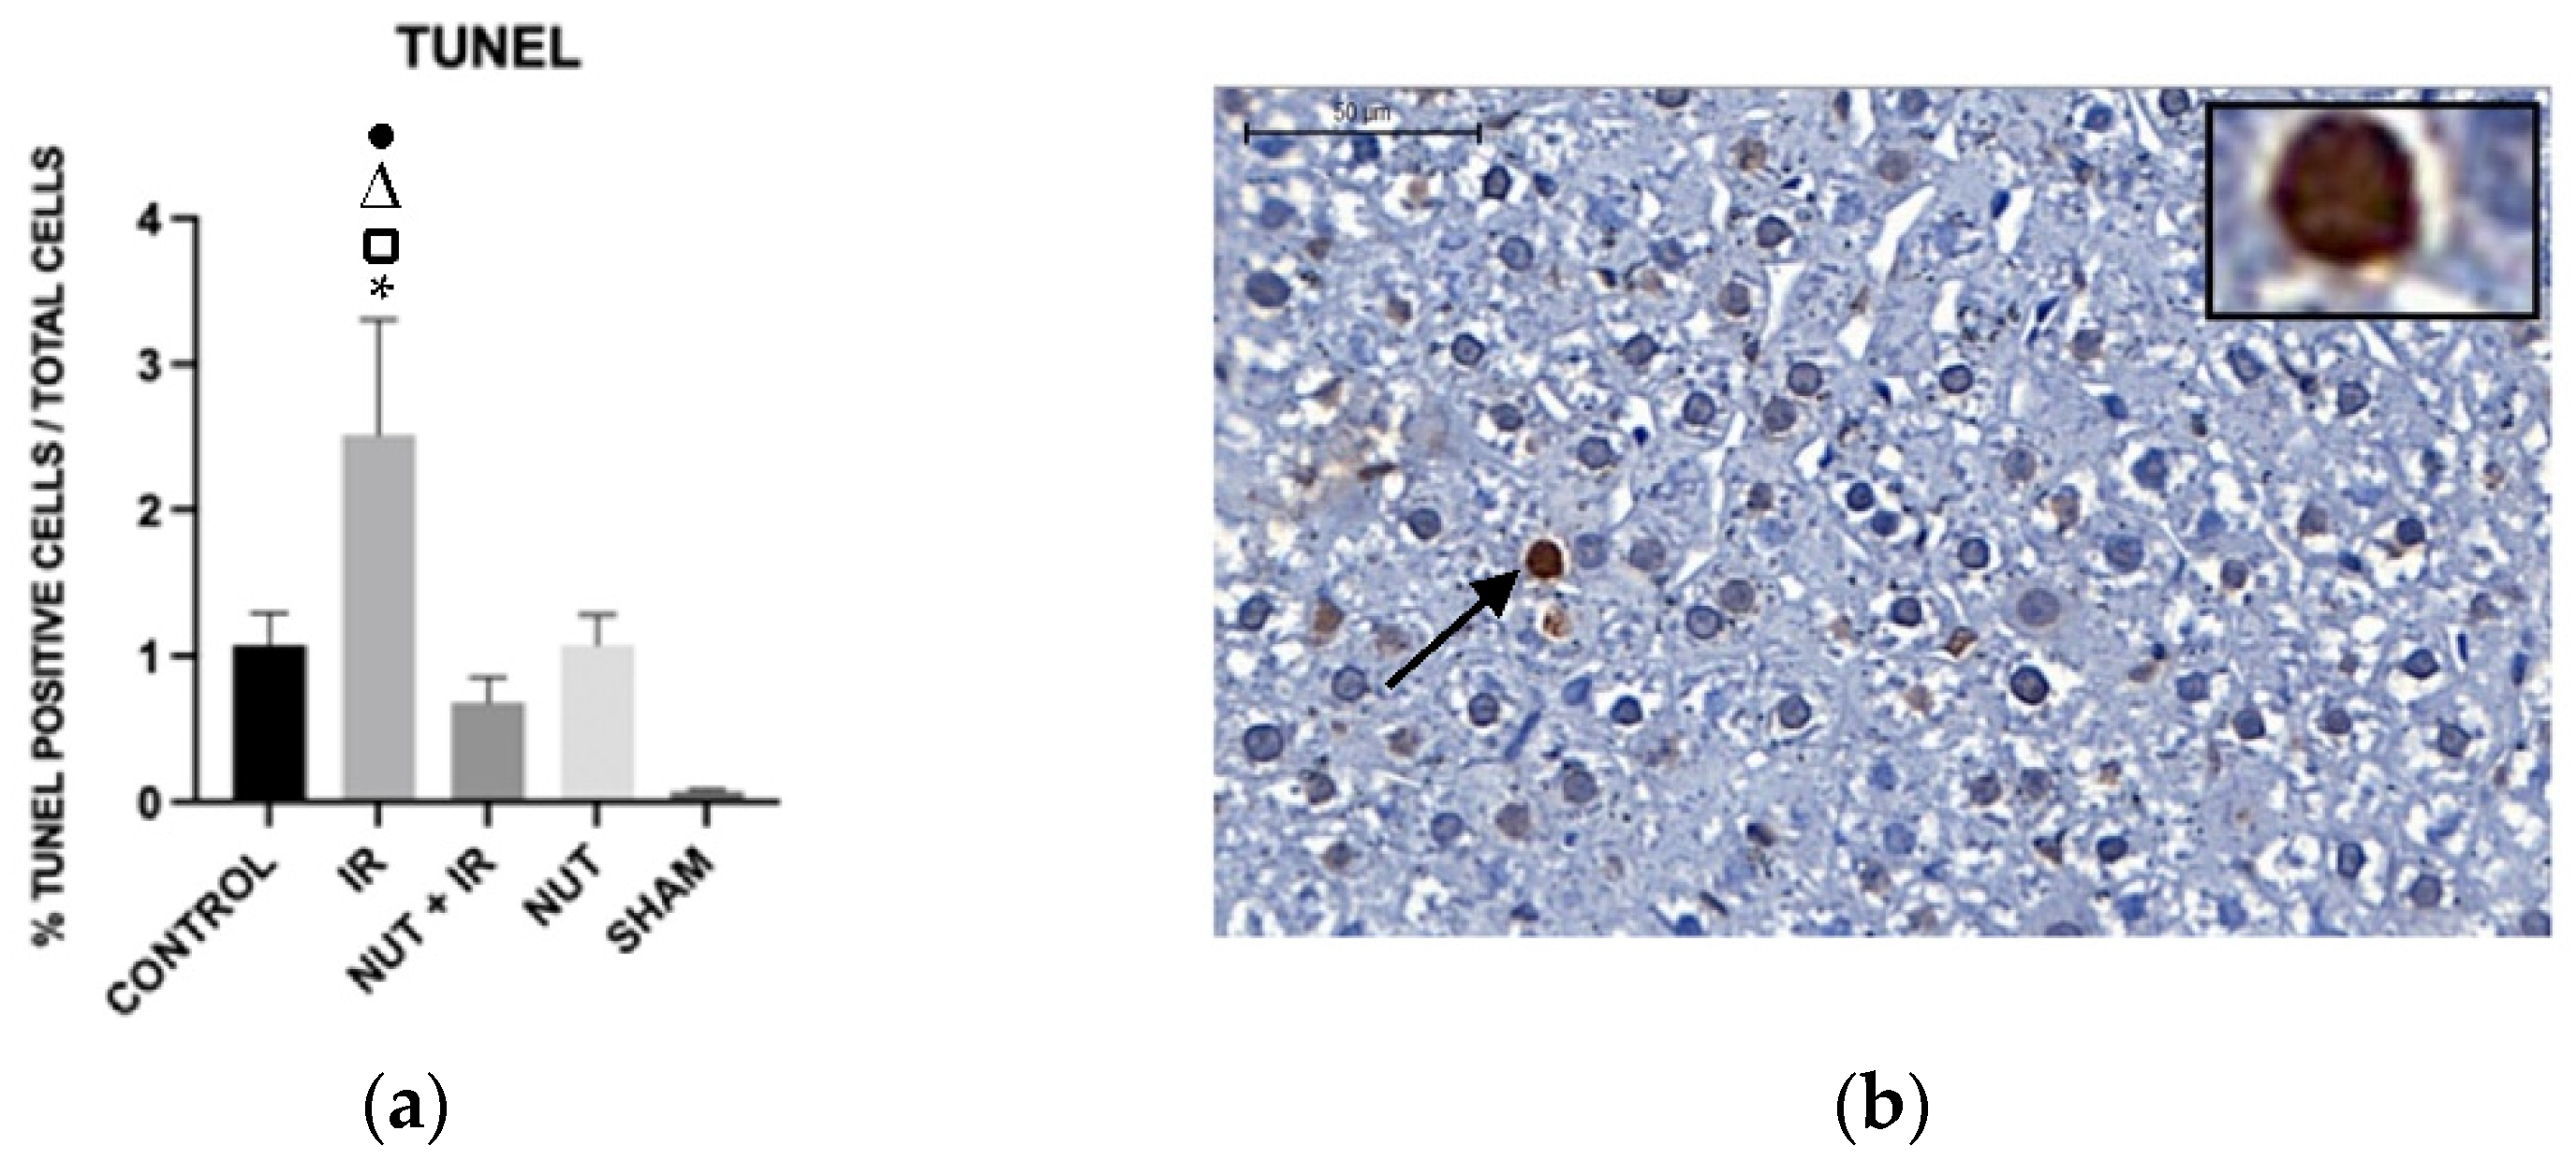
Apoptosis—TUNEL Assay
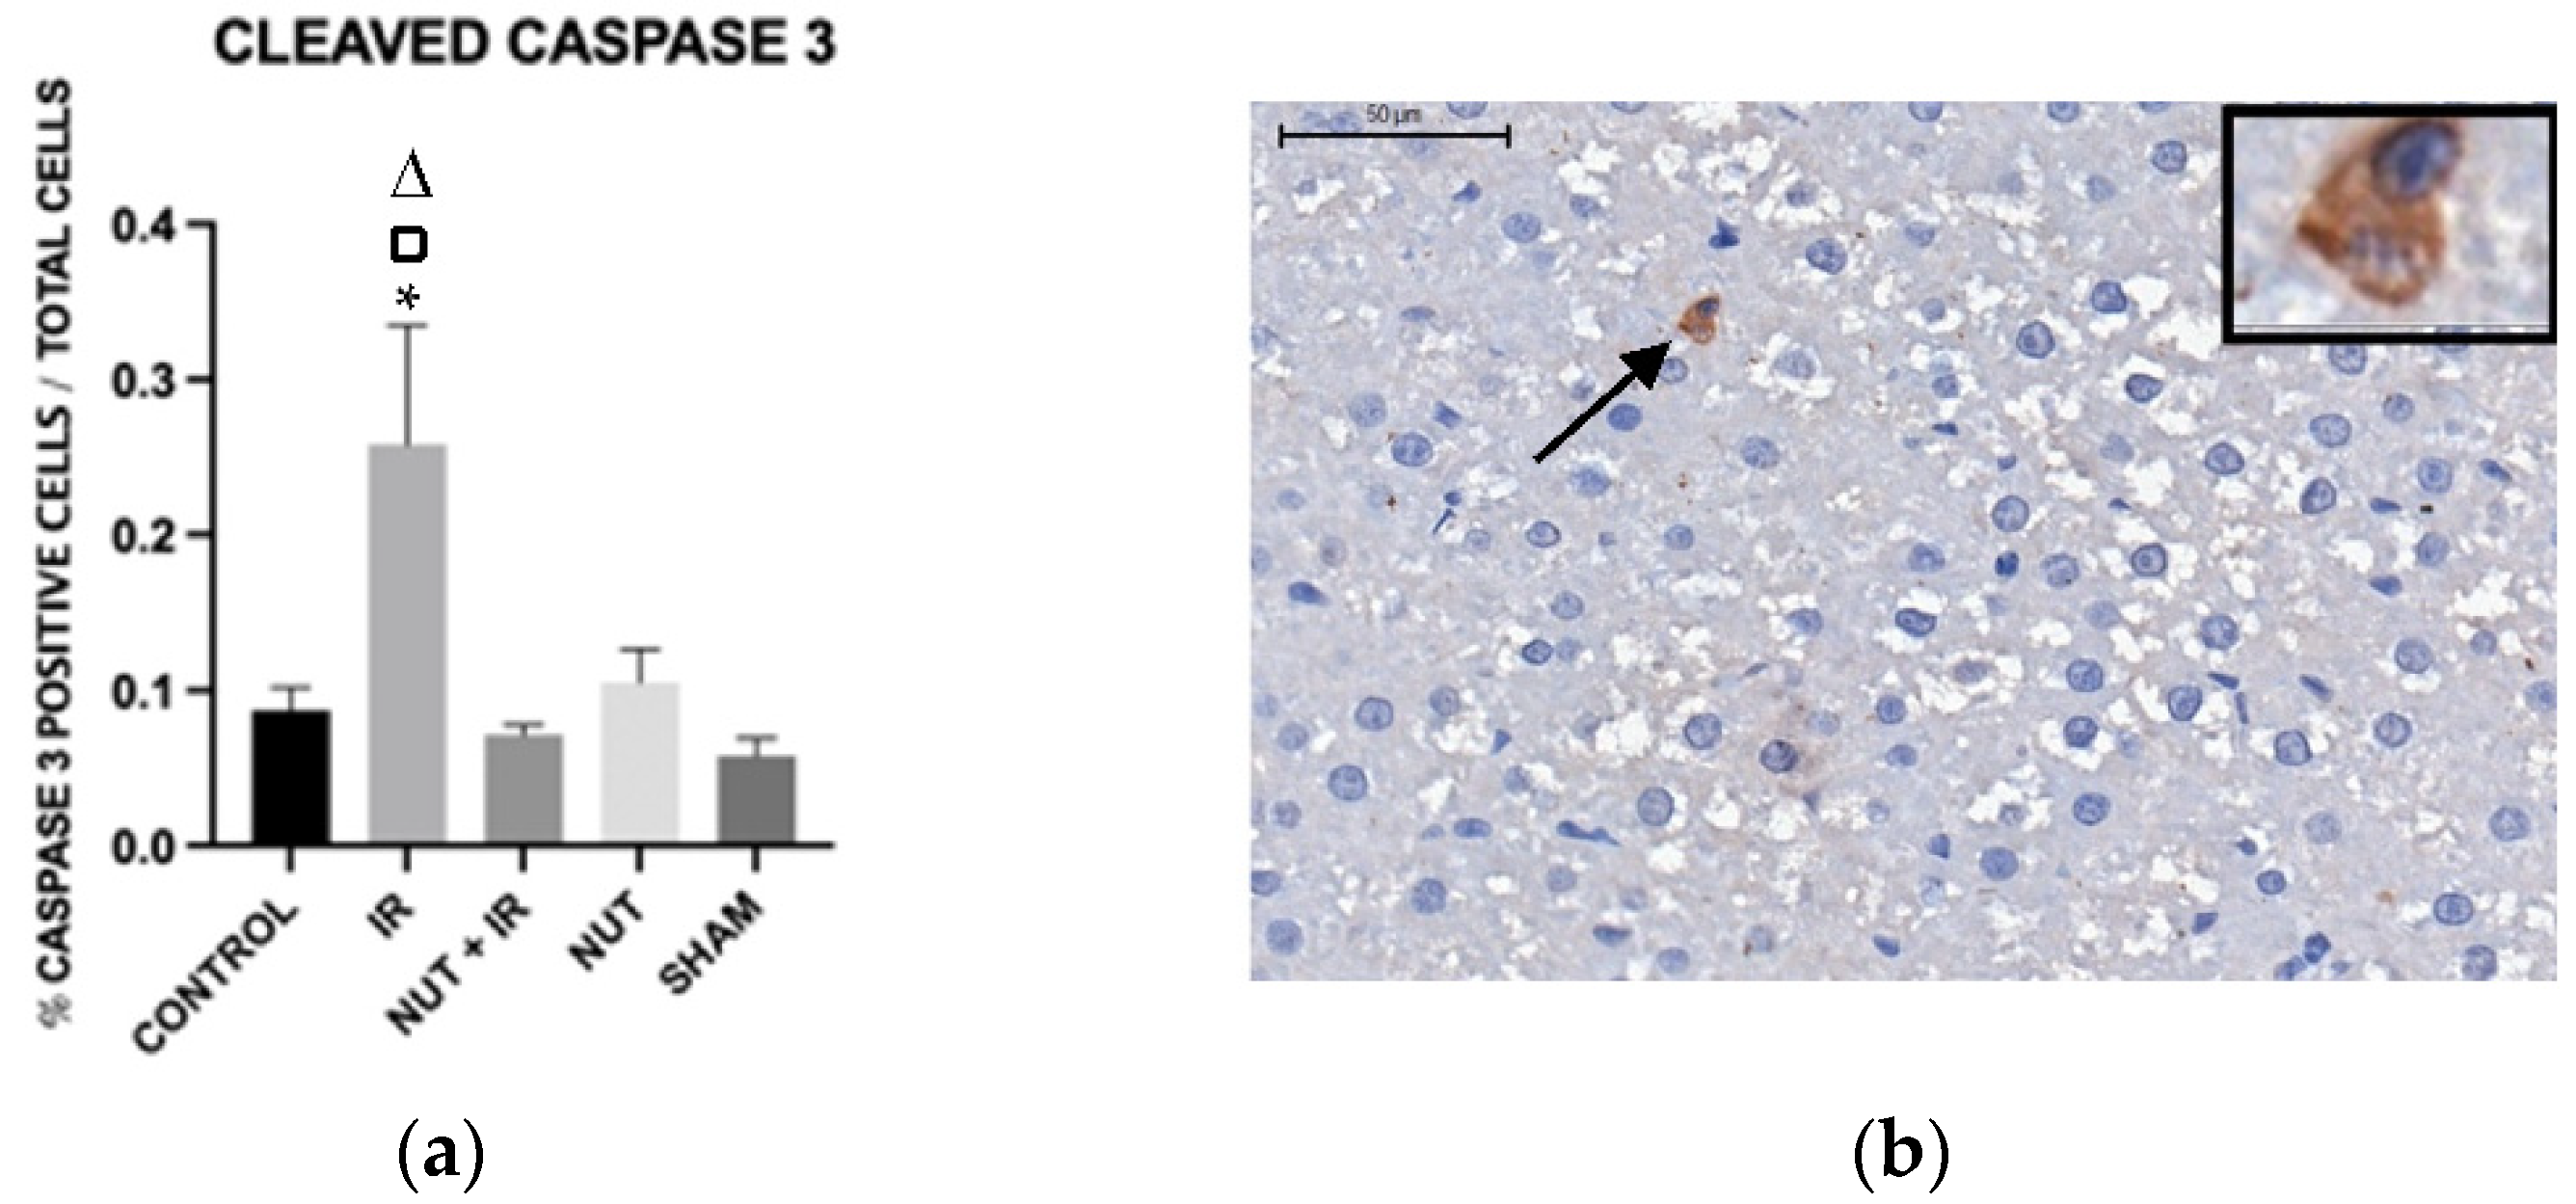
Cleaved Caspase 3 Protein
TNF-α Protein
2.5. Liver Histology Injury
3. Discussion
4. Materials and Methods
4.1. Animals
4.2. Preparation of the Nutraceutical Solution
4.3. Anesthesia and Surgical Procedures
4.4. Experimental Design
4.5. Serum Biochemical Analysis
4.6. Oxidative Stress
4.7. Gene Expression of Apoptosis
4.8. Immunohistochemistry
Apoptosis
Cleaved Caspase 3 and TNF-α Proteins
4.9. Histology
5.0. Data Processing
5. Conclusions
Author Contributions
Funding
Institutional Review Board Statement
Data Availability Statement
Acknowledgments
Conflicts of Interest
References
- Sachdeva, V.; Roy, A.; Bharadvaja, N. Current Prospects of Nutraceuticals: A Review. Curr Pharm Biotechnol 2020, 21, 884–896. [Google Scholar] [CrossRef] [PubMed]
- Brower, V. Nutraceuticals: Poised for a Healthy Slice of the Healthcare Market? Nat Biotechnol 1998, 16, 728–731. [Google Scholar] [CrossRef] [PubMed]
- Bergamin, A.; Mantzioris, E.; Cross, G.; Deo, P.; Garg, S.; Hill, A.M. Nutraceuticals: Reviewing Their Role in Chronic Disease Prevention and Management. Pharmaceut Med 2019, 33, 291–309. [Google Scholar] [CrossRef] [PubMed]
- D’Angelo, S.; Scafuro, M.; Meccariello, R. BPA and Nutraceuticals, Simultaneous Effects on Endocrine Functions. Endocr Metab Immune Disord Drug Targets 2019, 19, 594–604. [Google Scholar] [CrossRef] [PubMed]
- Espín, J.C.; García-Conesa, M.T.; Tomás-Barberán, F.A. Nutraceuticals: Facts and Fiction. Phytochemistry 2007, 68, 2986–3008. [Google Scholar] [CrossRef] [PubMed]
- Prasad, S.; Gupta, S.C.; Tyagi, A.K. Reactive Oxygen Species (ROS) and Cancer: Role of Antioxidative Nutraceuticals. Cancer Lett 2017, 387, 95–105. [Google Scholar] [CrossRef] [PubMed]
- Song, J.-M.; Lee, K.-H.; Seong, B.-L. Antiviral Effect of Catechins in Green Tea on Influenza Virus. Antiviral Res 2005, 68, 66–74. [Google Scholar] [CrossRef]
- de Mejia, E.G.; Dia, V.P. The Role of Nutraceutical Proteins and Peptides in Apoptosis, Angiogenesis, and Metastasis of Cancer Cells. Cancer and Metastasis Reviews 2010, 29, 511–528. [Google Scholar] [CrossRef]
- Aggarwal, B.B.; Van Kuiken, M.E.; Iyer, L.H.; Harikumar, K.B.; Sung, B. Molecular Targets of Nutraceuticals Derived from Dietary Spices: Potential Role in Suppression of Inflammation and Tumorigenesis. Exp Biol Med 2009, 234, 825–849. [Google Scholar] [CrossRef]
- Liu, B.; Cheng, Y.; Zhang, B.; Bian, H.; Bao, J. Polygonatum Cyrtonema Lectin Induces Apoptosis and Autophagy in Human Melanoma A375 Cells through a Mitochondria-Mediated ROS–P38–P53 Pathway. Cancer Lett 2009, 275, 54–60. [Google Scholar] [CrossRef]
- Puri, V.; Nagpal, M.; Singh, I.; Singh, M.; Dhingra, G.A.; Huanbutta, K.; Dheer, D.; Sharma, A.; Sangnim, T. A Comprehensive Review on Nutraceuticals: Therapy Support and Formulation Challenges. Nutrients 2022, 14, 4637. [Google Scholar] [CrossRef] [PubMed]
- Cornide-Petronio, M.E.; Álvarez-Mercado, A.I.; Jiménez-Castro, M.B.; Peralta, C. Current Knowledge about the Effect of Nutritional Status, Supplemented Nutrition Diet, and Gut Microbiota on Hepatic Ischemia-Reperfusion and Regeneration in Liver Surgery. Nutrients 2020, 12, 284. [Google Scholar] [CrossRef] [PubMed]
- Eltzschig, H.K.; Eckle, T. Ischemia and Reperfusion—from Mechanism to Translation. Nat Med 2011, 17, 1391–1401. [Google Scholar] [CrossRef] [PubMed]
- Jiménez-Castro, M.B.; Cornide-Petronio, M.E.; Gracia-Sancho, J.; Peralta, C. Inflammasome-Mediated Inflammation in Liver Ischemia-Reperfusion Injury. Cells 2019, 8, 1131. [Google Scholar] [CrossRef] [PubMed]
- Oliveira, T.H.C. de; Marques, P.E.; Proost, P.; Teixeira, M.M.M. Neutrophils: A Cornerstone of Liver Ischemia and Reperfusion Injury. Laboratory Investigation 2018, 98, 51–62. [Google Scholar] [CrossRef] [PubMed]
- Zhai, Y.; Petrowsky, H.; Hong, J.C.; Busuttil, R.W.; Kupiec-Weglinski, J.W. Ischaemia–Reperfusion Injury in Liver Transplantation—from Bench to Bedside. Nat Rev Gastroenterol Hepatol 2013, 10, 79–89. [Google Scholar] [CrossRef] [PubMed]
- He, D.; Guo, Z.; Pu, J.-L.; Zheng, D.-F.; Wei, X.-F.; Liu, R.; Tang, C.-Y.; Wu, Z.-J. Resveratrol Preconditioning Protects Hepatocytes against Hepatic Ischemia Reperfusion Injury via Toll-like Receptor 4/Nuclear Factor-ΚB Signaling Pathway in Vitro and in Vivo. Int Immunopharmacol 2016, 35, 201–209. [Google Scholar] [CrossRef] [PubMed]
- Su, J.-F.; Guo, C.-J.; Wei, J.-Y.; Yang, J.-J.; Jiang, Y.-G.; Li, Y.-F. Protection against Hepatic Ischemia-Reperfusion Injury in Rats by Oral Pretreatment with Quercetin. Biomed Environ Sci 2003, 16, 1–8. [Google Scholar]
- Calder, P.C. Mechanisms of Action of (n-3) Fatty Acids, J Nutr 2012, 142, 592S–599S. [Google Scholar] [CrossRef]
- Zapletal, C.; Heyne, S.; Breitkreutz, R.; Gebhard, M.M.; Golling, M. The Influence of Selenium Substitution on Microcirculation and Glutathione Metabolism after Warm Liver Ischemia/Reperfusion in a Rat Model. Microvasc Res 2008, 76, 104–109. [Google Scholar] [CrossRef]
- Abdel-Azeem, A.S.; Hegazy, A.M.; Ibrahim, K.S.; Farrag, A.-R.H.; El-Sayed, E.M. Hepatoprotective, Antioxidant, and Ameliorative Effects of Ginger ( Zingiber Officinale Roscoe ) and Vitamin E in Acetaminophen Treated Rats. J Diet Suppl 2013, 10, 195–209. [Google Scholar] [CrossRef]
- Maghsoudi, S.; Gol, A.; Dabiri, S.; Javadi, A. Preventive Effect of Ginger (Zingiber Officinale) Pretreatment on Renal Ischemia-Reperfusion in Rats. European Surgical Research 2011, 46, 45–51. [Google Scholar] [CrossRef]
- Eser, O.; Songur, A.; Yaman, M.; Cosar, M.; Fidan, H.; Sahin, O.; Mollaoglu, H.; Buyukbas, S. The Protective Effect of Avocado Soybean Unsaponifilables on Brain Ischemia/Reperfusion Injury in Rat Prefrontal Cortex. Br J Neurosurg 2011, 25, 701–706. [Google Scholar] [CrossRef]
- Araujo, Q.R. De; Gattward, J.N.; Almoosawi, S.; Parada Costa Silva, M. das G.C.; Dantas, P.A.D.S.; Araujo Júnior, Q.R. De Cocoa and Human Health: From Head to Foot—A Review. Crit Rev Food Sci Nutr 2016, 56, 1–12. [Google Scholar] [CrossRef]
- Singh, C.K.; Siddiqui, I.A.; El-Abd, S.; Mukhtar, H.; Ahmad, N. Combination Chemoprevention with Grape Antioxidants. Mol Nutr Food Res 2016, 60, 1406–1415. [Google Scholar] [CrossRef]
- Liu, R.H. Health Benefits of Fruit and Vegetables Are from Additive and Synergistic Combinations of Phytochemicals. Am J Clin Nutr 2003, 78, 517S–520S. [Google Scholar] [CrossRef]
- Liu, R.H. Potential Synergy of Phytochemicals in Cancer Prevention: Mechanism of Action. J Nutr 2004, 134, 3479S–3485S. [Google Scholar] [CrossRef]
- Hegazy, A.M.; El-Sayed, E.M.; Ibrahim, K.S.; Abdel-Azeem, A.S. Dietary Antioxidant for Disease Prevention Corroborated by the Nrf2 Pathway. J Complement Integr Med 2019, 16. [Google Scholar] [CrossRef]
- Saïdi, S.; Abdelkafi, S.; Jbahi, S.; van Pelt, J.; El-Feki, A. Temporal Changes in Hepatic Antioxidant Enzyme Activities after Ischemia and Reperfusion in a Rat Liver Ischemia Model. Hum Exp Toxicol 2015, 34, 249–259. [Google Scholar] [CrossRef]
- Silva, R.M. da; Malafaia, O.; Torres, O.J.M.; Czeczko, N.G.; Marinho Junior, C.H.; Kozlowski, R.K. Evaluation of Liver Regeneration Diet Supplemented with Omega-3 Fatty Acids: Experimental Study in Rats. Rev Col Bras Cir 2015, 42, 393–397. [Google Scholar] [CrossRef]
- Domenicali, M.; Vendemiale, G.; Serviddio, G.; Grattagliano, I.; Pertosa, A.M.; Nardo, B.; Principe, A.; Viola, A.; Trevisani, F.; Altomare, E.; et al. Oxidative Injury in Rat Fatty Liver Exposed to Ischemia-Reperfusion Is Modulated by Nutritional Status. Digestive and Liver Disease 2005, 37, 689–697. [Google Scholar] [CrossRef]
- Chandrasekara, A.; Josheph Kumar, T. Roots and Tuber Crops as Functional Foods: A Review on Phytochemical Constituents and Their Potential Health Benefits. Int J Food Sci 2016, 2016, 1–15. [Google Scholar] [CrossRef]
- Hasegawa, T.; Ito, Y.; Wijeweera, J.; Liu, J.; Malle, E.; Farhood, A.; McCuskey, R.S.; Jaeschke, H. Reduced Inflammatory Response and Increased Microcirculatory Disturbances during Hepatic Ischemia-Reperfusion Injury in Steatotic Livers of Ob/Ob Mice. American Journal of Physiology-Gastrointestinal and Liver Physiology 2007, 292, G1385–G1395. [Google Scholar] [CrossRef]
- Fang, H.; Liu, A.; Dahmen, U.; Dirsch, O. Dual Role of Chloroquine in Liver Ischemia Reperfusion Injury: Reduction of Liver Damage in Early Phase, but Aggravation in Late Phase. Cell Death Dis 2013, 4, e694–e694. [Google Scholar] [CrossRef]
- Perry, B.C.; Soltys, D.; Toledo, A.H.; Toledo-Pereyra, L.H. Tumor Necrosis Factor-α in Liver Ischemia/Reperfusion Injury. Journal of Investigative Surgery 2011, 24, 178–188. [Google Scholar] [CrossRef]
- Kato, A.; Gabay, C.; Okaya, T.; Lentsch, A.B. Specific Role of Interleukin-1 in Hepatic Neutrophil Recruitment after Ischemia/Reperfusion. Am J Pathol 2002, 161, 1797–1803. [Google Scholar] [CrossRef]
- Cui, L.-Z.; Wang, B.; Chen, L.-Y.; Zhou, J. The Effect of Ischemic Precondition to IL-6 on Rat Liver Ischemia-Reperfusion Injury in Transplantation. Asian Pac J Trop Med 2013, 6, 395–399. [Google Scholar] [CrossRef]
- Oreopoulos, G.D.; Wu, H.; Szaszi, K.; Fan, J.; Marshall, J.C.; Khadaroo, R.G.; He, R.; Kapus, A.; Rotstein, O.D. Hypertonic Preconditioning Prevents Hepatocellular Injury Following Ischemia/Reperfusion in Mice: A Role for Interleukin 10. Hepatology 2004, 40, 211–220. [Google Scholar] [CrossRef]
- Guimarães Filho, M.A.C.; Cortez, E.; Garcia-Souza, É.P.; Soares, V. de M.; Moura, A.S.; Carvalho, L.; Maya, M.C. de A.; Pitombo, M.B. Effect of Remote Ischemic Preconditioning in the Expression of IL-6 and IL-10 in a Rat Model of Liver Ischemia-Reperfusion Injury. Acta Cir Bras 2015, 30, 452–460. [Google Scholar] [CrossRef]
- Kaltenmeier, C.; Wang, R.; Popp, B.; Geller, D.; Tohme, S.; Yazdani, H.O. Role of Immuno-Inflammatory Signals in Liver Ischemia-Reperfusion Injury. Cells 2022, 11, 2222. [Google Scholar] [CrossRef]
- Prieto, I.; Monsalve, M. ROS Homeostasis, a Key Determinant in Liver Ischemic-Preconditioning. Redox Biol 2017, 12, 1020–1025. [Google Scholar] [CrossRef]
- Sánchez-Ramos, C.; Prieto, I.; Tierrez, A.; Laso, J.; Valdecantos, M.P.; Bartrons, R.; Roselló-Catafau, J.; Monsalve, M. PGC-1α Downregulation in Steatotic Liver Enhances Ischemia-Reperfusion Injury and Impairs Ischemic Preconditioning. Antioxid Redox Signal 2017, 27, 1332–1346. [Google Scholar] [CrossRef]
- Summermatter, S.; Handschin, C. PGC-1α and Exercise in the Control of Body Weight. Int J Obes 2012, 36, 1428–1435. [Google Scholar] [CrossRef]
- Fukai, M.; Hayashi, T.; Yokota, R.; Shimamura, T.; Suzuki, T.; Taniguchi, M.; Matsushita, M.; Furukawa, H.; Todo, S. Lipid Peroxidation during Ischemia Depends on Ischemia Time in Warm Ischemia and Reperfusion of Rat Liver. Free Radic Biol Med 2005, 38, 1372–1381. [Google Scholar] [CrossRef]
- Rüdiger, H.A.; Graf, R.; Clavien, P.-A. Sub-Lethal Oxidative Stress Triggers the Protective Effects of Ischemic Preconditioning in the Mouse Liver. J Hepatol 2003, 39, 972–977. [Google Scholar] [CrossRef]
- Hirao, H.; Nakamura, K.; Kupiec-Weglinski, J.W. Liver Ischaemia–Reperfusion Injury: A New Understanding of the Role of Innate Immunity. Nat Rev Gastroenterol Hepatol 2022, 19, 239–256. [Google Scholar] [CrossRef]
- Baskin-Bey, E.S.; Washburn, K.; Feng, S.; Oltersdorf, T.; Shapiro, D.; Huyghe, M.R.; Burgart, L.; Garrity-Park, M.; Van Vilsteren, F.G.I.; Oliver, L.K.; et al. Clinical Trial of the Pan-Caspase Inhibitor, IDN-6556, in Human Liver Preservation Injury. American Journal of Transplantation 2007, 7, 218–225. [Google Scholar] [CrossRef]
- Sindram, D.; Porte, R.J.; Hoffman, M.R.; Bentley, R.C.; Clavien, P. Platelets Induce Sinusoidal Endothelial Cell Apoptosis upon Reperfusion of the Cold Ischemic Rat Liver. Gastroenterology 2000, 118, 183–191. [Google Scholar] [CrossRef]
- Kuo, P.C.; Drachenberg, C.I.; de la Torre, A.; Bartlett, S.T.; Lim, J.W.; Plotkin, J.S.; Johnson, L.B. Apoptosis and Hepatic Allograft Reperfusion Injury. Clin Transplant 1998, 12, 219–223. [Google Scholar]
- PAROLIN, M.B.; REASON, I.J.M. Apoptose Como Mecanismo de Lesão Nas Doenças Hepatobiliares. Arq Gastroenterol 2001, 38, 138–144. [Google Scholar] [CrossRef]
- Zhu, Z.; Tang, Y.; Huang, S.; Zhao, Q.; Schroder, P.M.; Zhang, Z.; Zhang, Y.; Sun, C.; Wang, L.; Ju, W.; et al. Donor Liver Apoptosis Is Associated with Early Allograft Dysfunction and Decreased Short-Term Graft Survival after Liver Transplantation. Clin Transplant 2018, e13438. [Google Scholar] [CrossRef]
- Quireze, C.; de Souza Montero, E.F.; Leitão, R.M.C.; Juliano, Y.; Fagundes, D.J.; Poli-de-Figueiredo, L.F. Ischemic Preconditioning Prevents Apoptotic Cell Death and Necrosis in Early and Intermediate Phases of Liver Ischemia-Reperfusion Injury in Rats. Journal of Investigative Surgery 2006, 19, 229–236. [Google Scholar] [CrossRef]
- Zhang, Y.; Ye, Q.-F.; Lu, L.; Xu, X.-L.; Ming, Y.-Z.; Xiao, J.-S. Panax Notoginseng Saponins Preconditioning Protects Rat Liver Grafts from Ischemia/Reperfusion Injury via an Antiapoptotic Pathway. Hepatobiliary Pancreat Dis Int 2005, 4, 207–212. [Google Scholar]
- Mao, X.; Cai, Y.; Chen, Y.; Wang, Y.; Jiang, X.; Ye, L.; Li, S. Novel Targets and Therapeutic Strategies to Protect Against Hepatic Ischemia Reperfusion Injury. Front Med (Lausanne) 2022, 8. [Google Scholar] [CrossRef]
- Natori, S. The Caspase Inhibitor IDN-6556 Prevents Caspase Activation and Apoptosis in Sinusoidal Endothelial Cells during Liver Preservation Injury. Liver Transplantation 2003, 9, 278–284. [Google Scholar] [CrossRef]
- McCall, M.; Toso, C.; Emamaullee, J.; Pawlick, R.; Edgar, R.; Davis, J.; Maciver, A.; Kin, T.; Arch, R.; Shapiro, A.M.J. The Caspase Inhibitor IDN-6556 (PF3491390) Improves Marginal Mass Engraftment after Islet Transplantation in Mice. Surgery 2011, 150, 48–55. [Google Scholar] [CrossRef]
- Pockros, P.J.; Schiff, E.R.; Shiffman, M.L.; McHutchison, J.G.; Gish, R.G.; Afdhal, N.H.; Makhviladze, M.; Huyghe, M.; Hecht, D.; Oltersdorf, T.; et al. Oral IDN-6556, an Antiapoptotic Caspase Inhibitor, May Lower Aminotransferase Activity in Patients with Chronic Hepatitis C. Hepatology 2007, 46, 324–329. [Google Scholar] [CrossRef]
- Garcia-Tsao, G.; Fuchs, M.; Shiffman, M.; Borg, B.B.; Pyrsopoulos, N.; Shetty, K.; Gallegos-Orozco, J.F.; Reddy, K.R.; Feyssa, E.; Chan, J.L.; et al. Emricasan (IDN-6556) Lowers Portal Pressure in Patients With Compensated Cirrhosis and Severe Portal Hypertension. Hepatology 2019, 69, 717–728. [Google Scholar] [CrossRef]
- Bral, M.; Pawlick, R.; Marfil-Garza, B.; Dadheech, N.; Hefler, J.; Thiesen, A.; James Shapiro, A.M. Pan-Caspase Inhibitor F573 Mitigates Liver Ischemia Reperfusion Injury in a Murine Model. PLoS One 2019, 14. [Google Scholar] [CrossRef]
- Pepper, A.R.; Bruni, A.; Pawlick, R.; Wink, J.; Rafiei, Y.; Gala-Lopez, B.; Bral, M.; Abualhassan, N.; Kin, T.; Shapiro, A.M.J. Engraftment Site and Effectiveness of the Pan-Caspase Inhibitor F573 to Improve Engraftment in Mouse and Human Islet Transplantation in Mice. Transplantation 2017, 101, 2321–2329. [Google Scholar] [CrossRef]
- Ben-Ari, Z.; Hochhauser, E.; Burstein, I.; Papo, O.; Kaganovsky, E.; Krasnov, T.; Vamichkim, A.; Vidne, B.A. Role of Anti-Tumor Necrosis Factor-Alpha in Ischemia/Reperfusion Injury in Isolated Rat Liver in a Blood-Free Environment. Transplantation 2002, 73, 1875–1880. [Google Scholar] [CrossRef]
- Dhani, S.; Zhao, Y.; Zhivotovsky, B. A Long Way to Go: Caspase Inhibitors in Clinical Use. Cell Death Dis 2021, 12, 949. [Google Scholar] [CrossRef]
- Ghavami, S.; Shojaei, S.; Yeganeh, B.; Ande, S.R.; Jangamreddy, J.R.; Mehrpour, M.; Christoffersson, J.; Chaabane, W.; Moghadam, A.R.; Kashani, H.H.; et al. Autophagy and Apoptosis Dysfunction in Neurodegenerative Disorders. Prog Neurobiol 2014, 112, 24–49. [Google Scholar] [CrossRef]
- Sassmann-Schweda, A.; Singh, P.; Tang, C.; Wietelmann, A.; Wettschureck, N.; Offermanns, S. Increased Apoptosis and Browning of TAK1-Deficient Adipocytes Protects against Obesity. JCI Insight 2016, 1. [Google Scholar] [CrossRef]
- Pfeffer, C.; Singh, A. Apoptosis: A Target for Anticancer Therapy. Int J Mol Sci 2018, 19, 448. [Google Scholar] [CrossRef]
- Rani, M.; Rudhziah, S.; Ahmad, A.; Mohamed, N. Biopolymer Electrolyte Based on Derivatives of Cellulose from Kenaf Bast Fiber. Polymers (Basel) 2014, 6, 2371–2385. [Google Scholar] [CrossRef]
- Javanbakht, S.; Shaabani, A. Carboxymethyl Cellulose-Based Oral Delivery Systems. Int J Biol Macromol 2019, 133, 21–29. [Google Scholar] [CrossRef]
- Brai, B.; Adisa, R.; Odetola, A. Hepatoprotective Properties Of Aqueous Leaf Extract Of Persea Americana, Mill (Lauraceae) ‘Avocado’ Against Ccl4-Induced Damage In Rats. African Journal of Traditional, Complementary and Alternative Medicines 2014, 11, 237. [Google Scholar] [CrossRef]
- Iwasaki, W.; Kume, M.; Kudo, K.; Uchinami, H.; Kikuchi, I.; Nakagawa, Y.; Yoshioka, M.; Yamamoto, Y. Changes in the Fatty Acid Composition of the Liver with the Administration of N-3 Polyunsaturated Fatty Acids and the Effects on Warm Ischemia/Reperfusion Injury in the Rat Liver. Shock 2010, 33, 306–314. [Google Scholar] [CrossRef]
- Zúñiga, J.; Venegas, F.; Villarreal, M.; Núñez, D.; Chandía, M.; Valenzuela, R.; Tapia, G.; Varela, P.; Videla, L.A.; Fernández, V. Protection against in Vivo Liver Ischemia-Reperfusion Injury by n-3 Long-Chain Polyunsaturated Fatty Acids in the Rat. Free Radic Res 2010, 44, 854–863. [Google Scholar] [CrossRef]
- Miyauchi, T.; Uchida, Y.; Kadono, K.; Hirao, H.; Kawasoe, J.; Watanabe, T.; Ueda, S.; Jobara, K.; Kaido, T.; Okajima, H.; et al. Preventive Effect of Antioxidative Nutrient-Rich Enteral Diet Against Liver Ischemia and Reperfusion Injury. Journal of Parenteral and Enteral Nutrition 2019, 43, 133–144. [Google Scholar] [CrossRef] [PubMed]
- Rocha-Santos, V.; Figueira, E.R.; Rocha-Filho, J.A.; Coelho, A.M.; Pinheiro, R.S.; Bacchella, T.; Machado, M.C.; D’Albuquerque, L.A. Pentoxifylline Enhances the Protective Effects of Hypertonic Saline Solution on Liver Ischemia Reperfusion Injury through Inhibition of Oxidative Stress. Hepatobiliary & Pancreatic Diseases International 2015, 14, 194–200. [Google Scholar] [CrossRef]
- Figueira, E.R.R.; Bacchella, T.; Coelho, A.M.M.; Sampietre, S.N.; Molan, N.A.T.; Leitão, R.M.C.; Machado, M.C.C. Timing-Dependent Protection of Hypertonic Saline Solution Administration in Experimental Liver Ischemia/Reperfusion Injury. Surgery 2010, 147, 415–423. [Google Scholar] [CrossRef] [PubMed]
- Fernandes, D.C.; Gonçalves, R.C.; Laurindo, F.R.M. Measurement of Superoxide Production and NADPH Oxidase Activity by HPLC Analysis of Dihydroethidium Oxidation. In; 2017; pp. 233–249.
- Hong, Y.-L.; Yeh, S.-L.; Chang, C.-Y.; Hu, M.-L. Total Plasma Malondialdehyde Levels in 16 Taiwanese College Students Determined by Various Thiobarbituric Acid Tests and an Improved High-Performance Liquid Chromatography-Based Method. Clin Biochem 2000, 33, 619–625. [Google Scholar] [CrossRef] [PubMed]
- Gavrieli, Y.; Sherman, Y.; Ben-Sasson, S.A. Identification of Programmed Cell Death in Situ via Specific Labeling of Nuclear DNA Fragmentation. Journal of Cell Biology 1992, 119, 493–501. [Google Scholar] [CrossRef]
- Wijsman, J.H.; Jonker, R.R.; Keijzer, R.; van de Velde, C.J.; Cornelisse, C.J.; van Dierendonck, J.H. A New Method to Detect Apoptosis in Paraffin Sections: In Situ End-Labeling of Fragmented DNA. Journal of Histochemistry & Cytochemistry 1993, 41, 7–12. [Google Scholar] [CrossRef]
- Souza, P.; Rizzardi, F.; Noleto, G.; Atanazio, M.; Bianchi, O.; Parra, E.R.; Teodoro, W.R.; Carrasco, S.; Velosa, A.P.P.; Fernezlian, S.; et al. Refractory Remodeling of the Microenvironment by Abnormal Type V Collagen, Apoptosis, and Immune Response in Non-Small Cell Lung Cancer. Hum Pathol 2010, 41, 239–248. [Google Scholar] [CrossRef]



| Nutraceuticals | mg/kg | mg/ml | Amount (g) in 100 ml |
|---|---|---|---|
| Resveratrol | 2,96 | 0,74 | 0,074 |
| Quercetin | 3,56 | 0,89 | 0,0908 |
| Chelated selenium | 1,76 | 0,44 | 2,6831 |
| Omega-3 | 2,0 | 0,50 | 0,05 |
| Ginger extract | 3,24 | 0,81 | 0,081 |
| Avocado powder | 5,08 | 1,27 | 0,127 |
| Leucine | 4,44 | 1,11 | 0,111 |
| Nicotinamide | 20,0 | 5,0 | 0,5 |
| Antibody | Concentration | Brand | Code | Clone |
|---|---|---|---|---|
| Caspase 3 | 1:200 | Novocastra | NCL-CPP32 | - |
| TNF-α | 1:200 | Santa Cruz | sc-1348 | - |
Disclaimer/Publisher’s Note: The statements, opinions and data contained in all publications are solely those of the individual author(s) and contributor(s) and not of MDPI and/or the editor(s). MDPI and/or the editor(s) disclaim responsibility for any injury to people or property resulting from any ideas, methods, instructions or products referred to in the content. |
© 2023 by the authors. Licensee MDPI, Basel, Switzerland. This article is an open access article distributed under the terms and conditions of the Creative Commons Attribution (CC BY) license (https://creativecommons.org/licenses/by/4.0/).


