Preprint
Article

Droplet Digital PCR Development To Quantify the DNA Meth-Ylation Levels of SEPT9 and SHOX2 in Plasma From Patients With Head and Neck Squamous Cell Carcinoma

Altmetrics

Downloads

244

Views

101

Comments

0

Submitted:

05 May 2023

Posted:

06 May 2023

You are already at the latest version

Alerts
Abstract
Head and neck squamous cell carcinomas (HNSCCs) develop from the mucosa of the oral cavity, pharynx, and larynx. The methylation levels of Septin 9 (SEPT9) and short stature homeobox 2 (SHOX2) genes in ccfDNA are considered pan-cancer biomarkers and have shown prognostic value in preliminary reports in HNSCC. Liquid biopsy is a non-invasive procedure that collects tumor-derived molecules including circulating cell-free DNA (ccfDNA). Here, we developed a ddPCR-based assay to detect the DNA methylation levels of plasma circulating SEPT9 and SHOX2 in patients with HNSCC. We first set up the assay on commercial methylated and un-methylated DNA. Then, the dynamic changes of the methylation levels of SEPT9 and SHOX2 were quantified in 20 patients during the follow-up. The results highlighted: i) the capability of the ddPCR-based assay in detecting very low copies of methylated molecules; ii) the significant decrease in methylation levels of SEPT9 and SHOX2 in plasma of HNSCC patients at the first time points of follow-up respect to T0; iii) a different trend of longitudinally DNA methylation variations associable to the clinicopathological features of the patients. The absolute quantification of the methylation levels of SEPT9 and SHOX2 in HNSCC may be used for risk stratification and disease monitoring.
Keywords: 
Subject: Biology and Life Sciences  -   Biology and Biotechnology

1. Introduction

Head and neck squamous cell carcinoma (HNSCC) is a cancer of the squamous epithelium of the oral cavity, larynx, pharynx and nasal cavity. HNSCC is the seventh cause of human malignancy worldwide. The major risk factors for HNSCC are smoking, alcohol abuse, and infection by the human papillomavirus (HPV). The treatments of HNSCC include surgery, radiotherapy and chemotherapy. However, the prognosis of HNSCC is poor due to recurrent or metastatic HNSCC and in this case the curative options are very limited [1,2,3]. It is urgent to identify biomarkers that could help to improve patient outcome. The liquid biopsy is an important tool in molecular oncology because is an excellent source of biomolecules especially the circulating cell-free DNA (ccfDNA) released into the bloodstream by cell secretion or following apoptosis and necrosis [4,5]. Less than 1% of the ccfDNA is circulating tumor DNA (ctDNA) characterized by cancer hallmarks such as mutations or aberrant gene methylation and their detection can serve as molecular indicators for diagnosis, prognosis, and the identification of early recurrence [6]. Changes in DNA methylation profile are known to arise early during cancer development and the hypermethylation of the promoter region of tumor suppressor genes is involved in cancer onset and progression [7,8]. The DNA methylation is a stable covalent modification that can be detected in bio-fluids by PCR-based methods [9]. The DNA hypermethylation of SEPT9 and SHOX2 has been previously described in tissues as well as in ccfDNA from plasma of HNSCC patients by using qPCR assay [10]. Septin 9 (SEPT9), which belongs to the septin family and is involved in cytokinesis and cell cycle control, has been studied in many cancers including ovarian cancer, lung cancer, and colorectal carcinoma. As a tumor suppressor gene, the higher methylated level of SEPT9 inhibits gene expression and promotes cancer progression [11]. The hypermethylation of the short stature homeobox 2 (SHOX2) gene has been found in various malignancies [12,13]. Circulating SHOX2 and SEPT9 hypermethylation was detected also in different human cancers and they are considered promising circulating tumor liquid biopsy biomarkers [14]. Two commercial kits based on the quantification of the DNA methylation levels on selected genes in plasma ccfDNA are used in clinics for the diagnosis of the colorectal cancer named “Epi proColon” (methylation of septin 9 gene, SEPT9) [15] and of lung cancer named “EpiproLung” (methylation of Prostaglandin E Receptor 4 and short stature homeobox 2 genes; PTGER4 and SHOX2) [16]. More recently, a methylation-based plasma kit for the analysis of multiple genes has been validated for the diagnosis of the lung cancer (lung EpiCheck) [17]. Methods used to detect DNA methylation are usually based on qPCR. It is known that the commonly used Bio-Rad ddPCR technology provides greater sensitivity and absolute quantification of the template than conventional qPCR system. The target templates are partitioned into 20,000 water-in-oil droplets made by the “generator” each of them represents a nano-sized PCR environment. The PCR-positive and PCR-negative droplets are automatically counted by the “reader” to provide absolute quantification of target DNA in digital form [18,19]. To our knowledge, epigenetic studies in liquid biopsy from HNSCC patients using ddPCR are still very limited and the SEPT9 and SHOX2 methylation analysis by ddPCR is lacking [20]. Due to its importance for clinical implication, we developed here a ddPCR based-assay for the absolute quantification of SEPT9 and SHOX2 methylation levels in ccfDNA. In details, we analyzed SEPT9 and SHOX2 methylation in plasma from 20 HNSCC patients before the curative treatment (T0), as a preliminary activity of a larger project for liquid biopsy in HNSCC (“Identify” project); and we also performed a quantitative longitudinal methylation analysis during different time-points of follow up of the same patients with intervals of 3 months (T1, T2, T3) to verify whether methylated SHOX2 and SEPT9 may be reliable biomarkers to monitor the response to the treatment.

2. Results

2.1. Establishing the efficiency of MS-ddPCR assays for the detection of SEPT9 DNA methylation

In the present study, we developed two multiplex assays for measuring the methylation levels of SEPT9 and SHOX2 using ddPCR technology, defined as methylation-specific ddPCR (MS-ddPCR). MS-ddPCR for SEPT9 consisted of: i) a TaqMan probe-based assay designed with FAM reporter to detect the methylated bisulfite-converted DNA (SEPT9-M); ii) a TaqMan probe-based assay with HEX reporter to detect the unmethylated bisulfite-converted DNA (SEPT9-U) (Figure 1A). The sensitivity and specificity of the assays were tested using commercial methylated DNA and unmethylated DNA after bisulfite conversion. The 2-dimensional (2D) amplitude plot showed that SEPT9-M set detected only the methylated template (Figure 1B, positive droplets in blue, left) and on the contrary SEPT9-U set detected only the unmethylated template (Figure 1B, positive droplets in green, right) in multiplex ddPCR experiments. Next, we evaluated the performance of the MS-ddPCR assay by considering its ability to detect the SEPT9 DNA methylation levels in samples with low amounts of DNA input as well as in the presence of unmethylated DNA background. The MS-ddPCR for SEPT9 displayed dose-dependent trend and the methylation level was detectable by using a starting input of commercial bisulfite-treated DNA as low as 78.125 pg (Figure 1C). To assess the ability of the assay to detect methylated SEPT9 molecules in unmethylated DNA background, we diluted the methylated DNA with unmethylated DNA at different percentages (99%, 90%, 70%, 50%, 30%, 10%, 1%) and multiplex MS-ddPCR was performed on 20 ng of the bisulfite-treated DNA mixtures. The concentration of methylated target (copies/μl, in blue) and the concentration of unmethylated target (copies/μl, in green) decreased and increased respectively according to the percentage of methylated DNA. SEPT9-M and SEPT9-U assays were able to detect up to 1% of methylated SEPT9 and unmethylated SEPT9 resulting in a concentration of 0.14 copies/μl and 1.5 copies/μl, respectively (Figure 1D). The level of methylated SEPT9 (%) was calculated as described in the materials and methods section. The standard curve demonstrated the good linearity between the level of methylated SEPT9 (expressed as percentage, %) and the percentage of commercial bisulfite-treated methylated DNA loaded in each reaction (R2=0.92; Figure 1E).

2.2 Establishing the efficiency of MS-ddPCR assays for the detection of SHOX2 DNA methylation

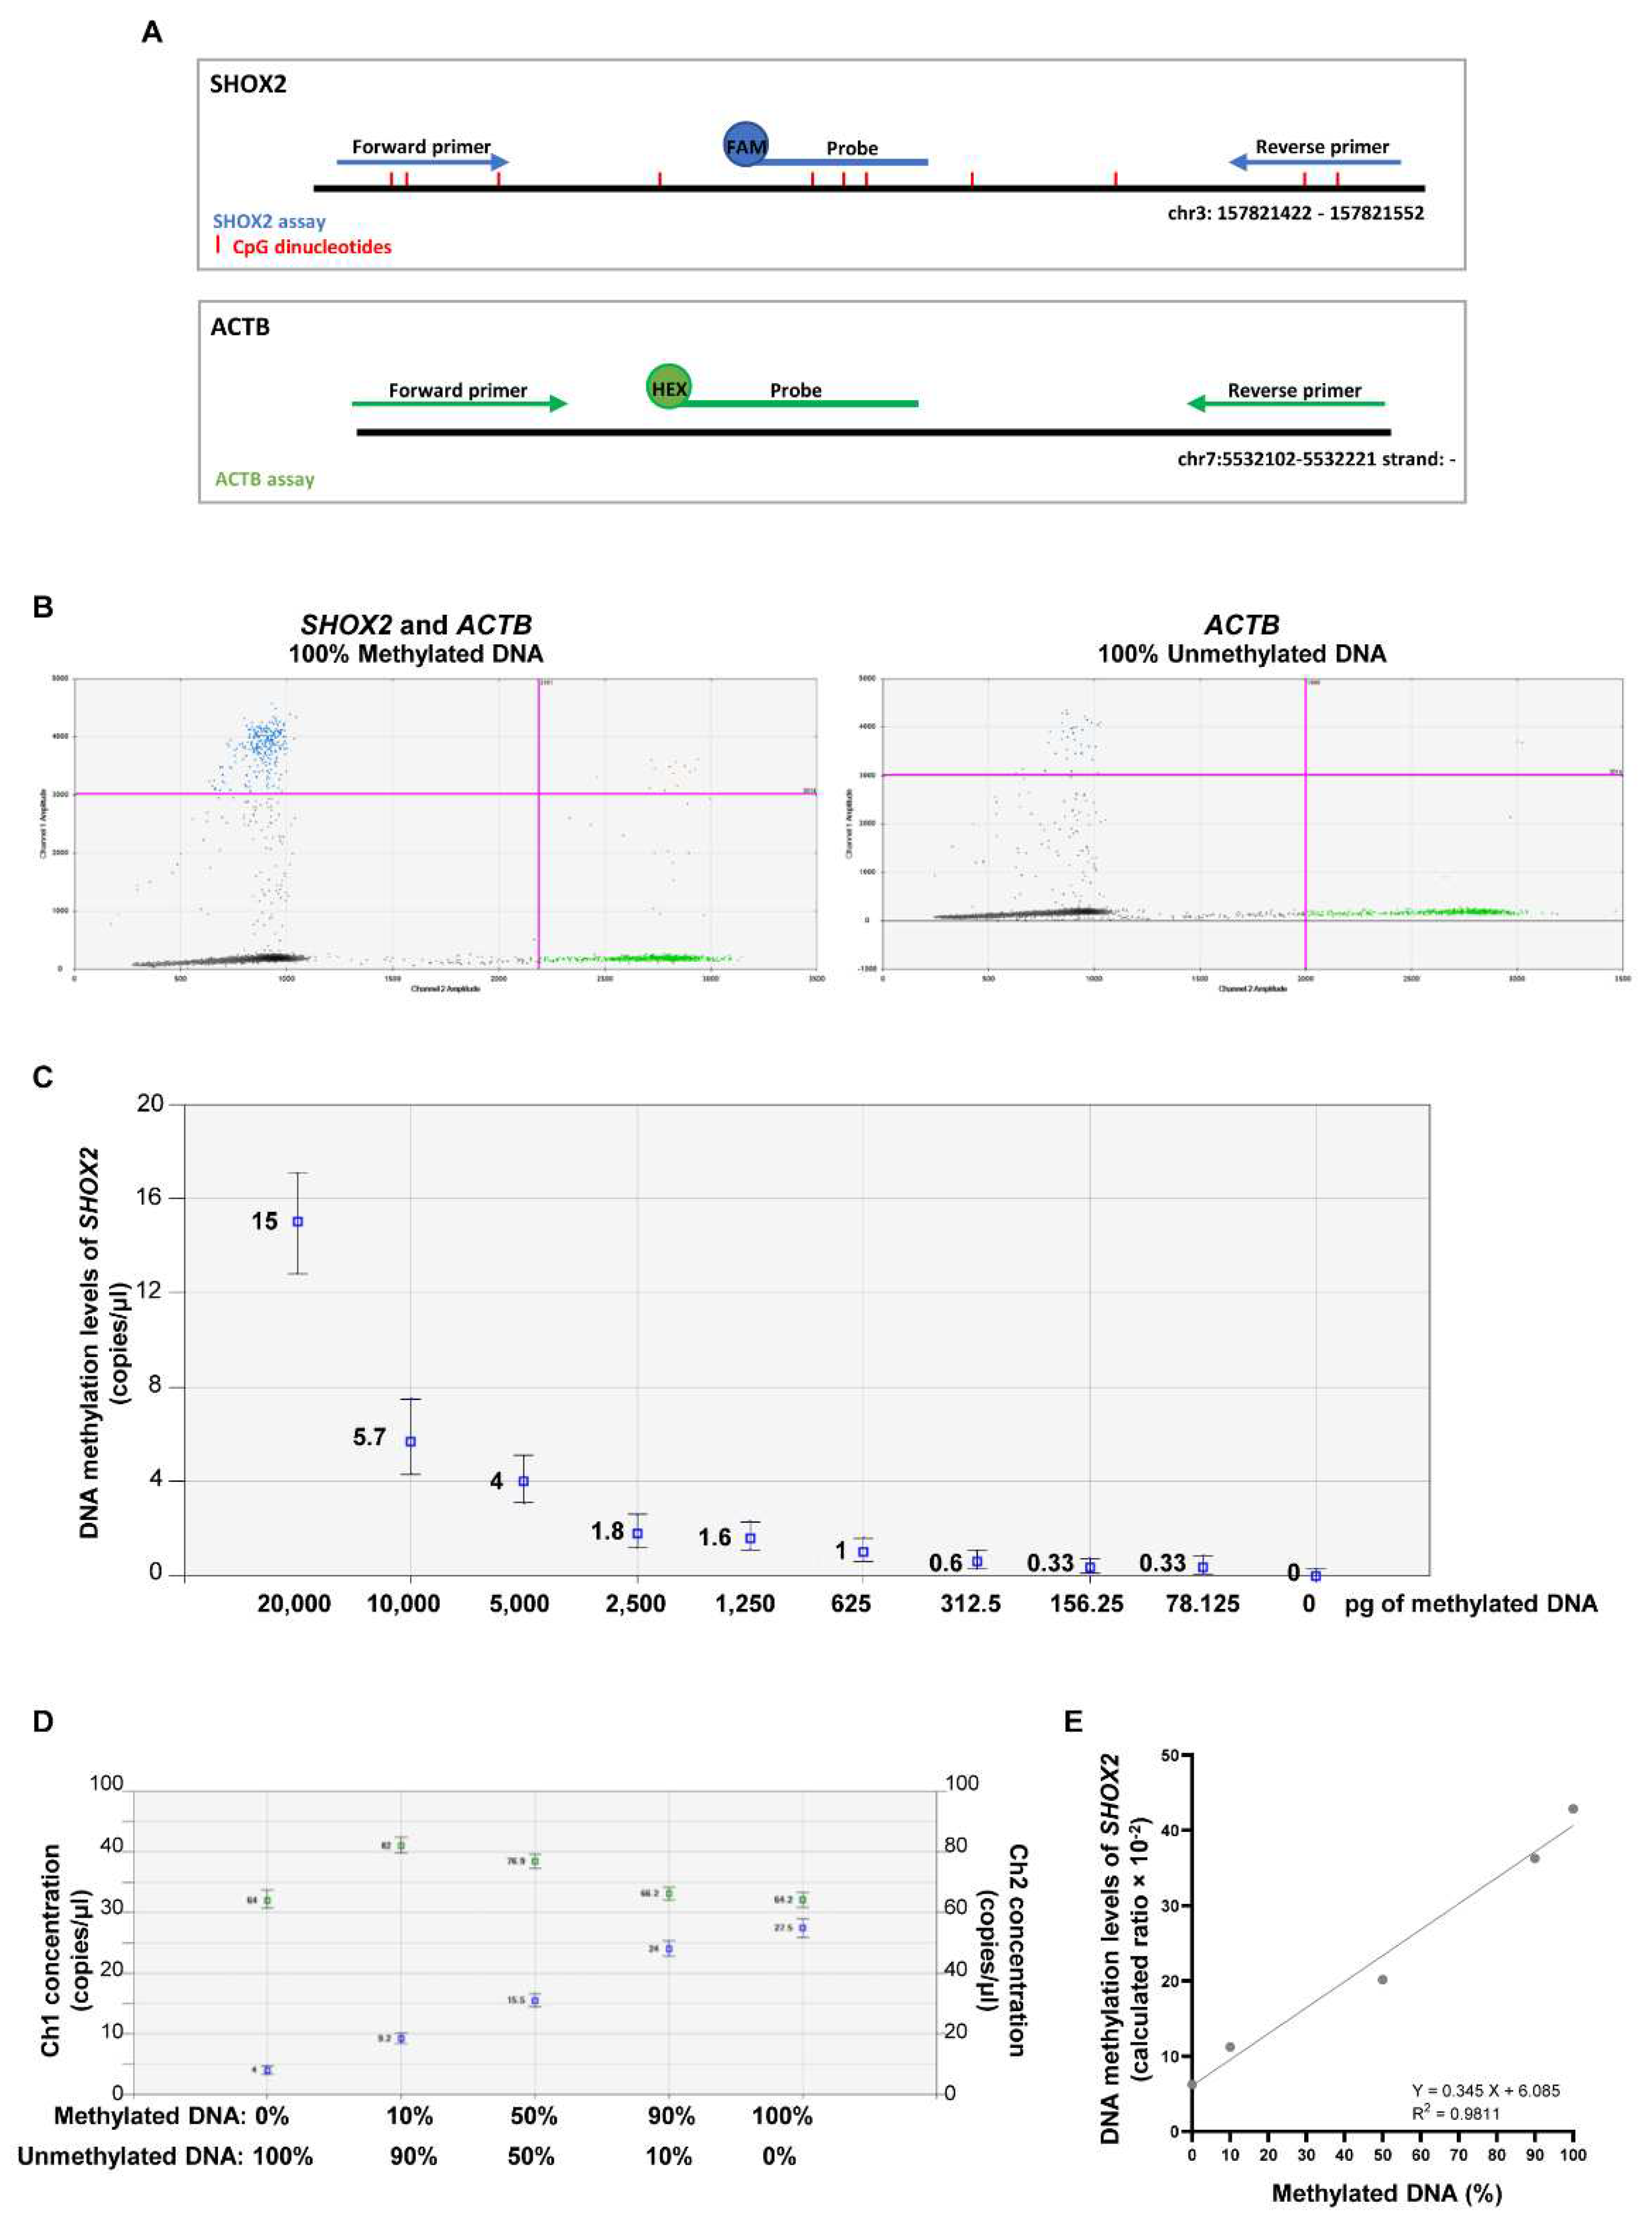
MS-ddPCR for SHOX2 consisted of: i) a TaqMan probe-based assay labelled with FAM for methylated SHOX2; ii) a TaqMan probe-based assay labelled with HEX for a region without CpGs of the ACTB gene (Figure 2A). The specificity of SHOX2 assays was tested by following the procedures described for SEPT9. Briefly, only methylated DNA treated with bisulfite resulted amplified by using the SHOX2 assay (Figure 2B, positive droplets in blue). As expected, the ACTB assay amplified methylated as well as unmethylated DNA (Figure 2B, positive droplets in green). The MS-ddPCR assay for SHOX2 displayed dose-dependent trend and it was able to detect methylated SHOX2 as low as 78.125 pg of commercial bisulfite-treated DNA (Figure 2C). The concentration of ACTB (copies/μl, in green) remained quite stable, meanwhile the concentration of methylated SHOX2 (copies/μl, in blue) increased accordingly to the percentage of the methylated DNA input with good linearity (R2=0.98; Figure 2D-E).

2.3 Methylation levels of SEPT9 and SHOX2 in ccfDNA from plasma of HNSCC patients

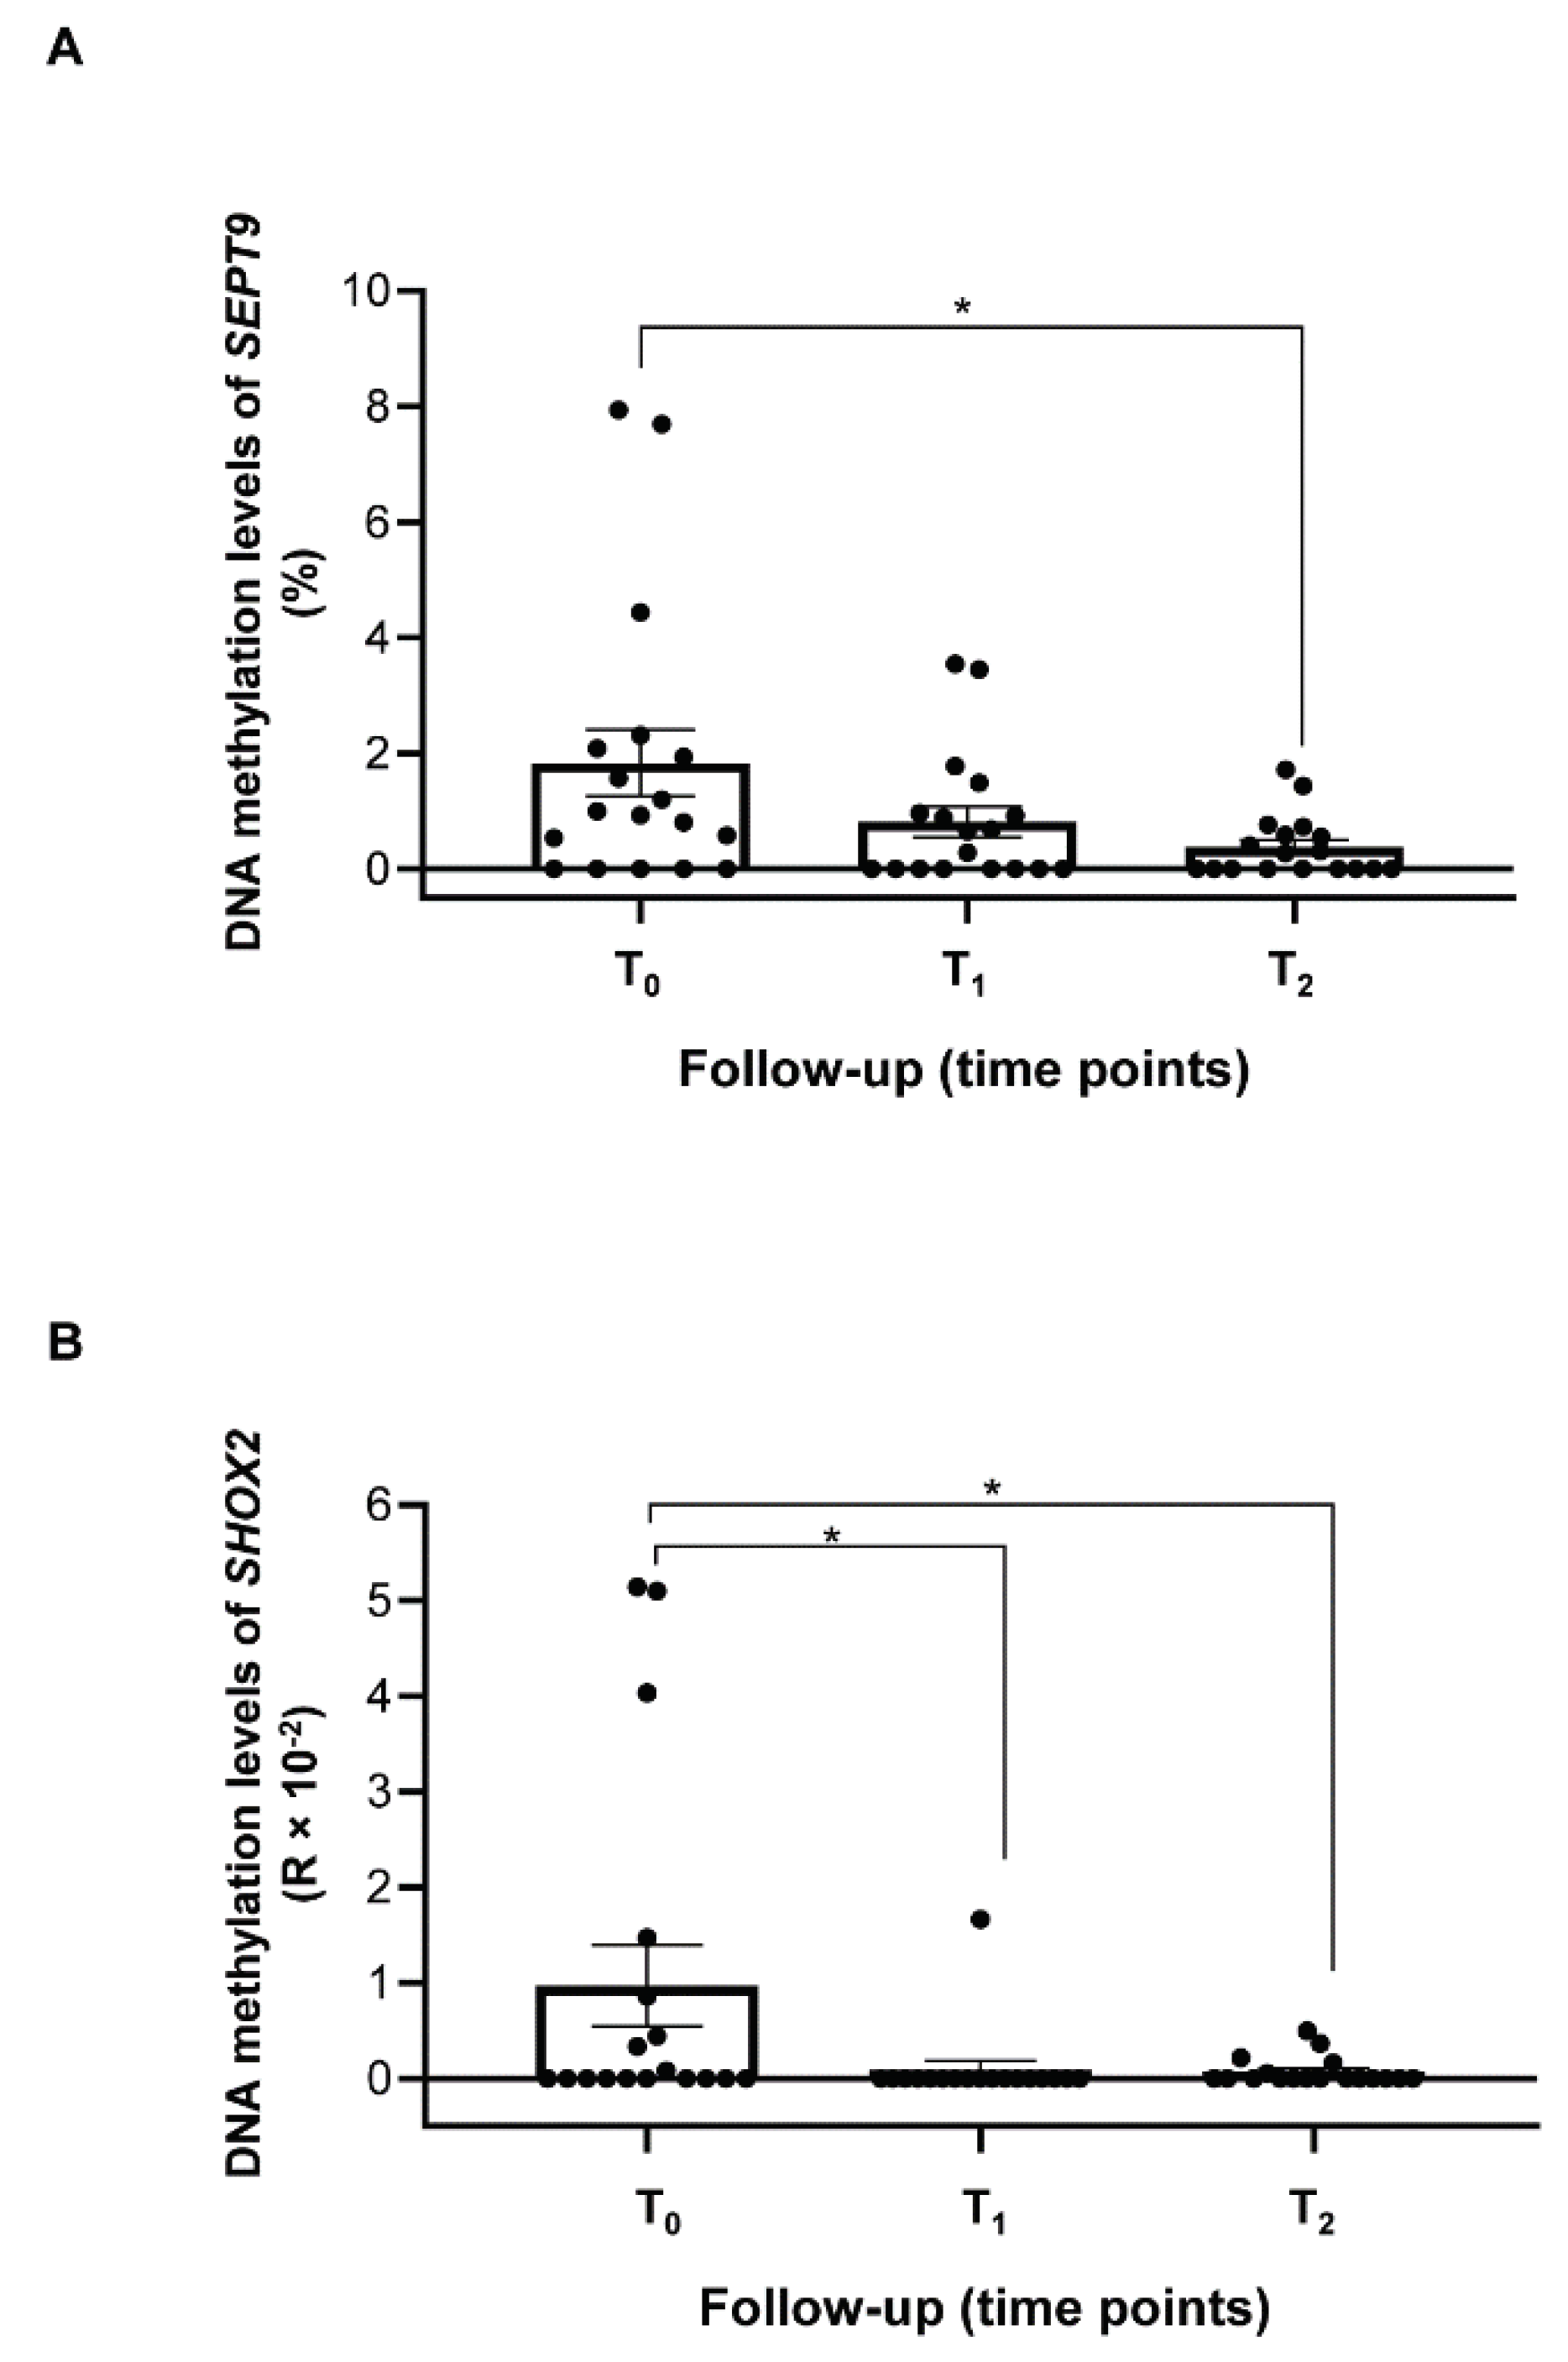
By using the MS-ddPCR technology, we measured the methylation levels of SEPT9 and SHOX2 in plasma from 20 patients with HNSCC. In order to verify whether the treatment may influence the methylation levels of these genes in ccfDNA, we analyzed the SEPT9 and SHOX2 methylation levels in plasma from each patient before the treatment (T0) and at 3-months intervals during the follow-up (T1=3 months after treatment; T2=6 months after treatment). The results are reported for the patients with 3 time points of follow-up (n=18; BS008 and BS014 were excluded). As reported in Figure 3A, the methylation of SEPT9 was detectable in 13 (72%) patients before the treatment (T0). Interestingly, the mean methylation level of SEPT9 decreased during the follow-up showing a strong reduction at T1 (fold change of 0.4 versus T0) and a significant drop at 6 months after the treatment (T2) (p < 0.05, fold change of 0.2 versus T0). Eight (44%) patients displayed SHOX2 methylation in ccfDNA at T0 and we obtained a significant decrease of the mean methylation levels of SHOX2 at T1 and T2 time-points of the follow-up (Figure 3B; p < 0.05, fold change of 0.09 and 0.07 respectively). Of these 8 patients, 5 showed a concomitant SEPT9 methylation in ccfDNA at T0.

2.4 Longitudinal variations of methylated SEPT9 and SHOX2 in ccfDNA from plasma of HNSCC patients

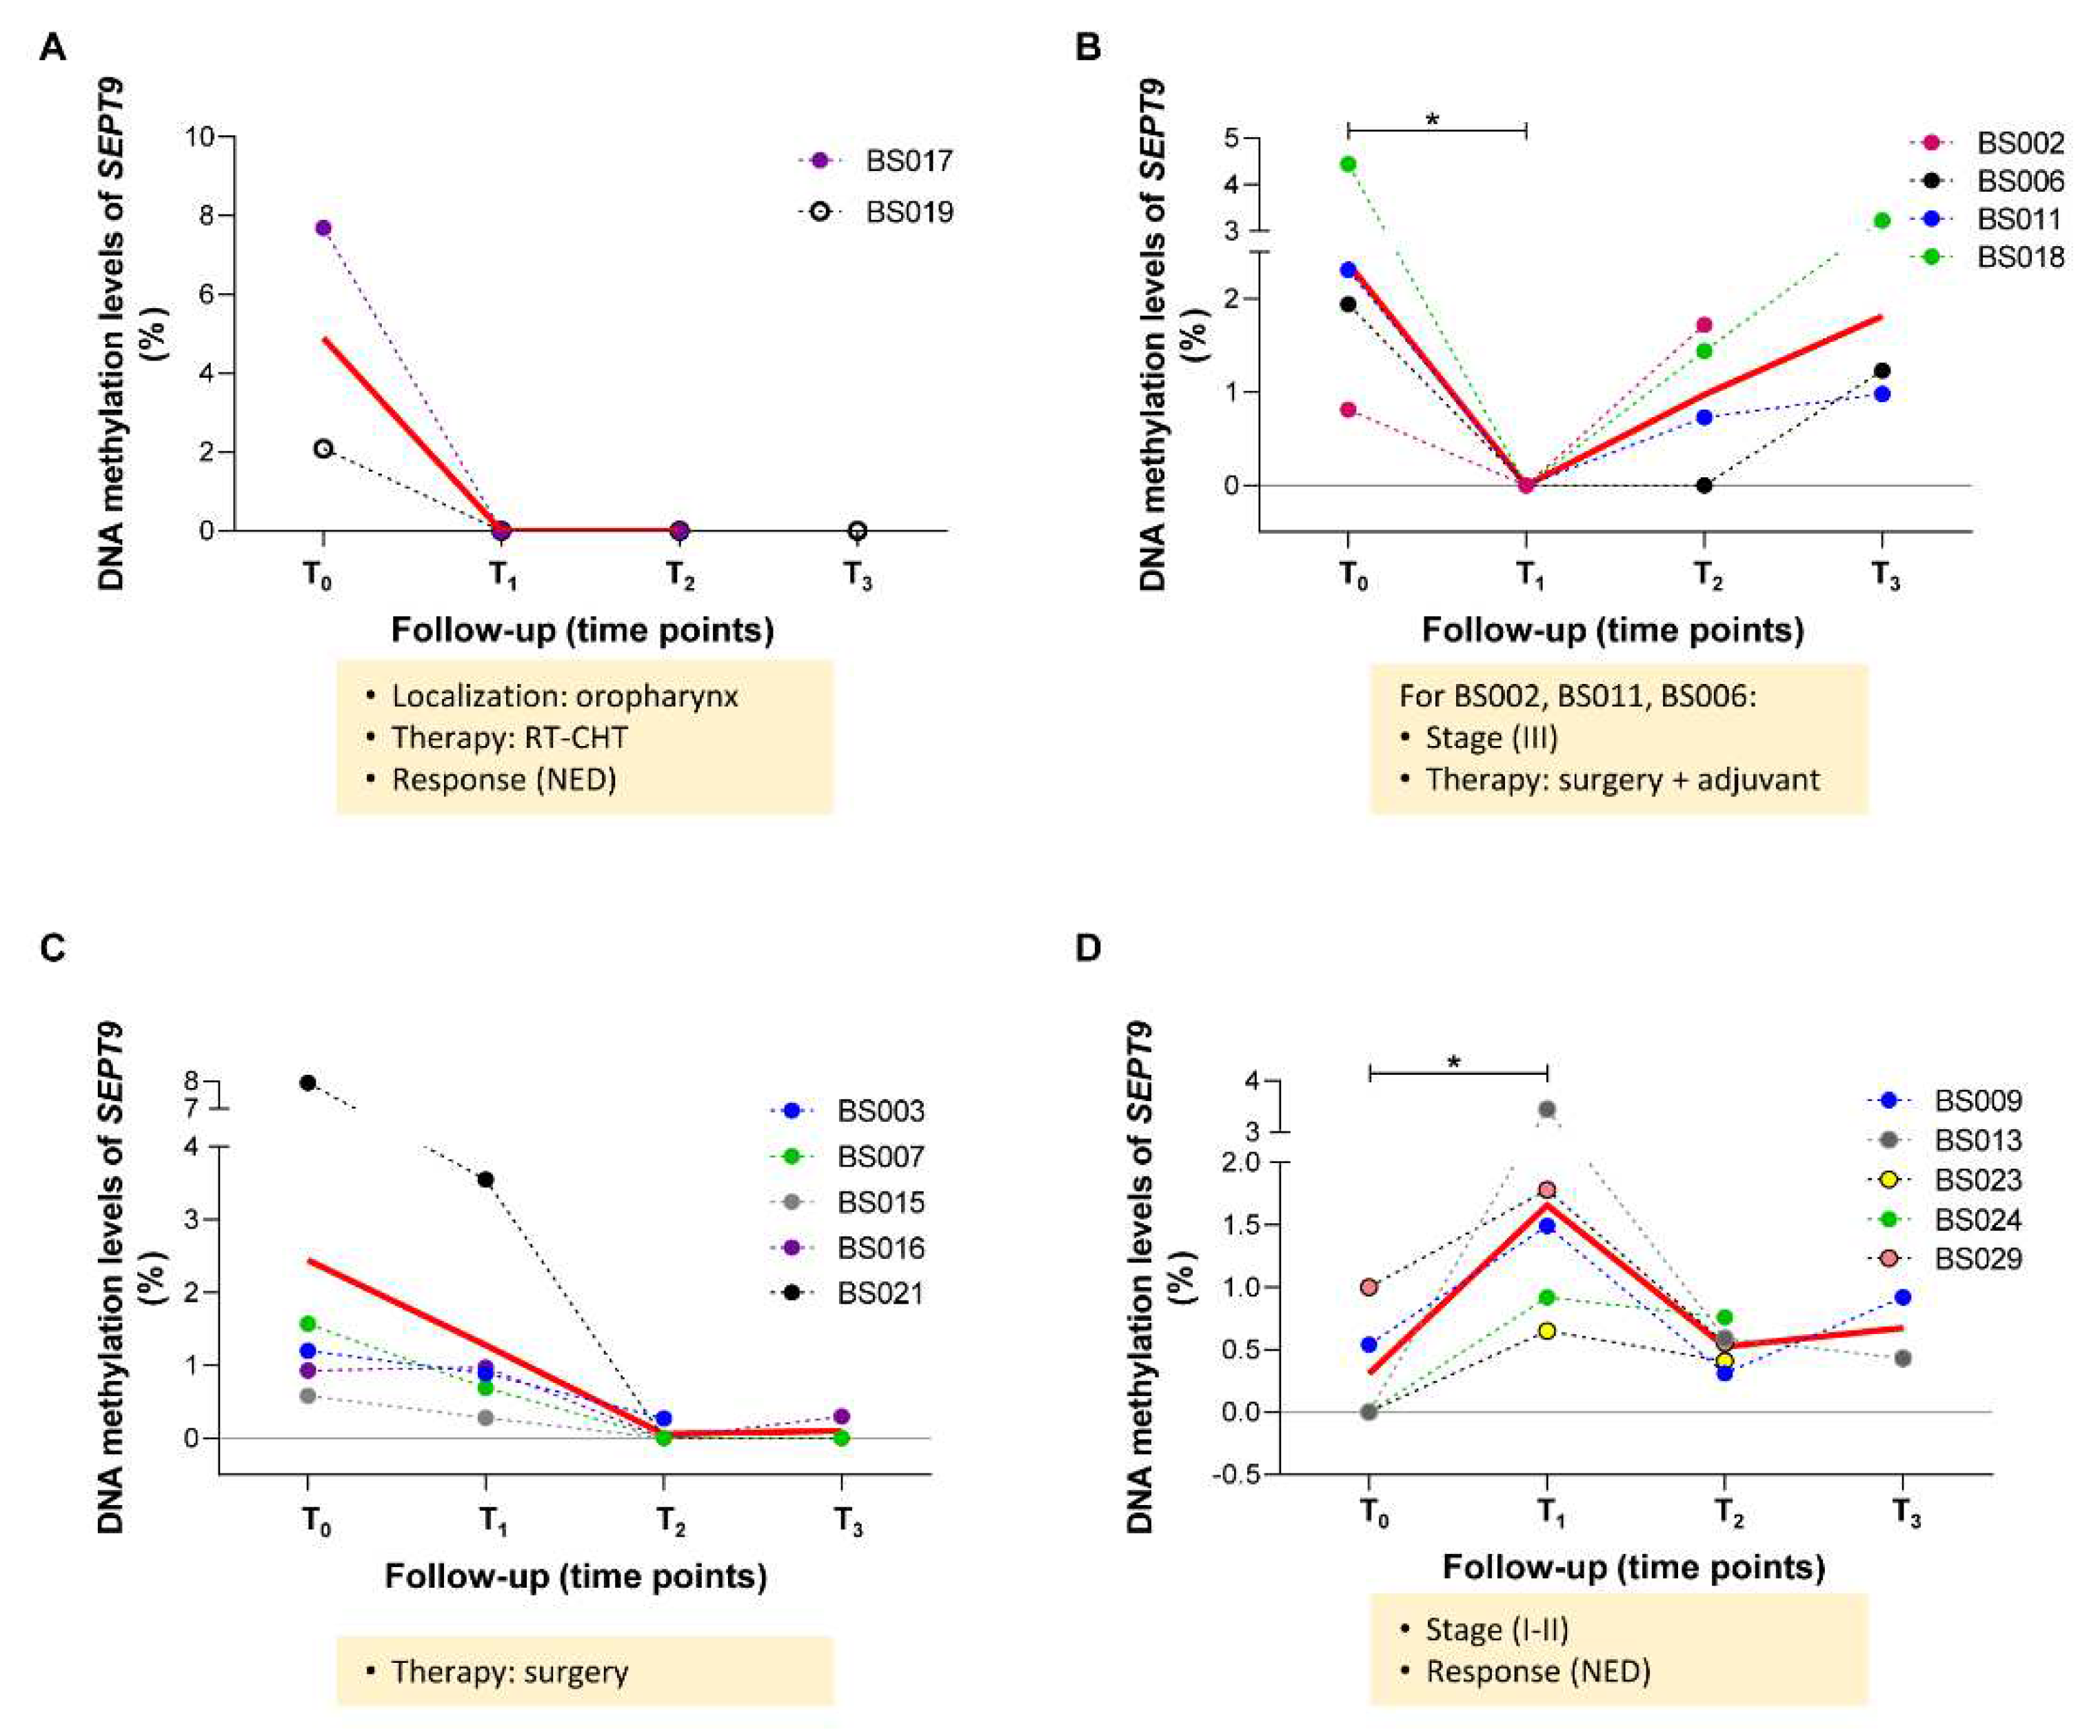
Among the 18 patients followed-up longitudinally, 10 reached the time point of 12 months after the treatment (T3) at the time of writing the manuscript. For the SEPT9 analysis, 2 out of 18 patients were not included because of the undetectable methylation levels in all the time points. By monitoring the longitudinal methylation levels of SEPT9, we depicted four different trends of variation. As reported in Figure 4 (A-B), 6 patients showed a drop to 0% of methylated SEPT9 in plasma at the first time-point post-treatment (T1). Among these, for 2 patients the methylation levels remained unchanged at the following available time points (Figure 4A), but in the remaining patients the methylation levels increased at T2 (BS002, BS011, BS018) or T3 (BS006) (Figure 4B). Five patients exhibited a decrease of SEPT9 methylation levels at T2 (Figure 4C). On the contrary, we obtained a significant rising trend of SEPT9 methylation levels in 5 patients at the first time-point post-treatment, then at T2, the SEPT9 methylation levels decreased (p<0.05; Figure 4D). In order to disclose a potential relation between the methylation levels of plasmatic SEPT9 and the treatment response, we divided all patients on the basis of the status of disease: not evidence of disease (NED), n=13 for each time points of follow-up; and patients with progressive disease (PD), n=6 patients at T0 and n=4 at T1 and T2. By considering the average methylation level of SEPT9, a significant decrease was found at T2 in the group of disease-free patients versus T0; conversely, no variations were observed in the PD group (Figure S1 A).
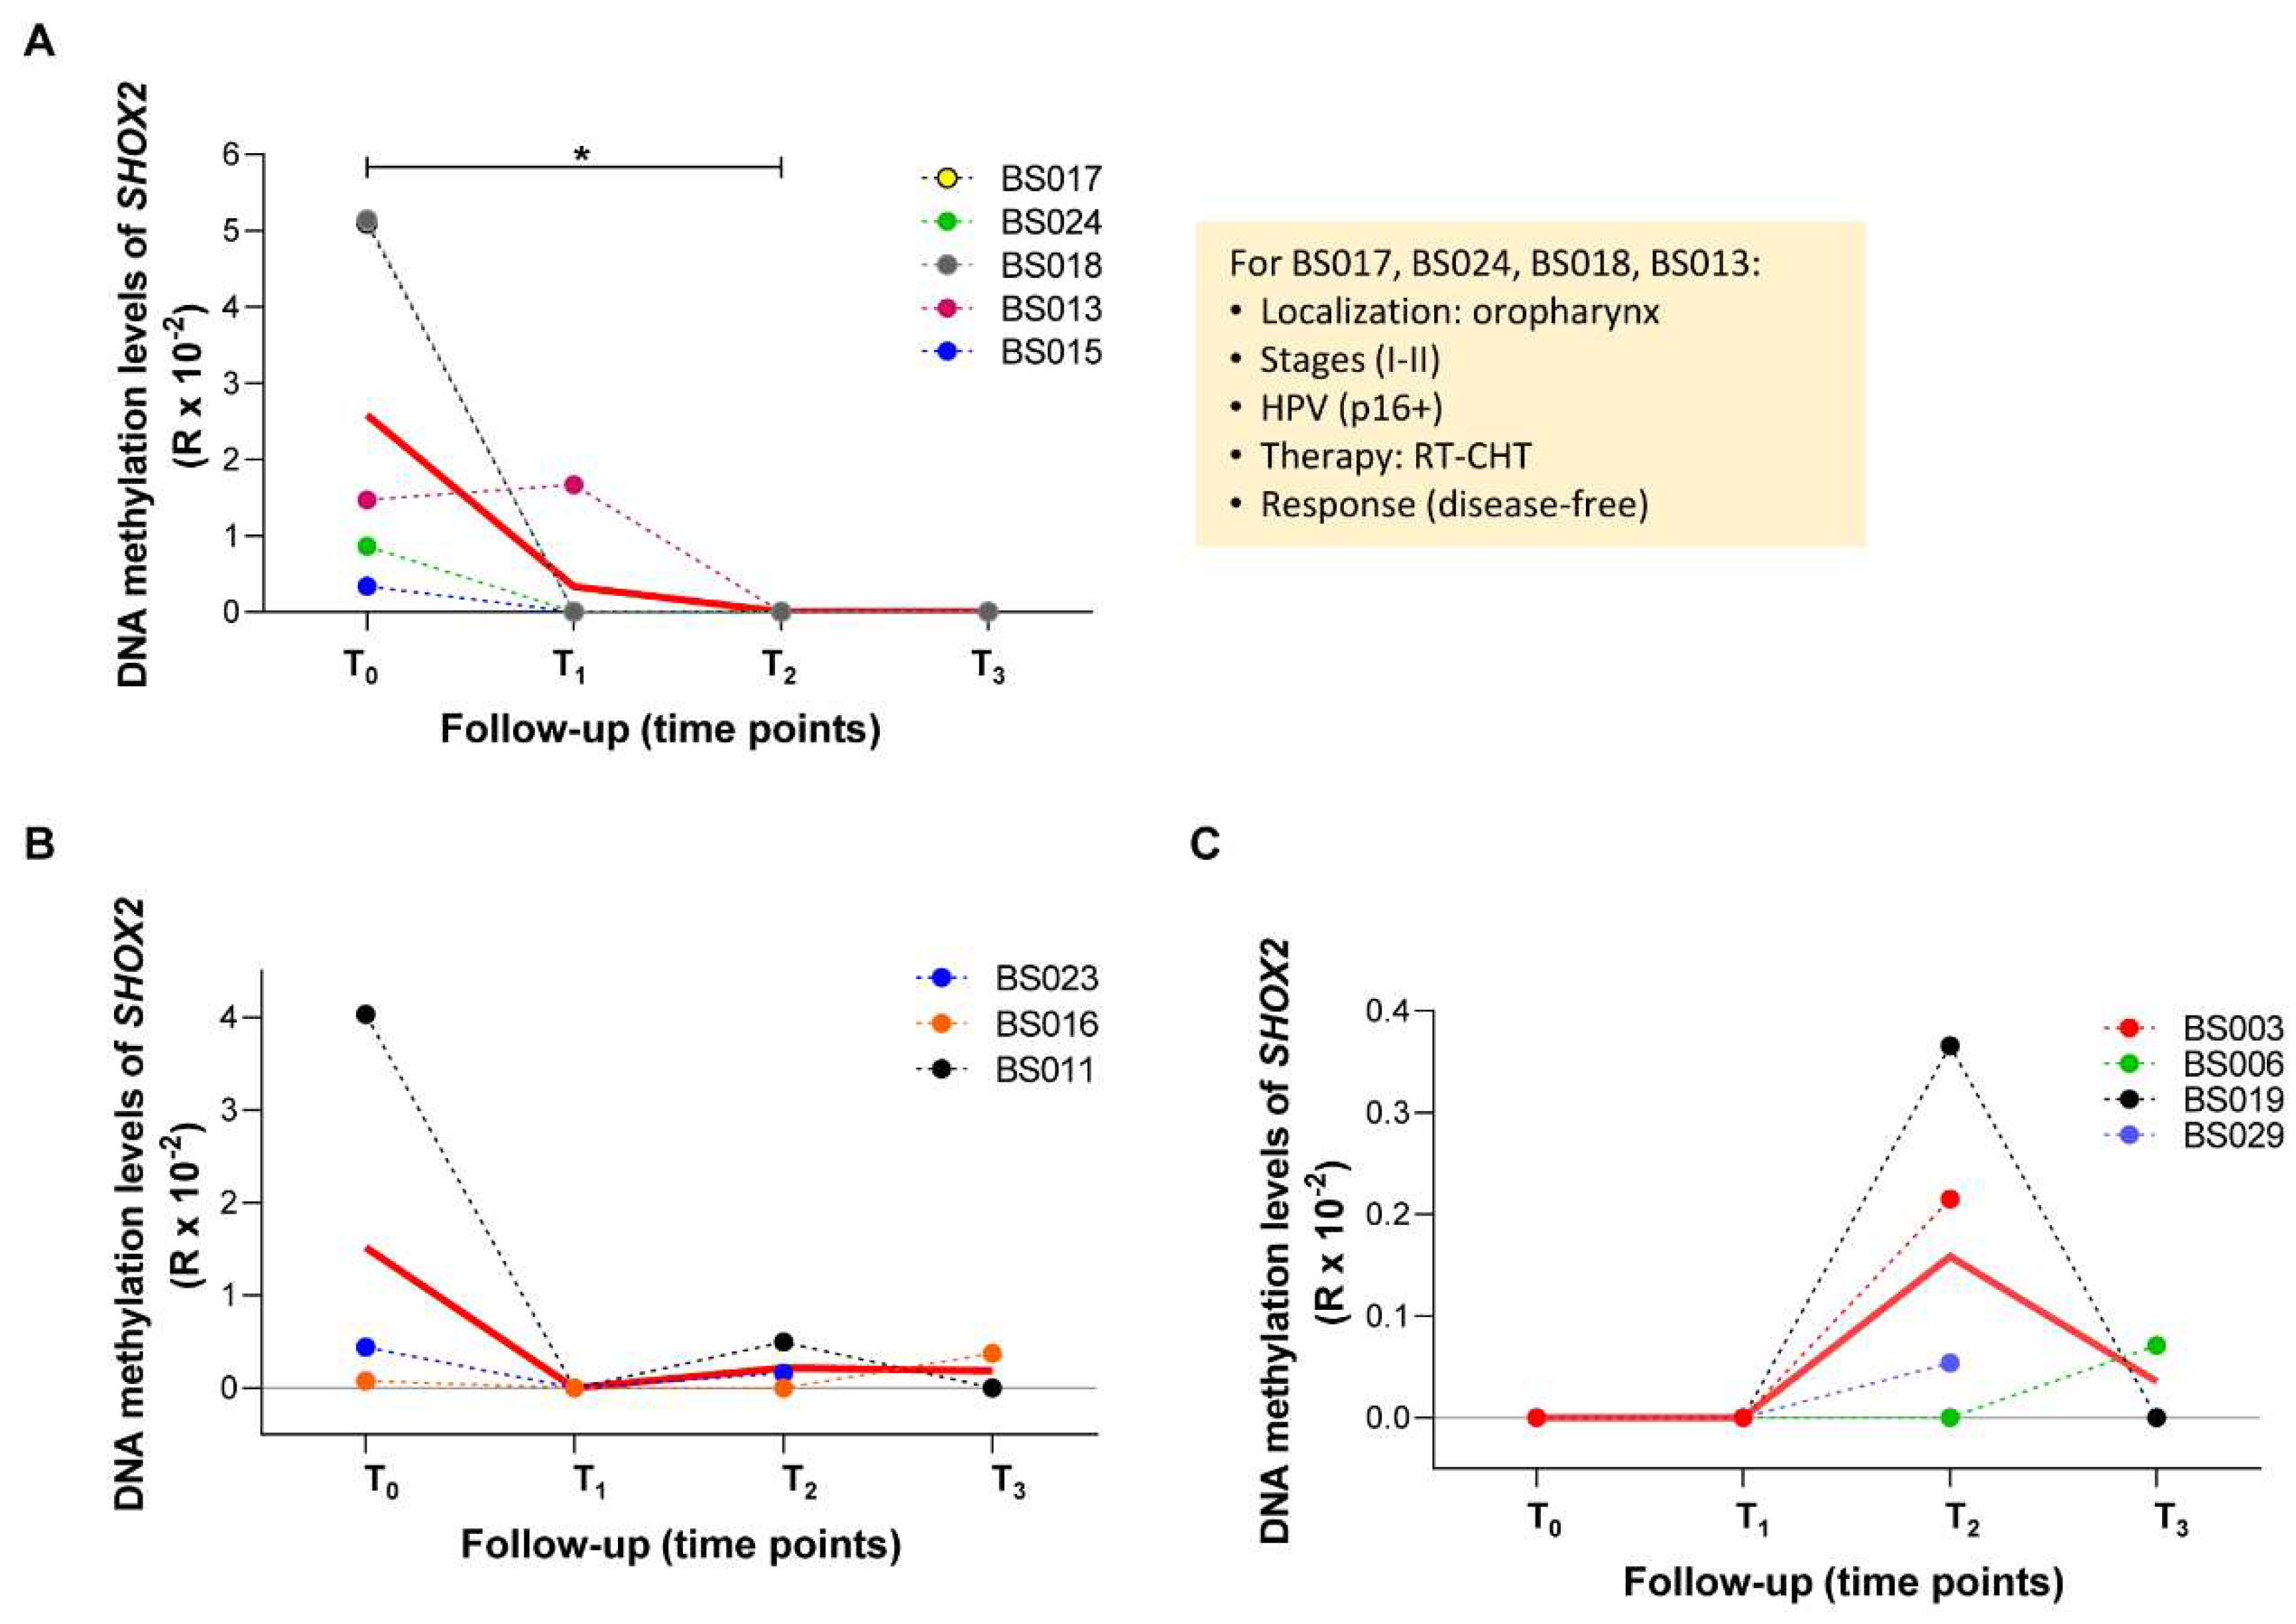
For SHOX2 analysis, we excluded 6 patients out of 18 because of undetectable methylation levels in all the time points. In the remaining patients, we observed three different longitudinal trends during the follow-up (Figure 5). In details, 5 patients displayed a high methylation level of SHOX2 before the treatment followed by a drop at T1 (or T2 for BS013); the methylation levels remained undetectable at the following time points (BS015, BS017, BS018, BS024) (p<0.05 T0 versus T2; Figure 5A). Three patients showed different methylation levels of SHOX2 at T0 followed by a drop to undetectable level at T1 and a slightly increase at T2 (BS011 and BS023) or T3 (BS016) (Figure 5B). Finally, we found that the methylation levels of SHOX2 were absent at T0 and T1 in 4 patients, but it rose at T2 (BS003, BS019, BS029) and at T3 (BS006) (Figure 5C). In addition, it dropped to undetectable level in BS019 patient at 12 months of follow-up (T3) (Figure 5C). Regarding the treatment response of HNSCC patients, no significant variations were found in SHOX2 methylation level among the different time points of follow-up in NED and PD groups (Figure S1 B).

3. Discussion

The liquid biopsy, as a minimally invasive procedure, has been widely used in molecular oncology to collect circulating tumor cells (CTCs), extracellular vesicles (EVs) and circulating tumor DNA (ctDNA) released when the cells die via apoptosis, necrosis, ferroptosis, senescence or active secretion [23]. The methylation levels of SEPT9 and SHOX2 in circulating cell-free DNA (ccfDNA) are considered biomarkers of diagnosis, staging and prognosis for head and neck squamous cell carcinoma (HNSCC) as well as for other malignancies [10,24,25]. It has been demonstrated that the circulating levels of methylated SEPT9 and SHOX2 correlated with some clinico-pathological features of HNSCC patients such as tumor and nodal category, and high methylation levels were associated with a higher risk of death [10]. ccfDNA concentration varies ranging from 1-15 ng/ml plasma in healthy individuals to 100 ng/ml plasma in cancer patients. The total amount of ctDNA can also be less than 1% of total ccfDNA [26] and these low concentrations make the detection challenging. The accurate and precise quantification of the genomic alterations with prognostic and predictive values may be of great importance for clinical management. For this reason, we considered useful and innovative the development of a ddPCR based-assay with the aim to improve the detection of the circulating levels of the methylated SEPT9 and SHOX2 in plasma from patients with HNSCC. In this study, we combined the methylation-specific assay to the ddPCR technology (MS-ddPCR or MethyLight ddPCR) that has a high detection sensitivity and allows the absolute quantification of the target template in a very low concentration [27,28]. In general, for liquid biopsy, there are still few data on the levels of DNA methylated molecules of cancer-associated genes using ddPCR. Here, we report for the first time the use of ddPCR to quantify the plasma amount of methylated SEPT9 and SHOX2 in HNSCC.
By using a set of commercial fully methylated and non-methylated DNA, we were able to detect up to 78 pg of methylated DNA and we quantified up to 1% of methylated DNA in a background of non-methylated DNA. As mentioned above, this amount and the relative percentages may reflect those detected in circulation.
We then tested the ddPCR assay on a discovery cohort of 18 HNSCC patients to determine the methylation levels of SEPT9 and SHOX2 in plasma before the start of the therapies and during the monitoring of the treatment response at 3 different time points of follow-up. At the time of the writing this manuscript, we collected plasma samples up to 1 year (T3) from the end of the treatment (surgical resection of the tumor, chemotherapy, radiotherapy) with intervals of 3 months. Most patients are still under surveillance, and we will proceed with methylation analysis at the available follow-up times.
We found a significant reduction of the mean methylation plasma levels of SEPT9 and SHOX2 in patients at T2 (SEPT9) and T1-T2 (SHOX2) monitoring times, that is 3 (T1) and 6 (T2) months after the end of the treatment. In this context, Bergheim et al. demonstrated that post-therapeutic SHOX2 and SEPT9 methylation ccfDNA showed a trend towards decreased levels in colorectal cancer patients with localized disease and no decrease in patients with distant metastases [25]. According to Krausewitz et al., the high levels of SEPT9 and SHOX2 methylation characterized patients with metastatic disease in prostate cancer [29]. In HNSCC, the baseline positivity of SEPT9 and SHOX2 methylation in plasma was found in 15 patients (15/20, 75%) and the methylation levels were used to monitor the responses to treatment in 6 patients finding a decrease under systemic therapy [24]. The significant decrease of the mean methylation levels of SEPT9 and SHOX2 that we found in the discovery cohort may be due to the positive effects of the treatments, being all the patients except 1 (BS002) (n=17) disease-free at the monitoring time T2. This encourages extending the analysis to a larger number of patients to confirm these findings.
Interestingly, we observed 4 different trends of SEPT9 methylation levels by representing the data according to the longitudinal quantification for each patient during surveillance. Among them, we detected a significant decrease of SEPT9 methylation levels at the monitoring time T1 in a group of 4 patients (3 out of 4 with tumor stage T3 and all 3 underwent to surgical resection and adjuvant therapy). A significant increase of SEPT9 methylation levels at the monitoring time T1 compared to T0 followed by a drastic decrease at T2 was found in 5 patients with tumor stages T1-T2 and without evidence of tumor progression at least until the monitoring time T3. For SHOX2, a group of 5 patients displayed a significant decrease of the methylation levels at the surveillance time T2 compared to T0, and 4 patients out of 5 had the same clinico-pathological features in terms of tumor localization (oropharynx), tumor stage (T1-T2), HPV p16 infection, type of treatment (chemotherapy and radiotherapy) and response (NED).
We think that the preliminary results obtained from the longitudinally absolute quantification of the methylated SEPT9 and SHOX2 are promising and constitute important premises to continue the surveillance and to measure the circulating methylation levels during the follow-up. At the moment, at least to our knowledge, only 3 studies evaluated the impact of both SEPT9 and SHOX2 in post-therapeutic surveillance and as biomarkers of prognosis and early diagnosis of tumor recurrence in HNSCC. Schrock et al. correlated the SEPT9 and SHOX2 methylation levels determined by qPCR to diagnosis, prognosis, staging and monitoring of HNSCC patients [10]. de Vos et al. evaluated the impact of SEPT9 and SHOX2 DNA methylation in the diagnosis of HNSCC and in the treatment response assessing relative and quantitative determinations by qPCR [14,24].
We believe that the use of ddPCR to detect small amounts of circulating methylated SEPT9 and SHOX2 as well as the monitoring of their dynamic changes at pre-established multiple times during the clinic surveillance are novel advancements in HNSCC with translational potential in clinical routine.
In conclusion, the extensive validation of SEPT9 and SHOX2 as circulating methylated biomarkers able to stratify groups of HNSCC patients on the basis of homogenous clinico-pathological characteristics is very important to improve the clinical management of the patients. For this purpose, we are continuing the multicenter study to collect liquid biopsies from 8 different hospitals to investigate the methylation levels of SEPT9 and SHOX2 as risk and monitoring biomarkers in a large cohort of Italian patients.

4. Materials and Methods

4.1. Plasma samples from HNSCC patients.

All patients enrolled in this study (n=20) were recruited from Spedali Civili of Brescia (Italy). The clinical and pathological characteristics are reported in Table 1 for each patient. All HNSCC patients met the following criteria: i) histologically confirmed squamous cell carcinoma of the oral cavity, oropharynx, hypopharynx or larynx; ii) clinical stage I-IV according to the VIII edition of the AJCC (American Joint Committee on Cancer) staging system; iii) age ≥ 18 years old and written informed consent. Peripheral blood samples were collected in EDTA-coated collection tubes. All recruited patients were screened for HPV virus-related disease and background pathology. The peripheral blood (10 mL/patient) of HNSCC patients was collected before the start of the first treatment (T0) and at intervals after the first treatment, including surgery, radiotherapy and chemotherapy (T1 = 3 months, T2 = 6 months, T3 = 12 months after treatment). Plasma was obtained by centrifugation of peripheral blood at 1600 rpm for 10 min at 4°C. The plasma was transferred to a new tube and stored at -80°C until DNA extraction. The study was approved by the ethical committee of Spedali Civili of Brescia (Protocol Identify, Ethical Committee approval n. NP 4551).

4.2. ccfDNA isolation from plasma and bisulfite conversion.

Circulating cell-free DNA (ccfDNA) was isolated from 2 mL of plasma using MagMAX Cell-Free DNA isolation kit (ThermoFisher Scientific; Waltham, MA, USA) according to manufacturer’s instruction. Purified ccfDNA was eluted in a 30 μL volume and 1 μL ccfDNA was used for ccfDNA quantification using Qubit Fluorometer and Qubit dsDNA HS (High Sensitivity) Assay Kit (ThermoFisher Scientific). The remaining ccfDNA (29 μl) was used for the bisulfite conversion using EZ DNA Methylation-Lightning kit (Zymo Research; Irvine, CA, USA) following the manufacturer’s instruction. Five hundred nanograms of a methylated and non-methylated human DNA standard (Human Methylated & Non-methylated DNA Set, Zymo Research) were converted with bisulfite to use then as positive controls. 13 and 10 μL of bisulfite-converted DNA were obtained from ccfDNA and methylated and non-methylated DNA respectively and stored at −80°C until their use.

4.3. Methylation specific-droplet digital PCR (MS-ddPCR) assays.

The methylation specific-droplet digital PCR (MS-ddPCR) assays were optimized for the detection of the methylation levels of SEPT9 and SHOX2. The MS-ddPCR experiments were performed using QX200™ ddPCR System (Bio-Rad, Hercules, CA, USA) [21,22]. The MS-ddPCR reaction mix consisted of the 2X ddPCR Supermix for Probes, and locus specific primers and probes. For SEPT9 assay, we designed the primers and probe sequences using Beacon Designer (PREMIER Biosoft; San Francisco, CA, USA). Two sets of primers and probes were obtained: the set with primers and probe with the fluorescent FAM reporter for methylated SEPT9 (named SEPT9-M) and the set with primers and probe with HEX reporter for unmethylated SEPT9 (named SEPT9-U). For SHOX2, the assay was designed to detect the methylated SHOX2 using a set with FAM-labelled probe (named SHOX2) and to detect a region without CpG in actin beta gene using a set with HEX-labelled probe (named ACTB). The complete list of all primer and probe sequences is provided in the Table S1. The PCR mix was prepared in a 22 μL reaction volume containing 11 μL 2 × ddPCR Supermix for Probes without dUTP (Bio-Rad), 0.55 μL 20 × PCR probe assay specific for the methylated loci (SEPT9-M or SHOX2) and 0.55 μL 20 × PCR probe assay specific for the unmethylated SEPT9 (SEPT9-U) or ACTB, and bisulfite-treated DNA, as template. Each ddPCR assay mixture (20 μL) was loaded into a disposable droplet generator cartridge (Bio-Rad). Then, 70 μL of droplet generation oil for probes (Bio-Rad) were loaded into each of the eight wells for oil. The cartridge was then placed inside the QX200 droplet generator (Bio-Rad). When droplet generation was completed, the droplets were transferred to a 96-well PCR plate (Bio-Rad) using a multichannel pipette. The plate was heat-sealed with foil and placed in a conventional thermal cycler. Thermal cycling conditions were: 95 °C for 10 min, 40 cycles of 94 °C for 30 s and 52 °C (for SEPT9 assay) or 57 °C (for SHOX2 assay) for 1 min (ramping rate reduced to 2%), with a final step at 98 °C for 10 min and a 4 °C indefinite hold. QuantaSoft software (Bio-Rad) was used to check the number of total droplets as well as the droplets positive for the methylated SEPT9 or SHOX2 in FAM channel and for the unmethylated SEPT9 or ACTB in HEX channel. SEPT9 methylation level was calculated as percentage: Concentration (copies/μl) for SEPT9-M / (Concentration (copies/μl) for SEPT9-M + Concentration (copies/μl) for SEPT9-U). Meanwhile, SHOX2 methylation level was calculated as ratio: Concentration (copies/μl) for SHOX2 / Concentration (copies/μl) ACTB.

4.4. Establishing the efficiency of MS-ddPCR assays.

The methylated and non-methylated human DNA standards (Zymo Research) converted with bisulfite were used to verify the efficiency of MS-ddPCR assays in the detection of SEPT9 and SHOX2 methylation. Two-fold serial dilutions of the fully methylated DNA were prepared with water. A set of samples containing 20,000 pg, 10,000 pg, 5000 pg, 2500 pg, 1250 pg, 625 pg, 312.5 pg, 156.25 pg, 78.125 pg, and 0 pg of standard bisulfite-converted DNA were tested for SEPT9 and SHOX2 by MS-ddPCR assays as described above. To verify the ability of MS-ddPCR in discriminating the methylated DNA from the DNA background, 20 ng of total DNA containing the following percentages of fully methylated DNA -99%, 90%, 70%, 50%, 30%, 10%, and 1%- were tested. A negative template control (NTC) containing all the components of the reaction except for the DNA template was included in each experiment.

4.5. Detection of SEPT9 and SHOX2 methylation levels in ccfDNA of HNSCC patients by MS-ddPCR.

To evaluate the methylation levels of SEPT9 and SHOX2 in plasma of HNSCC patients, 6 μL of bisulfite-converted ccfDNA were used for both MS-ddPCR assays. The multiplex ddPCR assays and the relative analysis were performed as described above. Each experiment included the positive control wells for the methylated and unmethylated loci containing 4 μl (20 ng) of fully methylated DNA (Zymo Research) converted with bisulfite and 4 μl (20 ng) of completely unmethylated DNA (Zymo Research) converted with bisulfite. Negative template control (NTC) wells were also included.

4.6. Statistical analysis.

Statistical analysis was carried out using GraphPad Prism 7.0 software (San Diego, CA, USA). One-way ANOVA or two-way ANOVA followed by Tukey’s test were used to compare the mean values of methylation levels for SEPT9 and SHOX2 in ccfDNA among the different time-points of the follow-up.

Supplementary Materials

The following supporting information can be downloaded at: Preprints.org, Table S1. Sequence of primers and probes used for MS-ddPCRs assays to detect the DNA methylation levels of SEPT9 and SHOX2. Figure S1. DNA Methylation levels of SEPT9 and SHOX2 in plasma from HNSCC patients with different treatment response at the time points of follow-up.

Author Contributions

Conceptualization, P.B., G.D.P. and A.S.; methodology, A.S. and I.G.; investigation, A.S., I.G. and I.A.P.; resources, C.A., L.L., D.S., C.G., S.G., A.P., D.M., C.P. and P.B.; writing—original draft preparation, A.S. and I.G.; writing—review and editing, A.S., I.G., I.A.P., G.D.P. and P.B.; supervision, A.S. and P.B.; funding acquisition, P.B., G.D.P. and A.S. All authors have read and agreed to the published version of the manuscript.

Funding

This research was supported by Fondazione Spedali Civili. We also thank the family of Ms. Claudia Massoni for the support to the research. The research has also been funded by CIB (Biotechnology Interuniversity Consortium, Italy) n. 12/10/2020, by the University of Brescia (local grants; n.60/2021; n.60/2022). The funding bodies played no role in the design of the study and in the collection, analysis, and interpretation of data, or in the writing of the manuscript.

Institutional Review Board Statement

This study was approved by ethical committee of Spedali Civili of Brescia (Protocol Identify, Ethical Committee approval n. NP 4551).

Informed Consent Statement

Informed consent was obtained from all subjects involved in the study.

Data Availability Statement

Data is contained within the article or supplementary material.

Conflicts of Interest

The authors declare no conflict of interest.

References

  1. Mody, M.D.; Rocco, J.W.; Yom, S.S.; Haddad, R.I.; Saba, N.F. Head and neck cancer. Lancet (London, England) 2021, 398, 2289–2299. [Google Scholar] [CrossRef]
  2. Sung, H.; Ferlay, J.; Siegel, R.L.; Laversanne, M.; Soerjomataram, I.; Jemal, A.; Bray, F. Global Cancer Statistics 2020: GLOBOCAN Estimates of Incidence and Mortality Worldwide for 36 Cancers in 185 Countries. CA. Cancer J. Clin. 2021, 71, 209–249. [Google Scholar] [CrossRef] [PubMed]
  3. Muzaffar, J.; Bari, S.; Kirtane, K.; Chung, C.H. Recent Advances and Future Directions in Clinical Management of Head and Neck Squamous Cell Carcinoma. Cancers (Basel). 2021, 13, 1–16. [Google Scholar] [CrossRef] [PubMed]
  4. Sánchez-Herrero, E.; Serna-Blasco, R.; Robado de Lope, L.; González-Rumayor, V.; Romero, A.; Provencio, M. Circulating Tumor DNA as a Cancer Biomarker: An Overview of Biological Features and Factors That may Impact on ctDNA Analysis. Front. Oncol. 2022, 12. [Google Scholar] [CrossRef] [PubMed]
  5. Caputo, V.; Ciardiello, F.; Maria, C.; Corte, D.; Martini, G.; Troiani, T.; Napolitano, S. Diagnostic value of liquid biopsy in the era of precision medicine: 10 years of clinical evidence in cancer. [CrossRef]
  6. Kogo, R.; Manako, T.; Iwaya, T.; Nishizuka, S.; Hiraki, H.; Sasaki, Y.; Idogawa, M.; Tokino, T.; Koide, A.; Komune, N.; et al. Individualized circulating tumor DNA monitoring in head and neck squamous cell carcinoma. Cancer Med. 2022, 11, 3960–3968. [Google Scholar] [CrossRef] [PubMed]
  7. Abeni, E.; Grossi, I.; Marchina, E.; Coniglio, A.; Incardona, P.; Cavalli, P.; Zorzi, F.; Chiodera, P.L.; Paties, C.T.; Crosatti, M.; et al. DNA methylation variations in familial female and male breast cancer. Oncol. Lett. 2021, 21. [Google Scholar] [CrossRef]
  8. Abeni, E.; Salvi, A.; Marchina, E.; Traversa, M.; Arici, B.; De Petro, G. Sorafenib induces variations of the DNA methylome in HA22T/VGH human hepatocellular carcinoma-derived cells. Int. J. Oncol. 2017, 51, 128–144. [Google Scholar] [CrossRef]
  9. Markou; Londra, D. ; Tserpeli, V.; Kollias; Tsaroucha, E.; Vamvakaris, I.; Potaris, K.; Pateras, I.; Kotsakis; Georgoulias, V.; et al. DNA methylation analysis of tumor suppressor genes in liquid biopsy components of early stage NSCLC: a promising tool for early detection. Clin. Epigenetics 2022, 14. [Google Scholar] [CrossRef]
  10. Schröck, A.; Leisse, A.; De Vos, L.; Gevensleben, H.; Dröge, F.; Franzen, A.; Wachendörfer, M.; Schröck, F.; Ellinger, J.; Teschke, M.; et al. Free-circulating methylated DNA in blood for diagnosis, staging, prognosis, and monitoring of head and neck squamous cell carcinoma patients: An observational prospective cohort study. Clin. Chem. 2017, 63, 1288–1296. [Google Scholar] [CrossRef]
  11. Sun, J.; Zheng, M.Y.; Li, Y.W.; Zhang, S.W. Structure and function of Septin 9 and its role in human malignant tumors. World J. Gastrointest. Oncol. 2020, 12, 619. [Google Scholar] [CrossRef]
  12. Zhou, X.; Lu, X.; Wu, H.; Liu, J.; Huang, H. Diagnostic performance of SHOX2 promoter methylation as biomarker for lung cancer identification: A meta-analysis update. Thorac. cancer 2021, 12, 3327–3332. [Google Scholar] [CrossRef] [PubMed]
  13. Semaan, A.; van Ellen, A.; Meller, S.; Bergheim, D.; Branchi, V.; Lingohr, P.; Goltz, D.; Kalff, J.C.; Kristiansen, G.; Matthaei, H.; et al. SEPT9 and SHOX2 DNA methylation status and its utility in the diagnosis of colonic adenomas and colorectal adenocarcinomas. Clin. Epigenetics 2016, 8. [Google Scholar] [CrossRef]
  14. de Vos, L.; Gevensleben, H.; Schröck, A.; Franzen, A.; Kristiansen, G.; Bootz, F.; Dietrich, D. Comparison of quantification algorithms for circulating cell-free DNA methylation biomarkers in blood plasma from cancer patients. Clin. Epigenetics 2017, 9. [Google Scholar] [CrossRef] [PubMed]
  15. Warren, J.D.; Xiong, W.; Bunker, A.M.; Vaughn, C.P.; Furtado, L. V.; Roberts, W.L.; Fang, J.C.; Samowitz, W.S.; Heichman, K.A. Septin 9 methylated DNA is a sensitive and specific blood test for colorectal cancer. BMC Med. 2011, 9, 133. [Google Scholar] [CrossRef] [PubMed]
  16. Palanca-Ballester, C.; Rodriguez-Casanova, A.; Torres, S.; Calabuig-Fariñas, S.; Exposito, F.; Serrano, D.; Redin, E.; Valencia, K.; Jantus-Lewintre, E.; Diaz-Lagares, A.; et al. Cancer epigenetic biomarkers in liquid biopsy for high incidence malignancies. Cancers (Basel). 2021, 13, 3016. [Google Scholar] [CrossRef] [PubMed]
  17. Gaga, M.; Chorostowska-Wynimko, J.; Horváth, I.; Tammemagi, M.C.; Shitrit, D.; Eisenberg, V.H.; Liang, H.; Stav, D.; Faber, D.L.; Jansen, M.; et al. Validation of Lung EpiCheck, a novel methylation-based blood assay, for the detection of lung cancer in European and Chinese high-risk individuals. Eur. Respir. J. 2021, 57. [Google Scholar] [CrossRef] [PubMed]
  18. Manganelli, M.; Grossi, I.; Ferracin, M.; Guerriero, P.; Negrini, M.; Ghidini, M.; Senti, C.; Ratti, M.; Pizzo, C.; Passalacqua, R.; et al. Longitudinal circulating levels of mir-23b-3p, mir-126-3p and lncrna gas5 in hcc patients treated with sorafenib. Biomedicines 2021, 9. [Google Scholar] [CrossRef]
  19. van Ginkel, J.H.; Huibers, M.M.H.; van Es, R.J.J.; de Bree, R.; Willems, S.M. Droplet digital PCR for detection and quantification of circulating tumor DNA in plasma of head and neck cancer patients. BMC Cancer 2017, 17. [Google Scholar] [CrossRef]
  20. Fung, S.Y.H.; Chan, K.C.A.; Wong, E.W.Y.; Ng, C.W.K.; Cho, R.; Yeung, Z.W.C.; Lam, J.W.K.; Chan, J.Y.K. Droplet digital PCR of tumor suppressor gene methylation in serial oral rinses of patients with head and neck squamous cell carcinoma. Head Neck 2021, 43, 1812–1822. [Google Scholar] [CrossRef]
  21. Manganelli, M.; Grossi, I.; Corsi, J.; D’agostino, V.G.; Jurikova, K.; Cusanelli, E.; Molfino, S.; Portolani, N.; Salvi, A.; De Petro, G. Expression of Cellular and Extracellular TERRA, TERC and TERT in Hepatocellular Carcinoma. Int. J. Mol. Sci. 2022, 23. [Google Scholar] [CrossRef]
  22. Grossi, I.; Schiavone, M.; Cannone, E.; Grejdan, O.A.; Tobia, C.; Bonomini, F.; Rezzani, R.; Salvi, A.; De Petro, G. Lasp1 Expression Is Implicated in Embryonic Development of Zebrafish. Genes (Basel). 2022, 14, 35. [Google Scholar] [CrossRef] [PubMed]
  23. Armakolas, A.; Kotsari, M.; Koskinas, J. Liquid Biopsies, Novel Approaches and Future Directions. Cancers (Basel). 2023, 15. [Google Scholar] [CrossRef] [PubMed]
  24. de Vos, L.; Jung, M.; Koerber, R.M.; Bawden, E.G.; Holderried, T.A.W.; Dietrich, J.; Bootz, F.; Brossart, P.; Kristiansen, G.; Dietrich, D. Treatment Response Monitoring in Patients with Advanced Malignancies Using Cell-Free SHOX2 and SEPT9 DNA Methylation in Blood: An Observational Prospective Study. J. Mol. Diagnostics 2020, 22, 920–933. [Google Scholar] [CrossRef] [PubMed]
  25. Bergheim, J.; Semaan, A.; Gevensleben, H.; Groening, S.; Knoblich, A.; Dietrich, J.; Weber, J.; Kalff, J.C.; Bootz, F.; Kristiansen, G.; et al. Potential of quantitative SEPT9 and SHOX2 methylation in plasmatic circulating cell-free DNA as auxiliary staging parameter in colorectal cancer: a prospective observational cohort study. Br. J. Cancer 2018, 118, 1217–1228. [Google Scholar] [CrossRef] [PubMed]
  26. Stejskal, P.; Goodarzi, H.; Srovnal, J.; Hajdúch, M.; van ’t Veer, L.J.; Magbanua, M.J.M. Circulating tumor nucleic acids: biology, release mechanisms, and clinical relevance. Mol. Cancer 2023, 22. [Google Scholar] [CrossRef]
  27. Yu, M.; Carter, K.T.; Makar, K.W.; Vickers, K.; Ulrich, C.M.; Schoen, R.E.; Brenner, D.; Markowitz, S.D.; Grady, W.M. Methylight droplet digital PCR for detection and absolute quantification of infrequently methylated alleles. Epigenetics 2015, 10, 803–809. [Google Scholar] [CrossRef]
  28. Postel, M.; Roosen, A.; Laurent-Puig, P.; Taly, V.; Wang-Renault, S.F. Droplet-based digital PCR and next generation sequencing for monitoring circulating tumor DNA: a cancer diagnostic perspective. Expert Rev. Mol. Diagn. 2018, 18, 7–17. [Google Scholar] [CrossRef]
  29. Krausewitz, P.; Kluemper, N.; Richter, A.P.; Büttner, T.; Kristiansen, G.; Ritter, M.; Ellinger, J. Early Dynamics of Quantitative SEPT9 and SHOX2 Methylation in Circulating Cell-Free Plasma DNA during Prostate Biopsy for Prostate Cancer Diagnosis. Cancers (Basel). 2022, 14. [Google Scholar] [CrossRef]
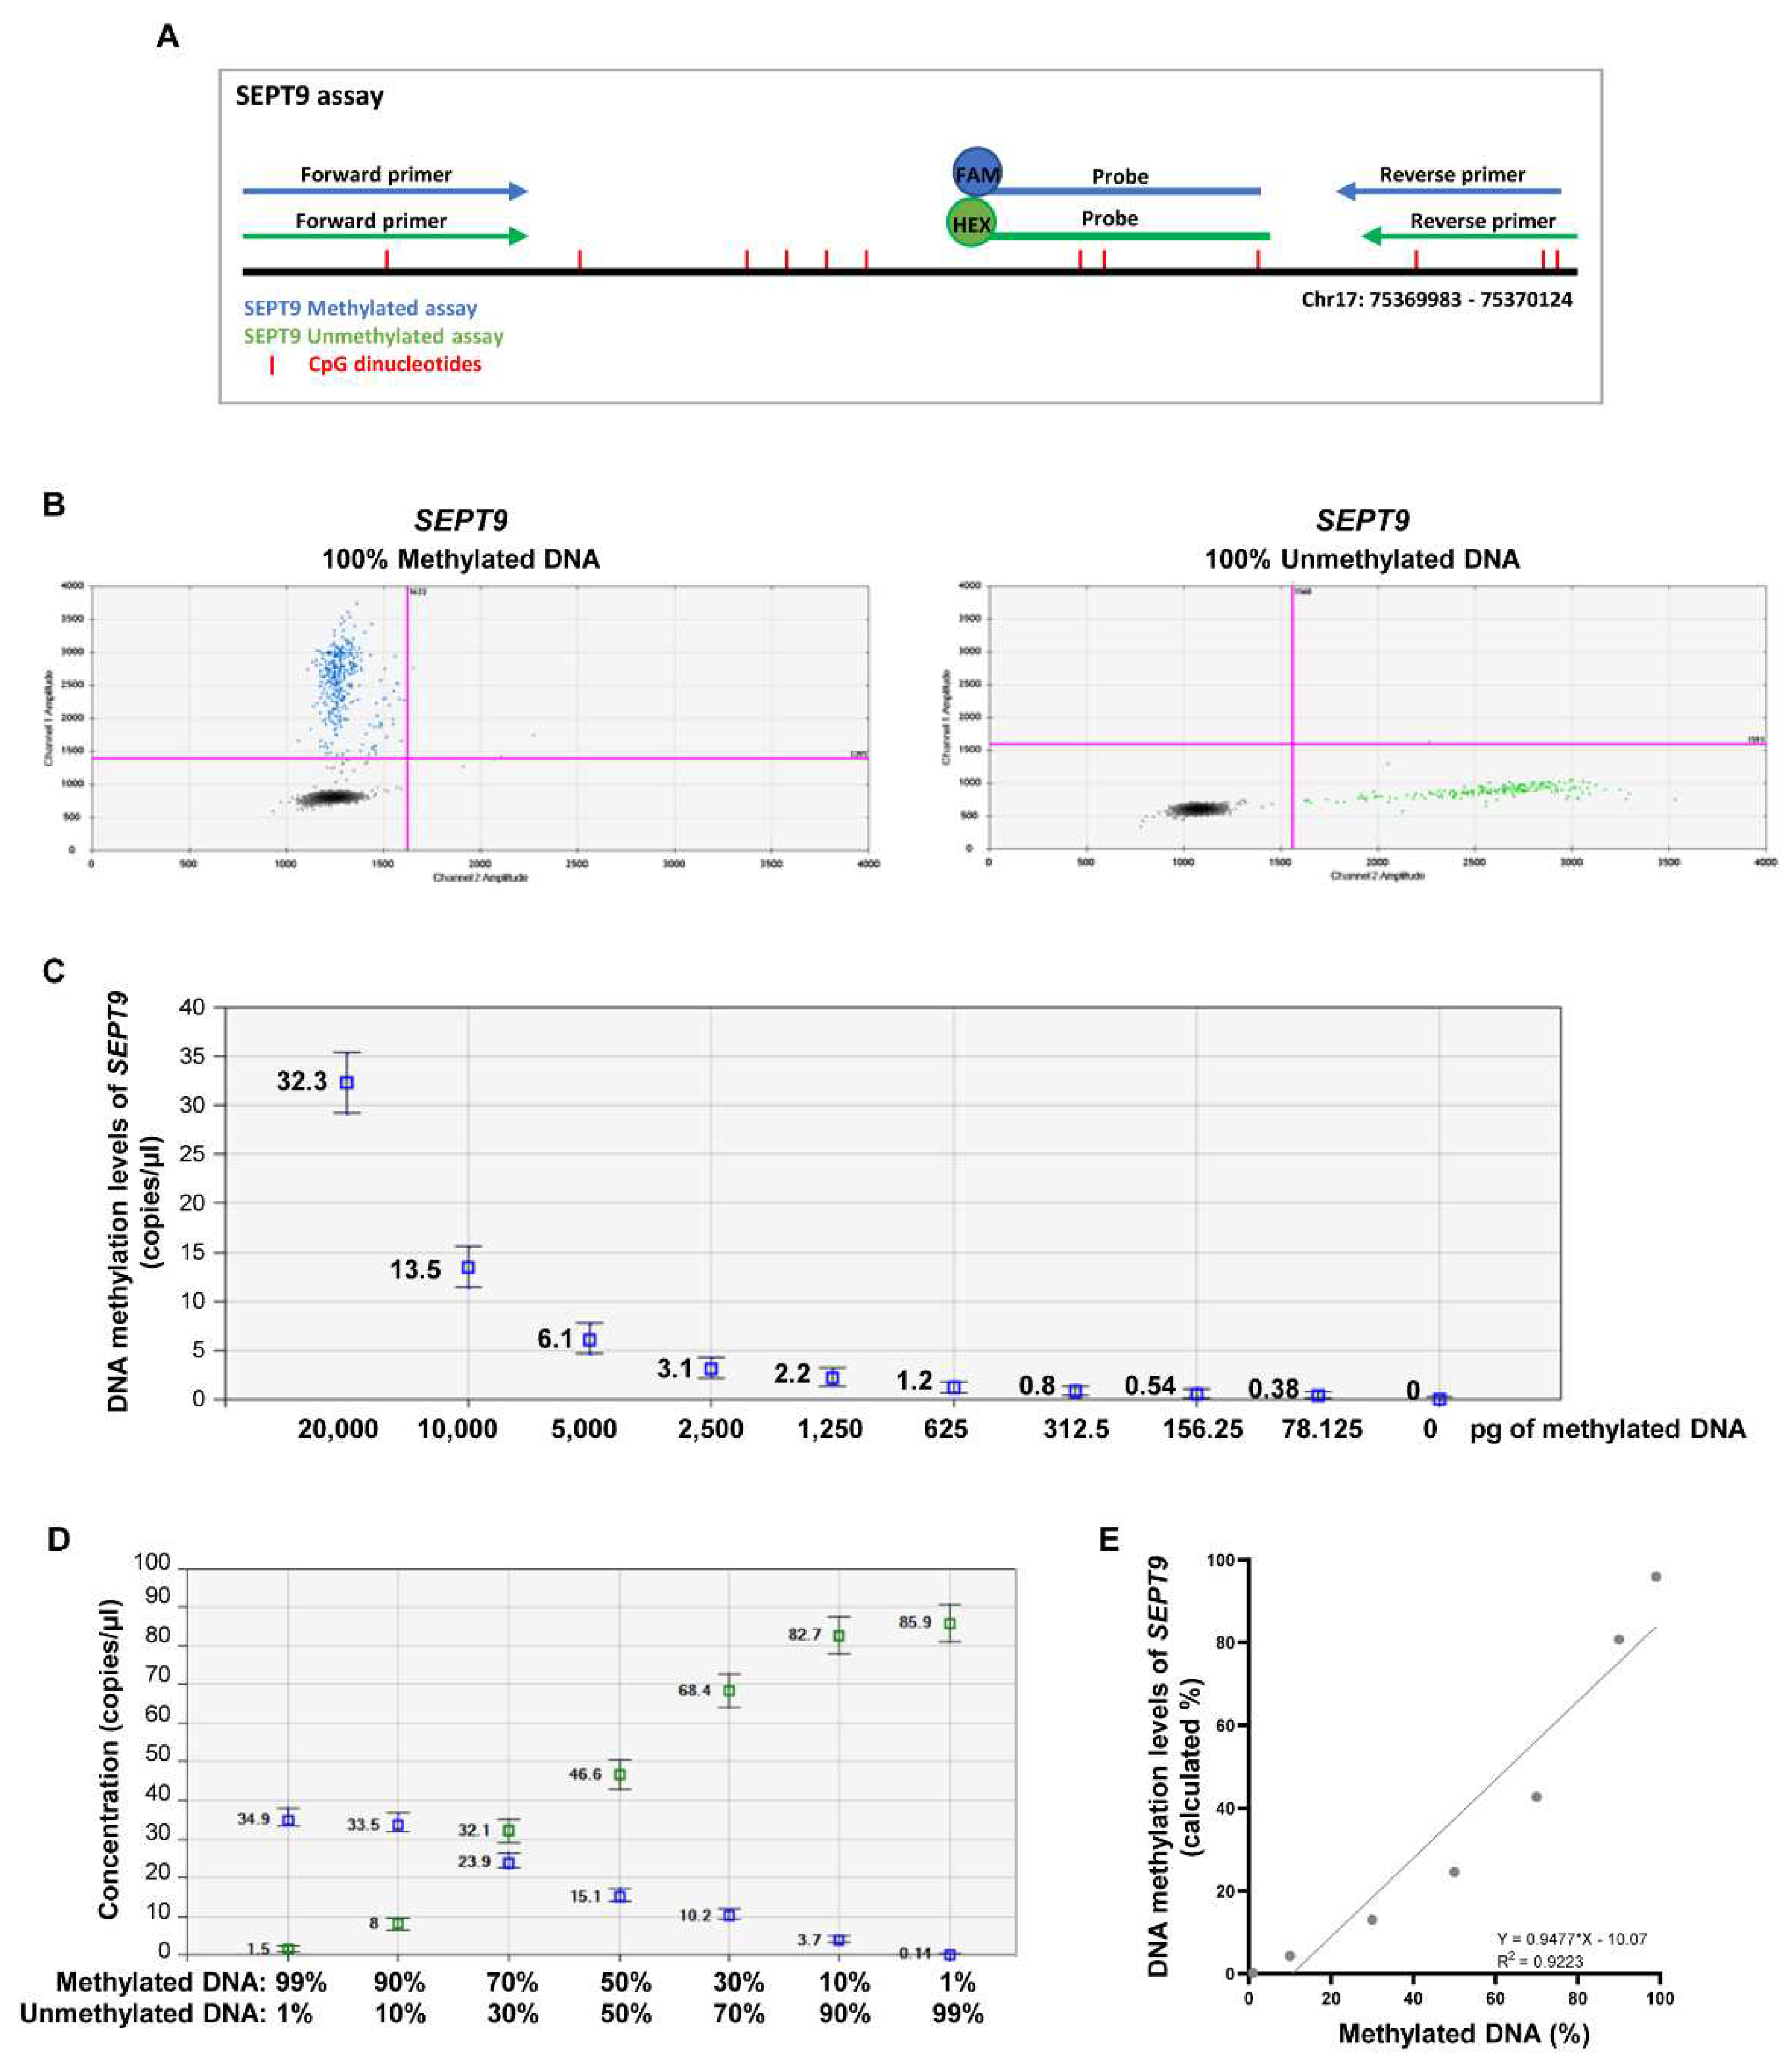
Figure 1. Efficiency of MS-ddPCR assays for the detection of SEPT9 DNA methylation. A) Schematic representation of the Methylation Specific-ddPCR (MS-ddPCR) assay used to detect the methylation levels of SEPT9. Multiplex ddPCR for the analysis of SEPT9 methylation was performed on bisulfite-converted DNA using the set specific for methylated DNA (in blue) and the set specific for unmethylated DNA (in green). Methylation-specific probe was designed with the fluorescence dye FAM and unmethylation-specific probe was designed with the fluorescence dye HEX. B) Example of 2D amplitude plot of the multiplex assay for SEPT9 using commercial methylated DNA (left) and unmethylated DNA (right) converted with bisulfite. For FAM and HEX dyes, a threshold was manually set to select positive droplets. Droplets positive for methylated SEPT9 were blue (Channel 1, FAM); droplets positive for unmethylated SEPT9 were green (Channel 2, HEX), negative droplets were dark grey. C) Two-fold dilution series of commercial 100% methylated DNA converted with bisulfite were prepared. ddPCR was able to detect the methylated SEPT9 as low as 78 pg of methylated DNA input. D) We prepared samples containing commercial methylated DNA and unmethylated DNA in different percentages (20 ng of total input DNA for each well) to verify the ability of MS-ddPCR assay to detect methylated SEPT9 molecules in an unmethylated DNA background. Concentrations (copies/μl) were reported for the assay specific for methylated SEPT9 (in blue) and the assay specific for unmethylated SEPT9 (in green). E) Standard curve of quantification was obtained using the SEPT9 methylation level detected in function of the percentage values of fully methylated DNA loaded in each reaction. SEPT9 methylation level was calculated as percentage: Conc. (copies/μl) for FAM / (Conc. (copies/μl) for FAM + Conc. (copies/μl) for HEX).
Preprints 72800 g001
Figure 2. Efficiency of MS-ddPCR assays for the detection of SHOX2 DNA methylation. A) Schematic representation of MS-ddPCR assay used to detect the methylation levels of SHOX2. The assay was designed to detect methylated SHOX2 using methylation-specific primers and probe (in blue) and a CpG free region of the actin beta (ACTB) on bisulfite-converted DNA. The location of the primers (arrows) as well as probes and CpG dinucleotides (red vertical lines) is indicated in grey boxes. Methylation-specific probe was designed with the fluorescence dye FAM and ACTB-specific probe was designed with the fluorescence dye HEX. B) Example of 2D amplitude plot of the multiplex assay for SHOX2 using commercial methylated DNA (left) and unmethylated DNA (right) converted with bisulfite. For FAM and HEX dyes, a threshold was manually set to select positive droplets. Droplets positive for methylated SHOX2 were blue (Channel 1, FAM), droplets positive for ACTB (sequence without CpG) were green (Channel 2, HEX), and negative droplets are dark grey. C) Two-fold dilution series of commercial 100% methylated DNA converted with bisulfite were prepared. ddPCR was able to detect the methylated SHOX2 as low as 78 pg of methylated DNA input. D) We prepared samples containing commercial methylated DNA and unmethylated DNA in different percentages (20 ng of total input DNA for each well) to verify the ability of SHOX2 assay to detect methylated SHOX2 molecules in an unmethylated DNA background. Concentrations (copies/μl) were reported for the assay specific for methylated SHOX2 (in blue) and the assay specific for ACTB (in green). E) Standard curve of quantification was obtained using the SHOX2 methylation level detected in function of the percentage values of fully methylated DNA loaded in each reaction. SHOX2 methylation level was calculated as ratio: Conc. (copies/μl) for FAM / Conc. (copies/μl) for HEX.
Preprints 72800 g002
Figure 3. Methylation levels of SEPT9 and SHOX2 in ccfDNA from plasma of HNSCC patients before and after treatment. Mean methylation levels of SEPT9 (A) and SHOX2 (B) in plasma collected at the pre-treatment time-point (T0) and at 3-months intervals (T1=3 months and T2=6 months after treatment) during the follow-up of HNSCC patients (n=18). The histograms indicate the means and bars are the SEM; one-way ANOVA, followed by Tukey’s test, was used to compare the different groups, * p < 0.05.
Preprints 72800 g003
Figure 4. Longitudinal variation of SEPT9 DNA methylation levels in plasma from HNSCC patients. The graphs show the amount of methylated SEPT9 (%) detected in the plasma of HNSCC patients before (T0) and after the treatment (Tn). Each line represents a single patient, and the dots indicate the methylation levels of SEPT9 at each blood withdrawal time point (T1=3 months, T2=6 months and T3=12 months after treatment). The continuous red line represents the average trend of SEPT9 methylation for each group; the clinical characteristics shared by grouped patients are reported in the yellow box for each trend. Four trends were depicted. (A-B) The SEPT9 methylation drastically dropped at the first time-point post-treatment (T1) or (C) slightly decreased and remained at low levels till the last time points of follow-up; (D) the SEPT9 methylation levels increased at T1 and diminished at the following time-points. One-way ANOVA followed by Tukey’s test was used to compare SEPT9 methylation levels among the different follow-up time points, *p<0.05.
Preprints 72800 g004
Figure 5. Longitudinal variation of SHOX2 DNA methylation levels in plasma from HNSCC patients. The graphs show the amount of methylated SHOX2 detected in the plasma of HNSCC patients before (T0) and after the treatment (Tn). Each line represents a single patient, and the dots indicate the methylation levels of SHOX2 at each blood withdrawal time point (T1=3 months, T2=6 months and T3=12 months after treatment). The continuous red line represents the average trend of SHOX2 methylation for each group; the clinical characteristics shared by grouped patients are reported in the yellow box for each trend. Three trends were depicted. (A) The SHOX2 methylation drastically dropped at the first or second time-points post-treatment (T1 and T2). (B) The SHOX2 methylation levels drastically dropped at T1 and slightly increased at the following time points (T2 or T3). (C) The SHOX2 methylation levels were absent at T0 and T1, but increased at the last time points of follow-up (T2 or T3). One-way ANOVA followed by Tukey’s test was used to compare SEPT9 methylation levels among the different follow-up time points, *p<0.05.
Preprints 72800 g005
Table 1. Clinical characteristics of HNSCC patients enrolled in the study.
ID patient Tumor Site Staging (VIII ed. AJCC) HPV
(SCC Oropharynx)
Treatment Type Status of Disease
(at last FU)
Time point of FU with blood sample collected
BS002 Larynx III Surgery + adj Right neck lymph nodes recurrence + pulmonary metastasis at 6 months of FU 6 months (T2)
BS003 Oral cavity II Surgery + adj Local recurrence at 8 months of FU 6 months (T2)
BS006 Oral cavity III Surgery + adj NED
(FU 18 months)
12 months (T3)
BS007 Oral cavity II Surgery NED
(FU 18 months)
12 months (T3)
BS008 Oral cavity II
p16+, HPV DNA+ RT-CHT Tumor persistence at T1 Pre-treatment (T0)
BS009 Oral cavity II Surgery + adj NED
(FU 18 months)
12 months (T3)
BS010 Larynx II CHT neo + RT NED
(FU 12 months)
6 months (T2)
BS011 Oral cavity III Surgery + adj Second primary tumor (SCC of the right tonsil) at 15 months of FU 12 months (T3)
BS013 Oropharynx II p16+ RT-CHT NED
(FU 18 months)
12 months (T3)
BS014 Larynx III Surgery + adj Progressive disease with pulmonary metastasis at 4 months of FU Pre-treatment (T0)
BS015 Hypopharynx III Surgery + adj Pulmonary metastasis at 9 months of FU 6 months (T2)
BS016 Larynx II Surgery + adj NED
(FU 18 months)
12 months (T3)
BS017 Oropharynx I p16+ RT-CHT NED
(FU 15 months)
12 months (T3)
BS018 Oropharynx II p16+ RT-CHT NED
(FU 15 months)
12 months (T3)
BS019 Oropharynx IV NEG RT-CHT NED
(FU 15 months)
12 months (T3)
BS020 Oropharynx II p16+ RT-CHT NED until T2, then lost at FU 6 months (T2)
BS021 Oral cavity III Surgery + adj NED
(FU 18 months)
12 months (T3)
BS029 Larynx II Surgery NED
(FU 15 months)
6 months (T2)
BS023 Oropharynx I p16+, HPV DNA+ RT-CHT NED
(FU 12 months)
6 months (T2)
BS024 Oropharynx I p16+ RT-CHT NED
(FU 12 months)
6 months (T2)
HPV, Human Papilloma Virus; RT-CHT, radiotherapy-chemotherapy; FU, follow-up; NED, no evidence of disease; adj, adjuvant treatment .
Disclaimer/Publisher’s Note: The statements, opinions and data contained in all publications are solely those of the individual author(s) and contributor(s) and not of MDPI and/or the editor(s). MDPI and/or the editor(s) disclaim responsibility for any injury to people or property resulting from any ideas, methods, instructions or products referred to in the content.
Copyright: This open access article is published under a Creative Commons CC BY 4.0 license, which permit the free download, distribution, and reuse, provided that the author and preprint are cited in any reuse.
Prerpints.org logo

Preprints.org is a free preprint server supported by MDPI in Basel, Switzerland.

Subscribe

© 2024 MDPI (Basel, Switzerland) unless otherwise stated