Submitted:
05 May 2023
Posted:
08 May 2023
You are already at the latest version
Abstract
Keywords:
1. Introduction
- Development of more efficient algorithms: There is a need to develop more efficient algorithms that can reduce the computational burden of iterative and optimization-based methods while still ensuring the global optimum solution.
- Adaptive sizing methodologies: As hybrid off-grid energy systems evolve over time due to factors such as changing load demands and component degradation, there is a need for adaptive sizing methodologies that can account for these changes and optimize system performance throughout its lifecycle.
- Scalability and applicability: As the demand for hybrid off-grid energy systems grows, there is a need to develop sizing methodologies that can be applied to various scales, from small residential systems to large-scale microgrids. Research should focus on developing scalable algorithms and techniques that can handle the increasing complexity and size of these systems.
- Incorporation of new technologies and energy sources: The rapid development of renewable energy technologies and energy storage solutions, such as advanced battery systems and hydrogen storage, necessitates the integration of these new technologies into existing sizing methodologies. Future research should explore how these emerging technologies can be effectively incorporated into the sizing process to enhance the performance of hybrid off-grid energy systems.
- Standardization and benchmarking: There are a lack of standardization and benchmarking in the field of sizing methodologies for hybrid off-grid energy systems. Developing standardized benchmarks and performance metrics can facilitate the comparison and evaluation of different sizing approaches, driving further improvements and innovation in the field.
- Simplicity: Deterministic methods often involve simpler mathematical models and algorithms compared to stochastic or simulation-based approaches, making them easier to implement, understand, and interpret.
- Computational efficiency: Due to their simplicity, deterministic methods generally require less computational resources and time compared to other approaches, such as stochastic or simulation-based methods.
- Reproducibility: Deterministic methods, by their nature, provide consistent results for the same input data, ensuring reproducibility and comparability across different applications and scenarios.
- Ease of integration: Deterministic methods can be more easily integrated into other optimization or decision-making frameworks, such as linear programming, mixed-integer linear programming, and multi-objective optimization algorithms.
- Lower uncertainty: By relying on fixed input parameters, deterministic methods eliminate the uncertainty associated with variable input data, such as weather conditions and load profiles, leading to more predictable and consistent results.
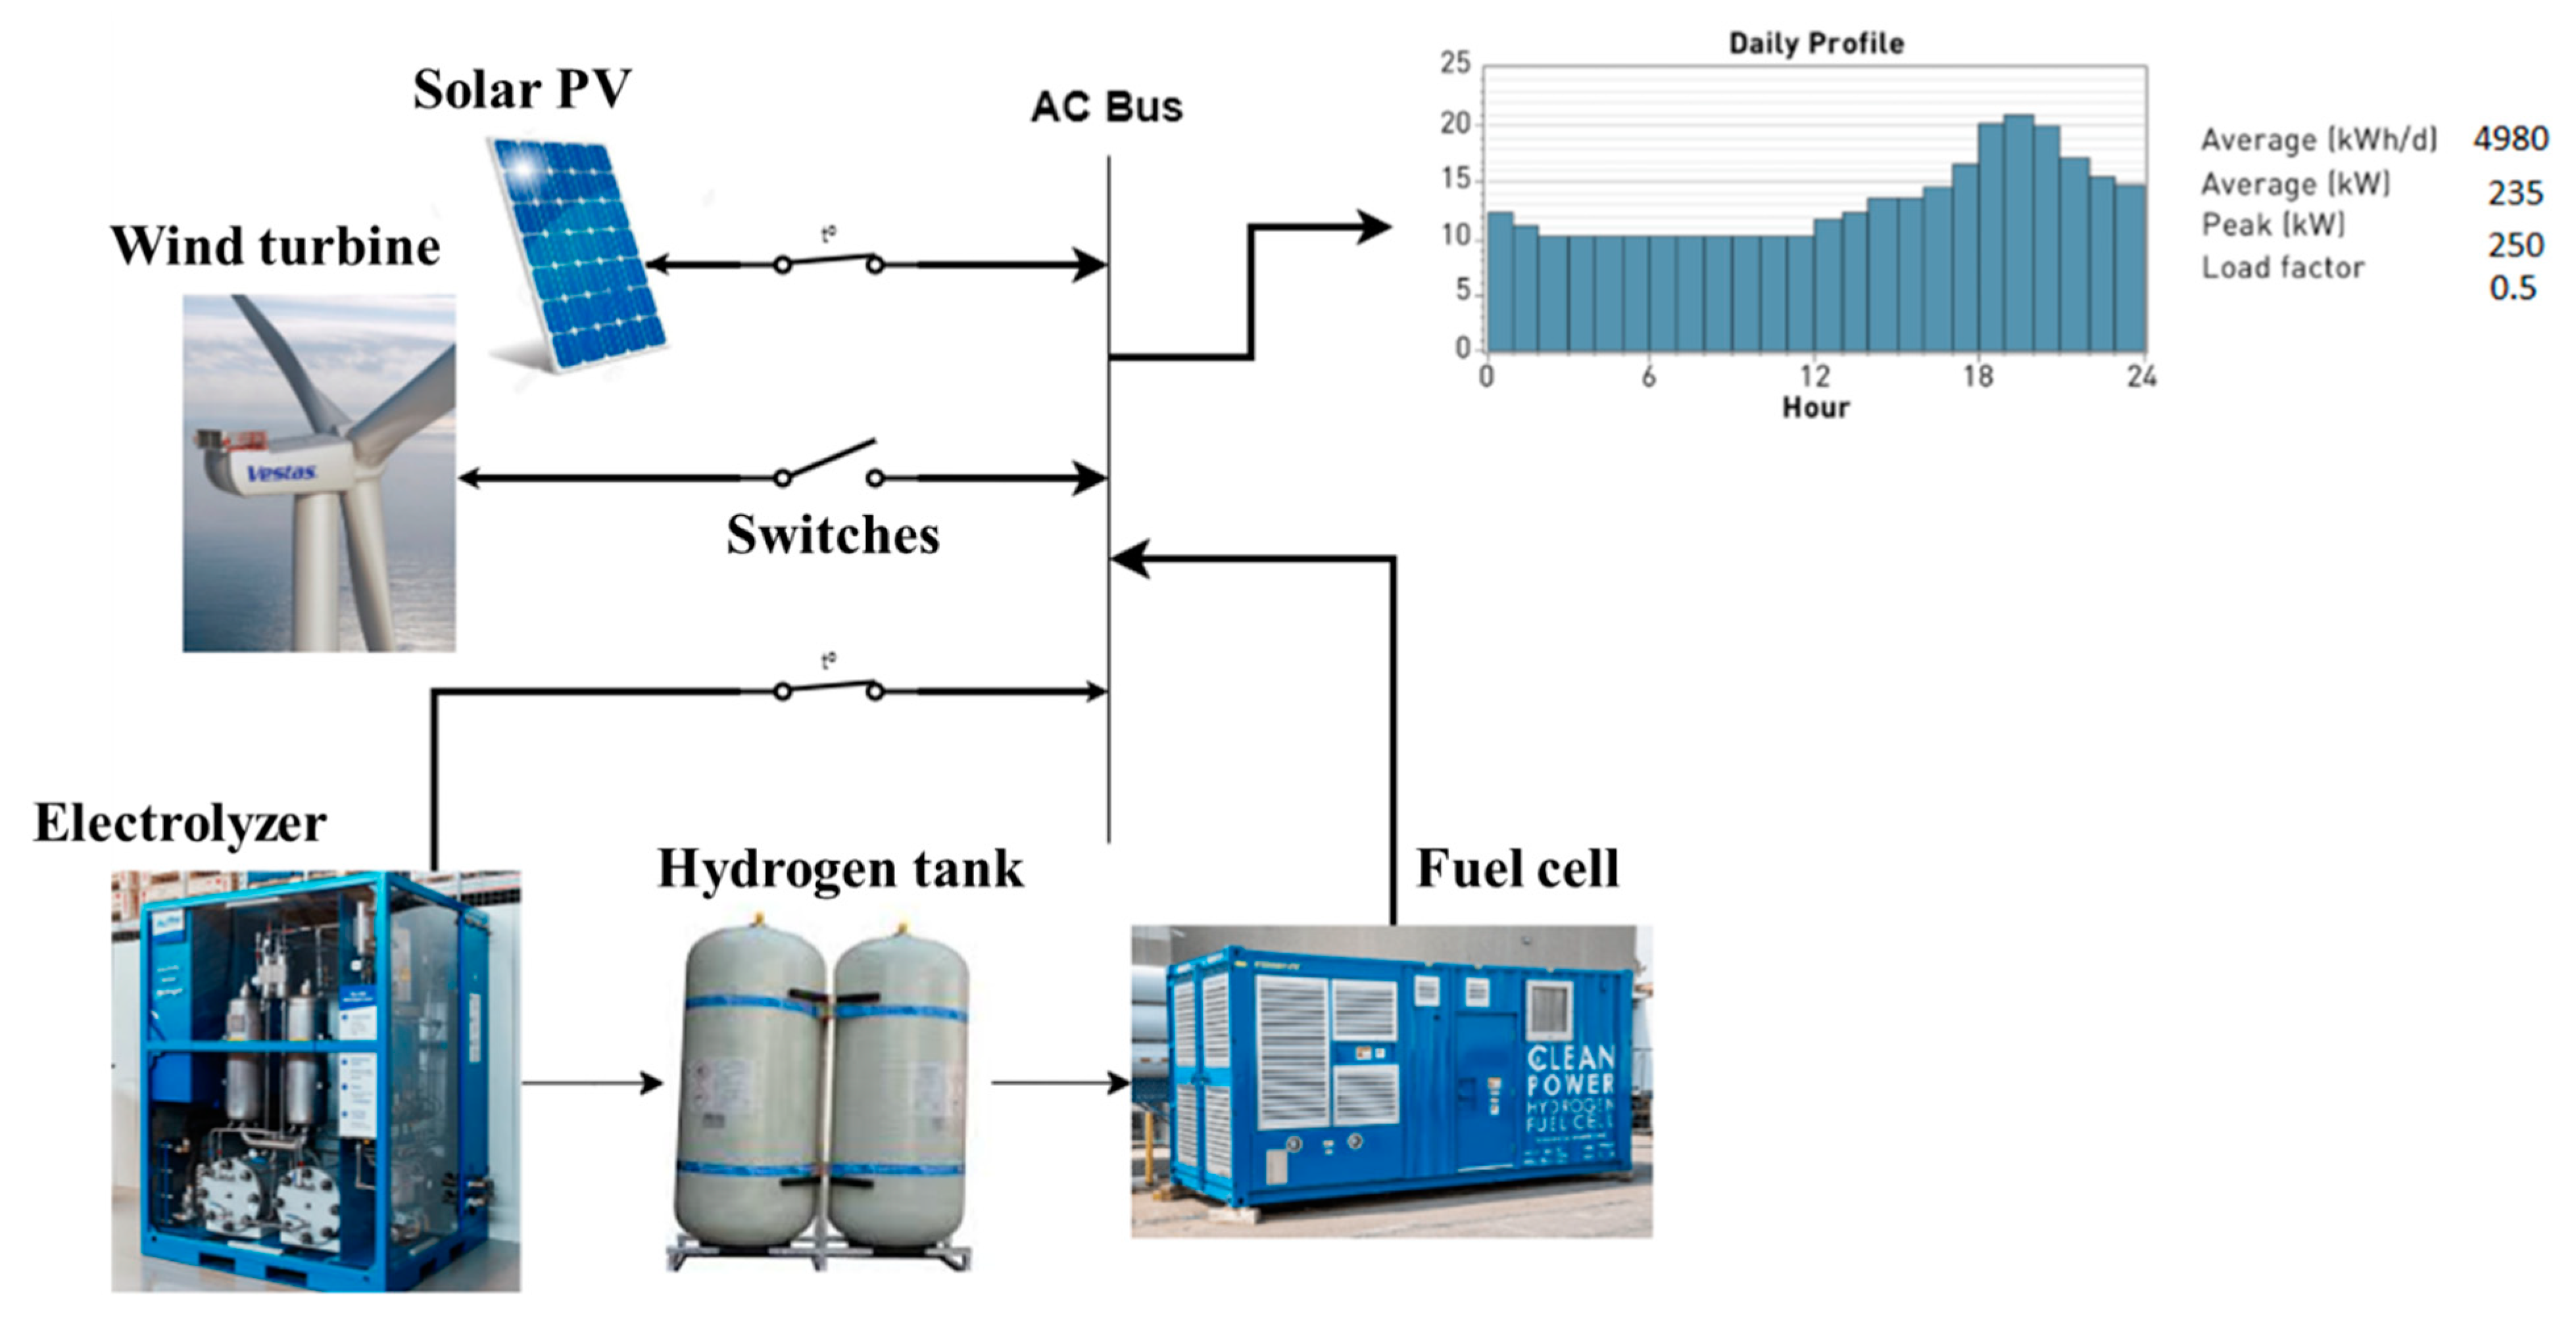
- A novel method named Deterministic Energy Balance Method (DBM) is proposed to find the optimal sizing of hybrid renewable energy sources (RESs) . This method is based on energy balance computation for system’s yearly profiles to avoid using any heuristic algorithms that are based on trial and error to find the global optima for system parameters and cost function.
- Cost analysis model is computed for all studied systems for one-year simulation based on DBM method to come up with a techno-economical solution for fair comparison with commercial software.
- 100% renewable energy system is introduced within different system setups and they are optimally sized using the DBM to achieve high reliability of energy supply. Additionally, seasonal variations’ impact on energy generation is utilized to manage the hydrogen production process for supplying the surplus energy in times of lack of generation.
- Verification and validation of the proposed method are achieved by using HOMER to judge the Levelized cost of energy for different system configurations and justify the power ratings of installed components for different setups.
2. Modeling of the Hybrid Energy System
2.1. Solar Photovoltaic
2.2. Wind Turbine Generators (WTGs)
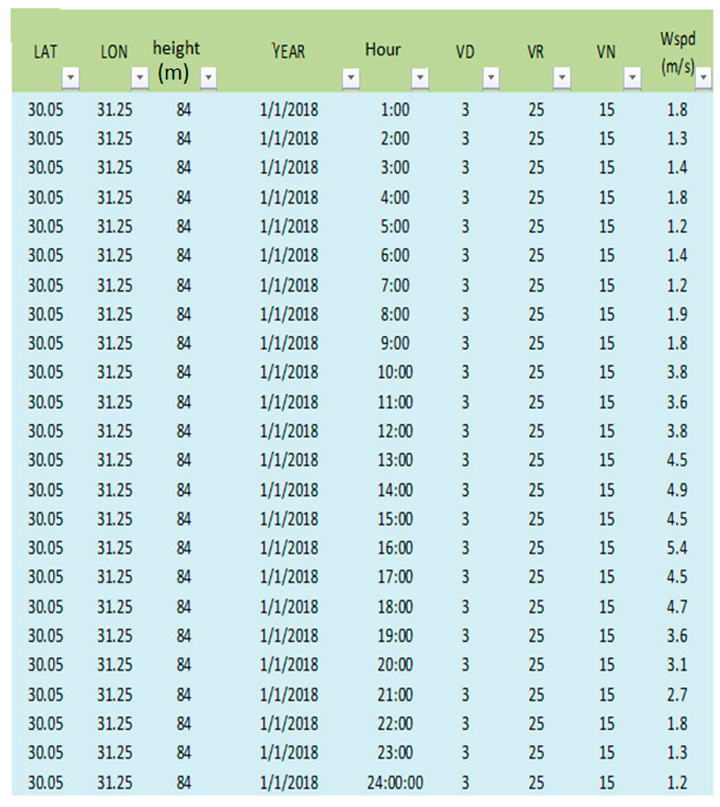
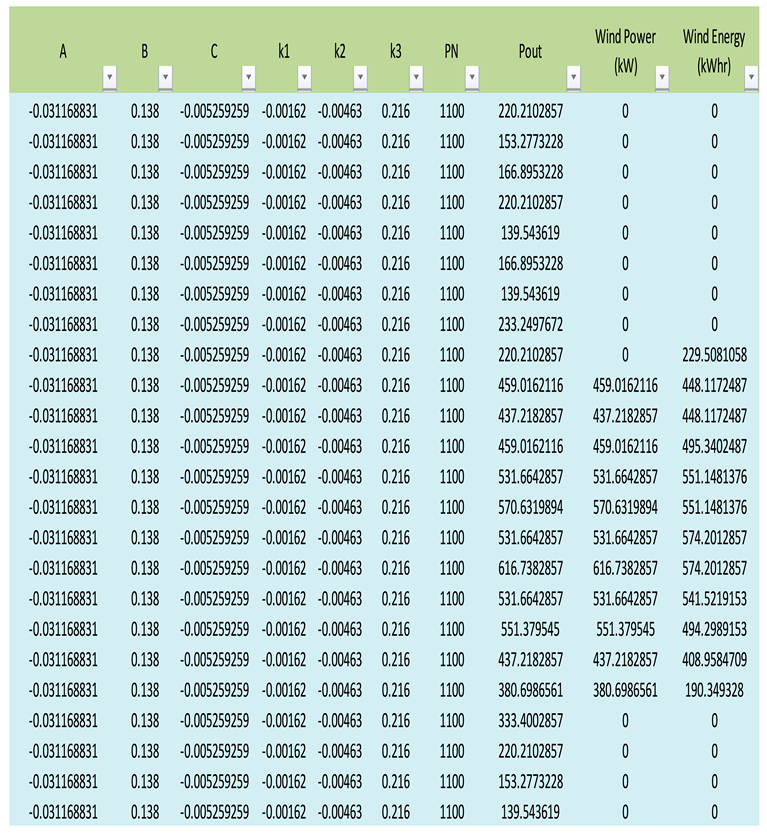
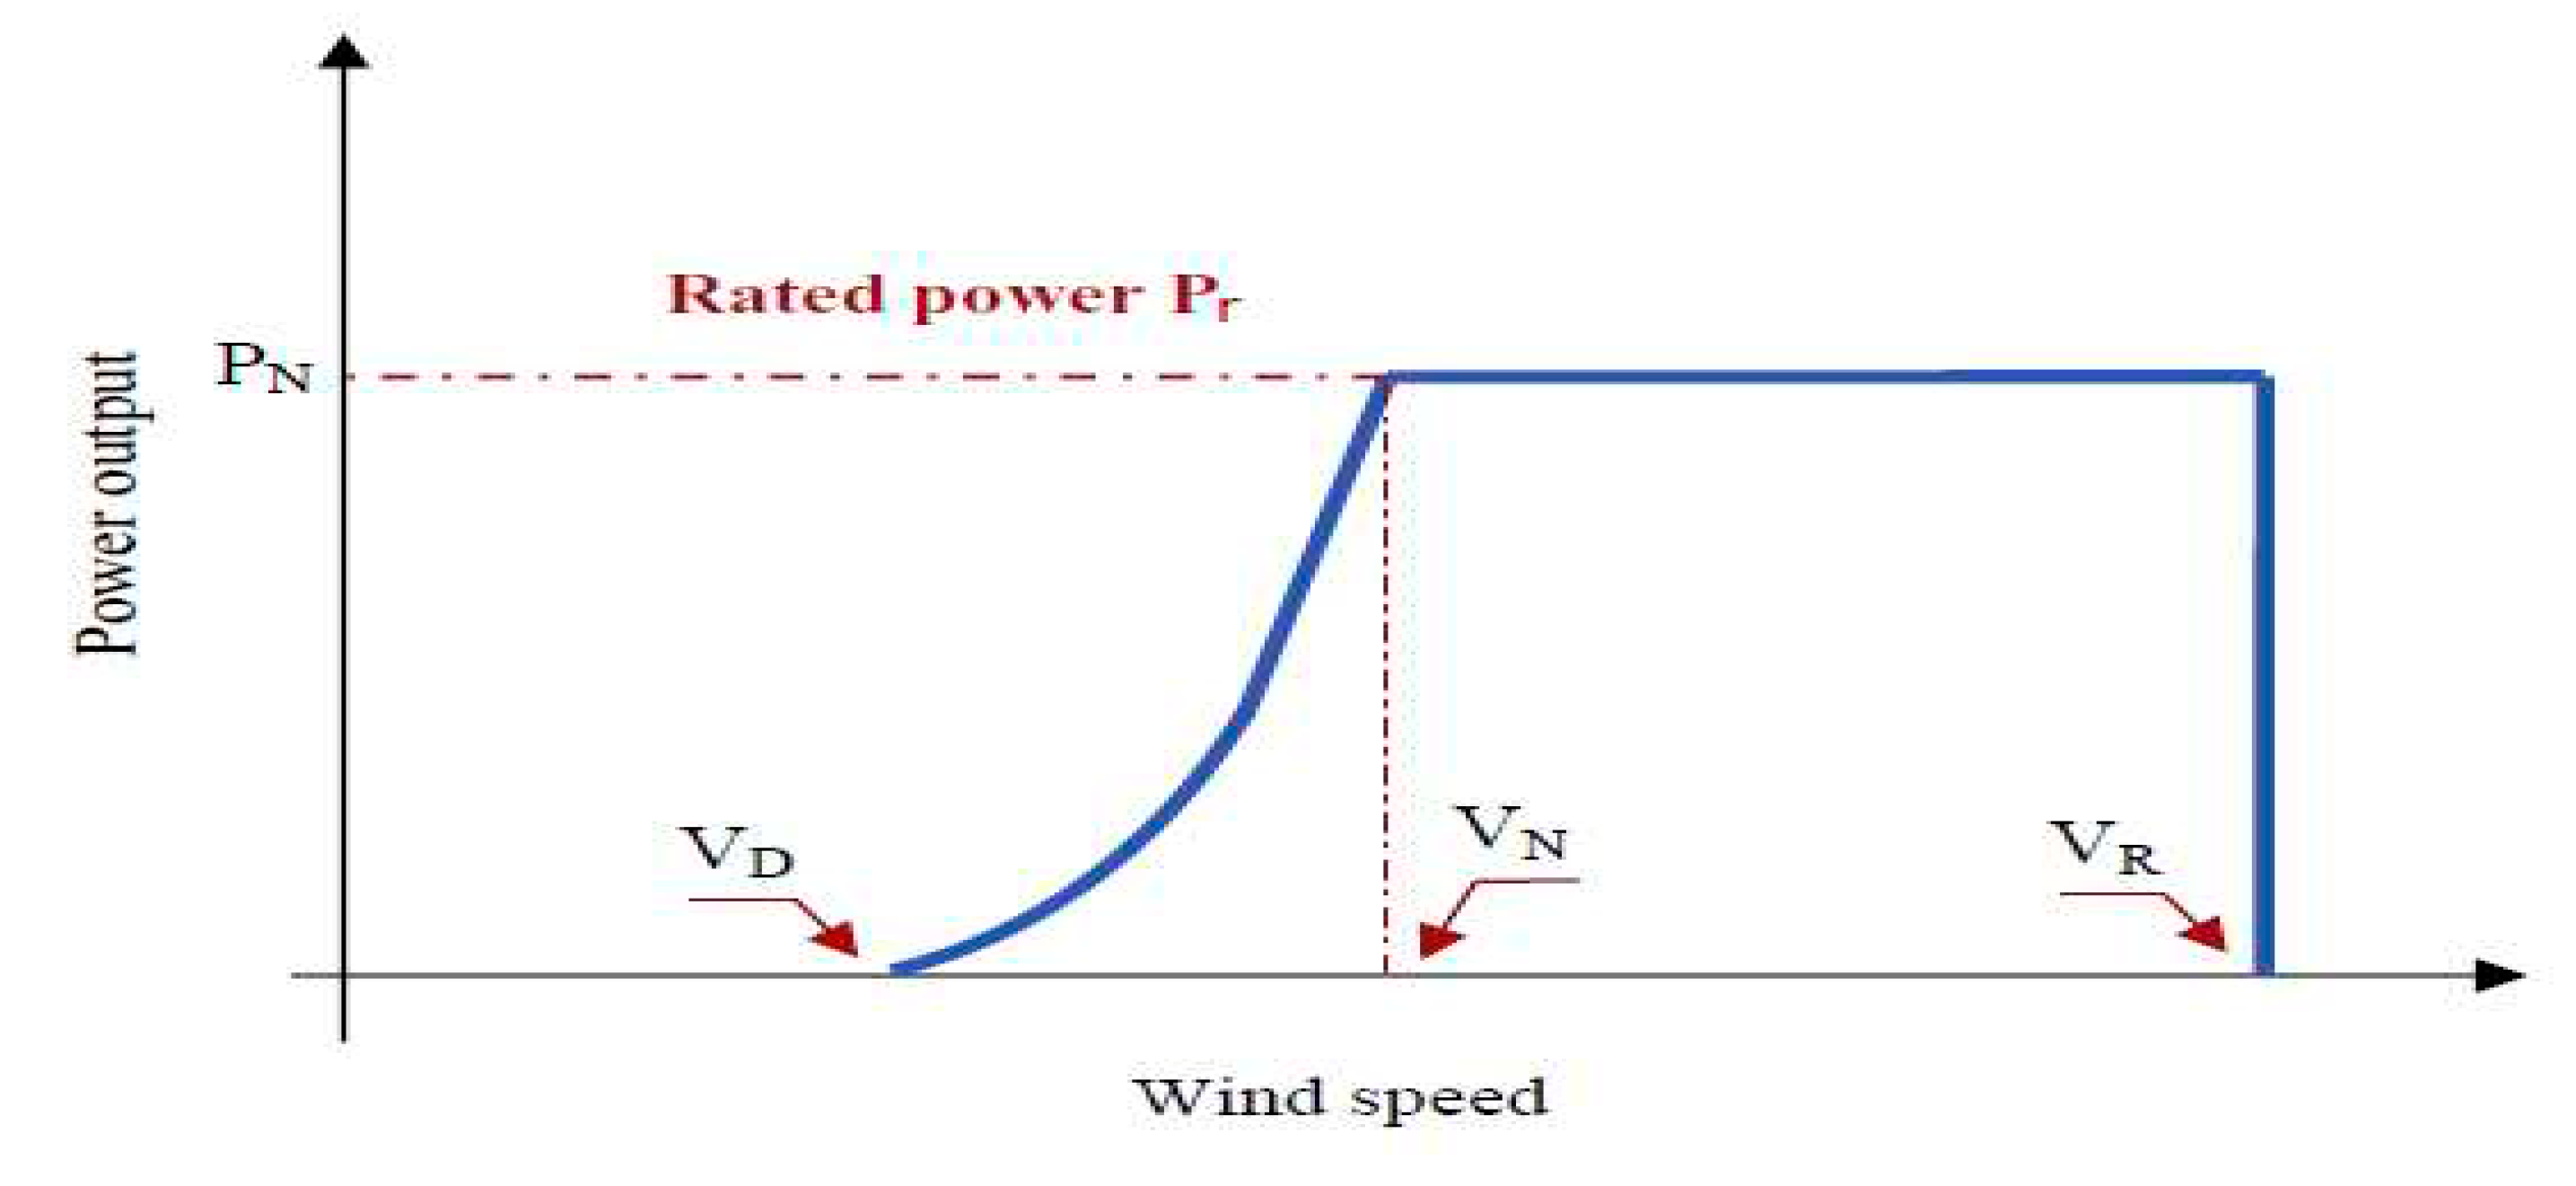
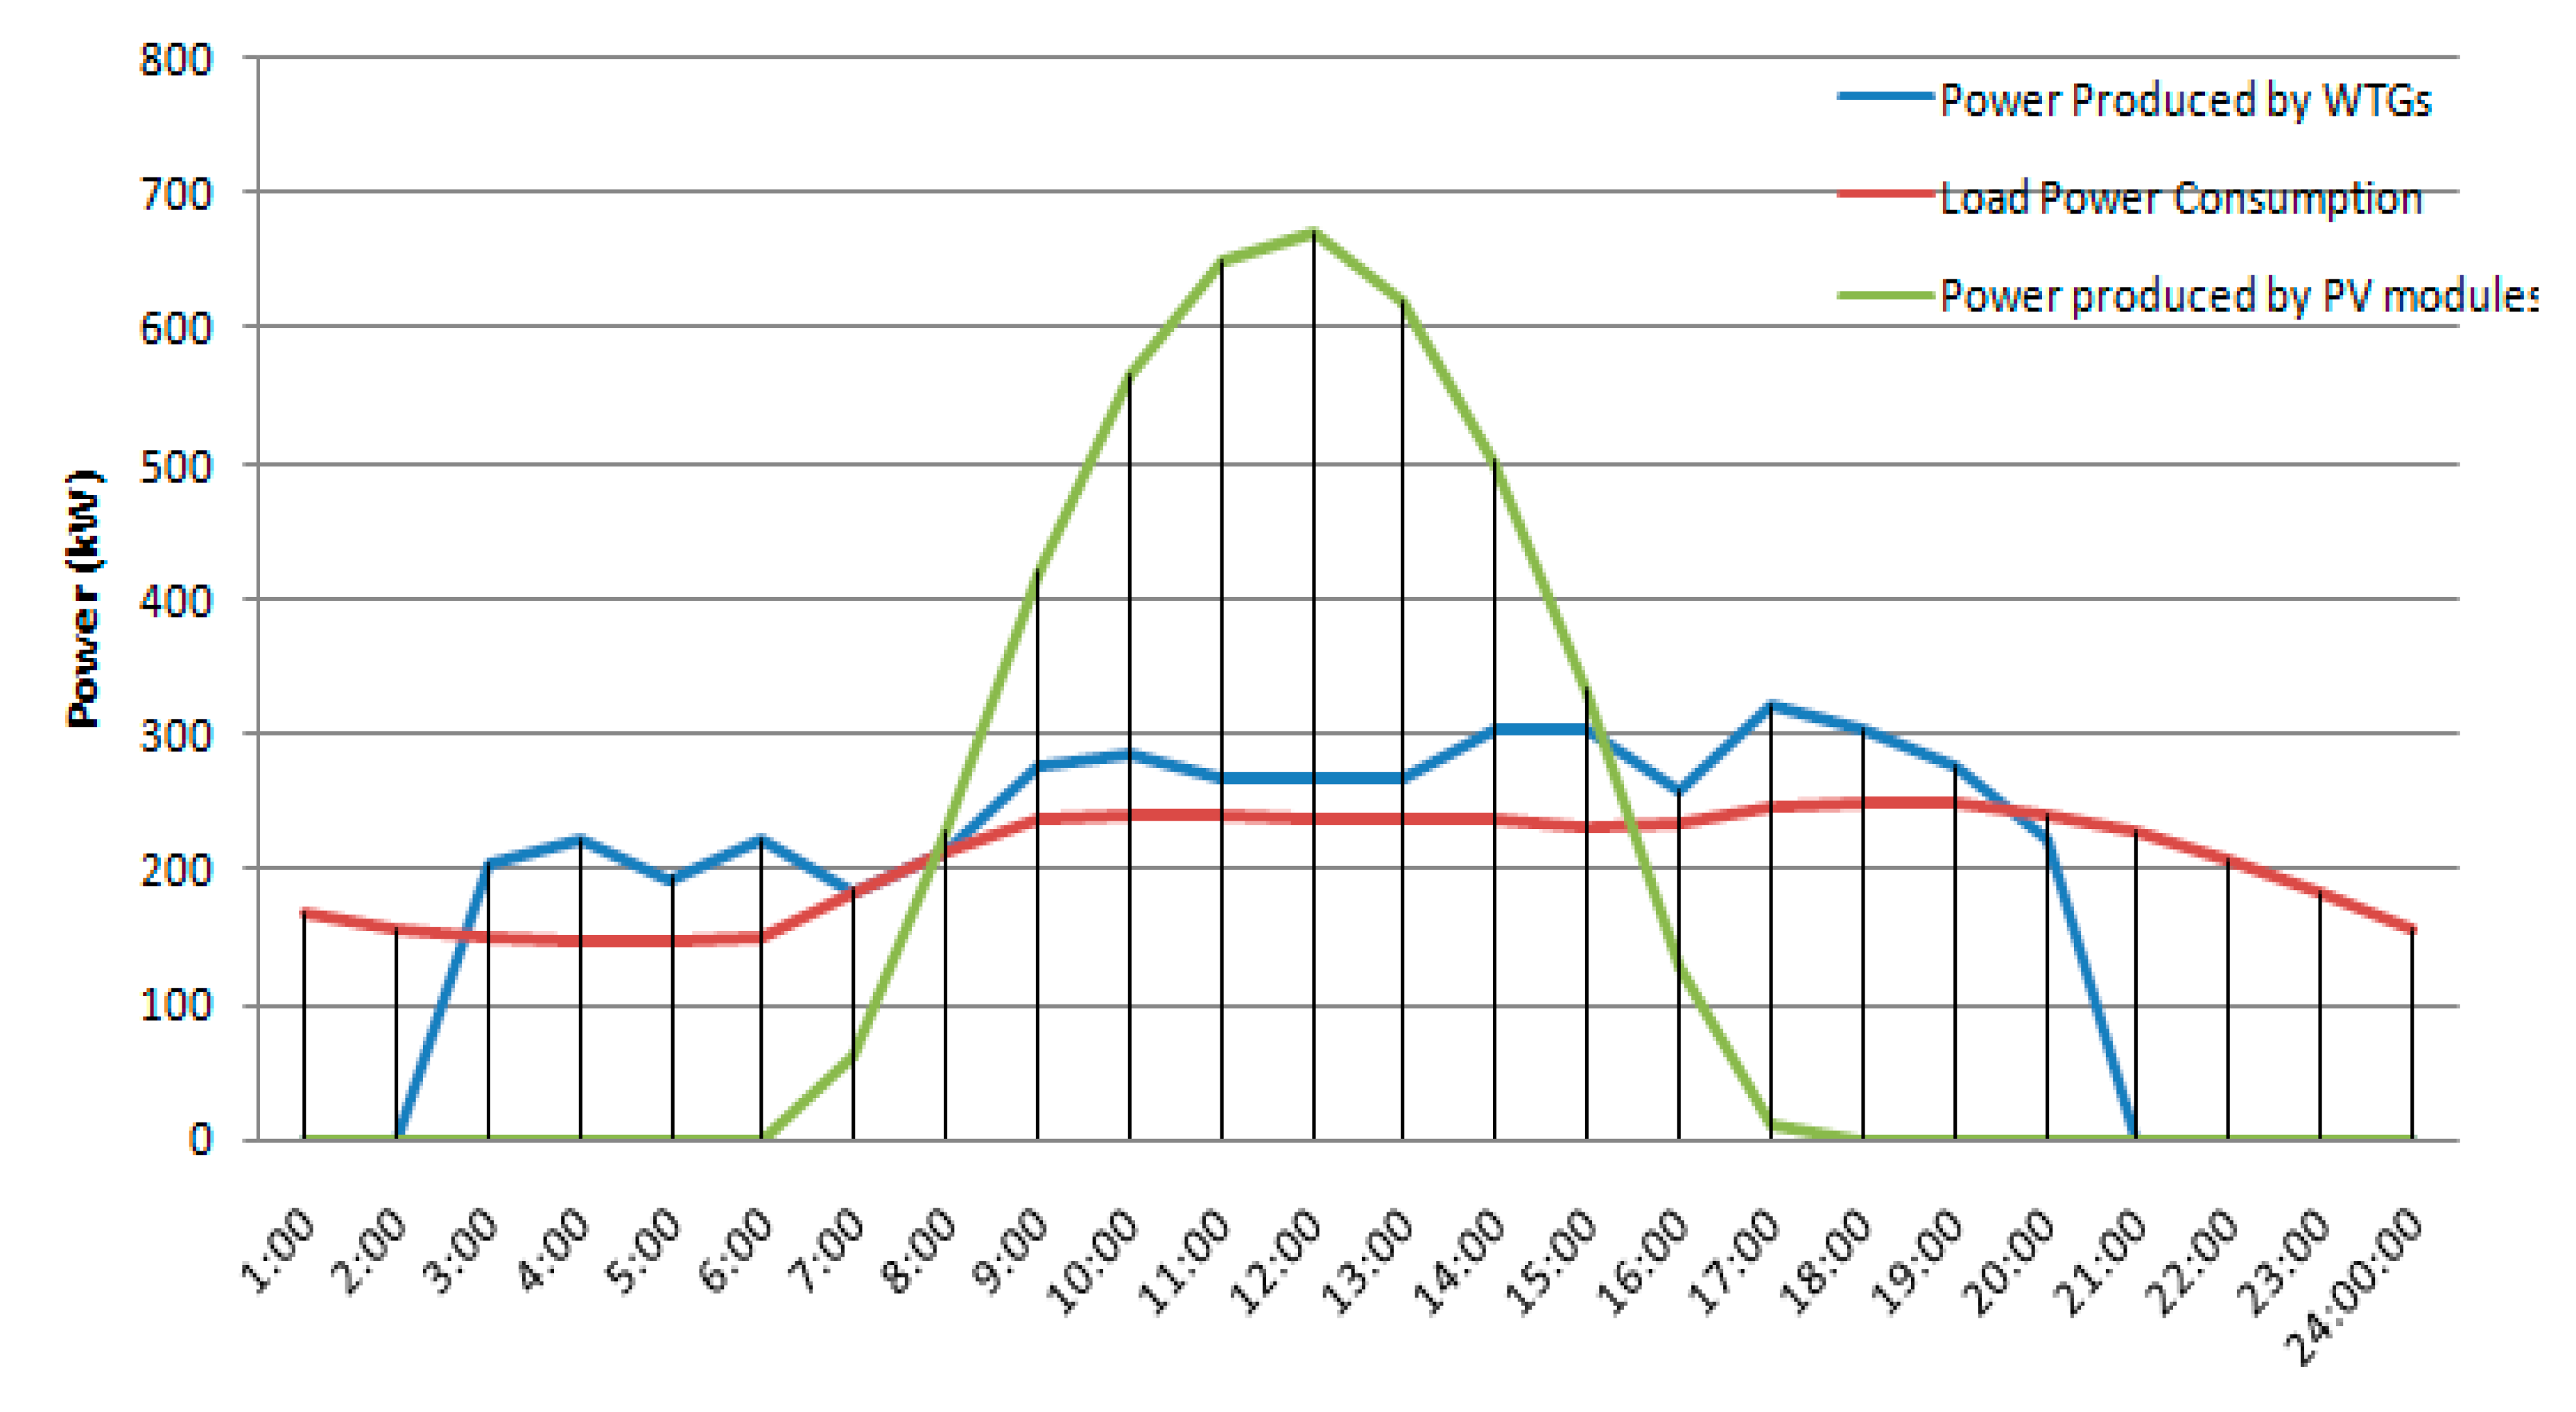
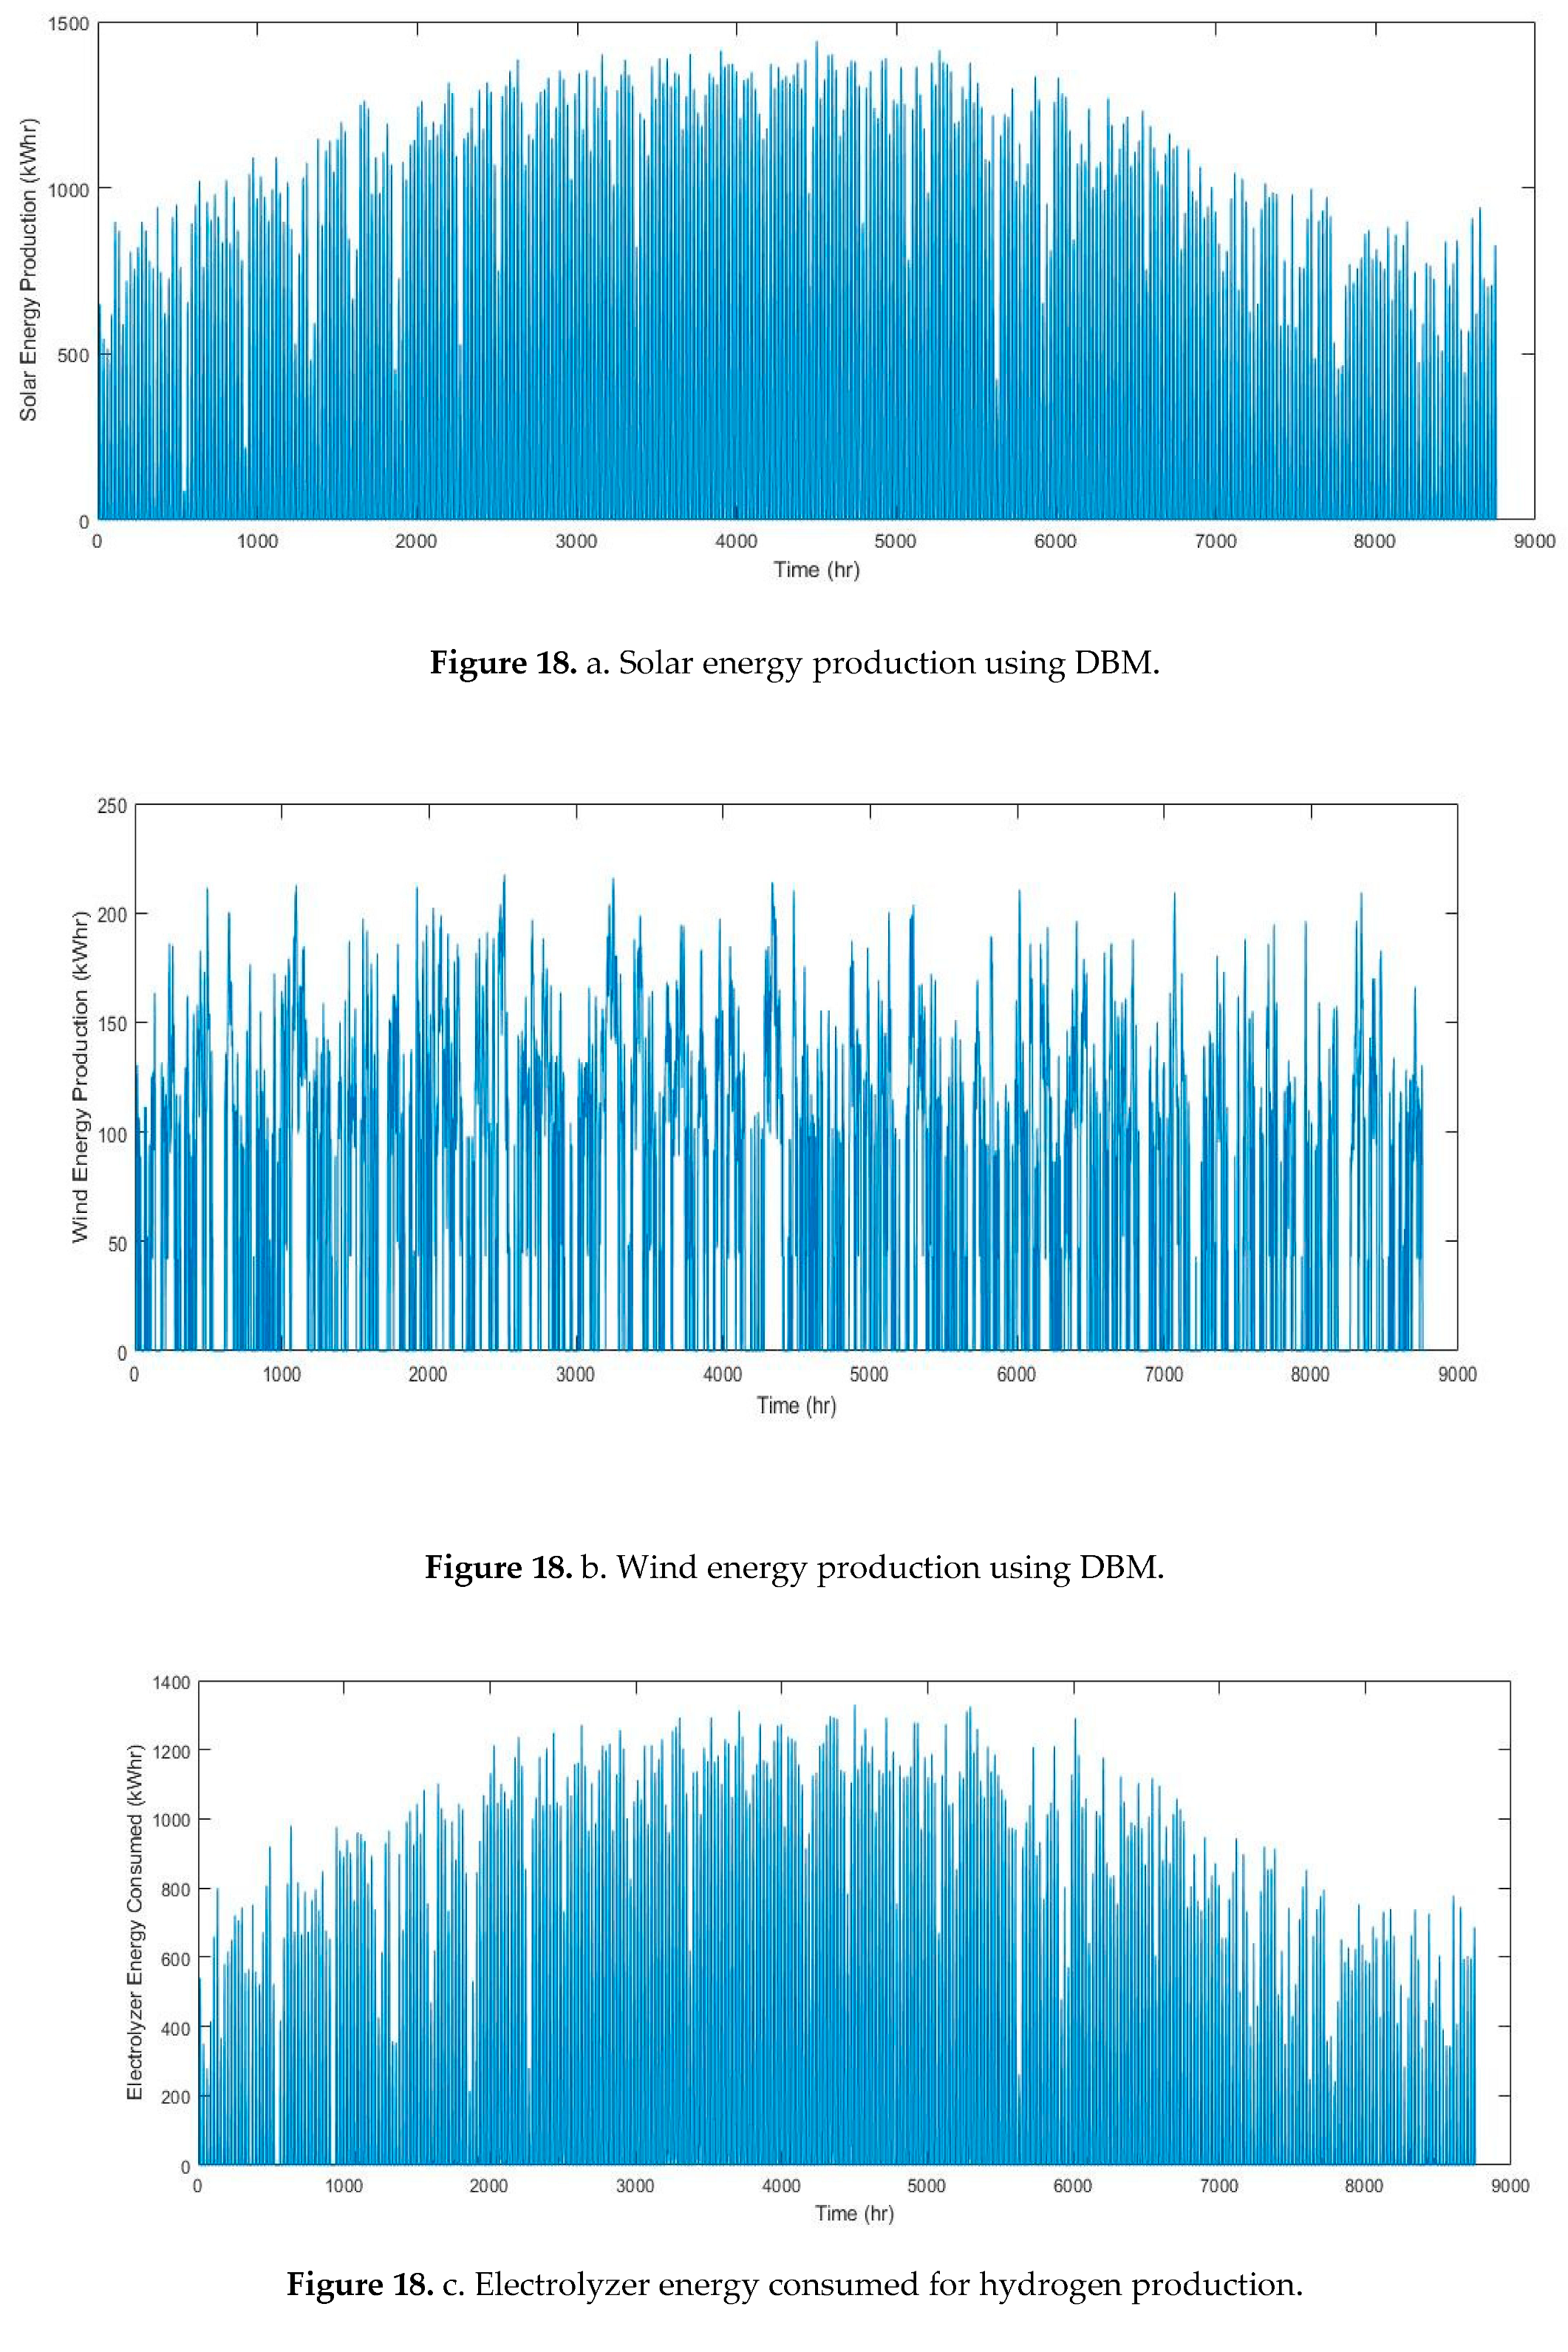
- The Wind Turbine Generator (WTG) hourly power output, at the studied location, depends on the hourly wind speed as shown in Figure 4. It can be expressed by following equations (Khiareddine et al.,2018):
2.3. Hydrogen System
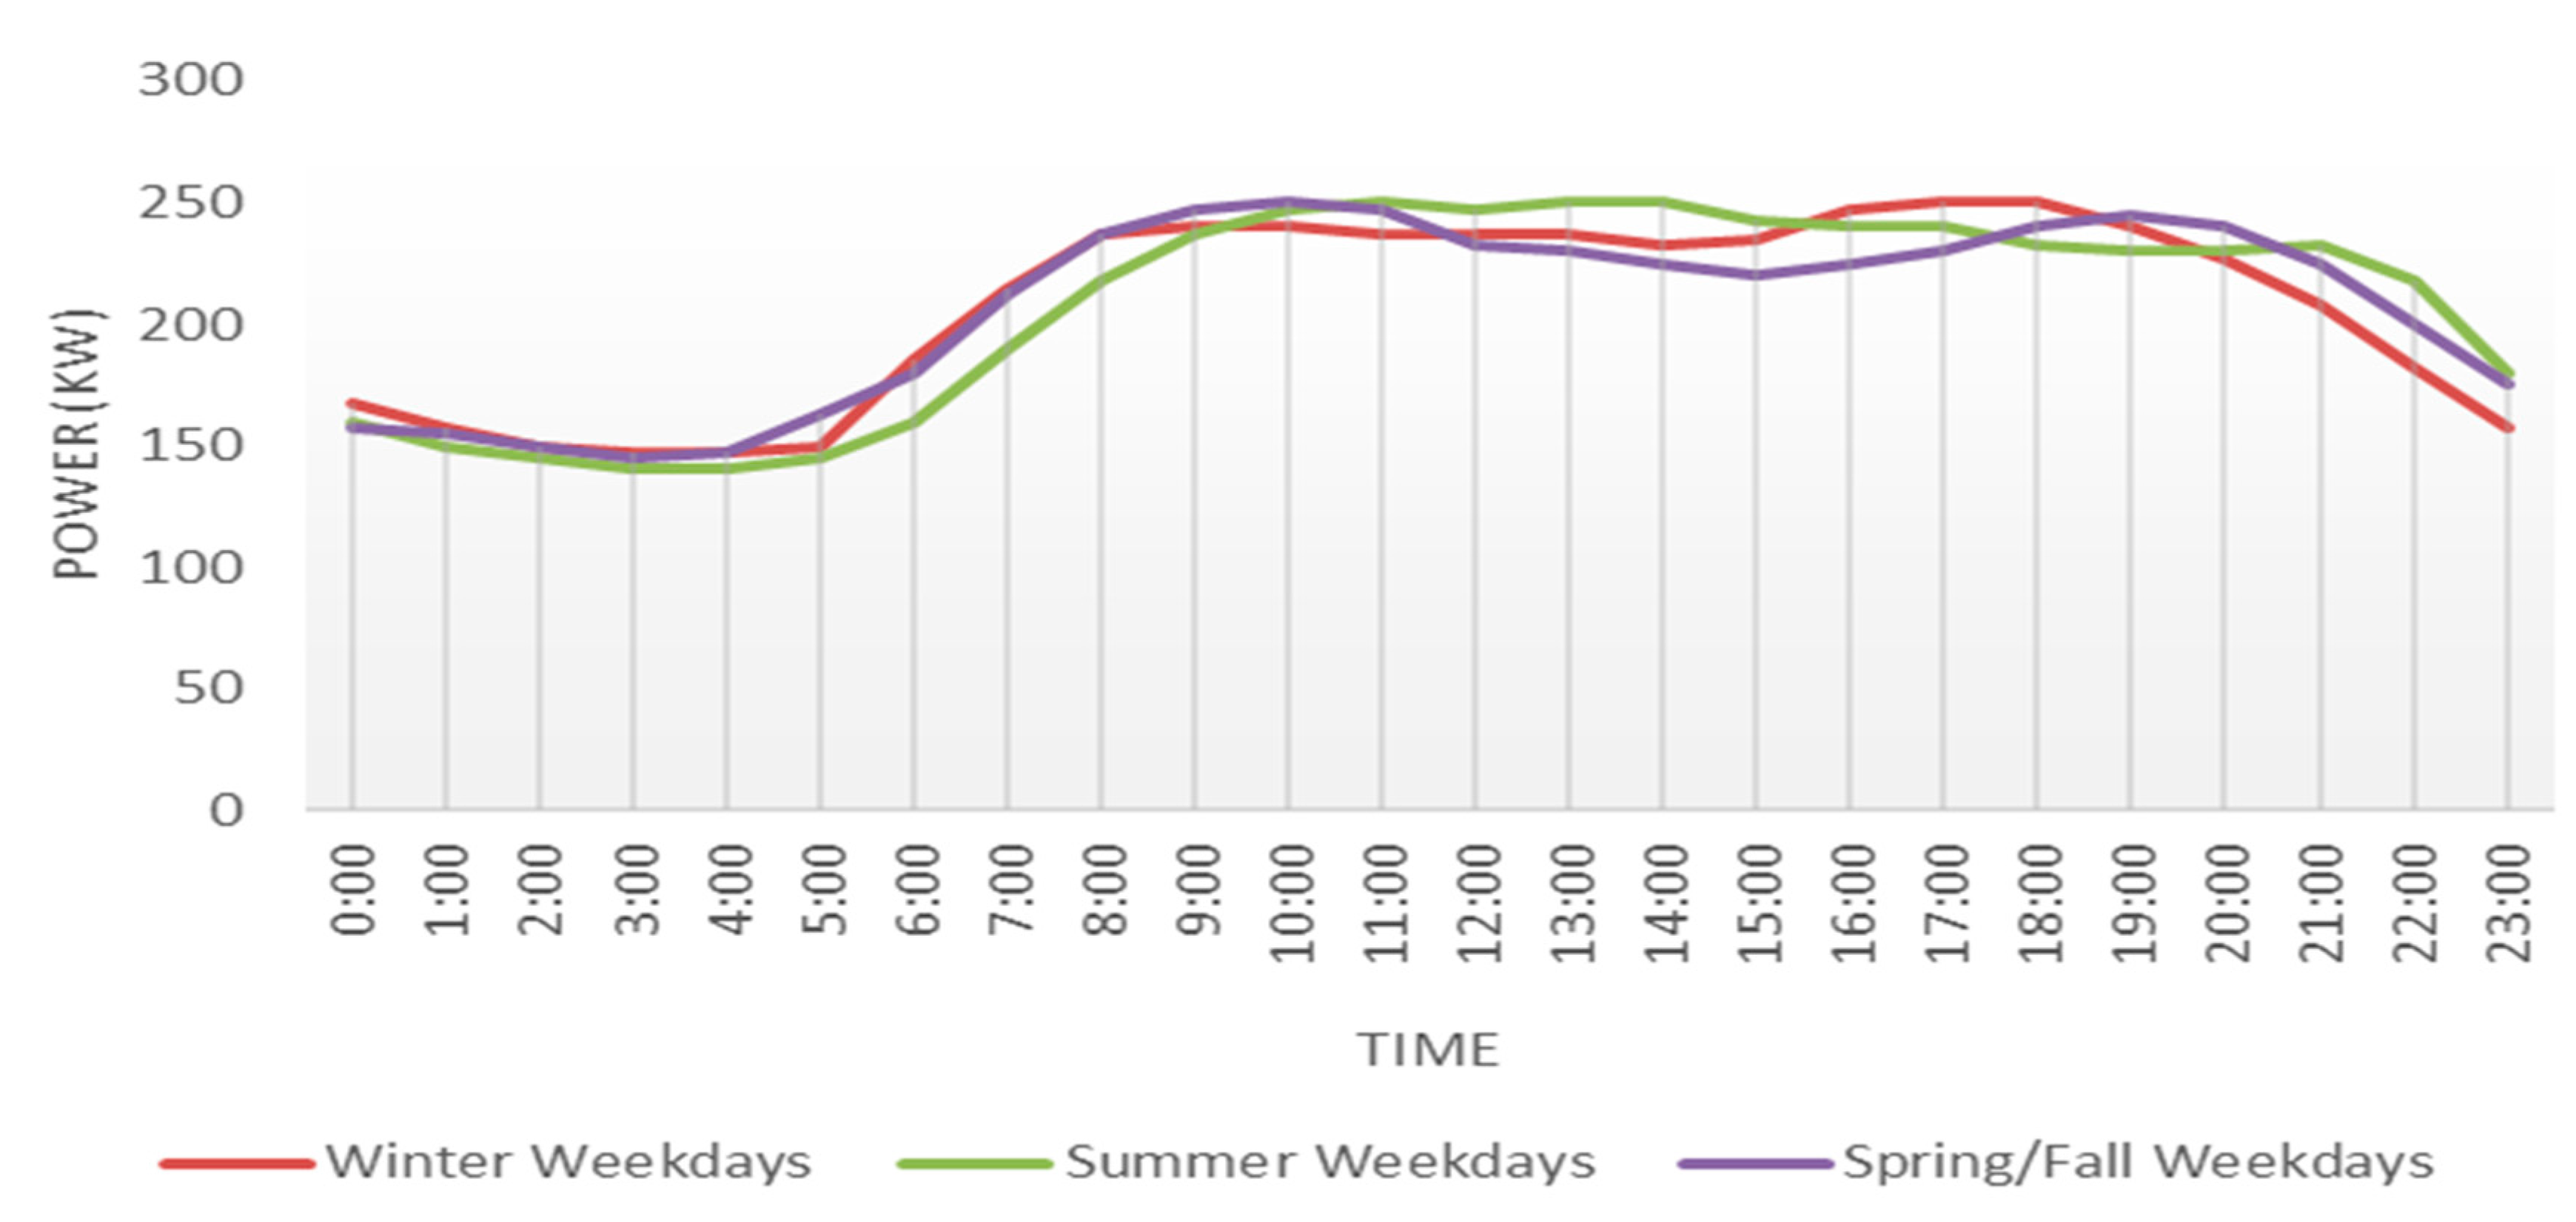
2.4. Load Profile System
2.5. Economic Investigation for the Studied System
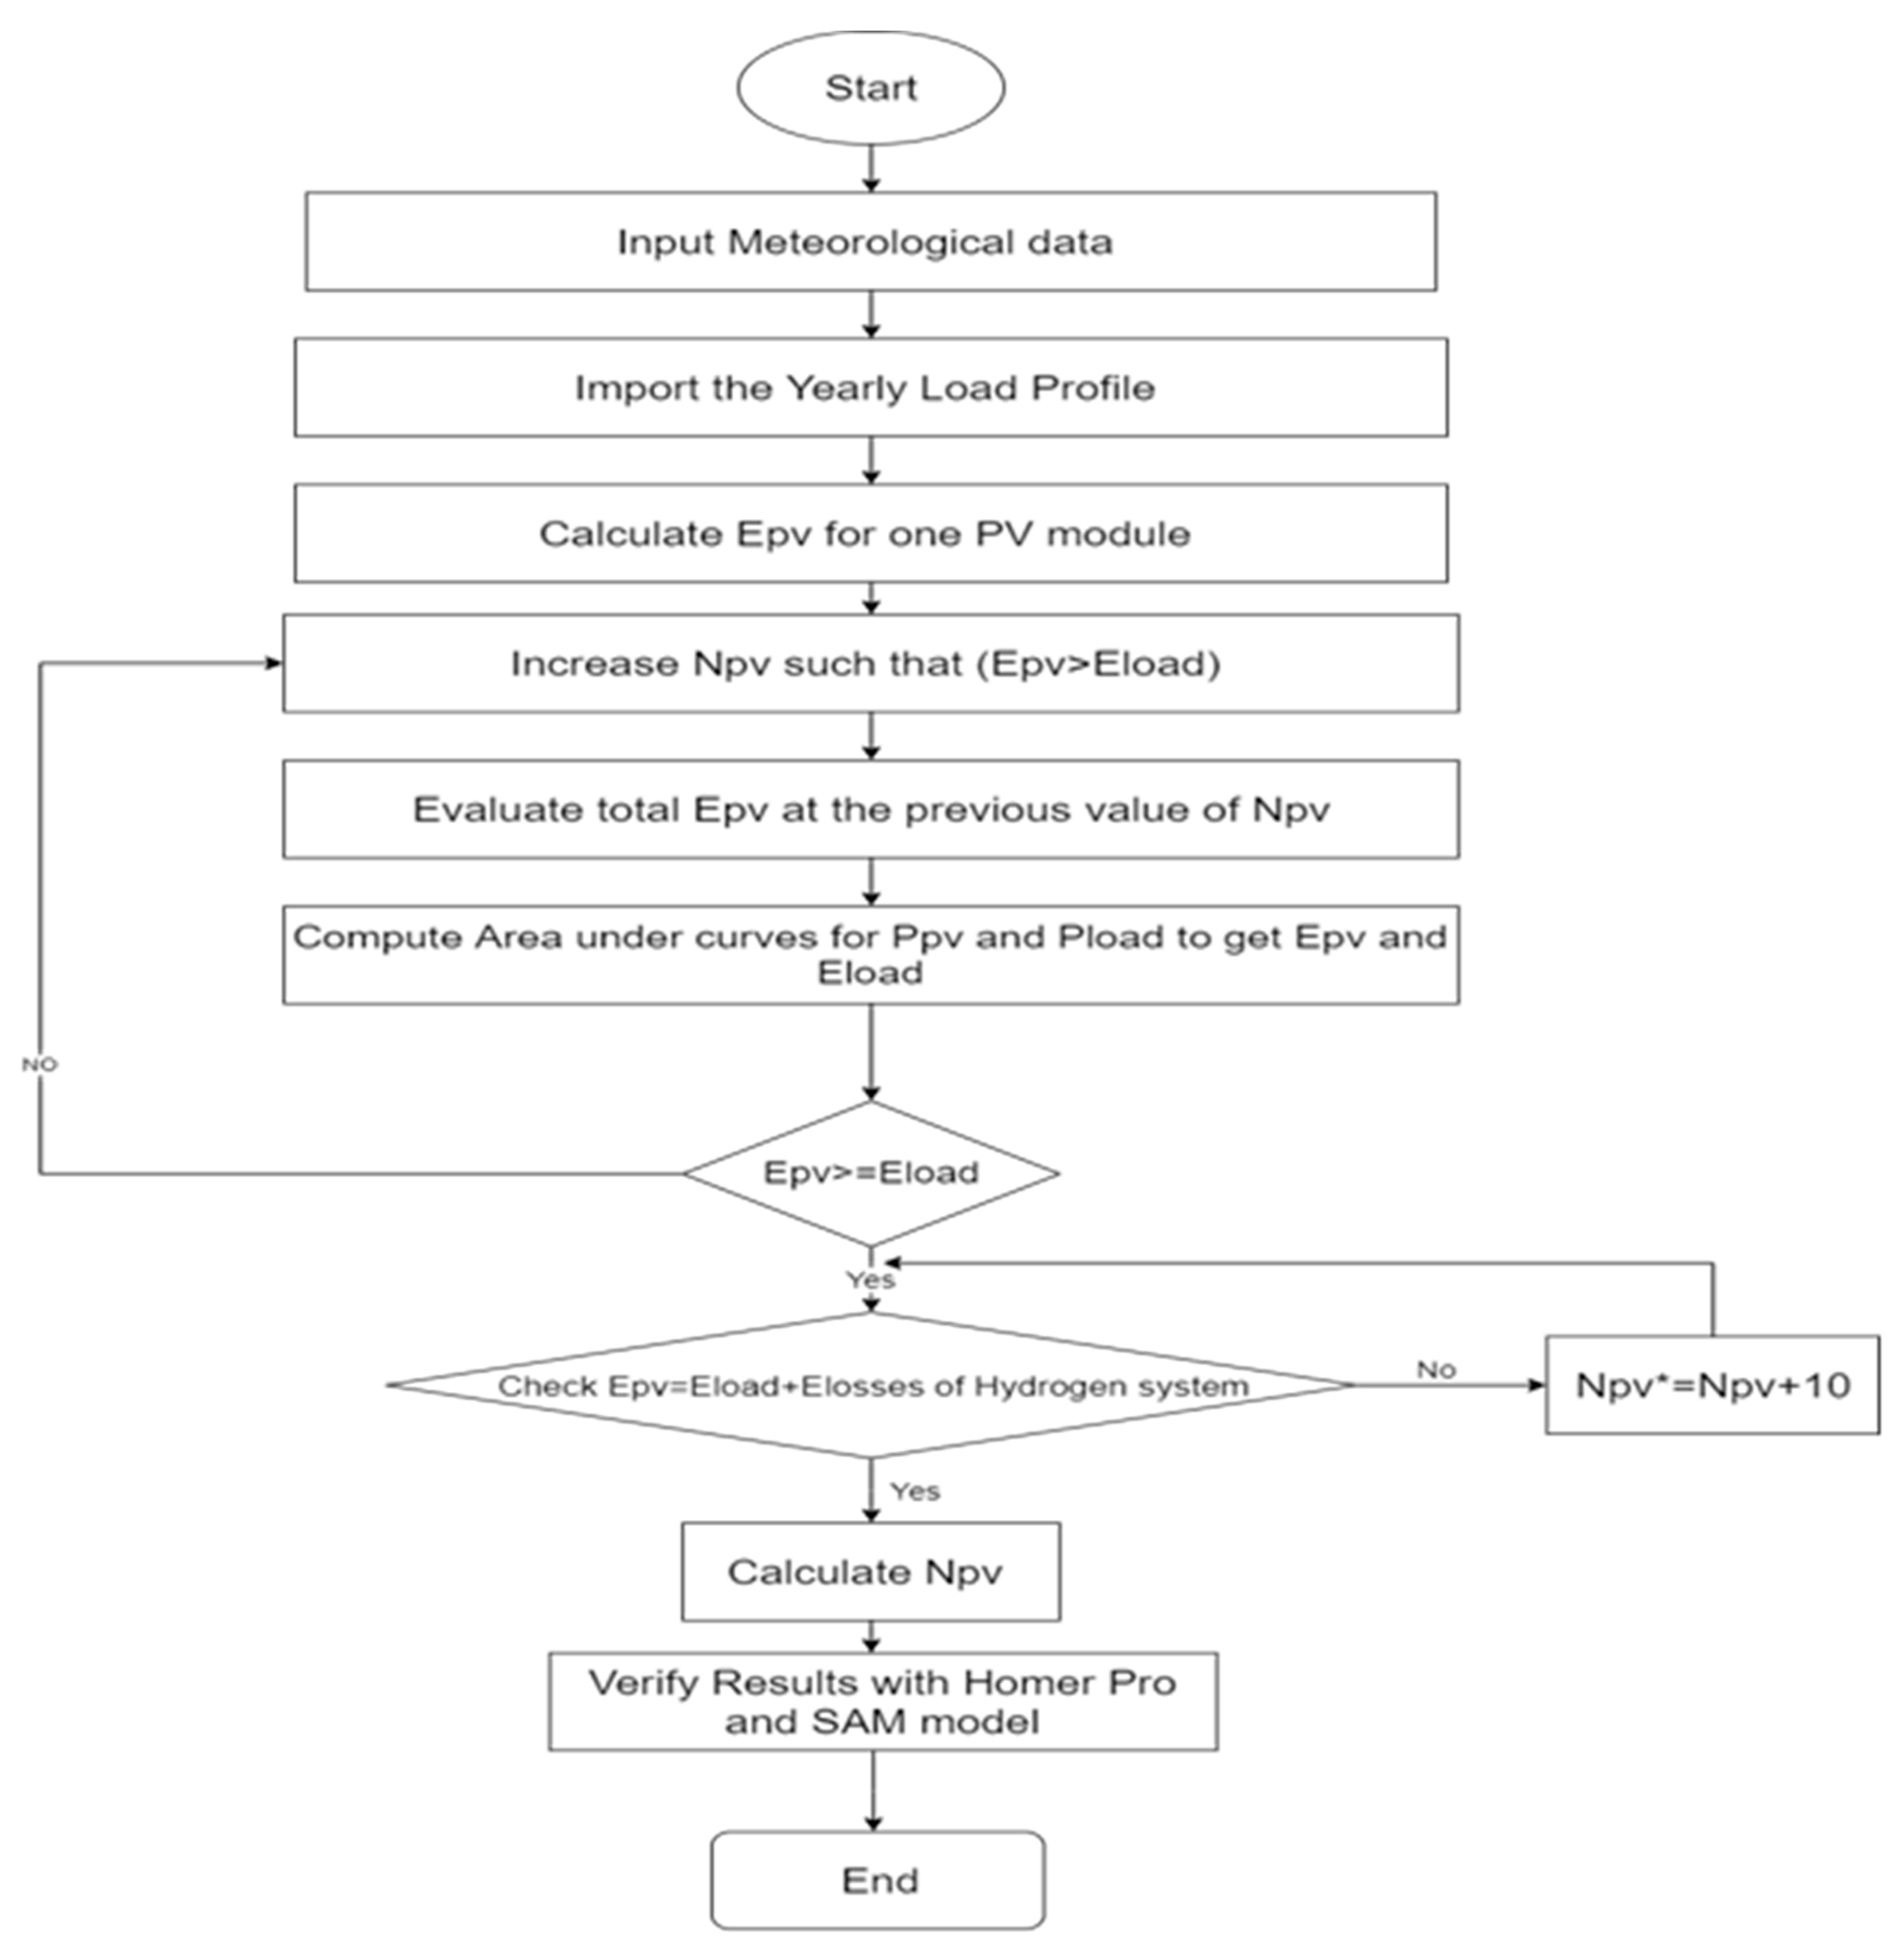
3. Methodology: Deterministic Balance Method (DBM)
4. Results and Discussion
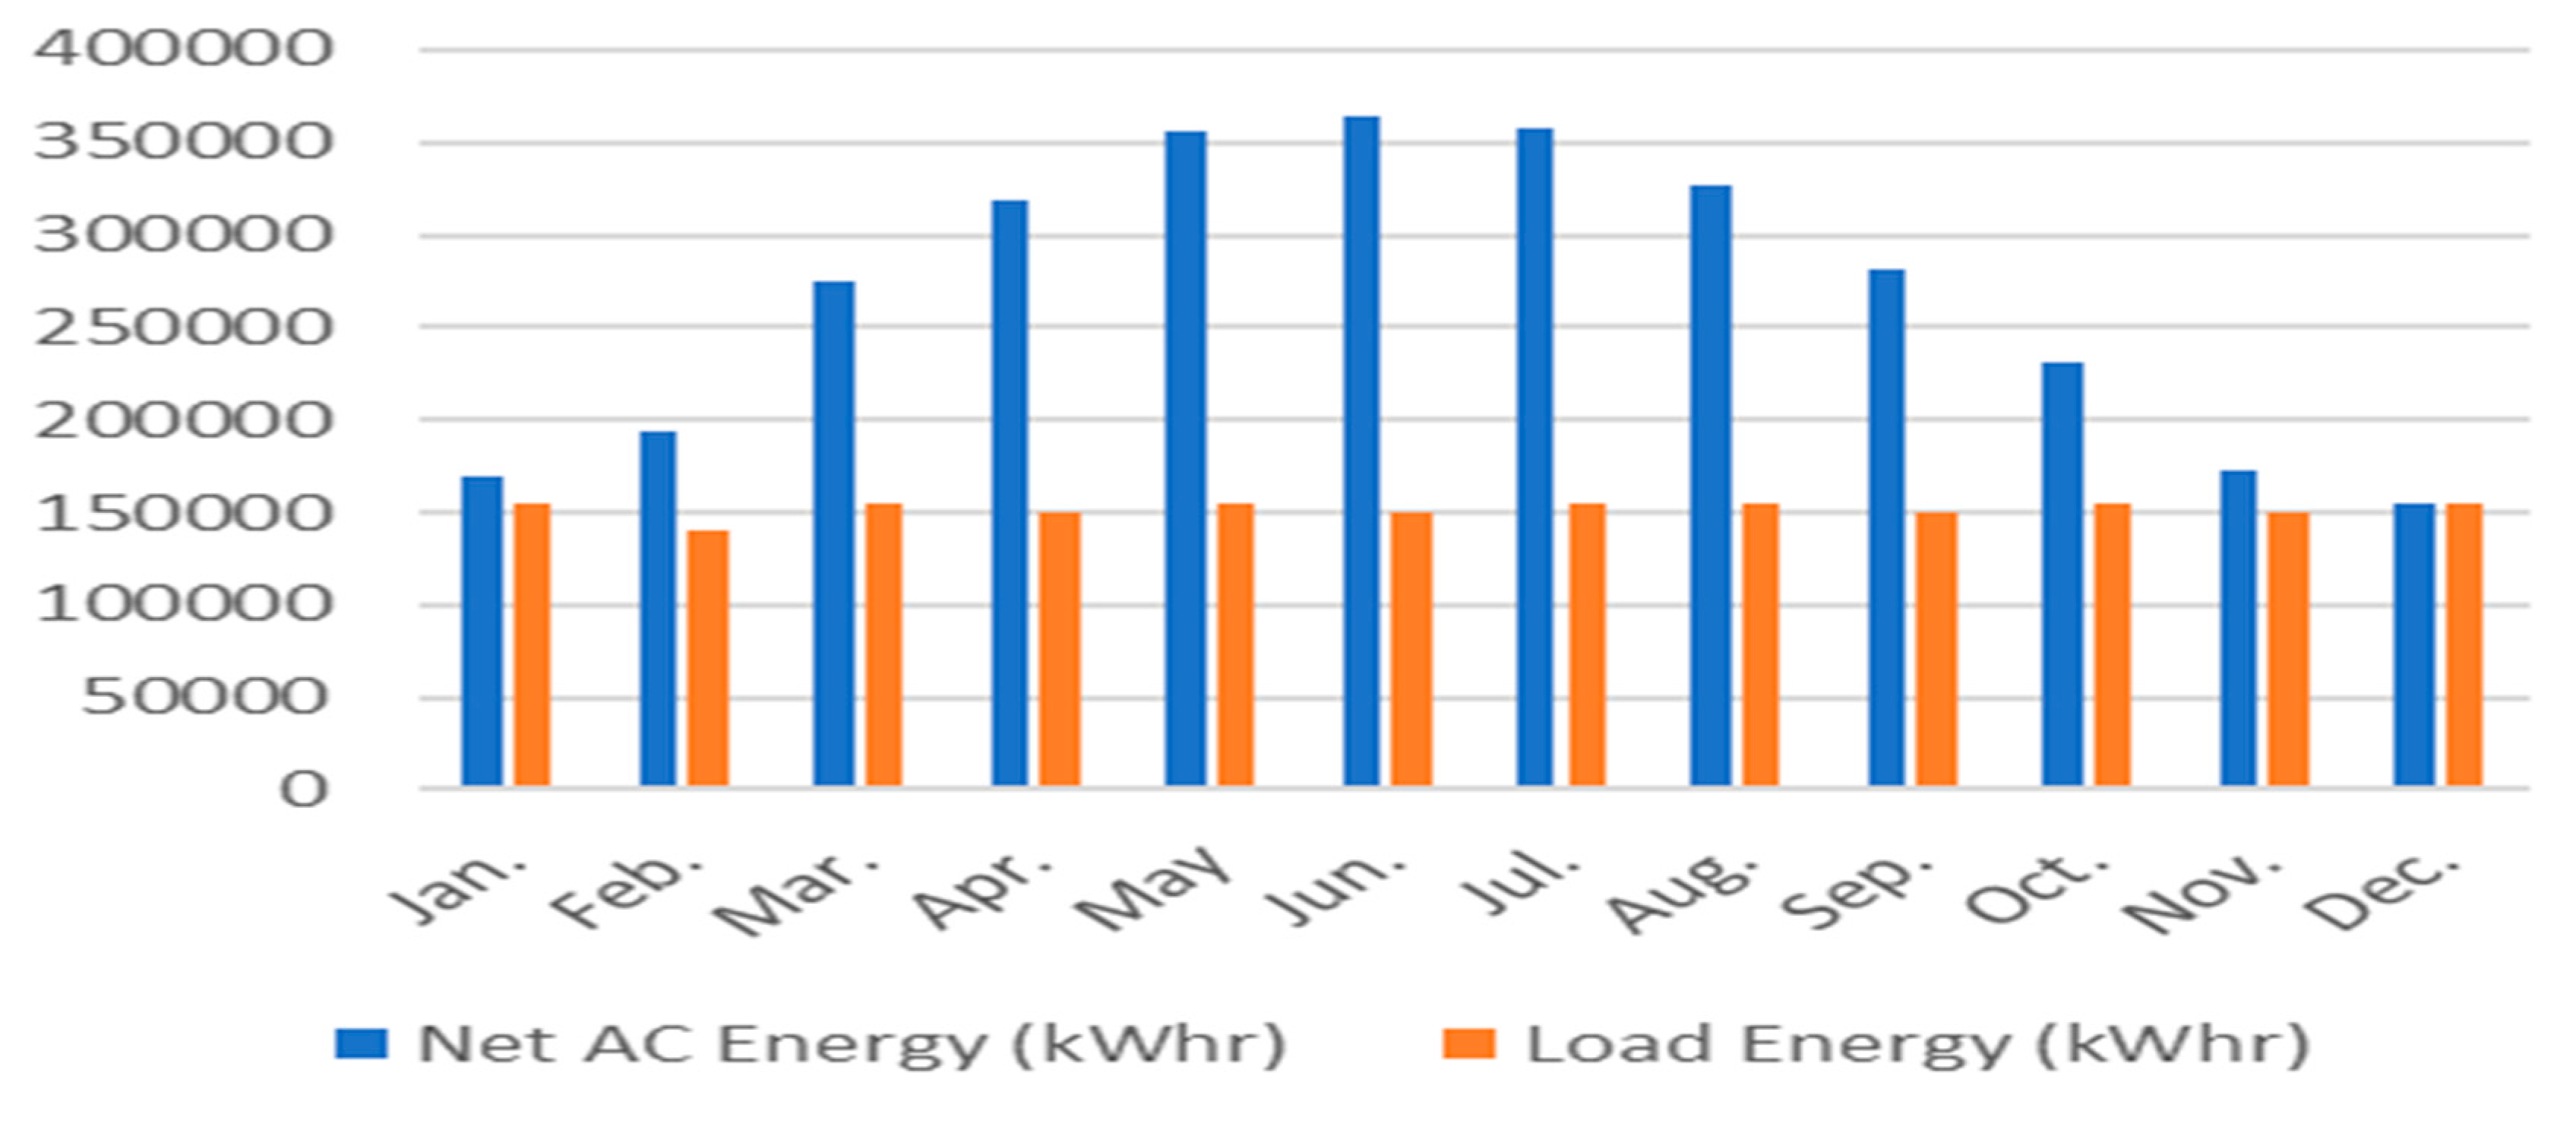
4.1. a. Sizing Methodology of Hybrid PV/Hydrogen System: Case Study 1
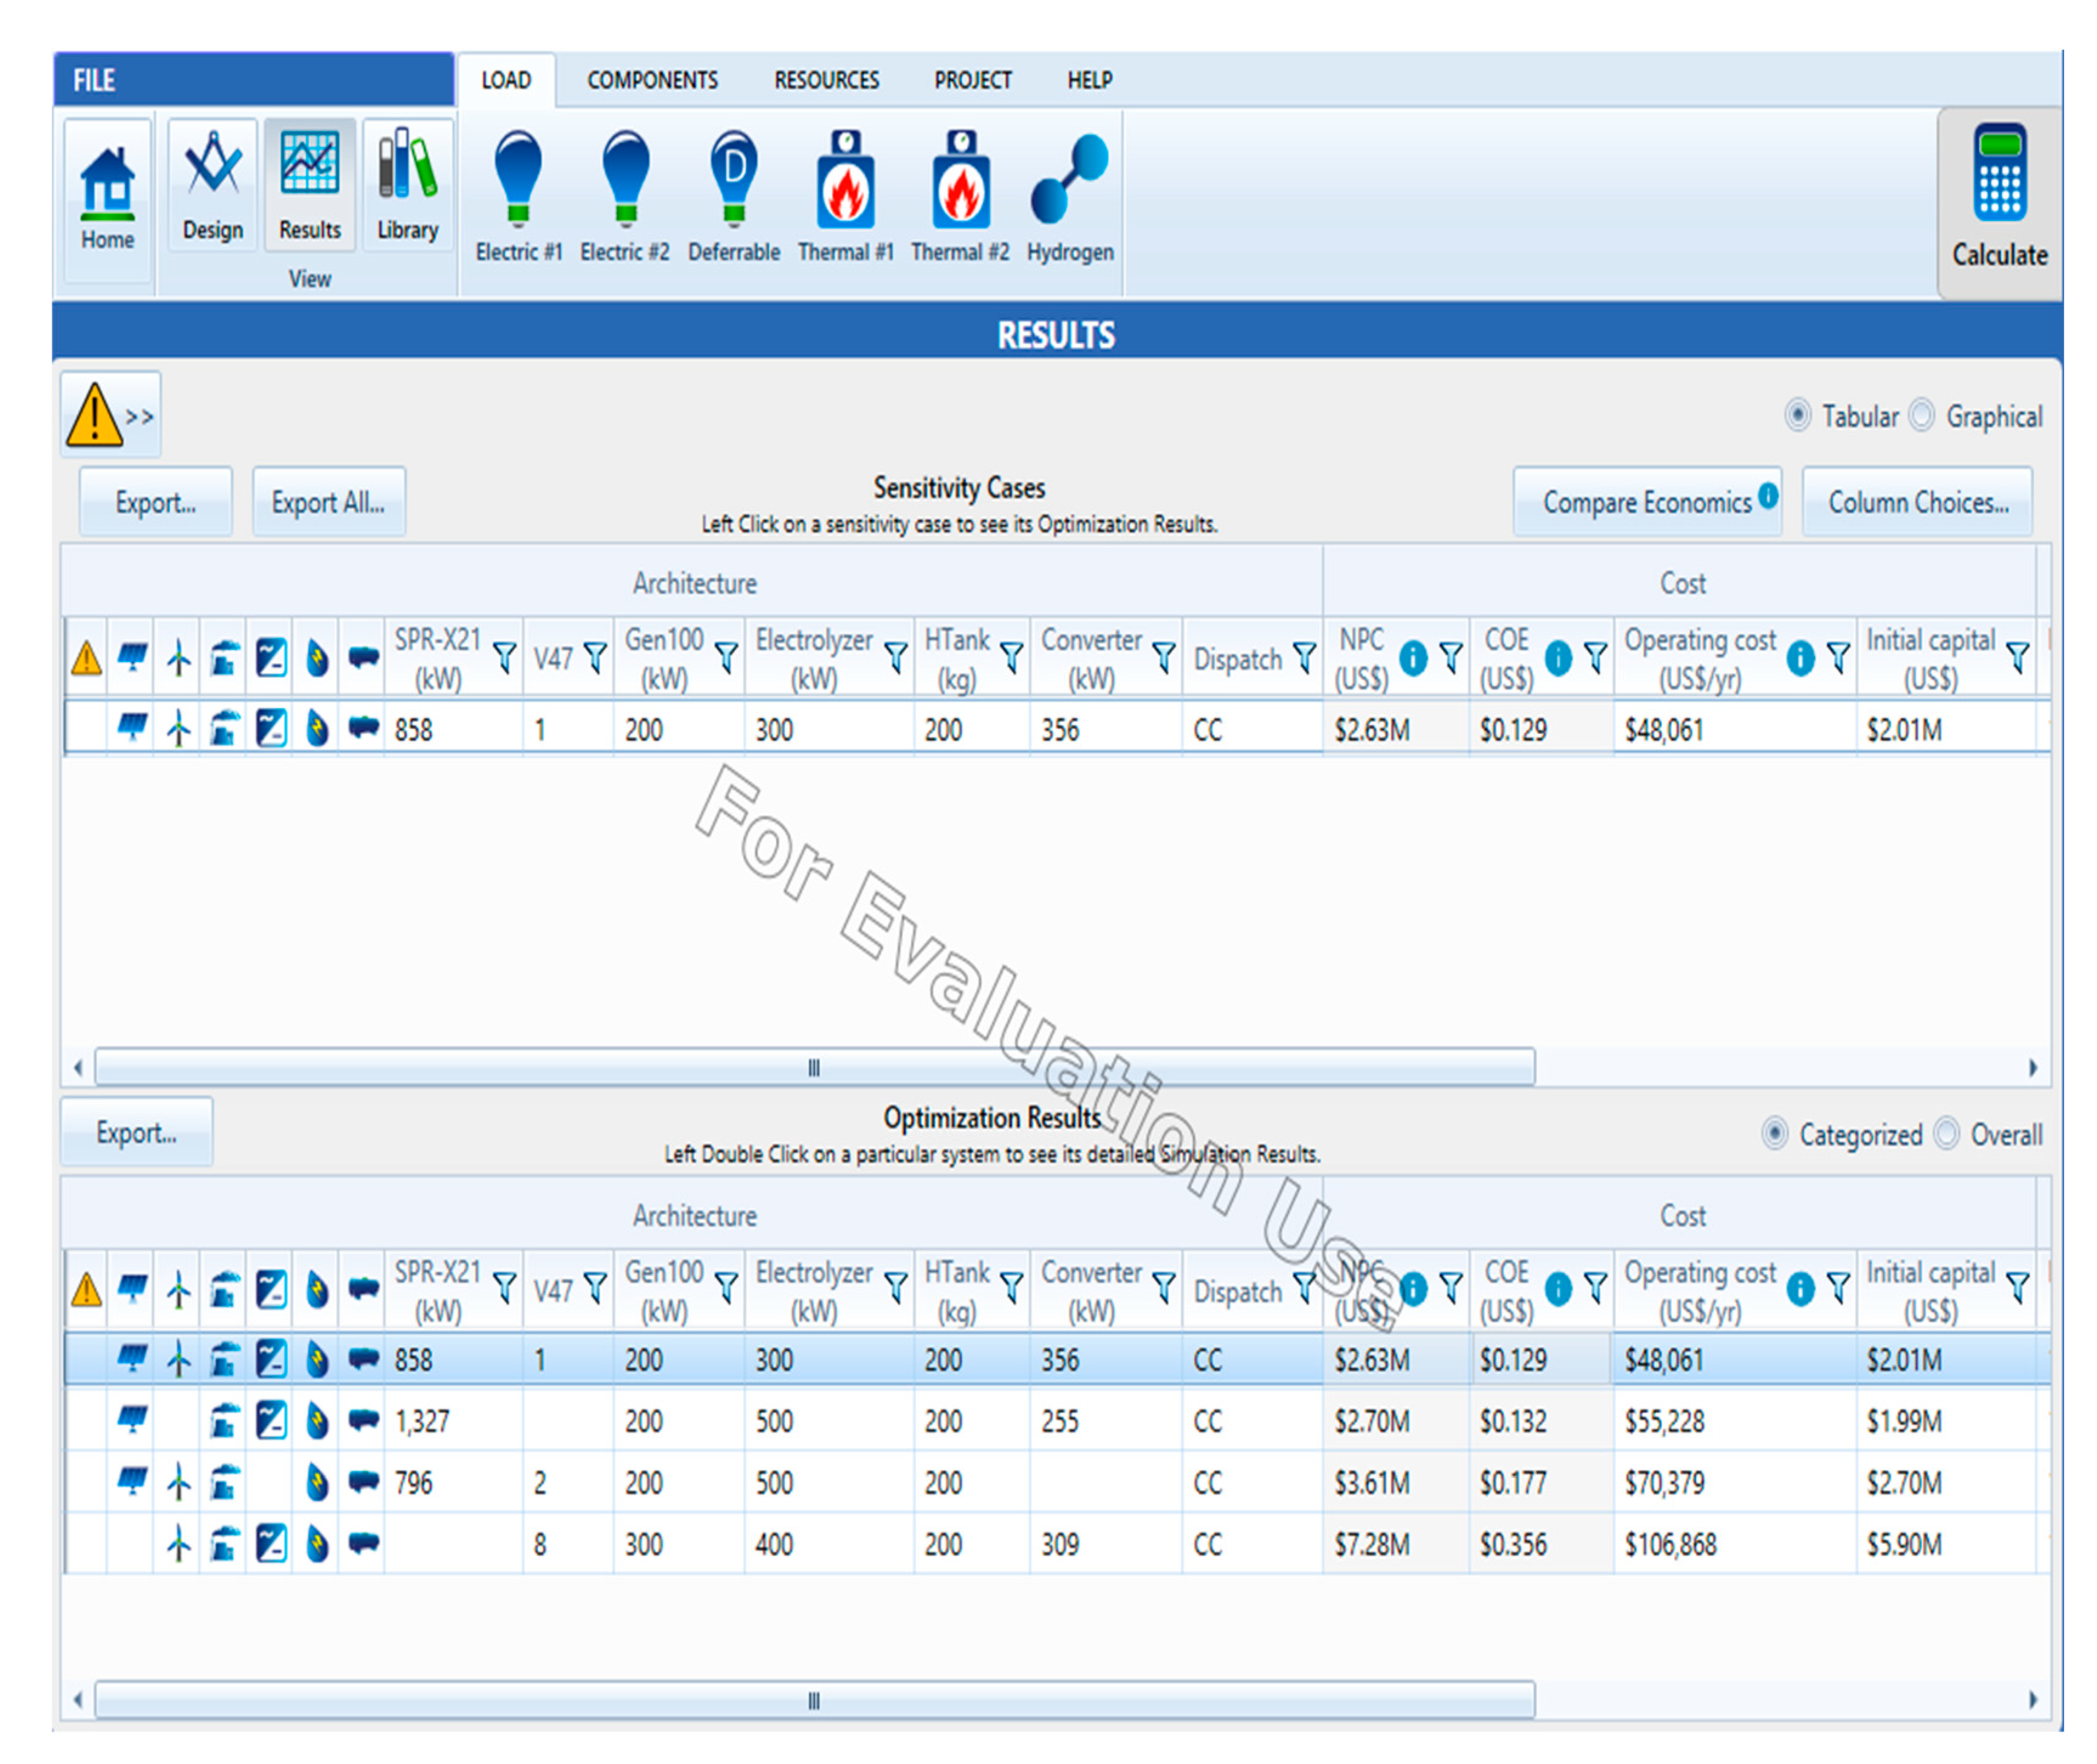
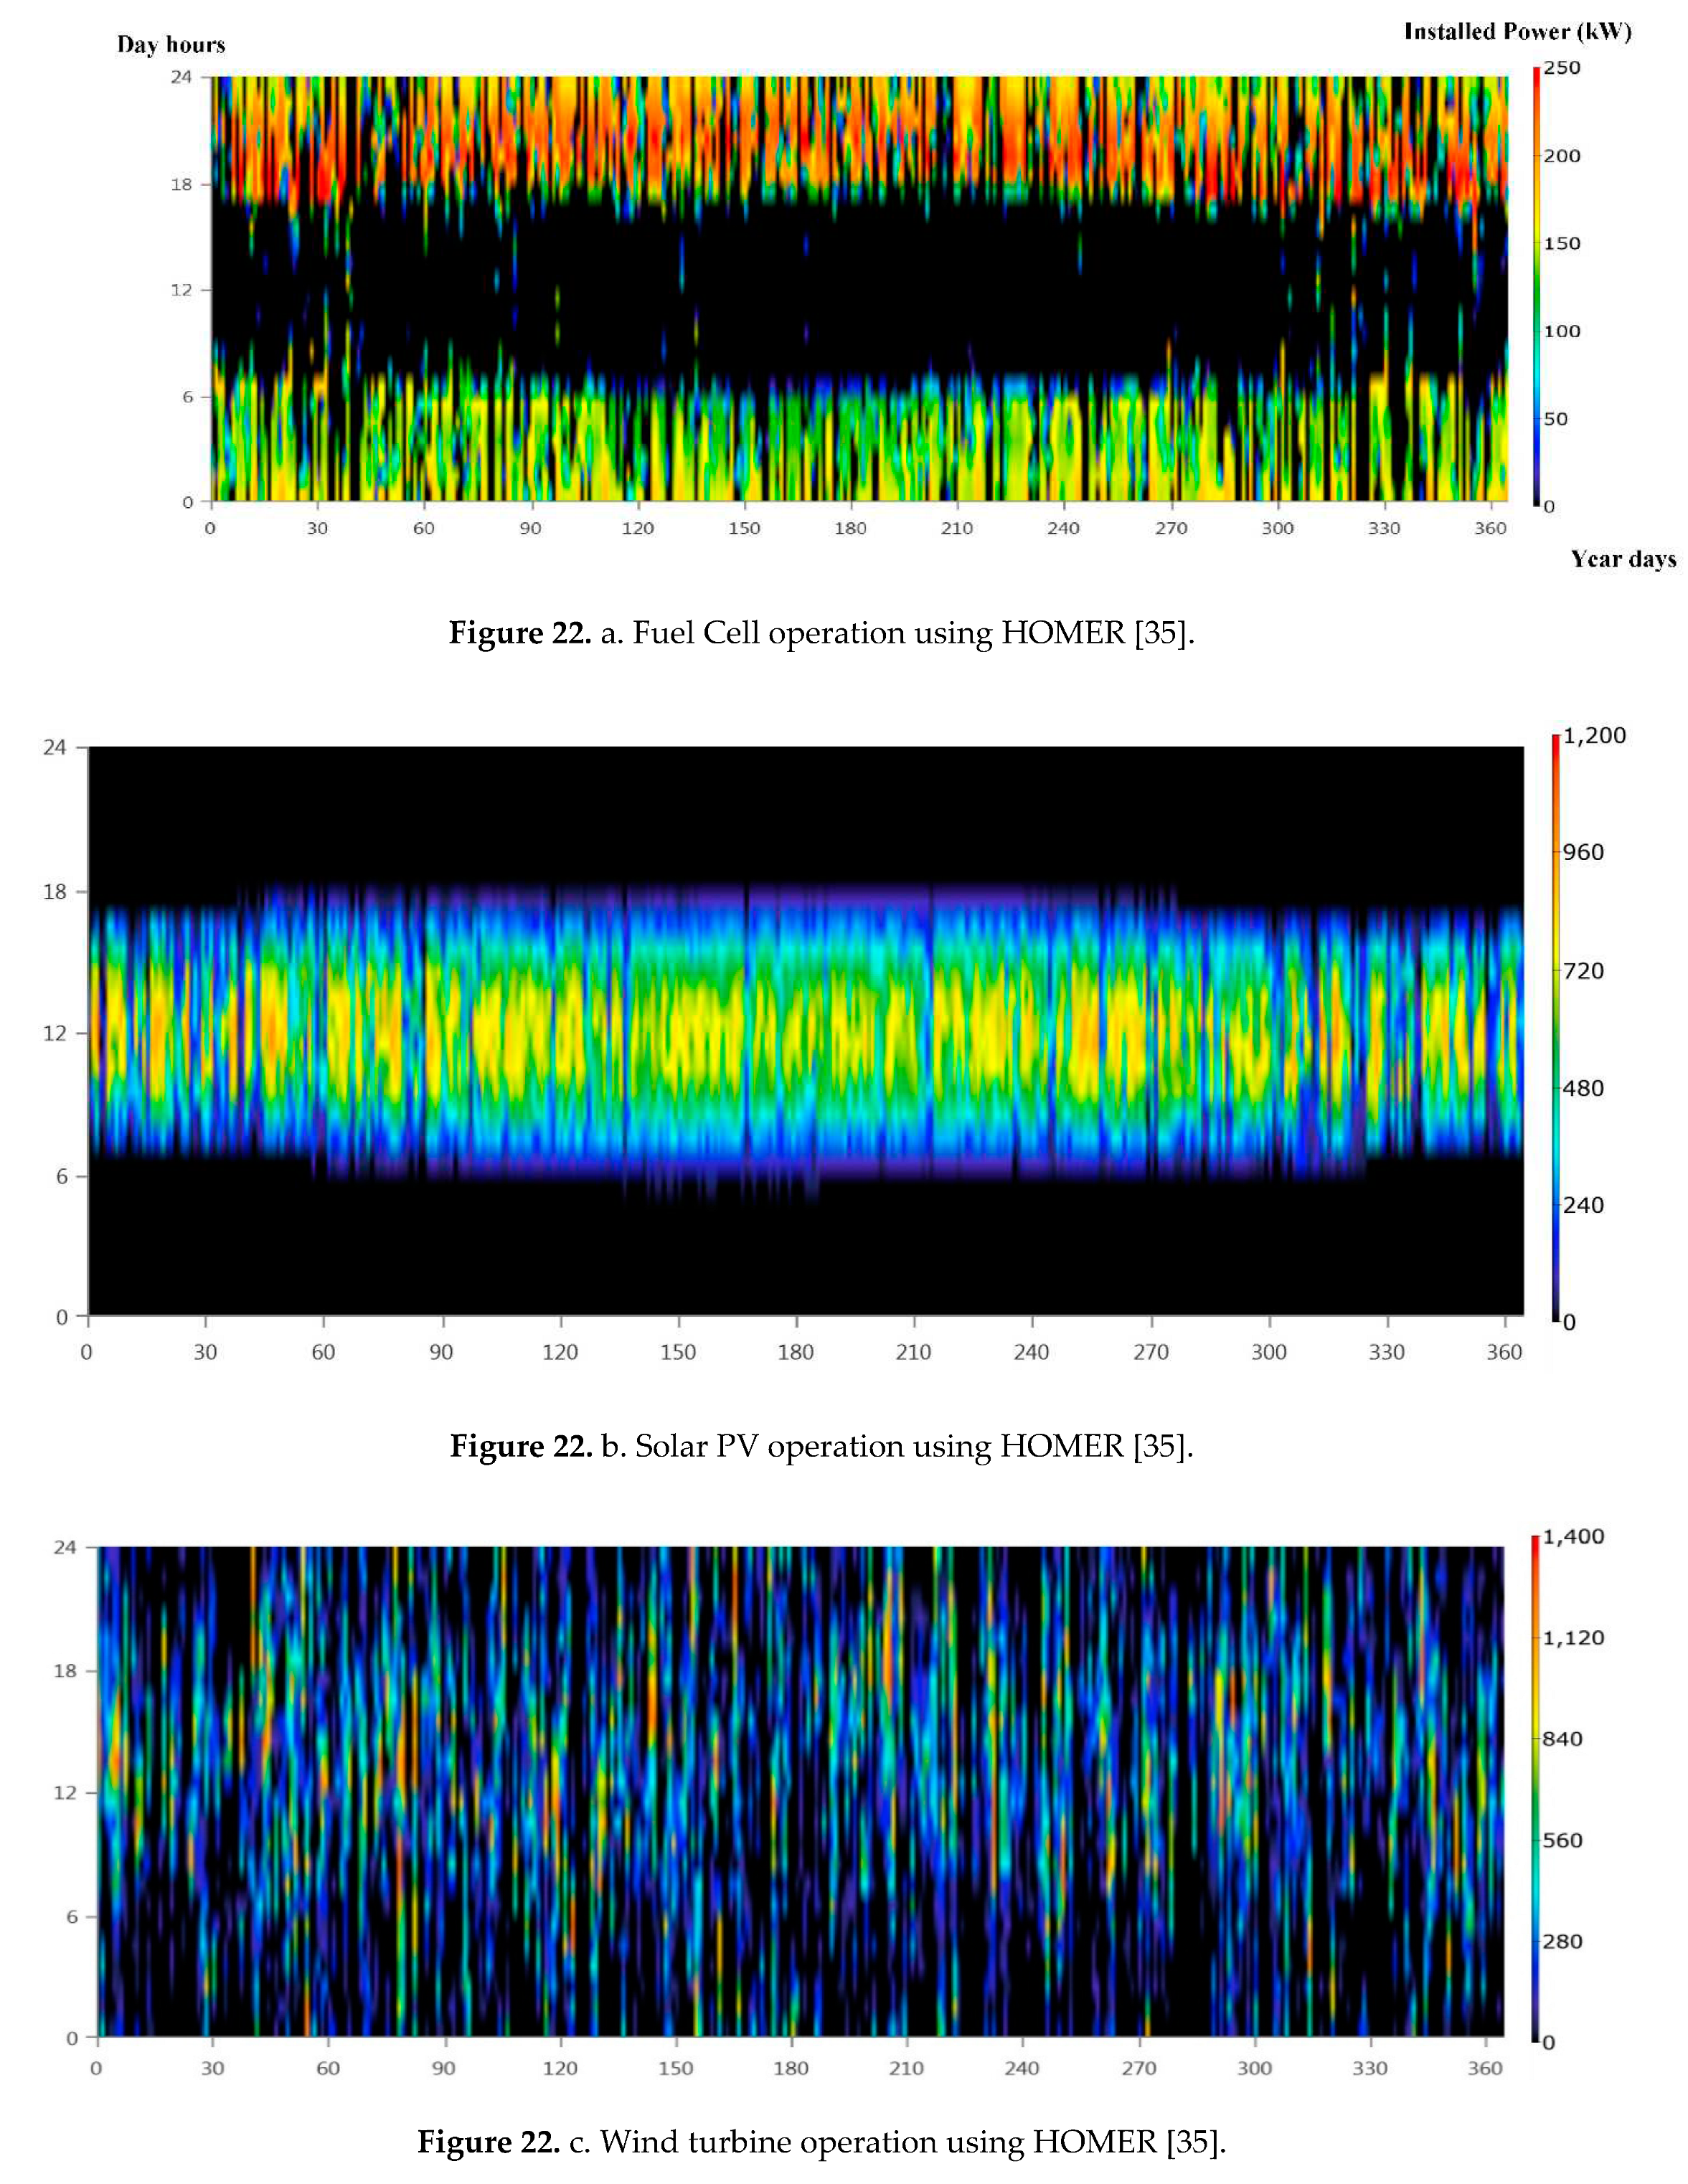
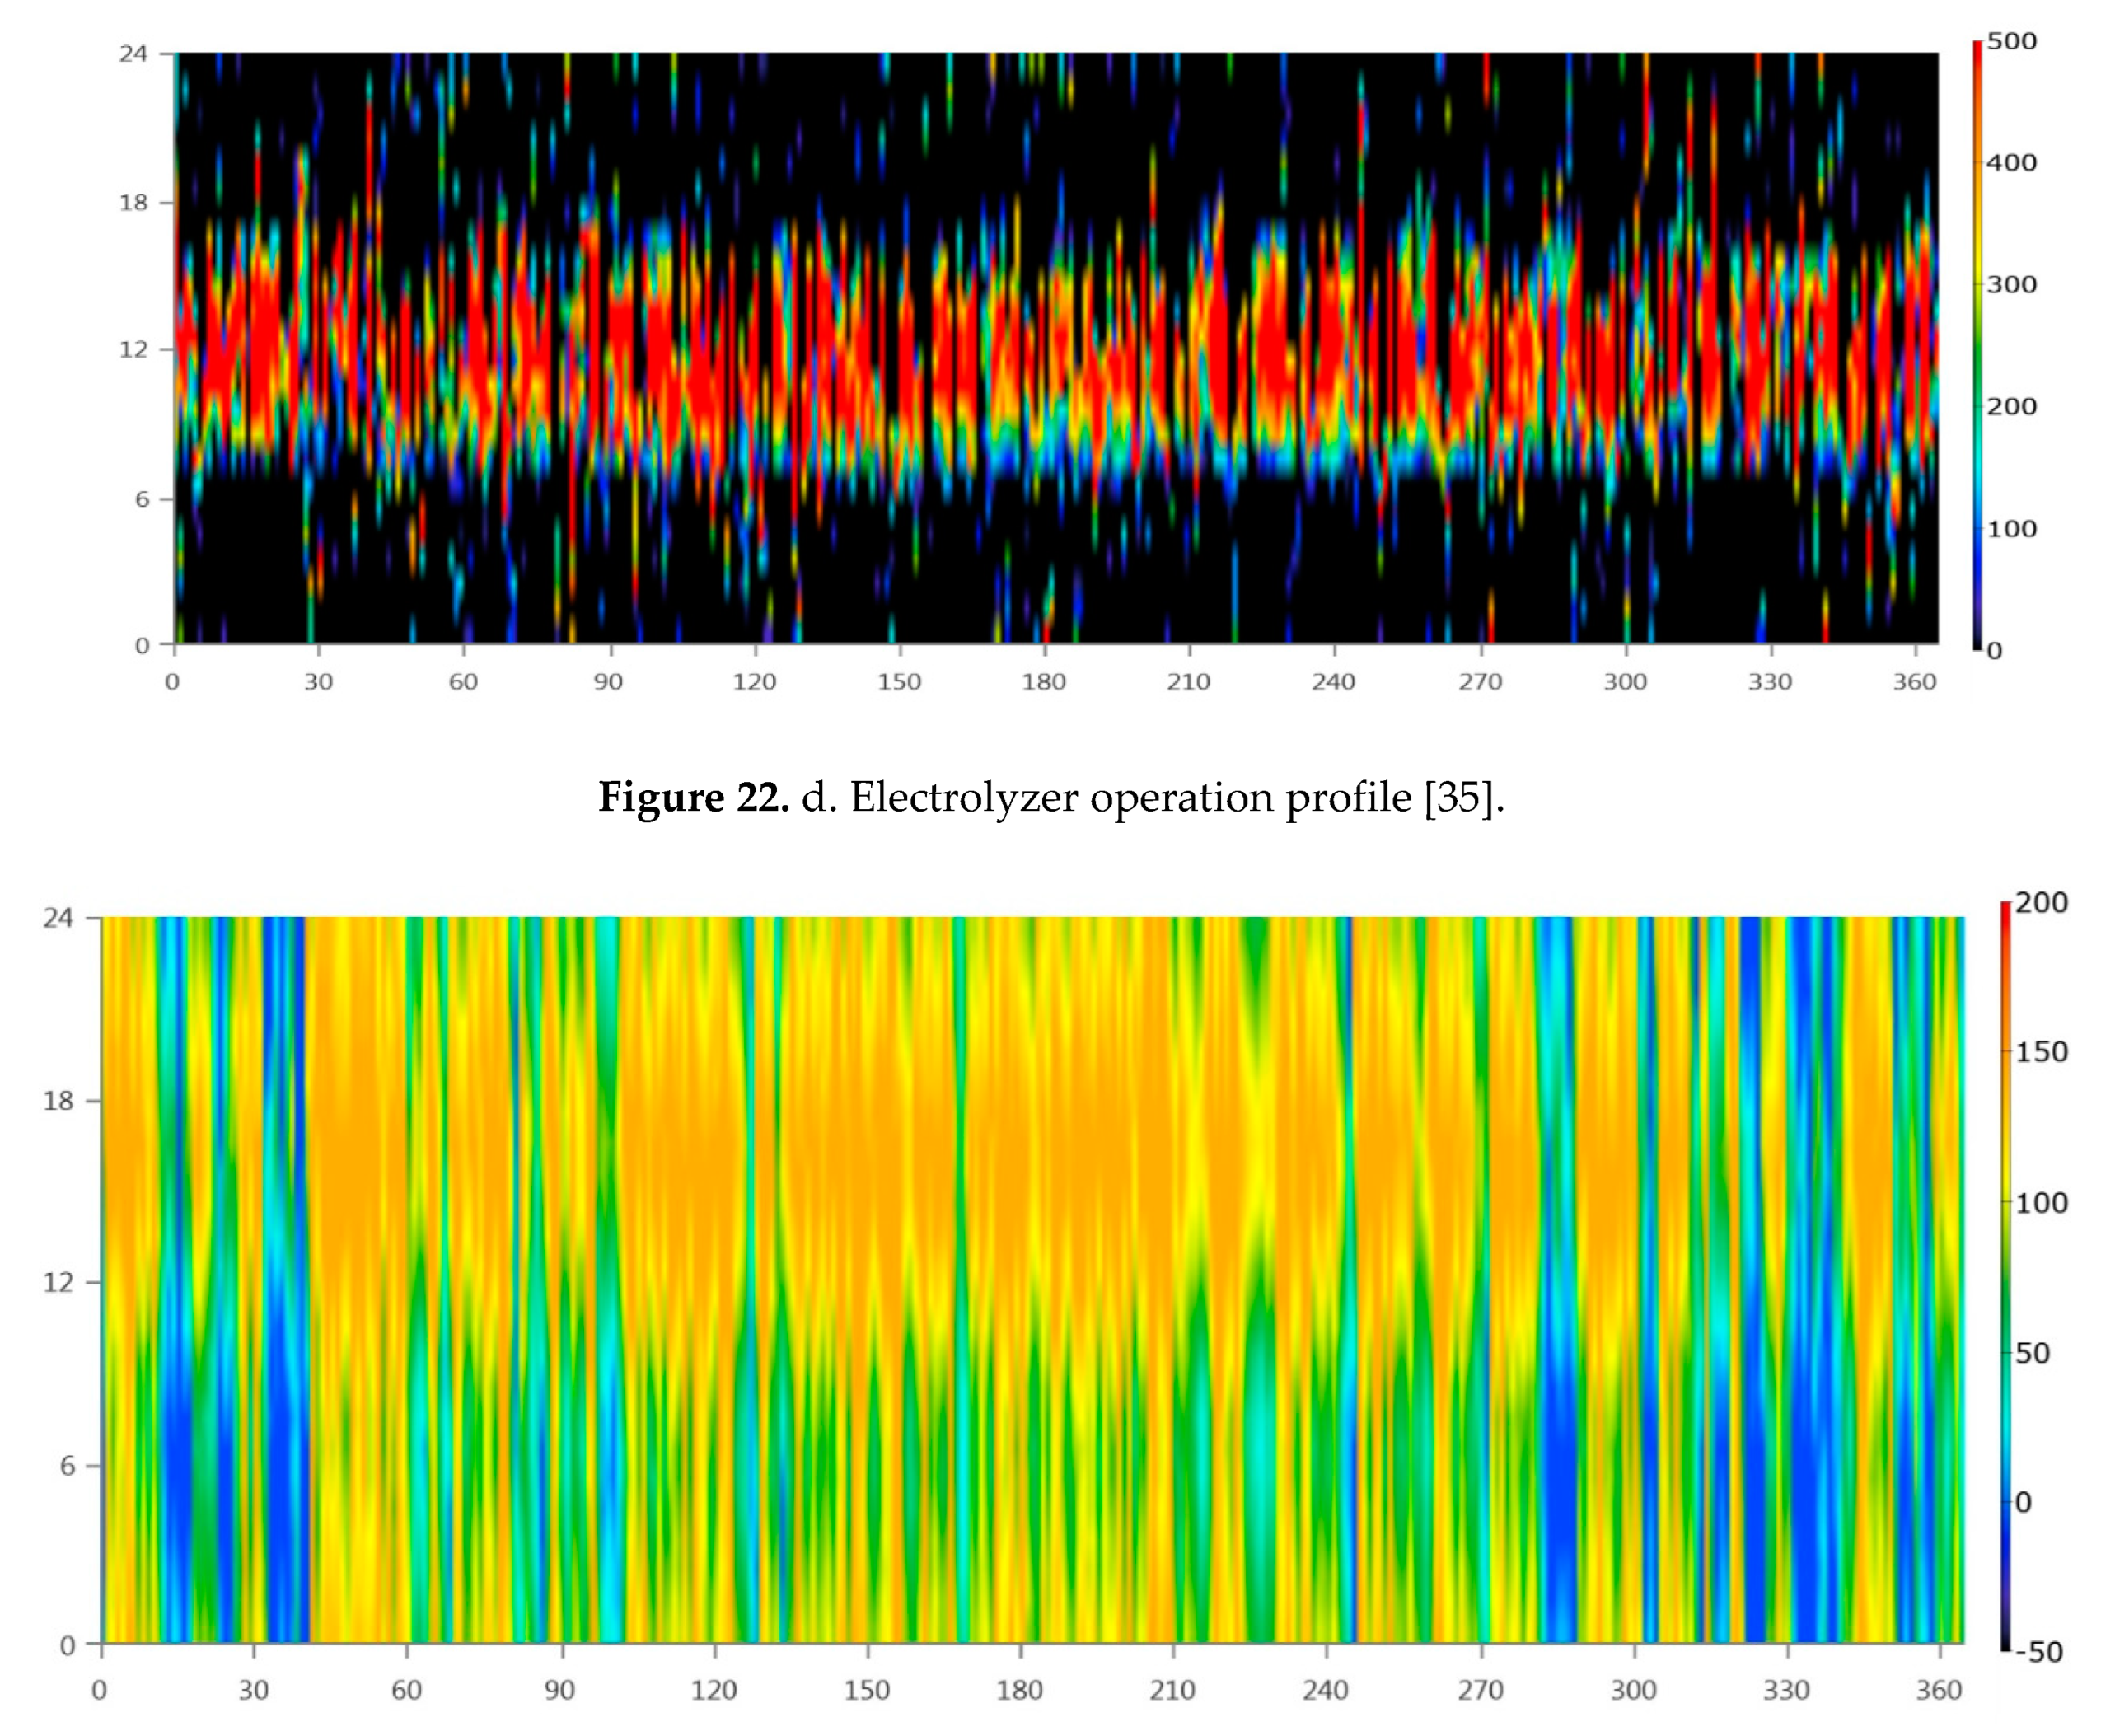
4.1. b. Evaluation Using HOMER Tool
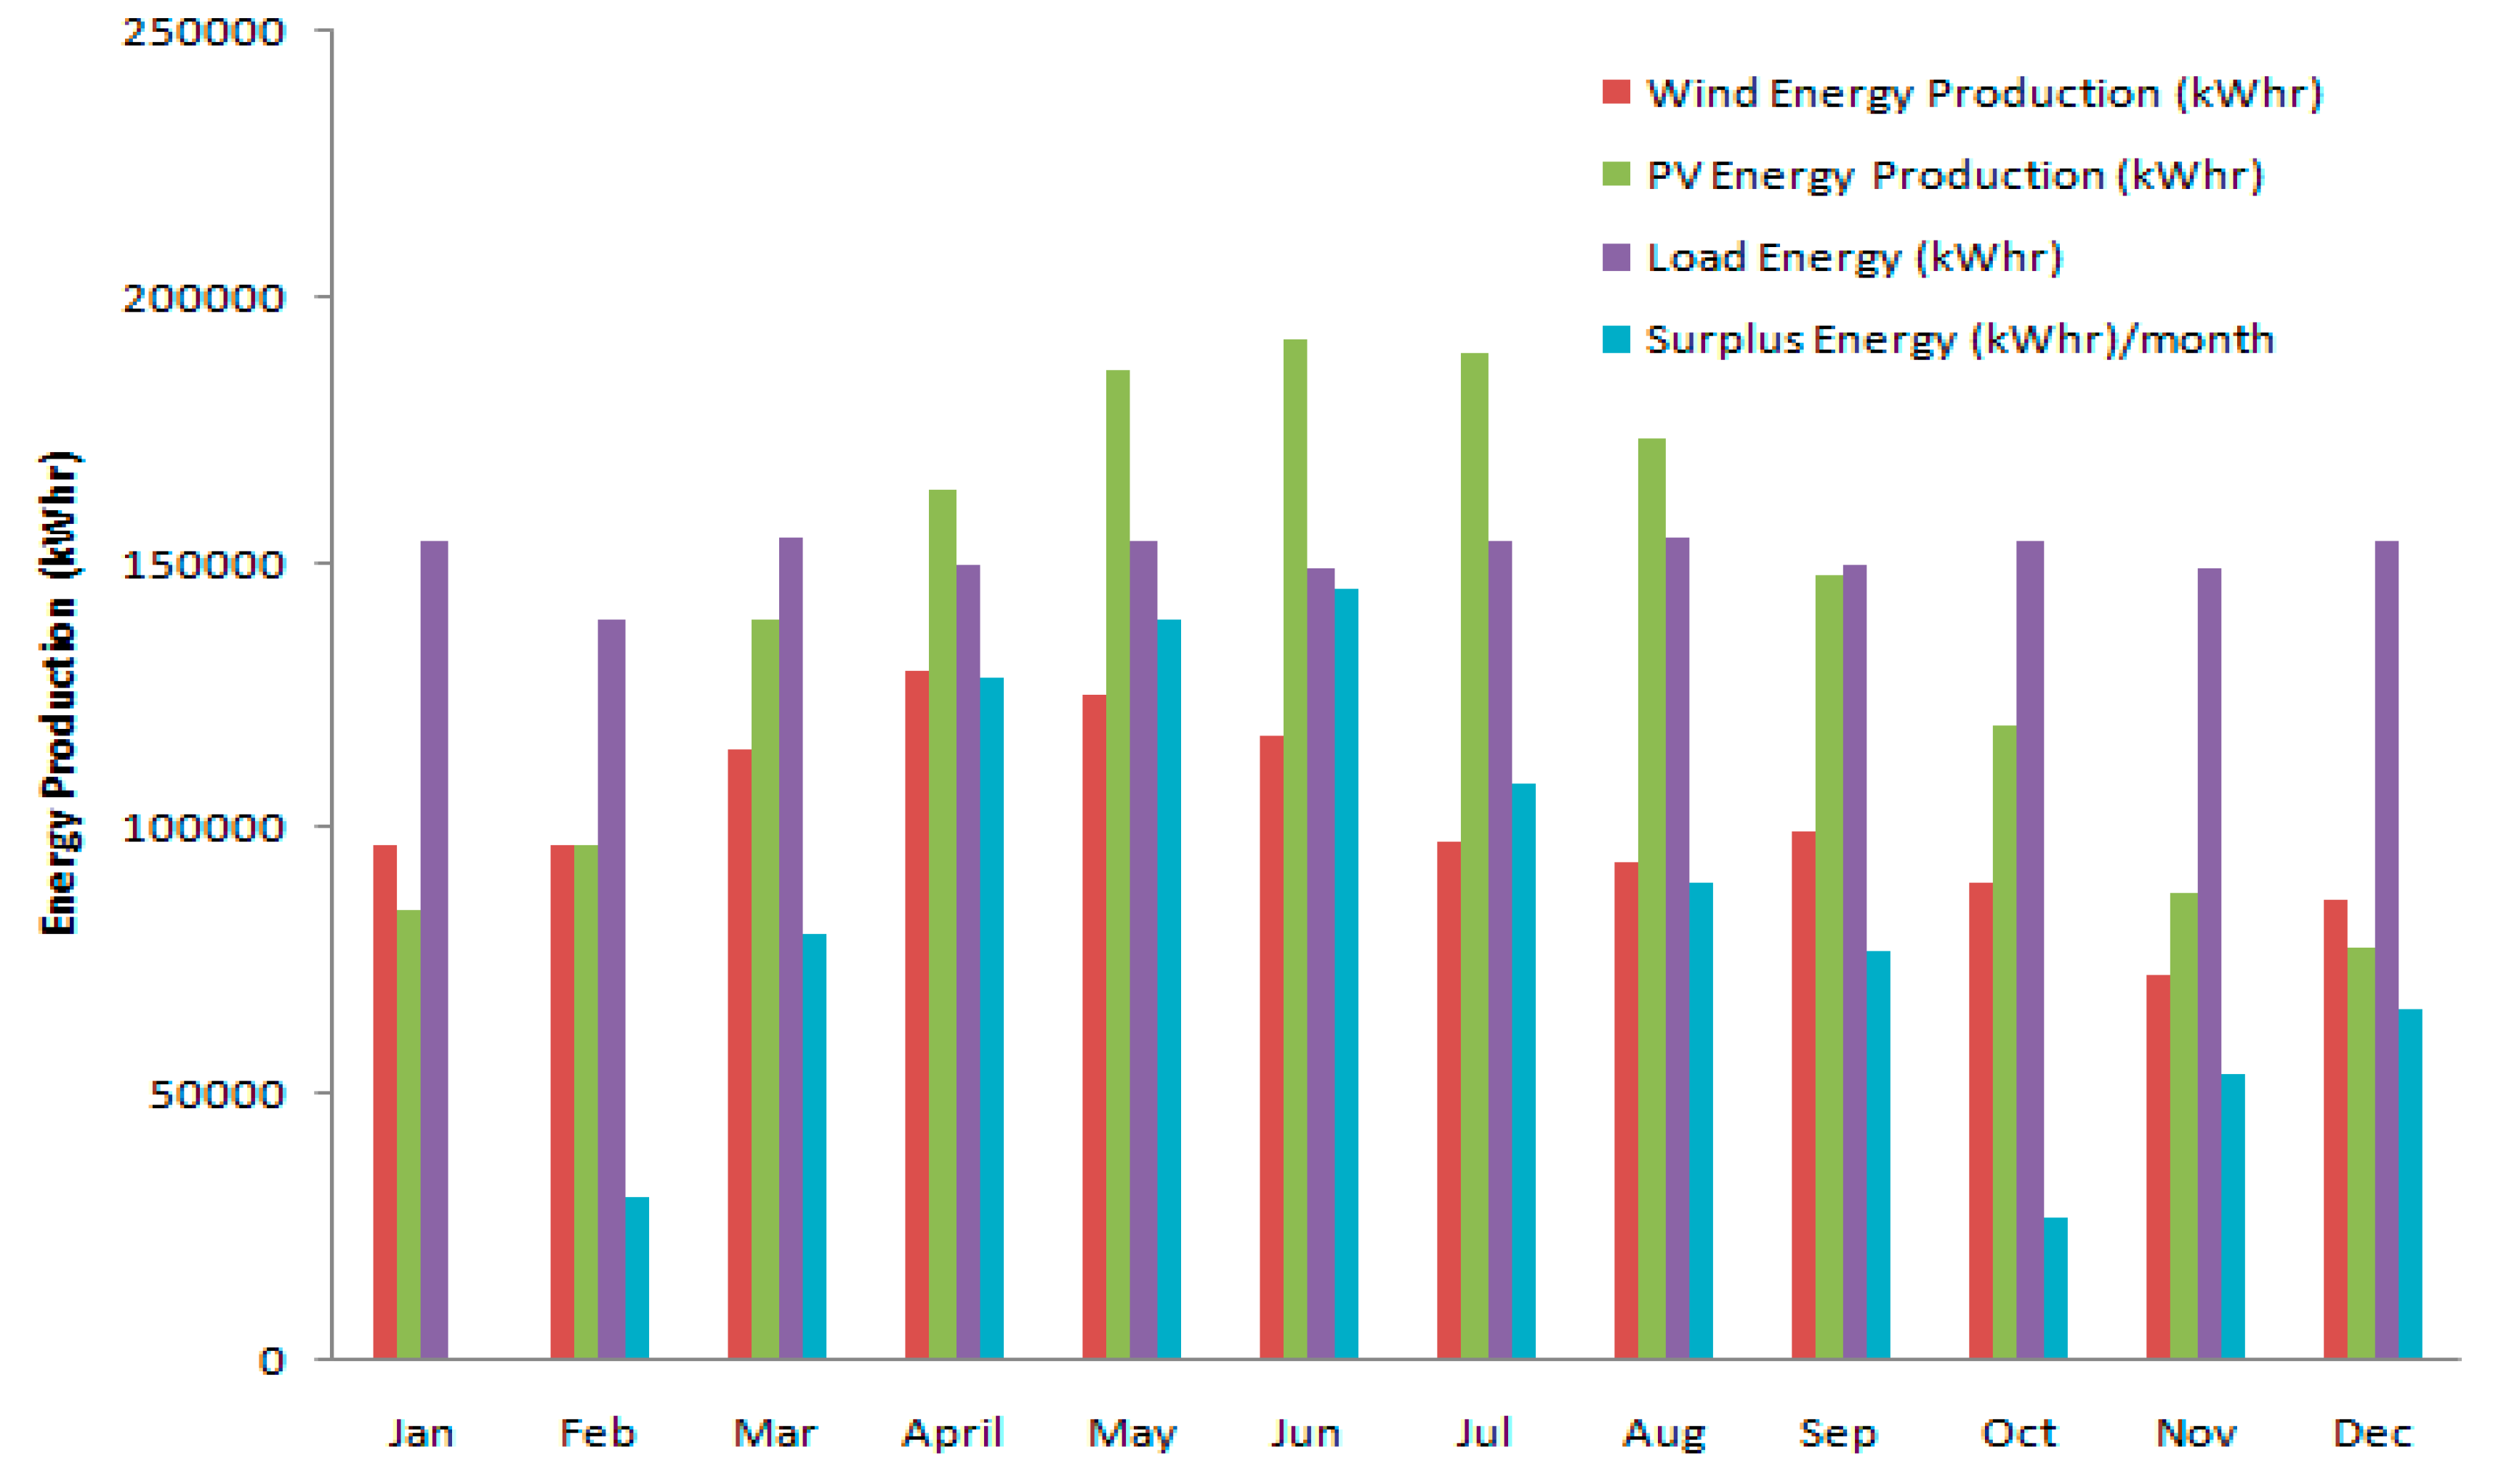
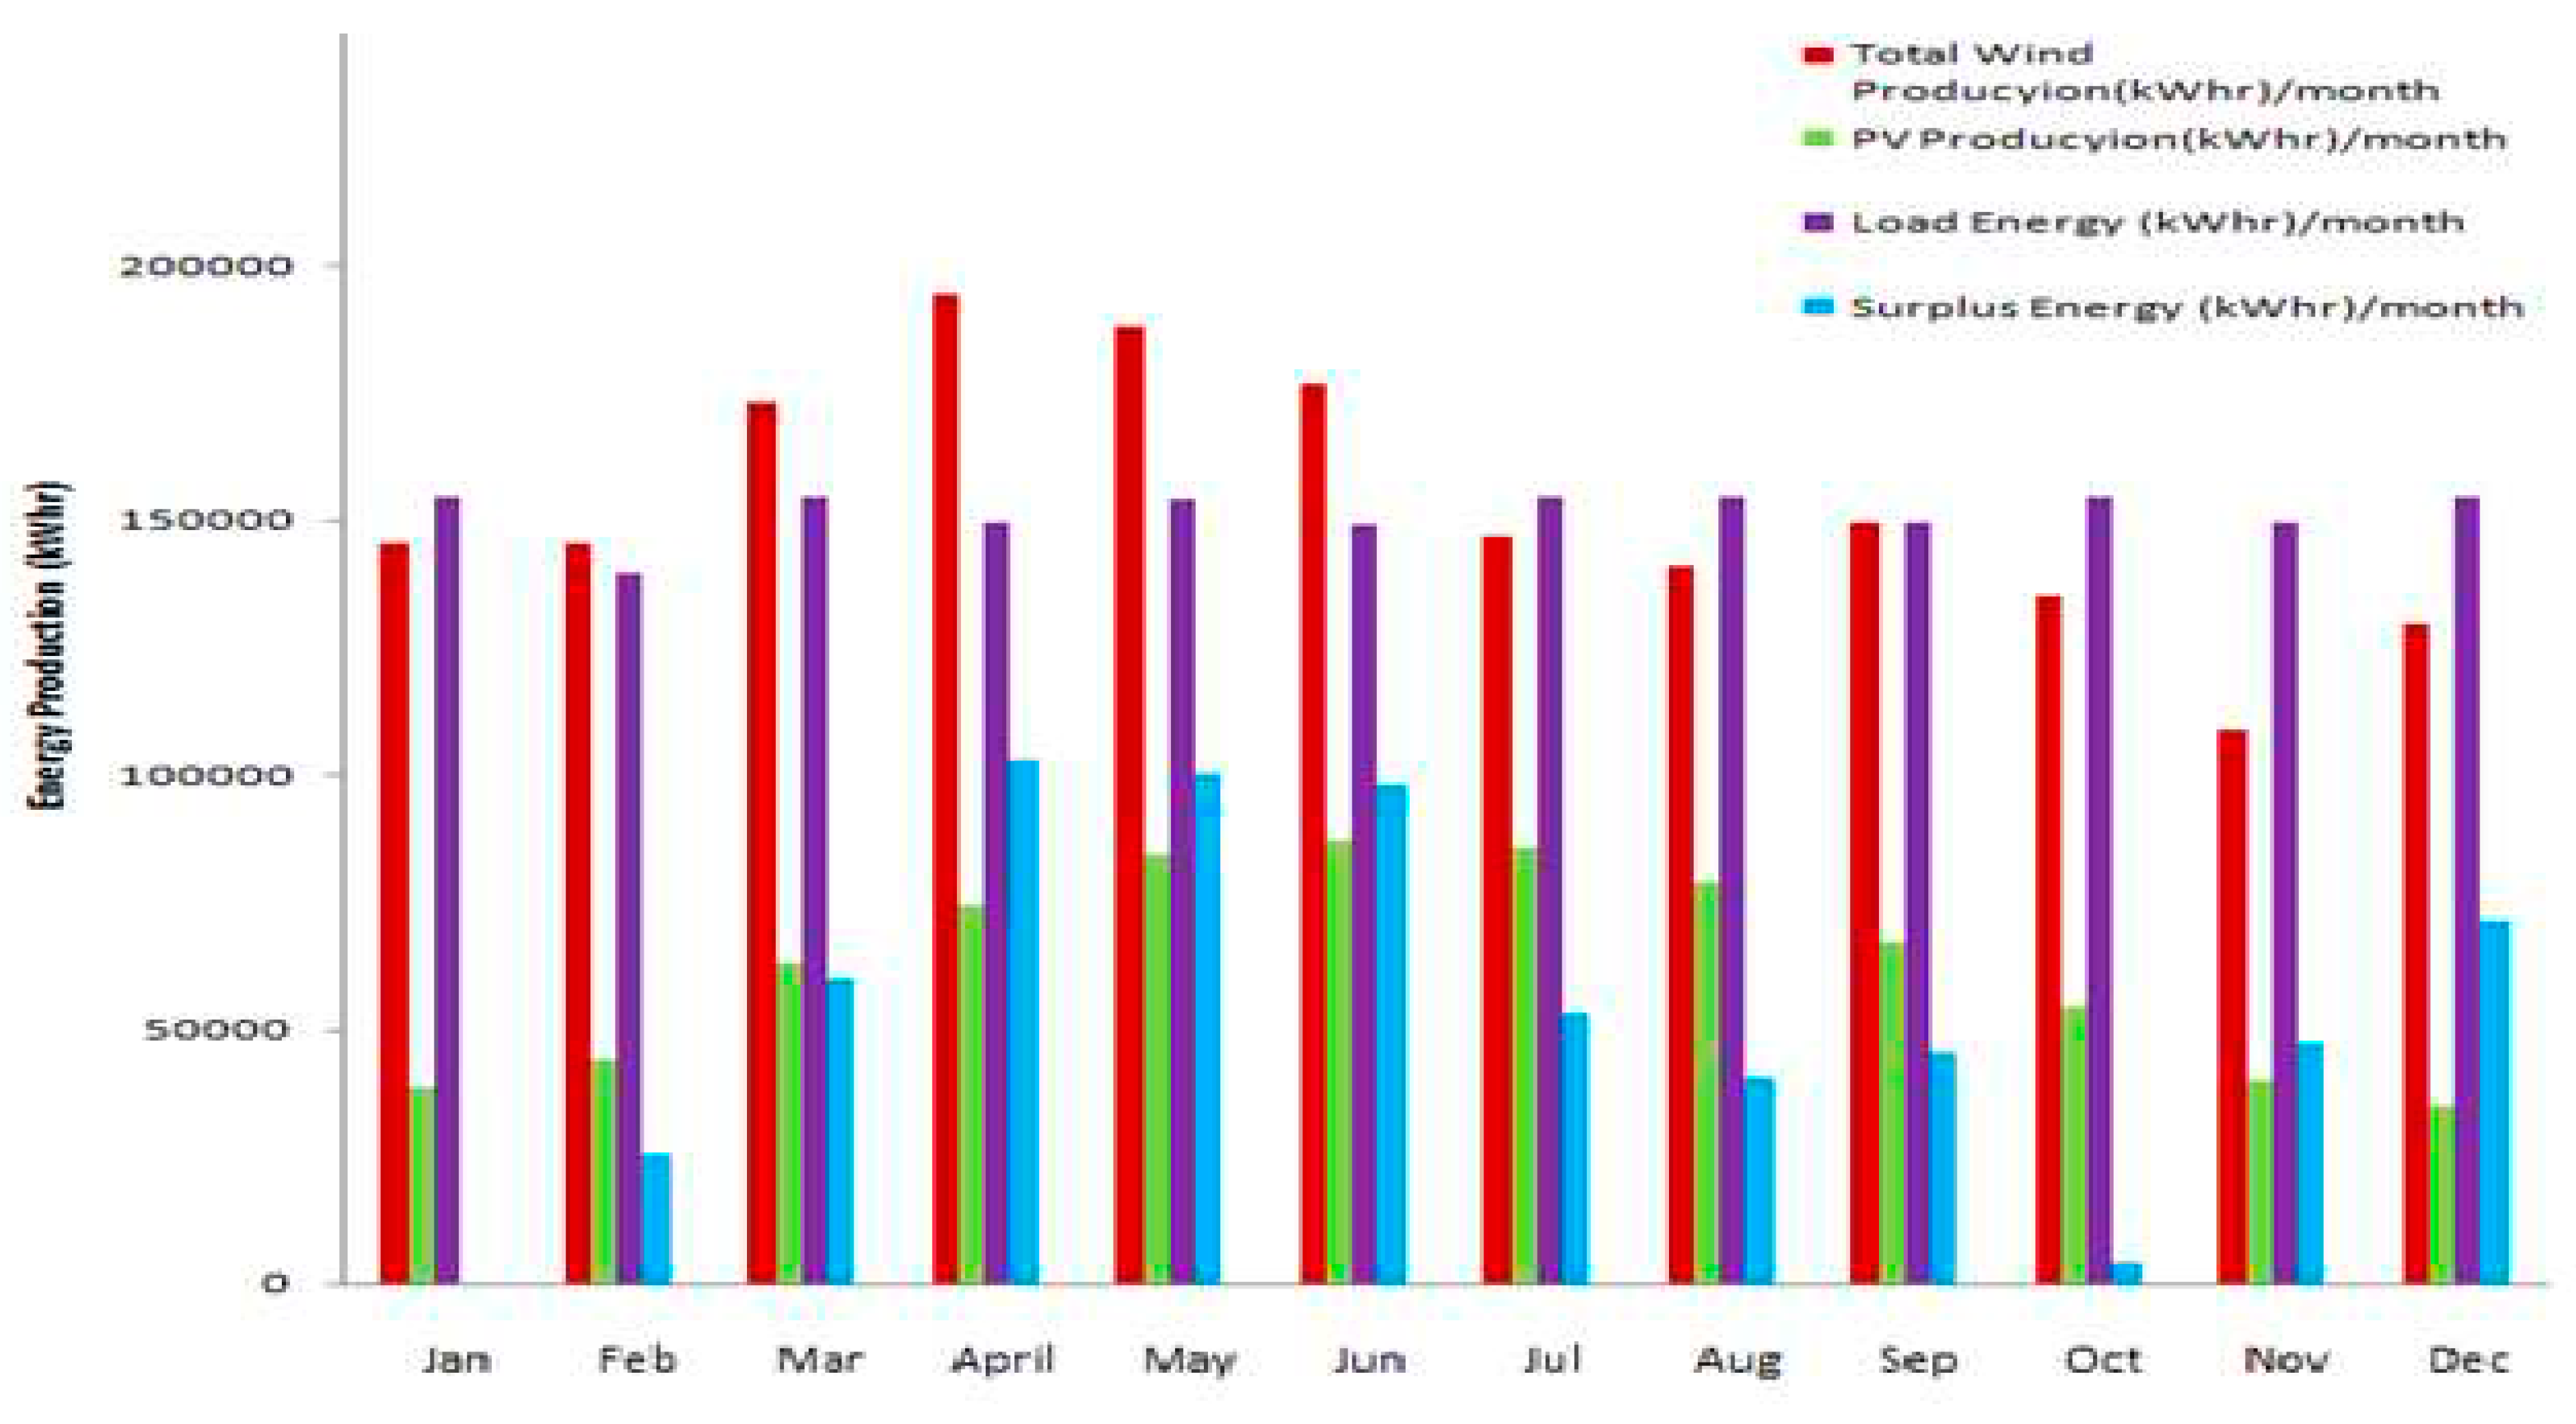
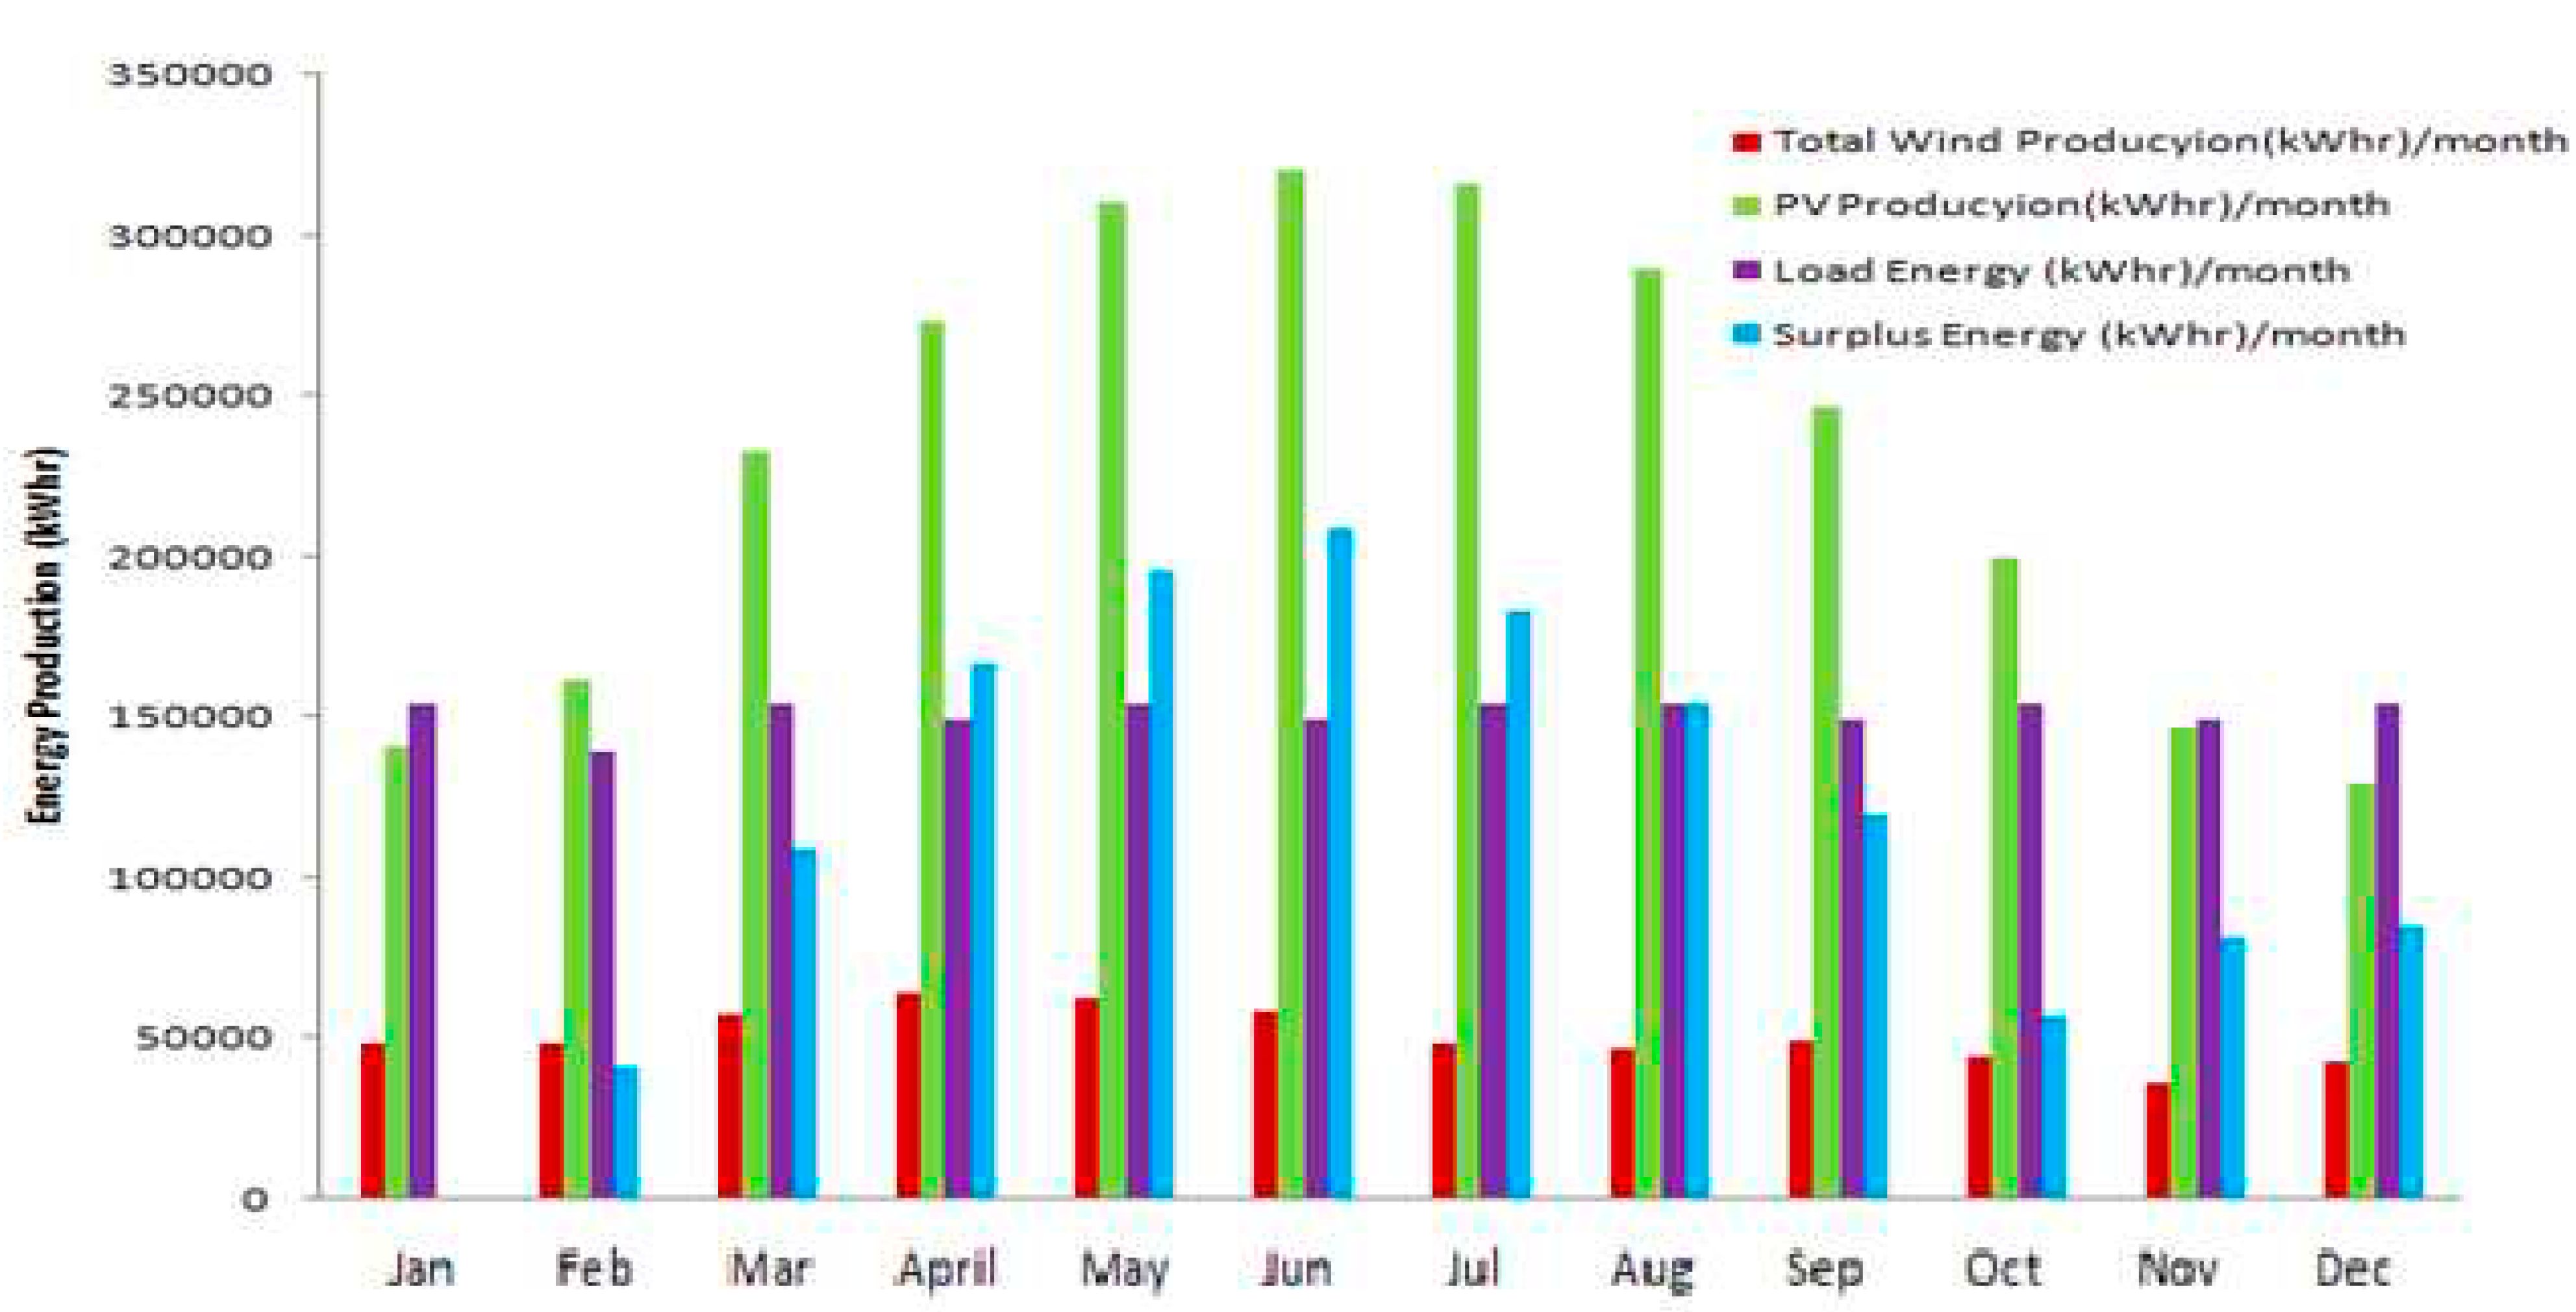
4.2. a. Sizing Methodology of Solar PV/Wind/Hydrogen system: Case Study 2
4.2. b. Sensitivity Analysis
| Month | Solar PV | Wind Turbine | Electrolyzer | Fuel Cell | Hydrogen Tank |
| Capital Cost ($) | 1,340,000 | 250,000 | 960,000 | 750,000 | 2000 |
| Maintenance Cost ($) | - | 113,463 | 2,178,490 | 816,934 | |
| Replacement Cost ($) | - | - | 960,000 | 750,000 | |
| Annual revenue ($) | 263,678 | ||||
| Annual net income ($) | 139,323 | ||||
| Net present Value ($) | -2,037,360 | ||||
| Present value of O&M ($) | 3,108,886 | ||||
| Present value of costs | 6,410,886 | ||||
| Levelized annual cost ($) | 706,275 | ||||
| Levelized Cost of energy ($/kWhr) | 0.2116 | ||||
Conclusion
Future Work
Conflicts of Interest
Nomenclature
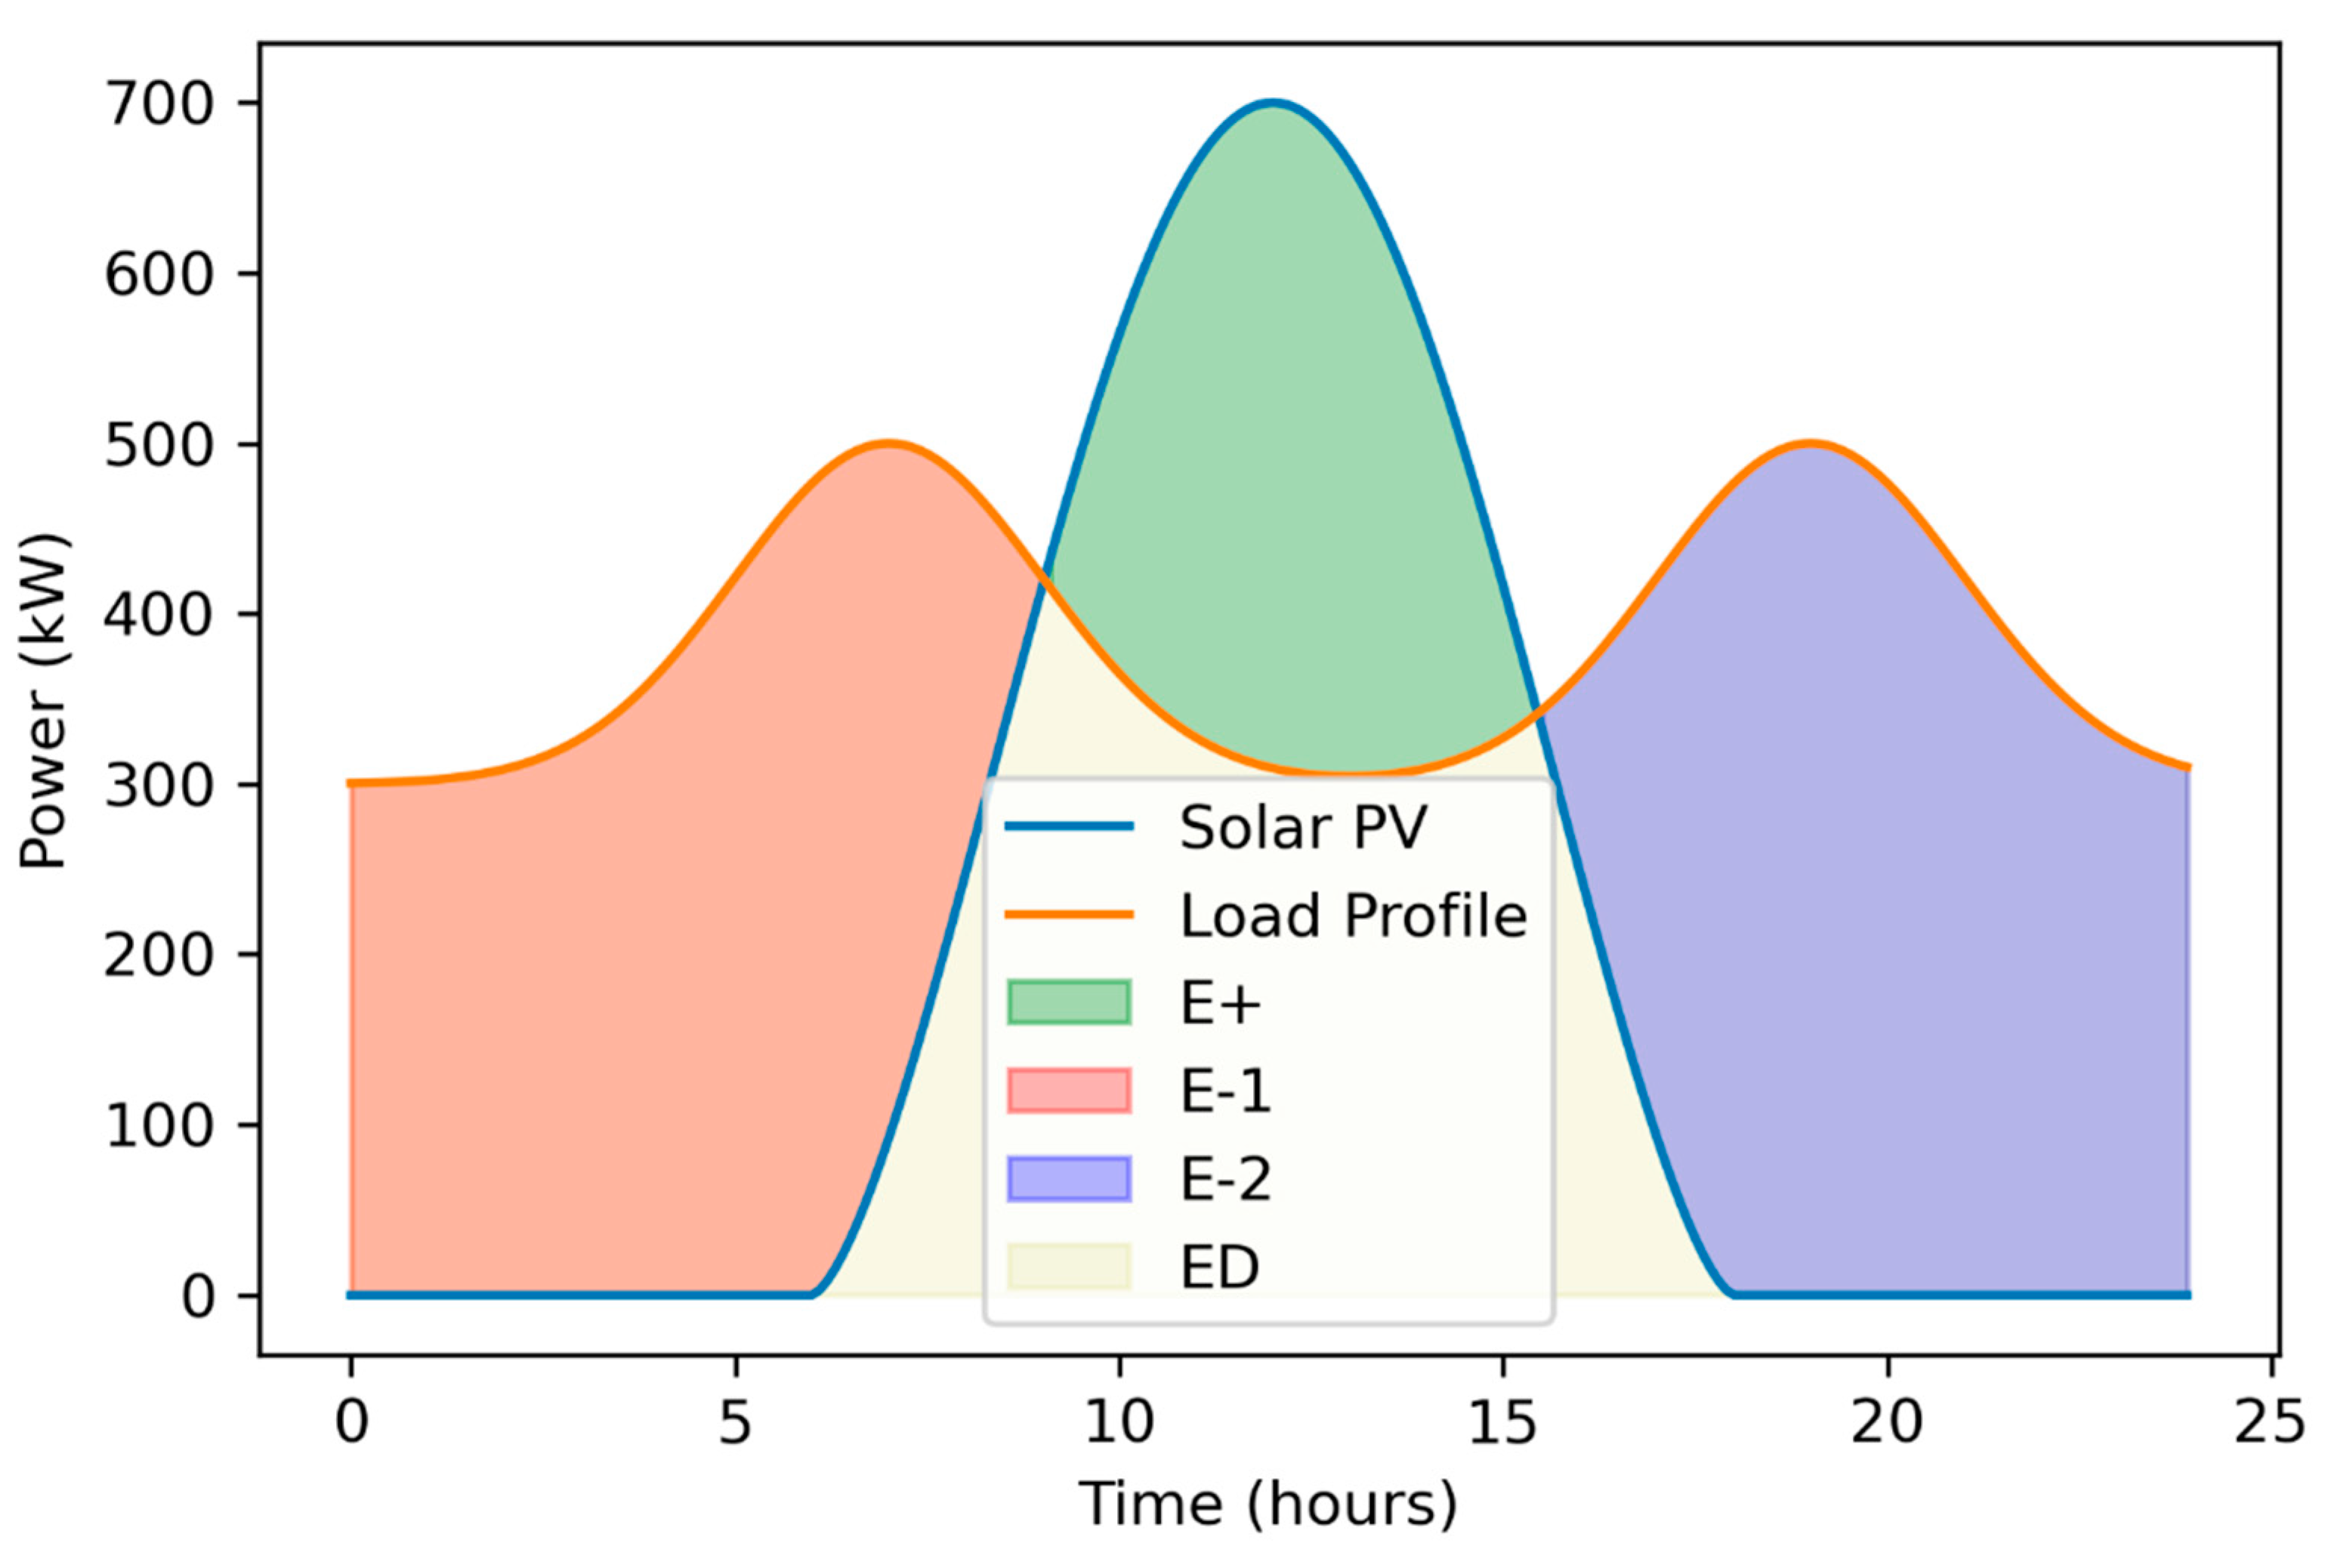
| E-,1 | Lack of energy from 12:00 a.m. till sunrise |
| E-,2 | Lack of energy from sunset till 12:00 a.m. |
| AEP | Annual energy production (kWh) |
| AR | Annual revenue from selling the electricity ($/year) |
| ANI | Annual net income ($/year) |
| COE | Cost of energy ($) |
| CI | Capital investment ($) |
| DC | Decommissioning costs ($) |
| ESP | Electricity selling price ($/kWh) |
| E+ | Surplus energy supplied by PV arrays |
| E- | Total lack of energy which will be supplied by fuel cell and electrolyzer |
| ED | Energy demanded by load and supplied by solar PV arrays |
| ED,1 | Energy demanded by load and supplied by solar PV arrays during sunrise |
| ED,2 | Energy demanded by load and supplied by solar PV arrays during sunset |
| ELZ | Electrolyzer |
| FC | Fuel cell |
| FV | Future value |
| GT | Irradiance power (W/m2) |
| LAC | Levelized annual cost ($) |
| LCOE | Levelized cost of energy ($/kWh) |
| LSCS | Lifespan cost of the hybrid system |
| LIP | Load interruption probability |
| NPV | Net present value ($) |
| O&M cost | Annual operating and maintenance cost ($/kWh) |
| PVDC | Present value of the cost of decommissioning ($) |
| PVC | Present value of all the costs ($) |
| PVM | Present value maintenance and repair cost |
| PV | Photovoltaics |
Present value of the cost analysis |
|
| P | Period of years (years) |
| Ppv | Solar PV power (kW) |
| Pl | Load power (kW) |
| Pwind | Power of wind generator (kW) |
| Pr | Rated electrical power output (kW) |
| P-PMS | Predictive Power management strategies |
| R | Annual discount rate (%) |
| P-PMS | Reactive Power management strategies |
| TX | Temperature de-rating factor, |
| Tm | Module temperature (˚C) |
| Ta | Reference temperature (25˚C) |
| Te | End time of simulation |
| WTG | Wind turbine generator |
| VN | Rated speed (m/s) |
| VD | Cut-in speed (m/s) |
| VR | Cut-off speed (m/s) |
| VV | Wind speed (m/s) |
| α | Power temperature coefficient for module selected (-0.331% ˚C) |
Appendix A. DBM methodology
 |
 |
 |
 |
 |
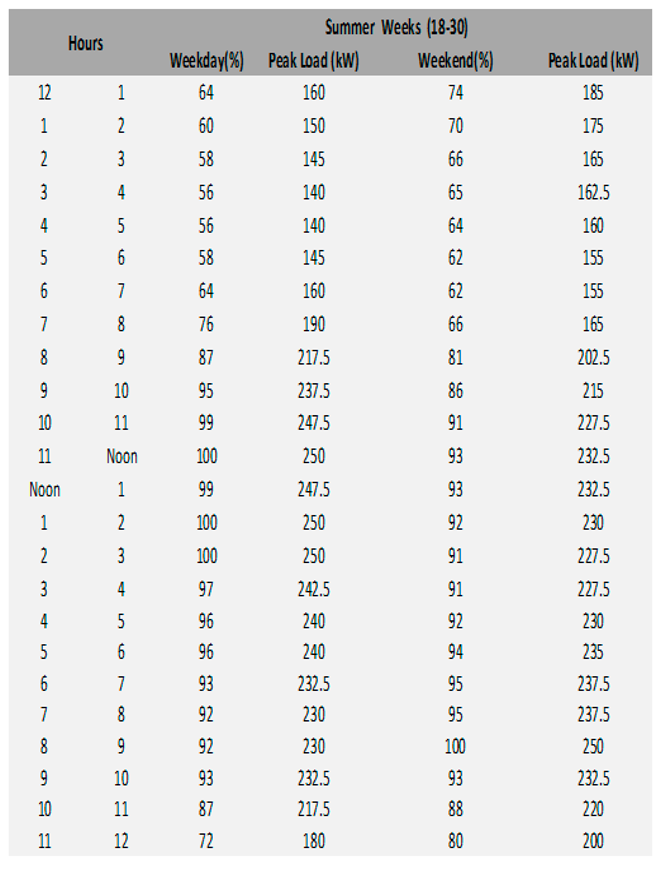
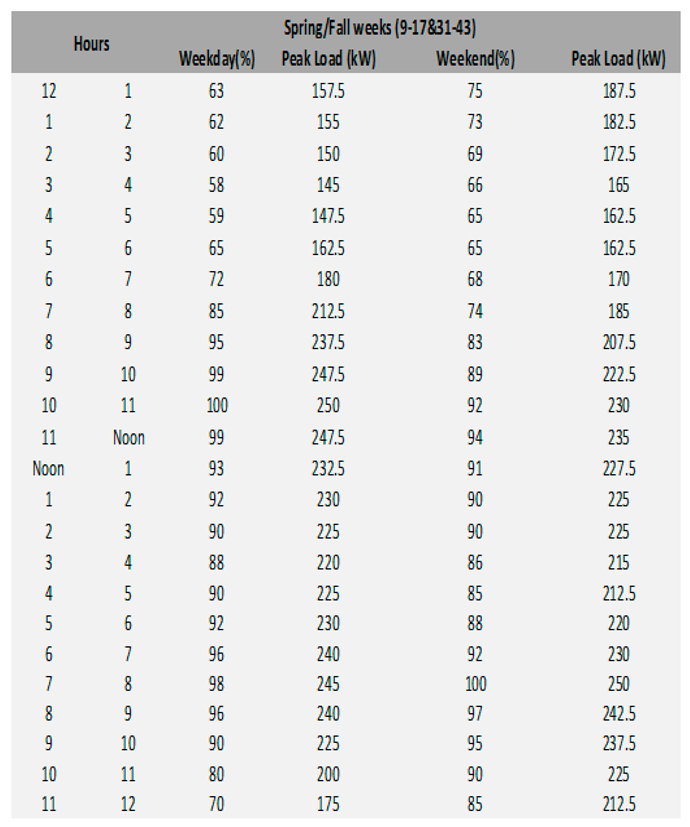
Appendix B. Load Profiles
 |
 |
 |
 |
Appendix C. Software Tools
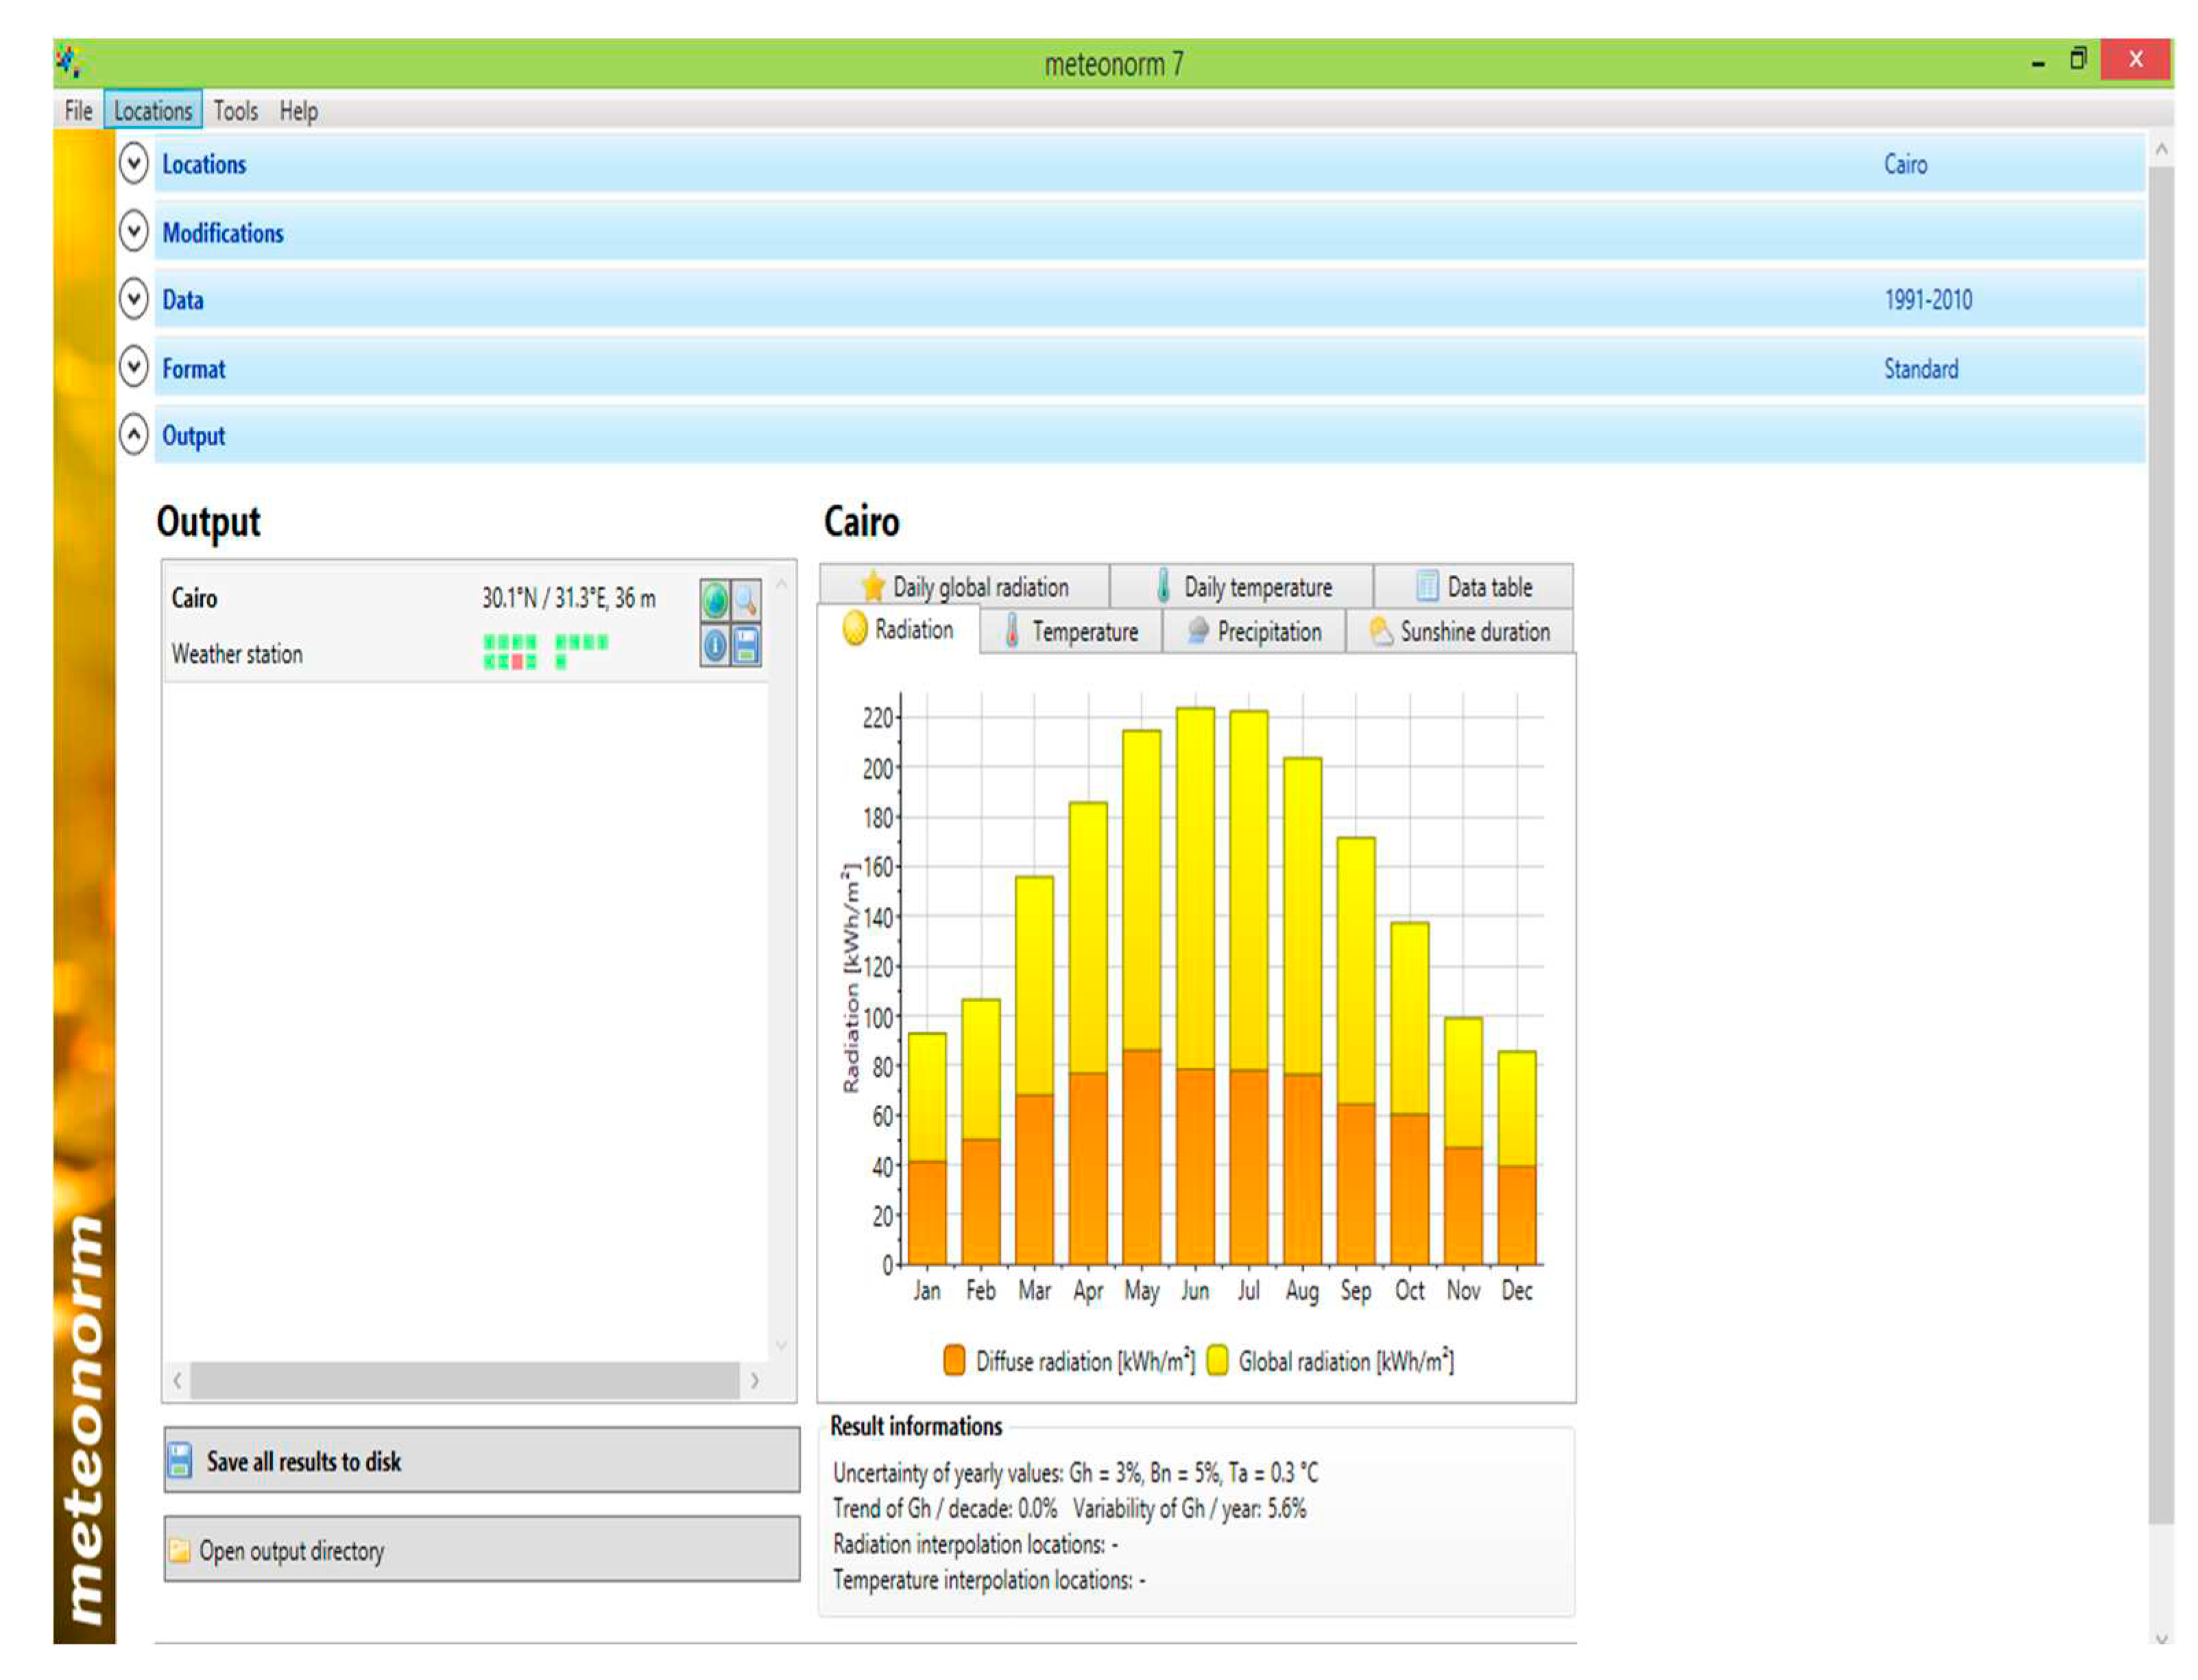
Appendix C.1. METEONORM Model
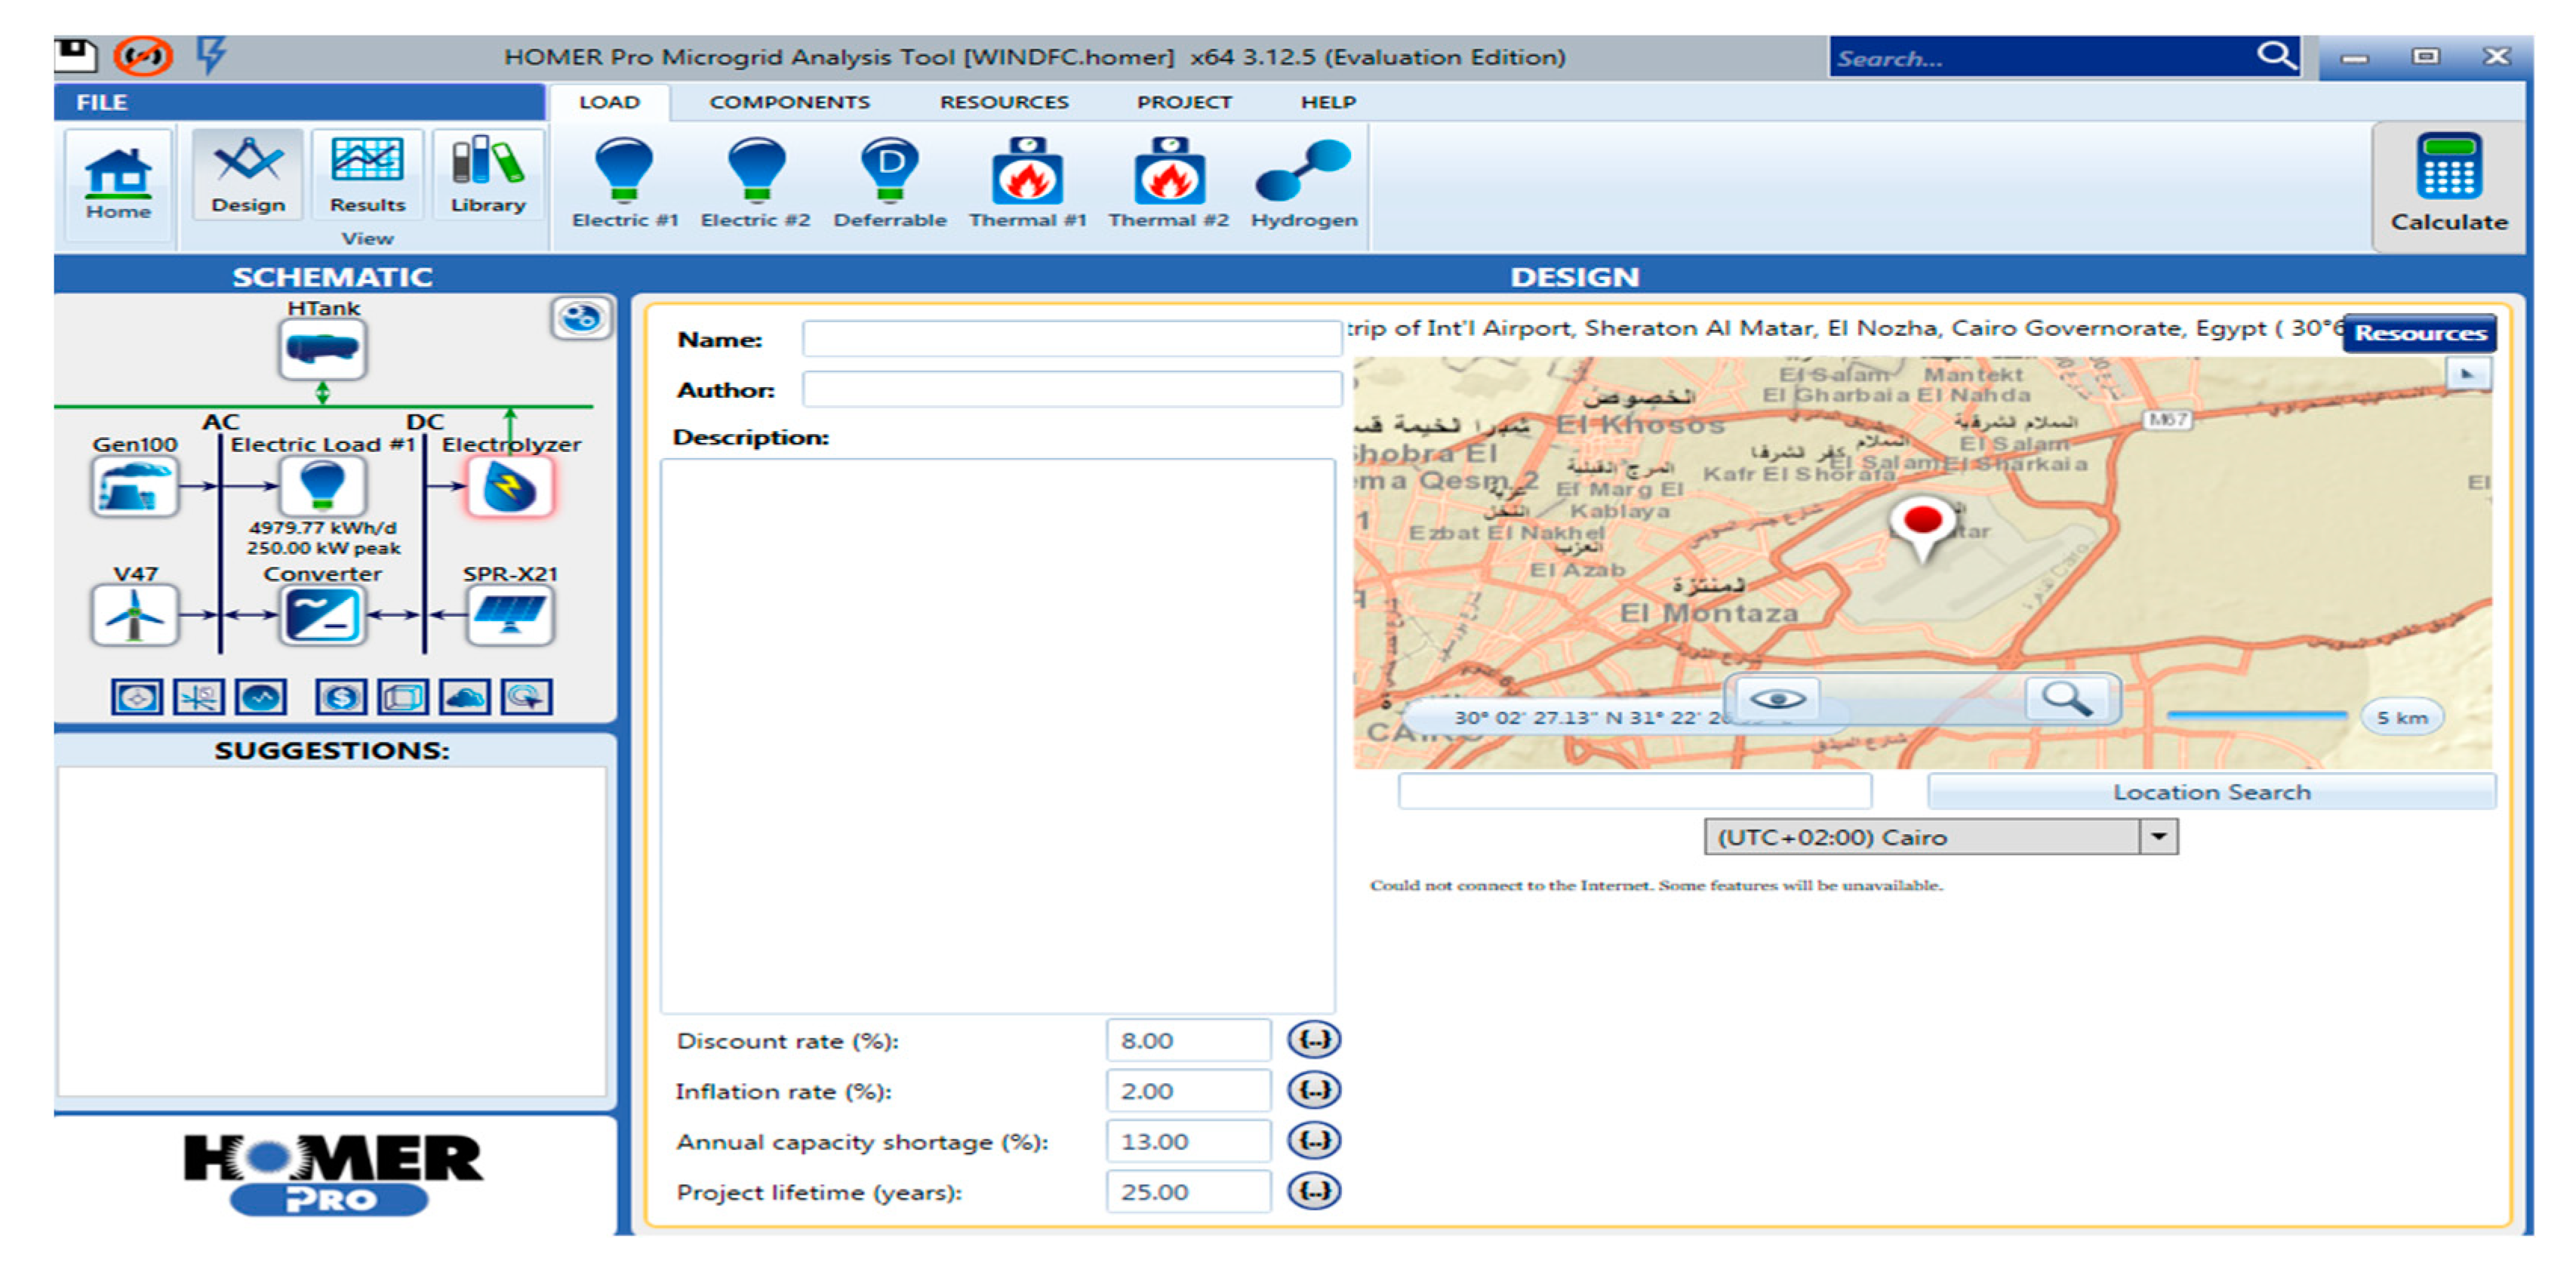
Appendix C.2. HOMER Model
References
- Gelma Boneya, Design of a photovoltaic-Wind Hybrid Power Generation System for Ethiopian Remote area, PhD thesis, Institue of Technology Department of Electrical and Computer Engineering, Addis Ababa University, 2011.
- Ghenai, C. , Salameh, T., & Merabet, A. (2018). Technico-economic analysis of off grid solar PV/Fuel cell energy system for residential community in desert region. International Journal of Hydrogen Energy.
- Adedoja, O.S. , Saleh, U.A., Alesinloye, A.R., Timiyo, T.-E.J., Onuigbo, I.F., Adejuwon, O.O., Josiah, E., 2023. An energy balance and multicriterial approach for the sizing of a hybrid renewable energy system with hydrogen storage. E-Prime - Adv. Electr. Eng. Electron. Energy 4, 100146. [CrossRef]
- Alberizzi, J.C. , Rossi, M., Renzi, M., 2020. A MILP algorithm for the optimal sizing of an off-grid hybrid renewable energy system in South Tyrol. Energy Rep. 6, 21–26. [CrossRef]
- Al-Othman, A. , Tawalbeh, M., Martis, R., Dhou, S., Orhan, M., Qasim, M., Ghani Olabi, A., 2022. Artificial intelligence and numerical models in hybrid renewable energy systems with fuel cells: Advances and prospects. Energy Convers. Manag. 253, 115154. [CrossRef]
- Arévalo, P. , Benavides, D., Lata-García, J., Jurado, F., 2020. Energy control and size optimization of a hybrid system (photovoltaic-hidrokinetic) using various storage technologies. Sustain. Cities Soc. 52, 101773. [CrossRef]
- Azad, A. , Shateri, H., 2023. Design and optimization of an entirely hybrid renewable energy system (WT/PV/BW/HS/TES/EVPL) to supply electrical and thermal loads with considering uncertainties in generation and consumption. Appl. Energy 336, 120782. [CrossRef]
- Ben Seddik, Z. , Ben Taher, M.A., Laknizi, A., Ahachad, M., Bahraoui, F., Mahdaoui, M., 2022. Hybridization of Taguchi method and genetic algorithm to optimize a PVT in different Moroccan climatic zones. Energy 250, 123802. [CrossRef]
- Brka, A. , Al-Abdeli, Y.M., Kothapalli, G., 2016. Predictive power management strategies for stand-alone hydrogen systems: Operational impact. Int. J. Hydrog. Energy 41, 6685–6698. [CrossRef]
- Cai, W. , Li, X., Maleki, A., Pourfayaz, F., Rosen, M.A., Alhuyi Nazari, M., Bui, D.T., 2020. Optimal sizing and location based on economic parameters for an off-grid application of a hybrid system with photovoltaic, battery and diesel technology. Energy 201, 117480. [CrossRef]
- Hadidian Moghaddam, M.J. , Kalam, A., Nowdeh, S.A., Ahmadi, A., Babanezhad, M., Saha, S., 2019. Optimal sizing and energy management of stand-alone hybrid photovoltaic/wind system based on hydrogen storage considering LOEE and LOLE reliability indices using flower pollination algorithm. Renew. Energy 135, 1412–1434. [CrossRef]
- Hassan, Q. , 2020. Optimisation of solar-hydrogen power system for household applications. Int. J. Hydrog. Energy 45, 33111–33127. [CrossRef]
- Jahannoosh, M. , Nowdeh, S.A., Naderipour, A., Kamyab, H., Davoudkhani, I.F., Klemeš, J.J., 2021. New hybrid meta-heuristic algorithm for reliable and cost-effective designing of photovoltaic/wind/fuel cell energy system considering load interruption probability. J. Clean. Prod. 278, 123406. [CrossRef]
- Mahmoudi, S.M. , Maleki, A., Rezaei Ochbelagh, D., 2023. Investigating the role of the carbon tax and loss of power supply probability in sizing a hybrid energy system, economically and environmentally. Energy Convers. Manag. 280, 116793. [CrossRef]
- Mokhtara, C. , Negrou, B., Settou, N., Bouferrouk, A., Yao, Y., 2021. Design optimization of grid-connected PV-Hydrogen for energy prosumers considering sector-coupling paradigm: Case study of a university building in Algeria. Int. J. Hydrog. Energy 46, 37564–37582. [CrossRef]
- Nazari-Heris, M. , Mirzaei, M.A., Asadi, S., Mohammadi-Ivatloo, B., Zare, K., Jebelli, H., 2021. A hybrid robust-stochastic optimization framework for optimal energy management of electric vehicles parking lots. Sustain. Energy Technol. Assess. 47, 101467. [CrossRef]
- Özçelep, Y. , Bekdaş, G., Apak, S., 2023. Meeting the electricity demand for the heating of greenhouses with hydrogen: Solar photovoltaic-hydrogen-heat pump system application in Turkey. Int. J. Hydrog. Energy 48, 2510–2517. [CrossRef]
- Pan, G. , Gu, W., Qiu, H., Lu, Y., Zhou, S., Wu, Z., 2020. Bi-level mixed-integer planning for electricity-hydrogen integrated energy system considering levelized cost of hydrogen. Appl. Energy 270, 115176. [CrossRef]
- Siddiqui, O. , Dincer, I., 2021. Optimization of a new renewable energy system for producing electricity, hydrogen and ammonia. Sustain. Energy Technol. Assess. 44, 101023. [CrossRef]
- Thirunavukkarasu, M. , Sawle, Y., Lala, H., 2023. A comprehensive review on optimization of hybrid renewable energy systems using various optimization techniques. Renew. Sustain. Energy Rev. 176, 113192. [CrossRef]
- Vahid, M.Z. , hajivand, M., Moshkelgosha, M., Parsa, N., Mansoori, H., 2020. Optimal, reliable and economic designing of renewable energy photovoltaic/wind system considering different storage technology using intelligent improved salp swarm optimisation algorithm, commercial application for Iran country. Int. J. Sustain. Energy 39, 465–485. [CrossRef]
- Zhang, Y. , Hua, Q.S., Sun, L., Liu, Q., 2020. Life Cycle Optimization of Renewable Energy Systems Configuration with Hybrid Battery/Hydrogen Storage: A Comparative Study. J. Energy Storage 30, 101470. [CrossRef]
- Mohamed, E. S. (2015). Dynamic Security of Interconnected Electric Power Systems-Volume 2: Dynamics and stability of conventional and renewable energy systems. LAP LAMBERT Academic Publishing.
- Skoplaki, E. , & Palyvos, J. A. (2009). On the temperature dependence of photovoltaic module electrical performance: A review of efficiency/power correlations. Solar energy 2009, 83, 614–624. [Google Scholar]
- Khiareddine, A. , Salah, C. B., Rekioua, D., &Mimouni, M. F. (2018). Sizing methodology for hybrid photovoltaic/wind/hydrogen/battery integrated to energy management strategy for pumping system. Energy 2018, 153, 743–762. [Google Scholar]
- New&Renewable Energy Authority-Annual Report2018,Accessed on 1 Jan.2020.
- New&Renewable Energy Authority official website http://www.nrea.gov.eg/, Accessed on : 1 sep.2020.
- Subcommittee, P.M. IEEE reliability test system. IEEE Transactions on power apparatus and systems 1979, 2047–2054. [Google Scholar] [CrossRef]
- Larminie, J., A. Dicks, and M.S. McDonald, Fuel cell systems explained. Vol. 2. 2003: J. Wiley Chichester, UK.
- Fathy, A. A reliable methodology based on mine blast optimization algorithm for optimal sizing of hybrid PV-wind-FC system for remote area in Egypt. Renewable energy 2016, 95, 367–380. [Google Scholar] [CrossRef]
- HOMER Support Guide, available online on https://www.homerenergy.com/support/ Accessed Apr 1, 2019.
- Global Atlas Wind, availabe online on https://globalwindatlas.info Accessed Apr 1, 2022.
- Meteonorm software platform, available online on https://meteonorm. 2022; 1.
- HOMER software program, available online on https://www.homerenergy.com/ Accessed Apr 1, 2022.
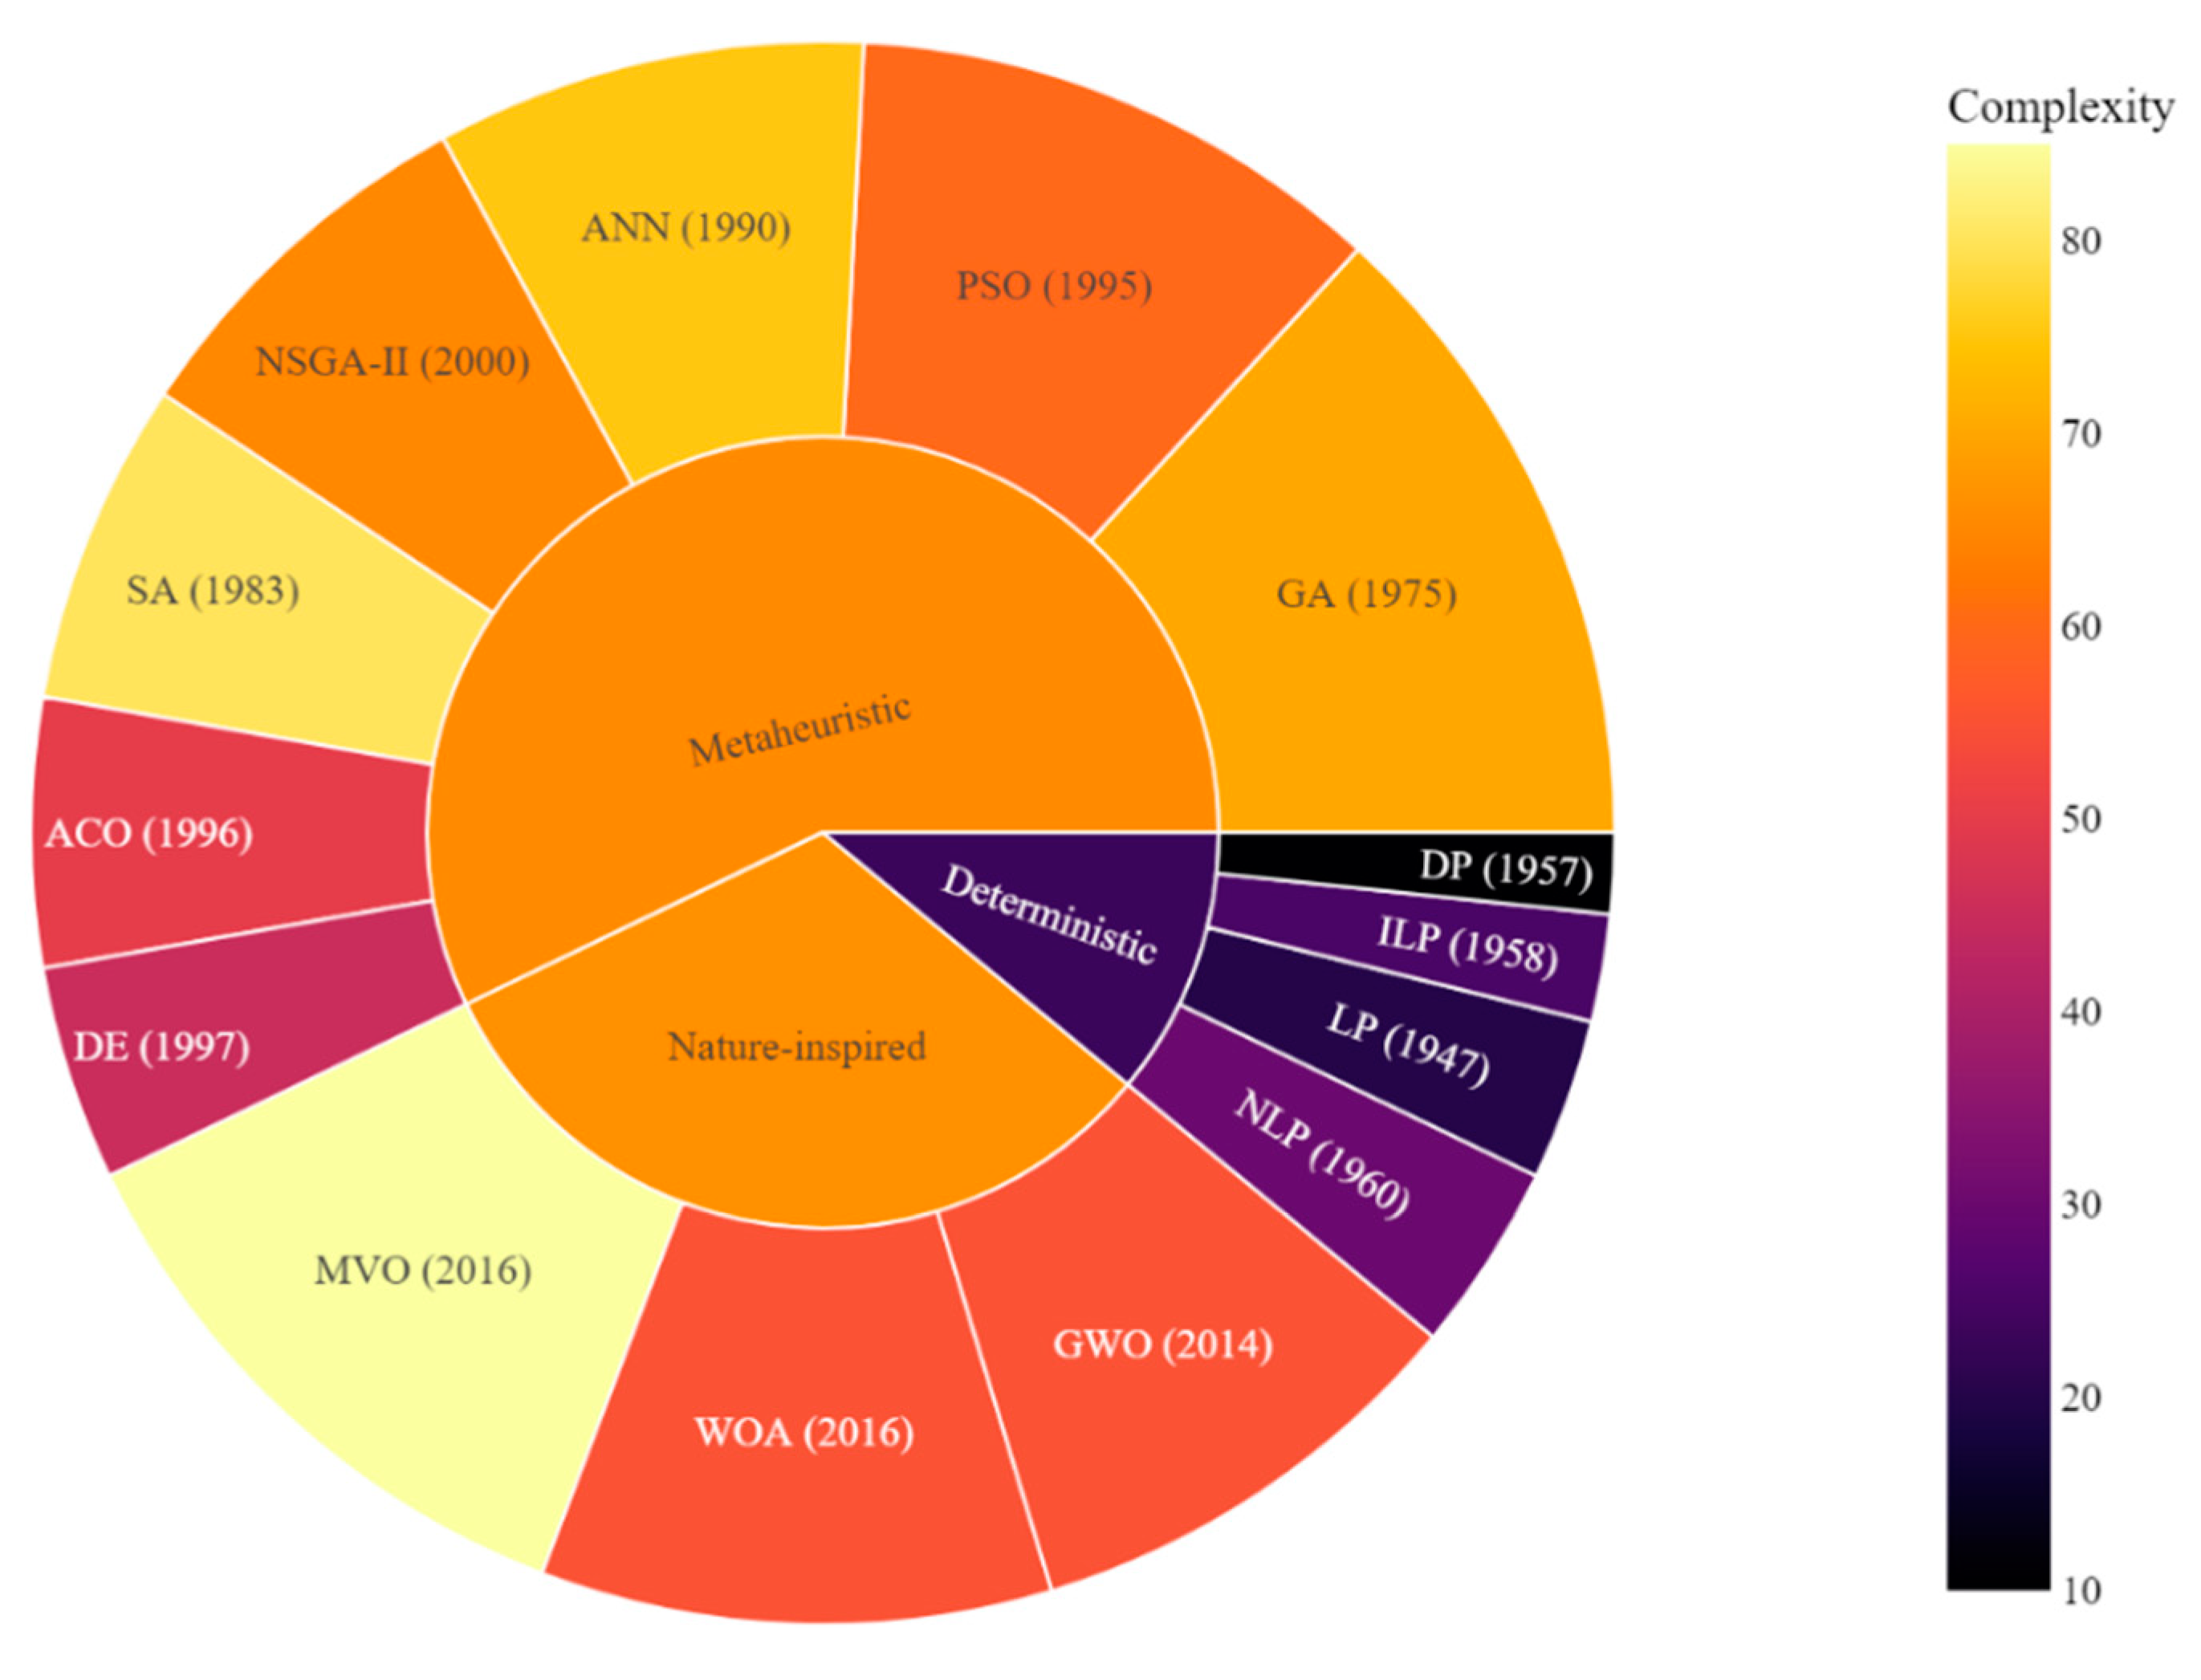
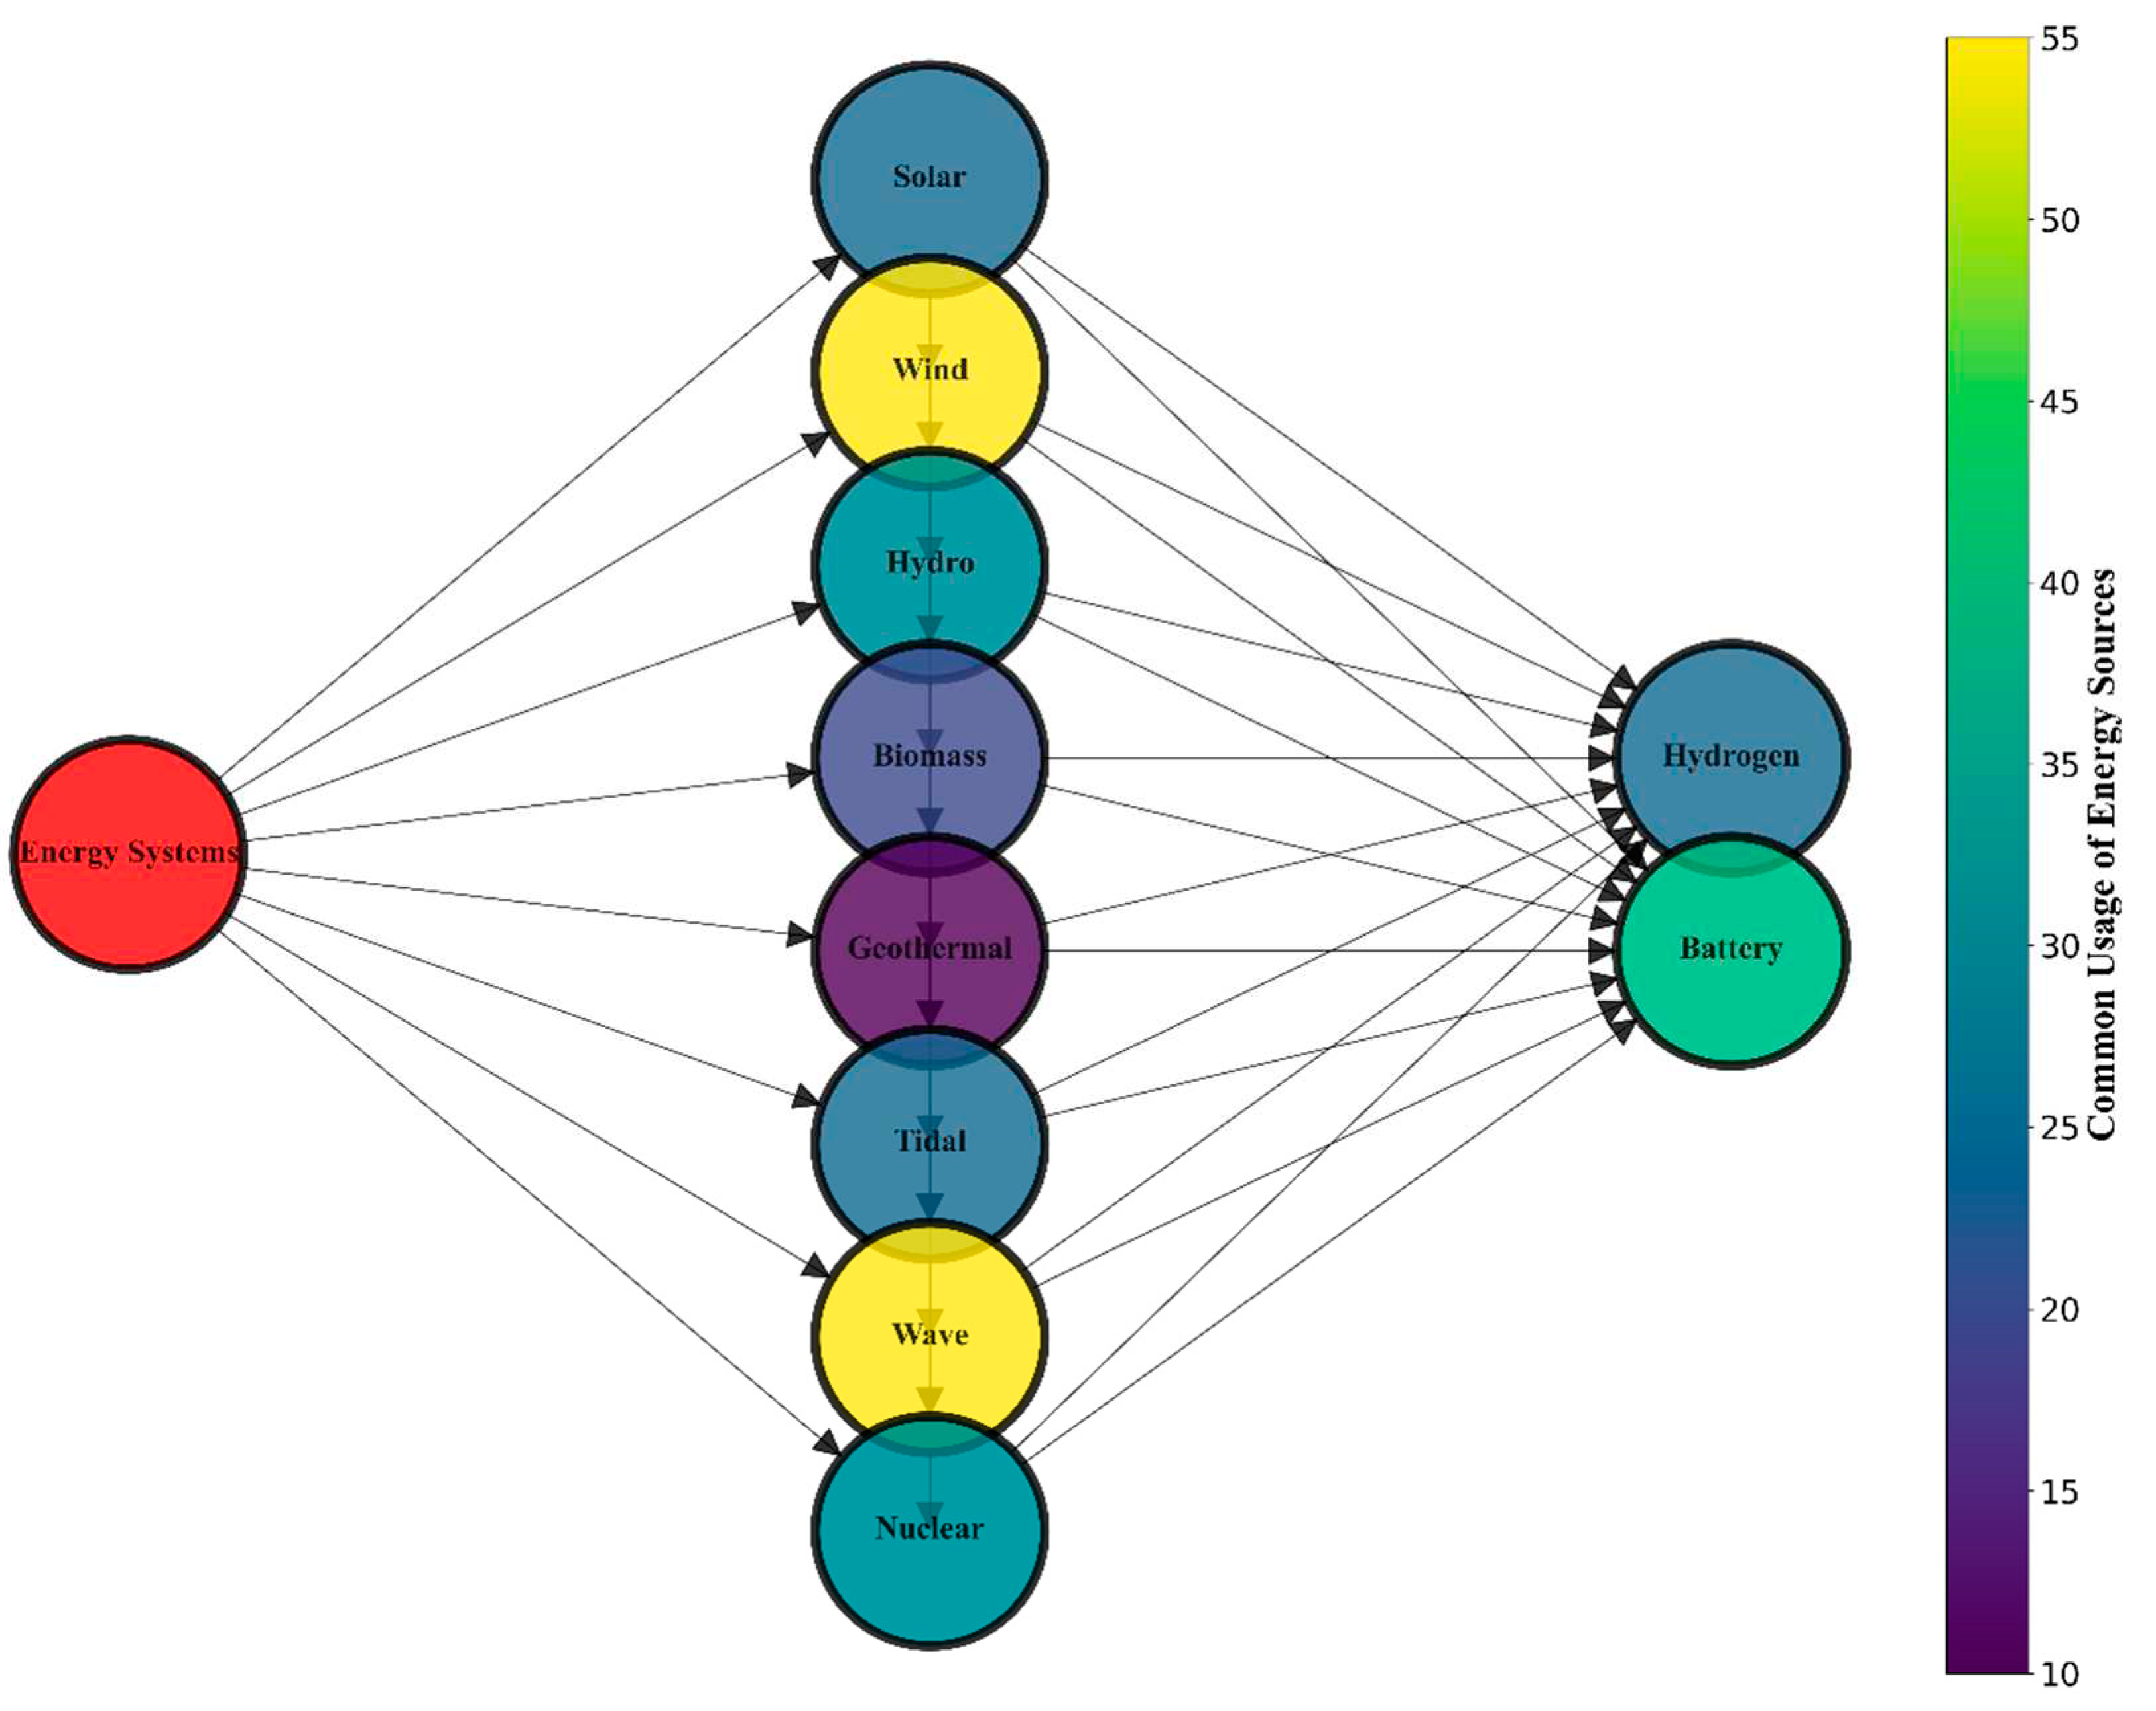
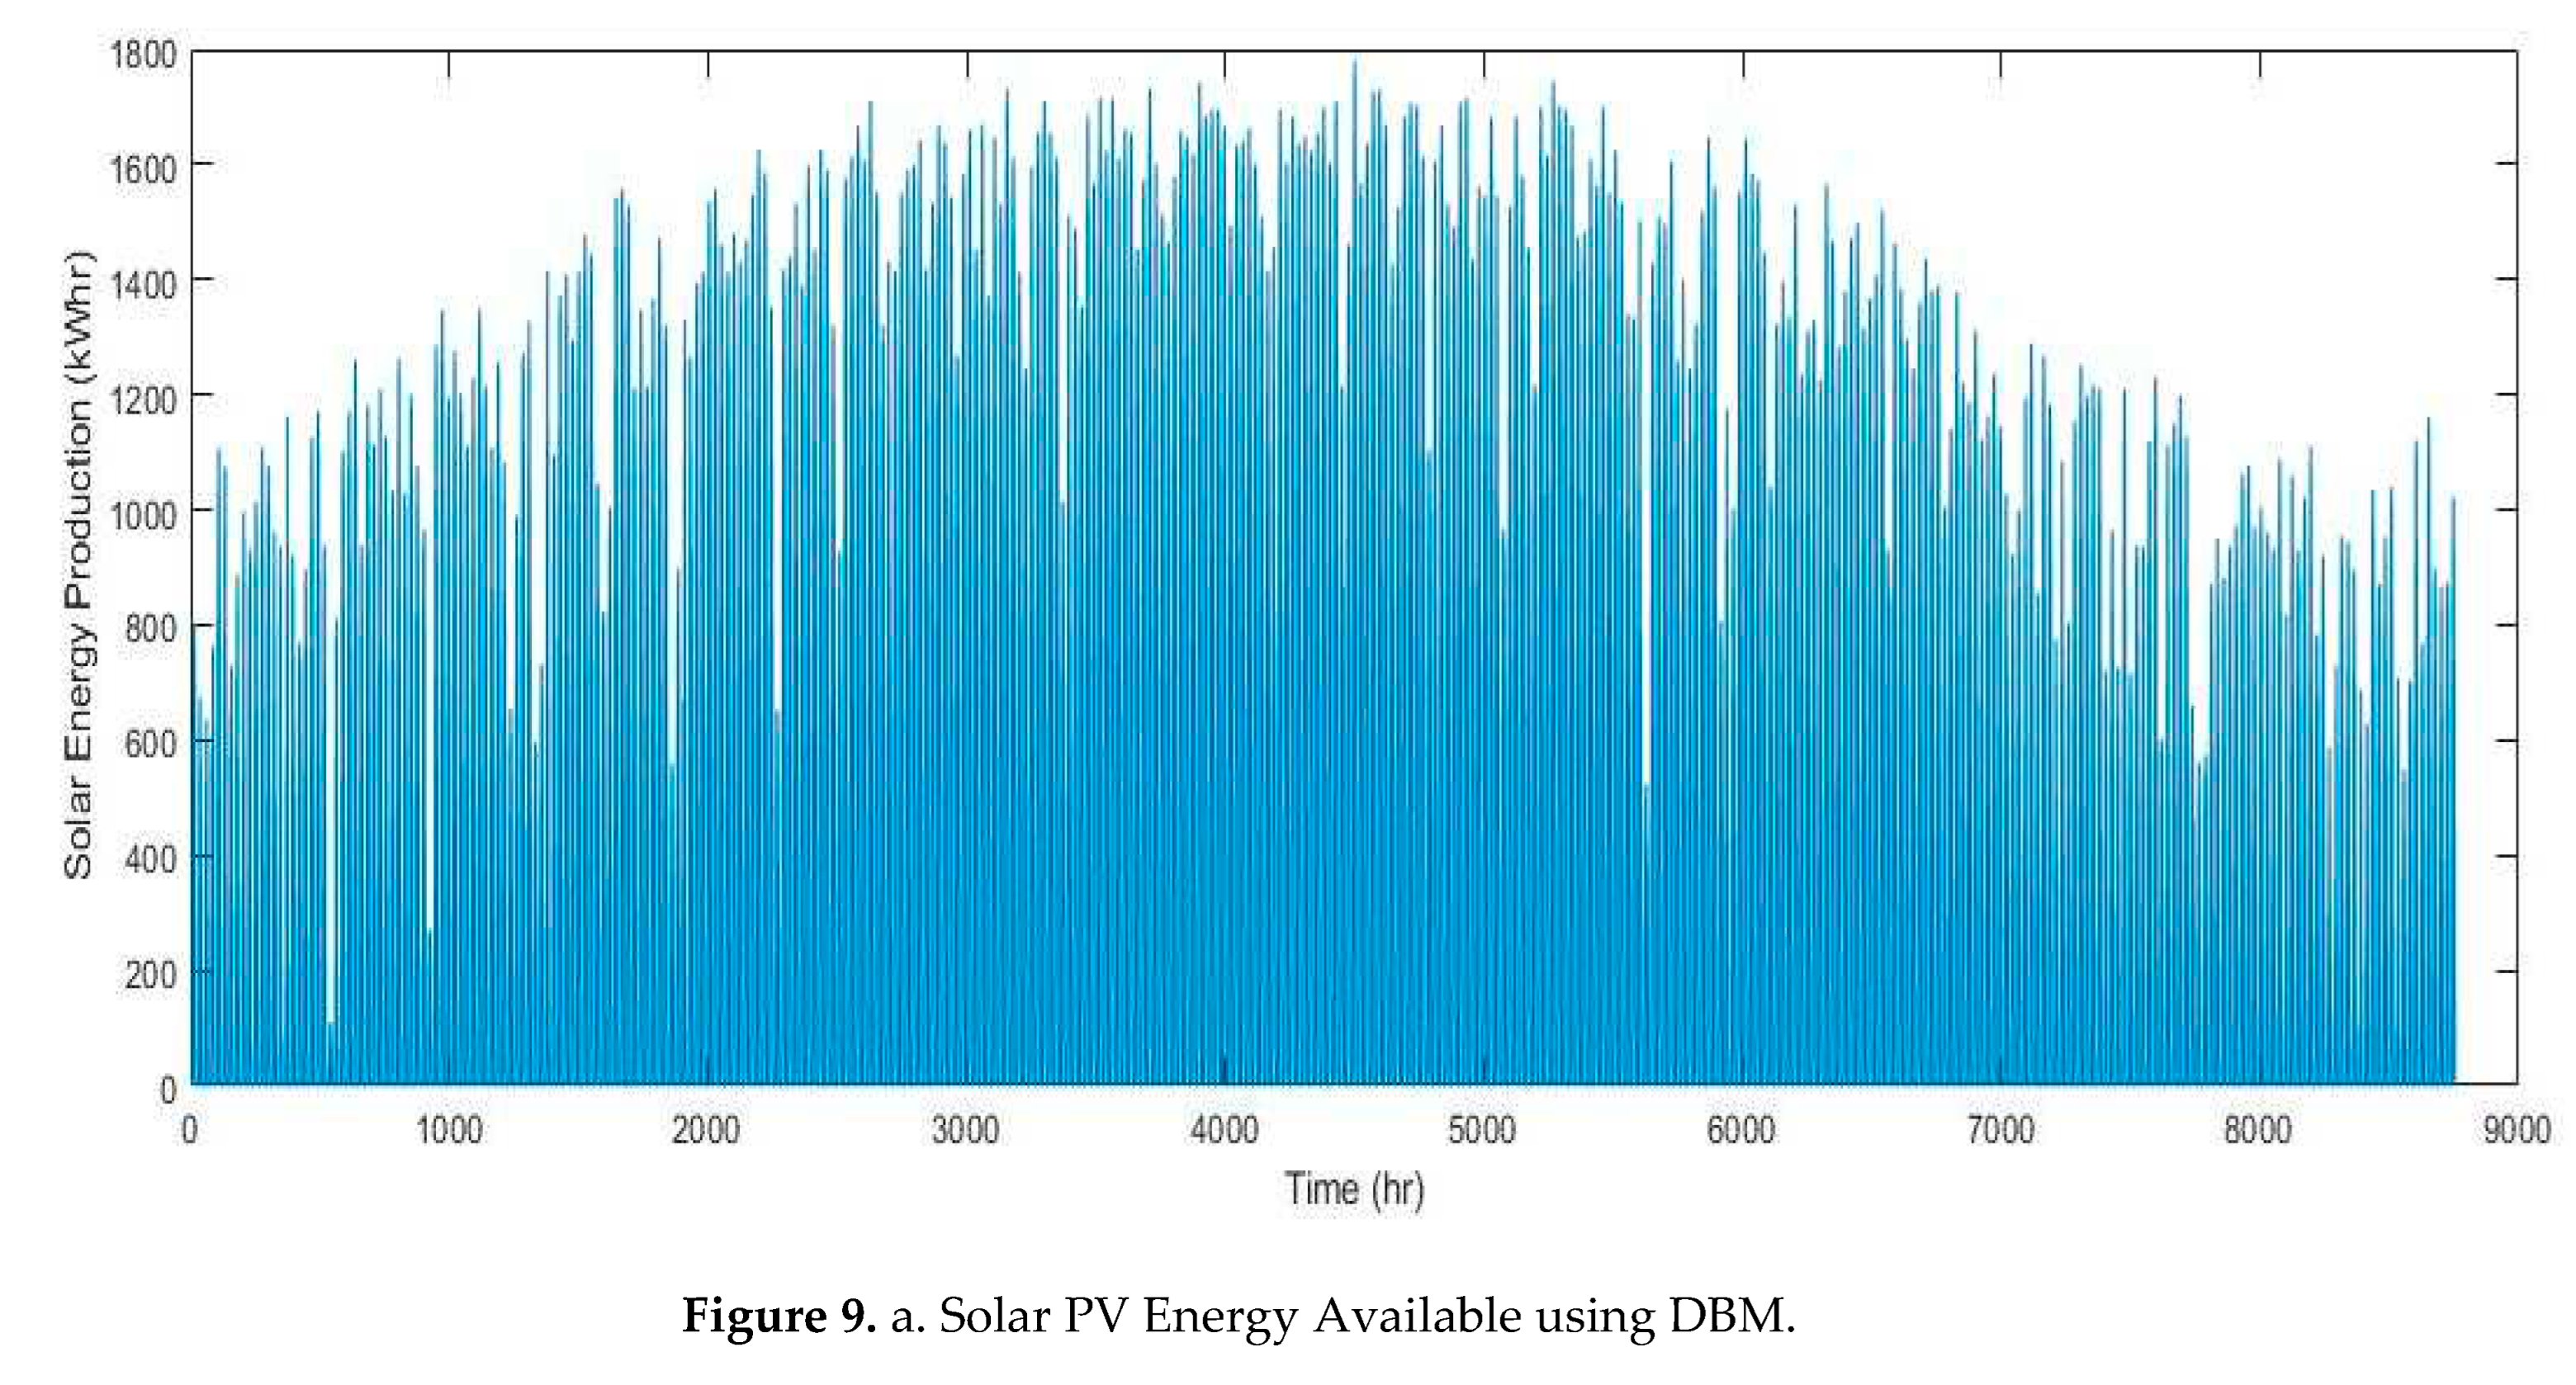
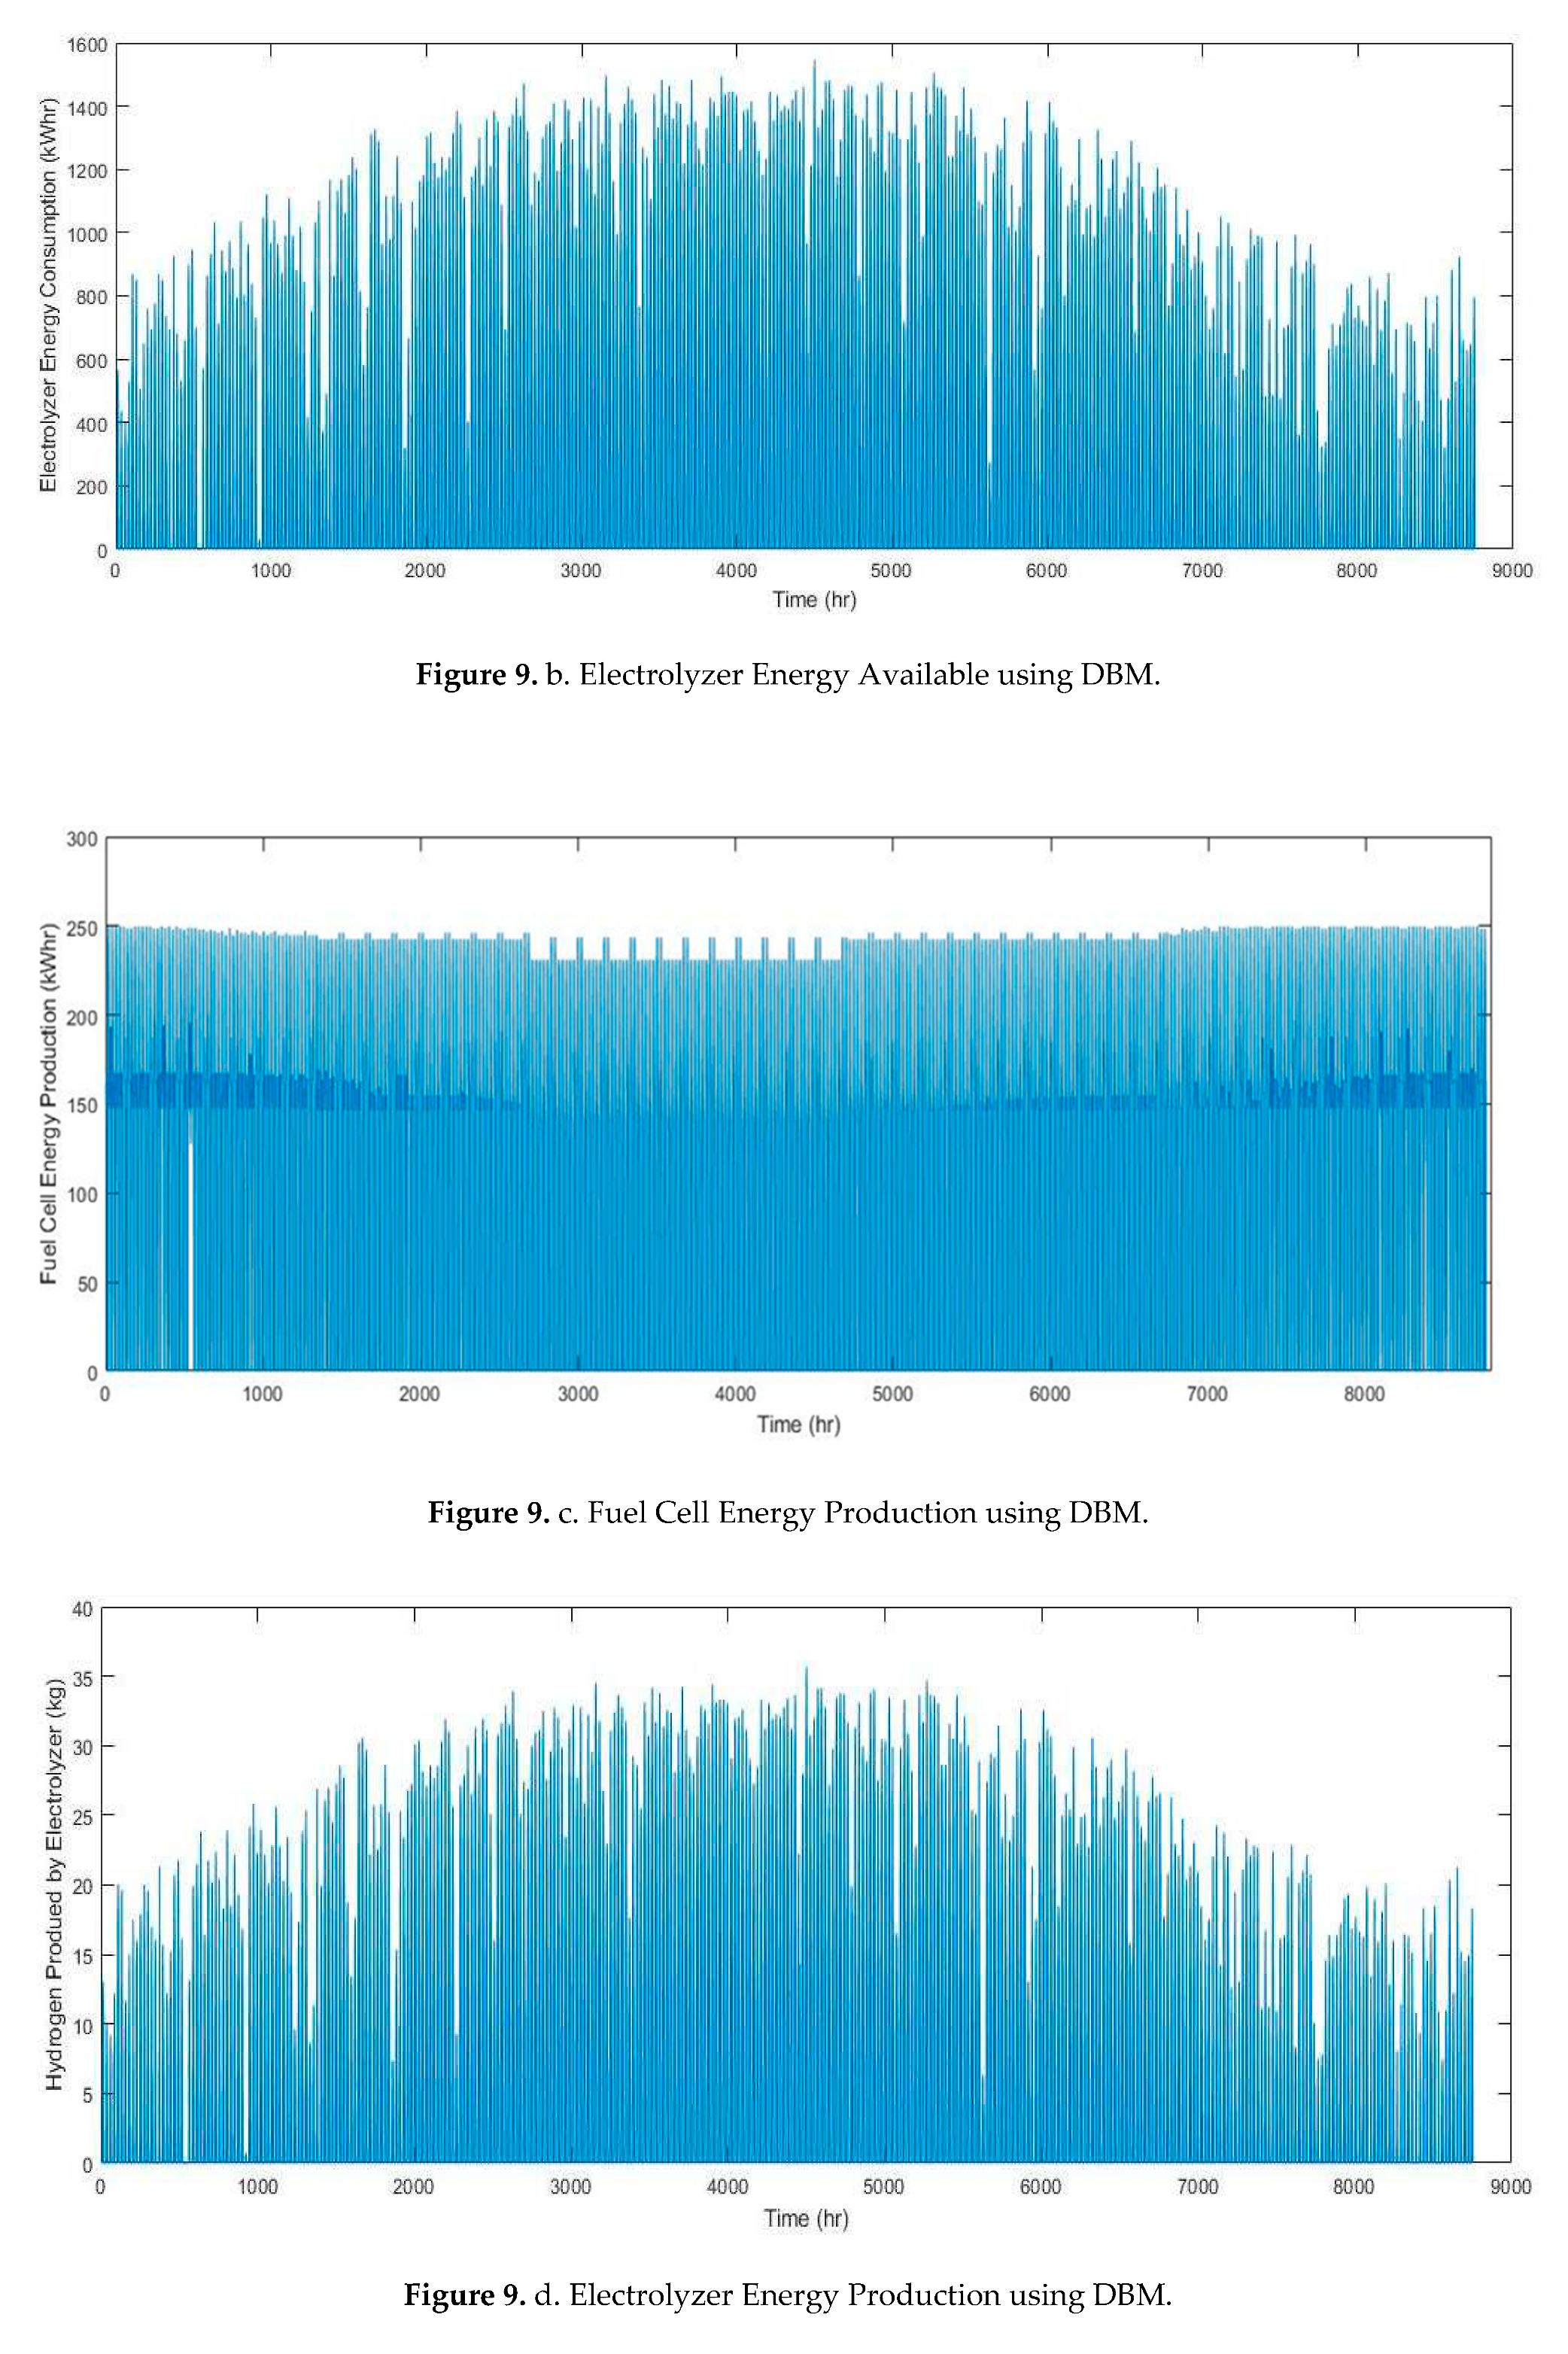
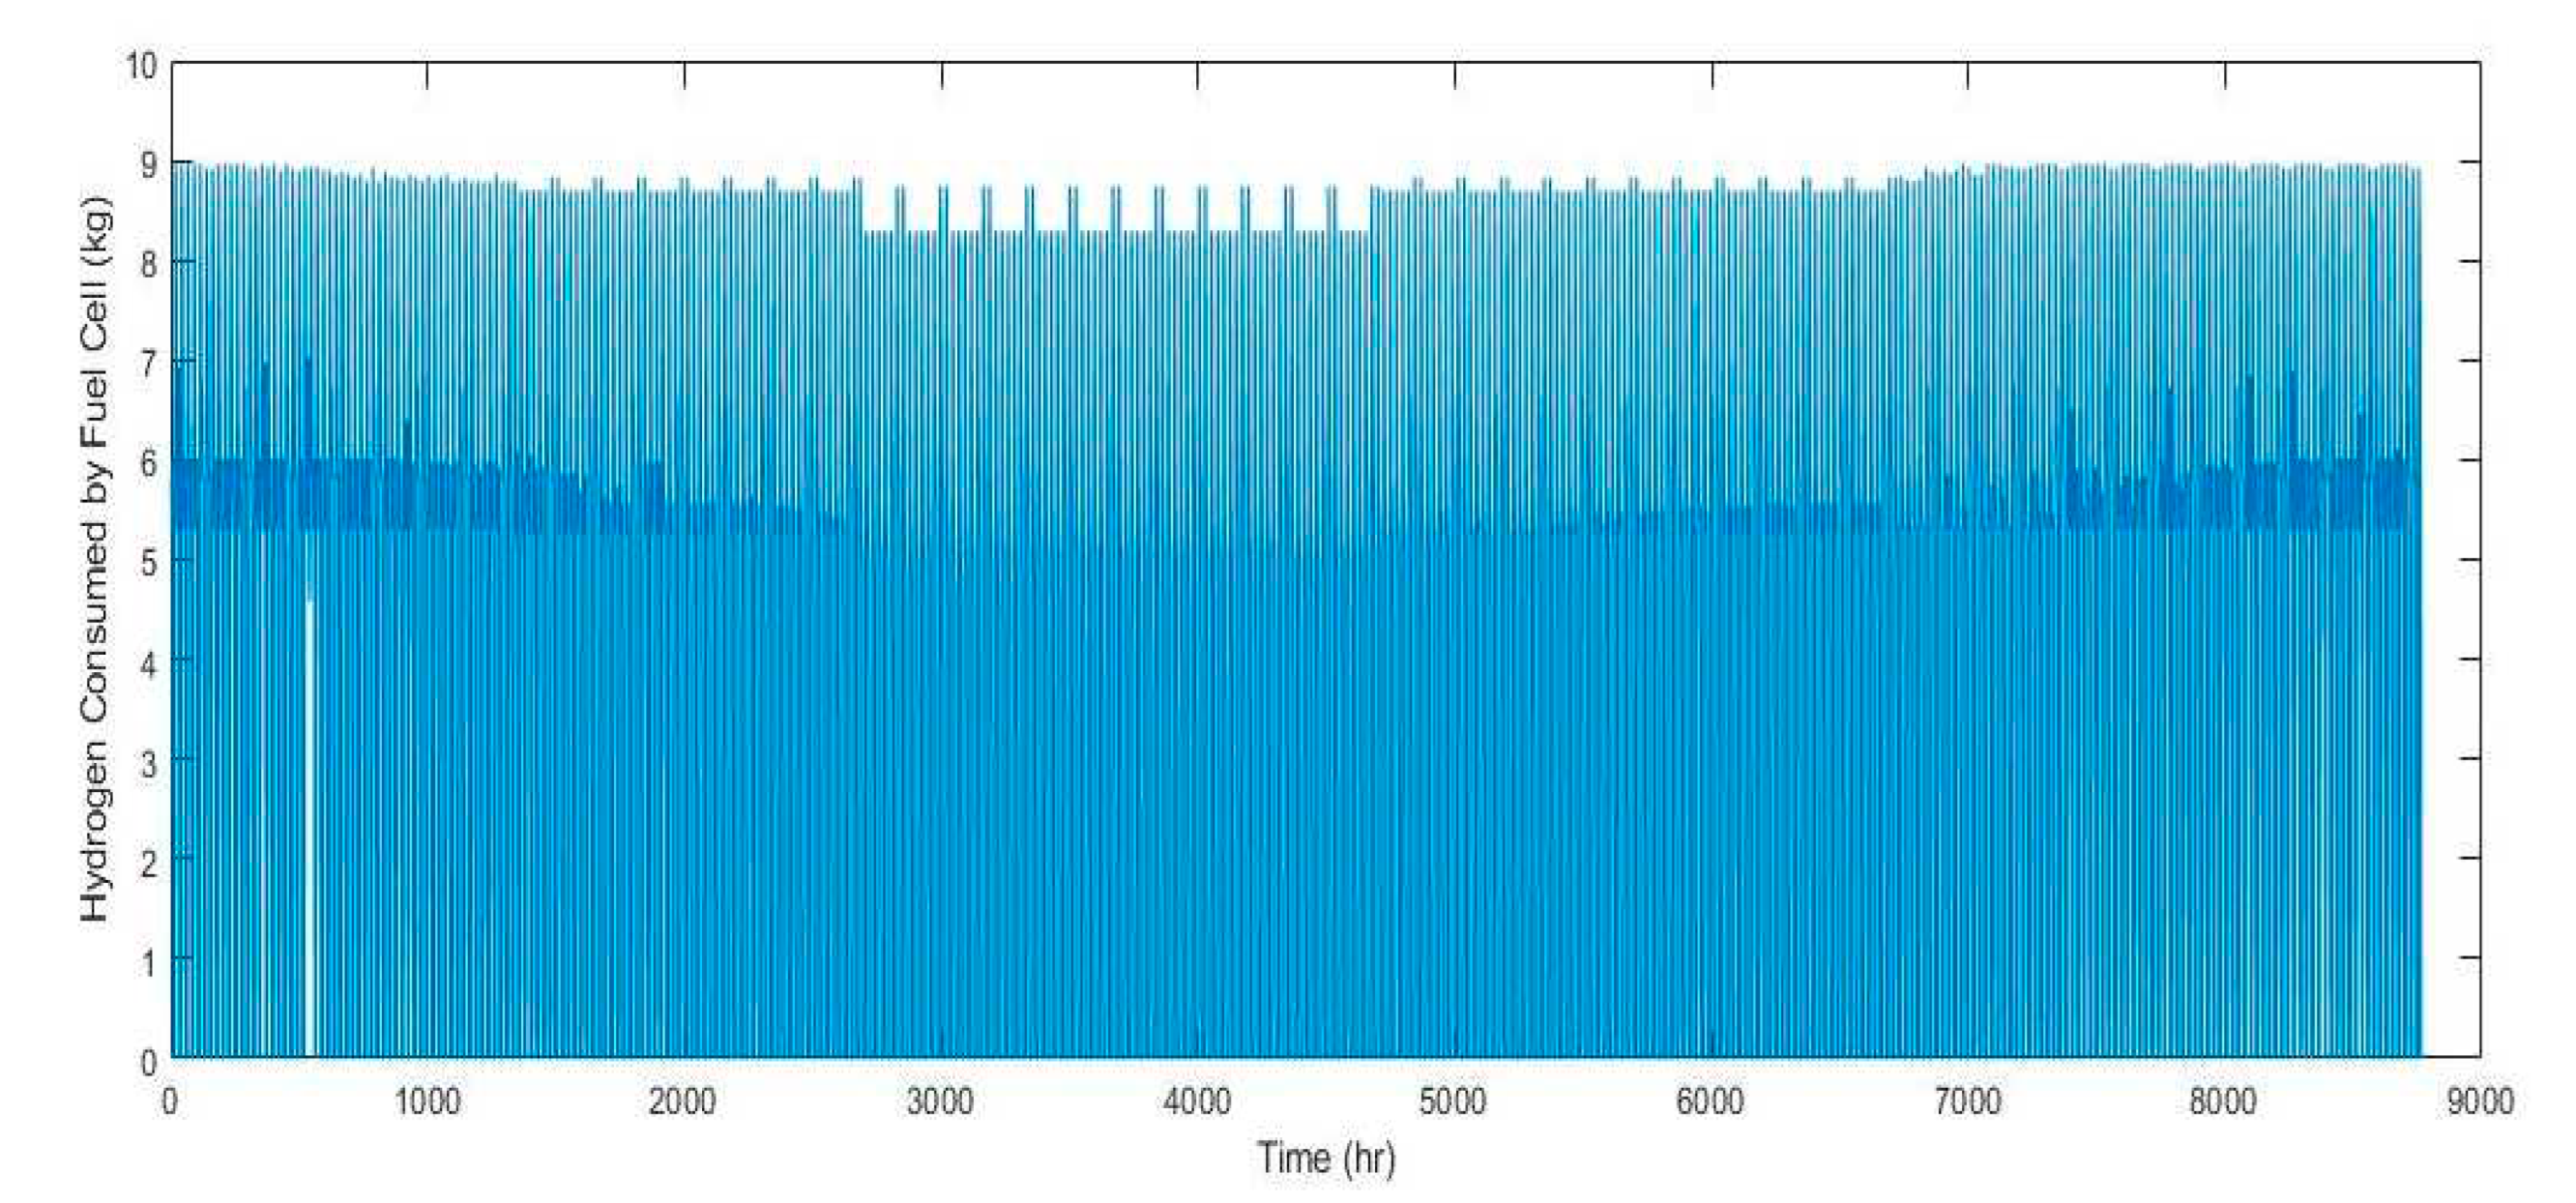
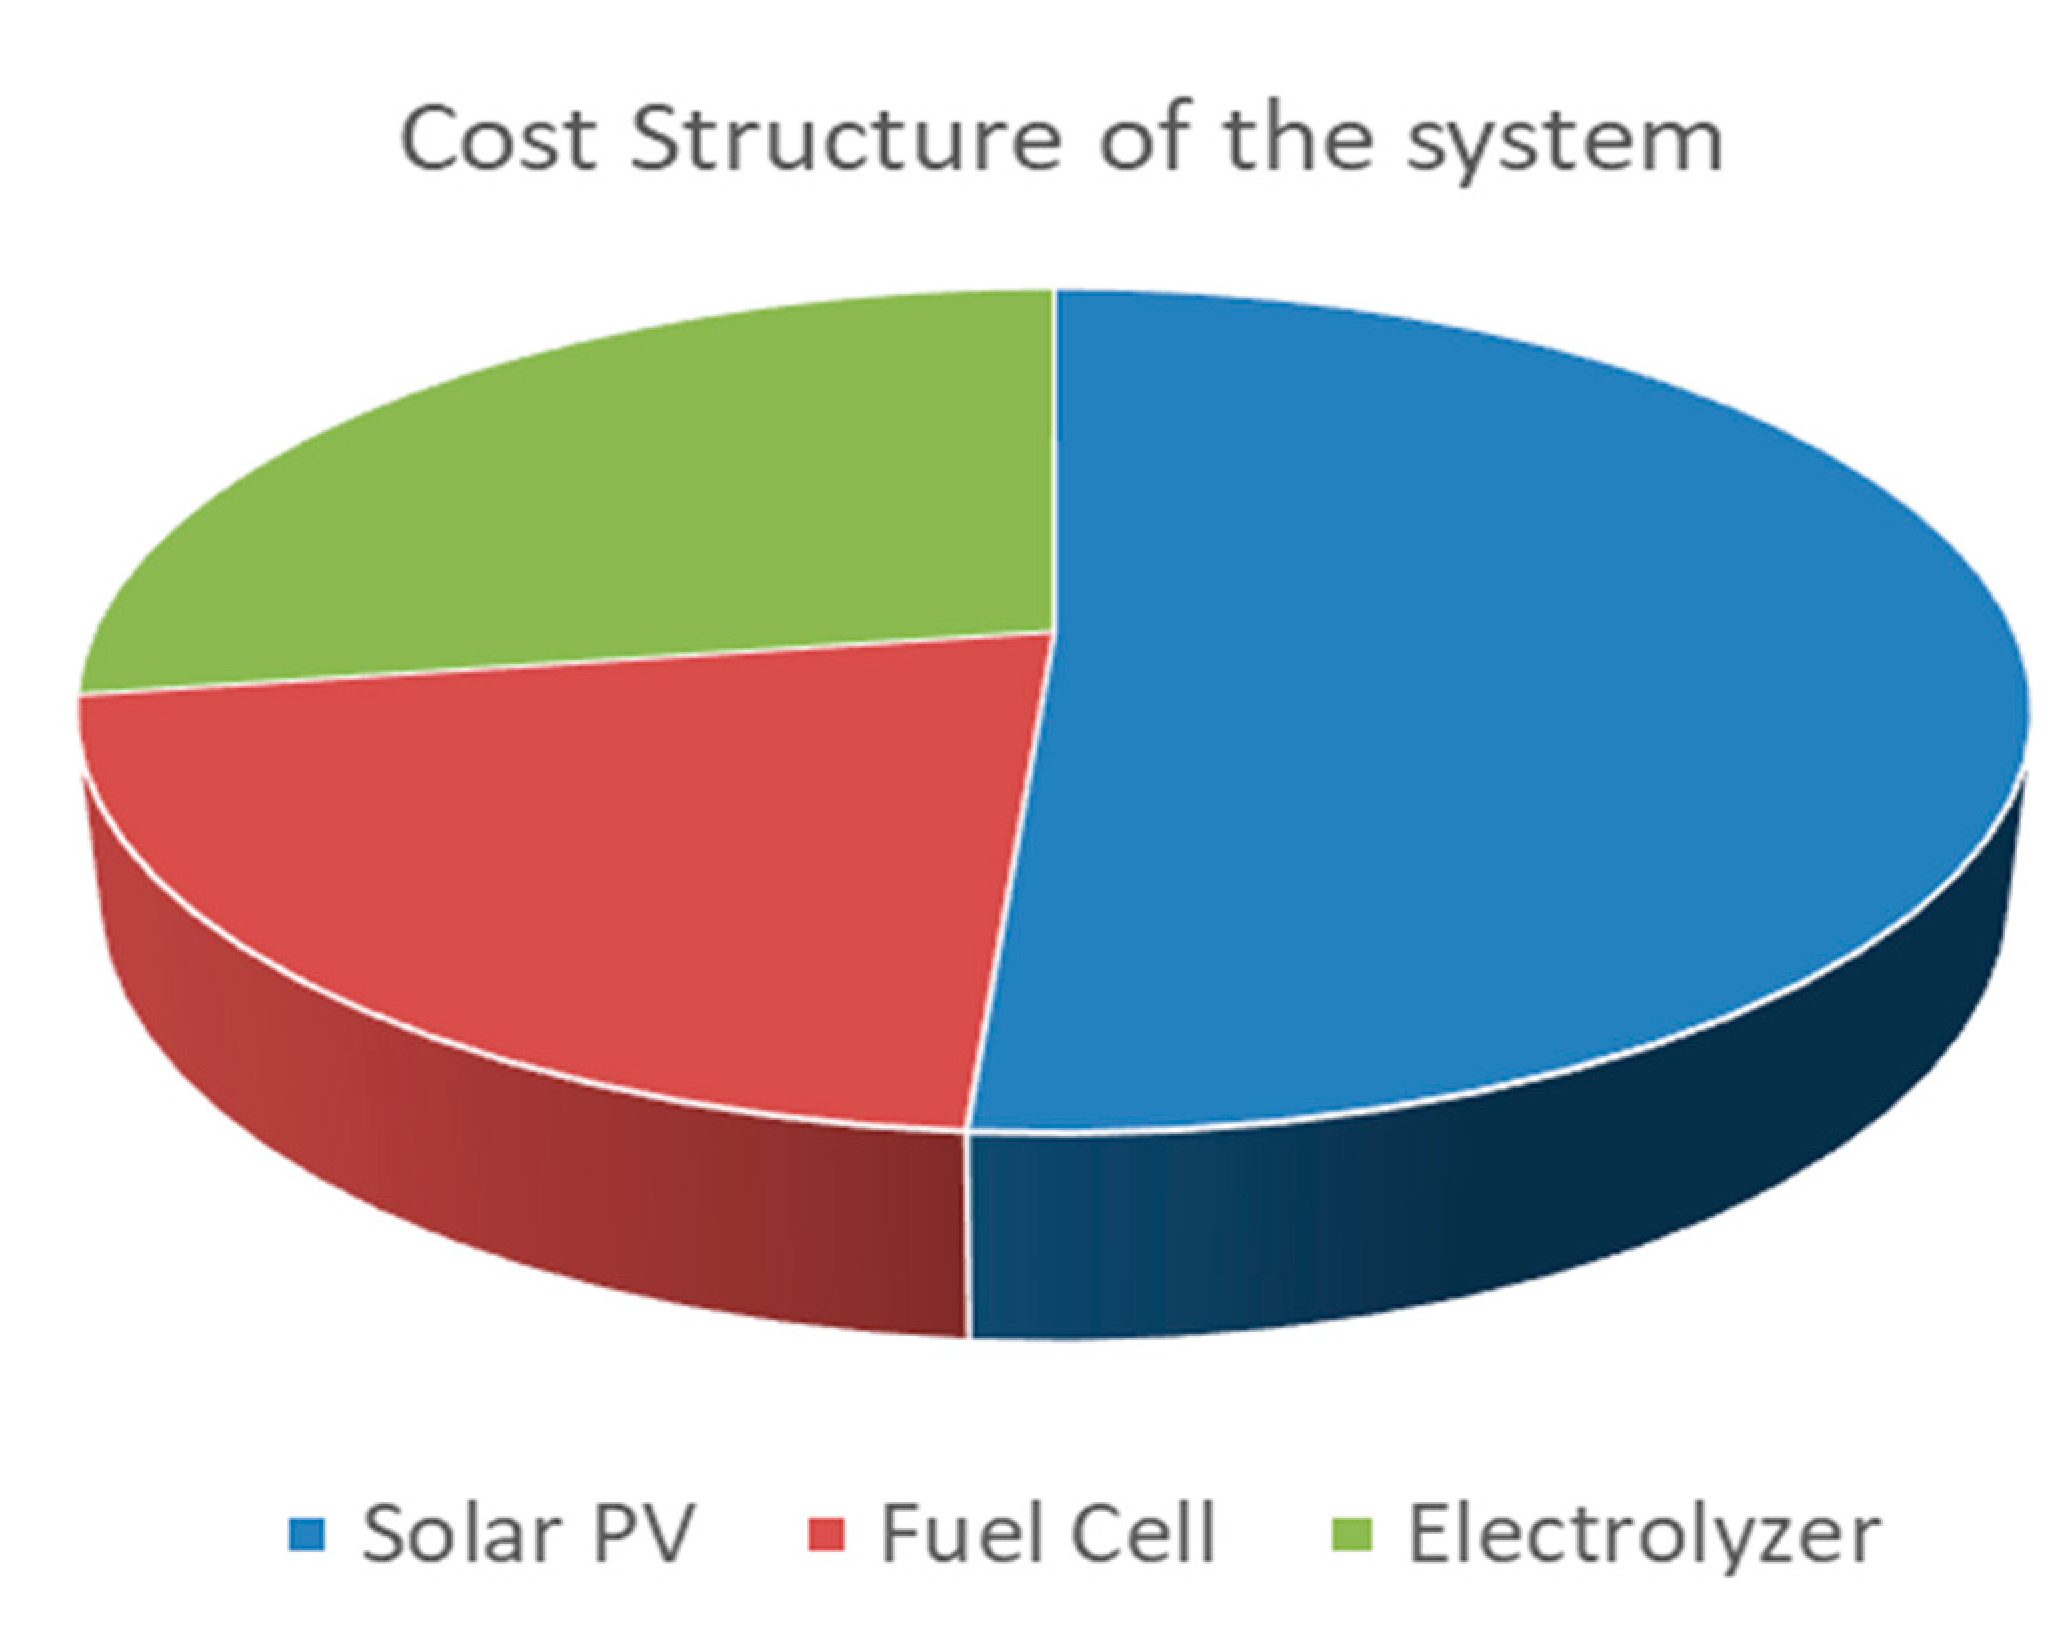

| Hybrid system | Method | Discussion | Authors/year |
| PV-WTG - battery - H2 storage |
Mixed-integer-linear programming | The cogeneration model was created to regulate the energy repository system's two-way energy flow. The model can significantly reduce the cost of producing hydrogen overall, especially when the load profile is high. | (Zhang et al., 2020) |
| WTG - PV-geothermal - H2 storage -battery |
Bi-level mixed-integer | A model addressing the levelized cost of hydrogen was introduced in order to lower the cost of hydrogen generation. To address problems with system performance and dependability, the model includes a variety of continuous and discrete factors. | (Pan et al., 2020) |
| Wind- PV – battery- H2 storage |
Particle swarm optimization | The -constraint method minimizes the COE while constraining loss of power supply probability and non-renewable usage. Simulation and optimization use particle swarm optimization and HOMER software | (Mokhtara et al., 2021) |
| PV – battery- H2 storage |
Iterative method | Based on empirical data on electric power load, solar irradiation, and ambient temperature, the modeling process of the solar hydrogen energy system was examined using MATLAB. The cost of electricity was levelized by $0.195/kWh due to energy distribution, which is a financial consideration. | (Hassan, 2020) |
| PV – battery- H2 storage |
Particle swarm optimization, genetic algorithm | Systems operating in P-PMS mode outperformed R-PMS in terms of cost, renewable integration, and environmental impact. The efficiency of the chosen algorithms was found to be a significant determinant of P-PMS, though. P-PMS might greatly lessen how FC and ELZ instantaneous responses affect the size and operation of the energy system. | (Brka et al., 2016) |
| WTG - PV - H2 storage -battery | Multi-objective-genetic algorithm | Using multi-objective optimization, a trigeneration system that produces ammonia, hydrogen, and electricity was examined. The measured range of the exergy efficiency was 10.9% to 38.2%, depending on the size of the meteorological data. | (Siddiqui and Dincer, 2021) |
| WTG- PV – battery- H2 storage |
Flower pollination algorithm | Renewable energy generation and hydrogen energy storage have an inverse relationship to the system's dependability restrictions. In some Iranian places, it was found that PV panels were more cost-effective than wind turbines. Moreover, wind turbines may be used as a reserve energy source to fulfill peak load requirements. | (Hadidian Moghaddam et al., 2019) |
| WTG- PV – battery- H2 storage |
Improved salp swarm optimization algorithm (ISSOA) | Dimensions of Hydrogen Tank and Battery storage In comparison to PV/WT with a battery storage system, H2 was shown to have a larger Cost of energy generation, while the latter exhibits superior system dependability. In terms of designing a hybrid system, ISSOA performed better than SSOA and PSO. | (Vahid et al., 2020) |
| WTG- PV – H2 storage | Hybrid grey wolf optimizer sine cosine algorithm | When LSCS and LIP were taken into account, PV/WTG/FC was shown to be the best configuration to meet the load requirement. H2 was essential in reducing RE fluctuation, which helped the system achieve the highest level of dependability. The fuel cell's efficiency was shown to be inversely related to stored H2 and LSCS, while directly related | (Jahannoosh et al., 2021) |
| WTG- PV – H2 storage | HOMER | The purpose of the study was to verify the effect of various storage technologies on HES. Minimum NPC and COE were supplied by the VRX battery system. The system made up of FC and H2 showed the fewest changes. By employing the load tracking control, it was discovered that the minimal SOC considering net cost fluctuated more than when using the load cycle control. | (Arévalo et al., 2020) |
| Month | Solar PV | Fuel Cell | Electrolyzer | Hydrogen Tank |
| Capital Cost ($) | 1,793,000 | 750,000 | 960,000 | 2000 |
| Maintenance Cost ($) | - | 816,934 | 2,178,490 | |
| Replacement Cost ($) | - | 750,000 | 960,000 | |
| Annual revenue ($) | 228,928 | |||
| Annual net income ($) | 109,111 | |||
| Net present Value ($) | -2,514,595* | |||
| Present value of O&M ($) | 2,995,424 | |||
| Present value of costs | 6,500,424 | |||
| Levelized annual cost ($) | 716,139 | |||
| Levelized Cost of energy ($/kWhr) | 0.247 | |||
| Photovoltaic Modules | Hydrogen Tank | ||
| Rated Power (kW) | 0.335 | Capacity of hydrogen tank | 100 kg |
| Type | monocrystalline | ||
| Abbreviation: | SPR-X21 | Eefficiency | 98% |
| Panel Type: | Flat Type | ||
| Rated Capacity(kW): | 0.335 | Lifetime | 15 years |
| `Temperature coefficient: | -0.3 | ||
| Operating temperature(C): | 43 | Initial tank level | 10% relative to tank size |
| Efficiency (%): | 21 | Capital | $14/kg |
| Manufacturer: | Sun Power | Replacement | $14/kg |
| Model | SunPower X21-335-BLK | O&M | $10/year/kg |
| Fuel Cell | Electrolyzer | ||
| Nominal Power | 250 kW | Nominal Power | 300 kW |
| H2 consumption rate | 5800 Btu/kWhr | H2 production rate | 60 Nm3/hr |
| Input Pressure | 15 psig | Output pressure | 10 barg-27barg |
| AC Power Production | 5 | AC power consumption | 5 kWhr/Nm3 |
| Nominal efficiency | 90% | Nominal efficiency | 80% |
| Manufacturer | ES5-EA2AAN | Manufacturer | Hydrogenics |
| Model | Bloom Energy | Model | HySTAT-60-10 |
| Capital | $3000/kW | Capital | $1200/kW |
| Replacement | $3000/kW | Replacement | $1200/kW |
| O&M | $0.01/hour/kW | O&M | $100/year/kW |
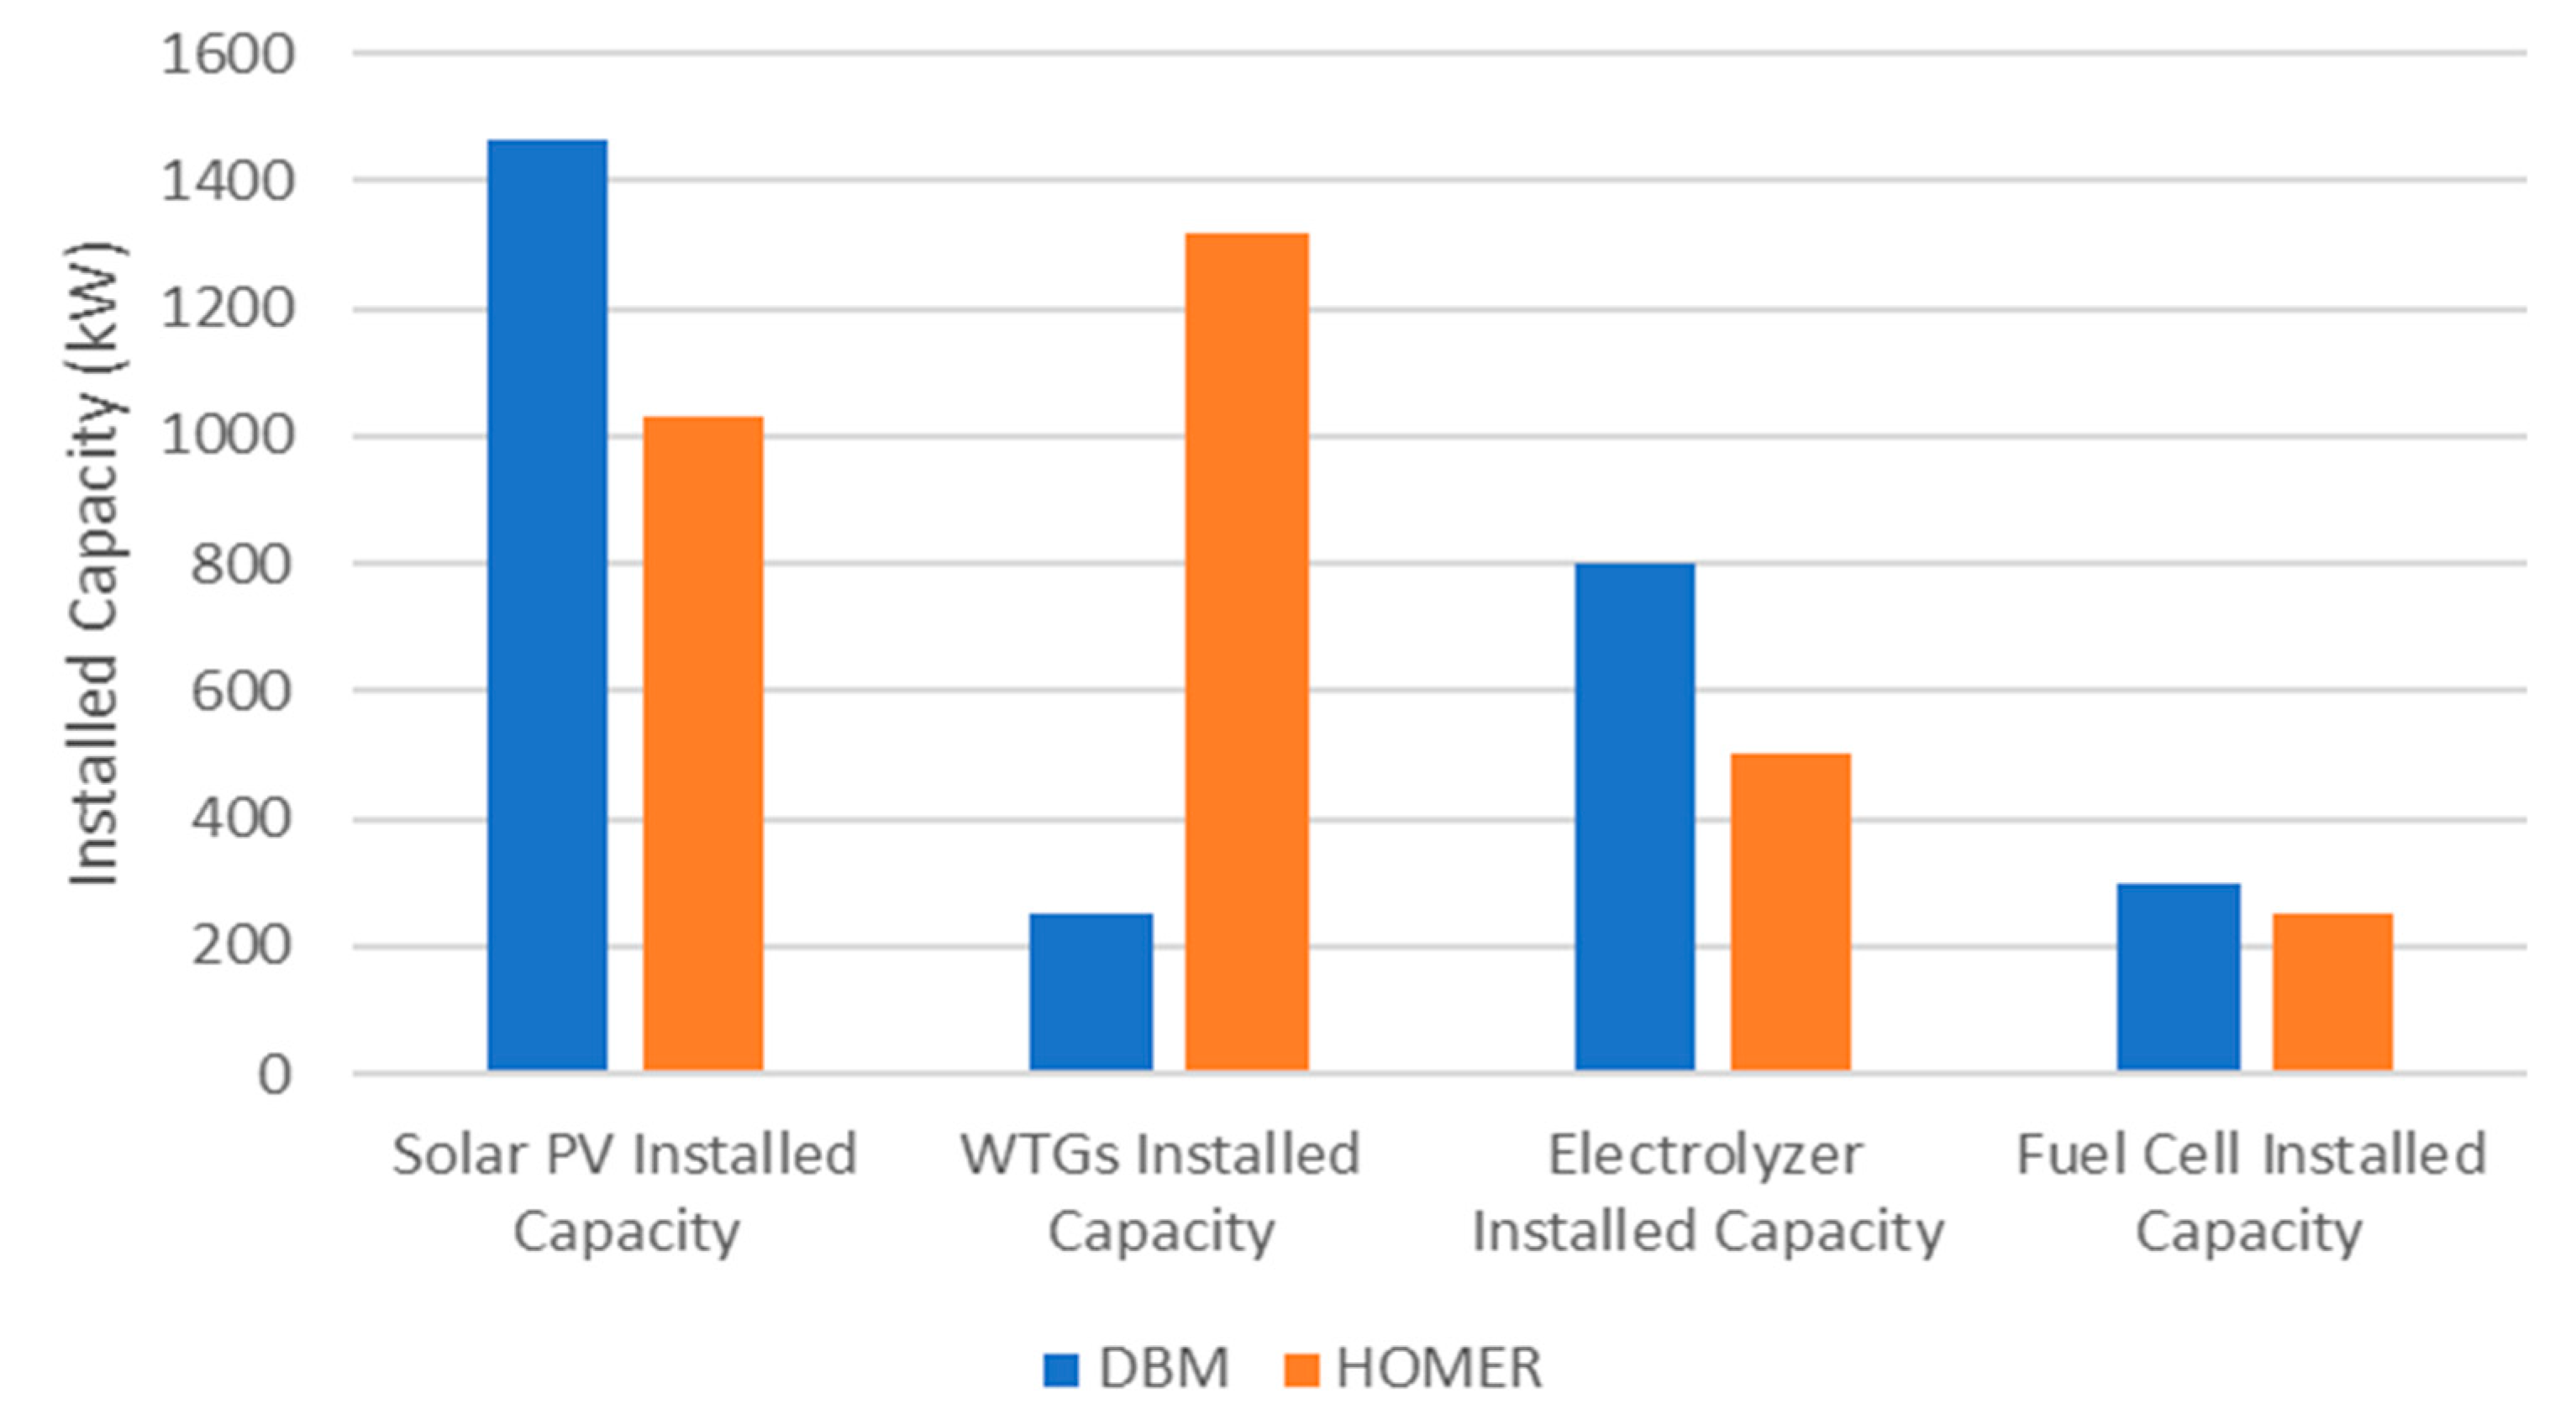
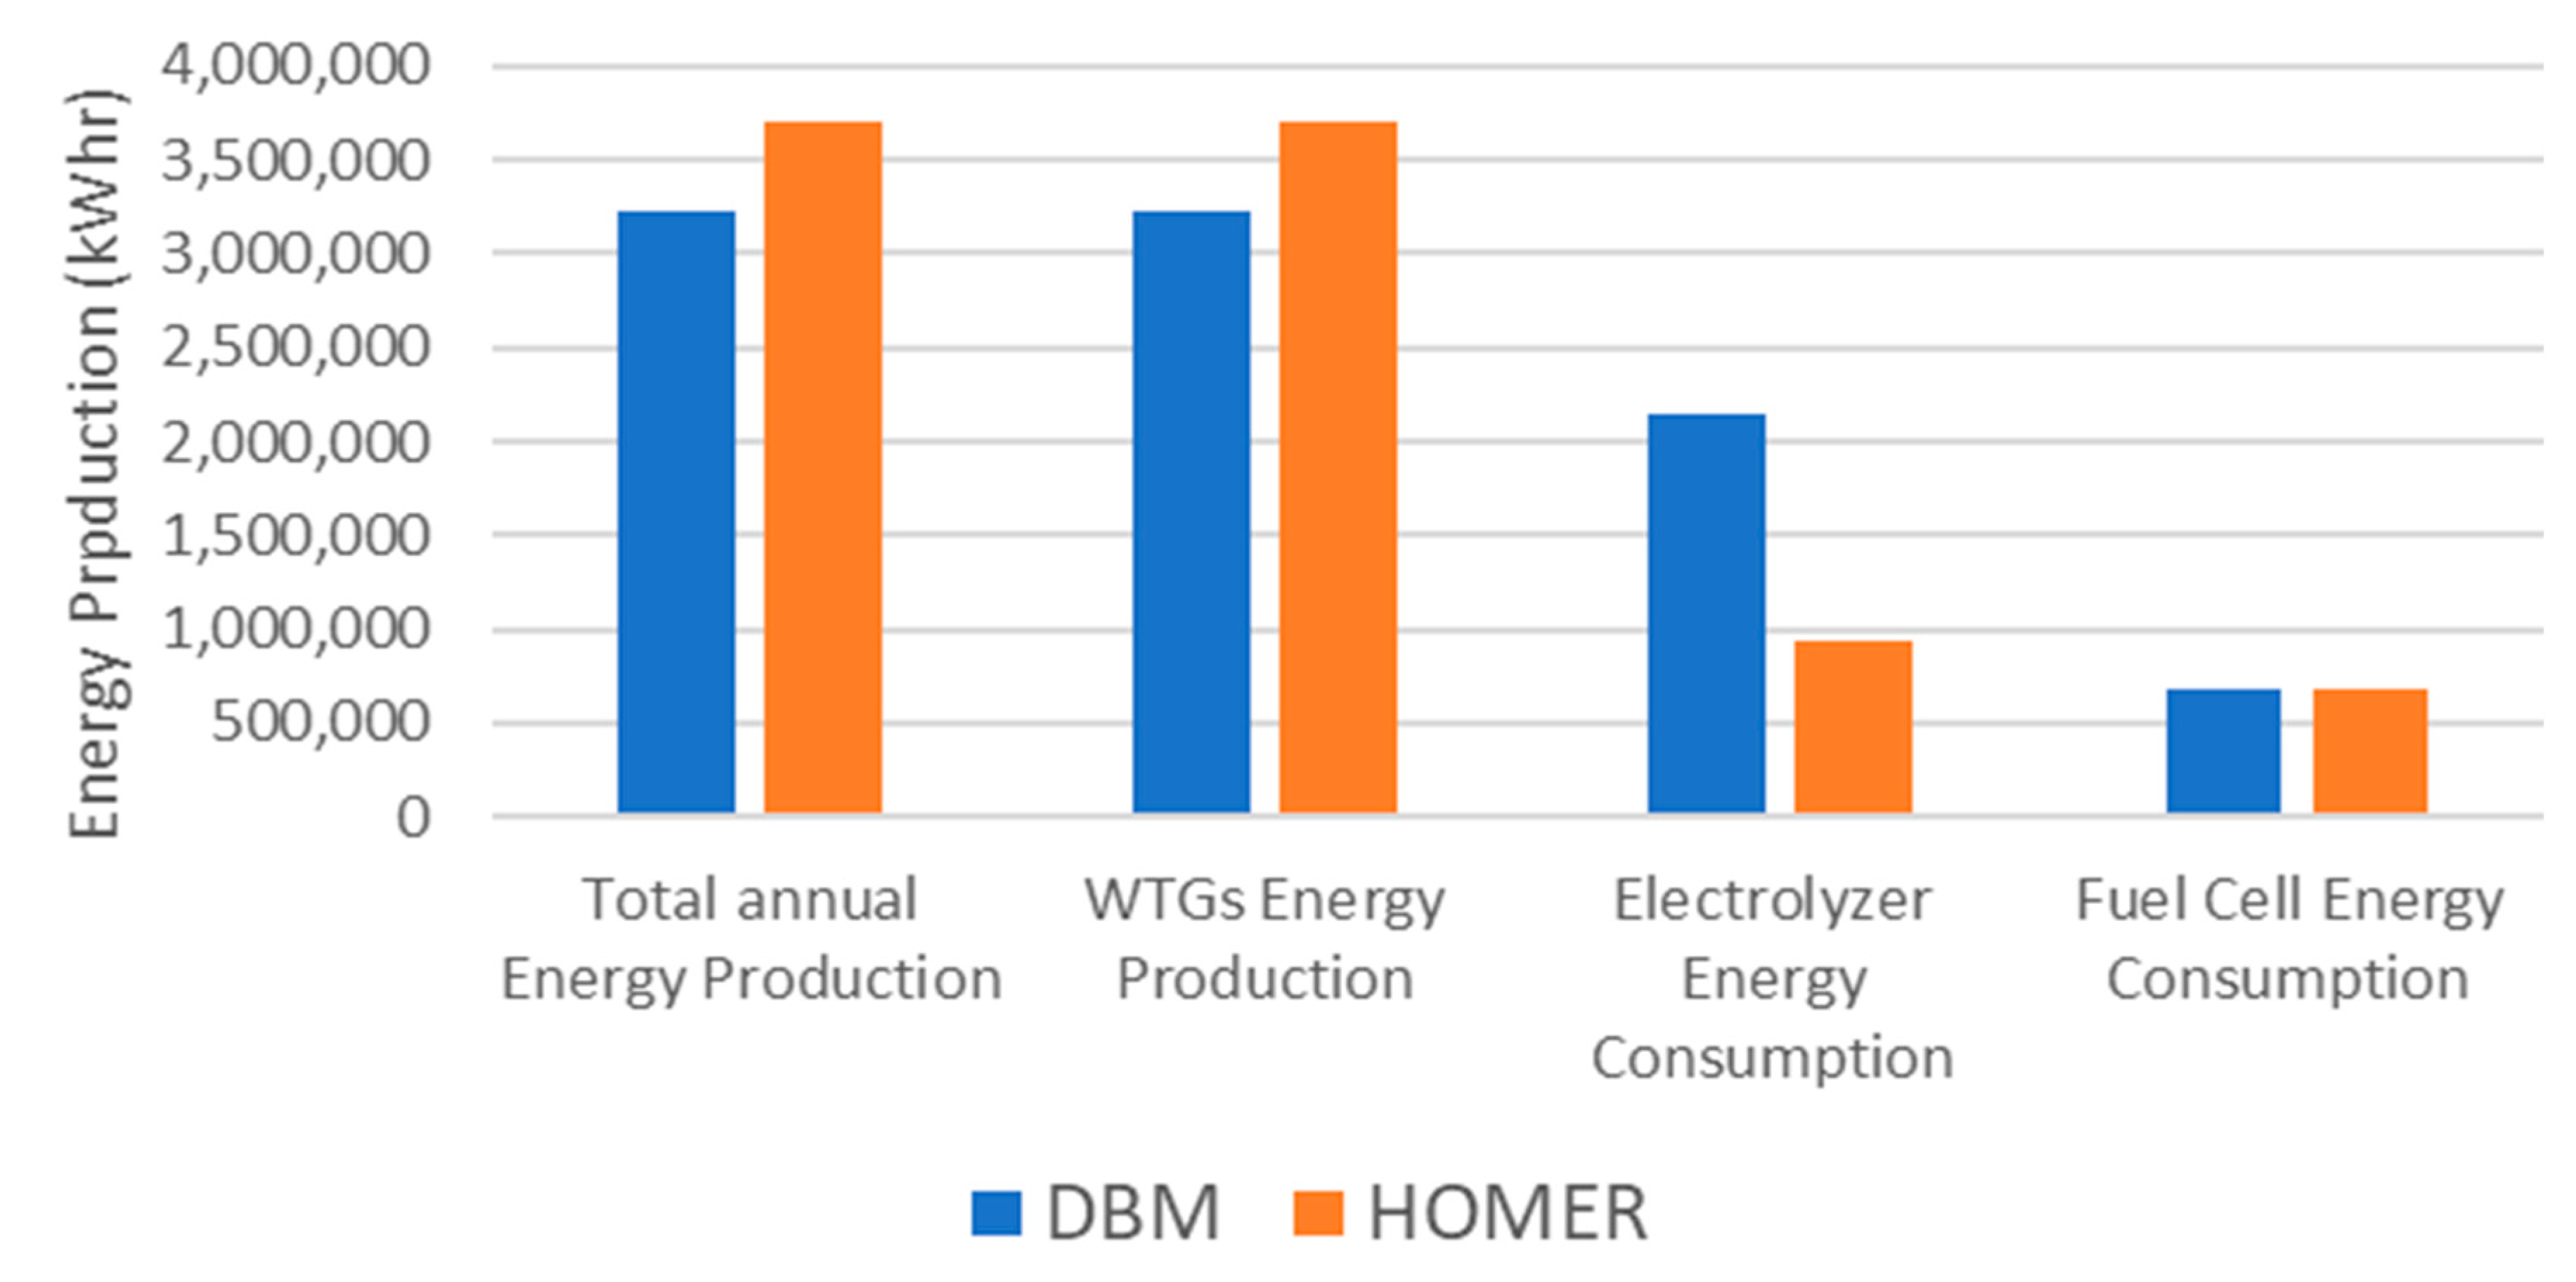
| Point of Comparison | PV/FC/ELZ | WIND/FC/ELZ | PV/WIND/FC/ELZ |
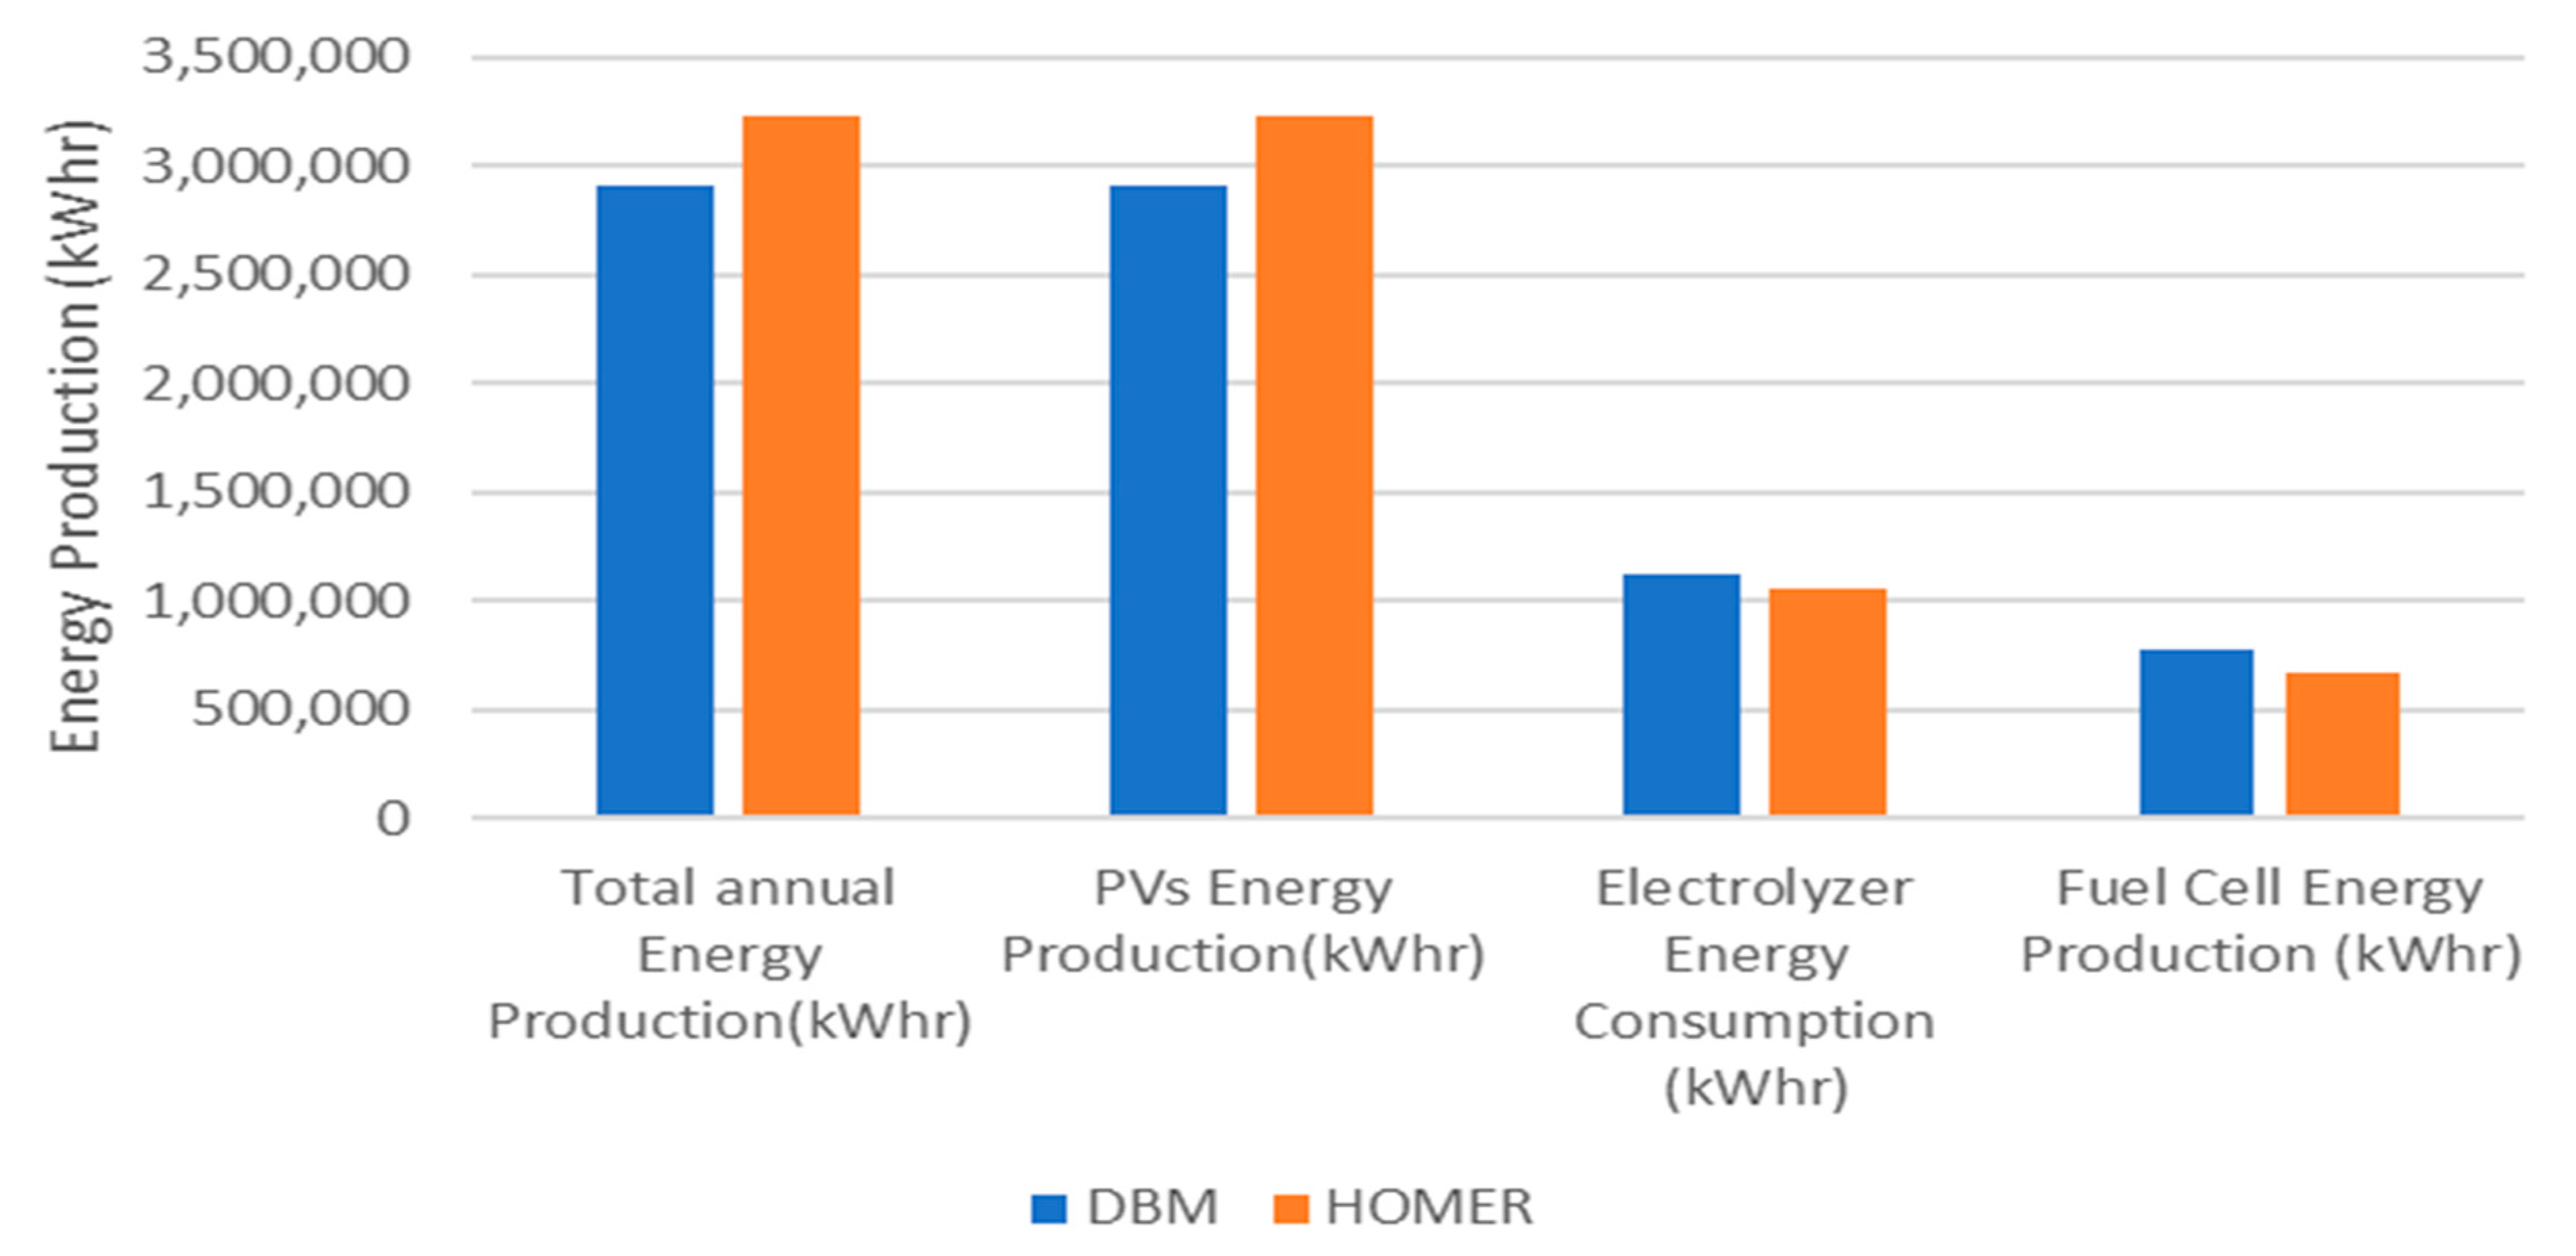
| Energy Production using DBM (kWhr) | 2,905,172 | 3,223,807 | 3,377,699 |
| Energy Production using HOMER (kWhr) | 3,138,000 | 3,396,359 | 3,262,563 |
| Absolute difference (%) | -5% | -5.3% | +3.5% |
| Installed Capacity using DBM (kW) | PV: 1793 kW FC: 300 kW ELZ:800 kW H2 tank: 100 kg |
WTG: 1340 kW FC:300 kW ELZ:1000 kW H2 tank: 100 kg |
PV: 1466 kW WTG: 250 KW FC: 300 kW ELZ:800 kW H2 tank: 100 kg (best techno-economic config.) |
| Installed Capacity using HOMER | PV: 1803 kW FC: 200 Kw ELZ:400 kW H2 tank:100 kg |
WTG: 1980 kW FC:200 kW ELZ:500 kW H2 tank:150 kg |
PV:1032 kW WTG:1320 kW FC:250 kW ELZ:500 KW H2 tank:150 kg |
| Levelized cost of energy-DBM | $0.247 | $0.237 | $0.211 |
| Levelized cost of energy-HOMER | $0.332 | $0.310 | $0.232 |
| Greenhouse emissions | Only manufacturing material | Only manufacturing material | Only manufacturing material |
Disclaimer/Publisher’s Note: The statements, opinions and data contained in all publications are solely those of the individual author(s) and contributor(s) and not of MDPI and/or the editor(s). MDPI and/or the editor(s) disclaim responsibility for any injury to people or property resulting from any ideas, methods, instructions or products referred to in the content. |
© 2023 by the authors. Licensee MDPI, Basel, Switzerland. This article is an open access article distributed under the terms and conditions of the Creative Commons Attribution (CC BY) license (http://creativecommons.org/licenses/by/4.0/).


