Preprint
Article

Phytoplankton Dynamics and Biogeochemistry of the Black Sea

Altmetrics

Downloads

143

Views

41

Comments

0

A peer-reviewed article of this preprint also exists.

Submitted:

06 May 2023

Posted:

08 May 2023

You are already at the latest version

Alerts
Abstract
Biogeochemistry of waters is an essential regulator of phytoplankton dynamics, determining the level of species bloom and the change of dominants. The paper investigated the seasonal dynamics of phytoplankton and the nutrient concentration and their ratios in the NE Black Sea in 2017-2021. Two taxonomic groups, diatoms, and coccolithophores, determine seasonal dynamics and significantly contribute to the total phytoplankton biomass. Coccolithophores annually, except in 2020, formed bloom in early June. Large diatoms in summer annually, except in 2019, dominated with biomass exceeding 1000 mg m-3. During the bloom of these taxonomic groups, their contribution to the total phytoplankton biomass exceeded 90%. Each group has characteristic biogeochemical niches in the nitrogen and phosphorus concentrations coordinates. The regulation of the biogeochemistry of water is the position of the seasonal thermocline. With a high-lying and sharp gradient thermocline (the average for five years is 6.87 m), low nitrogen concentrations and a nitrogen-to-phosphorus ratio below the Redfield ratio are created in the upper mixed layer. These conditions are optimal for the dominance of coccolithophores. When the thermocline is deepened (the average for five years is 17.96 m), the phosphorus concentration decreases significantly and the ratio of nitrogen to phosphorus is significantly higher than the Redfield ratio, and these conditions lead to the dominance of large diatoms. The results of experimental studies with nitrogen and phosphorus additives in the natural phytoplankton population confirm the above statements. The addition of phosphorus leads to an increased role of coccolithophores in the total phytoplankton biomass, the addition of nitrogen alone contributes to the growth of large diatoms, and the combined addition of phosphorus and nitrogen in a ratio close to the Redfield ratio leads to the dominance of small diatoms.
Keywords: 
Subject: Environmental and Earth Sciences  -   Oceanography

Introduction

Phytoplankton of the World Ocean plays an essential role in regulating the planet's climate, and it absorbs about half of atmospheric carbon [1]. Atmospheric carbon is transported to the deep layers of the ocean due to the functioning of the biological carbon pump (BCP) [2,3]; existing estimates of global carbon exports are in the range from 5 to 15x1015 g C per year [4,5]. BCP has a complex structure and includes organic and carbonate pumps [6]. Various taxonomic and functional groups are responsible for the latter's work [7]. The organic pump is mainly represented by diatoms [8], the carbonate pump includes calcifying organisms, and in the ocean, more than 50% of the work of the carbonate pump consists of coccolithophorids capable of building a cell shell from CaCO3 [9,10]. In the process of calcification, one molecule of CO2 is released, which reduces the ability of the ocean to absorb atmospheric carbon. Therefore, the ratio of diatoms and coccolithophorids is fundamental for regulating the planet's climate [7]. In this regard, the question arises of what factors influence this ratio. First, the question is raised about the contribution of the biogeochemical regime of water masses to the regulatory role of this ratio.
The ratio of carbon, nitrogen, and phosphorus (C:N:P) discovered by Redfield in the particulate organic matter (POM) has become a kind of reference point in ocean biogeochemistry, concerning which large-scale biogeochemical processes are considered [11].
This ratio has been a paradigm for a long time and has been widely used in biogeochemical models until now [12]. It was later shown that C:N:P has spatial variability [11,13]. In warm near-equatorial waters, C:N:P is higher than the Redfield ratio; when moving to the poles, it decreases, and at high latitudes, it is significantly lower than the canonical ratio. C:N:P is characterized by temporal variability on the scale of days, seasons, and years [11].
It turned out that there are two main factors of plasticity C:N:P - physiological and taxonomic [11,14]. At the level of one species, this ratio is a function of the concentration of these substances in the medium, and this is a physiological response. On the other hand, the different ratio of these elements is characteristic of different species, which is a taxonomic answer. Furthermore, the latitudinal variability of N:P is due to a taxonomic difference; in southern latitudes, small-size phytoplankton (mainly prokaryotes) with a high value of this indicator dominates; in high latitudes, large eukaryotes contribute to a decrease in N:P [15,16].
In ecological stoichiometry, the dominant hypothesis is the growth rate hypothesis, which postulates that the growth rate positively correlates with the macromolecular composition of biomass and, above all, with the content of ribosomes. Consequently, in fast-growing species, the ribosome content should be higher, which leads to the fact that N:P should be lower [17,18,19]. This pattern has been shown in different taxa and a broad size spectrum [14,19,20,21,22]. Phytoplankton is no exception [23]. It follows that the potential production properties can be judged based on the biochemical composition of biomass, which is taxonomically determined [24,25]. N:P depends on the cell's ratio of ribosomes and protein [26,27,28], and therefore, species with a high growth rate will have a low cell N:P ratio [29].
Applying the growth rate hypothesis to phytoplankton has several features [30]. In particular, in nitrogen limiting growth media N:P may not increase with increasing growth rate. The maximum specific growth rate of the species is noted in the exponential growth phase, and here the optimal ratio of elements for maximum growth will be. In addition, polyphosphates can be the storage reservoir of phosphorus in the cell [31], which significantly changes stoichiometry.
It is fundamentally essential that the ratio of elements in the biomass is a function of their concentration in the medium, and the content of the growth-limiting element and the specific growth rate are related. The Droop equation is a reasonably simple equation describing this relationship [32,33]. This equation has gained the most significant prevalence for creating and improving phytoplankton growth models [34,35,36].
Currently, attempts are being made to link ecological stoichiometry with traits of fundamental importance for growth, survival, and competition [37]. These features are associated with the size of phytoplankton cells using allometric dependencies [38,39,40,41,42,43].
The Redfield ratio is widely used to compare concentrations in water, primarily nitrogen and phosphorus, in various ocean biomes and to identify a factor limiting the productivity of phytoplankton. It is assumed that nitrogen limits the growth of phytoplankton when N:P < 16:1; when N:P > 16:1, phosphorus becomes the limiting factor [44]. It turned out that N:P in phytoplankton biomass is close to the ratio of these elements in the ocean. Two main points of view explain this fact [45]. The first hypothesis is that modern phytoplankton results from the long evolution of phytoplankton in historically existing conditions when modern phytoplankton taxonomic groups were formed. The second concept believes that the concentration of nutrients and their ratio determines by phytoplankton. The latter hypothesis is currently dominant [26]. The structure of phytoplankton is determined by the ratio of nitrogen and phosphorus in the incoming water [46,47]. The residual nutrient concentration and their ratio in the water depend by phytoplankton species [28,48].
The spatial and temporal variability of the biogeochemistry of the waters of the World Ocean indicates the need to investigate the features of the research area. In our work, research is carried out in the Black Sea, which has some unique properties.
The Black Sea is an inland sea with a relatively weak influence of the ocean; the salinity here is half oceanic [49]. This sea location affects its hydrophysical and hydrochemical properties [50]. The biogeochemistry of the Black Sea water masses is subject to significant spatial and temporal variations [51,52,53,54]. The rivers discharge determines the biogeochemistry of this sea. The main river flow is 80% located in the western part of the sea, and this part of the sea is more eutrophicated [55,56,57,58], in the eastern part eutrophication is less and such spatial variability affects the state of the marine ecosystem [59]. A unique feature of the Black Sea is a Rim current that runs along the continental slope and forms a cyclonic circulation [60,61]. The Black Sea has a complex vertical hydrophysical structure characterized by a cold intermediate layer and a pycnocline separating the waters of the Black Sea proper from the underlying Mediterranean waters [62]. The vertical biogeochemical structure is determined by oxic, suboxic, and anoxic layers [62]. The vertical nutrient flow significantly depends on weather conditions, in particular on the winter temperatures of the atmosphere [63] and the thickness of the upper mixed layer [64].
The phytoplankton composition is determined by two taxonomic groups – diatoms and coccolithophores [65,66,67,68]. Coccolithophores blooms occur almost annually in late May and early June and occupy large areas [69,70]. In the northeastern part of the Black Sea, studies from 2002-2016 showed that the annual dynamics of phytoplankton are determined by the biogeochemistry of water [68]. The development of diatoms and coccolithophores is associated with the concentrations of silicon, nitrogen, and phosphorus and their ratios. However, climate change and variations in anthropogenic load may be the reason for shifts in the biogeochemical functioning of the Black Sea ecosystem. Therefore, the task of assessing the current biogeochemical status is an important stage for understanding the processes that lead to changes in the ecosystem.
In this paper, the following hypothesis is tested: the bloom of coccolithophores and large diatoms determine the functioning of the ecosystem of the northeastern part of the Black Sea at the current; these phenomena depend on the biogeochemistry of water and, first of all, the concentration of nitrogen and phosphorus and their ratio. For this purpose, the data of field observations for the last five years (2017-2021) have been analyzed and supplemented with the results of experimental studies of the effect of nitrogen and phosphorus additives on the phytoplankton composition.

2. Methods

2.1. Field Sampling

Physical and chemical data and phytoplankton composition studies were carried out on numerous cruises of R/V Ashamba from 2017 to 2021 in the NE part of the Black Sea (Figure 1). The samples stations were located on a transect from Golubaya Bay (the region of Gelendgik city). The stations were located at depths 25, 50, 100, 500, 100, and 1500 m. A CTD (Sea-Bird Electronics, Inc.) was used to measure temperature, salinity, and density and thence to estimate the upper mixed layer (UML) depth.
5L Niskin bottles mounted on a Rosette sampler were used for water sampling. At each station, samples were taken from different depths (the water surface, the middle of the upper mixed layer for phytoplankton composition (UML), the seasonal thermocline, and below the thermocline). The samples (bottles of 1 - 1.5 L) were fixed with neutralized formaldehyde (0.8–1.0% final concentration). Samples were stored in darkness, at room temperature (18-20 °C), for two weeks; after cell sedimentation, the upper water layers were slowly decanted.

2.2. Field Sample Analyses

Standard spectrophotometric techniques were used to measure the concentrations of silicate, phosphate (P), nitrate (NO3−), nitrite (NO2−), and ammonium (NH4+) [71,72]. Total dissolved inorganic nitrogen (DIN) was estimated as the sum of nitrate, nitrite, and ammonium.
Light microscopy (Jenaval, Carl Zeiss “Jena”) with 16x20 and 16x40 magnifications was used for species identification and cell counting. Cells with linear dimensions of less than 20 µm were counted with a Naujotte chamber (0.05 mL), and large cells were with Naumann (1 mL) chamber.
Species identification was based on morphology guided by the following sources Tomas (1997) and Throndsen et al. (2003) [73,74], and the World Register of Marine Species (http://www.marinespecies.org). Cells with unknown taxonomic affiliation with linear dimensions of 4 to 10 µm were accepted as “small flagellates.” Cell volume was estimated according to Hillebrand et al. (1999) [75]. Wet weight was calculated from the cell biovolume, assuming cell density equals 1g mL-1. The standard equations for converting biovolume to carbon biomass units were used [76]. The dominant species was considered as species with maximal biomass at this station. The subdominant species was the second most biomass species.

2.3. Experimental studies

The experimental study of nutrients treatment on phytoplankton dynamic in natural population were performed at the coastal laboratory of the Southern Branch of the P.P. Shirshov Institute of Oceanology (Gelendzhik). Water for experiments was filtrated through two layers of the net (mesh size - 180 micrometer) to remove zooplankton and was transferred to a 0.5-L Erlenmeyer flask. The volume of culture medium was 200 mL in all experiments. These flasks were kept in a growth chamber where the temperature and irradiance were regulated. Water temperature was usually maintained at the same value of the sea surface at the time of sampling. Lighting was supplied using LEDs (SMD 5050, cold white light, 6500K), and the photon flux density (PFD) 50-60 µmol photons m-2 s-1 PAR; the light:dark cycle was 16:8. Enrichment treatments were realized by the nitrogen and phosphorus supply to the final concentration 12–14 µM and 1 µM, respectively. The scheme of full factorial design 22 was used for the experiment [77]. Four variants of experiments were in this scheme (Table S1): 1 – without nutrients addition; 2 – only nitrogen addition; 3 – only phosphorus addition; 4 – nitrogen and phosphorus additions simultaneously. Each variant was assessed in duplicate or triplicate; the Student t-test was used to compare different variants in the experiments, and the significance was set at 5%. A batch method of cultivation was applied in all experiments. Counts of the cell abundances were carried out every day. Algae of all systematic and size groups were considered, except for the picoplankton fraction (1–2 µm).

3. Results

3.1. Dominance of coccolithophores and large diatoms in the Black Sea

3.1.1. Dominance of coccolithophores

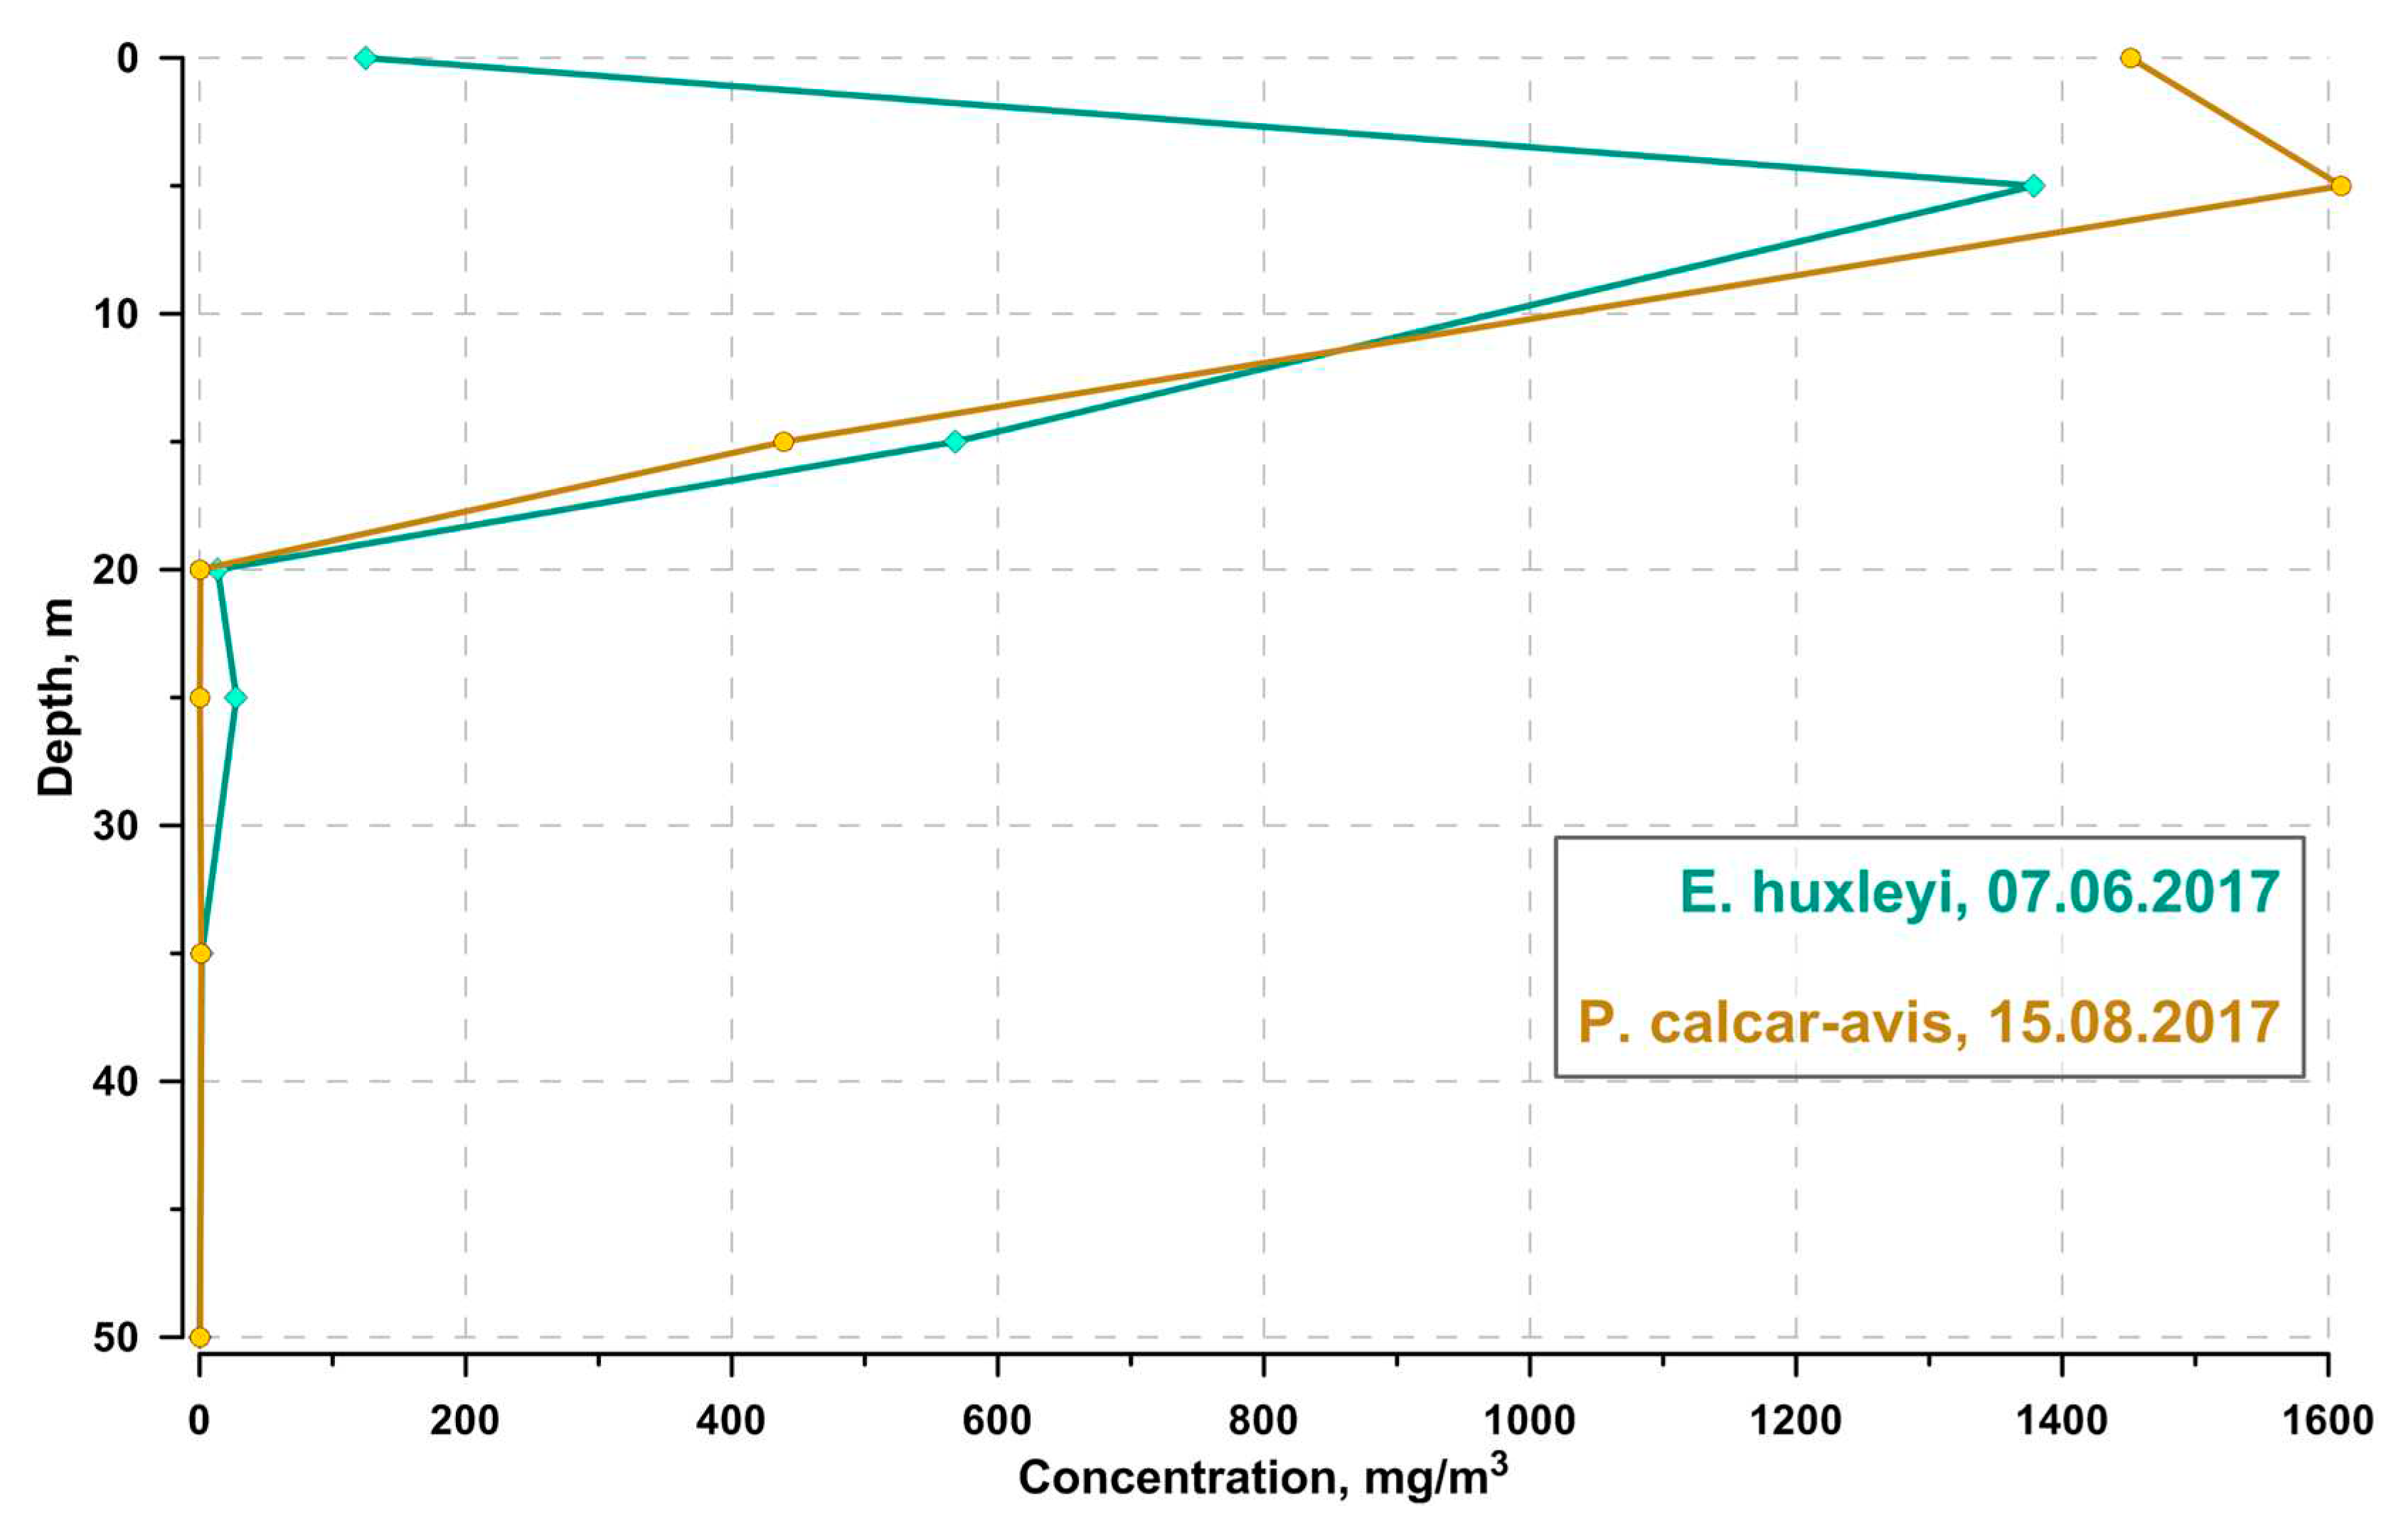
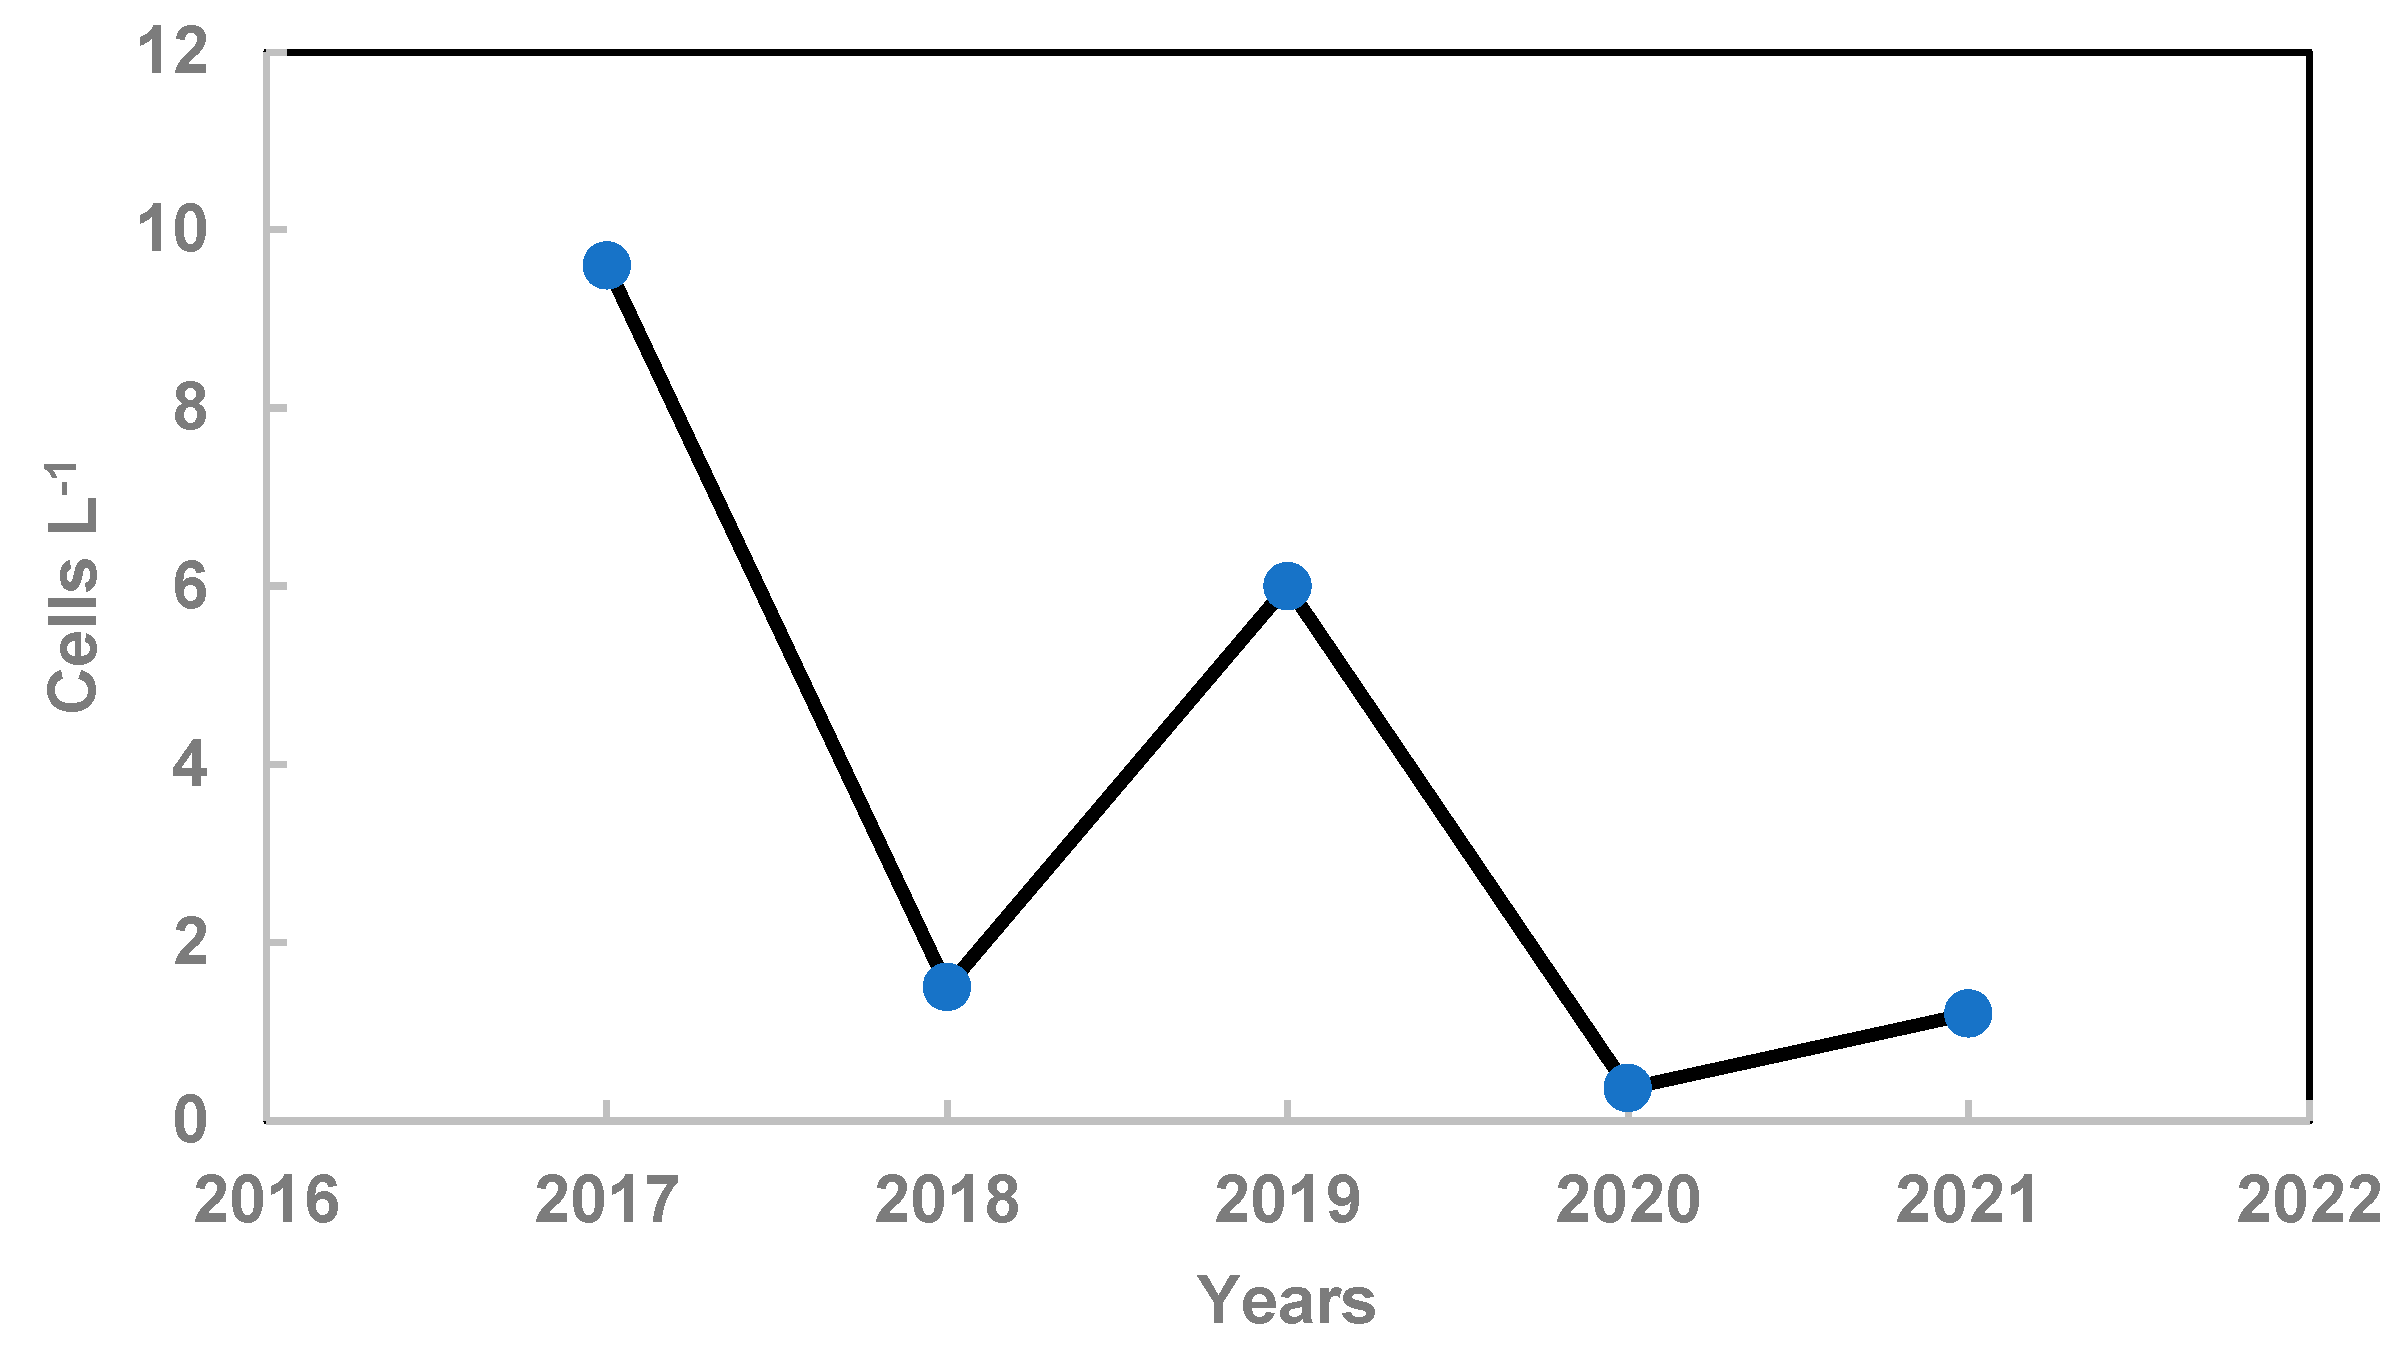
The dominance of coccolithophores usually occurred in early June at depths from 0 to 15 m (Figure 2). Coccolithophores were represented by only one species, Emiliania huxleyi. The bloom level was reached in 2017, 2018, 2019, and 2021, the maximum cell abundance was observed in 2017 (9.6 ·106 cells L-1) (Figure 3, Table S2). At the same time, the coccolithophores’ contribution to the total phytoplankton biomass can reach 99% (Table S2). The biomass of diatoms during the coccolithophores bloom was always negligible. The exception is one case registered at an offshore station when 11.06. 2017 at a depth of 9 m, an accumulation of Cerataulina pelagica with biomass exceeding 1000 mg m-3 was detected. The biomass of dinoflagellates was always low and did not reach 100 mg m-3, with the exception of one case on 5.06. 2019, when an accumulation of Alexandrium ostenfeldii with biomass was recorded on the water surface of the shelf station above a depth of 25 m about 2000 mg m-3. The contribution of small flagellates to the total phytoplankton biomass has always been low.

3.1.2. The dominance of large diatoms.

The dominance of large diatoms in July-August 2017-2021 is recorded annually; maximum biomass occurs in the UML from the surface to a depth of 10-18 m (Figure 2, Table 1). At the same time, the maximum biomass of large diatoms has always exceeded 1000 mg m-3, with the exception of 2019. The biomass of large diatoms is due to the intensive growth of almost one species - Pseudosolenia calcar-avis. The maximum biomass of this species was recorded in July 2020 at a depth of 15 m and in August 2021 at the surface. In addition to this species, in 2020 and 2021, another large diatom Proboscia alata made a significant contribution to the biomass of large diatoms. (Table 1 and Table 2).
At the end of July and in the first half of August 2020, this species was the dominant species. In August 2021, Proboscia alata was subdominant species, but its biomass significantly exceeded 1000 mg m-3. Also, at this time, another large diatom Dactyliosolen fragilissimus, with relatively high biomass, was recorded. In August 2017, the pennate small-cell diatom Pseudo-nitzschia delicatissima appeared for a short time in phytoplankton.
During the bloom of large diatoms, the contribution of dinoflagellates, coccolithophorids, and small flagellates was always relatively low (Table S3).

3.2. Physics of the water column.

The physics of the water column depends on the absorption of the heat flux generated by solar radiation (Figure S1). The maximum light flows are recorded in June-July, and the minimum in December and January; the difference is about five times. In the NE part of the Black Sea is the non–freezing; observations over the past 20 years show that the minimum water temperature on the surface is in February and March and is in the region of 9-10 °C (Figure S2). The maximum temperature reaches 28 °C in August.
The bloom of the coccolithophore Emiliania huxleyi occurs in late spring and early summer in the UML with a high-lying thermocline (Table 1, Figure S3). Data for 2017-2021 show that the water temperature in the UML during the bloom of the coccolithophore Emiliania huxleyi is approaching 21 °C. The depth of the water layer of 10 °C, which corresponds to the winter temperature on the water surface, is low. Accordingly, the thickness of the layer from the thermocline to the reference temperature of 10 °C is also relatively small.
Table 3. Temperature and salinity at UML, depth and thickness of seasonal thermocline during Emiliania huxleyi and large diatom Pseudosolenia calcar-avis bloom.
Parameter E. huxleyi P. calcar-avis p, t-test
Temperature 20,89 25.93 5.1·10-26
Salinity 17.74 17.97 0.0004
Depth of seasonal thermocline 6.87 17.96 1·10-7
Depth of layer 10 °C 27.47 42.67 5.1·10-7
The thickness of seasonal thermocline 20.60 24.41 0.031
The bloom of a large diatom Temperature and salinity in UML, depth and thickness of seasonal thermocline during Emiliania huxleyi and large diatom Pseudosolenia calcar-avis bloom in summer is observed with a deep-lying thermocline and a water temperature in UML reaching 26 °C (Table 1). The water layer with a temperature of 10 °C is located much lower than in late spring and early summer during the coccolithophores bloom. The thickness of the layer below the thermocline also increases.
In summer, there is an increase in salinity on the surface water.

3.3. UML Chemistry

When coccolithophores dominate in early summer, low nitrogen concentrations were recorded, but relatively high phosphorus concentrations and N:P are below the Redfield ratio (Table 4). At this time, high silicon concentrations were observed, which led to an increase in Si:N.
During the bloom of large diatoms, the nitrogen concentration significantly increases. However, the phosphorus concentration significantly decreases, as a result of which the N:P becomes significantly higher than the Redfield ratio (Table 4). The silicon concentration is significantly reduced, which leads to a significant decrease in Si:N. Changes Si:P during coccolithophores bloom, and large diatoms were not reliable.

3.4. The effect of nitrogen and phosphorus additives on the dynamics of phytoplankton.

In an experiment conducted on May 21, 2019, an intensive growth of Emiliania huxleyi was observed in a variant with the simultaneous addition of nitrogen and phosphorus. The regression equations show that the contribution of phosphorus exceeds the contribution of nitrogen (Table 5). At the same time, the growth of the small pennate diatom Pseudo-nitzschia delicatissima was observed in the population; it was maximal with the simultaneous addition of nitrogen and phosphorus, while the contribution of nitrogen was one and a half times higher than the contribution of phosphorus. The growth of a large diatom was noticeably higher in the absence of phosphorus supplementation. In an experiment conducted on June 11, 2020, the growth of E. huxleyi was observed only in experiments where phosphorus was added. The growth of the large diatom Cerataulina pelagica and the relatively small diatom Leptocylindrus danicus was observed with the simultaneous addition of nitrogen and phosphorus, while the contribution of nitrogen was noticeably higher. In an experiment on June 11, 2021, intensive growth of a large diatom Proboscia alata was obtained in an experiment with nitrogen addition.

Discussion

Five-year observations have shown that coccolithophores dominate annually in early summer and large diatoms in summer. This trend is consistent with the results of previous studies, which show a similar phenomenon from 2002 to 2017 [68]. Over the past five years, no significant changes in environmental conditions could lead to noticeable shifts in phytoplankton composition and dominant species. The annual dominance of coccolithophores and large diatoms in a specific season is part of the seasonal succession of phytoplankton, the primary regulator of which is the physics of the water column [78,79].
The bloom of the coccolithophore Emiliania huxleyi
Two factors determine the water column's hydrophysical processes – the heat flux's intensity at the atmosphere's boundary and the water surface and the wind speed. In turn, the wind direction determines the air temperature; NE and SE winds are dominant in the northeastern part of the Black Sea [80]. The wind speed is maximal in winter and minimal in summer [81,82]. In winter, cold NE winds dominate, the air temperature is below the water temperature, the water's surface is cooled, and convective mixing develops. A thermocline develops with the weakening of the winds and the strengthening of thermal radiation. In late spring and early summer, with the dominance of weak SE winds, it becomes sharp, and the thermocline depth at this time is minimal. The importance of this parameter for separating the ecological niches of diatoms and coccolithophorids has become apparent only recently [83]. In the Atlantic Ocean, coccolithophores blooms are also observed with the stability of the water column and the presence of thermocline [84].
High heat flux in late May and early June contributes to increased temperature in the UML, which is close to optimal for the intensive growth of coccolithophores [85,86]. Thus, a sharp gradient thermocline and a temperature close to optimal are necessary to develop Emiliania huxleyi bloom.
The intensity of bloom in the years of research was different; the maximum was recorded in 2017. The reasons for the interannual variability remain unclear. However, there is a hypothesis that the intensity of the bloom is associated with the intensity of winter mixing; after cold winters with increased vertical turbulence, the bloom is more intense [87]. Indeed, deeper mixing in cold winters transfers denser waters to the upper layers, which enhances vertical exchange when convective mixing stops [88].
The salinity of the UML varies depending on the season, and river runoff plays the primary role [89]. Increased river discharge in spring and early summer leads to minimal salinity. High thermal radiation on the water surface and low inflow of fresh water contribute to some increase in water salinity in summer. However, such insignificant changes in salinity cannot have physiological consequences for Emiliania huxleyi, which grows intensively in a wide salinity corridor [90].
The coccolithophore Emiliania huxleyi grows intensively and reaches the bloom level at relatively low nitrogen and high phosphorus concentrations. This fact is consistent with earlier data obtained in the Black Sea [67,68]. Low nitrogen concentrations are a characteristic feature of blooms in the ocean [90], indicating a similar mechanism of adaptation to low nitrogen concentrations. Furthermore, the half-saturation constant for nitrogen uptake in this species is very low (⩽0.5µm); it allows it to compete successfully with other species, particularly with the rapidly growing small diatoms Skeletonema costatum [91]. The ability of Emiliania huxleyi to grow at low nitrogen concentrations [92] and win the competition from other species has an implementation of the “affinity growth strategy” [68]. Indeed, according to the R-competition theory [46,47], the competition will be won by a species with a low residual concentration of the limiting resource.
This strategy implies a low nitrogen quota in the cell [93]. However, the small cell size and the lack of space for vacuoles do not create an opportunity to accumulate intracellular nitrogen reserves. Thus, concerning nitrogen, the Emiliania huxleyi cell should be attributed not to a storage cell but to an assembly machinery [28,48].
At the same time, Emiliania huxleyi demands high phosphorus concentration; its advantage is manifested at relatively high phosphorus concentrations. Our experimental studies show that it is always necessary to add phosphorus to increase the biomass of this species. Cells of this species grow successfully at N:P below the Redfield ratio. This fact was noted in field studies [68,94] and in experiments with the addition of nitrogen and phosphorus [67]. Increased phosphorus concentrations in the medium suggest an increase in the content of phosphates in the cell. This event usually occurs due to an increase in the content of ribosomes, and according to the hypothesis of the growth rate, this species should be attributed to the rapidly growing. However, in reality, the specific growth rate of Emiliania huxleyi is significantly lower than the specific rate of small diatoms. Therefore, this species is classified as a K-strategy compared to diatoms, mostly R-strategists [7]. So far, the reasons for the high phosphorus demands are unclear. Nevertheless, photosystem II activity in E. huxleyi decreases faster with phosphorus restriction than with nitrogen restriction, and the opposite happens in diatoms [95]. Also, when phosphorus is limited, morphological changes in both cells and coccoliths are recorded, and the carbon quota in the cell and the degree of its calcification increase [96,97,98].
Small diatoms are more demanding of nitrogen concentration. In our experiments, adding nitrogen increases their intensive growth (Table 5). In these experiments, N:P is close to the Redfield ratio.
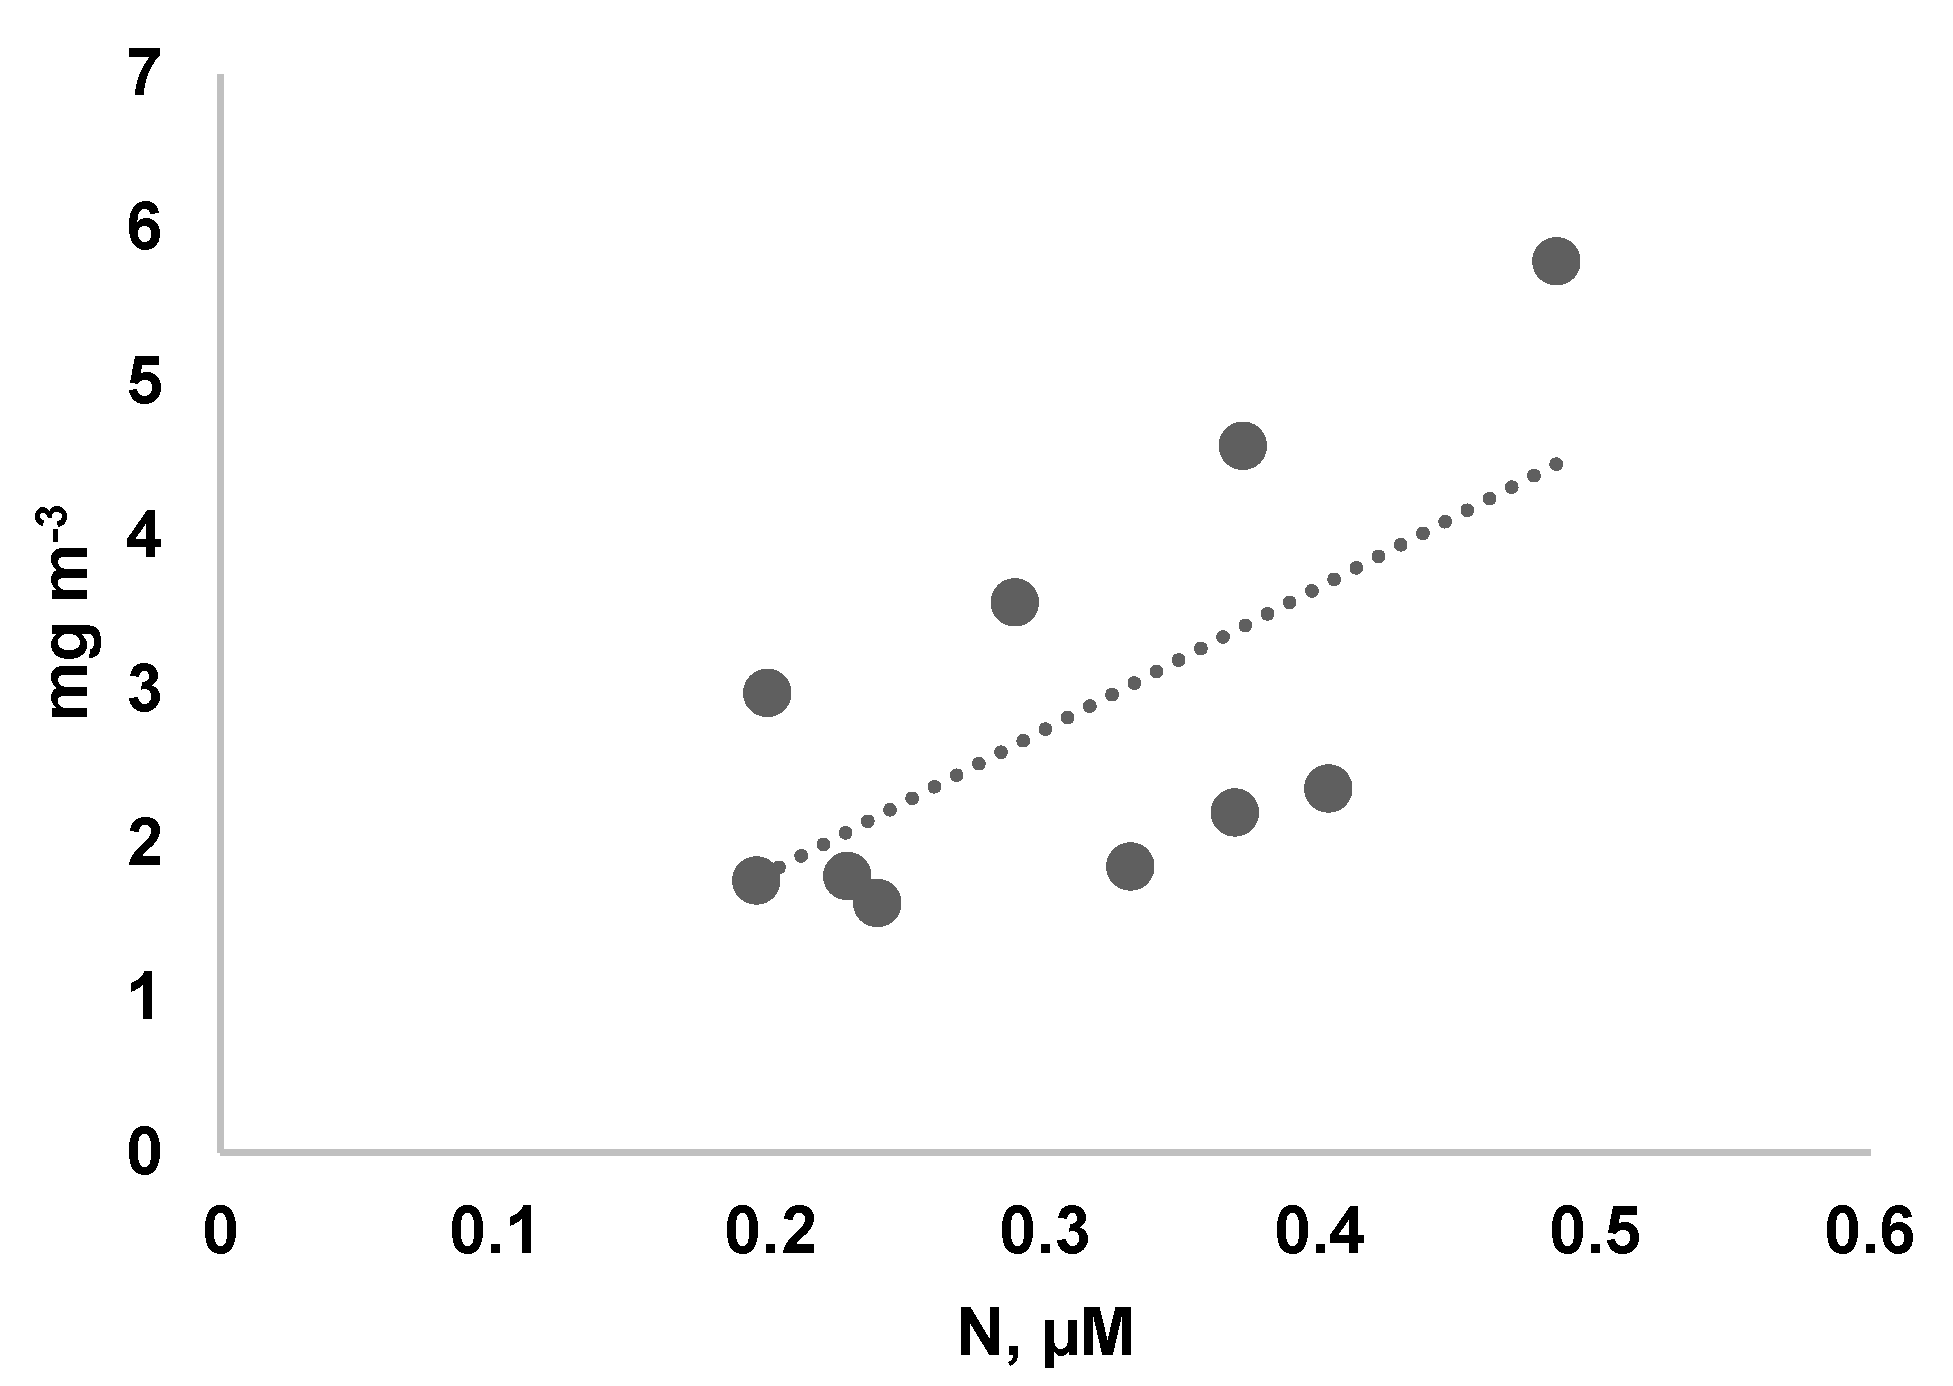
At the beginning of June 2018, in field studies, we found a significant increase in the biomass of the small diatom Pseudo-nitzschia delicatissima with an increase in the nitrogen concentration in the medium (CC = 0.48; p = 0.04) (Figure 4). Thus, an increase in nitrogen concentration at a relatively high phosphorus concentration leads to a shift in seasonal succession towards the spring bloom of small diatoms.
Large diatoms bloom and biogeochemistry of seawater
Diatoms are the most widespread taxonomic group in the World Ocean, which provides a high level of primary production and high diversity [8,99,100]. The annual summer dominance of large diatoms in the northeastern part of the Black Sea is associated with the intensive growth of mainly one species Pseudosolenia calcar-avis; sometimes, Proboscia alata was recorded.
In the second half of June, the NE wind becomes dominant; its characteristic feature is temporary instability. This event leads to a gradual deepening of the UML, and it ceases to be acutely gradient. The depth of the seasonal thermocline layer increases.
The phosphorus concentration is low and, in some cases, close to zero. An increase in nitrogen concentration and a significant decrease in phosphorus concentration leads to an increase in N:P, significantly higher than the Redfield ratio. Due to the intensive consumption of silicon, its concentration is significantly lower than the bloom period of coccolithophores; the consequence is a decrease in Si:N.
The nutrient ratio and, above all, N:P are regulated by the physics of the water column. The nitrogen concentration increases faster with depth than the phosphorus concentration (see Figure S); at the lower boundary of the thermocline, the nitrogen concentration can reach 2 µM. A noticeable increase in phosphorus concentration begins from a depth of 90 m. During the summer bloom of large diatoms, mixing reaches depths of elevated nitrogen concentrations but does not reach depths of elevated phosphorus concentrations.
Our experimental results show that the stimulation of the growth of large diatoms occurs with the addition of nitrogen only (Table 5), i.e., with a shift of N:P above the Redfield ratio.
The high N:P in the medium determines the structural stoichiometry, i.e., the high ratio of nitrogen contents in the cell [101,102]. Based on the hypothesis that there is an optimal N:P for each species [28,48], the high N:P we found is optimal for large diatoms. There is a physiological justification for this. The concentration of ribosomes in a large cell is relatively low. The concentration of protein found in chloroplasts is relatively high. In addition, the content of vacuoles capable of accumulating nitrogen [103] is high. Concerning nitrogen, large diatoms are storage machines.
Conceptual schemes reflecting the position of these groups in the coordinates of physics and chemistry of the water column contribute to understanding the significant differences in the ecological niches of the main taxonomic groups of phytoplankton. The classical scheme is Margalef's Mandala, where turbulence is reflected on one axis and nutrient concentration on the other [104,105]. These schemes have been further developed [106,107,108].
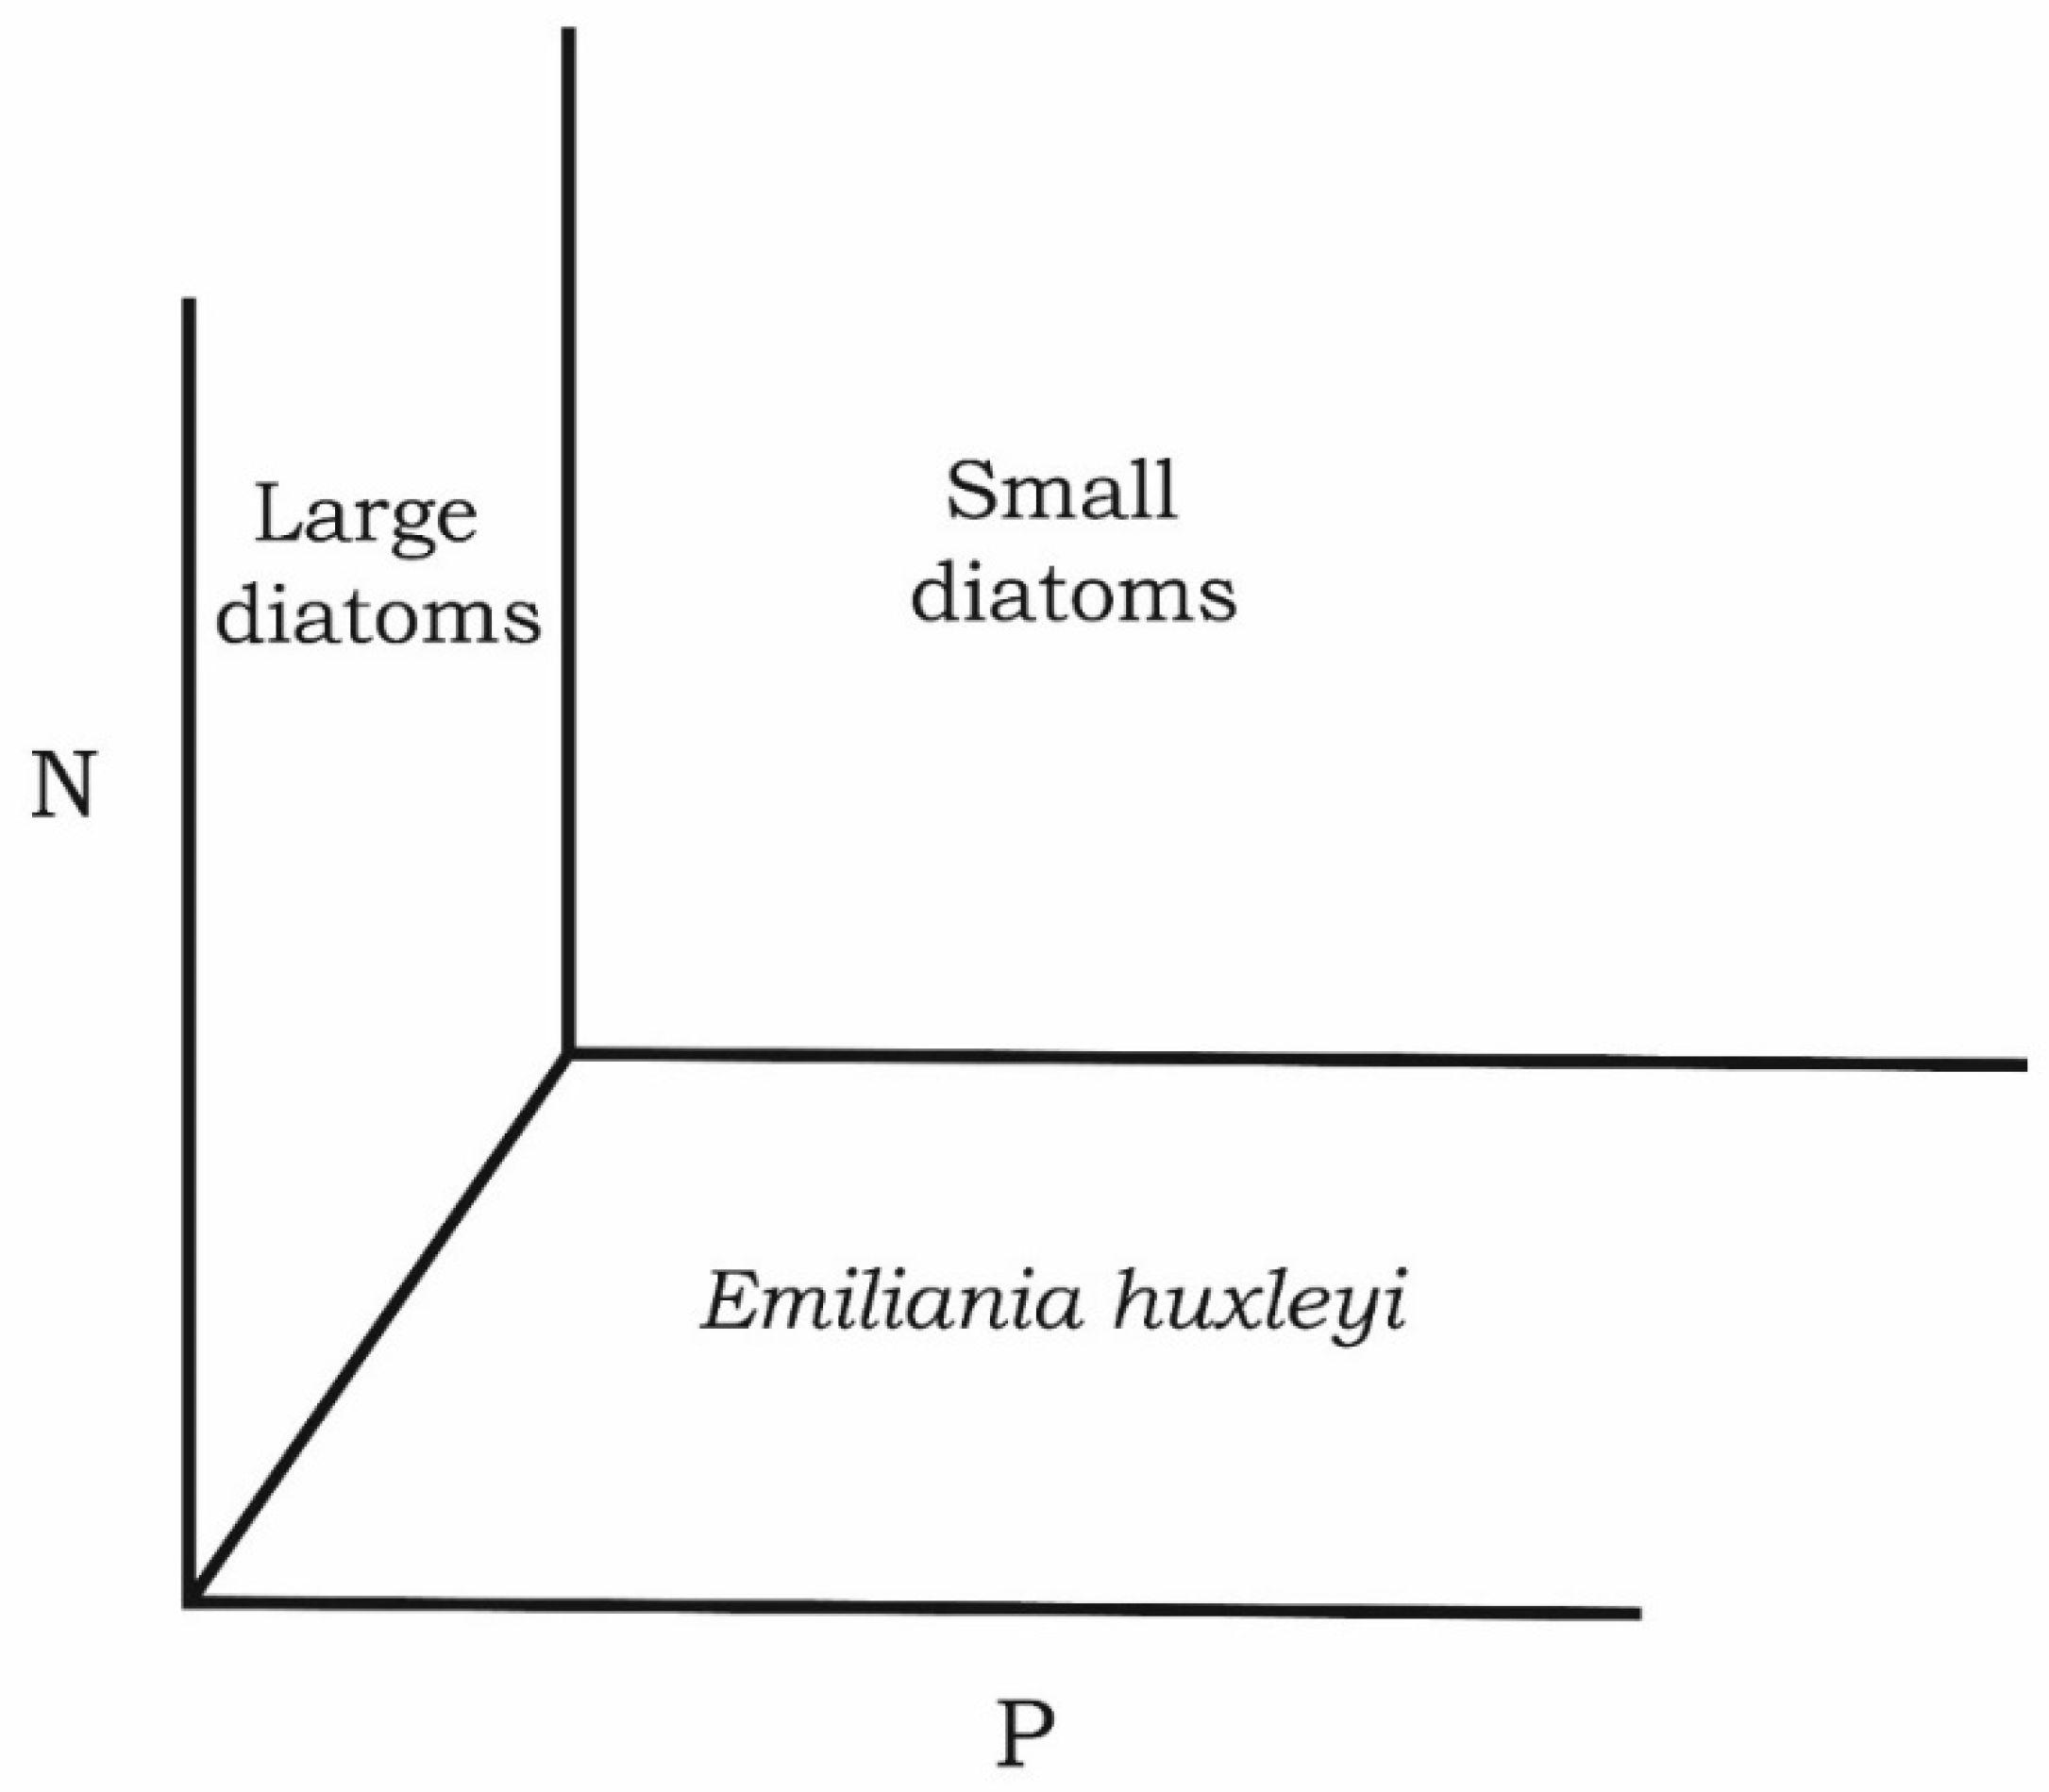
However, these schemes are of little use for our case since either nutrient are not separated in them and are considered as an integral variable, or diatoms are considered as a single taxonomic group, without dividing it into dimensional or taxonomic classes. Therefore, in our work, the effect of stoichiometry is reflected in the coordinates N and P. The obtained results allow us to create a unified picture of the influence of nitrogen and phosphorus concentrations and their ratios on the composition of phytoplankton (Figure 4). At low nitrogen concentrations and high phosphorus concentrations and correspondingly low N:P, and coccolithophores dominate in the community. The dominance passes to large diatoms at high concentrations of nitrogen and low phosphorus. With N:P close to the Redfield ratio and relatively high nitrogen and phosphorus concentrations, small diatoms win the competition. Our experimental studies show that almost always, with the simultaneous addition of nitrogen and phosphorus at their ratio close to the Redfield ratio, small diatoms dominate. It is either a pennate diatom Pseudo-nitzschia delicatissima, or a small centric Skeletonema costatum. Field data demonstrate the dominance of small diatoms during the spring phytoplankton bloom [68]. This event happens in late winter and early spring after the convective mixing stops.
The concentration of nitrogen and phosphorus is high, which allows them to grow at a rate close to the maximum. Under these conditions, species with high maximum specific growth rates benefit. In other words, a rapid growth strategy is implemented in this case [68]. The maximum specific growth rate is characteristic of small diatoms due to the high specific light absorption coefficients, which are several times higher than the same indicator for large diatoms [109]. Comparing the figure we obtained with Figure 1 in the article by Meunier et al. (2017), there is a significant difference. In the segment reflecting the ability of cells to P-affinity in Figure 5, there are large diatoms, while in the article by Meunier et al. (2017) [37], small cells. Our data demonstrate the high ability of large diatoms to grow at phosphorus concentrations close to analytical zero. In the middle part, we have small diatoms growing at an N:P ratio close to the Redfield ratio [68]; in the article by Meunier et al. (2017), large cells are located in this place. Finally, in our scheme, the species demonstrating high N-affinity is the coccolithophore Emiliania huxleyi, instead of N2- fixation species. Our scheme reflects the results obtained in the Black Sea.
This scheme explains why, with the dominance of coccolithophorids, large diatoms are almost absent. With the dominance of large diatoms, the contribution of coccolithophores to the total biomass is negligible. At the same time, species coexistence is possible from close niches. Namely, the coexistence of coccolithophorids and Pseudo-nitzschia delicatissima is possible. Furthermore, large diatoms can coexist with Pseudo-nitzschia delicatissima. These phenomena are shown using our field data.

Conclusion

Considering the results obtained from the point of view of ecological succession in the northeastern part of the Black Sea, it should be noted that it follows the scheme: small diatoms (spring) → coccolithophores (late spring, early summer) → large diatoms (summer). Furthermore, this scheme was also valid from 2002 – 2016 [68]; thus, there were no significant shifts.
Spring phytoplankton blooms occur both in coastal areas and in the open ocean, and they are caused by the intensive growth of small diatoms [106,110,111]. The primary mechanism triggering the spring phytoplankton bloom is based on the hypothesis of the critical depth of Sverdrup and in various modifications [79,112,113,114]. In other words, light plays the primary role here as an energy factor. Our research shows that the spring diatoms bloom is characterized by the corresponding biogeochemistry, i.e., the ratios of elements close to the Redfield ratio.
Coccolithophores bloom is a widespread phenomenon in the World Ocean (2002), and there are many different hypotheses explaining the mechanisms of bloom development [115] and the role of coccoliths in the prosperity of coccolithophores [89,116]. In this case, the chemistry of the carbonate system plays a unique role [117,118]. Our field and experimental studies show that biogeochemistry is crucial for coccolithophores blooms: they develop at low nitrogen concentrations and N:P below the Redfield ratio. The concentration of silicon does not play any role.
Large diatoms dominate in the community at low phosphorus concentrations and at N:P significantly higher than the Redfield ratio. At the same time, the bloom of large diatoms takes a long time, up to several months. Large diatoms are also successful competitors in the ocean, forming zones of intensive growth and flowering from subtropics to polar regions [117,118,119,120]. However, according to generally accepted concepts, the nutrient absorption half-saturation constant is determined by the ratio of the cell surface to volume [117,121], and consequently, large diatoms are poor competitors for nutrition. Our studies show that the large diatom Pseudosolenia calcar-avis successfully competes for phosphorus and can grow at concentrations close to zero.

Supplementary Materials

The following supporting information can be downloaded at the website of this paper posted on Preprints.org.

Author Contributions

V. Silkin conducted conceptualization and writing of the paper; L. Pautova provided the field data and writing of the paper; O. Podymov provided the hydrophysical data; V. Chasovnikov provided hydrochemical data; A. Lifanchuk conducted experimental studies; A. Fedorov conducted field studies.

Funding

Ministry of Science and Higher Education of the Russian Federation (theme № 0128-2021-0013) and Russian Science Foundation grant (project No. 22-17-00066);

Institutional Review Board Statement

Not applicable.

Informed Consent Statement

Not applicable.

Acknowledgments

We appreciate researchers and students who assisted with sampling data

Conflicts of Interest

The authors declare that they have no known competing financial interests or personal relationships that could have appeared to influence the work reported in this paper

References

  1. Field, C.B.; Behrenfeld, M.J.; Randerson, J.T.; Falkowski, P. Primary production of the biosphere: Inte-grating terrestrial and oceanic components. Science 1998, 281(5374), 237–240. [Google Scholar] [CrossRef] [PubMed]
  2. Volk, T.; Hoffert, M.I. Ocean carbon pumps: Analysis of relative strengths and efficiencies in ocean-driven atmospheric CO2 changes. In The Carbon Cycle and Atmospheric CO2 Natural Variations Archean to Present. In Geophysical Monograph Series, Sundquist, E.T., Broecker, W.S., Eds. American Geophysical Union, Washington, DC: 1985; 32, 99-110.
  3. Sarmiento, J.L.; Gruber, N. Ocean Biogeochemical Dynamics. Princeton University Press, Princeton, NJ: 2006; p. 526.
  4. Henson, S.A.; Sanders, R.; Madsen, E.; Morris, P.J.; Le Moigne, F.; Quartly, G.D. A reduced estimate of the strength of the ocean's biological carbon pump. Geophys. Res. Lett. 2011, 38. p. L04606. [CrossRef]
  5. Siegel, D.A.; Buesseler, K.O.; Doney, S.C.; Sailley, S.F.; Behrenfeld, M.J.; Boyd, P.W. Global assessment of ocean carbon export by combining satellite observations and food-web models. Global Biogeochemical Cycles. 2014, 28, 181–196. [Google Scholar] [CrossRef]
  6. Legendre, L.; Rivkin, R.B.; Weinbauer, M.G.; Guidi, L.; Uitz, J. The microbial carbon pump concept: Potential biogeochemical significance in the globally changing ocean. Prog. Oceanogr. 2015, 134, 432–450. [Google Scholar] [CrossRef]
  7. Cermeno, P.S.; Dutkiewicz, R.P.; Harris, M.; Follows, O.; Schofield and Falkowski, P.G. The role of nutricline depth in regulating the ocean carbon cycle. Proc. Natl. Acad. Sci. USA 2008, 105, 20344–20349. [Google Scholar] [CrossRef] [PubMed]
  8. Tréguer, P.; Bowler, C.; Moriceau, B.; et al. Influence of diatom diversity on the ocean biological carbon pump. Nat Geosci 2018, 11, 27–37. [Google Scholar] [CrossRef]
  9. Milliman, J.D. Production and accumulation of calcium carbonate in the ocean: budget of a non-steady state. Global Biogeochemical Cycles 1993, 7, 927–957. [Google Scholar] [CrossRef]
  10. Poulton, A.J.; Adey, T.R.; Balch, W.M.; Holligan, P.M. Relating coccolithophore calcification rates to phytoplankton community dynamics: Regional differences and implications for carbon export. Deep Sea Research Part II. 2007, 54, 538–557. [Google Scholar] [CrossRef]
  11. Tanioka T., Catherine, A.G.; Alyse A. L.; Nathan, S.G.; Adam, J.; Fagan, 1. & Adam, C.; Martiny. Global patterns and predictors of C:N:P in marine ecosystems. Communications Earth & Environment 2022, 3, 271. [CrossRef]
  12. Dutkiewicz, S.; et al. Capturing optically important constituents and properties in a marine biogeochemical and ecosystem model. Biogeosciences 2015, 12, 4447–4481. [Google Scholar] [CrossRef]
  13. DeVries, T.; Deutsch, C. Large-scale variations in the stoichiometry of marine organic matter respiration. Nat. Geosci. 2014, 7, 890–894. [Google Scholar] [CrossRef]
  14. Moreno, A.R.; Martiny, A.C. Ecological Stoichiometry of Ocean Plankton. Annual Review of Marine Science. 2018, 10, 43–69. [Google Scholar] [CrossRef] [PubMed]
  15. Lomas, M.W.; Steven, E.; Baer, C.M.; Kristina, X.T.; Debra, A.L.; Mark, A.A.; Adam, C.M. Varying influence of phytoplankton biodiversity and stoichiometric plasticity on bulk particulate stoichiometry across ocean basins. Commun. Earth Environ. 2021, 2, 143. [Google Scholar] [CrossRef]
  16. Inomura, K.; Deutsch, C.; Jahn, O.; Stephanie, D.; Michael, J.F. Global patterns in marine organic matter stoichiometry driven by phytoplankton ecophysiology. Nat. Geosci. 2022, 15, 1034–1040. [Google Scholar] [CrossRef] [PubMed]
  17. Elser, J.J.; Sterner, R.W.; Gorokhova, E.; Fagan, W.F.; Markow, T.A.; Cotner, J.B.; Harrison, J.F.; Hobbie, S.E.; Odell, G.M. and Weider, L.W. Biological stoichiometry from genes to ecosystems. Ecology Letters. 2000, 3, 540–550. [CrossRef]
  18. Sterner, R.W. and Elser, J.J. Ecological Stoichiometry: The Biology of Elements from Molecules to the Biosphere. Princeton: Princeton University Press, 2003. [CrossRef]
  19. Elser, J.J.; Acharya, K.; Kyle, M.; Cotner, J.; Makino, W.; Markow, T.; Watts, T.; Hobbie, S.; Fagan, W.; Schade, J.; Hood, J. and Sterner, R.W. Growth rate–stoichiometry couplings in diverse biota. Ecol. Lett. 2003, 6, 936–943. [CrossRef]
  20. Ågren, G.I. The C:N:P stoichiometry of autotrophs – theory and observations. Ecol. Lett. 2004, 7, 185–91. [Google Scholar] [CrossRef]
  21. Hessen, D.O.; Elser, J.J.; Sterner, R.W.; Urabe, J. Ecological stoichiometry: an elemental approach using basic principles. Limnol. Oceanogr. 2013, 58, 2219–2236. [Google Scholar] [CrossRef]
  22. Moody, E.K.; Rugenski, A.T.; Sabo, J.L.; Turner, B.L. and Elser, J.J. Does the Growth Rate Hypothesis Apply across Temperatures? Variation in the Growth Rate and Body Phosphorus of Neotropical Benthic Grazers. Front. Environ. Sci. 2017, 5, 14. [CrossRef]
  23. Hessen, D.O.; Hafslund, O.T.; Andersen, T.; Broch, C.; Shala, N.K. and Wojewodzic, M.W. Changes in Stoichiometry, Cellular RNA, and Alkaline Phosphatase Activity of Chlamydomonas in Response to Temperature and Nutrients. Front. Microbiol. 2017, 8, p 18. [CrossRef]
  24. Finkel, Z.V.; Beardall, J.; Flynn, K.J.; Quigg, A.; Rees, T.V. and Raven, J.A., Phytoplankton in a changing world: cell size and elemental stoichiometry. J. Plankton Res. 2010, 32, 119–137. [CrossRef]
  25. Finkel, Z.V.; Follows, M.J.; Liefer, J.D.; Brown, C.M.; Benner, I.; Irwin, A.J. (2016) Phylogenetic Diversity in the Macromolecular Composition of Microalgae. PLoS ONE 2016, 11, 5. [Google Scholar] [CrossRef] [PubMed]
  26. Falkowski, P.; Scholes, R.J.; Boyle, E.; Canadell, J.; Canfield, D.; Elser, J.; Gruber, N.; Hibbard, K.; Hogberg, P.; Linder, S.; Mackenzie, F.T.; Moore, B.; Pedersen, T.; Rosenthal, Y.; Seitzinger, S.; Smetacek, V.; Steffen, W. The global carbon cycle: a test of our knowledge of earth as a system. Science 2000, 290(5490), 291–296. [Google Scholar] [CrossRef] [PubMed]
  27. Geider, R. and La Roche, J. Redfield revisited: Variability of C:N:P in marine microalgae and its biochemical basis. European Journal of Phycology 2002, 37, 1–17. [CrossRef]
  28. Klausmeier, C.A.; Litchman, E.; Daufresne, T.; Levin, S.A. Optimal nitrogen-to-phosphorus stoichiometry of phytoplankton. Nature 2004, 429, 171–74. [Google Scholar] [CrossRef] [PubMed]
  29. Hillebrand, H.; Steinert, G.; Boersma, M.; Malzahn, A.; Meunier, C.; Plum, L.C.; Ptacnik, R. Goldman revisited: Faster-growing phytoplankton has lower N:P and lower stoichiometric flexibility. Limnol. Oceanogr. 2013, 58(6), 2076–2088. [Google Scholar] [CrossRef]
  30. Flynn, K.J.; Raven, J.A.; Rees, T.A.; Finkel, Z.; Quigg, A.; Beardall, J. Is the growth rate hypothesis applicable to microalgae? J. Phycol. 2010, 46, 1–12. [Google Scholar] [CrossRef]
  31. Cembella, A.D.; Antia, N.J.; Harrison, P.J. and Rhee, G-Y. The Utilization of Inorganic and Organic Phosphorous Compounds as Nutrients by Eukaryotic Microalgae: A Multidisciplinary Perspective: Part 2, Critical Reviews in Microbiology 1984, 11:1, 13-81. [CrossRef]
  32. Droop, M.R. Vitamin B12 and marine ecology. The kinetics of uptake, growth and inhibition of Monochrysis lutheri. J. Mar. Biol. Assoc. UK. 1968, 48, 689–733. [Google Scholar] [CrossRef]
  33. Droop, M.R. The nutrient status of algal cells in continuous culture. J. Mar. Biol. Assoc UK. 1974, 54, 825–855. [Google Scholar] [CrossRef]
  34. Smith, S.L.; Pahlow, M.; Merico, A. and Wirtz, K.W. Optimality-based mo deling of planktonic organisms. Limnol. Oceanogr. 2011, 56, 2080–2094. [CrossRef]
  35. Bonachela, J.A.; Allison, S.D.; Martiny, A.C.; Levin, S.A. A model for variable phytoplankton stoichiometry based on cell protein regulation. Biogeosciences Discuss. 2013, 10, 3241–3279. [Google Scholar] [CrossRef]
  36. Pahlow, M. and Oschlies, A. Optimal allocation backs droop s cell-quota model. Mar. Ecol. Prog. Ser. 2013, 473, 1–5. [Google Scholar] [CrossRef]
  37. Meunier, C.L.; Boersma, M.; El-Sabaawi, R.; Halvorson, H.M.; Herstoff, E.M.; Van de Waal, D.B.; Vogt, R.J. and Litchman, E. From Elements to Function: Toward Unifying Ecological Stoichiometry and Trait-Based Ecology. Front. Environ. Sci. 2017, 5, p 18. [CrossRef]
  38. Litchman, E. and Klausmeier, C.A. Trait-based community ecology of phytoplankton. Ann. Rev. Ecol. Evol. Syst. 2008, 39, 615–639. [CrossRef]
  39. Litchman, E.; Klausmeier, C.A.; Schofield, O.M. et al. The role of functional traits and trade-offs in structuring phytoplankton com munities: scaling from cellular to ecosystem level. Ecol. Lett. 2007, 10, 1170–1181. [Google Scholar] [CrossRef] [PubMed]
  40. Litchman, E.; Klausmeier, C.A.; Yoshiyama, K. Contrasting size evolution in marine and freshwater dia-toms. Proc. Nat. Acad. Sci. USA 2009, 106, 2665–2670 http://dx. [Google Scholar] [CrossRef] [PubMed]
  41. Verdy, A.; Follows, M.J. and Flierl, G. Optimal phytoplankton cell size in an allometric model. Mar. Ecol. Prog. Ser. 2009, 379, 1–12. [CrossRef]
  42. Mei, Z.-P.; Finkel, Z.V.; Irwin, A.J. Phytoplankton growth allometry and size dependent C:N stoichiometry revealed by a variable quota model. Mar. Ecol. Prog. Ser. 2011, 434, 29–43. [Google Scholar] [CrossRef]
  43. Kremer, C.T.; Williams, A.K.; Finiguerra, M.; Fong, A.A.; Kellerman, A.; Paver, S.F.; Tolar, B.B.; Toscano, B.J. Realizing the potential of trait-based aquatic ecology: new tools and collaborative approaches. Limnol. Oceanogr. 216, 62, 253-271. [CrossRef]
  44. Falkowski, P.G. Evolution of the nitrogen cycle and its influence on the biological sequestration of CO2 in the ocean. Nature 1997, 387, 272–275. [Google Scholar] [CrossRef]
  45. Redfield, A.C. The biological control of chemical factors in the environment. Am. Sci. 1958, 46, 205–221. [Google Scholar]
  46. Tilman, D. Resource competition between planktonic algae: an experimental and theoretical approach. Ecology 1977, 58, 338–348. [Google Scholar] [CrossRef]
  47. Tilman, D. Resource Competition and Community Structure. 1982. Princeton University Press 1982, p. 296.
  48. Klausmeier, C.A.; Litchman, E.; Daufresne, T.; Levin, S.A. Phytoplankton stoichiometry. Ecol. Res. 2008, 23, 479–485. [Google Scholar] [CrossRef]
  49. Sorokin, Yu.I. The Black Sea ecology and oceanography. Backhuys Publishers, Leiden, The Netherlands 2002, p. 875.
  50. Kostianoy, A.G.; Kosarev, A.N. The Black Sea Environment, Springer-Verlag Berlin Heidelberg, Hdb Env Chem 2008, 5, Part Q: XIV, p. 457.
  51. Konovalov, S.K. Konovalov, S.K. and Murray, J.W. Variations in the Chemistry of the Black Sea on a Time Scale of Decades (1960-1995). Journal of Marine Systems 2001, 31, 217–243. [Google Scholar] [CrossRef]
  52. Oguz, T.; Fach, B.; Salihoglu, B. Invasion dynamics of the alien ctenophore Mnemiopsis leidyi and its impact on anchovy collapse in the Black Sea. J. Plankton Res. 2008, 30, 1385–1397. [Google Scholar] [CrossRef]
  53. Oguz, T.; Velikova, V. Abrupt transition of the northwestern Black Sea shelf ecosystem from a eutrophic to an alternative pristine state. Mar. Ecol. Prog. Ser. 2010, 405, 231–242. [Google Scholar] [CrossRef]
  54. Pakhomova, S.; Vinogradova, E.; Yakushev, E.; Zatsepin, A.; Shtereva, G.; Chasovnikov, V. and Podymov, O. Interannual variability of the Black Sea Proper oxygen and nutrients regime: the role of climatic and anthropogenic forcing. Estuar. Coast. Shelf Sci. 2014, 140, 134–145. [Google Scholar] [CrossRef]
  55. Bodeanu, N.; Andrei, C.; Boicenco, L.; Popa, L.; Sburlea, A. A new trend of the phytoplankton structure and dynamics in the Romanian marine waters. Cercetari Marine 2004, 35, 77–86. [Google Scholar]
  56. Moncheva, S.; Petrova-Karadjova, V.; Palasov, A. Harmful algal blooms along the Bulgarian Black Sea coast and possible patterns of fish and zoobenthic mortalities. Harmful Marine Algal Blooms, Lavoisier Publ. Incorp, Paris 1995, 193-198.
  57. Moncheva, S.; Gotsis-Skretas, O.; Pagou, K.; Krastev, A. Phytoplankton Blooms in Black Sea and Medi-terranean Coastal Ecosystems Subjected to Anthropogenic Eutrophication: Similarities and Differences. Estuar. Coast. Shelf 2001, 53, 281–295. [Google Scholar] [CrossRef]
  58. Velikova, V.; Moncheva, S.; Petrova, D. Phytoplankton dynamics and Red Tides (1987–1997) in the Bulgarian Black Sea. Water Sci. Technol. 1999, 39(8), 27–36. [Google Scholar] [CrossRef]
  59. Kubryakov, A.A.; Stanichny, S.V.; Zatsepin, A.G. Interannual variability of Danube waters propagation in summer period of 1992–2015 and its influence on the Black Sea ecosystem. Journal of Marine Systems 2018, 179, 10–30. [Google Scholar] [CrossRef]
  60. Zatsepin, A.G.; Baranov, V.I.; Kondrashov, A.A.; Korzh, A.O.; Kremenetskiy, V.V.; Ostrovskii, A.G.; Soloviev, D.M. Submesoscale Eddies at the Caucasus Black Sea Shelf and the Mechanisms of Their Gen-eration. Oceanology 2011, 51(4), 554–567. [Google Scholar] [CrossRef]
  61. Kubryakov, A.I.; Korotaev, G.K.; Dorofeev, V.L.; Ratner, Y.B.; Palazov, A.; Valchev, N.; Malciu, V.; Matescu, R. and Oguz, T. Black Sea coastal forecasting system. Ocean. Sci. 2012, 8, 183–196 http://dx. [Google Scholar] [CrossRef]
  62. Konovalov, S.K.; Murray, J.W.; Murray, Luther G.W. Basic Processes of Black Sea Biogeochemistry. Oceanography 2005, 18(2), 24–35. [CrossRef]
  63. Kubryakova, E.A.; Kubryakov, A.A.; Stanichny, S.V. Impact of Winter Cooling on Water Vertical Entrainment and Intensity of Phytoplankton Bloom in the Black Sea. Physical Oceanography 2018, 25(3), 191–206. [Google Scholar] [CrossRef]
  64. Kubryakov, A.A.; Belokopytov, V.N.; Zatsepin, A.G.; Stanichny, S.V. and Piotukh, V.B. The Black Sea Mixed Layer Depth Variability and Its Relation to the Basin Dynamics and Atmospheric Forcing. Physical Oceanography 2019, 26(5), 397–413. [CrossRef]
  65. Pautova, L.A.; Mikaelyan, A.S.; Silkin, V.A. The structure of plankton community in shelf waters of north-eastern part of the Black Sea in the period of mass bloom of Emiliania huxleyi in 2002-2005. Oceanology 2007, 47, 408–417. [Google Scholar] [CrossRef]
  66. Mikaelyan, A.S.; Silkin, V.A.; Pautova, L.A. Coccolithophorids in the Black Sea: interannual and long-term changes. Oceanology 2011, 51, 45–53. [Google Scholar] [CrossRef]
  67. Silkin, V.A.; Pautova, L.A.; Pakhomova, S.V.; Lifanchuk, A.V.; Yakushev, E.V. and Chasovnikov, V.K. Environmental control on phytoplankton community structure in the NE Black Sea. J. Exp. Mar. Biol. Ecol. 2014, 461, 267–274. [Google Scholar] [CrossRef]
  68. Silkin, V.A.; Pautova, L.A.; Giordano, M.; Chasovnikov, V.K.; Vostokov, S.V.; Podymov, O.I.; Pakhomova, S.V.; Moskalenko, L.V. Drivers of phytoplankton blooms in the northeastern Black Sea. Mar. Poll. Bull. 2019, 138, 274–284. [Google Scholar] [CrossRef]
  69. Cokacar, T.; Kubilay, N.; Oguz, T. Structure of Emiliania huxleyi blooms in the Black Sea surface waters as detected by SeaWIFS imagery. Geophysical Research Letters 2001, 28, 4607–4610. [Google Scholar] [CrossRef]
  70. Kopelevich, O.; Burenkov, V.; Sheberstov, S.; Vazyulya, S.; Kravchishina, M.; Pautova, L.; Silkin, V.; Ar-temiev, V.; Grigoriev, A. Satellite monitoring of coccolithophore blooms in the Black Sea from ocean col-or data. Remote Sensing of Environment 2014, 146, 113–123. [Google Scholar] [CrossRef]
  71. Bordovskiy, O.K.; Chernyakova, A.M. Modern Methods of the Ocean Hydrochemical Investigations; P.P. Shirshov Institute of Oceanology 1992, 200 p. (In Russian).
  72. Grashoff, K.; Kremling, K.; Ehrhard, M. Methods of Seawater Analysis; Wiley-VCH: Weinheim, Germany; New York, NY, USA; Chichester, UK; Brisbane, Australia; Singapore; Toronto, ON, Canada 1999; 420 p.
  73. Tomas, C.R. (Ed.). Identifying Marine Phytoplankton; Academic Press: San Diego, CA, USA 1997, 858 p. ISBN 0-12-693018-X.
  74. Throndsen, J.; Hasle, G.R.; Tangen, K. Norsk Kystplanktonflora; Almater: Oslo, Norway 2003, 341 p.
  75. Hillebrand, H.; Durselen, C.; Kirschtel, D.; Pollingher, U.; Zohary, T. Biovolume calculation for pelagic and benthic microalgae. J. Phycol. 1999, 35, 403–424. [Google Scholar] [CrossRef]
  76. Menden-Deuer, S.; Lessard, E.J. Carbon to volume relationship for dinoflagellates, diatom, and other protist plahkton. Limnol. Oceanogr. 2000, 45, 569–579. [Google Scholar] [CrossRef]
  77. Maksimov, V.N. Mnogofactornyi experiment v boilogii (Multyfactorial experiment in biology). Moscow, Nauka 1980, 164-190. (In Russian).
  78. Barton, A.D.; Lozier, M.S.; Williams, R.G. 11. Physical controls of variability in North Atlantic phyto-plankton communities. Limnol. Oceanogr. 2014, 60, 181–197. [Google Scholar] [CrossRef]
  79. Lindemann, C.; John, M.A.St. A seasonal diary of phytoplankton in the North Atlantic. Front. Mar. Sci. 1, A37. [CrossRef]
  80. Krivosheya, V.G.; Moskalenko, L.V.; Melnikov, V.A.; Skirta, A.Yu. Effects of the Wind and Thermal Conditions Variability on the Structure and Dynamics of the Seawater in the Northeastern Black Sea. Oceanology 2012, 52, 453–466. [Google Scholar] [CrossRef]
  81. Arkhipkin, V.S.; Gippius, F.N.; Koltermann, K.P.; Surkova, G.V. Wind waves in the Black Sea: results of a hind cast study. Nat. Hazards Earth Syst. Sci. 2014, 14, 2883–2897. [Google Scholar] [CrossRef]
  82. Kubryakov, A.A.; Stanichny, S.V.; Zatsepin, A.G.; Kremenetskiy, V.V. Long-Term Variations of the Black Sea Dynamics and Their Impact on the Marine Ecosystem. Journal of Marine Systems, 2016, 163, 80–94. [Google Scholar] [CrossRef]
  83. Bach, L.T.; Ulf, R.; Magdalena, A.G.; Luisa, F.; Schulz, K.G. A unifying concept of coccolithophore sensitivity to changing carbonate chemistry embedded in an ecological framework. Progress in Oceanography 2015, 135, 125–138. [Google Scholar] [CrossRef]
  84. Iglesias-Rodrigez, M.D.; Brown, C.W.; Doney, S.C.; Kleypas, J.; Kolber, D.; Kolber, Z.; Hayes, P.K. and Falkowski, P.G. Representing key phytoplankton functional groups in ocean cycle models: Coccolithophorids. Global. Biogem. Cy. 2002, 16, 1–20. [Google Scholar] [CrossRef]
  85. Fielding, S.R. Emiliania huxleyi specific growth rate dependence on temperature. Limnol. Oceanogr. 2013, 58(2), 663–666. [Google Scholar] [CrossRef]
  86. Zhang, Y.; Klapper, R.; Lohbeck, K.T.; Bach, L.T.; Schulz, K.G.; Thorsten, B.H. Reusch and Ulf, R. Between- and within-population variations in thermal reaction norms of the coccolithophore Emiliania huxleyi. Limnol. Oceanogr. 2014, 59(5), 1570-1580. [CrossRef]
  87. Mikaelyan, A.S.; Pautova, L.A.; Chasovnikov, V.K.; Mosharov, S.A.; Silkin, V.A. Alternation of diatoms and coccolithophores in the northeastern Black Sea: a response to nutrient changes. Hydrobiologia 2015, 755, 89–105. [Google Scholar] [CrossRef]
  88. Kubryakov, A.A.; Mikaelyan, A.S.; Stanichny, S.V. Extremely strong coccolithophore blooms in the Black Sea: the decisive role of winter vertical entrainment of deep water. Deep Sea Research Part I Oceanographic Research Papers 2021, 173(4), 103554. [Google Scholar] [CrossRef]
  89. Iglesias-Rodrigez, M.D.; Brown, C.W.; Doney, S.C.; Kleypas, J.; Kolber, D.; Kolber, Z.; Hayes, P.K. and Falkowski, P.G. Representing key phytoplankton functional groups in ocean cycle models: Coccolithophorids. Global. Biogem. Cy. 2002, 16, 1–20. [Google Scholar] [CrossRef]
  90. Paasche, E. A review of the coccolithophorid Emiliania huxleyi (Prymnesiophyceae), with particular reference to growth, coccolith formation, and calcification-photosynthesis interactions. Phycologia 2002, 40, 503–529. [Google Scholar] [CrossRef]
  91. Eppley, R.W.; Rogers, J.N.; McCarthy, J.J. Half saturation constants for uptake of nitrate and ammonium by marine phytoplankton. Limnology and Oceanography 1968, 14, 912–920. [Google Scholar] [CrossRef]
  92. Sunda, W.G. and Hardison, R.D. Ammonium uptake and growth limitation in marine phytoplankton. Limnol. Oceanogr. 2007, 52(6), 2496–2506. [CrossRef]
  93. Silkin, V.A. and Khailov, K.M. Bioecological Mechanisms of Aquaculture Management. Leningrad, Nauka, 1988, p. 230. (In Russian).
  94. Lessard, E.J.; Merico, A.; Tyrell, T. Nitrate:phosphate ratios and Emiliania huxleyi blooms. Limnol. Oceanogr. 2005, 50, 1020–1024. [Google Scholar] [CrossRef]
  95. Loebl, M.; Cockshutt, A.M.; Campbell, D.A. and Finkel Z.V. Physiological basis for high resistance to photoinhibition under nitrogen depletion in Emiliania huxleyi. Limnol. Oceanogr. 2010, 55(5), 2150–2160. [CrossRef]
  96. Paasche, E. Roles of nitrogen and phosphorus in coccolith formation in Emiliania huxleyi (Prymnesiophyceae). Eur. J. Phycol. 1998, 33, 33–42. [Google Scholar] [CrossRef]
  97. Shiraiwa, Y. Physiological regulation of carbon fixation in the photosynthesis and calcification of coccolithophorids. Comparative Biochemistry and Physiology 2003, 136, 775–783. [Google Scholar] [CrossRef]
  98. Oviedo, A.M.; Langer, G.; Ziver, P. Effect of phosphorus limitation on coccolith morphology and element ratios in Mediterranean strains of the coccolithophore Emiliania huxleyi. Journal of Experimental Marine Biology and Ecology 2014, 459, 105–113. [Google Scholar] [CrossRef]
  99. Smetacek, V. Diatoms and the ocean carbon cycle. Protist 1999, 150, 25–32. [Google Scholar] [CrossRef] [PubMed]
  100. Malviya, S.; Scalco, E.; Audic, S.; Vincent, F.; Veluchamy, A.; Poulain, J.; Wincker, P.; Iudicone, D.; Colomban de Vargas; Bittner, L.; Zingone, A. and Bowler, S. Insights into global diatom distribution and diversity in the world’s ocean. PNAS 2016, 113(11), E1516-E1525. [CrossRef]
  101. Rhee, G.-Y. Effects of N:P atomic ratios and nitrate limitation on algal growth, cell composition, and nitrate uptake. Limnol. Oceanogr. 1978, 23, 10–25. [Google Scholar] [CrossRef]
  102. Goldman, J.C.; Mccarthy, J.J.; Peavey, D.G. Growth rate influence on the chemical composition of phytoplankton in oceanic waters. Nature 1979, 279, 210–215. [Google Scholar] [CrossRef]
  103. Raven, J.A. The role of vacuoles. New Phytol. 1987, 106, 357–422. [Google Scholar] [CrossRef]
  104. Margalef, R. Life forms of phytoplankton as survival alternatives in an unstable environment. Oceanol. Acta 1978, 1, 493–509. [Google Scholar]
  105. Villamaña, M.; Marañón, E.; Cermeño, P.; Estrada, M.; Fernández-Castro, B.; Figueiras, F.G.; Latasa, M.; Luis Otero-Ferrer, J.; Reguera, B. and Mouriño-Carballido, B. The role of mixing in controlling resource availability and phytoplankton community composition. Progress in Oceanography 2019, 178, 102181 https:// doiorg/101016/jpocean2019102181.
  106. Smayda, T.J. Ecological features of harmful algal blooms in coastal upwelling ecosystems. South African Journal of Marine Science 2000, 22(1), 219–253. [Google Scholar] [CrossRef]
  107. Smayda, T.J.; Reynolds, C.S. Community assembly in marine phytoplankton: Application of recent models to harmful dinoflagellate blooms. J. Plankton Res. 2001, 23, 447–461. [Google Scholar] [CrossRef]
  108. Glibert, P.M. Margalef revisited: A new phytoplankton mandala incorporating twelve dimensions, including nutritional physiology. Harmful Algae 2016, 55, 25–30. [Google Scholar] [CrossRef]
  109. Silkin, V.; Fedorov, A.; Flynn, K.J.; Paramonov, L.; Pautova, L. Protoplasmic streaming of chloroplasts enables rapid photoacclimation in large diatoms. J. Plankton Res. 2021, 43, 831–845. [Google Scholar] [CrossRef]
  110. Siegel, D.A.; Doney, S.C.; Yoder, J.A. The North Atlantic spring phytoplankton bloom and Sverdrup’s critical depth hypothesis. Science 2002, 296, 730–733. [Google Scholar] [CrossRef] [PubMed]
  111. Sommer, U.; Adrian, R.; De Senerpont, D.L.; Elser, J.J.; Gaedke, U.; Ibelings, B.; Jeppesen, E.; Lürling, M.; Molinero, C.J.; Mooij, W.M.; van Donk, E.; Winder, M. The Plankton Ecology Group (PEG) Model: mechanisms driving plankton succession. Annu. Rev. Ecol. Evol. Syst. 2012, 43, 429–448. [Google Scholar] [CrossRef]
  112. Sverdrup, H.U. On conditions for the vernal blooming of phytoplankton. J. Cons. Int. Explor. Mer. 1953, 18, 287–295. [Google Scholar] [CrossRef]
  113. Behrenfeld, M.J.; Boss, E.S. Resurrecting the Ecological Underpinnings of Ocean Plankton Blooms. Annu. Rev. Marine. Sci. 2014, 6, 167–194. [Google Scholar] [CrossRef] [PubMed]
  114. Mikaelyan, A.S.; Chasovnikov, V.K.; Kubryakov, A.A.; Stanichny, S.V. Phenology and drivers of the win-ter-spring phytoplankton bloom in the open Black Sea: the application of Sverdrup's hypothesis and its re-finements. Prog. Oceanogr. 2017, 151, 163–176. [Google Scholar] [CrossRef]
  115. yrrell, T.; Merico, M. Emiliania huxleyi: bloom observations and the conditions that induce them. In Coccolithophores from Molecular Processes to Global Impact, Thierstein, H.R., Young, J.R., Eds. Springer, Berlin, Heidelberg 2004, 75-97.
  116. Raven, J.; Crawfurd, K. Environmental controls on coccolithophore calcification. Mar. Ecol. Prog. Ser. 2012, 470, 137–166. [Google Scholar] [CrossRef]
  117. Goldman, J.C. Potential role of large oceanic diatoms in new primary production. Deep-Sea Res. 1993, 40, 159–168. [Google Scholar] [CrossRef]
  118. Kemp, A.; Pearce, R.B.; Grigorov, I.; Rance, J.; Lange, C.B.; Quilty, P. and Salteet, I. Production of giant marine diatoms and their export at oceanic frontal zones: Implications for Si and C flux from stratified oceans. Global Biogeochem Cycles 2006, 20, 1–3. [Google Scholar] [CrossRef]
  119. Villareal, T.A.; Brown, C.G.; Brzezinski, M.A.; Krause, J.W. and Wilson, C. Summer diatom blooms in the north Pacific subtropical gyre: 2008–2009. PLoS ONE 2012, 7, e33109. [CrossRef]
  120. Pautova, L.; Silkin, V.; Kravchishina, M.; Klyuvitkin, A.; Kudryavsteva, E.; Glukhovets, D.; Chultsova, A.; Politova, N. Phytoplankton of The High-Latitude Arctic: Intensive Growth Large Diatoms Porosira Glacialis in The Nansen Basin. J. Mar. Sci. Eng. 2022, 10, x. [Google Scholar] [CrossRef]
  121. Edwards, K.F.; Thomas, M.K.; Christopher, A.; Klausmeier, A.C. and Litchman, E. Allometric scaling and taxonomic variation in nutrient utilization traits and maximum growth rate of phytoplankton. Limnol. Oceanogr. 2012, 57, 554–566. [Google Scholar] [CrossRef]
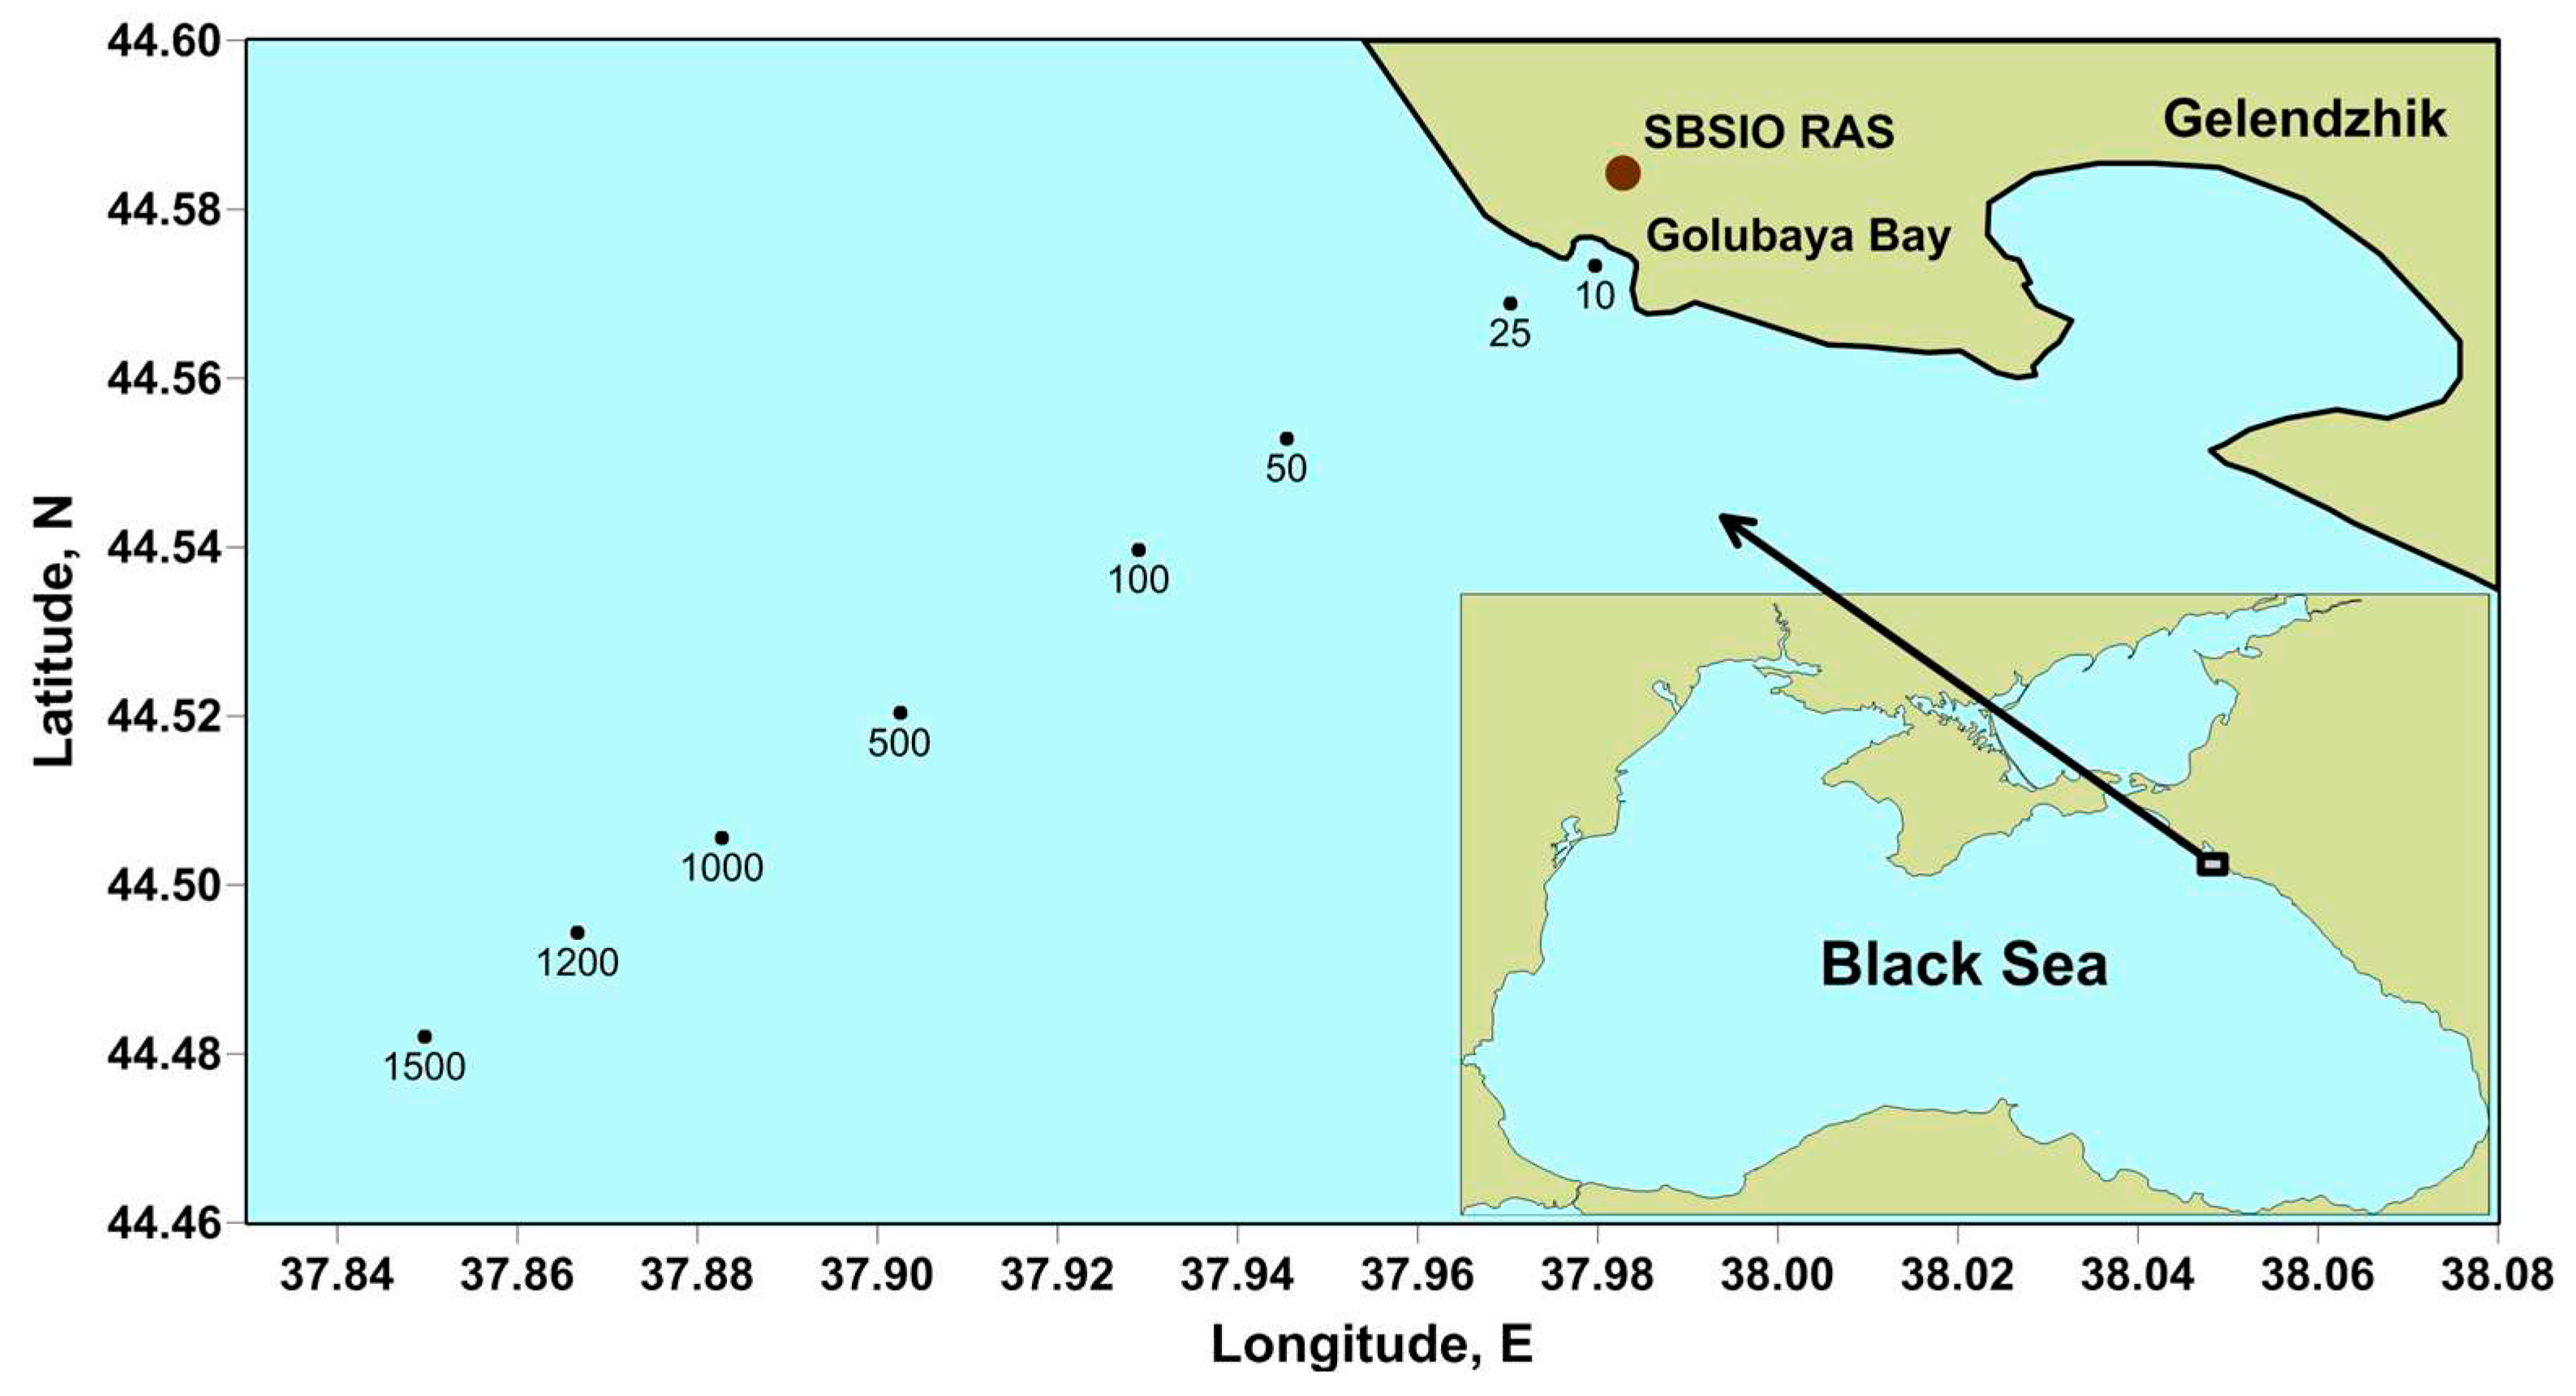
Figure 1. Map of sampling stations in the northeastern part of the Black Sea 2017-2021.
Preprints 72929 g001
Figure 2. Vertical distribution of biomass concentration of Emiliania huxleyi at the beginning of June 2017 and Pseudosolenia calcar-avis in August 2017.
Preprints 72929 g002
Figure 3. Dynamics of maximum values of Emiliania huxleyi abundance at research stations in 2017-2021.
Preprints 72929 g003
Figure 4. Dependence of Pseudo-nitzschia delicatissima biomass on nitrogen concentration on 7.06.2018.
Preprints 72929 g004
Figure 5. Conceptual diagram showing the position of small and large diatoms, as well as coccolithophores in the coordinates of nitrogen and phosphorus concentrations.
Preprints 72929 g005
Table 1. Maximum biomass of large diatoms, their contribution to the total phytoplankton biomass, and dominant species in the summer of 2017-2021.
Date Max
biomass
% of total
biomass
Dominant
species
07.2017 1609.75 98.9 Pseudosolenia calcar-avis
07.2018 1121.0 91.0 Pseudosolenia calcar-avis
07.2019 214.0 67.3 Pseudosolenia calcar-avis
07.2020 4300,9 98.5 Pseudosolenia calcar-avis+ Proboscia alata
08.2021 3914.0 95.3 Pseudosolenia calcar-avis + Proboscia alata
Table 2. Biomass of large diatoms in summer 2017, 2020, and 2021.
Species 17.08.2017 22.07.2020 31.07.2020 16.08.2020 26.08.2020 17.08.2021
Proboscia alata 0 112.9 902.6 557.6 5.4 1298.5
Pseudosolenia calcar-avis 1430.4 3496.2 556.7 124.0 356.8 2058.4
Dactyliosolen fragilissimus 0 0 0 0 0 500
Pseudo-nitzschia delicatissima 13.6 0 0 0 0 0
Table 4. Average concentrations of nitrogen, phosphorus, and silicon and their ratios during coccolithophorid Emiliania huxleyi and large diatom Pseudosolenia calcar-avis bloom.
N P Si. N:P Si:N Si:P
E. h. P. c-a E. h. P. c-a E. h. P. c-a E. h. P. c-a E. h. P. c-a E. h. P. c-a
44 86 44 86 44 86 44 86 44 86 44 86
0,77 1.04 0.10 0.04 5.54 2.19 12.63 60.29 8,74 4,35 99.4 87.0
p = 0.04 p = 1.7·10-8 p = 6.25·10-13 p = 0.0003 p = 0.003 p = 0.51
Table 5. Regression equations showing the effect of nitrogen and phosphorus additives on the biomass of phytoplankton species in the stationary phase of the accumulative culture.
Date
(day, month)
Species Regression equations
Mg m-3
Confi-dence interval
2019
21.05. Emiliania huxleyi 7111.9+5083.5 N +5291.8 P +5166.1 NP 551.0
21.05. Pseudo-nitzschia delicatissima 2205.0+1991.2 N +1382.4 P +1340.7 NP 419.4
21.05. Dactyliosolen fragilissimus 1613.7+310.4 N -294.3 P -133.6 NP 479.8
2020
11.06. Emiliania huxleyi 494.6-49.3 N +327.6 P -51.1 NP 78.6
11.06. Cerataulina pelagica 3378.5+2353.5 N +1797.1 P +1055.0 NP 1783.2
11.06. Leptocylindrus danicus 5599.2+4267.9 N +4081.3 P +3779.9 NP 903.7
2021
11.06. Proboscia alata 2854.0+780.3 N - 480.9 P -732.2 NP 788.8
Disclaimer/Publisher’s Note: The statements, opinions and data contained in all publications are solely those of the individual author(s) and contributor(s) and not of MDPI and/or the editor(s). MDPI and/or the editor(s) disclaim responsibility for any injury to people or property resulting from any ideas, methods, instructions or products referred to in the content.
Copyright: This open access article is published under a Creative Commons CC BY 4.0 license, which permit the free download, distribution, and reuse, provided that the author and preprint are cited in any reuse.
Prerpints.org logo

Preprints.org is a free preprint server supported by MDPI in Basel, Switzerland.

Subscribe

© 2024 MDPI (Basel, Switzerland) unless otherwise stated