Submitted:
05 May 2023
Posted:
08 May 2023
You are already at the latest version
Abstract
Keywords:
1. Introduction
2. Materials and Methods
2.1. Data Collection
2.2. Data Processing and Analysis
 ,
,
 [51],
[51],
 ,
,
3. Results
3.1. Annual Solar Energy Potential


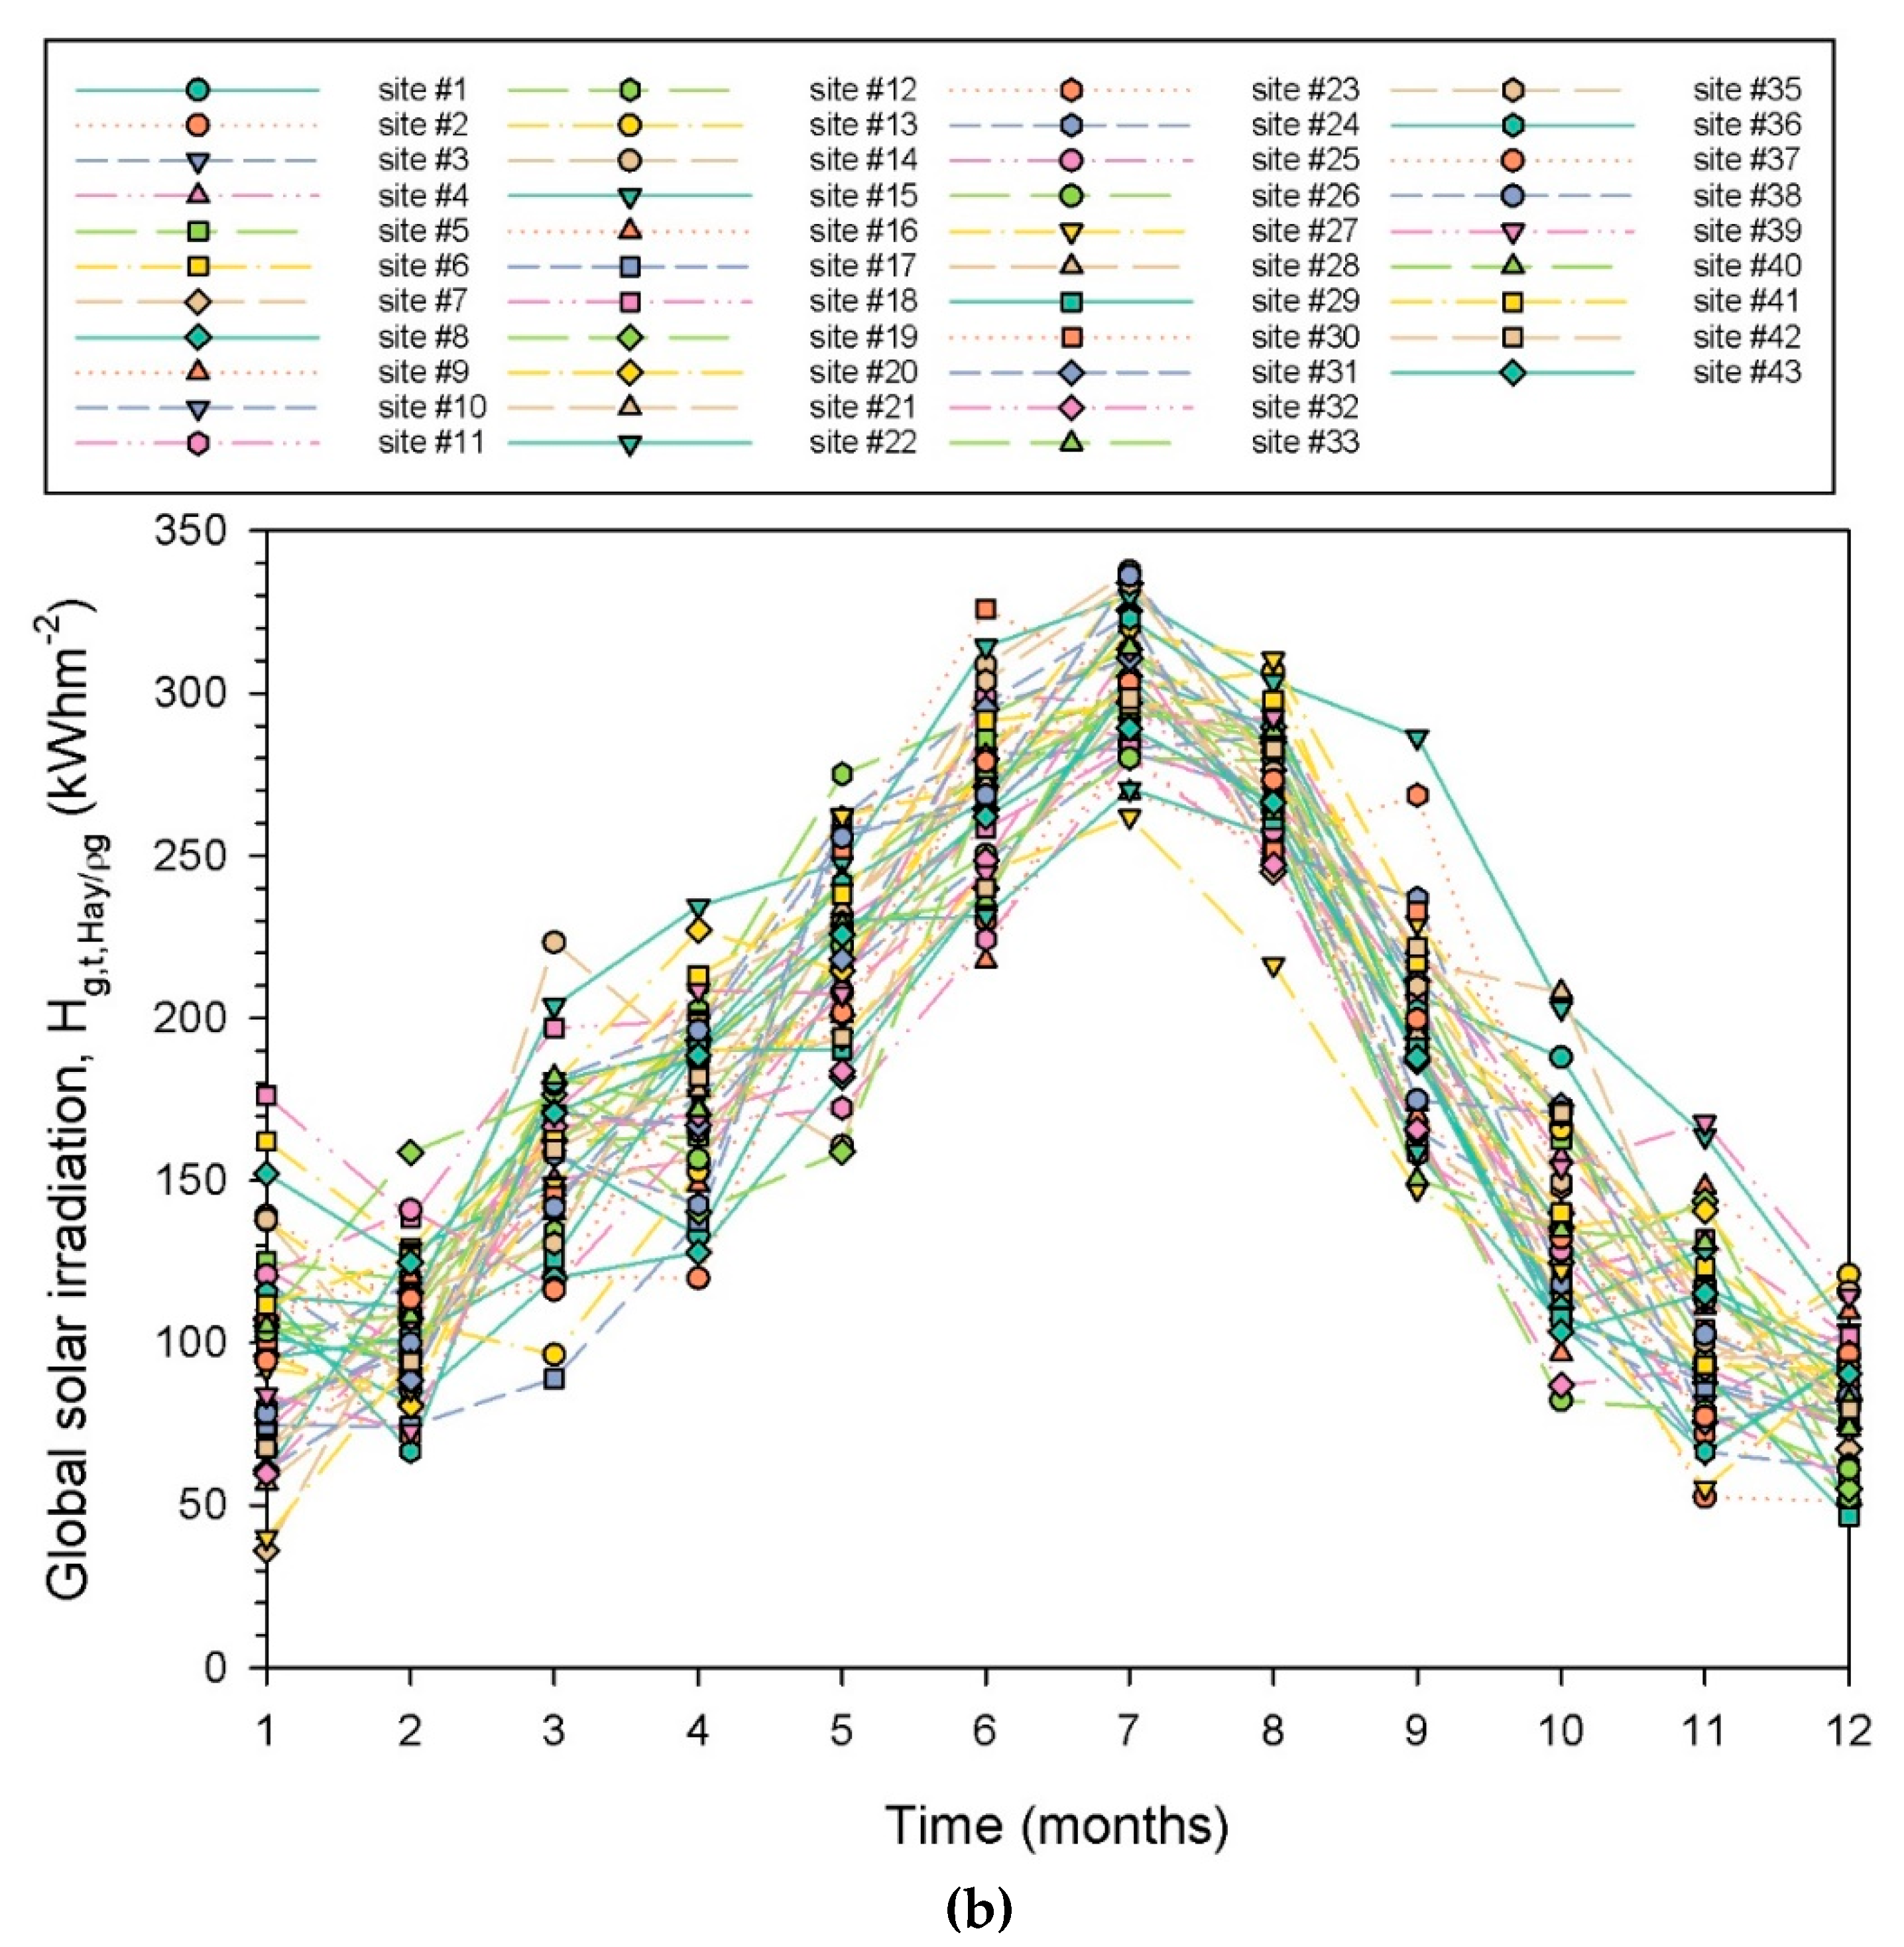
3.2. Monthly Solar Energy Potential
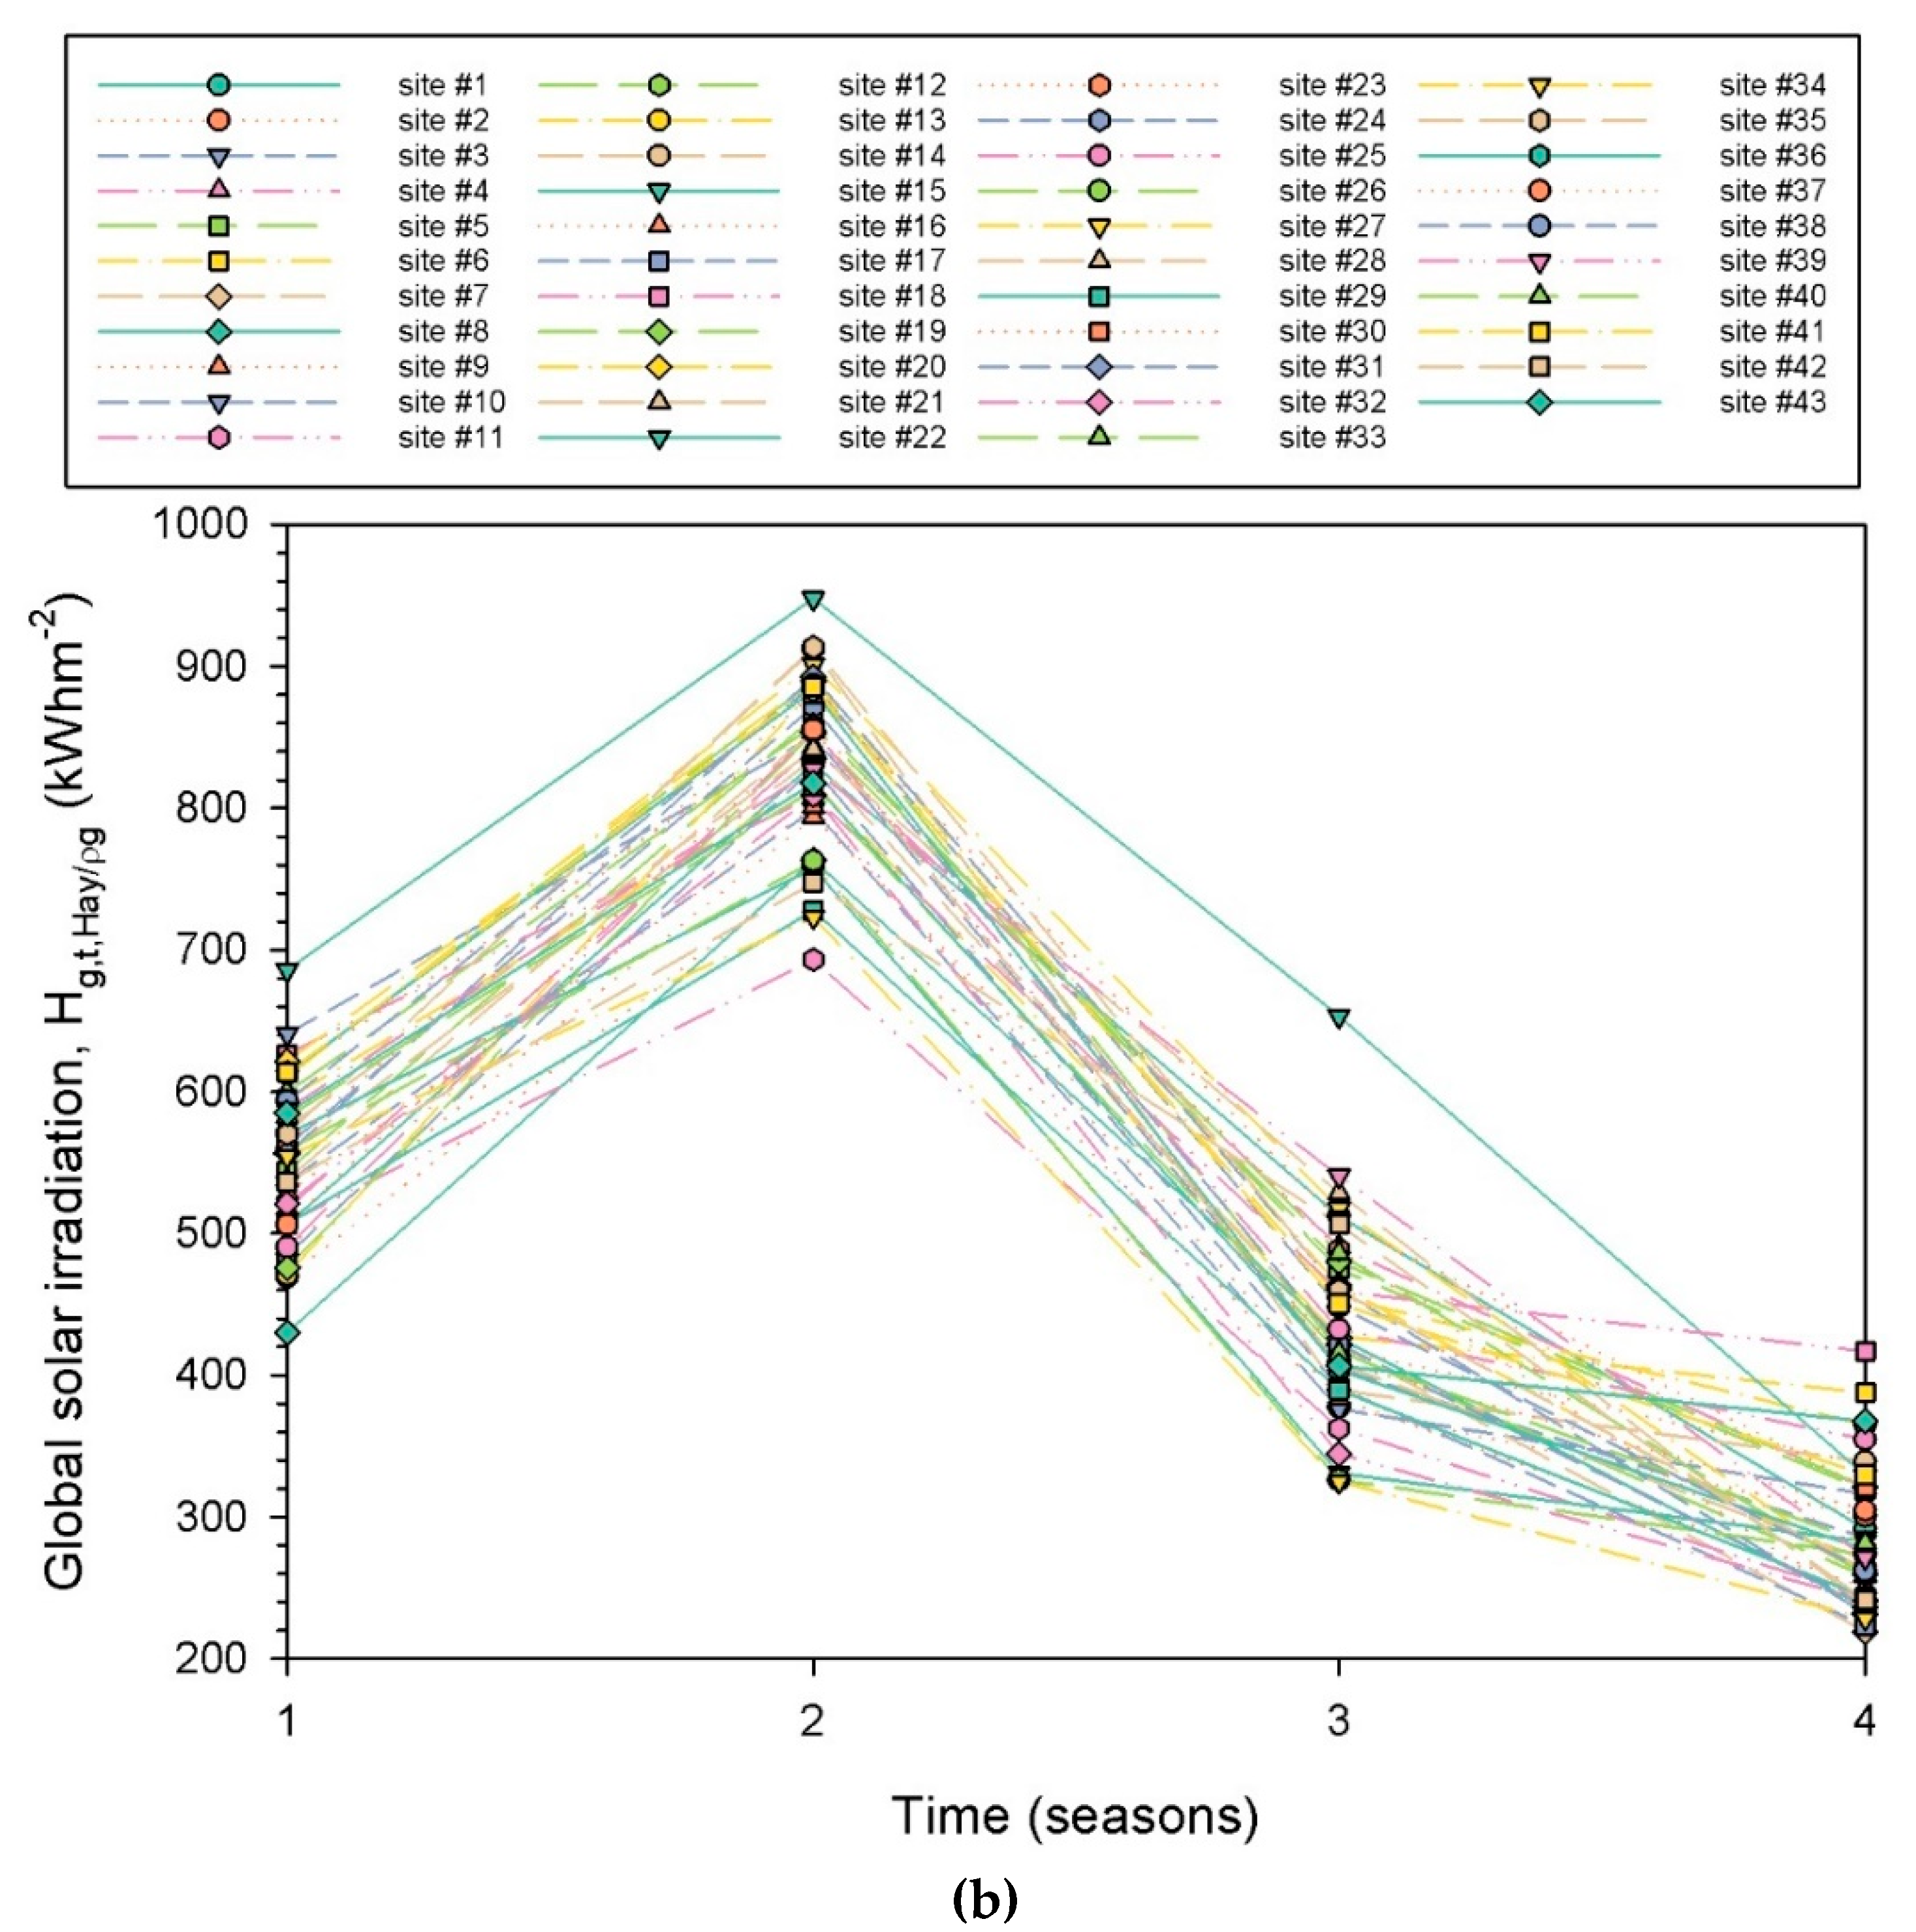
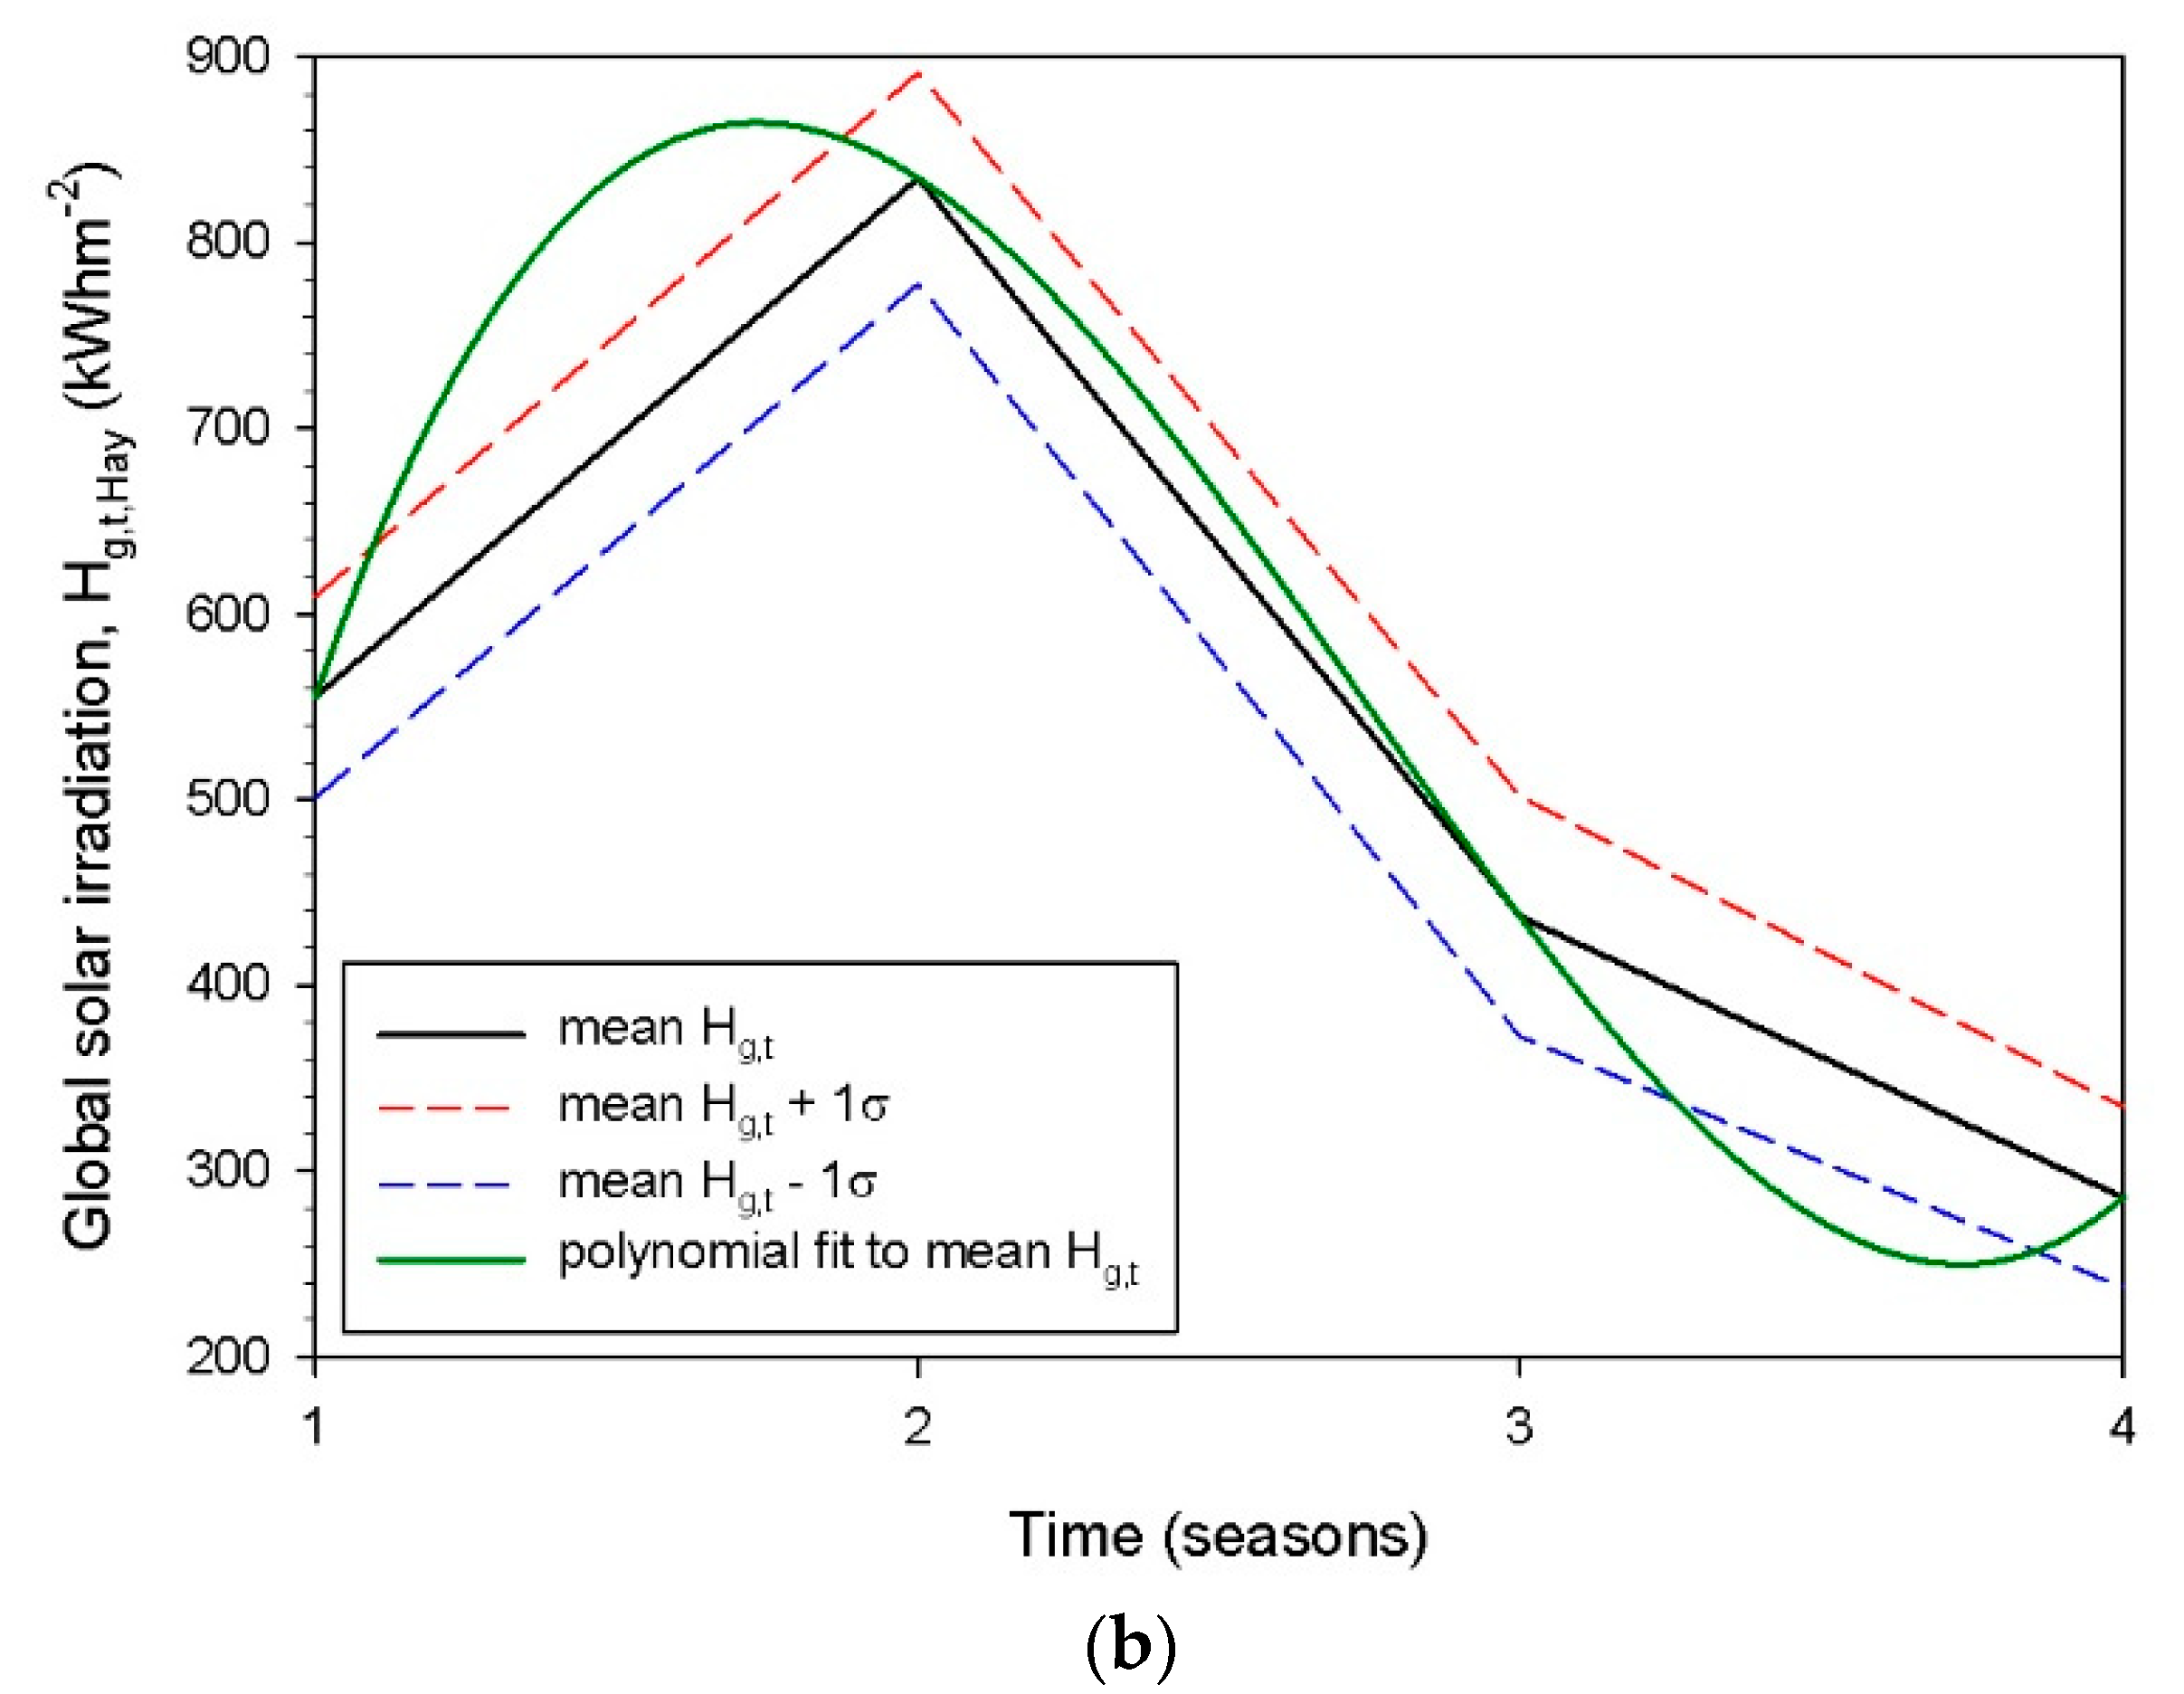
3.3. Seasonal Solar Energy Potential
3.4. Maps of Annual Solar Energy Potential
3.5. Specialised Analysis
- (i)
- Various researchers [33,34,59,60,61] have shown that the PV-GIS tool simulates values for solar horizontal radiation with an accuracy between ‒14% to +11%, i.e., a median value of ‒1.5% very comparable to the ±3% accuracy of most pyranometers. That was done by comparing PV-GIS-simulated solar radiation values with real measurements. Therefore, no new evaluation is needed here for the PV-GIS tool. As far as the inter-dependence of the Hg,t,Hay/ρg and Hg,t,L-J/ρg estimated values is concerned, this is shown in Figure 11a for all- and Figure 11b for clear-sky conditions. In both cases, the inter-dependence is linear, as anticipated.
- (ii)
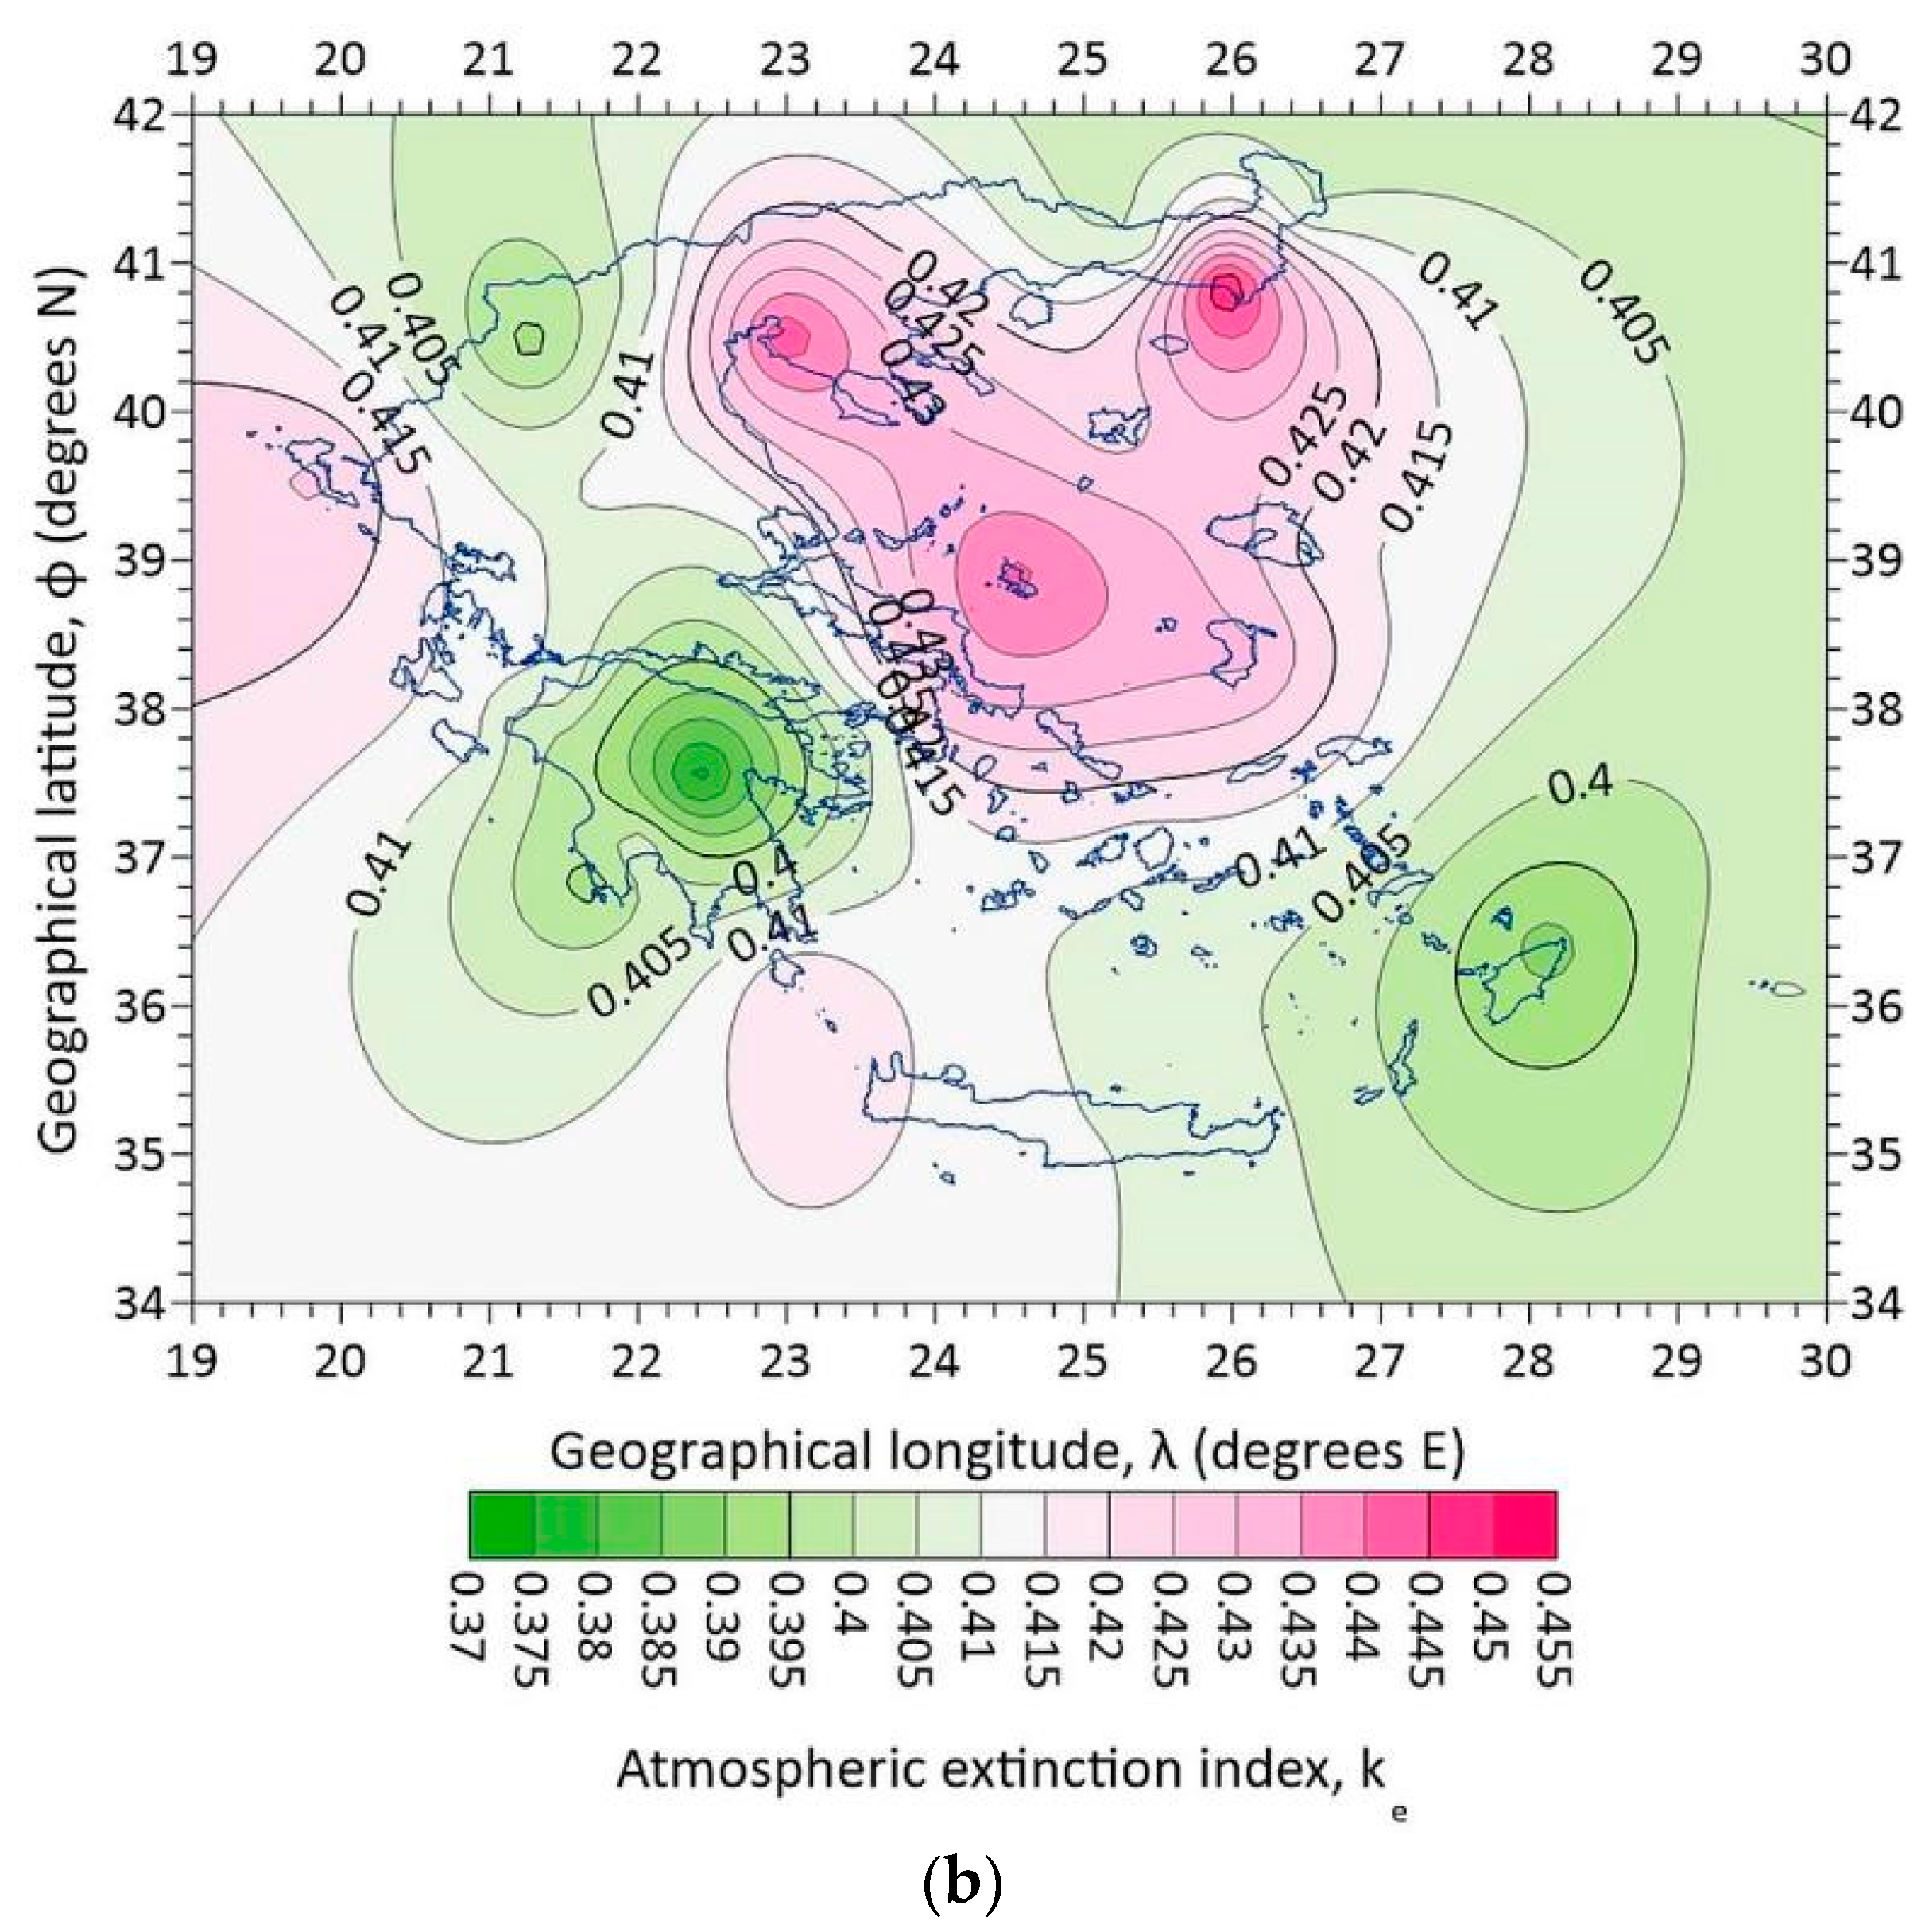
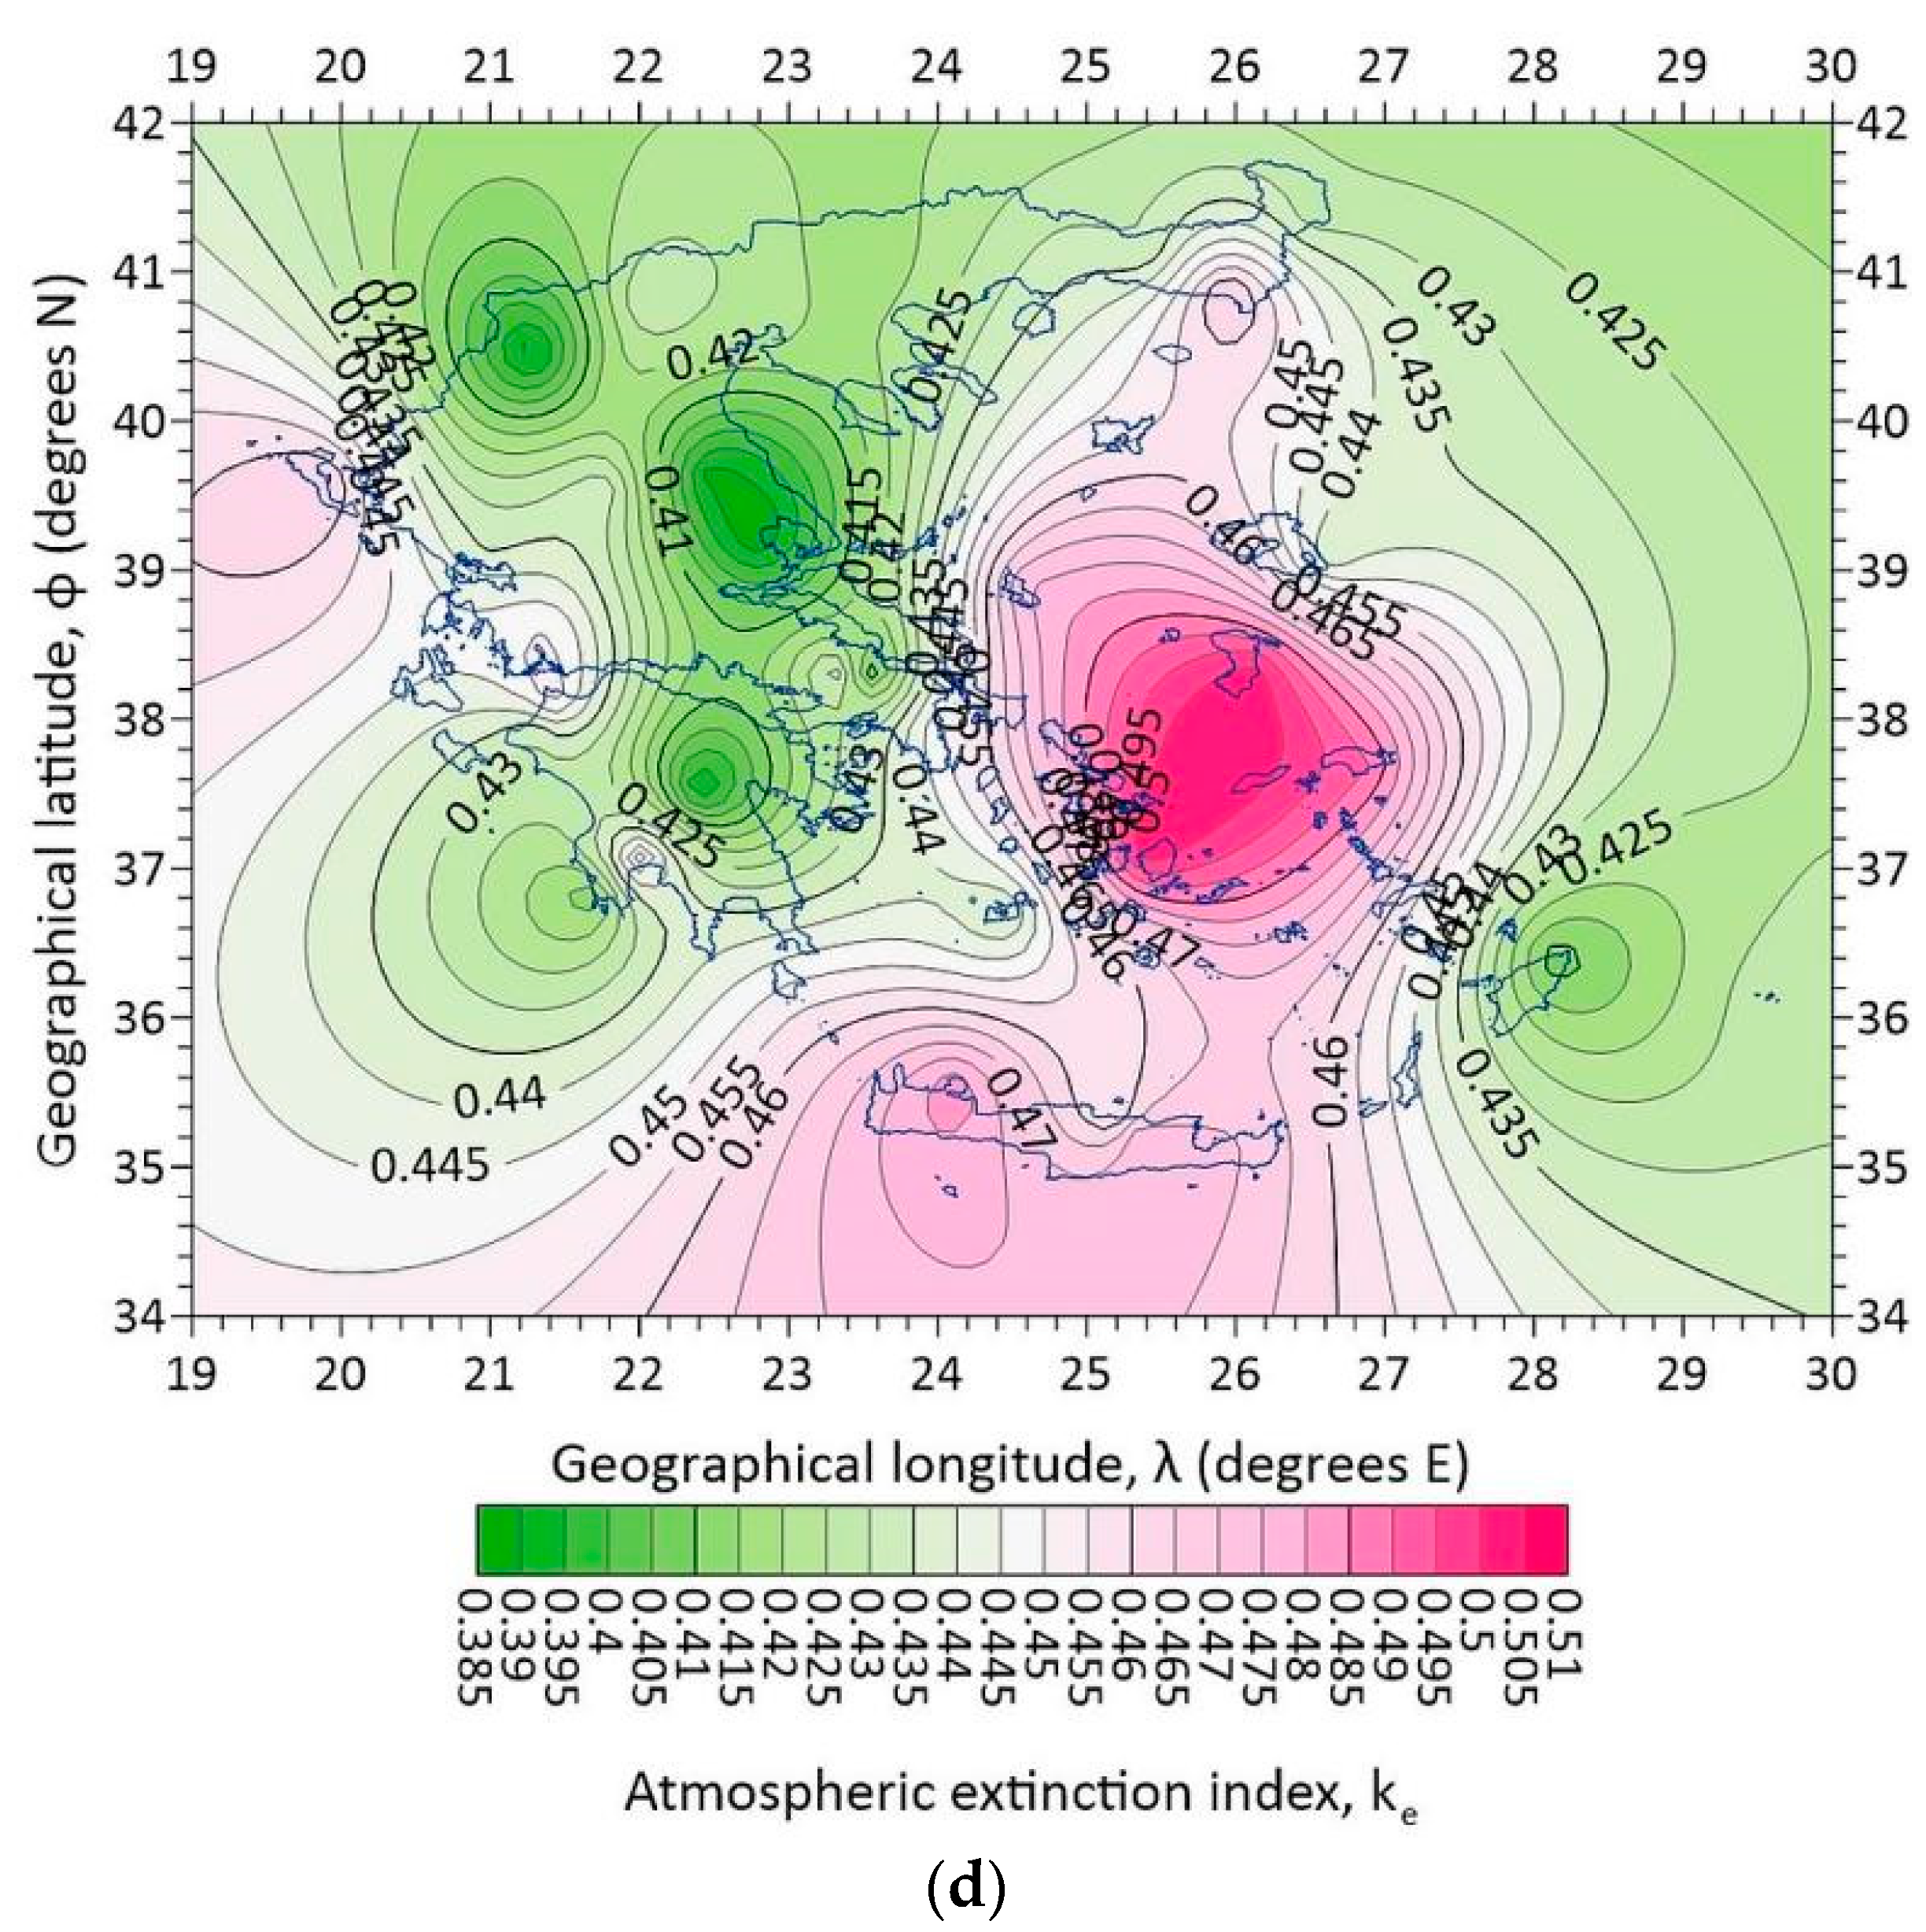
- Figure 12a shows the dependence of Hg,t,Hay/ρg on ke. A linear fit to the data points with a negative slope has been derived; this implies decreasing solar irradiation values with an increasing atmospheric extinction index. In other words, a 0.1 increase in ke results in an almost 1273 kWhm-2 decrease in Hg,t,Hay/ρg, (calculated by applying the linear expression in Figure 12a twice for ke1 = 0.38 and ke2 = 0.48, computing the Hg,t,Hay/ρg1 and Hg,t,Hay/ρg2 values, and taking their difference (Hg,t,Hay/ρg2 ‒ Hg,t,Hay/ρg1)). As these energy values concern the whole Greek territory (i.e., the average value for all 43 sites), then a decrease of about 30 kWhm-2 per site (= 1273 / 43) in a year-round is calculated or a decrease of ≈2.5 kWhm-2 per site and per month (= 30 / 12). From Figure 7a, one sees that the average energy yield for January (worst case) is about 130 kWhm-2 for all 43 sites or about 3.0 kWhm-2 per site in January (= 130 / 43), and 330 kWhm-2 in July (best case) for all 43 sites or 7.8 kWhm-2 per site in July (= 330 / 43). The site-month values of 3.0 (7.8) kWhm-2 are comparable (3 times higher) to the 2.5 kWhm-2 decrease in Hg,t,Hay/ρg due to a 0.1 increase in ke. Since ke = Hd/Hb (consider Hb = constant), a 0.1 increase in ke means a 10% increase in Hd, and a subsequent decrease in Hg,t,Hay/ρg equal to 1273 kWhm-2 (or 14% equivalently). Therefore, any solar energy investor in Greece should consult not only the solar energy potential map of Greece (Figure 10a), but also the corresponding map of ke in Figure 12b. In the latter map, higher ke values occur over the northern Aegean Sea, Macedonia, and Thrace regions, and lower ones over Peloponnese, Crete, and Rhodes. Taking into account a constant Hb value concludes that favourable areas for solar harvesting in Greece are those of Peloponnese, Crete, and Rhodes because the contribution of the diffuse solar component is less important than in the northern areas; this way, no extra cost in the solar panels is anticipated in exploiting the higher diffuse radiation in northern Greece in respect to the Hb component
- (iii)
- Now that the importance of the ke index in solar harvesting has been established, it is useful to derive and present the monthly and seasonal mean variation of the index for Greece. Figure 13 shows the intra-annual variation of ke. It is interesting to observe that minimum values occur in the summertime due to lower Hd/Hb values; this is so because, on the one hand, the Hd levels are lower than in the other seasons (less frequent cloudiness), and, on the other hand, the Hb levels are higher in this season. The above observations are also confirmed by Figure 14, which presents the seasonal variation of ke under all-sky conditions in Greece. The spring and summer ke patterns are remarkably similar; higher values in the northern part of Greece and lower in the south. The lower ke values imply lower diffuse radiation in comparison to the direct one; therefore, solar panels need to exploit the direct solar component without paying attention to the diffuse one in southern Greece; on the contrary, the diffuse radiation becomes more dominant in northern Greece, and this must be considered in PV installations. This outcome indicates a preference for solar harvesting below the latitude of φ ≈ 39oN (same conclusion in Section 3.4 for the annual values of Hg,t,Hay/ρg) during spring and summertime. On the contrary, the autumn and winter patterns differ; some relatively high values are spotted over the northern Aegean Sea, Macedonia, Thrace, and south of Peloponnese (autumn), and Crete, and almost all the Aegean Sea (winter). In these two seasons, the rule of an imaginary dividing line at φ ≈ 39oN is not obeyed.
- (iv)
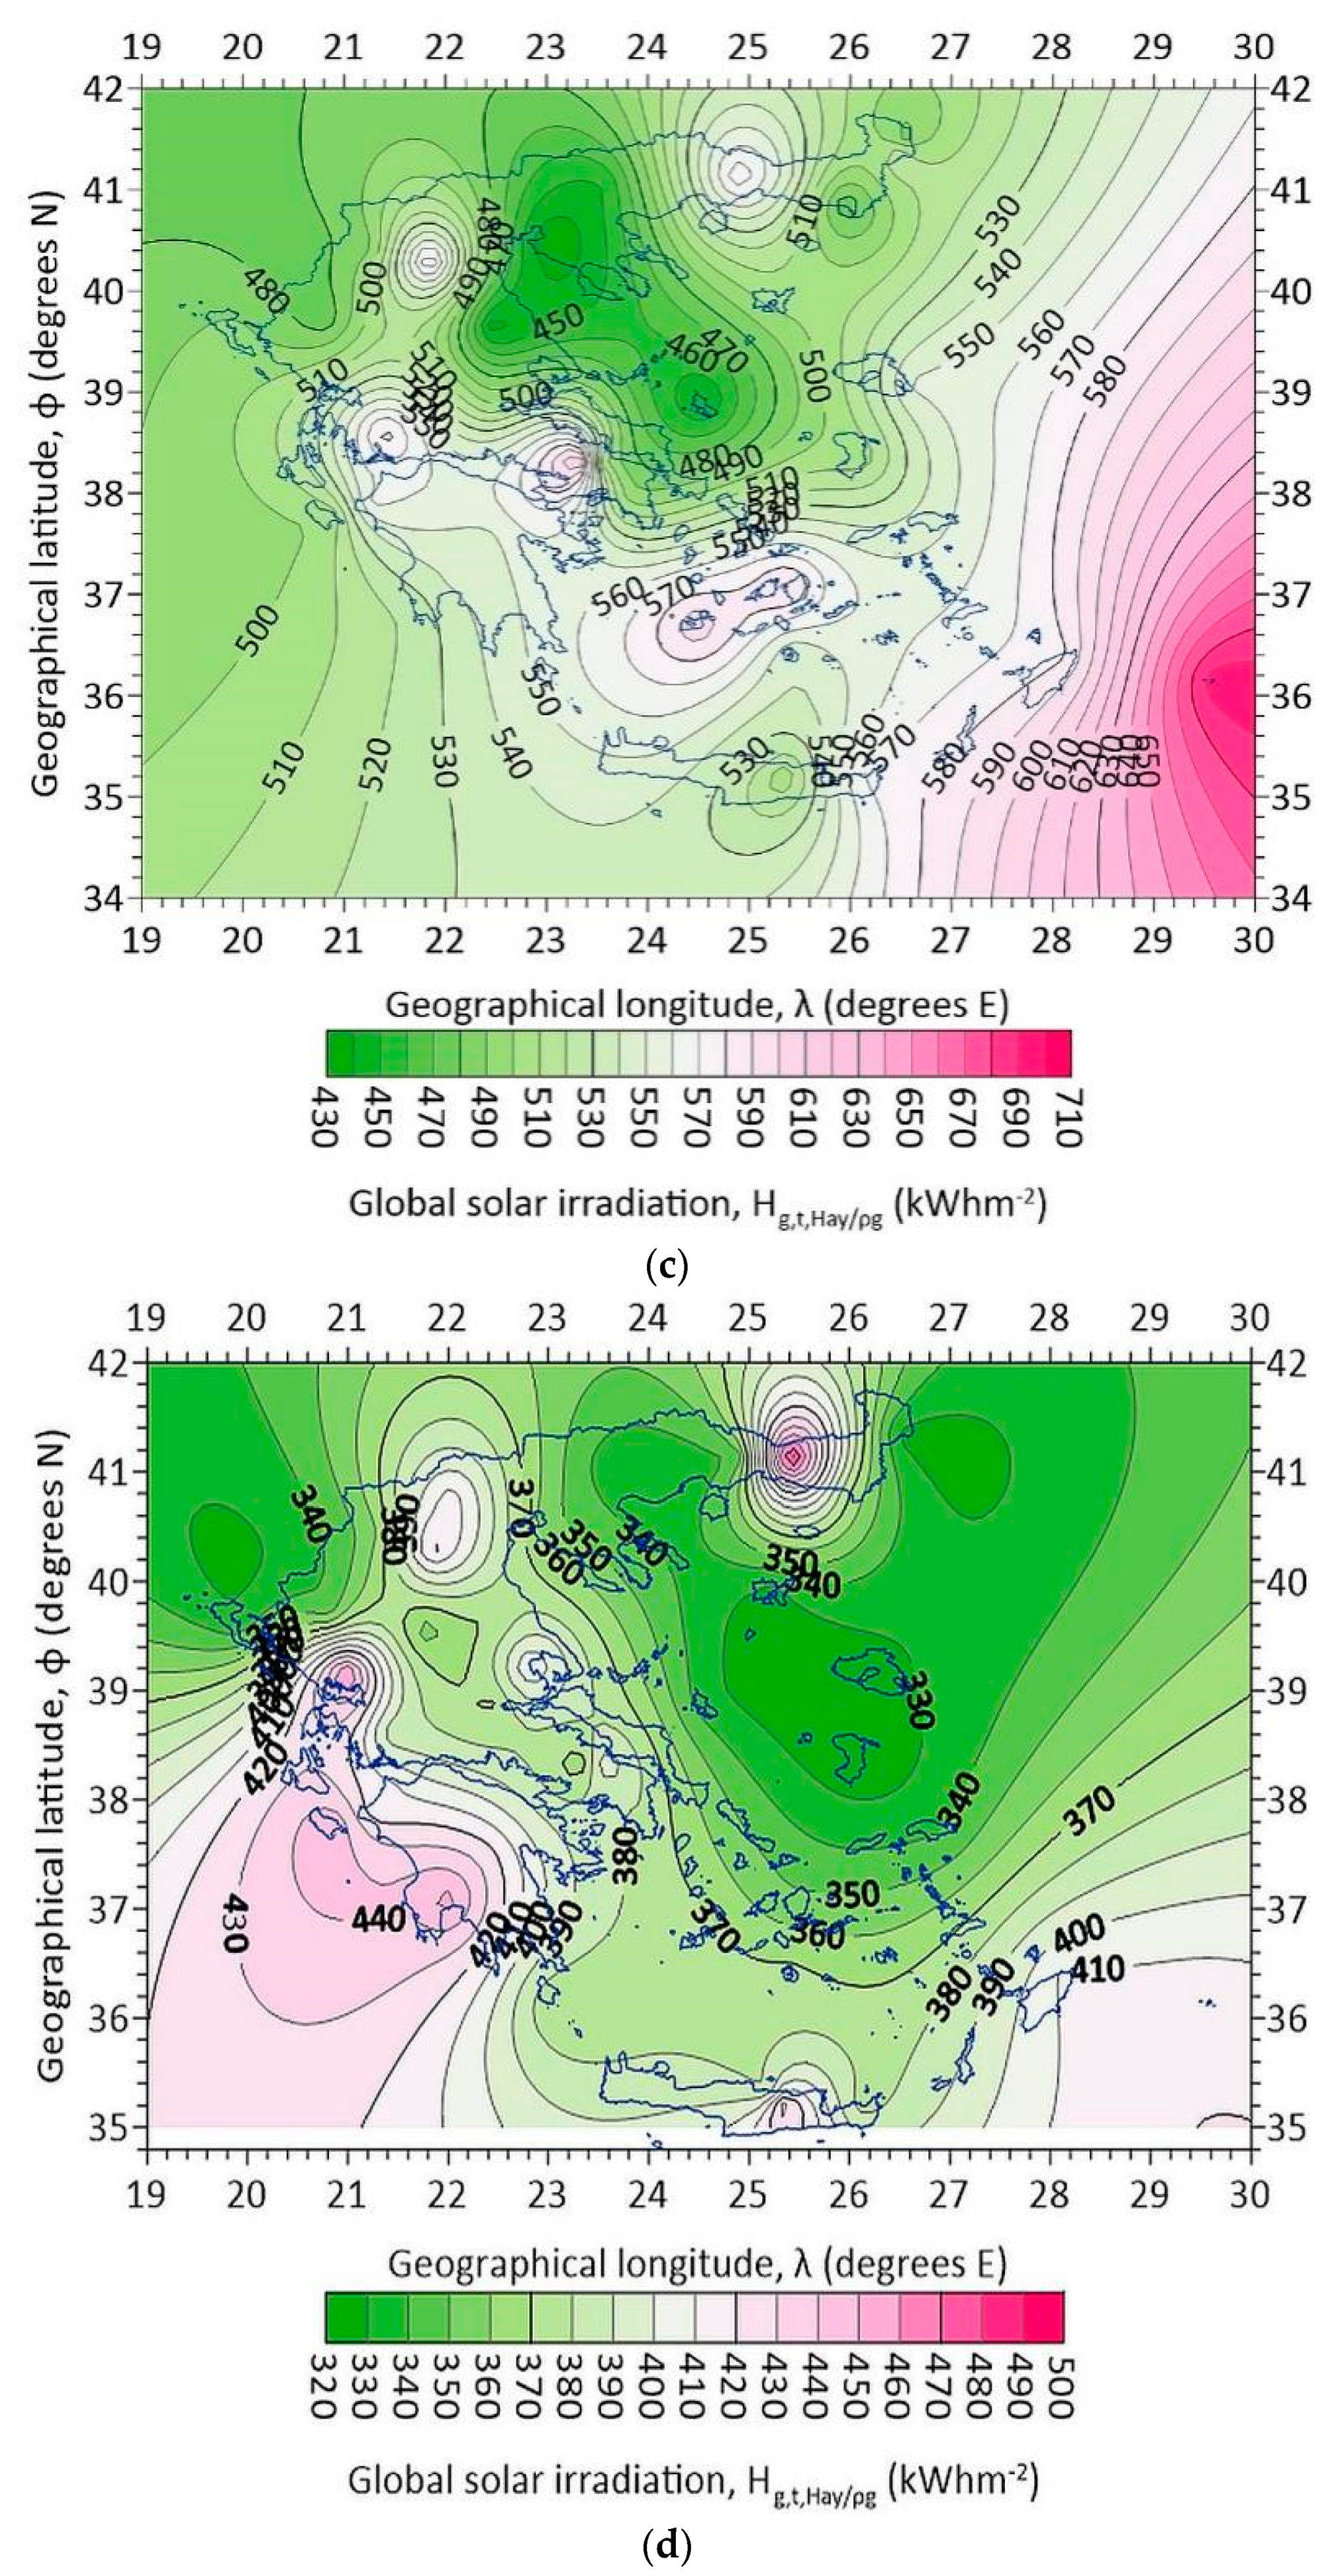
- The variation of the annual Hg,t,Hay/ρg values versus φ is presented in Figure 4. Here, analogous plots are derived with respect to z or ρg. Figure 15a shows the variation of the annual Hg,t,Hay/ρg values versus z, and Figure 15b the variation of Hg,t,Hay/ρg versus ρg. In both Figures, a wide dispersion of the Hg,t,Hay values versus z or ρg is seen; moreover, a lot of Hg,t,Hay values occur at lower elevations (below 25 m amsl, vertical dashed line in Figure 15a) that shows that the global solar irradiation is not strictly related to the altitude of the site (at least in the range 0 m – 700 m amsl). Indeed, 16 sites out of 43 (37.2%) are at altitudes lower than 25 m amsl. Similar conclusion is drawn from Figure 15b; here the 6th-order polynomial fit is shown to form two peaks at ρg ≈ 0.116 and ≈ 0.144. The very loose dependence of the solar irradiation on flat-plate solar collectors fixed on dual-axis systems in Greece on either the site location (i.e., geographical latitude) or the type of ground (i.e., ground albedo) concludes that the general rule for a solar energy system installation is only the region (northern or southern Greece, see Figure 10 and Figure 16).
- (v)
- Figure 16 presents the four seasonal maps of Hg,t,Hay/ρg over Greece under all-sky conditions. It is easily seen that the Hg,t,Hay/ρg patterns are the reverse of those for ke in the corresponding seasons. This is quite logical, because high global solar radiation consists mainly of direct solar component and less diffuse solar radiation; this is equivalent to low ke (i.e., Hd/Hb) values and vice versa.
- (vi)
- Figure 17 presents a 3Dgraph of Hg,t,Hay/ρg versus φ and ρg (Figure 17a), and a scatter plot of ρg versus φ (Figure 17b) under all-sky conditions. The Hg,t,Hay/ρg pattern is a wave-like shape, confirmed by the 2D plot, in which the green line is a 6th-order polynomial fit to the data points. This is an interesting result and shows that the reflections from the ground play a role in the performance of a dual-axis solar system. The big scatter in the data points of Figure 17b implies that the ground reflections do not depend directly on the geographical latitude; nevertheless, two peaks in the ρg values can be observed for φ ≈ 38oN and φ ≈ 41oN that correspond to sites located in central and northern Greece, where green lands (forests or cultivated areas) exist that reflect more radiation than the bare soil in most parts of the southern territories of the country (for φ < 38oN). Apart from the general territory rule of φ ≈ 39oN (see Figure 10 and Figure 16) in investing solar energy systems in Greece that was formulated in (iv) above, one should also consider that a system installed at a site with φ = 38oN or φ = 41oN may receive almost 1.4 times higher ground reflection than other sites at φ ≈ 36oN or φ ≈ 39oN. On the other hand, a combination of Figure 15b and Figure 17b results in Figure 17a, in which the solar irradiation levels over Greece take a waveform pattern.
- (vi)
- Figure 18 presents the intra-annual variation of the near-real ground albedo over Greece. The mean ρg ± 1σ band is also shown and implies a ρg variation in the range of 0.108 - 0.155. This broad ±1σ band is justified by the wide dispersion of the annual ρg values in relation to φ shown in Figure 17b. Nevertheless, an annual mean ρg value over Greece is estimated at 0.135. Psiloglou and Kambezidis [62] have estimated an annual ground-albedo value for Athens at 0.145 from solar radiation measurements at the Actinometric Station, National Observatory of Athens, Greece, in the period 1999 - 2008.
4. Discussion
5. Conclusions
Author Contributions
Funding
Institutional Review Board Statement
Informed Consent Statement
Data Availability Statement
Acknowledgments
Conflicts of Interest
References
- Kambezidis, H. D.; Psiloglou, B. E. Estimation of the Optimum Energy Received by Solar Energy Flat-Plate Convertors in Greece Using Typical Meteorological Years. Part I: South-Oriented Tilt Angles. Applied Sciences (Switzerland) 2021, 11 (4), 1–27. [CrossRef]
- Demain, C.; Journée, M.; Bertrand, C. Evaluation of Different Models to Estimate the Global Solar Radiation on Inclined Surfaces. Renew Energy 2013, 50, 710–721. [CrossRef]
- El-Sebaii, A. A.; Al-Hazmi, F. S.; Al-Ghamdi, A. A.; Yaghmour, S. J. Global, Direct and Diffuse Solar Radiation on Horizontal and Tilted Surfaces in Jeddah, Saudi Arabia. Appl Energy 2010, 87 (2), 568–576. [CrossRef]
- García, I.; de Blas, M.; Hernández, B.; Sáenz, C.; Torres, J. L. Diffuse Irradiance on Tilted Planes in Urban Environments: Evaluation of Models Modified with Sky and Circumsolar View Factors. Renew Energy 2021, 180, 1194–1209. [CrossRef]
- Barbón, A.; Bayón, L.; Díaz, G.; Silva, C. A. Investigation of the Effect of Albedo in Photovoltaic Systems for Urban Applications: Case Study for Spain. Energies (Basel) 2022, 15 (21), 7905. [CrossRef]
- Akbar, H. S.; Fathallah, M. N.; Raoof, O. O. Efficient Single Axis Sun Tracker Design for Photovoltaic System Applications. IOSR Journal of Applied Physics 2017, 09 (02), 53–60. [CrossRef]
- Heslop, S.; MacGill, I. Comparative Analysis of the Variability of Fixed and Tracking Photovoltaic Systems. Solar Energy 2014, 107, 351–364. [CrossRef]
- Abdallah, S.; Nijmeh, S. Two Axes Sun Tracking System with PLC Control. Energy Convers Manag 2004, 45 (11–12), 1931–1939. [CrossRef]
- Akbar, H. S. Design of Sun Tracker System for Solar Energy Applications. Journal of Physics and Research (IJPR) 2015, 1 (1), 29–34.
- Hafez, A. Z.; Yousef, A. M.; Harag, N. M. Solar Tracking Systems: Technologies and Trackers Drive Types – A Review. Renewable and Sustainable Energy Reviews 2018, 91 (November 2017), 754–782. [CrossRef]
- Altarawneh, I. S.; Rawadieh, S. I.; Tarawneh, M. S.; Alrowwad, S. M.; Rimawi, F. Optimal Tilt Angle Trajectory for Maximizing Solar Energy Potential in Ma’an Area in Jordan. Journal of Renewable and Sustainable Energy 2016, 8 (3). [CrossRef]
- Talebizadeh, P.; Mehrabian, M. A.; Abdolzadeh, M. Prediction of the Optimum Slope and Surface Azimuth Angles Using the Genetic Algorithm. Energy Build 2011, 43 (11), 2998–3005. [CrossRef]
- Evseev, E. G.; Kudish, A. I. The Assessment of Different Models to Predict the Global Solar Radiation on a Surface Tilted to the South. Solar Energy 2009, 83 (3), 377–388. [CrossRef]
- Kambezidis, H. D. The Solar Radiation Climate of Greece. Climate 2021, 9, 183–202. [CrossRef]
- Kaddoura, T. O.; Ramli, M. A. M.; Al-Turki, Y. A. On the Estimation of the Optimum Tilt Angle of PV Panel in Saudi Arabia. Renewable and Sustainable Energy Reviews 2016, 65, 626–634. [CrossRef]
- Ohtake, H.; Uno, F.; Oozeki, T.; Yamada, Y.; Takenaka, H.; Nakajima, T. Y. Estimation of Satellite-Derived Regional Photovoltaic Power Generation Using a Satellite-Estimated Solar Radiation Data. Energy Sci Eng 2018, 6 (5), 570–583. [CrossRef]
- Tsalides, P.; Thanailakis, A. Direct Computation of the Array Optimum Tilt Angle in Constant-Tilt Photovoltaic Systems. Solar Cells 1985, 14 (1), 83–94. [CrossRef]
- Koronakis, P. S. On the Choice of the Angle of Tilt for South Facing Solar Collectors in the Athens Basin Area. Solar Energy 1986, 36 (3), 217–225. [CrossRef]
- Balouktsis, A.; Tsanakas, D.; Vachtevanos, G. On the Optimum Tilt Angle of a Photovoltaic Array. International Journal of Solar Energy 1987, 5 (3), 153–169. [CrossRef]
- Synodinou, B. M.; Katsoulis, B. D. A Comparison of Three Models for Estimation of Global Solar Irradiation on Tilted and Oriented Surfaces in Athens. International Journal of Solar Energy 1996, 18 (2), 83–102. [CrossRef]
- Darhmaoui, H.; Lahjouji, D. Latitude Based Model for Tilt Angle Optimization for Solar Collectors in the Mediterranean Region. In Energy Procedia; 2013; Vol. 42, pp 426–435. [CrossRef]
- Kaldellis, J. K.; Kapsali, M.; Kavadias, K. A. Temperature and Wind Speed Impact on the Efficiency of PV Installations. Experience Obtained from Outdoor Measurements in Greece. Renew Energy 2014, 66, 612–624. [CrossRef]
- Jacobson, M. Z.; Jadhav, V. World Estimates of PV Optimal Tilt Angles and Ratios of Sunlight Incident upon Tilted and Tracked PV Panels Relative to Horizontal Panels. Solar Energy 2018, 169 (April), 55–66. [CrossRef]
- Raptis, I.-P.; Moustaka, A.; Kosmopoulos, P.; Kazadzis, S. Selecting Surface Inclination for Maximum Solar Power. Energies (Basel) 2022, 15 (13), 4784. [CrossRef]
- Palz, W.; Greif, J. Introduction to the Tables for Daily Global and Diffuse Radiation Incident on Slopes. In European Solar Radiation Atlas; Palz, W., Greif, J., Eds.; Springer Berlin Heidelberg: Berlin, Heidelberg, 1996; pp 25–27. [CrossRef]
- Page, J.; Albuisson, M.; Wald, L. The European Solar Radiation Atlas: A Valuable Digital Tool. Solar Energy 2001, 71 (1), 81–83. [CrossRef]
- ESMAP. Global Solar Atlas 2.0; Washington, DC, 2019. www.solargis.com.
- Kambezidis, H. D.; Psiloglou, B. E.; Kavadias, K. A.; Paliatsos, A. G.; Bartzokas, A. Development of a Greek Solar Map Based on Solar Model Estimations. Sun and Geosphere 2016, 11 (2), 137–141.
- Katopodis, T.; Markantonis, I.; Politi, N.; Vlachogiannis, D.; Sfetsos, A. High-Resolution Solar Climate Atlas for Greece under Climate Change Using the Weather Research and Forecasting (WRF) Model. Atmosphere (Basel) 2020, 11 (7), 761. [CrossRef]
- Huld, T.; Müller, R.; Gambardella, A. A New Solar Radiation Database for Estimating PV Performance in Europe and Africa. Solar Energy 2012, 86 (6), 1803–1815. [CrossRef]
- Urraca, R.; Gracia-Amillo, A. M.; Koubli, E.; Huld, T.; Trentmann, J.; Riihelä, A.; Lindfors, A. V.; Palmer, D.; Gottschalg, R.; Antonanzas-Torres, F. Extensive Validation of CM SAF Surface Radiation Products over Europe. Remote Sens Environ 2017, 199 (September), 171–186. [CrossRef]
- Urraca, R.; Huld, T.; Gracia-Amillo, A.; Martinez-de-Pison, F. J.; Kaspar, F.; Sanz-Garcia, A. Evaluation of Global Horizontal Irradiance Estimates from ERA5 and COSMO-REA6 Reanalyses Using Ground and Satellite-Based Data. Solar Energy 2018, 164 (October 2017), 339–354. [CrossRef]
- Mueller, R. W.; Matsoukas, C.; Gratzki, A.; Behr, H. D.; Hollmann, R. The CM-SAF Operational Scheme for the Satellite Based Retrieval of Solar Surface Irradiance - A LUT Based Eigenvector Hybrid Approach. Remote Sens Environ 2009, 113 (5), 1012–1024. [CrossRef]
- Amillo, A. G.; Huld, T.; Müller, R. A New Database of Global and Direct Solar Radiation Using the Eastern Meteosat Satellite, Models and Validation. Remote Sens (Basel) 2014, 6 (9), 8165–8189. [CrossRef]
- Walraven, R. Calculating the Position of the Sun. Solar Energy 1978, 20 (5), 393–397. [CrossRef]
- Wilkinson, B. J. An Improved FORTRAN Program for the Rapid Calculation of the Solar Position. Solar Energy 1981, 27 (1), 67–68. [CrossRef]
- Kambezidis, H. D.; Papanikolaou, N. S. Solar Position and Atmospheric Refraction. Solar Energy 1990, 44 (3), 143–144. [CrossRef]
- Kambezidis, H. D.; Mimidis, K.; Kavadias, K. A. Correction of the Solar Azimuth Discontinuity at Sunrise and Sunset. Sun and Geosphere 2022, 15 (1), 19–34. [CrossRef]
- Liu, B.; Jordan, R. C. The Long-Term Average Performance of Flat-Plate Solar-Energy Collectors. Solar Energy 1963, 7 (2), 53–74.
- Hay, J. E. Calculation of Monthly Mean Solar Radiation for Horizontal and Inclined Surfaces. Solar Energy 1979, 23 (4), 301–307. [CrossRef]
- Hay, J. E. Calculating Solar Radiation for Inclined Surfaces: Practical Approaches. Renew Energy 1993, 3 (4–5), 373–380. [CrossRef]
- Kambezidis, H. D.; Psiloglou, B. E.; Gueymard, C. Measurements and Models for Total Solar Irradiance on Inclined Surface in Athens, Greece. Solar Energy 1994, 53 (2), 177–185. [CrossRef]
- Pandey, C. K.; Katiyar, A. K. Hourly Solar Radiation on Inclined Surfaces. Sustainable Energy Technologies and Assessments 2014, 6, 86–92. [CrossRef]
- Iqbal, M. An Introduction to Solar Radiation; Academic Press, 1983.
- Kambezidis, H. D. The Solar Resource. In Comprehensive Renewable Energy; Letcher, T. M., Ed.; Elsevier: Oxford, 2022; Vol. 3, pp 26–117. [CrossRef]
- Gueymard, C. A. A Reevaluation of the Solar Constant Based on a 42-Year Total Solar Irradiance Time Series and a Reconciliation of Spaceborne Observations. Solar Energy 2018, 168 (February), 2–9. [CrossRef]
- Spencer, J. W. Fourier Series Representation of the Position of the Sun. Search (Syd) 1971, 2 (5), 172.
- Acker, J. G.; Leptoukh, G. Online Analysis Enhances Use of NASA Earth Science Data. Eos, Transactions American Geophysical Union 2007, 88 (2), 14. [CrossRef]
- Kambezidis, H. D.; Psiloglou, B. E. Climatology of the Linke and Unsworth-Monteith Turbidity Parameters for Greece: Introduction to the Notion of a Typical Atmospheric Turbidity Year. Applied Sciences (Switzerland) 2020, 10 (11). [CrossRef]
- Perez, R.; Ineichen, P.; Seals, R.; Zelenka, A. Making Full Use of the Clearness Index for Parameterizing Hourly Insolation Conditions. Solar Energy 1990, 45 (2), 111–114. [CrossRef]
- Kasten, F. A New Table and Approximation Formula for the Relative Optial Air Mass. Archiv für Meteorologie, Geophysik und Bioklimatologie Serie B 1965, 14 (2), 206–223. [CrossRef]
- Farahat, A.; Kambezidis, H. D.; Labban, A. The Solar Radiation Climate of Saudi Arabia. Climate 2023, 11 (4), 75. [CrossRef]
- Kafka, J. L.; Miller, M. A. A Climatology of Solar Irradiance and Its Controls across the United States: Implications for Solar Panel Orientation. Renew Energy 2019, 135, 897–907. [CrossRef]
- Farahat, A.; Kambezidis, H. D.; Almazroui, M.; Ramadan, E. Solar Energy Potential on Surfaces with Various Inclination Modes in Saudi Arabia: Performance of an Isotropic and an Anisotropic Model. Applied Sciences 2022, 12 (11), 5356. [CrossRef]
- Esbond, G. I.; Funmilayo, S. W. O. Solar Energy Potential in Yola, Adamawa State, Nigeria 2 The Problem 3 Literature Review. International Journal of Renewable Energy Sources 2019, 4 (January), 48–55.
- Raisz, E. The Analemma. Journal of Geography 1941, 40 (3), 90–97. [CrossRef]
- Lynch, P. The Equation of Time and the Analemma. Irish Mathematical Society Bulletin 2021, 0069 (69), 47–56. [CrossRef]
- Kambezidis, H. D.; Larissi, I. K.; Nastos, P. T.; Paliatsos, A. G. Spatial Variability and Trends of the Rain Intensity over Greece. Advances in Geosciences 2010, 26, 65–69. [CrossRef]
- Mueller, R.; Behrendt, T.; Hammer, A.; Kemper, A. A New Algorithm for the Satellite-Based Retrieval of Solar Surface Irradiance in Spectral Bands. Remote Sens (Basel) 2012, 4 (3), 622–647. [CrossRef]
- Farahat, A.; Kambezidis, H. D.; Almazroui, M.; Ramadan, E. Solar Potential in Saudi Arabia for Southward-Inclined Flat-Plate Surfaces. Applied Sciences 2021, 11 (9), 4101. [CrossRef]
- Farahat, A.; Kambezidis, H. D.; Almazroui, M.; Al Otaibi, M. Al. Solar Potential in Saudi Arabia for Inclined Flat-Plate Surfaces of Constant Tilt Tracking the Sun. Applied Sciences 2021, 11 (15), 7105. [CrossRef]
- Psiloglou, B. E.; Kambezidis, H. D. Estimation of the Ground Albedo for the Athens Area, Greece. J Atmos Sol Terr Phys 2009, 71 (8–9), 943–954. [CrossRef]
- Hammad, B.; Al-Sardeah, A.; Al-Abed, M.; Nijmeh, S.; Al-Ghandoor, A. Performance and Economic Comparison of Fixed and Tracking Photovoltaic Systems in Jordan. Renewable and Sustainable Energy Reviews. December 2017, pp 827–839. [CrossRef]
- Lazaroiu, G. C.; Longo, M.; Roscia, M.; Pagano, M. Comparative Analysis of Fixed and Sun Tracking Low Power PV Systems Considering Energy Consumption. Energy Convers Manag 2015, 92, 143–148. [CrossRef]
- Michaelides, I. M. M.; Kalogirou, S. A. A.; Chrysis, I.; Roditis, G.; Hadjiyianni, A.; Kambezidis, H. D. D.; Petrakis, M.; Lykoudis, S.; Adamopoulos, A. D. D. Comparison of Performance and Cost Effectiveness of Solar Water Heaters at Different Collector Tracking Modes in Cyprus and Greece. Energy Convers Manag 1999, 40 (12), 1287–1303. [CrossRef]
- Kambezidis, H. D.; Farahat, A.; Almazroui, M.; Ramadan, E. Solar Potential in Saudi Arabia for Flat-Plate Surfaces of Varying Tilt Tracking the Sun. Applied Sciences 2021, 11 (23), 11564. [CrossRef]
- Drury, E.; Lopez, A.; Denholm, P.; Margolis, R. Relative Performance of Tracking versus Fixed Tilt Photovoltaic Systems in the USA. Progress in Photovoltaics: Research and Applications 2013, 22, n/a-n/a. [CrossRef]
- Eke, R.; Senturk, A. Performance Comparison of a Double-Axis Sun Tracking versus Fixed PV System. Solar Energy 2012, 86 (9), 2665–2672. [CrossRef]
- Vaziri Rad, M. A.; Toopshekan, A.; Rahdan, P.; Kasaeian, A.; Mahian, O. A Comprehensive Study of Techno-Economic and Environmental Features of Different Solar Tracking Systems for Residential Photovoltaic Installations. Renewable and Sustainable Energy Reviews 2020, 129, 109923. [CrossRef]











| Site number | Site name / Region / z (m amsl) | λ (o E) | φ (o N) |
|---|---|---|---|
| 1 | Agrinio/Western Greece/25 | 21.383 | 38.617 |
| 2 | Alexandroupoli/Eastern Macedonia and Thrace/3.5 | 25.933 | 40.850 |
| 3 | Anchialos/Thessaly/15.3 | 22.800 | 39.067 |
| 4 | Andravida/Western Greece/15.1 | 21.283 | 37.917 |
| 5 | Araxos/Western Greece/11.7 | 21.417 | 38.133 |
| 6 | Arta/Epirus/96 | 20.988 | 39.158 |
| 7 | Chios/Northern Aegean/4 | 26.150 | 38.350 |
| 8 | Didymoteicho/Eastern Macedonia and Thrace/27 | 26.496 | 41.348 |
| 9 | Edessa/Western Macedonia/321 | 22.044 | 40.802 |
| 10 | Elliniko/Attica/15 | 23.750 | 37.900 |
| 11 | Ioannina/Epirus/484 | 20.817 | 39.700 |
| 12 | Irakleio/Crete/39.3 (also written as Heraklion) |
25.183 | 35.333 |
| 13 | Kalamata/Peloponnese/11.1 | 22.000 | 37.067 |
| 14 | Kastelli/Crete/335 | 25.333 | 35.120 |
| 15 | Kastellorizo/Southern Aegean/134 | 29.576 | 36.142 |
| 16 | Kastoria/Western Macedonia/660.9 | 21.283 | 40.450 |
| 17 | Kerkyra/Ionian Islands/4 (also known as Corfu) |
19.917 | 39.617 |
| 18 | Komotini/Eastern Macedonia and Thrace/44 | 25.407 | 41.122 |
| 19 | Kozani/Western Macedonia/625 | 21.783 | 40.283 |
| 20 | Kythira/Attica/166.8 | 23.017 | 36.133 |
| 21 | Lamia/Sterea Ellada/17.4 | 22.400 | 38.850 |
| 22 | Larissa/Thessaly/73.6 | 22.450 | 39.650 |
| 23 | Lesvos/Northern Aegean/4.8 | 26.600 | 39.067 |
| 24 | Limnos/Northern Aegean/4.6 | 25.233 | 39.917 |
| 25 | Methoni/Peloponnese/52.4 | 21.700 | 36.833 |
| 26 | Mikra/Central Macedonia/4.8 | 22.967 | 40.517 |
| 27 | Milos/Southern Aegean/5 | 24.475 | 36.697 |
| 28 | Naxos/Southern Aegean/9.8 | 25.533 | 37.100 |
| 29 | Orestiada/Eastern Macedonia and Thrace/41 | 26.531 | 41.501 |
| 30 | Rodos/Southern Aegean/11.5 (also written as Rhodes) |
28.117 | 36.400 |
| 31 | Samos/Northern Aegean/7.3 | 26.917 | 37.700 |
| 32 | Serres/Central Macedonia/34.5 | 23.567 | 41.083 |
| 33 | Siteia/Crete/115.6 | 26.100 | 35.120 |
| 34 | Skyros/Sterea Ellada/17.9 | 24.550 | 38.900 |
| 35 | Souda/Crete/140 | 21.117 | 35.550 |
| 36 | Spata/Attica/67 | 23.917 | 37.967 |
| 37 | Tanagra/Sterea Ellada/139 | 23.550 | 38.317 |
| 38 | Thira/Southern Aegean/36.5 | 25.433 | 36.417 |
| 39 | Thiva/Sterea Ellada/189 | 23.320 | 38.322 |
| 40 | Trikala/Thessaly/114 | 21.768 | 39.556 |
| 41 | Tripoli/Peloponnese/652 | 22.400 | 37.533 |
| 42 | Xanthi/Eastern Macedonia and Thrace/83 | 24.886 | 41.130 |
| 43 | Zakynthos/Ionian Islands/7.9 (also known as Zante) |
20.900 | 37.783 |
| Site number | Hg,t,Hay/ρg,all skies | Hg,t,Hay/ρg,clear skies |
|---|---|---|
| 1 | 2505 | 2141 |
| 2 | 2305 | 1906 |
| 3 | 2406 | 2027 |
| 4 | 2515 | 2171 |
| 5 | 2554 | 2202 |
| 6 | 2548 | 2228 |
| 7 | 2379 | 2032 |
| 8 | 2272 | 1856 |
| 9 | 2415 | 2039 |
| 10 | 2504 | 2181 |
| 11 | 2269 | 1806 |
| 12 | 2528 | 2177 |
| 13 | 2526 | 2175 |
| 14 | 2558 | 2211 |
| 15 | 2878 | 2617 |
| 16 | 2388 | 1963 |
| 17 | 2330 | 1927 |
| 18 | 2640 | 2311 |
| 19 | 2588 | 2130 |
| 20 | 2571 | 2235 |
| 21 | 2425 | 2070 |
| 22 | 2336 | 1941 |
| 23 | 2488 | 2194 |
| 24 | 2422 | 2094 |
| 25 | 2473 | 2131 |
| 26 | 2278 | 1921 |
| 27 | 2641 | 2288 |
| 28 | 2514 | 2182 |
| 29 | 2266 | 1868 |
| 30 | 2583 | 2274 |
| 31 | 2486 | 2141 |
| 32 | 2299 | 1916 |
| 33 | 2552 | 2203 |
| 34 | 2247 | 1831 |
| 35 | 2553 | 2207 |
| 36 | 2502 | 2177 |
| 37 | 2438 | 2075 |
| 38 | 2525 | 2191 |
| 39 | 2567 | 2227 |
| 40 | 2425 | 2093 |
| 41 | 2623 | 2280 |
| 42 | 2419 | 2031 |
| 43 | 2506 | 2177 |
| Sum | 106245 | 90848 |
| Average | 2471 | 2113 |
| Standard deviation (σ) | 127 | 157 |
| Average + 1σ | 2598 | 2270 |
| Average ‒ 1σ | 2344 | 1956 |
 |
Disclaimer/Publisher’s Note: The statements, opinions and data contained in all publications are solely those of the individual author(s) and contributor(s) and not of MDPI and/or the editor(s). MDPI and/or the editor(s) disclaim responsibility for any injury to people or property resulting from any ideas, methods, instructions or products referred to in the content. |
© 2023 by the authors. Licensee MDPI, Basel, Switzerland. This article is an open access article distributed under the terms and conditions of the Creative Commons Attribution (CC BY) license (http://creativecommons.org/licenses/by/4.0/).


