Preprint
Article

Influence of HIV/AIDS infection on Immunological and Nutritional Status. A Cross Sectional Study in Kingdom of Bahrain

Altmetrics

Downloads

170

Views

62

Comments

0

Submitted:

06 May 2023

Posted:

08 May 2023

You are already at the latest version

Alerts
Abstract
Background and Objectives: HIV infection is a global public health problem that can lead to the progression of AIDS. Nutritional status and biochemical markers can significantly contribute to the progression of AIDS in HIV/AIDS patients. The main objective of this study is to examine the association between the nutritional and biochemical markers as well as BMI in HIV/AIDS patients in the kingdom of Bahrain. Methods: A retrospective cohort study, including 300 patients (248 males and 52 females) with HIV/AIDS in Bahrain. Various biochemical markers were collected from patients’ medical records including CD4^+ T cells counts, albumin, Hb, HCT, MCV, WBC, and creatinine. A semi-structured questionnaire using of a standardized food frequency questionnaire (FFQ) was used from which total energy and total macronutrients were calculate. Results: the mean BMI of participants was 27.20 kg/m2 with none of the participants had a BMI lower than 18.5 kg/m2 (underweight). The majority of patients’ dietary intake of macronutrients and total calories intake were either within or above the recommended RDA levels. The results also showed that all mean values of the nutritional and biochemical markers (CD4^+ T cells counts, albumin, Hb, HCT, MCV, WBC, and creatinine) are within the referenced normal ranges. A significant positive correlation of CD4^+ T cells counts, Hb, HCT and albumin at <0.05 level was found. There was no significant correlation between CD4^+ T cells counts and MCV, WBC and creatinine. A positive significant correlation was found between BMI, CD4^+ T cells counts, and WBC at <0.01 level. Conclusion: BMI values significantly correlated to biochemical markers of AIDS progression. Dietary pattern of participants was undiversified among participants, with high prevalence of obesity and overweight. Malnutrition among this study population was not present.
Keywords: 
Subject: Biology and Life Sciences  -   Virology

1. Introduction

The association between nutritional status, disease stage and prolonged degradation of the immune system emphasized that nutrition can significantly contribute to the progression of acquired immune deficiency syndrome (AIDS). Along with human immunodeficiency virus (HIV) infection and compromised immunity, there are numbers of risk factors including muscle wasting, fat mass loss, reduced appetite, gastrointestinal problems, and the hypermetabolic state. HIV weakens and obliterates the immune system, which lowers the body’s ability to fight off infections and increase mortality rate [1].
The correlation between nutritional status and progression of AIDS is a complex study; yet it has been shown that poor nutrition may pose additional stress on an already weakened immune system. Poor nutritional status, especially malnutrition, places higher energy demands on patients and their immune system leading to numbers of risk factors including opportunistic infections, malignancies, debilitation, and death [2]. The difficulty in maintaining a nutritious diet as AIDS progresses has been linked to biological and social factors that play huge rule in diminishing the individual’s ability to consume food. Consequently, adequate nutrition care plan for population living with HIV/AIDS should always be given priority [3,4].
One of the circumstances responsible for poor nutritional status in an HIV-infected person is the reduction in patients’ appetite due to difficulty in ingesting food, opportunistic infections, illness, or even psychological compromises. In addition, poor nutritional status can be commonly associated with adverse effects of medications used to treat AIDS patients or any related illness, which cause nausea, and vomiting. At the same time, frequent bacterial infections accompanied with diarrhea can lead to poor absorption of nutrients [5,6,7,8]. In addition, HIV causes severe damage to the gastrointestinal tract by causing flattening of the villus of the small intestine cells. Eventually, leading to several malabsorption processes regarding carbohydrate and fat thereby compromising the absorption of fat-soluble vitamins like vitamins A and E.
These vitamins are essential for the immune system to function properly and are required during illness and infections. Iron deficiency is also very common to cause fatigue among patients, further decreases consumption of food and nutrients absorption. Therefore, malnutrition is considered a sign for disease progression among HIV-infected patients [5,6,7,8]. Altered metabolism has also been shown to be prevalent in HIV infected individuals, each patient presents with varying degrees of alteration in metabolic processes. These metabolic changes affect nutritional requirements and consumption. Thus, analyzing changes in the concentrations of some biochemical markers linked to nutritional status among HIV infected people contributes to early detection of malnutrition [9,10,11,12,13,14,15]. Additionally, dyslipidemia develops because of the infection complex metabolic changes that occur frequently. The dyslipidemia associated with HIV infection is exemplified by reduced levels of high-density lipoprotein cholesterol (HDL-C), elevated total cholesterol (TC), elevated low-density lipoprotein cholesterol (LDL-C), and high triacylglycerol’s (TGC) levels as well as significant decrease of albumin levels. Simultaneously, malnutrition is associated with a deficient in nutritional intake and immunological status presenting in low body mass index (BMI), anemia, dyslipidemia, and hypoalbuminemia [9,10,11,12,13,14,15].
HIV infection is a global public health burden with a high prevalence rate in locations where malnutrition is also a major concern. The idea of improving food access for undernourished people, regardless of disease status, is not new; yet fundamental issues remain about the most effective strategies to incorporate nutritional interventions into HIV care-plan. The distinction between food and nutrition as well as the idea that the amount of food is not synonymous with nutrition content must be highlighted. This has received less attention because of the urgency of the situation and the understandable instinct to get whatever food is available to those who are in need. The detrimental interaction impacts of undernutrition, insufficient food consumption, and HIV infection necessitate concentrated efforts to develop and execute efficient cross-sectoral solution [16,17].
Early nutritional intervention can spare lean body mass in individuals living with HIV and have signs of active weight loss. Malnutrition is one of the earlier complications of HIV infection to be detected, which results in wasting syndrome. It should be classified as a prognostic factor in advanced HIV stages; thus, malnutrition is significantly considered as HIV-associated complications. Several clinical trials were done to evaluate the effectiveness of supplements with required nutrients at different stages of HIV infection as well as combining formula foods for treating malnutrition along with medications. Therefore, enhanced nutritional status may guarantee better health in HIV infected individuals [2]. AIDS negatively compromised individuals' ability to consume, utilize and acquire food leading to a range of risk factors from poor nutritional status, weight loss, to even morbidity. Patients with body mass index (BMI) lower than 18.5 kg/m2 have a higher level of AIDS progression. In addition, as AIDS progresses several changes in the biochemical markers can be detected and are considered as common disorders resulting from HIV infection [18]. (Hailemariam et al. 2013).
The use of antiretroviral therapy (ART) can pose adverse impact on these disorders. Biochemical markers that can be affected are cluster of differentiated CD4+ T helper cells (CD4+ T cells), albumin, haemoglobin (Hb), haematocrit (HTC), mean corpuscular volume (MCV), white blood cells (WBC), and creatinine. Values of these biochemical markers can be lower than normal as AIDS progresses. Thus, early assessment of nutritional status and functional biochemical markers in the routinely patients’ checkups are crucial to delay the progression of the disease [19].
In Bahrain, the association between nutritional and chemical biomarkers and progression of AIDS among patients has not yet been studied. Therefore, the need to evaluate patients BMI and biochemical markers is crucial to detect early poor nutritional status and slow progression of AIDS (Hailemariam et al. 2013). The main objectives of the study were to examine the association between nutritional and biochemical markers that contribute to AIDS progression, and to analyze the nutritional factors that could increase/decrease the progression of AIDS in Bahraini citizens.

2. Materials and Methods

2.1. The study population

This study is a retrospective cohort study conducted during the period from 5August 2021 until 5 October 2021. All individuals with HIV/AIDS having a medical record at Salmaniya Medical Complex (SMC) (the only HIV/AIDS Center) at the kingdom of Bahrain were included in the study. The study population consisted of 308 individuals (257 males) and 51 females.
Data from the medical records included the latest results of the patient’s biochemical markers such as CD4+ T cells counts, albumin, Hb, HCT, MCV, WBC, and creatinine were supplied by SMC.

2.2. Ethical approval

The permission to conduct the study was first obtained from the Deanship of Graduate Studies and Scientific Research at the University of Bahrain (UOB) on 6 April 2021 (Decision No. 2021/77). Approval was also obtained from the Secondary Health Care Research Committee (SHCRC) on 14 June 2021 (Decision No. 83140621). Verbal consent of participants was taken before conducting the phone interviews due to covid-19 pandemic. The objectives of the study were explained, the confidentiality and privacy were maintained properly.

2.3. Food Frequency Questionnaire

All patients were asked to answer a semi-structured questionnaire that consists of standardized food frequency questionnaire (FFQ), Harvard Food Frequency Questionnaire Form, via phone interviews. However, only 81 patients agreed to fill in the FFQ.
The questionnaire consisted of two parts; the first part included demographic data such as age, gender, occupation, educational level, weight in (kg) and height in (cm). The second part included frequency of food in groups; for each food. There was an amount shown either a medium serving in a common household unit such as slice, teaspoon, cup or in grams. Participants were asked to indicate how often on average they have eaten the specified amount of each food during the past year. Giving them the choices of; never or less than once per month, 1-3 per month, 1 per week, 2-4 per week, 5-6 per week, 1 per day, 2-3 per day, 4-6 per day, and 6+ per day. The FFQ of each patient was calculated to estimate average intake of calories and macronutrients as well as stratified to get a list of daily consumed food.

2.4. Estimation of Macronutrients Intake

Patients' dietary habits were assessed to obtain frequency and portion size about food and beverage consumption over the past year. Patients’ average calories and macronutrients intake including carbohydrate, fat, and protein were calculated using the method of Willett (2012) [20]. Each Frequency in the FFQ such as never or less than once per month, 1-3 per month, 1 per week, 2-4 per week, 5-6 per week, 1 per day, 2-3 per day, 4-6 per day, and 6+ per day has a value of 0.016, 0.08, 0.14, 0.42, 0.8, 1, 2.5, 4.5, 6 respectively. Each frequency’s value was multiplied with the serving of food’s calories content, carbohydrate, fat and protein using the method of Willett (2013) [20]. Based on patients’ choices in the FFQ, the sum of each table gave us the average intake of calories, grams of carbohydrate, grams of fat, and grams of protein. In addition, participant’s responses in the FFQ were analysed and food that was frequently consumed on daily basis were recorded with the number of counts. This will give an outlook on the most consumed food among patients. The information regarding calories and macronutrients contents of food were obtained from the diet-controller application version 2.1.0 [21].
Total calories and macronutrient’s content of the diet were calculated based on World Health Organization (WHO) recommendations for HIV infected individuals [22]. WHO recommendations were 10% increase for caloric need above the general recommendation of health adults [23], and 12-15% increase for protein. However, no recommendation to increase carbohydrate and fat above the general recommendation of healthy adults. Therefore, it was recommended that HIV infected individuals should consume 45-65% of total calories from carbohydrate and 20%-35% of total calories from fat [22,23].

2.5. Anthropometric Measurements

Patients’ weight and height were used for the calculation of body BMI, as weight in kilograms divided by the square of height in meters (kg/m2) [24]. BMI were stratified into the WHO criteria: <17 (moderate to severe malnutrition), 17 to < 18.5 (mild malnutrition), >18.5 to 25 (normal nutrition), and >25 kg/m2 (overweight and obese) [18].

2.6. Statistical Analysis

Data were analysed using the Statistical Package for Social Science (SPSS version 28). Descriptive statistics were presented as means ± standard deviations (SD), ranges (minimum and maximum), and percentiles. Normal distribution of data was assessed using independent sample t-test as well as histogram-graph. Two-tailed Pearson correlation was used to correlate numeric variables such weight, height, CD4+ T cells counts, albumin, Hb, HCT, MCV, WBC, and creatinine levels between HIV-infected patients. Binary logistic regression and one-way ANOVA were used as CD4+ T cells counts being the dependent variables to correlate its value with the other variables. Descriptive statistics followed by selection of chi-square were used for the generation of odds ratio and confidence interval. P-values of less than 0.05 were considered statistically significant.

3. Results

Demographic characteristics of the participants are shown in Table 1. Males compromised 80.51% of the participants, and 16.88% were females. The age range of participants were 22-85 years old. The level of education was primary education (17.28%), intermediate education (16.04%), secondary education (39.50%), bachelor’s degree (B.Sc.) (25.92%), and higher education (1.23%).
Based on the information obtained from the analysis of the FFQ, 73 of the participants reported that they consumed white bread on a daily basis, while 64 participants consumed white rice as the main meal for lunch every day. In addition, 15 participants stated that they consumed potatoes as French fries on a daily basis. None of the participants stated that they consume higher fiber contents of carbohydrate on a daily basis such as oatmeal, whole grain bread, or brown rice. While the counts of high protein sources that participants reported consuming daily, were eggs with 45 counts followed by yogurt with 31 counts and beans with only 6 counts. Tea was among the most consumed caffeinated drinks with 75 participants who consumed tea daily, followed by coffee with 56 counts and the least amount of consumption was soft drinks with only 5 counts. The general consumption of fruits and vegetables was moderate. Among vegetables arugula (rocket), onions, and tomatoes were the most commonly consumed, and both apples and oranges were among the most consumed fruits (Table 2).
Dietary assessment of 81 participants was used to calculate the nutrients intake levels including caloric intake, carbohydrate, protein, and fat. Participants (32.09% males; 6.17% females) of those who were assessed had inadequate caloric intake as compared to the recommended dietary allowance (RDA) values. The caloric intake mean value was 2232±509.96 Kcal/day for males and 2290 ± 425.46 Kcal/day for females.
As for protein, there was 2.47% of males and 6.17% of females below RDA recommendation with a mean intake of 66.76 ± 36.35 g/day for males and 65.35 ± 11.70 g/day for females. Regarding lipid, mean intake was 36.36 ± 10.92 g/day for males and 37.04 ± 7.74 g/day for females. In addition, 9.87% of males and 8.64% of females were below the RDA recommendation in terms of lipid intake. Carbohydrate intake among participants showed a mean intake of 364.04 ± 73.46 g/day for males and 333.18 ± 87.68 g/day for females. Carbohydrates consumption was above the RDA recommendation among the all males participants’ (70.37%) as well as all females participants’ (29.63%).
Table 3. Macronutrients and calories adequacy of participants’ diets based on FFQ.
Nutrients *RDARecommendations Mean   ± SD %Below recommended RDA intake %Within recommended RDA intake % Above
recommended RDA intake
Total Calories (kcal/day) Male: 2200-2420
Female: 1760-2200
2232±509.96
2290±425.46
32.09
6.17
9.89
2.47
28.39
20.99
Total Proteins
(g/day)
Male: 63-65
Female: 52-53
66.76±36.36
65.35±11.70
2.47
6.17
27.16
12.35
40.74
11.11
Total lipids (g/day) Male: 49-54
Female: 39-49
36.36±10.92
37.04±7.74
9.87
8.64
2.47
1.23
58.03
19.76
Total carbohydrates (g/day) Male: 250-300
Female: 190-250
364.04±73.46
333.18±87.68
0.00
0.00
0.00
0.00
70.37
29.63
FFQ: food frequency questionnaire, RDA: Recommended Daily Allowance Range [22,23] *.
Description and classification of BMI are illustrated in Table 4. Participants (38.27%) had normal-weight, 37.03% of participants were overweight, 18.51% of participants were obese class I, 4.93% of participants were obese class II, and 1.23% of participant were obese class III. A mean BMI value of 27.20 kg/m2 was recorded.
The correlation between calories intake and individuals' BMI is illustrated in Figure 1. The plot reveals a positive correlation in which individuals with the highest calories intake have a higher value of BMI.
Table 5 displays the correlation coefficients between the BMI, total calories, total carbohydrates, total lipids, and total proeins consumed. It can be seen that all the correlations are significant at p-values ˂0.01 level since all of the p-values are less than 0.0001.
The mean CD4+ T cells counts, albumin, Hb, HCT, MCV, WBC, and creatinine were found to be 620.91 ± 673.40 cells/ m m 3 , 42.77 ± 5.62 g/L, 13.51 ± 2.31 g/L, 42.15 ± 7.03%, 83.13 ± 10.28 g/L, 6.16 ± 2.59 x 10 9 /L, and 84.19 ± 57.28 mg/dL respectively (Table 6). The results showed that all mean values are within the referenced normal ranges [26,27].
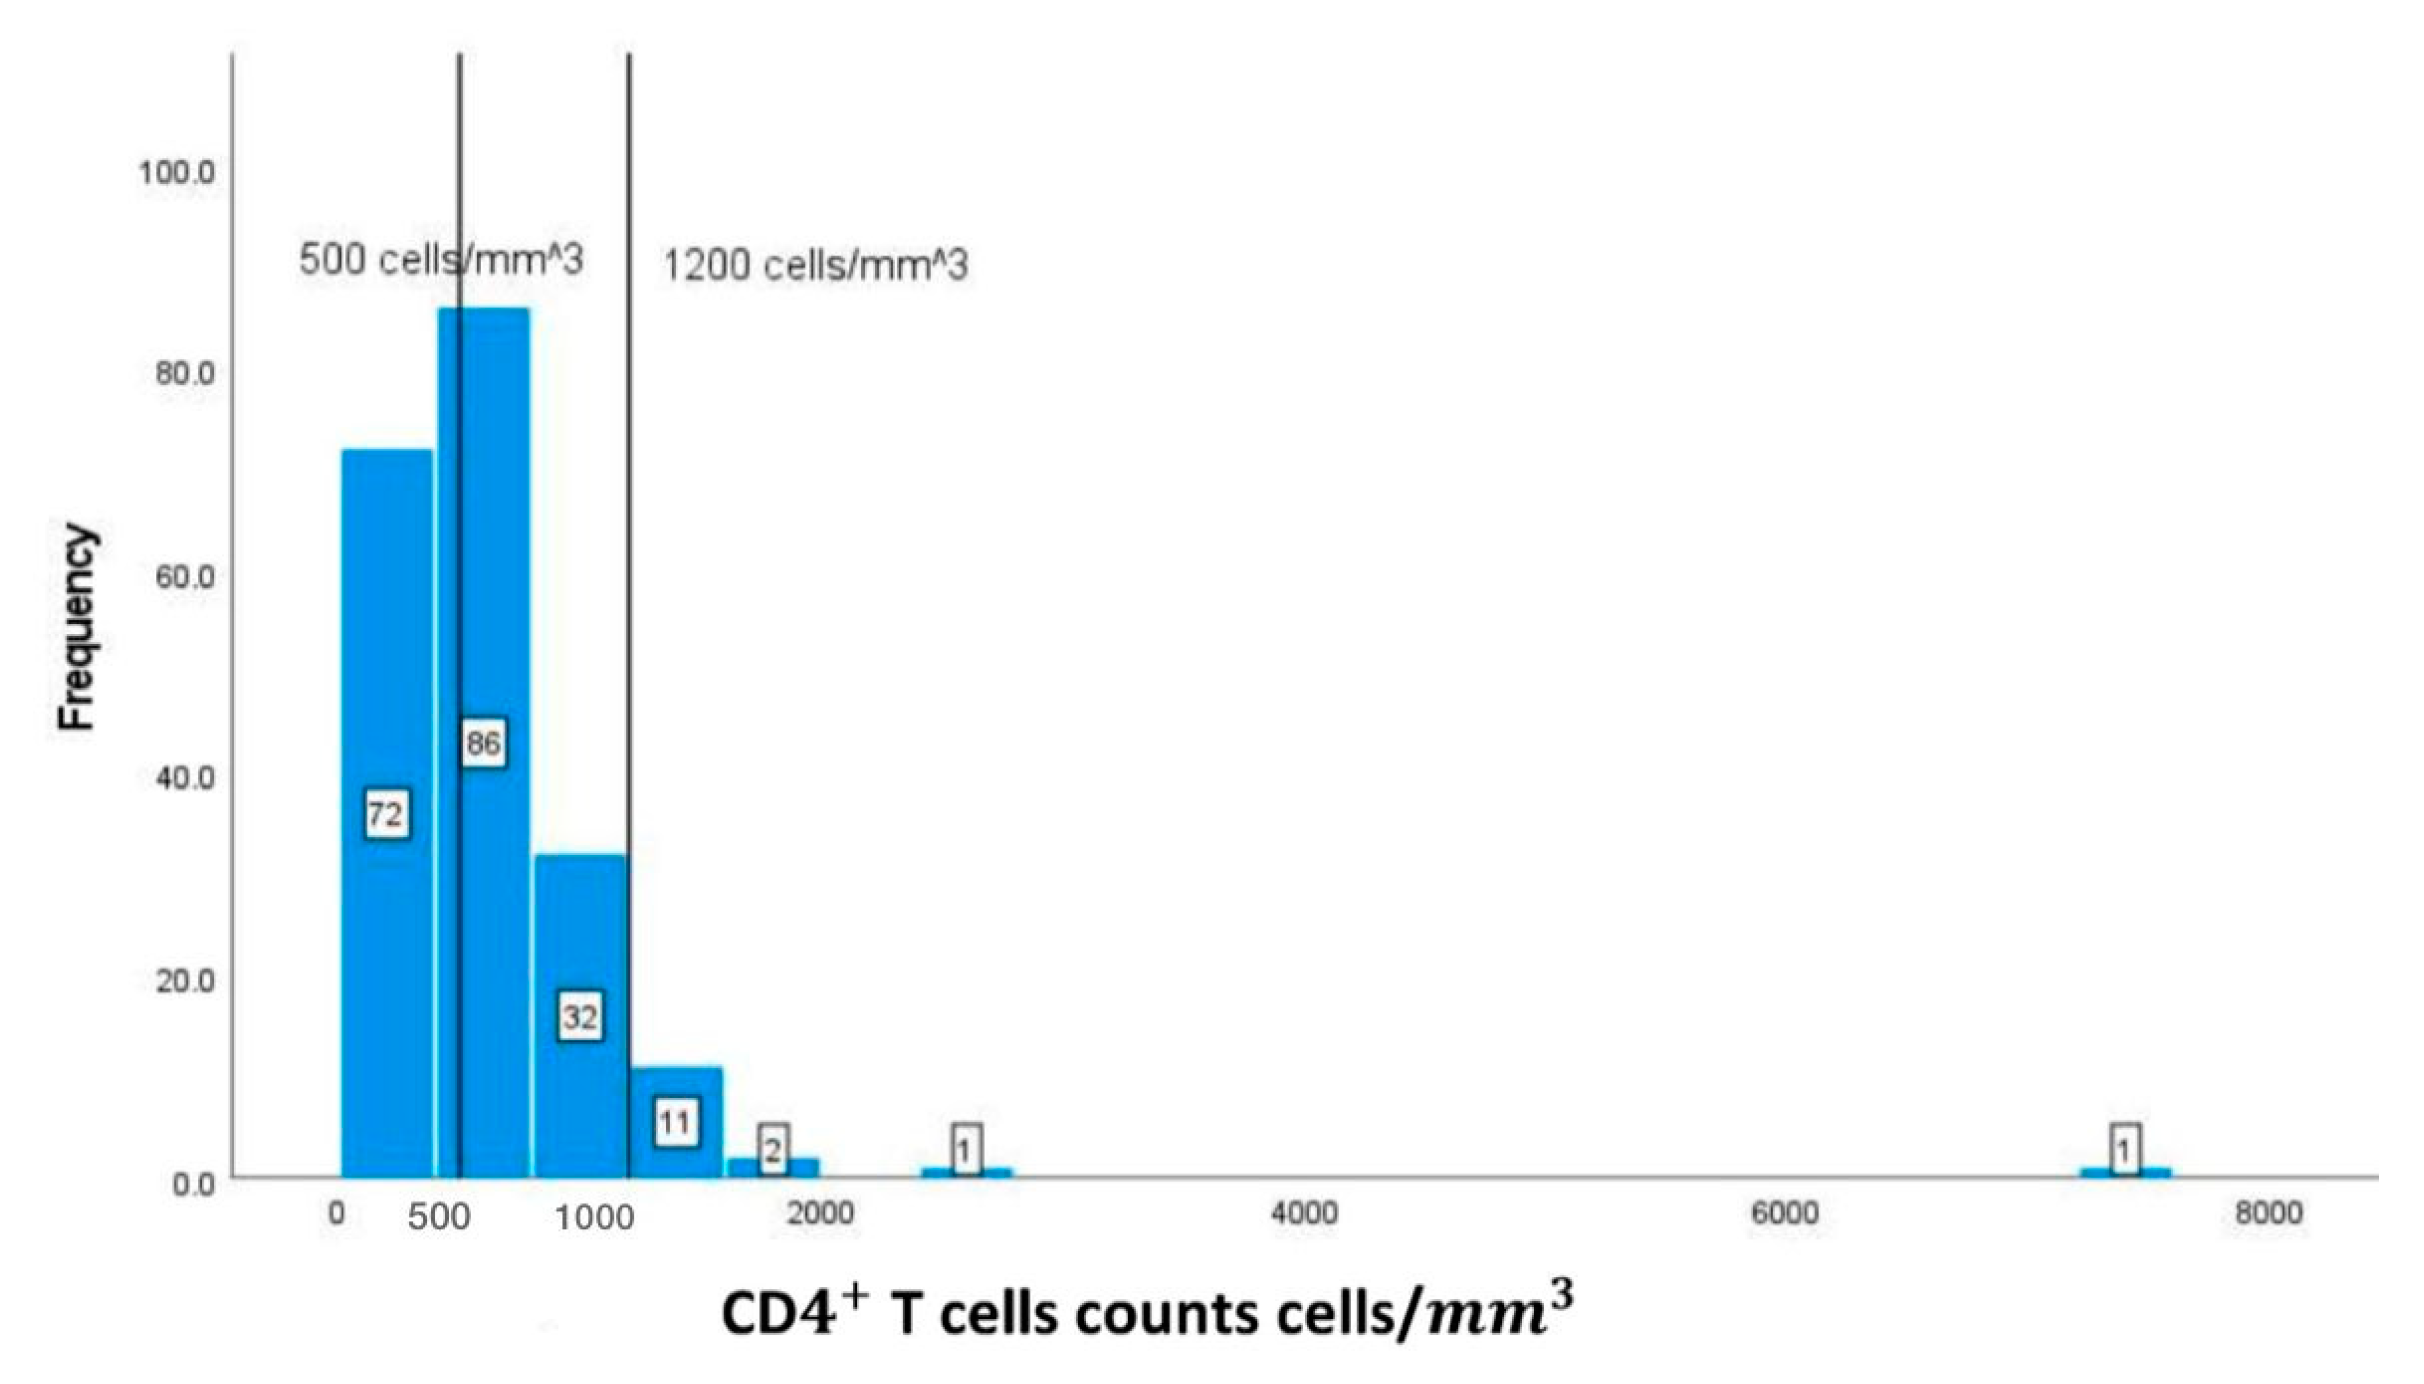
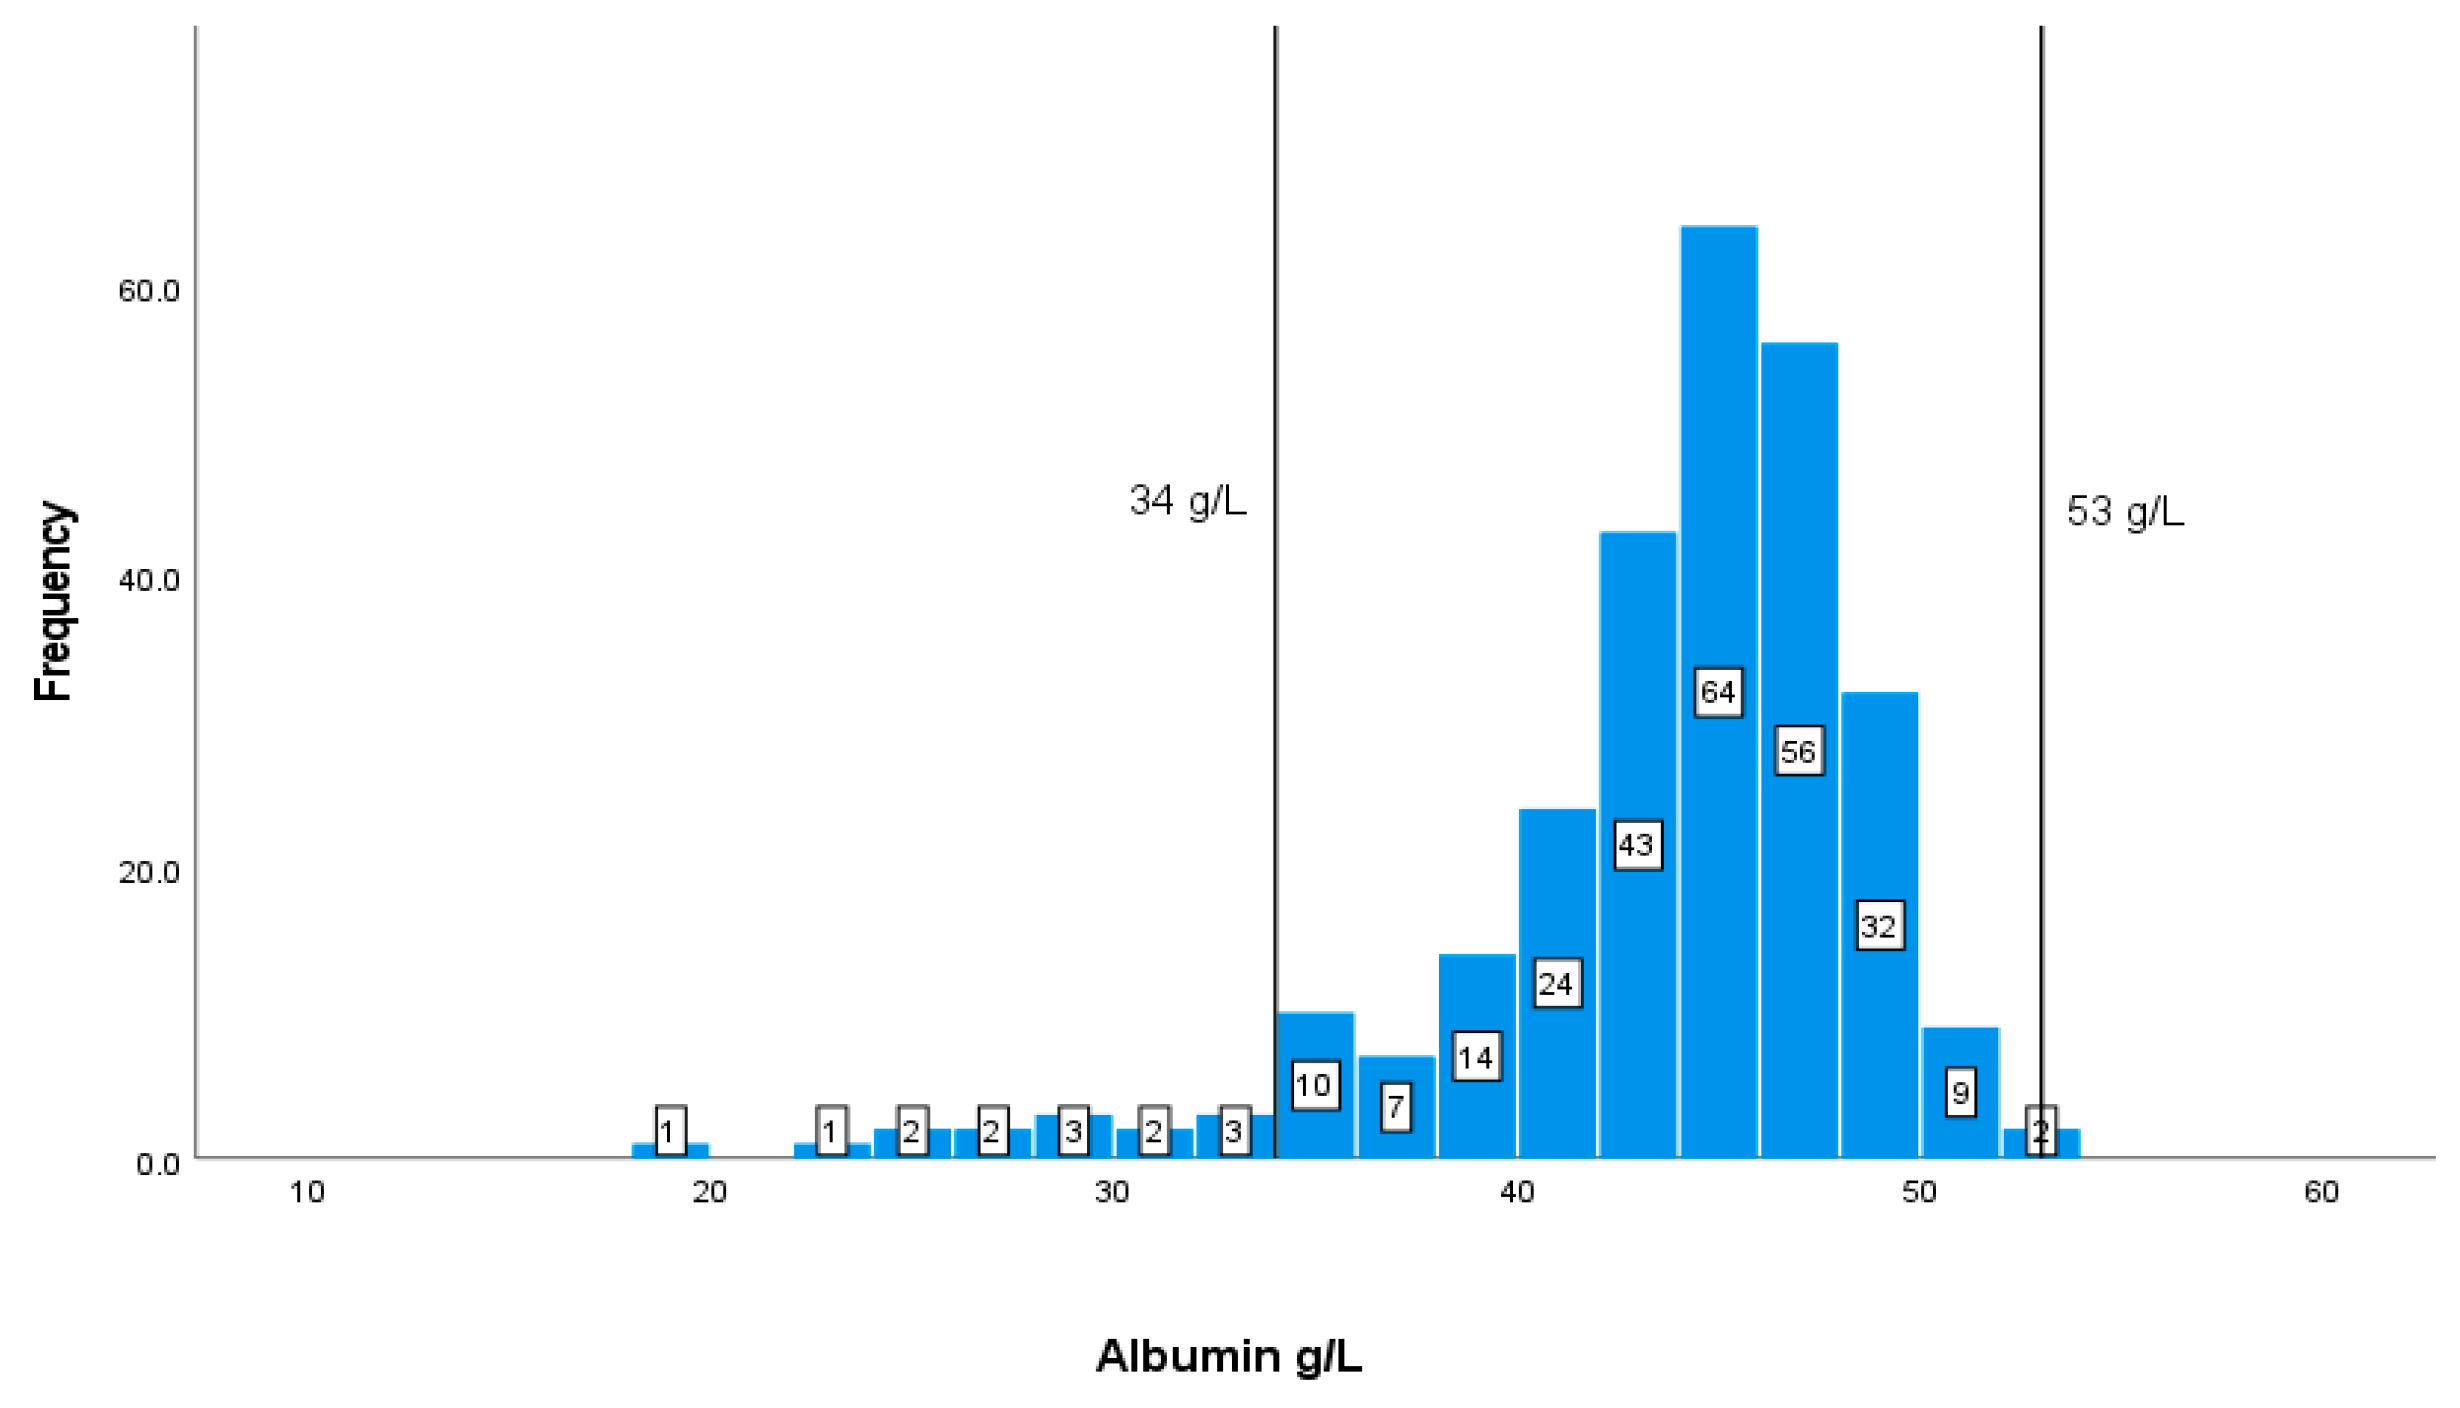
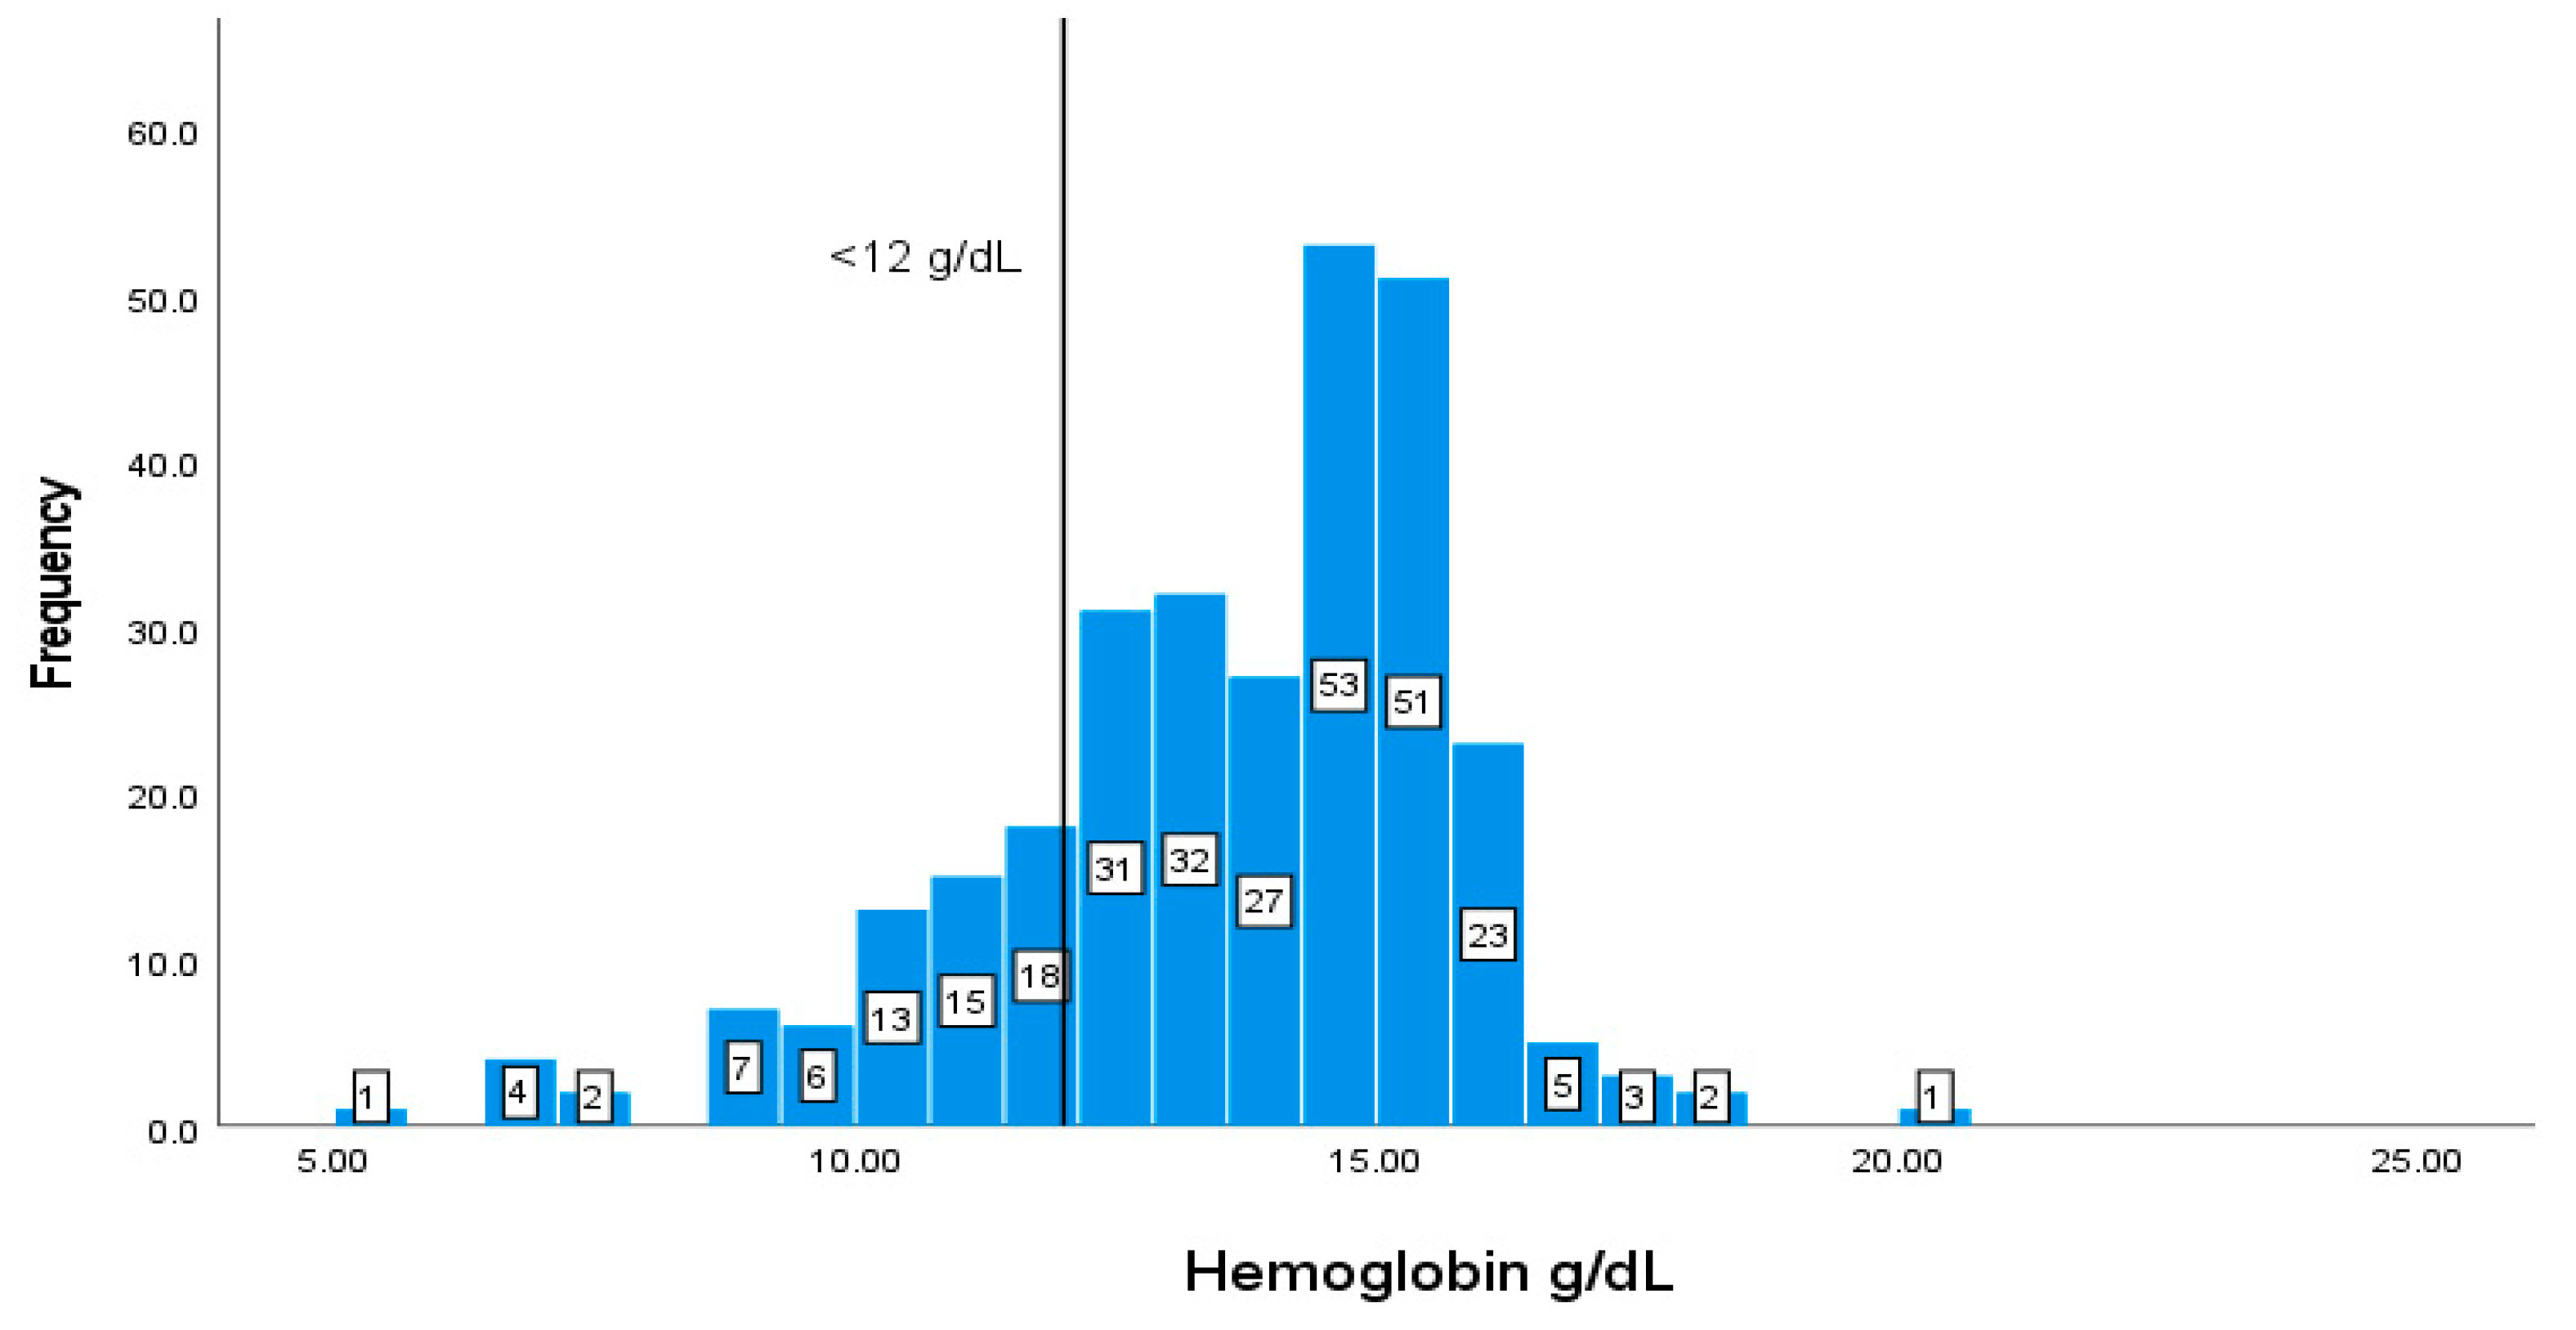
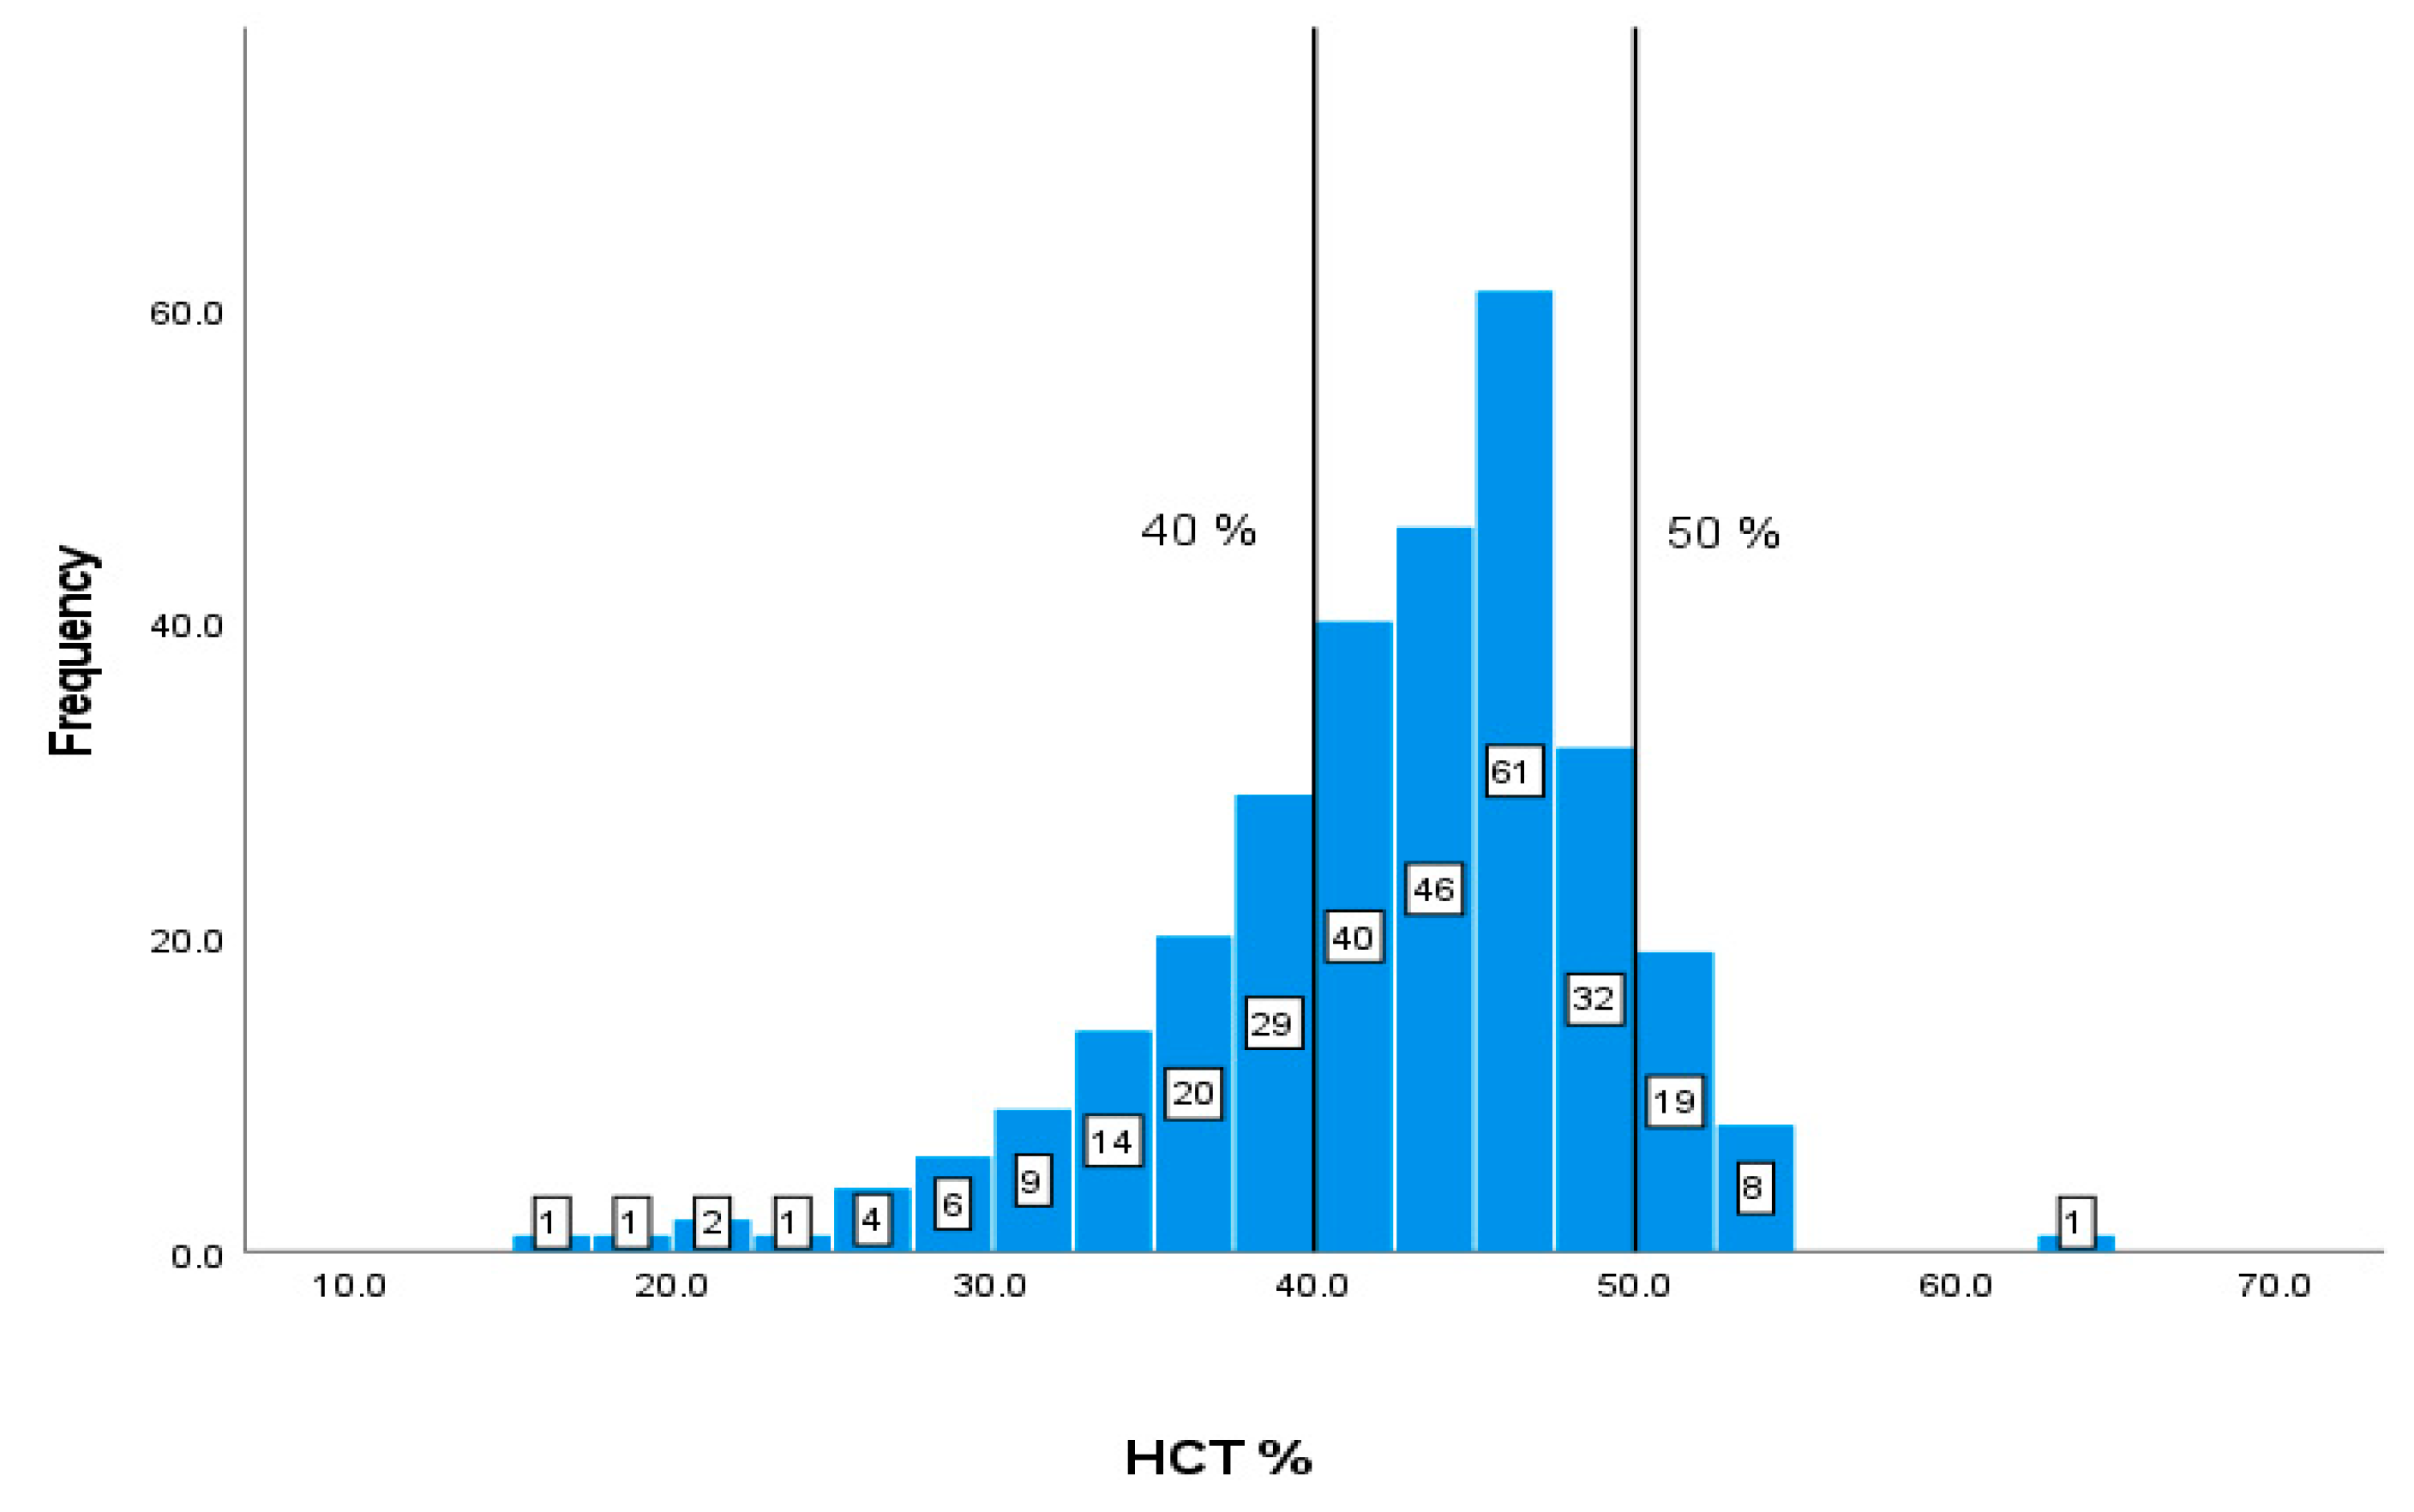
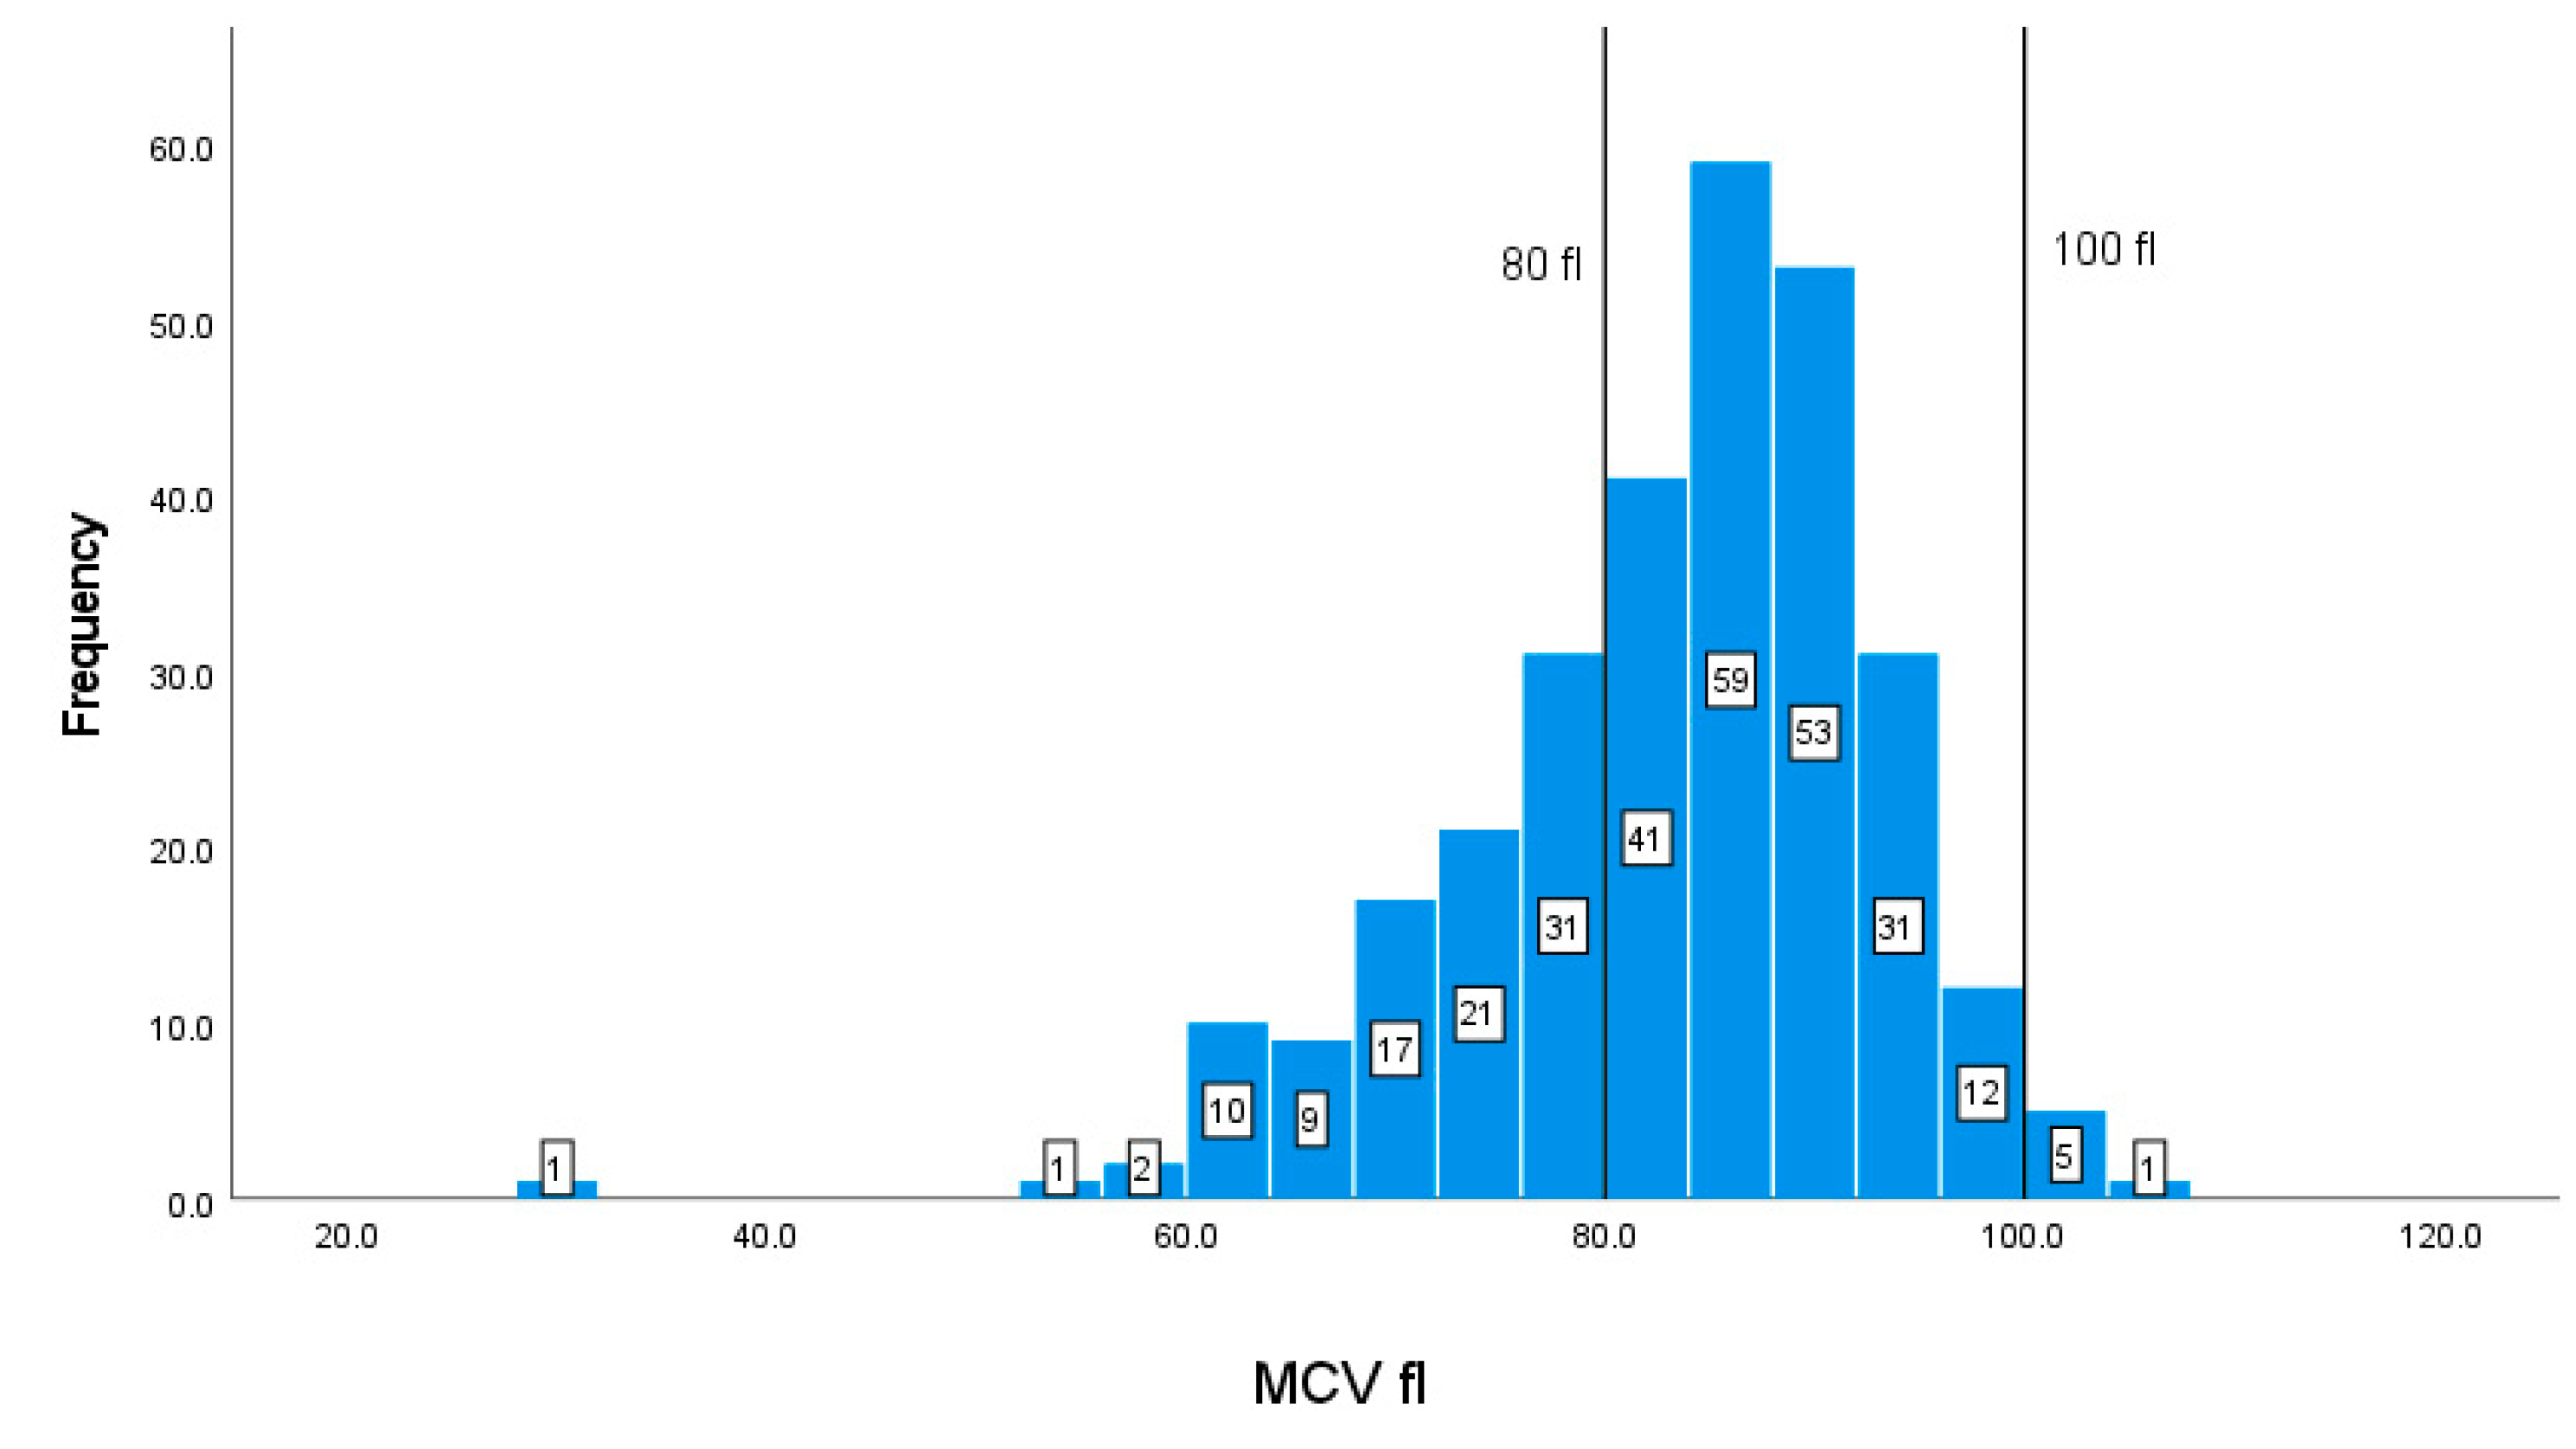
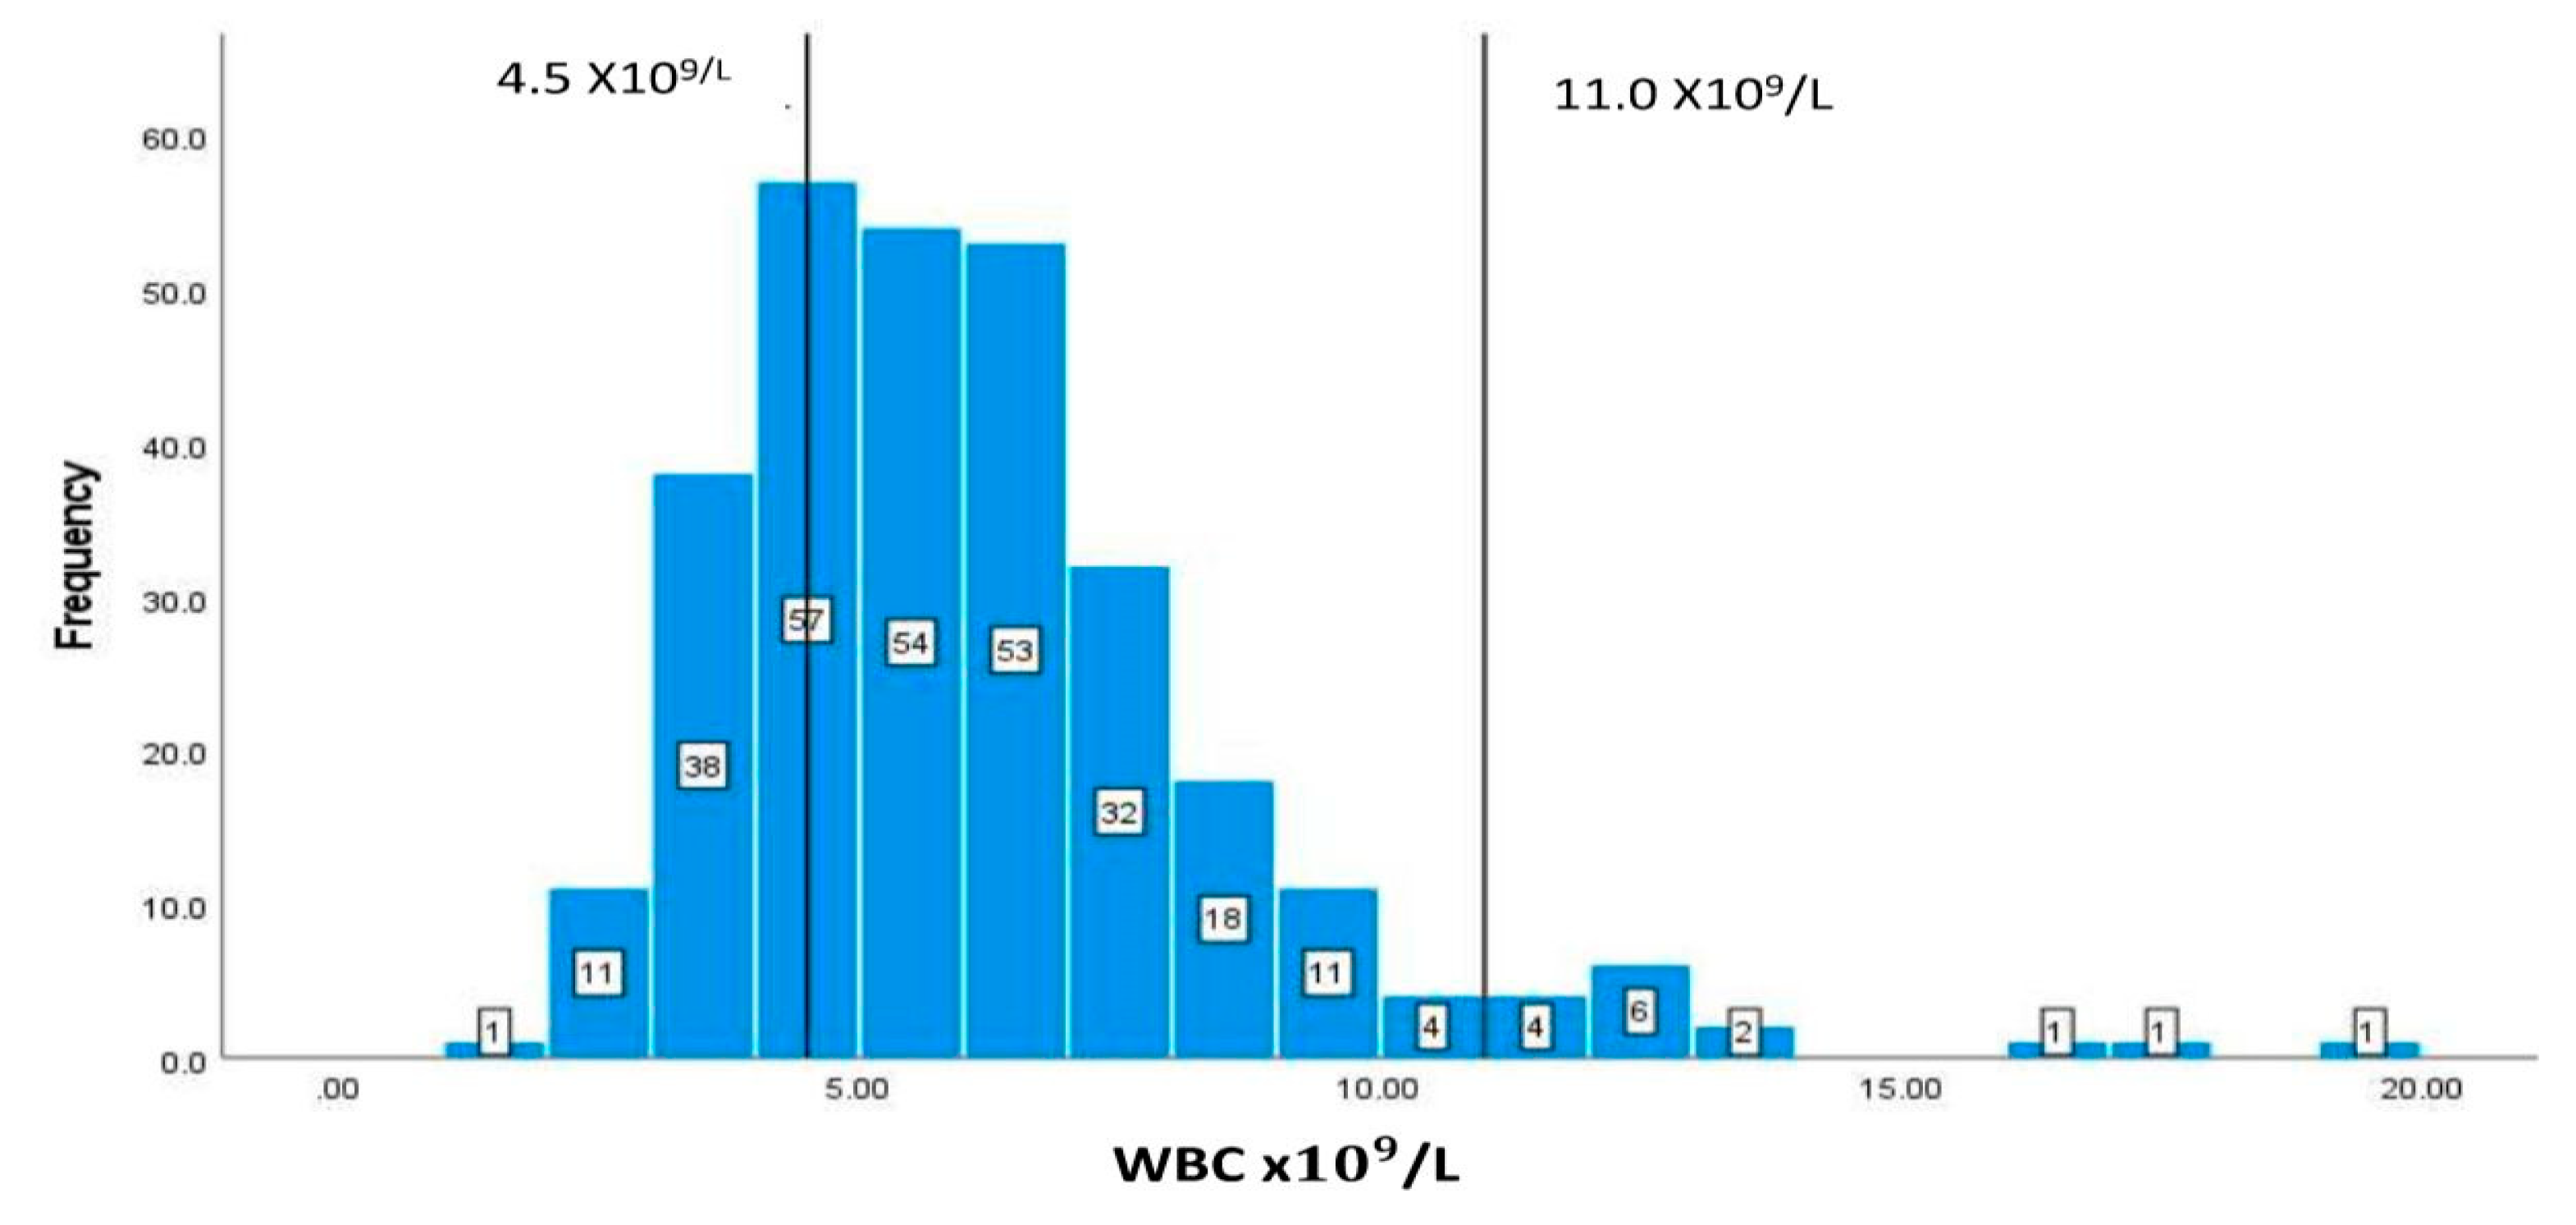
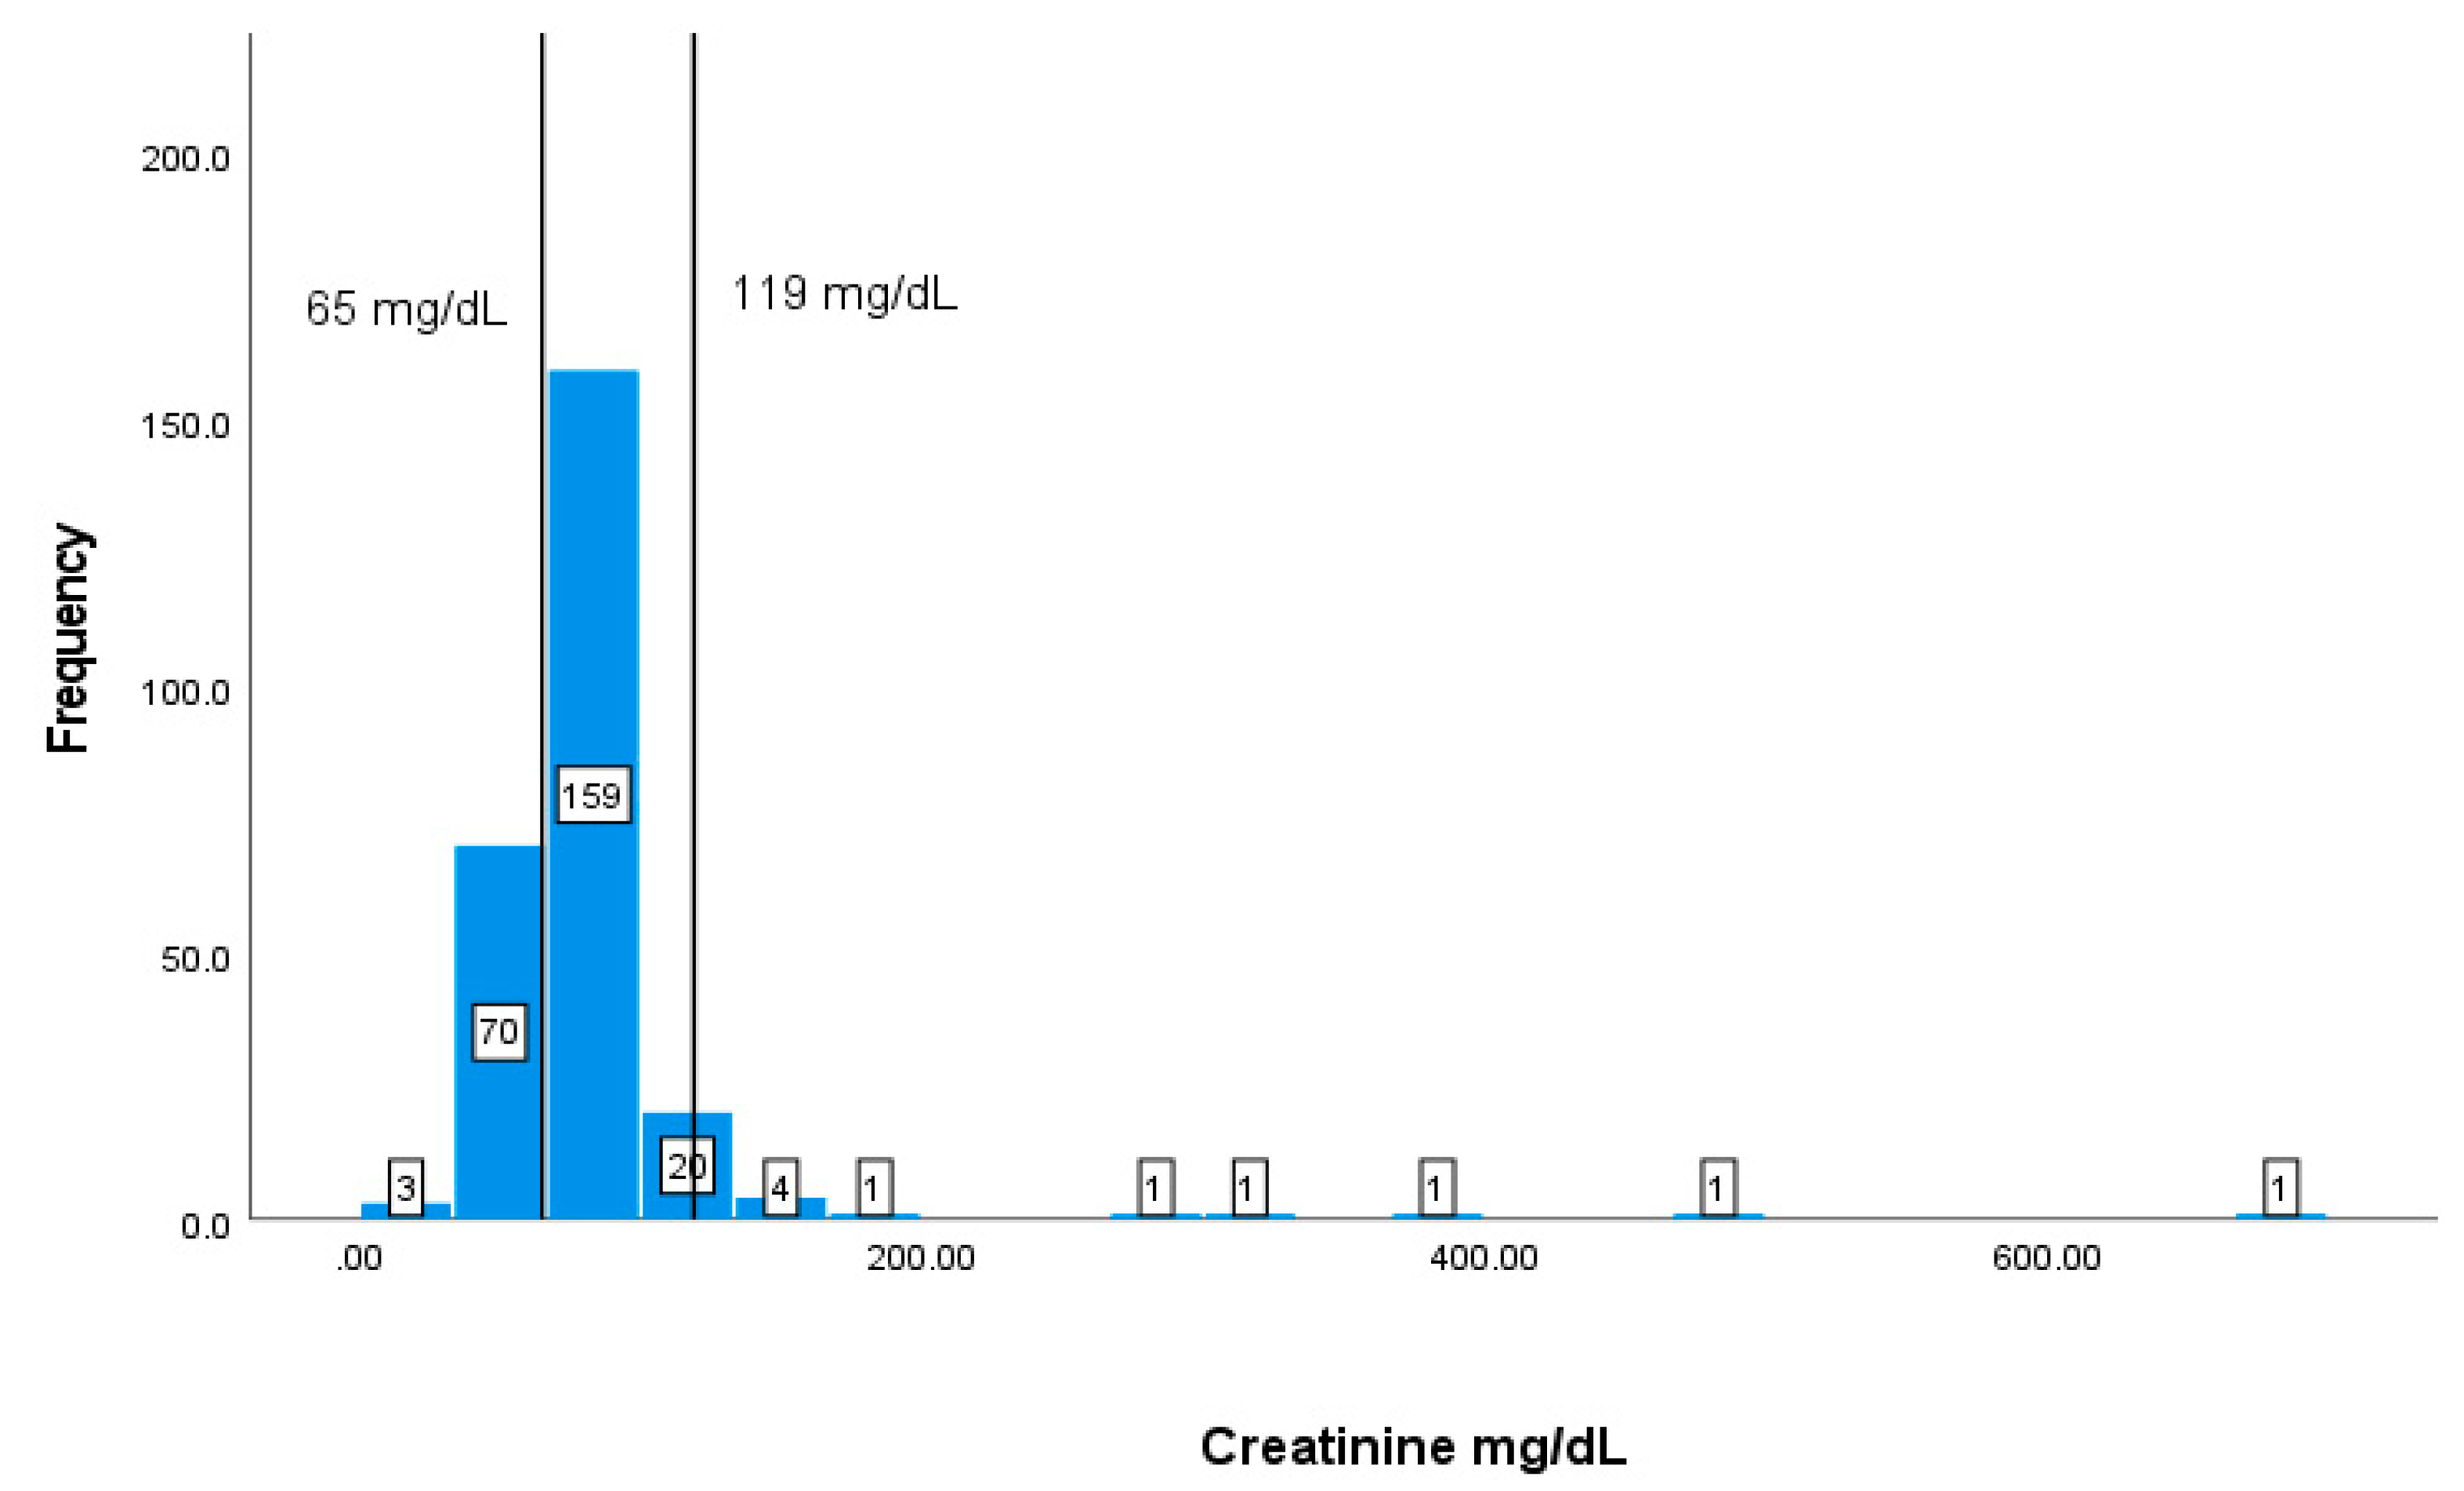
The values and frequencies of the patients’ biochemical markers including CD 4 + T cells counts, albumin, Hb, HCT, MCV, WBC, and creatinine are illustrated in Figure 2, Figure 3, Figure 4, Figure 5, Figure 6, Figure 7 and Figure 8. Values of each biochemical markers were stratified and exemplified as histograms to look at their distribution in comparison to the normal range. Additionally, two vertical lines in each histogram were added to indicate the normal range limit, all values out of their ranges are considered abnormal.
In Figure 2, the normal level of CD 4 + T cells ranges from 500 cells/ m m 3 to 1200 cells/ m m 3 . The graph represents a right-skewed distribution of the data, meaning that the mean is to the right of the median. In addition, participants (94) 45.85% out of the 205 available values for CD 4 + T cells counts have CD 4 + T cells counts below 500 cells/ m m 3 .
The albumin shows a normal distribution of the data. Most of the albumin readings for patients are within the normal range of 35 53 g/L. Available measures of albumin were 275 of which only 14 patients are below the normal level, and none with elevated levels graph (Figure 3).
The values of Hb less than 12 g/dL represent values that are below the recommendation. Most of the patients have normal levels of Hb, in which 61 (20.74%) patients out of 294 have values of less than <12 g/Dl (Figure 4).
Patients (87) 29.59% out of 294 available data have values of HCT % lower than 40% and 28 patients with elevated values of more than 50% (Figure 5).
The normal MCV range is 80 100 fl as shown with vertical lines on the graph. Out of the available 294 patients’ blood data, there are 92 (31.29 %) patients with values less than 80 fl, and only 6 with elevated levels of more than 100 fl (Figure 6).
Table 7 displays the correlation coefficients between all nutritional and biochemical markers. It can be seen from the table that there is a significant correlation between albumin with Hb, HCT, and CD4+T cells (p˂0.01). There is also a significant relation between HCT, Hb, and MCV (p˂0.01).
The linear regression model using nutritional and biochemical markers model was fitted against CD4+T cells (Table 8). It was found that only albumin has a significant coefficient.
CD4+ T cells counts; cluster of differentiation CD4+ T helper cells, Hb: haemoglobin, HCT: hematocrit, MCV: mean corpuscular volume, WBC: White blood cells.
A normal WBC range is 4.5 −11 x 109/L as shown with the vertical lines in Figure 7. Data of this marker represents a skewed to the right distribution similar to the graph of CD4+ T cells counts. In addition, out of the available 294 data, 79 (26.87%) patients have values lower than 4.5 x 10⁹/L and 15 patients with elevated values of more than 11x109/L (Figure 7) and the normal range is 40–50%.
The typical range for creatinine is between 65 119 mg/dL. In this study, patients (73) 27.86% out of 262 available data have creatinine values lower than 65 mg/dL (Figure 8).

4. Discussion

The present study has revealed important information about the nutritional and biochemical markers and the contextual association factors to HIV/AIDS patients in Bahrain. Although, HIV/AIDS patients are more susceptible to malnutrition than the general population [1,28]; the condition of underweight (malnutrition) in this study population was not found, since none of the participants had a BMI lower than 18.5 kg/m2 (underweight), and participants mean BMI value of 27.20 kg/m2 (overweight) was recorded.
It has been well established based on several studies that people living with HIV/AIDS require more energy to compensate for poor absorption and adverse drug effects and recurrent infections [22]. Earlier research suggests that HIV/AIDS patients are generally malnourished and that economy and food insecurity can have deleterious impact on patients’ nutritional status [29]. The findings of several studies revealed higher prevalence of malnutrition among HIV/AIDS patients due to insufficient basic nutritional needs [1,28,30,31,32]. On the contrarily, other studies have shown that over-nutrition (overweight/obesity) are more prevalence among HIV/AIDS patients [33,34]. Similarly, the current study observed that under-nutrition was less common when compared to over-nutrition among participants. Therefore, HIV/AIDS patients in Bahrain are not in food lack, and food abundance is not an issue as none of the participants reported a concern regarding food availability and excess as compared to studies conducted in other regions such as Africa [30], and rural parts of Asia [35].
The analysis of patients’ dietary intake of macronutrients content (total proteins, lipids, and carbohydrates) and total calories in the present study revealed that the majority of patient’s intake were either within or above the recommended RDA levels. These results are consistent with several other studies in which HIV/AIDS patients had sufficient macronutrients intake [33,34]. However, 38.26% of the patients in the present study had insufficient total calories (32.09% among males, and 6.17% among females). Similar dietary pattern was also found in the study of Nti (2012) [30] in Ghana in which HIV/AIDS patient’s total calories were far less of what was recommended by WHO (20% to 30% above RDA) for adults to help maintain body weight in HIV+ individuals [22]. Although most Ghanaian diets are carbohydrate-base, HIV+ individuals protein intakes exceeded the recommended RDA for protein. Inadequate calories intake can result in the use of protein as a source of energy to compensate the body with the insufficient energy [30]. The diet of participants in the current study was found to be undiversified although sufficient to closely reach the RDA recommendations. Findings in this study revealed that there was no variety in the intake of food from various food sources such as fruits, vegetables, higher fibre carbohydrate such as oatmeal, whole grain bread, or brown rice, even though the amounts of food consumed was sufficient among patients. Martín-Cañavate et al. [36] also reported that participants’ diet was not well balanced in term of food choices, whereas Onyango et al. [37] used diversified meal plan that contributed to the resistance to illness and infections in AIDS patients. The association between weight gain, ART and changes in BMI was investigated by several researchers [19,38,39]. They have stated that the risk of muscle wasting and being undernourished in HIV+ patients were reduced as ART treatment period increased. This could be attributed to the fact that ART treatment for long duration improves immunity and reduces risk of frequent infections, diarrhoea, and vomiting resulting in improved appetite, enhanced dietary consumption, and better nutritional status. Patients who were mostly treated with ART/ Highly active antiretroviral therapy (HAART), had nutritional status favoured the higher prevalence of overweight [39]. Therefore, the prevalence of overweight/obese categories among participants in the current study can also be related to the ART treatment protocol carried out in HIV/AIDS patient in SMC. This situation was supported by the participant’s statement that AR has elevated their appetite and caused weight gain. The results of the biochemical marker in the present study has shown a significant positive correlation between CD 4 + T cells counts and the higher BMI kg/ m 2 of patients. Similarly, the study of Khatri et al. [40] has shown that lower BMI is strongly correlated with the progression of AIDS. Thus, negatively affecting weight, and compromised patients’ ability to consume food [40]. Several studies have shown that CD 4 + T cells counts, and albumin levels are the two main markers that can be considered as the first indices to look at in term of AIDS progression. The common association between these studies is that hypoalbuminemia defined as albumin concentrations <34g/L, along with CD 4 + T cells counts below 500 cells/ m m 3   are associated with more rapid progression of AIDS [41,42,43,44,45]. The results of the current study were found to be consistent with those studies since a positive correlation was recorded between CD 4 + T cells and albumin. Several other studies have also shown that haematological abnormalities in haemoglobin, HCT, and MCV were prevalent among HIV/AIDS patients and associated with CD 4 + T cells counts [42,46,47,48]. The results of the current study also found that low haemoglobin, HCT, and MCV were associated with the lower CD 4 + T cells counts.
Elevated creatinine levels along with low CD 4 + T cells counts were found to be significantly associated with renal disease in HIV infected individuals by several studies [49,50]. The majority of participants in current study had normal levels of creatinine, and a negative correlation was found between the CD 4 + T cells counts and creatinine.

5. Conclusion

The study concluded that nutritional status proved to be related to important nutritional and biochemical alterations associated with HIV/AIDS. None of the participants had a BMI lower than 18.5 kg/m2 (underweight). The analysis of patients’ dietary intake of macronutrients content and total calories revealed that the majority of patient’s intake were either within or above the recommended RDA levels. The diet of participants was found to be undiversified but sufficient to closely reach the RDA recommendations. Lower hemoglobin, HCT, albumin, WBC were associated with the lower CD 4 + T cells counts. This association has proven its strong connection to AIDS-defining illness and progression. Higher BMI was associated with lower Hb, HCT, albumin, and WBC. Whereas the decreased levels in hemoglobin and HCT is a pointer to anemia known to be prevalent in HIV patients while the reduction in CD 4 + T cells counts indicates immunosuppressant in the patients. Finally, the HIV/AIDS community is facing two type of nutritional disorders, undernutrition and overweight/obesity, both of which are associated with AIDS progression.

Author Contributions

Methodology, analysis, investigation, original draft preparation, writing, reviewing, and editing the final draft, F.A., and A.F.; analysis and software, F.A., M.A., and A.F.; data curation, J.A., and F.B. All authors read and approved the final version of the manuscript for publication.

Funding

This research did not receive any external funding.

Informed Consent Statement

The purpose of the study was fully explained to the participants and that the information collected will be kept confidential, their anonymity was assured, and that the information would be used for master thesis writing and publication.

Data Availability Statement

Data of the study are available upon request.

Acknowledgments

The authors would like to thank the HIV/AIDS patients for their participation in this study.

Conflicts of Interest

The authors declare no conflict of interests.

References

  1. Suttajit, M. Advances in Nutrition Support for Quality of Life in HIV/AIDS. Asia Pac. Clin. Nutr. 2007, 16, 318–322. [Google Scholar]
  2. Enwereji, E.E.; Ezeama, M.C.; Onyemachi, P.E. Basic Principles of Nutrition, HIV and AIDS: Making Improvements in Diet to Enhance Health. In Nutrition and HIV/AIDS-Implication for Treatment, Prevention and Cure. 2019. [CrossRef]
  3. Scrimshaw, N.S.; SanGiovanni, J. P; Synergism of Nutrition, Infection, and Immunity: an Overview. Am. J. Clin. Nutr. 1997, 66, 464–477. [Google Scholar] [CrossRef] [PubMed]
  4. Colecraft, E. HIV/AIDS: Nutritional Implications and Impact on Human Development. Proc. Nutr. Soc. 2008, 67, 109–113. [Google Scholar] [CrossRef] [PubMed]
  5. Scrimshaw, N.S.; SanGiovanni, J.P. Synergism of Nutrition, Infection, and Immunity: an Overview. Am. J. Clin. Nutr. 1997, 66, 464–477. [Google Scholar] [CrossRef] [PubMed]
  6. Smith, P.D.; Quinn, T.C.; Strober, W.; Janoff, E.N.; Masur, H. Gastrointestinal Infections in AIDS. Ann. Intern. Med. 1992, 116, 63–77. [Google Scholar] [CrossRef] [PubMed]
  7. Süttmann, U.; Ockenga, J.; Selberg, O.; Hoogestraat, L.; Deicher, H.; Müller, M.J. Incidence and Prognostic Value of Malnutrition and Wasting in Human Immunodeficiency Virus-infected Outpatients. Journal of Acquired Immune Deficiency Syndromes and Human Retrovirology: Official Publication of the International Retrovirology Association 1995, 8, 239–246. [Google Scholar] [CrossRef] [PubMed]
  8. Duggal, S.; Chugh, T.D.; Duggal, A.K. HIV and Malnutrition: Effects on Immune System. Clin. Dev. Immunol. 2012, 8, 3–5. [Google Scholar] [CrossRef] [PubMed]
  9. Thiébaut, R.; Daucourt, V.; Mercié, P.; Ekouévi, D.K.; Malvya, D.; Morlat, P.; Dabis, F. Lipodystrophy, Metabolic Disorders, and Human Immunodeficiency Virus Infection: Aquitaine Cohort, France. Clin. Infect. Dis. 2000, 31, 1482–1487. [Google Scholar] [CrossRef]
  10. Heath, K.V.; Hogg, R.S.; Chan, K.J.; Harris, M.; Montessori, V.; O'Shaughnessy, M.V.; Montaner, J.S. Lipodystrophy-associated Morphological, Cholesterol and Triglyceride Abnormalities in a Population-Based HIV/AIDS Treatment Database. AIDS 2001, 15, 231–239. [Google Scholar] [CrossRef]
  11. Linares, M.E.; Bencomo, J.F.; Perez, L.E.; Torrez, O.; Barrera, O. Influence of HIV/AIDS Infection on Some Biochemical Indicators of the Nutritional Status. Biomed. : J. Natl. Inst. Health 2002, 22, 116–122. [Google Scholar] [CrossRef]
  12. Hughes, S.; Kelly, P. Interactions of Malnutrition and Immune Impairment, With Specific Reference to Immunity Against Parasites. Parasite Immunol. 2006, 28, 577. [Google Scholar] [CrossRef] [PubMed]
  13. Soares, R.S.; Tendeiro, R.; Foxall, R.B.; Baptista, A.P.; Cavaleiro, R.; Gomes, P.; Camacho, R.; Valadas, E.; Doroana, M.; Lucas, M.; Antunes, F.; Victorino, R.M.M.; Sousa, A.E. Cell-associated Viral Burden Provides Evidence of Ongoing Viral Replication in aviremic HIV-2-infected Patients. J. Virol. 2011, 85, 2429–2438. [Google Scholar] [CrossRef] [PubMed]
  14. Sicotte, M.; Bemeur, C.; Diouf, A.; Zunzunegui, M.V.; Nguyen, V.K. Nutritional Status of HIV-infected Patients During the First Year HAART in Two West African cohorts. J. Health Popul. Nutr. 2015, 34, 1–10. [Google Scholar] [CrossRef] [PubMed]
  15. Thuppal, S.V.; Jun, S.; Cowan, A.; Bailey, R.L. The Nutritional Status of HIV-infected US Adults. Curr. Dev. Nutr. 2017, 10, 163. [Google Scholar] [CrossRef] [PubMed]
  16. Bell, C.; Devarajan, S.; Gersbach, H. The Long-run Economic Costs of AIDS: A Model with an Application to South Africa. World Bank Econ. Rev. 2006, 20, 55–89. [Google Scholar] [CrossRef]
  17. Ivers, L.C.; Cullen, K.A.; Freedberg, K.A.; Block, S.; Coates, J.; Webb, P.; Mayer, K.H. HIV/AIDS, Undernutrition, and Food Insecurity. Clin. Infect. Dis. 2009, 49, 1096–1102. [Google Scholar] [CrossRef] [PubMed]
  18. Hailemariam, S.; Bune, G.T.; Ayele, H.T. Malnutrition: Prevalence and its Associated Factors in People Living with HIV/AIDS, in Dilla University Referral Hospital. Arch. Public Health 2013, 71, 13. [Google Scholar] [CrossRef]
  19. Yuh, B.; Tate, J.; Butt, A.A.; Crothers, K.; Freiberg, M.; Leaf, D.; Justice, A.C. Weight Change After Antiretroviral Therapy and Mortality. Clin. Infect. Dis. 2015, 60, 1852–1859. [Google Scholar] [CrossRef]
  20. Willett, W. Monographs in Epidemiology and Biostatistics: Nutritional Epidemiology Vol. 40 3rd Ed. Oxford university press 2012. [Google Scholar]
  21. Mulberry Soft. Health & Fitness: Diet Controller (2.1.0) 2021. /: Available online: http.
  22. WHO: World Health Organization. Nutrient Requirements for People Living with HIV 2004. Available online: http://apps.who.int/iris/bitstream/handle/10665/42853/9241591196.
  23. Byrd-Bredbenner, C.; Moe, G.; Berning, J.; Kelley, D. Wardlaw's Perspectives in Nutrition (pp. 187-219). McGraw-Hill Higher Education 2013.
  24. Dietz, W.H.; Bellizzi, M. C. Introduction: the use of body mass index to assess obesity in children. Am. J. Clin. Nutr. 1999, 70, 123–125. [Google Scholar] [CrossRef]
  25. Weir, C.B.; Jan, A. BMI Classification Percentile and Cut Off Points. State Pearls Publishing, Treasure Island Florida 2019; 3108-2114.
  26. Width, M.; Reinhard, T. The Essential Pocket Guide for Clinical Nutrition (2nd Ed). Wolters Kluwer 2018. [Google Scholar]
  27. Tinarwo, P.; Zewotir, T.; North, D. Trends and Adaptive Optimal Set Points of CD4+ Count Clinical Covariates at Each Phase of the HIV Disease Progression. AIDS Res. Treat. 2020, 14, 1–10. [Google Scholar] [CrossRef] [PubMed]
  28. Benzekri, N.A.; Sambou, J.; Diaw, B.; Sall, E.H.I.; Sall, F.; Niang, A.; Gottlieb, G.S. High Prevalence of Severe Food Insecurity and Malnutrition Among HIV-infected Adults in Senegal, West Africa. Public Libr. Sci. One 2015, 10, 141819. [Google Scholar] [CrossRef] [PubMed]
  29. Dannhauser, A.; Van Staden, A.M.; Van der Ryst, E.; Nel, M.; Marais, N.; Erasmus, L.; Roux, G.D. Nutritional Status of HIV-1 Seropositive Patients in the Free State Province of South Africa: Anthropometric and Dietary Profile. Eur. J. Clin. Nutr. 1999, 53, 165–173. [Google Scholar] [CrossRef]
  30. Nti, C.A.; Hayford, J.; Opare-Obisaw, C. Nutrition knowledge, Diet Quality and Nutritional Status of People Living with HIV (PLHIV) in Ghana. Food Public Health.
  31. Mutisya, M.; Kandala, N.B.; Ngware, M.W.; Kabiru, C.W. Household Food (in) Security and Nutritional Status of Urban Poor Children Aged 6 to 23 Months in Kenya. BMC Public Health 2015, 15, 1–10. [Google Scholar] [CrossRef]
  32. Gebremichael, D.Y.; Hadush, K.T.; Kebede, E.M.; Zegeye, R.T. Food Insecurity, Nutritional Status, and Factors Associated with Malnutrition Among People Living with HIV/AIDS Attending Antiretroviral Therapy at Public Health Facilities in West Shewa Zone, Central Ethiopia. BioMed Res. Int. 2018, 9, 2–7. [Google Scholar] [CrossRef]
  33. Amorosa, V.; Synnestvedt, M.; Gross, R.; Friedman, H.; MacGregor, R.; Gudonis, D.; Tebas, P.A. Tale of 2 Epidemics: The Intersection Between Obesity and HIV Infection in Philadelphia. J. Acquir. Immune Defic. Syndr. 2005, 39, 557–561. [Google Scholar]
  34. Takarinda, K.C.; Mutasa-Apollo, T.; Madzima, B.; Nkomo, B.; Chigumira, A.; Banda, M.; Mugurungi, O. Malnutrition Status and Associated Factors Among HIV-positive Patients Enrolled in ART Clinics in Zimbabwe. Boston Med. Cent. Nutr. 2017, 3, 1–11. [Google Scholar] [CrossRef]
  35. He, Z.; Ji, C. Nutritional Status, Psychological Well-being, and the Quality of Life of AIDS Orphans in Rural Henan Province, China. Trop. Med. Int. Health 2007, 12, 1180–1190. [Google Scholar] [CrossRef]
  36. Martín-Cañavate, R.; Sonego, M.; Sagrado, M. J.; Escobar, G.; Rivas, E.; Ayala, S.; Custodio, E. Dietary patterns and Nutritional Status of HIV-infected Children and Adolescents in El Salvador: A cross-sectional Study. Public Libr. Sci. Open J. 2018, 13, 13,196–380. [Google Scholar] [CrossRef]
  37. Onyango, A.C.; Walingo, M.K.; Mbagaya, G.; Kakai, R. Assessing Nutrient Intake and Nutrient Status of HIV Seropositive Patients Attending Clinic at Chulaimbo Sub-District Hospital, Kenya. J. Nutr. Metab. 2012, 9, 1–7. [Google Scholar] [CrossRef] [PubMed]
  38. Villamor, E.; Saathoff, E.; Manji, K.; Msamanga, G.; Hunter, D. J.; Fawzi, W. Vitamin Supplements, Socioeconomic Status, and Morbidity Events as Predictors of Wasting in HIV-infected women from Tanzania. Am. J. Clin. Nutr. 2005, 82, 857–865. [Google Scholar] [CrossRef] [PubMed]
  39. Castro, A.D.; Silveira, E.A.; Falco, M.D.; Nery, M.W.; Turchi, M.D. Overweight and Abdominal Obesity in Adults Living with HIV/AIDS. , J. Braz. Med. Assoc. 2016, 62, 353–360. [Google Scholar] [CrossRef] [PubMed]
  40. Khatri, S.; Amatya, A.; Shrestha, B. Nutritional Status and the Associated Factors Among People Living with HIV: An Evidence from Cross-Sectional Survey in Hospital Based Antiretroviral Therapy Site in Kathmandu, Nepal. Boston Med. Cent. Nutr. 2020, 6, 1–13. [Google Scholar] [CrossRef] [PubMed]
  41. Stambullian, M.; Feliu, S.; Slobodianik, N. H. Nutritional Status in Patients with HIV infection and AIDS. Br. J. Nutr. 2007, 98, 140–143. [Google Scholar] [CrossRef] [PubMed]
  42. Obirikorang, C.; Yeboah, F.A. Blood Haemoglobin Measurement as a Predictive Indicator for the Progression of HIV/AIDS in Resource-limited Setting. J. Biomed. Sci. 2009, 16, 1–7. [Google Scholar] [CrossRef]
  43. Santos, A.C.O. D.; Almeida, A.M.R. Nutritional status and CD4 Cell Count in Patients with HIV/AIDS Receiving Antiretroviral Therapy. J. Braz. Soc. Trop. Med. 2013, 46, 698–703. [Google Scholar] [CrossRef]
  44. Leal, J.A.; Fausto, M.A.; Carneiro, M.; Tubinambás, U. Prevalence of Hypoalbuminemia in Outpatients with HIV/AIDS. J. Braz. Soc. Trop. Med. 2018, 51, 203–206. [Google Scholar] [CrossRef]
  45. Aurpibul, L.; Namwongprom, S.; Sudjaritruk, T.; Ounjaijean, S. Metabolic Syndrome, Biochemical Markers, and Body Composition in Youth Living with Perinatal HIV Infection on Antiretroviral Treatment. Public Libr. Sci. One 2020, 15, 230–707. [Google Scholar] [CrossRef]
  46. Tagoe, D.N.A.; Asantewaa, E. Profiling Haematological Changes in HIV Patients Attending Fevers Clinic at the Central Regional Hospital in Cape Coast, Ghana: A case-control Study. Arch. Appl. Sci. Res. 2011, 3, 326–331. [Google Scholar]
  47. Ositadinma, I.M.; Ikponmwosa, O.S.; Okechukwu, O.C. Haemorheology and Red Cell indices in HIV Positive Individuals on Antiretroviral Therapy in Delta State, Nigeria. Int. J. Curr. Res. Rev. 2015, 7, 24. [Google Scholar]
  48. Lumbanraja, S.N.; Siregar, D.I.S. Association Between Red Blood Cell Indices and CD4 count in HIV-positive Reproductive Women. Institute of Physics Conference Series: Earth Environ. Sci. 2018, 125, 12–27. [Google Scholar] [CrossRef]
  49. Gardner, L.I.; Holmberg, S.D.; Williamson, J.M.; Szczech, L.A.; Carpenter, C.C.; Rompalo, A.M. HIV Epidemiology Research Study Group. Development of Proteinuria or Elevated Serum Creatinine and Mortality in HIV-infected Women. J. Acquir. Immune Defic. Syndr. 2003, 32, 203–209. [Google Scholar] [CrossRef] [PubMed]
  50. Adedeji, T.A.; Adedeji, N.O.; Adebisi, S.A.; Idowu, A. A.; Fawale, M. B.; Jimoh, K. A. Prevalence and Pattern of Chronic kidney Disease in Antiretroviral patients with HIV/AIDS. J. Int. Assoc. Provid. AIDS Care 2015, 14, 434–440. [Google Scholar] [CrossRef]
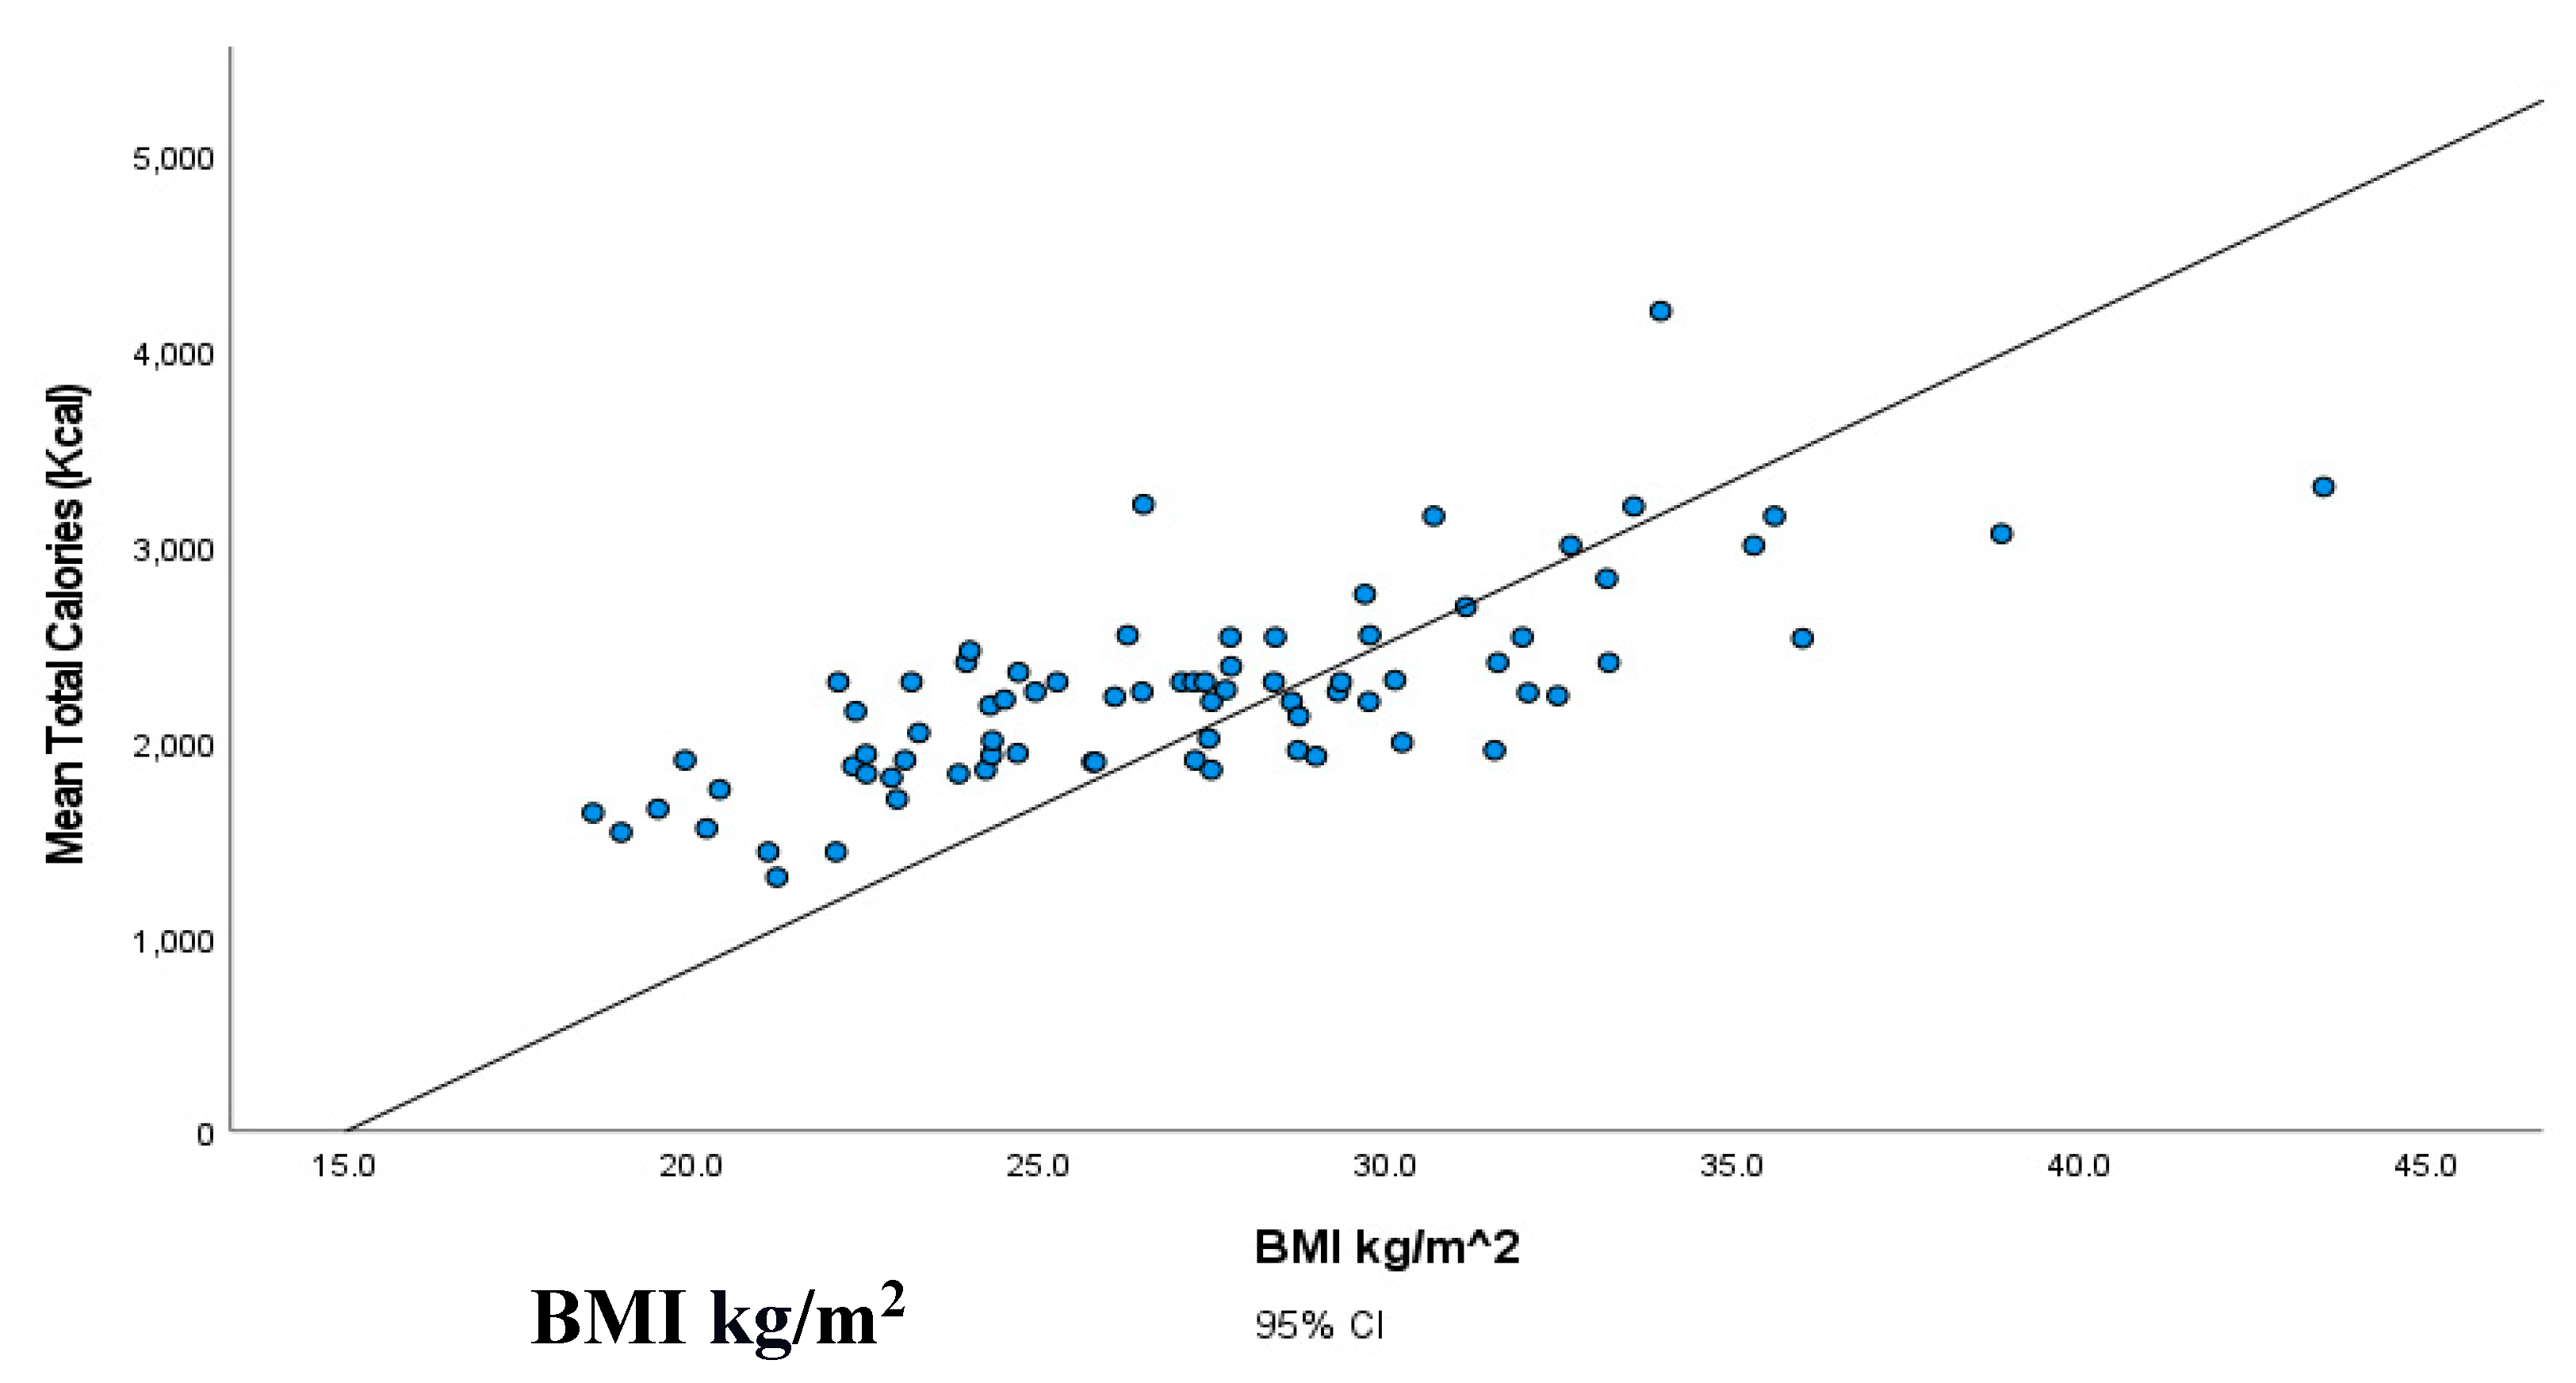
Figure 1. Illustration of the association between total calories (Kcal) and body mass index (BMI) (kg/m2).
Preprints 72955 g001
Figure 2. Patients’ classification frequencies (histograms) of CD 4 +
Preprints 72955 g002
Figure 3. Patients ‘classification frequencies of albumin among patients.
Preprints 72955 g003
Figure 4. Patients’ classification frequencies of Haemoglobin among patients.
Preprints 72955 g004
Figure 5. Patients’ classification frequencies (histograms) of HCT % among patients.
Preprints 72955 g005
Figure 6. Patients’ classification frequencies (histograms) of MCV among patients.
Preprints 72955 g006
Figure 7. Patients’ classification frequencies (histograms) of WBC among patients.
Preprints 72955 g007
Figure 8. Patients’ classification frequencies (histograms) of creatinine among patients.
Preprints 72955 g008
Table 1. Selected demographic characteristic of the study population.
Patients’ characteristics N %
Age range (year) 22-85
Gender
Male
Female

248 (80.51%)
52 (16.88%)
Nationality
Bahraini

308
Education
Primary 14 (17.28%)
Intermediate 13 (16.04%)
Secondary 32 (39.50%)
Diploma/ B.Sc. 21 (25.92%)
Higher education 1 (1.23%)
Table 2. Daily consumption of selected food from carbohydrate, protein, caffeinated drinks, vegetables, and fruits.
Selected food Count (n) % Responses
Carbohydrate
White bread 73 90.12%
White rice 64 79.01%
Potatoes 15 18.51%
Protein
Eggs 45 55.55%
Yogurt 31 38.27%
Beans 6 7.40%
Caffeinated drinks
Tea 75 92.59%
Coffee 56 69.13%
Soft drinks 5 6.17%
Vegetables
Arugula (rocket) 45 55.55%
Onions 39 48.14%
Tomatoes 25 30.86%
Fruits
Apples 51 62.96%
Oranges 32 39.50%
Table 4. Description of subjects BMI classification.
*BMI Classification
Normal (n)
18.5-24.9
Overweight (n)
25-29.9
Obese class I (n)
30-34.9
Obese class II (n)
35-39.9
Obese class III (n)
≥ 40
Classification n of participant 31 30 15 4 1
% 38.27 37.03 18.51 4.93 1.23
BMI = Body mass index *[25].
Table 5. Two-tailed Pearson correlation between BMI and macronutrients content of diet.
BMI kg/m2 Total calories (kcal/day) Total carbohydrates (g/dL) Total lipids (g/dL)
Total calories (kcal/day) Correlation 0.740**
p-value 0.000
Total carbohydrates (g/dL) Correlation 0.744* 0.907*
p-value 0.000 0.000
Total lipids (g/dL) Correlation 0.701* 0.862* 0.867*
p-value 0.000 0.000 0.000
Total proteins (g/day) Correlation 0.715* .814* 0.746* 0.695*
p-value 0.000 0.000 0.000 0.000
*Correlation is significant at p <0.01.
Table 6. The mean, standard deviation of the chosen markers.
Markers *Reference range Mean   ± SD
CD 4 + T cells counts (500-1200 cells/ m m 3 ) 620.91 ± 673.40
Albumin (35-53 g/L) 42.77 ± 5.62
Hb Male: (14-18 g/L)Female: (12-16 g/L) 13.51 ± 2.31
HCT 40-50 % 42.15 ± 7.03
MCV 80-100 fl 83.13 ± 10.28
WBC 4.5-11 x 10 9 /L 6.16 ± 2.59
Creatinine 65-119 mg/dL 84.19 ± 57.28
CD 4 + T cells counts; cluster of differentiation CD4+ T helper cells, Hb: haemoglobin, HCT: hematocrit, MCV: mean corpuscular volume, WBC: White blood cells * [26,27].
Table 7. Two-tailed Pearson correlation between nutritional and biochemical markers.
Albumin Cr Hb HCT WBC MCV
Creatinine Correlation coefficient -0.136
p-value 0.069
Hb Correlation coefficient .619** 0.104
p-value 0 0.148
HCT Correlation coefficient .612** 0.081 .933**
p-value 0 0.255 0
WBC Correlation coefficient -0.016 0.068 -0.026 -0.008
p-value 0.821 0.342 0.706 0.911
MCV Correlation coefficient 0.091 0.046 .374** .349** 0.071
p-value 0.2 0.52 0 0 0.293
CD4+T cells Correlation coefficient .271** -0.02 0.161 .183* .165* -0.041
p-value 0.002 0.817 0.053 0.027 0.047 0.627
CD4+ T cells counts; cluster of differentiation CD4+ T helper cells, Hb: haemoglobin, HCT: hematocrit, MCV: mean corpuscular volume, WBC: White blood cells, Cr: creatinine; * Correlation is significant at p value ˂0.05 level. **Correlation is significant at p value ˂0.01 level.
Table 8. Regression analysis against CD 4 + T cells counts.
Model Coefficients t Sig.
B Std. Error
(Constant) -801.898 782.798 -1.024 0.308
Albumin 39.275 16.353 2.402 0.018
Creatinine -0.049 1.013 -0.048 0.961
Hb -34.312 104.535 -0.328 0.743
HCT 19.406 35.736 0.543 0.588
WBC 46.563 27.002 1.724 0.087
MCV -11.122 6.903 -1.611 0.110
Disclaimer/Publisher’s Note: The statements, opinions and data contained in all publications are solely those of the individual author(s) and contributor(s) and not of MDPI and/or the editor(s). MDPI and/or the editor(s) disclaim responsibility for any injury to people or property resulting from any ideas, methods, instructions or products referred to in the content.
Copyright: This open access article is published under a Creative Commons CC BY 4.0 license, which permit the free download, distribution, and reuse, provided that the author and preprint are cited in any reuse.
Prerpints.org logo

Preprints.org is a free preprint server supported by MDPI in Basel, Switzerland.

Subscribe

© 2024 MDPI (Basel, Switzerland) unless otherwise stated