Introduction
Indirect calorimetry (IC) is a widely used method to study the energy metabolism of animals and humans by directly measuring gas exchange (O
2 and CO
2). The heat production (HP) calculation is based on the principle of the volumetric stoichiometry of oxygen consumed (VO
2), carbon dioxide produced (VCO
2), and heat released from the oxidative process [
1]. Recently, this method has gained interest from poultry researchers for supporting studies on energy metabolism and developing net energy systems [
2,
3,
4,
5].
IC accurately assesses the HP of animals under different environmental conditions, energy utilization from feeds, and other temporal measurements [
2,
3,
6]. Over the years, advancements in gas analyzer technologies, data acquisition systems, and computing power have improved the accuracy of measurements [
7,
8]. However, to ensure the quality and accuracy of results, trained technicians are required to conduct biological trials, handle equipment properly, and acquire data adequately [
9].
The accuracy of an IC system depends on the ability to detect and record variations in signals that reflect the metabolic or physiological animal response, which the researcher will later interpret [
10,
11]. Several procedures have been developed to check the accuracy of the IC, including alcohol or propane gas combustion, alcohol evaporation, continuous gas injection, and specific volume gas injection. However, some methods have limitations, such as low sensitivity, difficulty in the calculation, expensive materials or substances, and time-consuming procedures. Therefore, the recovery test should be flexible to accommodate the diversity of IC systems and the research objective. Still, it must simulate the experimental conditions of a biological trial, considering the flow used and the delta of CO
2 and O
2 observed when measurements were made in animals inside the chamber.
The open-circuit system integrated into the trough airflow of pull-mode calorimetric chambers is commonly used in farm animal trials [
2,
3,
6,
9,
12]. This system measures the concentration of gases (O
2 and CO
2) and the rate of change when considering the flow of air from the atmosphere into the chamber, and the volume of gas exchanged (VO
2 and VCO
2) over time can be calculated. However, before obtaining the final value of HP, a set of computations aims to preserve the signals due to the metabolic animal response, identify atypical signals due to factors foreign to the investigation, and suppress measurement noise [
12,
13,
14].
In this paper, we aim to standardize a methodology to validate the IC system to verify the accuracy and detect whole-system leaks. Additionally, we propose an easy-to-use spreadsheet to compute the data acquisition and final calculation of HP based on the fundamental equation of Brower [
1], which yields an improved transient response and suppresses measurement noise.
General description of the flow-through IC system
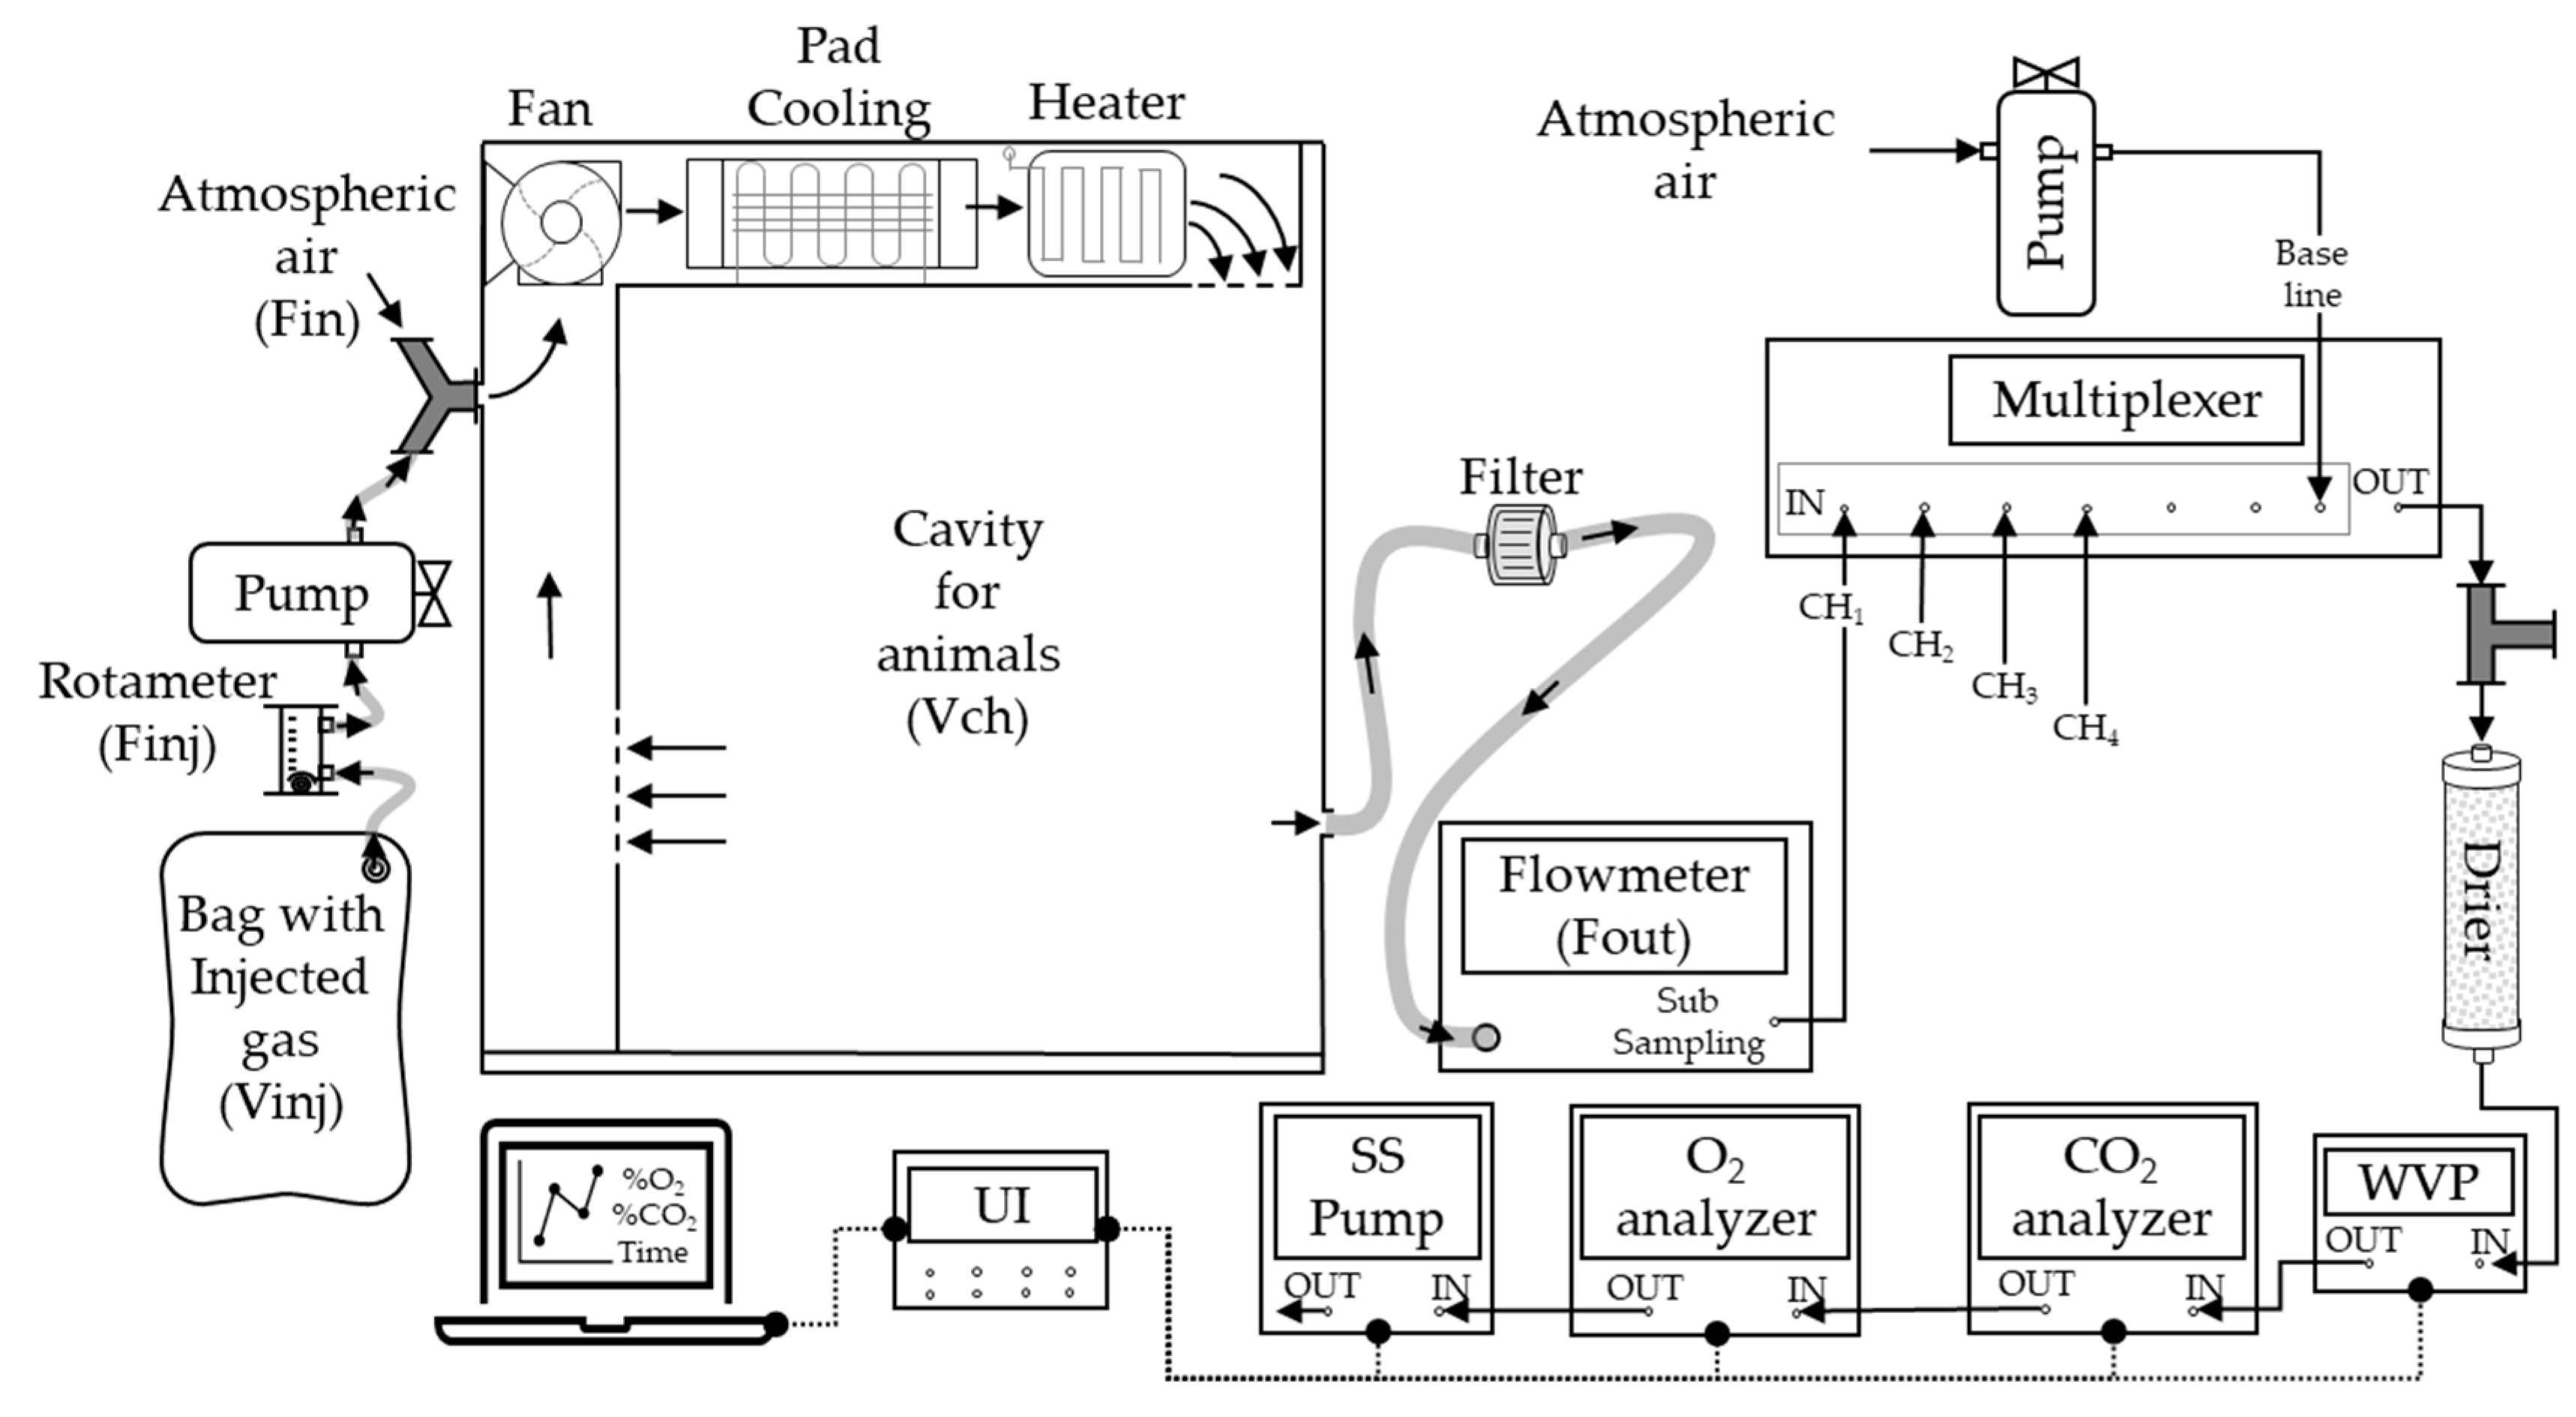
We used an open-circuit IC system that could couple six chambers, as shown in
Figure 1. Each chamber had the same geometric volume (Vch) of 980 m
3 (dimensions 100 cm × 100 cm × 98 cm), implemented with a temperature control system inside (heater and cooler) that maintained a constant temperature set at 24±1.0°C and a humidity of 60% during the trials.
The experimental setup consisted of air conduction, analyzers, and data acquisition components. Mass flow pumps (FK-100, Sable System, Las Vegas) were coupled to each CH and set at a flow rate of 20 L/min. A sample of air at 160 ± 2.0 mL/min was carried from each flow pump using a sub-sampler pump (SS4, Sable System, Las Vegas) located at the end of the circuit, maintaining the sample flow constant through gas analyzers. The sampled air was subjected to water vapor pressure analysis (RH-100, Sable System, Las Vegas). The sample was passed through a drying column (>99.5% CaSO4, Drierite®) to capture the humidity.
The O2 and CO2 concentrations were then analyzed using paramagnetic (PA-10, Sable System, Las Vegas) and infrared (CA-10, Sable System, Las Vegas) analyzers, respectively. The concentrations were measured as dry air. Finally, a universal interface (UI-3, Sable System, Las Vegas) was linked to the flowmeters and analyzers to record the signals at a frequency of one record per second. The signals from analyzers and flowmeters were extracted using ExpData software (Sable System, Las Vegas).
The atmospheric air was conducted using a diaphragm pump, and the concentrations of O2 and CO2 were measured to establish a baseline.
General calculations
The general calculations used here for the simulations of the dynamic of gas injection and the spreadsheet for data computing were described by Ligton [
15] for an open-circuit system with negative pressure. The correction of the outgoing flow (Fout) by barometric (BP) and water vapor pressure (WVP) was calculated as
. The ingoing flow (Fin) was calculated by a nitrogen correction factor using the equation
, where
.
The volume of gases was determined as follows: , . Furthermore, .
The HP was calculated using the Brower [
1] equation:
.
Simulation of the dynamic of gas injection in a theoretical system
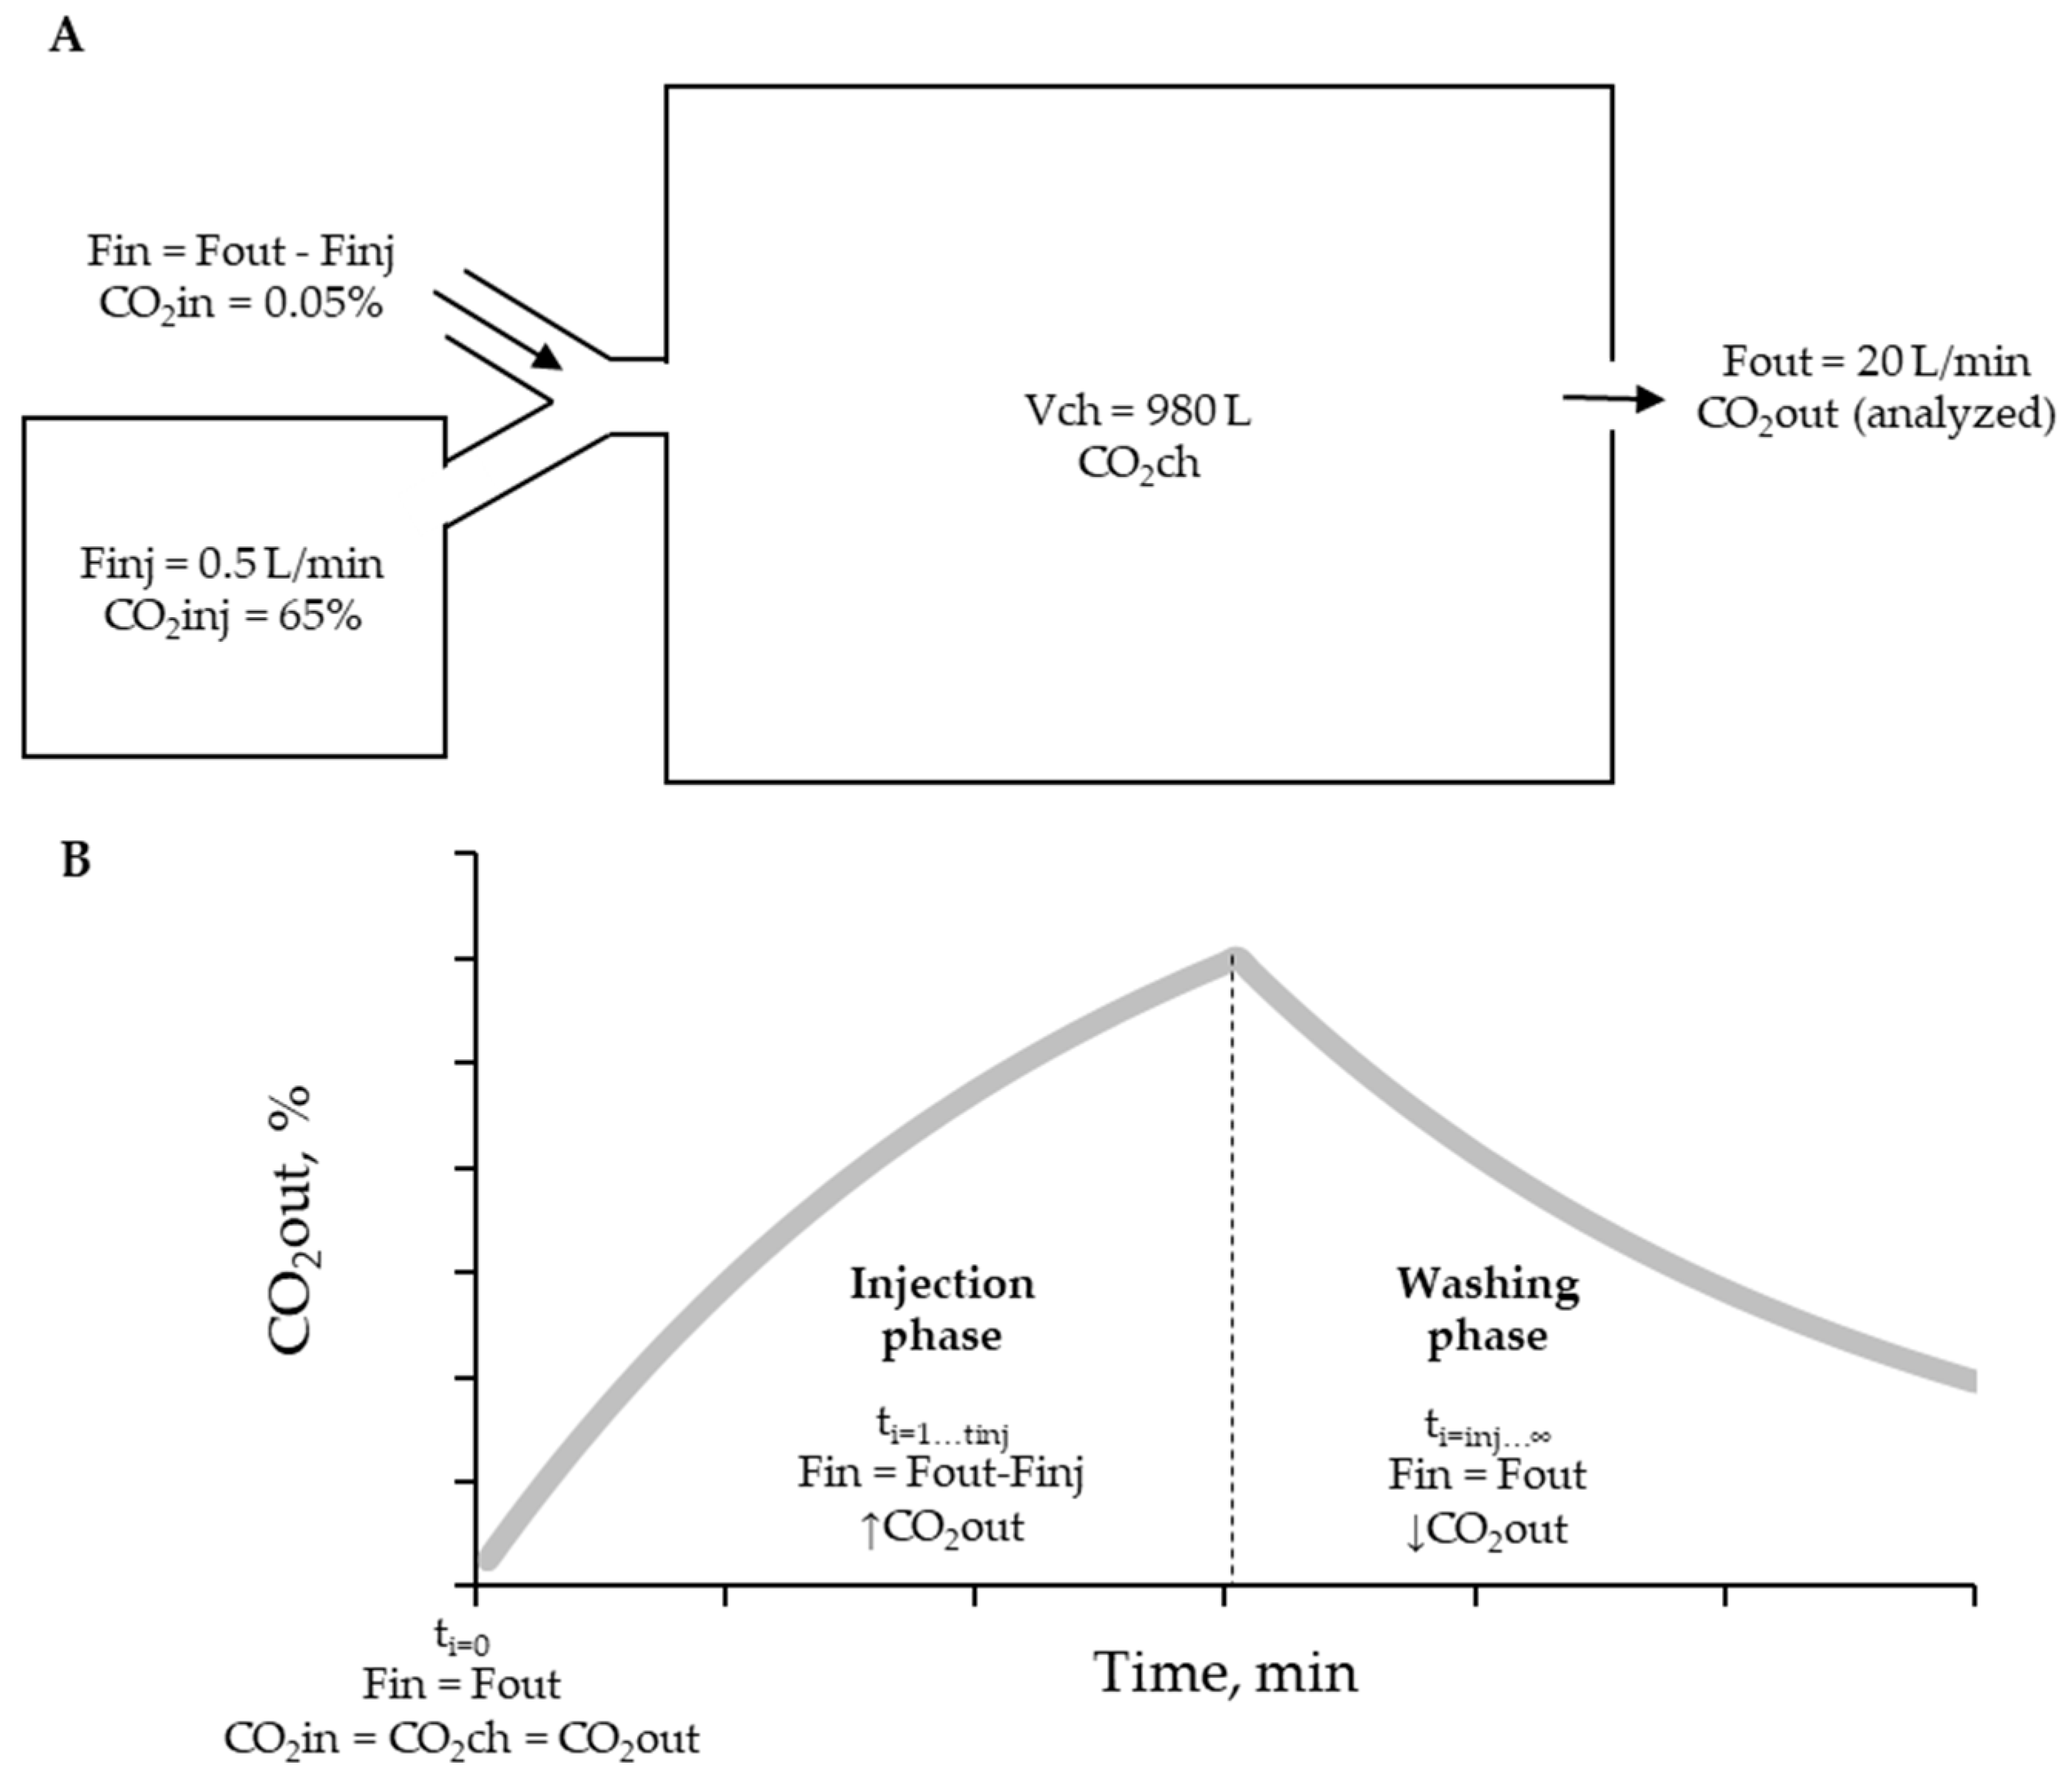
To conduct the recovery test, we developed a simulation of CO
2 dynamics in MS Excel when injected into the system (
Suppl. 1). The simulation was based on a theoretical system that assumes constant flow (
or
), and dry air (where
), and it described the behavior of injected CO
2 concentration (CO
2inj) through the system over time (per minute). Parameters such as the volume of injected gas (Vinj), injection flow (Finj), and concentration of CO
2inj were assumed constant and can be modified for other gases and concentrations. Additional calculations are presented in
Table 1. The simulation was conducted to determine the volume of CO
2 in three compartments: (1) ingoing rate (VCO
2in), (2) CO
2 volume in the chamber (VCO
2ch), and (3) outgoing rate (VCO
2out) (
Figure 2A). The simulation was divided into two phases: injection phases (when Finj>0 and ti<tinj) and washing phases (when Vinj was empty and Finj=0) (
Figure 2B).
The simulation began at ti = 0 (no injection of tested gas or baseline), where the concentration of CO
2 in all compartments was equal to the atmospheric air concentration. From that should establish the following volumetric concentration on each compartment:
For the injection phases (ti = 1→tinj), the calculation was as follows:
The VCO2ch value for t=1 was calculated by adding the VCO2ch value at t=i-1 to the VCO2in value at t=i and the VCO2inj value at t=i, and then subtracting the VCO2out value at t=i-1. The VCO2out rate at t=1 was utilized to determine the fractional concentration of CO2 in the chamber (CO2ch for t=i).
Finally, During the washing phases (ti = tinj…∞), the CO
2 volumes were calculated as follows:
The outputs of interest from the simulation over time were CO2out, the differential volume of CO2 (), and the cumulative differential volume of CO2 (). These parameters (per minute) were used to compare with the result of each chamber.
Recovery test procedure
The recovery test was performed in four respirometry chambers by introducing a known concentration of CO2 and measuring the rate of gas clearance over time as subjects exhaled. The recovery protocol was developed with the following considerations: (i) monitoring and controlling the concentration and injection flow of the gas every minute, (ii) ensuring that the concentration and injection flow is consistent with the expected range of metabolic rates in animal trials, and (iii) comparing the simulated clearance rate of CO2 with the observed clearance rate in each chamber to assess accuracy and precision.
A non-diffusion medical bag was used to store 30 L of a known CO
2 concentration (65% analytical CO
2 and 35% compressed nitrogen, standard gas mixture with guaranteed concentration, Code: ONU-1013, White Martins, SP, Brazil), which was connected to a micro-diaphragm pump (Finj at 70 kPa of pressure on vacuum) and injected into the chamber at a controlled injection flow of 0.5 L/min, as monitored by a rotameter (
Figure 1 and 2A). After that, the data collection was started by around 60 minutes (injection time) up to the bag empty and continued for another 60 minutes without injection (washing time). This process was repeated three times in each chamber, and the average of the three observations was compared with the expected clearance rate from the simulation.
Data analyses and recovery index calculation
The data analysis for the recovery test was carried out the same as was described in the simulation procedures. The data were recorded every second and averaged per minute. The parameters evaluated to assess the accuracy of the system for each chamber included the fractional concentration of CO
2out, ∆VCO
2, and cumulative ∆VCO
2. The error (ε) and residual standard deviation (RSD) were calculated for each chamber and each minute to assess the results. In addition, the recovery rate was calculated based on the expected volume of CO
2 and the observed volume in each chamber.
Here, k represents CO2out(ti), ΔVCO2, or Cumulative ΔVCO2. Observed values were recorded in each chamber, and expected values were calculated using the simulation.
Results of the recovery test
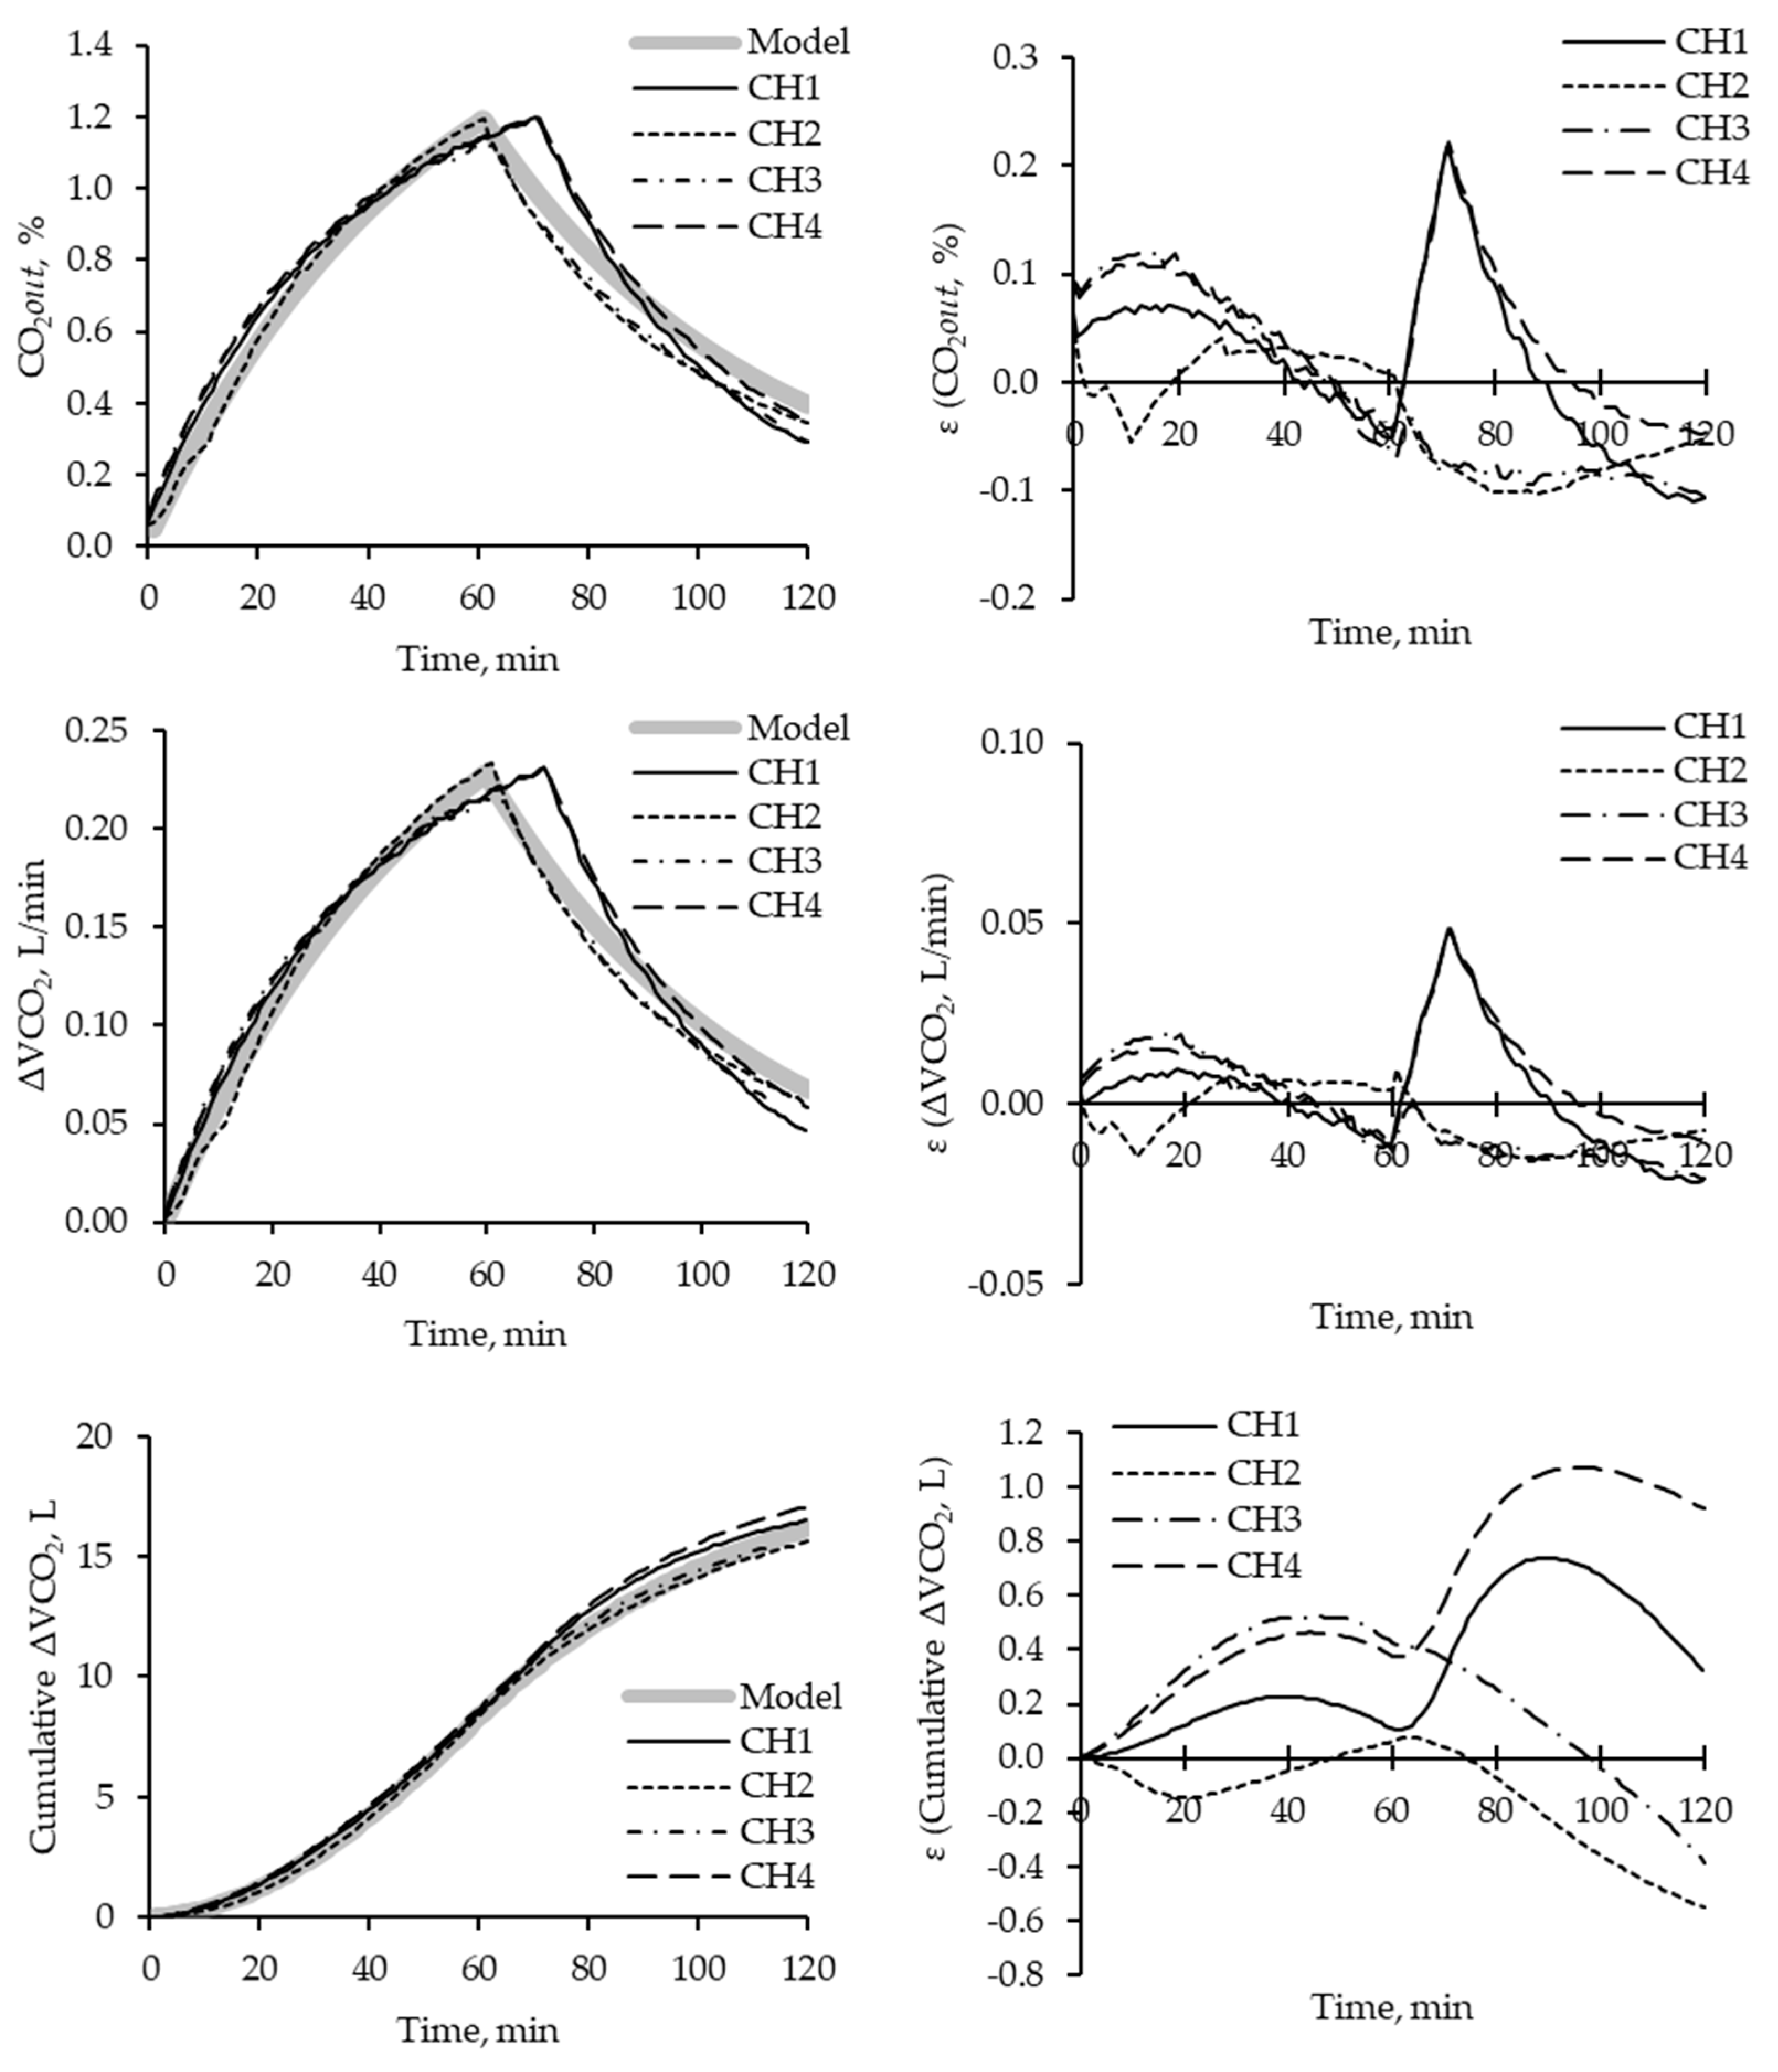
Figure 3 displays the dynamic behavior of each chamber per minute. All chambers exhibited similar behavior for all parameters compared with the model. However, chambers 2 and 3 showed different behavior and errors than chambers 1 and 4. Chamber 2 exhibited greater consistency and closeness to the expected behavior curve than the other chambers.
The injection phase results showed that chambers 2 and 3 reached their tinj values at approximately 60 minutes, which is consistent with the expected time for gas injection to finalize. However, chambers 1 and 4 took longer than expected, with a delay of around 15 minutes. During this period, all chambers exhibited slightly higher values for %CO
2out and ΔVCO
2 than expected. Additionally, the washing period showed a greater variation in the parameters of CO
2out(ti), ΔVCO
2, and Cumulative ΔVCO
2. In general, 1% of the variation in CO
2 resulted in a 0.05 L/min of the volumetric ΔVCO2 from the expected value. However, this did not affect the cumulative volumetric difference of CO
2, and it should not pose a problem during animal experimentation, as it only released less than 1 L of VCO
2 above the expected value. The variation in these parameters over time is related to the airflow (Finj or Fout). It can be calibrated on the flowmeter, which should exhibit greater precision during animal experimentation [
15].
The recovery rates and relative standard deviation (RSD) for each chamber are presented in
Table 2. As previously mentioned, chambers 2 and 3 exhibited similar behavior and higher RSD(ΔVCO
2) and lower RSD (Cumulative ΔVCO
2) than chambers 1 and 4. This resulted in a recovery rate below 1 for chambers 2 and 3, while chambers 1 and 4 had recovery rates above 1. These results fall within the system's inefficiency range, as McLean and Tobin [
16] recommended, where a normal variation of 3% to 8% (from 0.92 to 1.08) is considered an acceptable range for recovery rates.
The procedure of data computing and filtering of IC system
An accurate description of the general steps involved in computing IC data is provided by Lighton [
15] and Gerrits et. al. [
9]. This methodology is suitable for data obtained from analyzers and chambers that have been checked and calibrated. In other words, the chamber should not have any defects or a recovery test should be conducted to establish the chamber's feasibility. Furthermore, the analyzer output signals should represent the variation over time during animal experimentation. Therefore, performing periodic calibration of the analyzer, verification of the recorded signals, and filtering to obtain coherent gas concentration values while disregarding some noise during recordings is recommended.
Here we used the IC data report by Camargos et. al., [
17] on broiler chickens as an example to detail step-by-step the calculations of data management and is available the calculation spreadsheet developed in MS Excel with this data (
Suppl. 2).
Oxygen and CO2 signals calibration
The initial step in IC measurement involves verifying the recorded signal and ensuring coherent values of gas concentration. To achieve this, calibration must be performed at the start and end of each metabolic measurement period (daily).
For the data computing of the data from Camargos et. al., [
17], we considered the calibration procedure carried out using two gases with known concentrations: gas A, which was pure nitrogen with approximately 99.99% N2 and 0% O
2 and CO
2 (White Martins, SP, Brazil), and gas B, which was a standard mixture of 21% O
2 and 1% CO
2 (White Martins, SP, Brazil).
The calibration curve was performed for each gases of interes (in this cases O
2 and CO
2) by extrapolationg along the time (ti) as:
Where O2ti is the fractional concentration for the gas A or gas B at the ti. O2t0 and O2tn is the concentration at the initial and the final register value by the analyzer, respectively. With the extrapoled concentration of O2 for each ti and each gases (A and B), is then linearized as:
Finally, the calibrated signals and expression of the concentration of both gases was expressed as:
The same procedure was performed for O2.
Calibrated fractional concentration and filtering
The fractional concentration obtained through calibration is not sufficient for HP calculation. Thus, the reliability of the IC measurements depends on the metabolic signal detected by the system or the appropriate mathematical application to highlight these metabolic events.
The Bartholomew [
18] data transformation is a widely used procedure for real-time gas exchange measurements [
19]. This procedure is based on the relationship between Vch and Fout, which refers to the system's ability to detect the metabolic signal or, in the absence of it, to provide a delay for corrective action.
The fractional data for O
2 or CO
2 can be corrected by combining the exponential saturation of the chamber, which depends on the flow rate. The calibrated concentration of O
2 and CO
2 at a given time (i) can be corrected as follows:
After applying the Bartholomew transformation, the CO
2 concentration was transformed to the time ti. Since the signal recording was performed every second, a moving average (n=10) was used as a criterion to reduce noise and synchronize the O
2 and CO
2 analyzer signals.
The same procedure was applied to O
2. The transformed and filtered signals were then used to calculate the HP based on the equation described by Lighton [
15] and Gerrits et. al., [
9].
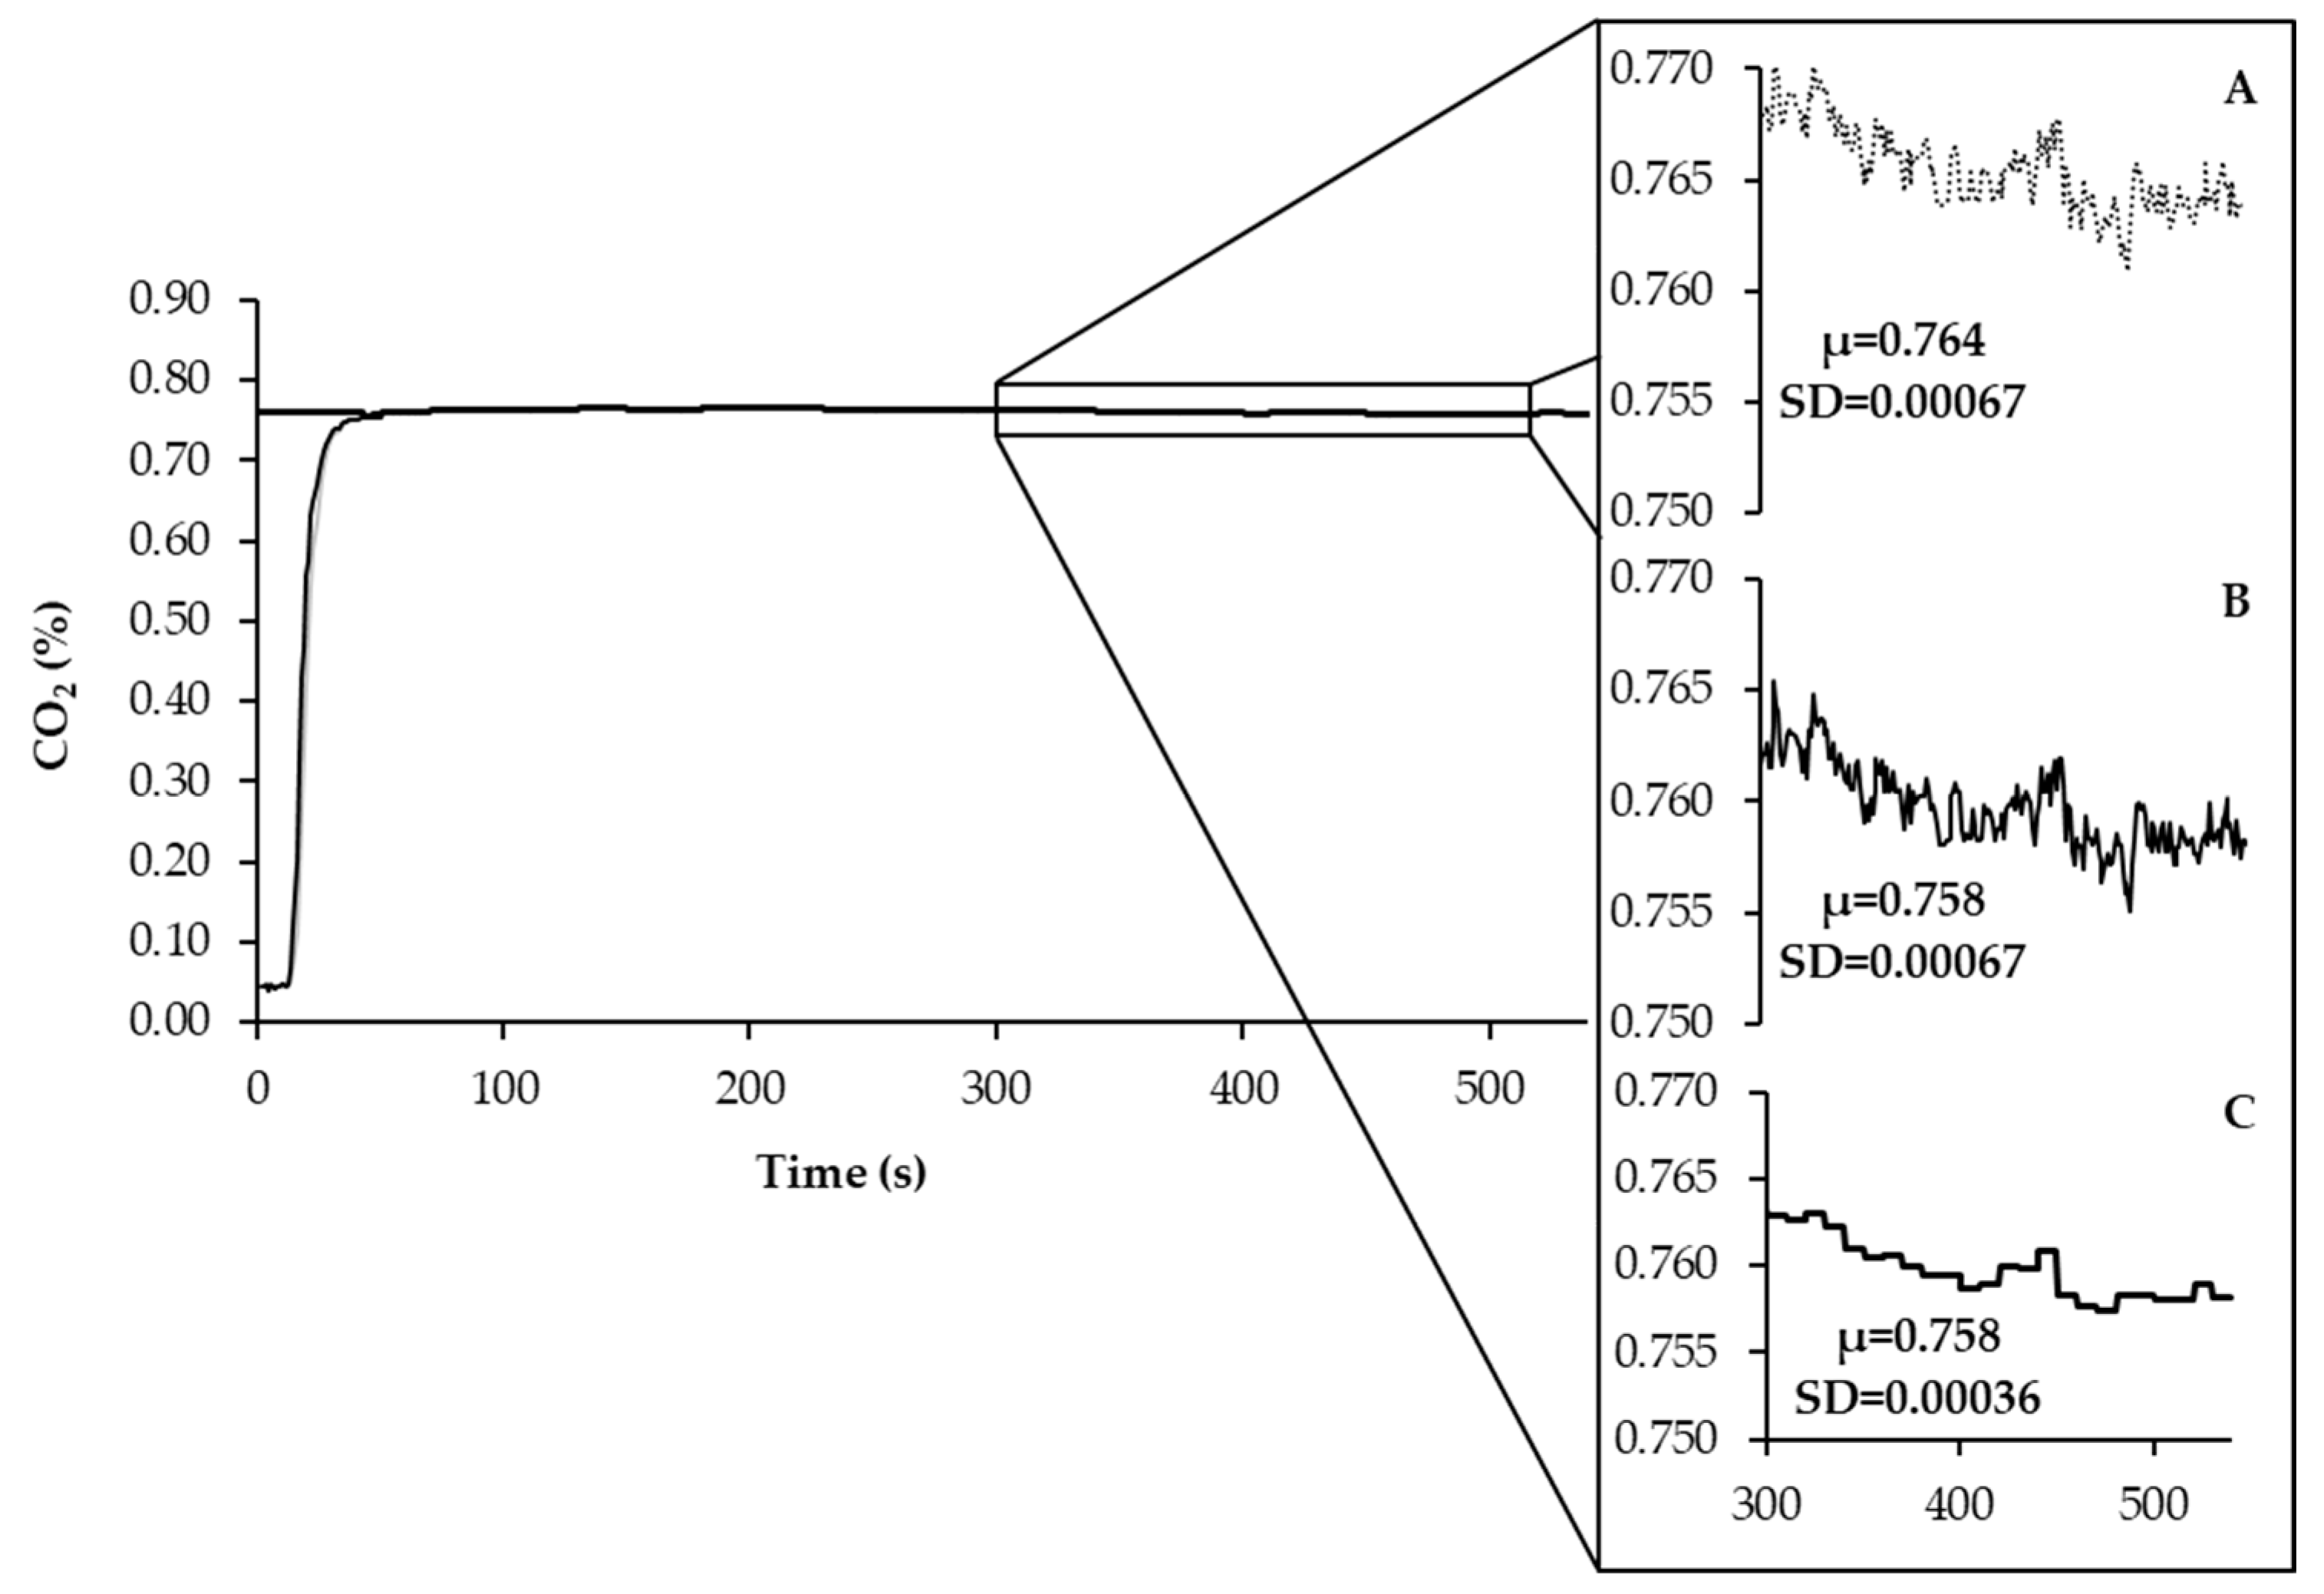
The detailed step-by-step procedure for the data collection of an hour in a multichamber IC system is presented in Figure 4 and
Supp 2.
Figure 5.
The curve of recorded signal (A) calibration and Bartolomew transformation applied to individual data (B) and filtered data with moving average (C) of the fractional concentration of CO2. In the same way, was applied to O2.
Figure 5.
The curve of recorded signal (A) calibration and Bartolomew transformation applied to individual data (B) and filtered data with moving average (C) of the fractional concentration of CO2. In the same way, was applied to O2.
As illustrated in the figure, the average fractional concentration of CO2 after calibration and Bartholomew transformation showed a slight reduction. This reduction was due to the volumetric contribution of CO2 in the chamber, which is dependent on Vch, in addition to the CO2out register by the analyzer. The variation in the recorded and calibrated-transformed data was similar at this point. To reduce noise in the data while maintaining the average of previously calibrated-transformed data, a moving average (n=10) was applied.
Implication
The implications of the described methodology for future research are significant, as it can enhance the accuracy and quality of measurements for indirect calorimetry (IC), which is crucial for investigating animal energy metabolism. This adaptable methodology can be tailored to diverse IC systems and research objectives, rendering it a valuable tool for researchers in various fields. Furthermore, the MS Excel spreadsheet can be customized for specific research purposes or serve as a didactic teaching aid. Thus, our proposal presents a valuable contribution to the field of IC and can significantly advance the precision and reliability of animal science research.
Supplementary Materials
The following supporting information can be downloaded at the website of this paper posted on Preprints.org.
Author Contributions
Conceptualization, R.R.L.; methodology, R.R.L., and R.S.C.; spreadsheets development, R.R.L., R.S.C., R.L.S., and B.B.L; validation, R.R.L. and R.S.C.; formal analysis, R.R.L.; investigation, R.R.L., N.S.K.; resources, N.S.K.; simulation testing and data validation, R.R.L., R.S.C., B.B.L., R.L.S.; writing—original draft preparation, R.R.L.; writing—review and editing, R.R.L., and N.S.K.; project administration, N.S.K.; funding acquisition, N.S.K. All authors have read and agreed to the published version of the manuscript.
Funding
This study was supported by FAPESP [Process 2019/26575-6] and scholarship (CNPq) – Finance Code Nº 88882.330298/2019-01.
Conflicts of Interest
The authors declare no conflicts of interest.
References
- Brower, E. Report of Sub-committee on Constants and Factors. In Symposium of Energy Metabolism Held at European Association for Animal Production; Eaap Academic: London, 1965; pp. 441–443. [Google Scholar]
- Riveros, R.L. .; Camargos, R.S.; Macari, M.; Reis, M.P.; Leme, B.B.; Sakomura, N.S. Dynamic of Heat Production Partitioning in Rooster by Indirect Calorimetry. Anim Biosci. 2023, 36, 75–83. [Google Scholar] [CrossRef] [PubMed]
- Martinez, D.A.; Suesuttajit, N.; Hilton, K.; Weil, J.T.; Umberson, C.; Scott, A.; Coon, C.N. The Fasting Heat Production of Broilersis a Function of their Body Composition. Anim.–Open Space 2022, 100029. [Google Scholar] [CrossRef]
- Wu, S.B.; Swick, R.A.; Noblet, J.; Rodgers, N.; Cadogan, D.; Choct, M. Net Energy Prediction and Energy Efficiency of Feed for Broiler Chickens. Pult. Sci. 2019, 98, 1222–1234. [Google Scholar] [CrossRef] [PubMed]
- Liu, W.; Lin, C.H.; Wu, Z.K.; Liu, G.H.; Yan, H.; Yang, H.; Cai, H. Estimation of the Net Energy Requirement for Maintenance in Broilers. Asian-Australas J. Anim. Sci. 2017, 30, 849–856. [Google Scholar] [CrossRef] [PubMed]
- Caldas, J.V.; Hhilton, K.; Boonsinchai, N.; England, J.; Aauromoustakos, A.; Coon, C.N. Dynamics of Nutrient Utilization, Heat Production, and Body Composition in Broiler Breeder Hens During Egg Production. Poult. Sci. 2018, 97, 2845–2853. [Google Scholar] [CrossRef]
- Takala, J. Handbook of Gas Exchange and Indirect Calorimetry; Detex, 1991. [Google Scholar]
- Saathoff, A.J.; Welles, J. Gas Exchange Measurements in the Unsteady State. Plant Cell Environ. 2021, 44, 3509–3523. [Google Scholar] [CrossRef] [PubMed]
- Gerrits, W.; Labussièr, E. Indirect Calorimetry, Techniques, Computations and Applications; Wageningen Academic Publishers: Wageningen, Netherlands, 2015. [Google Scholar]
- Peppelenbos, H.W. The Use of Gas Exchange Characteristics to Optimize Ca Storage and Ma Packaging of Fruits and Vegetables. Ph.D. Thesis, Land Bouw Universiteit, Wageningen, 1996. [Google Scholar]
- Staudacher, E.M; Huetteroth, W.; Schachtner, J.; Daly, K.C. 2009. A 4-Dimensional Representation of Antennal Lobe Out-put Based on an Ensemble of Characterized Projection Neurons. J. Neurosci. Methods. 2009, 180, 208–223. [Google Scholar] [CrossRef] [PubMed]
- Fedak, M.A.; Rome, l.; Seeherman, H.J. One-step N2-Dilution Technique for Calibrating Open-Circuit VO2 Measuring Systems. J. Appl. Physiol., 1981, 51, 772–776. [Google Scholar] [CrossRef] [PubMed]
- Ortigues; Dussap, C.G.; Aanglaret, Y. Comparison of Various Methods of Calculating the Instantaneous Respirato-RY Gaseous Exchanges from Discrete Measurements in Respiration Chambers. J. Theor. Biol.. 1997, 185, 489–501. [Google Scholar] [CrossRef]
- Lighton, J.R.B. Instantaneous' Metabolic Measurement. J. Exp. Biol. 2013, 215, 1605–1606. [Google Scholar] [CrossRef] [PubMed]
- Lighton, J.R.B. Measuring Metabolic Rates; Oxford Univ Press: Oxford, United Kindon, 2008. [Google Scholar]
- McLean, J.; Tobin, G. Animal and Human Calorimetry; University Press: Cambridge, United Kindon, 1988. [Google Scholar]
- Camargo, R.S.; Riveros, R.L.; Macari, M.; Freitas, L.F.V.; Zanetti, M.C.; Bicego, K.C.; Sakomura, N.S. Dynamic of the Energy Utilization of Broiler Chicks. In Proceedings of the Latin American Scientific Conference 2022, Foz do Iguaçú, Brasil, 4–6 October 2022. [Google Scholar]
- Bartholomew, G.A.; Vleck, D.E.; Vleck, C.M. Instantaneous Measurements of Oxygen Consumption During Pre-flight Warm-up and Post-flight Cooling in Sphingid and Saturniid Moths. J. Exp. Biol. 1981, 90, 17–32. [Google Scholar] [CrossRef]
- Pendar, H.; Socha, J.J. Estimation of Instantaneous Gas Exchange in Flow-Through Respirometry Systems: A Modern Revision of Bartholomew's Z-Transform Method. Plos One 2015, 10, e0139508. [Google Scholar] [CrossRef] [PubMed]
|
Disclaimer/Publisher’s Note: The statements, opinions and data contained in all publications are solely those of the individual author(s) and contributor(s) and not of MDPI and/or the editor(s). MDPI and/or the editor(s) disclaim responsibility for any injury to people or property resulting from any ideas, methods, instructions or products referred to in the content. |
© 2023 by the authors. Licensee MDPI, Basel, Switzerland. This article is an open access article distributed under the terms and conditions of the Creative Commons Attribution (CC BY) license (http://creativecommons.org/licenses/by/4.0/).


