1. Introduction
The mechanisms that control organismal growth and its coordination with the availability of nutrients in cellular micro-environments were unknown until a few decades ago. It is now well appreciated that the mechanistic Target Of Rapamycin (mTOR) protein kinase (formerly “mammalian” TOR) represents the major nutrient-sensitive regulator of animal growth [
1,
2]. The mTOR pathway responds to diverse environmental signals, coordinates cell growth and proliferation [
2,
3], and its deregulation has been strongly associated with aging and a number of human disorders, such as diabetes, neurodegenerative diseases and cancer [
4,
5].
mTOR is an evolutionary conserved Serine/Threonine protein kinase that belongs to the PI3K-relate kinases (PIKK) family and is the catalytic core of two large multi-protein complexes designated mTORC1 (mTOR complex 1) and mTORC2 (mTOR complex 2) [
2,
6]. Their function, substrate specificity, upstream inputs, downstream outputs and sensitivity to Rapamycin differ notably due to the distinct composition of their accessory proteins [
5,
6]. mTORC1 is better characterized and reviewed between the two mTOR complexes. It controls cell growth and metabolism, by regulating anabolic and catabolic processes, including protein, lipid and nucleotide synthesis, while blocking autophagy at the post-translational and transcriptional levels, in response to various environmental cues, such as growth factors, energy status, oxygen, stress and especially amino acids [
3,
6,
7].
Amino acids, which are not only essential components for protein synthesis, but also serve as source of energy and carbon for many metabolic pathways, are also key regulators of mTORC1 [
2,
4]. Amino acids derive either from lysosome-mediated protein degradation or are exogenously sensed by the GATOR–Rag Guanosine Triphosphatase (GTPase) pathway, which activates the mTORC1 cascade [
8]. Rag GTPases interact with Raptor, a major component of mTORC1, to translocate mTORC1 to the lysosomal membrane, whereat it is, then, activated by Rheb. Translocation of mTORC1 requires the interaction of Rag GTPases with Ragulator, which is a complex located on the lysosome surface [
9].
mTORC1 is capable of sensing intra-lysosomal and cytosolic amino acid concentrations through distinct mechanisms and sensors [
2,
10]. Cytosolic Arginine and Leucine can signal to mTORC1 via different pathways controlled by the GATOR2 and GATOR1 complexes. GATOR1 is a negative regulator of mTORC1, when bound to the lysosome, via recruitment by KICSTOR -protein- complex, whereas GATOR2 acts as positive regulator [
9]. Leucine and Arginine bind to the cytosolic amino acid sensor proteins Sestrin1/2 and CASTOR1, respectively, and dissociate them from GATOR2, which is, then, activated and triggers the activation of mTORC1, through the inactivation of GATOR1 [
11,
12]. Remarkably, mTORC1 cannot sense Methionine directly, but only indirectly, via a previously uncharacterized protein, called SAMTOR. SAMTOR is an S-Adenosyl-Methionine (SAM) cytoplasmic sensor, which interacts with KICSTOR and GATOR1, to release mTORC1 from the lysosomal membrane, and, thereby, acts as negative regulator of mTORC1. SAM is biochemically converted and produced from Methionine, and, under Methionine sufficiency, SAM binds to SAMTOR, which, then, dissociates from GATOR1. The disruption of SAMTOR–GATOR1 complex causes inactivation of GATOR1, which results in mTORC1 activation [
2,
7,
13].
To in vivo investigate the role of SAMTOR in model biological environments, we have, herein, targeted the Drosophila homologous gene, dSAMTOR, in diverse fly tissues during aging, by combined employment of the GAL4/UAS and RNAi transgenic technologies. Besides dSAMTOR, dBHMT, the gene controlling the Betaine to Methionine conversion, was also downregulated, in tissue-specific manner, throughout lifetime. System pathologies derived from gene targeting revealed the in vivo importance of Methionine-SAM axis in cellular integrity, tissue architecture and organ functionality in elderly individuals.
3. Discussion
Nutrients are directly involved in the regulation of lifespan, aging and metabolic health of organisms, with most metabolic-related cellular activities being mediated by the mTORC1 complex, which functions as the central regulator of cell growth and metabolism in response to changes in nutrient signals, such as specific amino acid(s) absence or (excessive) presence [
15]. The essential amino acid Methionine is presented as a key metabolite in many aspects of animal physiology, with its metabolism being regulated in an age-dependent manner [
16]. Methionine’s primary metabolite, SAM, serves as a universal methyl donor required for most methylation reactions, including those of DNA and histones [
17,
18,
19]. The mTORC1 signaling pathway senses the cellular levels of Methionine in an indirect fashion, through the SAM-specific sensor, SAMTOR [
7]. SAMTOR protein is a recently described cytoplasmic amino acid sensor, able to negatively regulate mTORC1 signaling by inducing its (mTORC1) dissociation from the lysosomal membrane. When SAM binds to SAMTOR, the SAMTOR-containing complex can be disrupted and inhibition of mTORC1 signaling activity can be abolished [
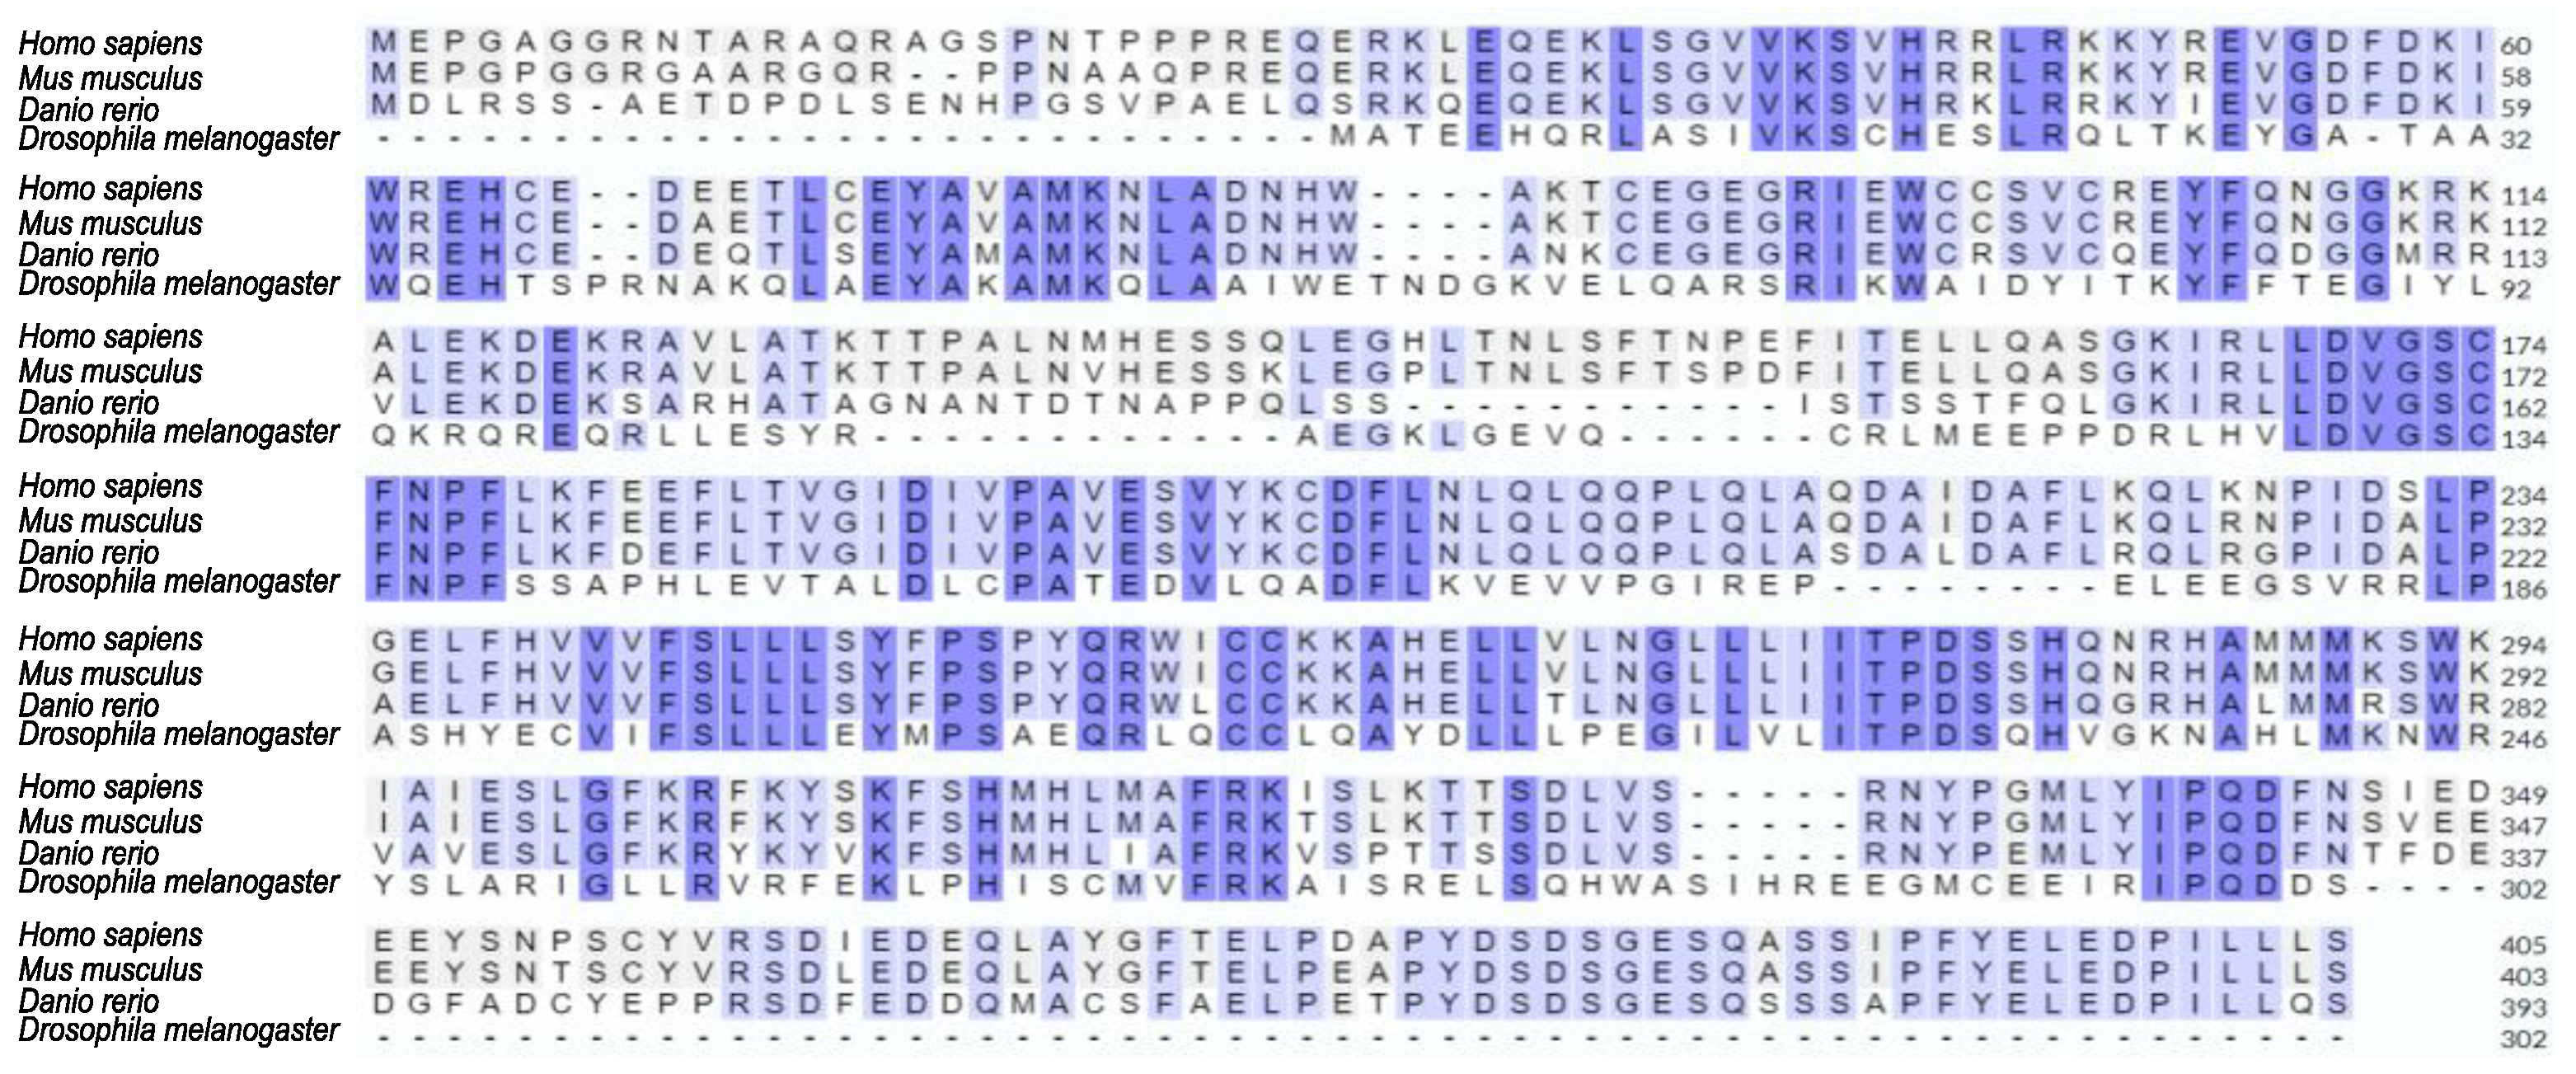
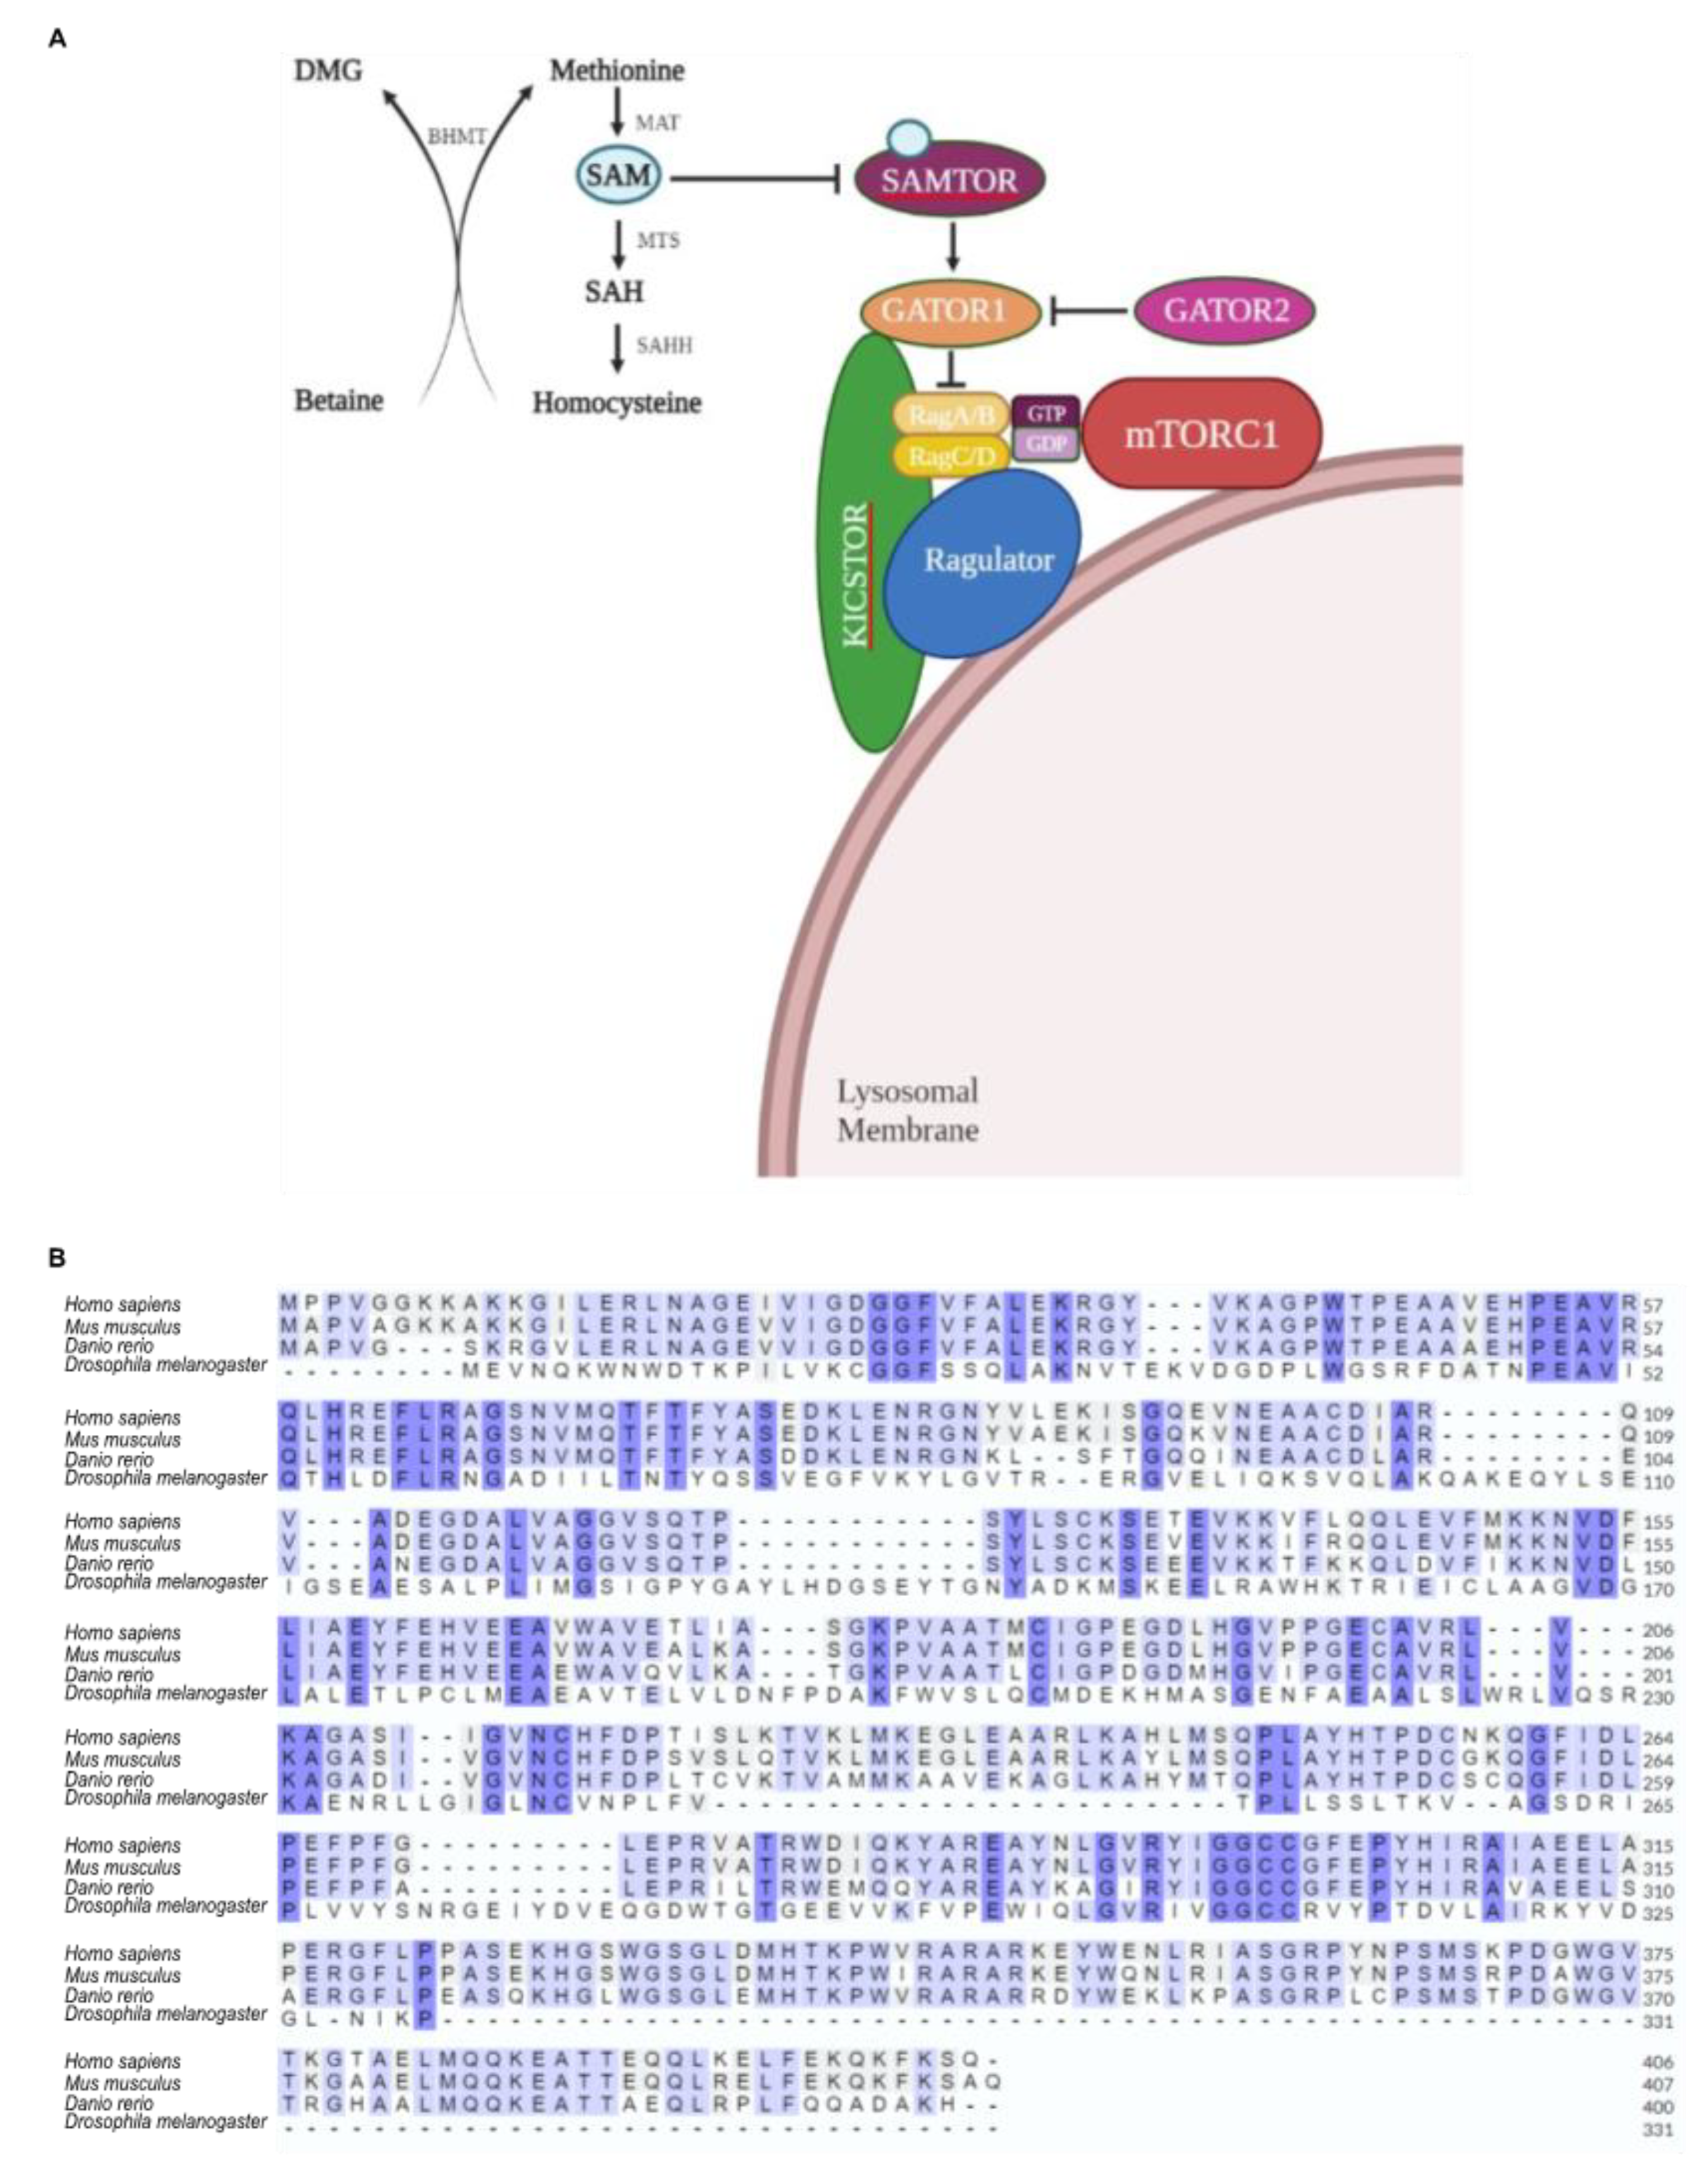
7]. SAMTOR is highly conserved among metazoans (
Figure 1), and in
Drosophila S2R+ cells lacking dSAMTOR, the dTOR pathway is resistant to Methionine starvation [
7], indicating that dSAMTOR plays a similar regulatory role in dTORC1 signaling as SAMTOR does in human cells. Hitherto, the
in vivo role of dSAMTOR protein in fly’s systemic pathophysiology has not been investigated.
Therefore, to reveal the importance of tissue-specific dSAMTOR loss to
Drosophila health, lifespan and well-being, we have genetically targeted the
dSAMTOR cognate gene in all major organ tissues, through employment of the appropriate GAL4 drivers and two UAS-SAMTOR_RNAi strains. Strong
dSAMTOR downregulation resulted in embryonic lethality in the majority of
dSAMTOR-targeted tissues, suggesting that threshold levels of dSAMTOR activity are essential for diverse cell-type functionalities, and especially for normal neuromuscular development and performance. Interestingly, moderate downregulation of
dSAMTOR gene in the neuromuscular system is not detrimental and is characterized by distinct phenotypes of sex- and age-dependent pathologies, with predominantly negative impact on
Drosophila health and lifespan. Disruption of the SAMTOR-containing complex leads to inactivation of GATOR1, and subsequent activation of mTORC1 and, thus, suppression of autophagy [
7]. It may also be the accumulation of SAM metabolite, presumably induced by the lack of SAM-binding partner, SAMTOR, that likely contributes to dSAMTOR loss-derived pathology in fly’s tissue systems. The activation of dTORC1, in
dSAMTOR-targeted environments, is strongly supported by the increased phosphorylation contents of (d)p70S6K (a
bona fide dTORC1 substrate) and dTOR kinases herein identified by our active kinome profiling in fly brain (
Figure 5). The mTORC1 complex acts as a central regulator of diverse cellular functions, committed to promote anabolism and cell growth, and its aberrant over-activation is often detected in up to 80% of human cancers [
20,
21,
22]. mTORC1 exerts neuronal-specific activities during brain development, shaping both the signaling and physical landscapes of the brain, with these activities temporally spanning every stage of brain development [
5,
23]. Most importantly, mTORC1 suppresses the catabolic pathway, through inhibition of autophagy and lysosome biogenesis [
5]. Hyperactive mTOR signaling in the brain is associated with characteristic lesions, such as focal cortical dysplasia, seizures, macrocephaly and benign brain tumors [
5]. In mutant mice that are unable to suppress mTORC1 signaling and, therefore, fail to limit their energy expenditure or activate autophagy to supply tissue cytoplasms with free amino acids, perinatal lethality occurs, thus demonstrating that mTORC1 activity must be tightly controlled to maintain -normal- cellular homeostasis,
in vivo [
5,
24,
25]. Furthermore, failure in autophagic clearance in the brain results in progressive and permanent destruction of neurons, causing impairment in cognition and motor control, while inhibition of autophagy has emerged as a hallmark of neurotoxic cell death [
5,
26,
27].
Regarding the SAM metabolite, it has long been established that it serves as a universal donor of methyl groups, for almost all methyl-transfer reactions
in vivo, to produce a methylated substrate and SAH (S-Adenosyl-L-Homocysteine) moiety [
18,
28]. In a SAMTOR-deficient background, cellular SAM levels increase and the elevated SAM:SAH ratio gives rise to imbalanced cellular methylation potential, resulting in aberrant increase in the methylation load of proteins, nucleic acids and metabolites [
29]. These types of aberrant methylation events seem to critically contribute to diverse cellular pathologies, with changes in methylation patterns of histones and nucleic acids decisively determining the epigenetic states of cells that are mechanistically associated with global alterations in gene expression profiles [
18,
30]. Although alterations in the methylation status do not likely account for all the, herein observed, detrimental effects in fly’s physiology, the functional synergism of hypermethylation with the high energy levels required by dTORC1 hyperactivation (to promote anabolism and cell growth), together with the accumulation of misfolded or excessive bio-macro-molecules, due to (dTORC1-dependent) suppression of autophagy (which could supply cells with energy and building blocks for proliferation), no longer seems to be compatible with early development in a
dSAMTOR-deficient genetic background.
The compromised health and reduced lifespan profiles, herein described for the first time, in response to tissue-specific moderate silencing of
dSAMTOR gene may result either from moderate dTORC1-complex activation or moderate SAM-metabolite accumulation. Interestingly, GNMT (Glycine N-Methyltransferase: uses SAM -as methyl donor- to produce N-Methyl-Glycine) downregulation (via RNAi-specific targeting) or SAMS (SAM Synthase) over-expression could not affect lifespan, thereby indicating that moderate increases in SAM cellular contents cannot cause baneful outcomes in fly’s longevity [
31]. In contrast, (m)TORC1 suppression has been shown to extend lifespan in different organisms, including
Drosophila [
32], strongly suggesting the dTORC1 capacity to tightly regulate fly’s longevity and lifespan [
33]. Of note, dietary Methionine restriction has proved to inhibit (m)TORC1 and extend lifespan, in both rodents and flies [
13,
34,
35]. Most importantly, genetic or pharmacological manipulation of SAM metabolism suffices for expansion of
Drosophila lifespan [
31,
36], thus implying that SAM, but not Methionine
per se, is critical for tissue and organism homeostasis,
in vivo. The mechanism via which suppression of mTORC1 leads to lifespan extension includes, likely among others, the induction of autophagy [
15]. The functional regulation of mTORC1 is of major importance in defining the morphology of developing brain, by promoting both the building of new proteins at some synapses and the pruning of obsolete synapses through autophagy at others [
5]. Hence, the different tissue-specific phenotypes, herein observed, following moderate downregulation of
dSAMTOR gene, may be attributed to distinct degrees of balance between inhibition or activation of dTORC1 signaling, in different tissue, gender and age fly settings. Taken together, the quantitative regulation of (d)SAMTOR and SAM levels in the cytoplasm may act as a key factor in lifespan regulation. Their quantitative control is likely mediated by the tissue-dependent induction or suppression of (d)TORC1 signaling activities, which become presumably more complex at the multi-tissue and organism levels.
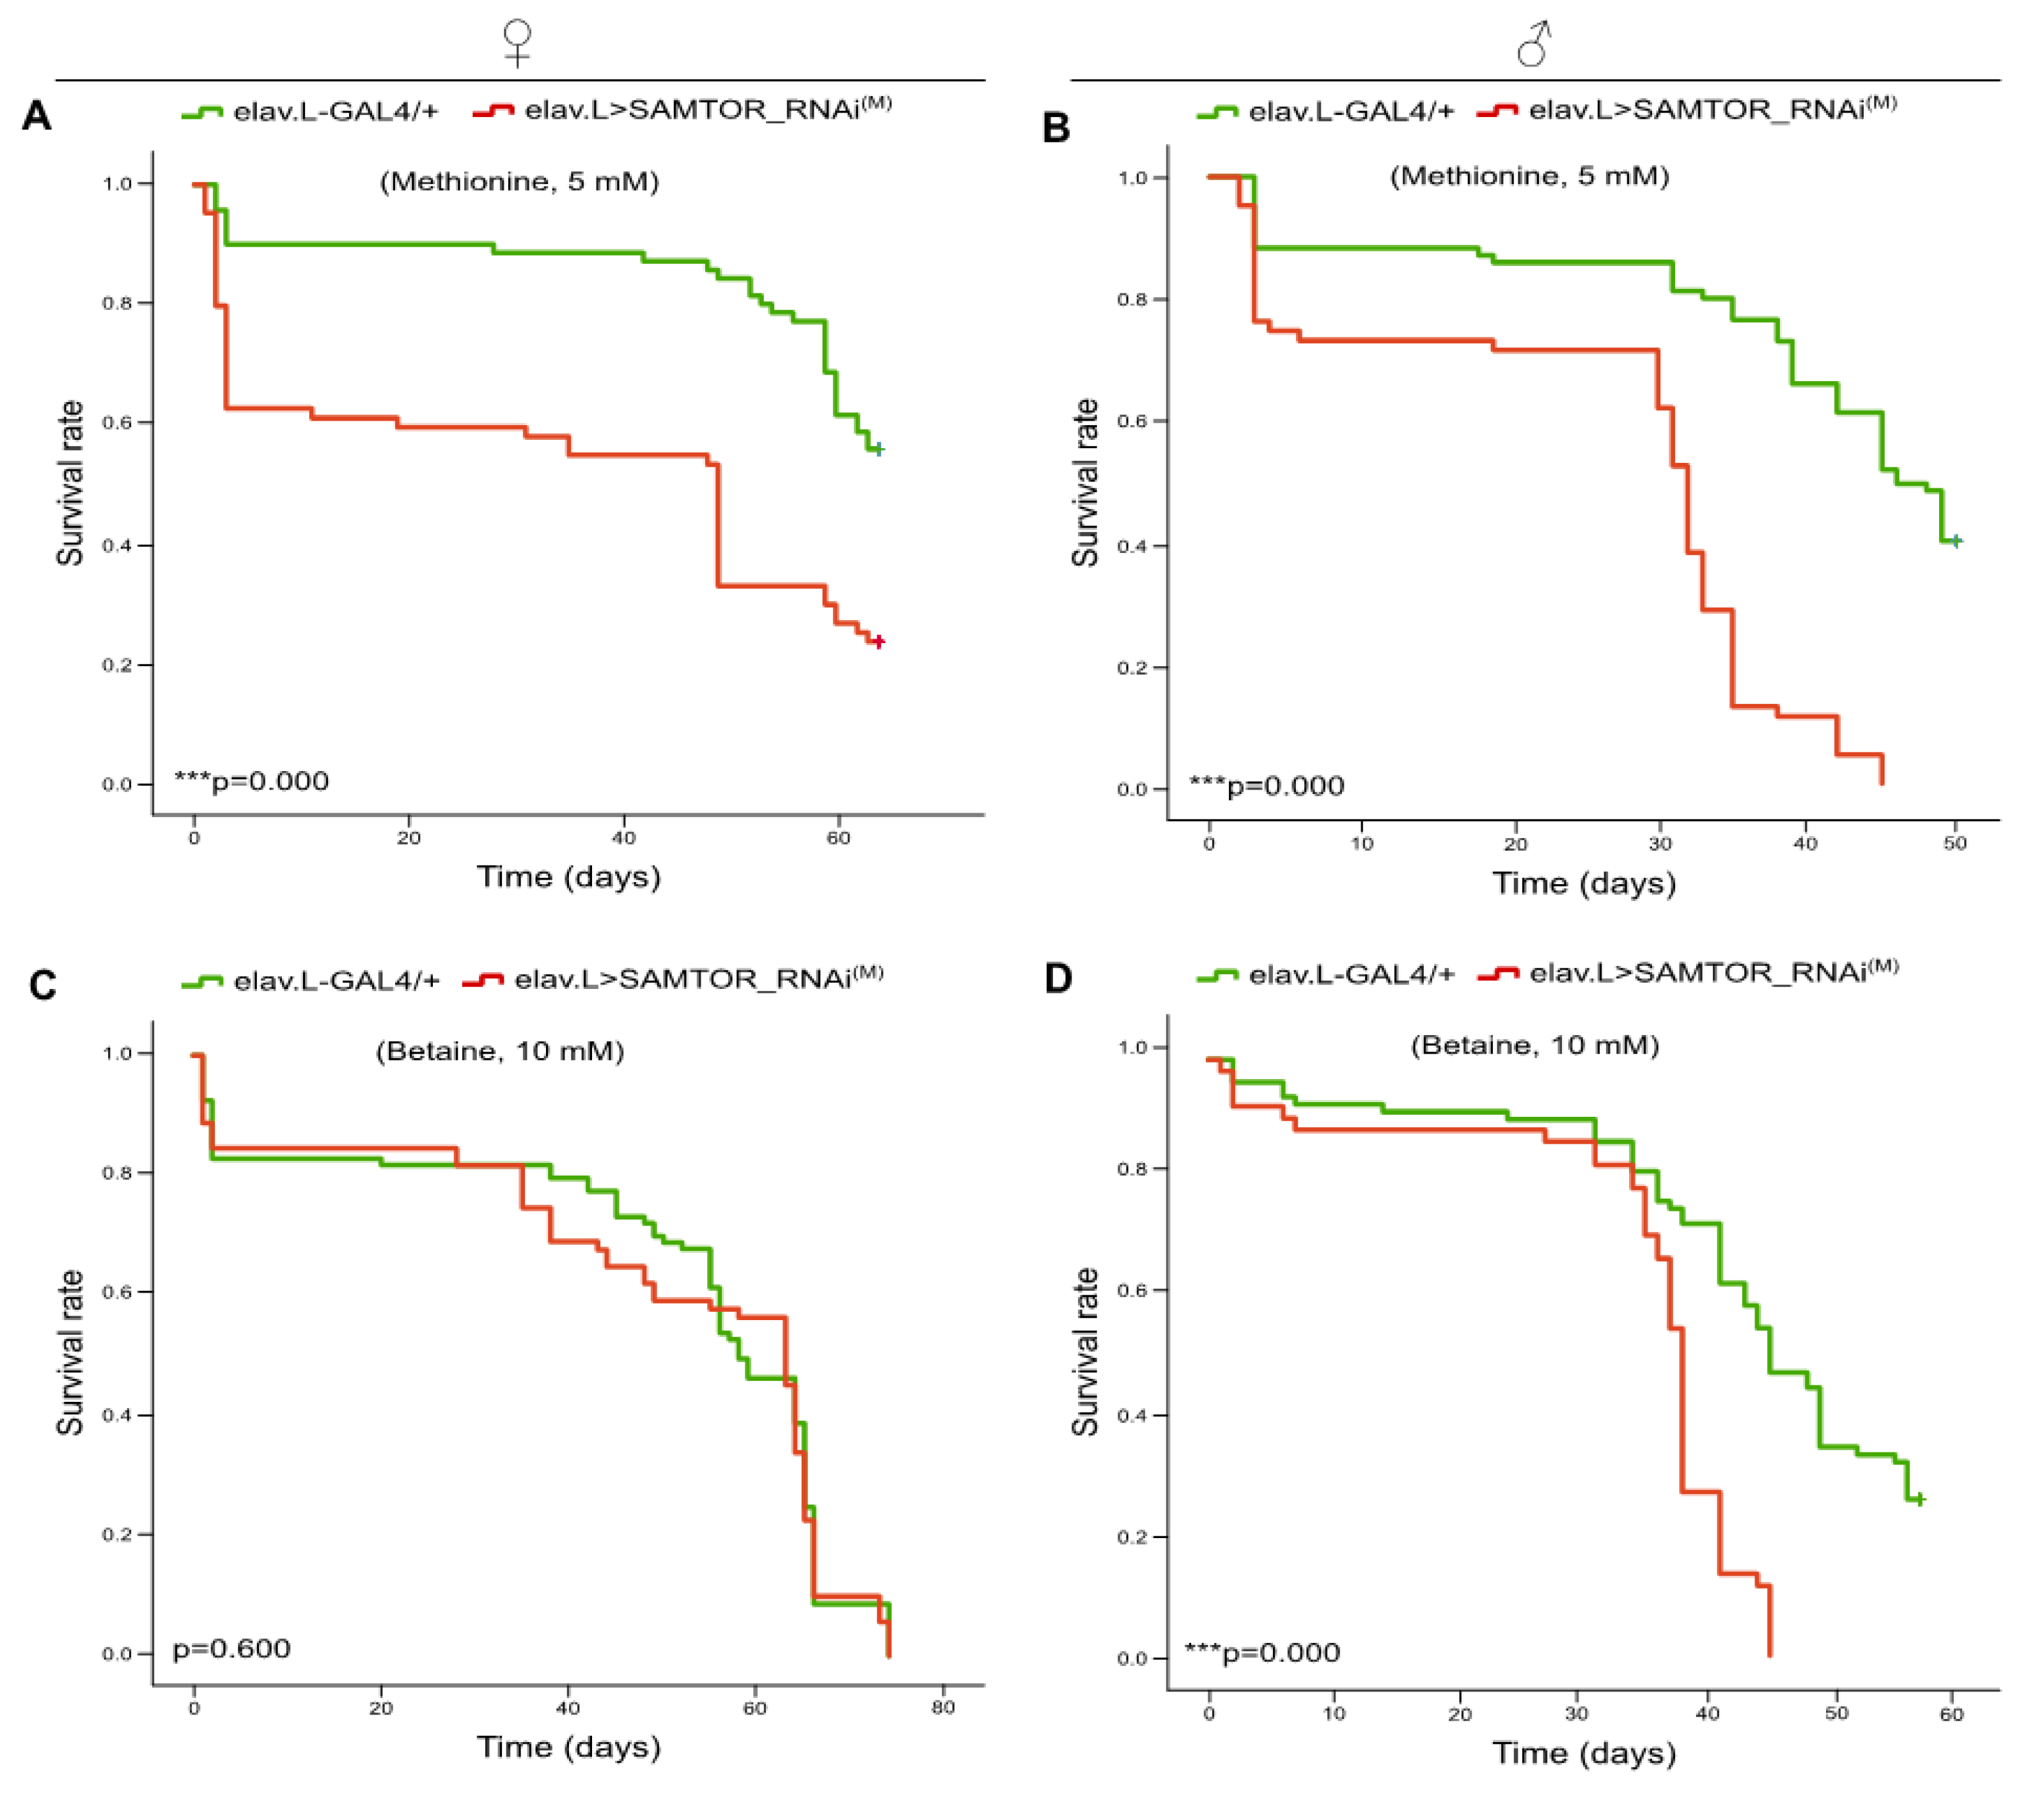
Methionine administration and Betaine-induced elevation of Methionine cellular contents in
dSAMTOR-targeted flies, specifically in their neuronal tissues, resulted in reduced viability profiles. A high proportion of dietary protein or amino acid imbalance has been shown to reduce lifespan in
Drosophila [
37]. Furthermore, Methionine, when administered at high (effective) levels, acts as toxic compound and leads to decreased longevity [
38]. Regarding
Drosophila, the toxic level of Methionine has proved to be 10 mM, for female flies. Nevertheless, it must be the imbalance caused by the excess of Methionine over other amino acids that leads to longevity reduction [
34]. Remarkably, in our
in vivo experimental setting, although Methionine supplementation (5 mM in the food) remains far below the toxic dose (10 mM), the dSAMTOR (moderately) deficient background seems to produce novel complexity levels to the functional interaction of Methionine with other critical amino acids. This new metabolic sub-routine, among others, could cause pathogenic accumulations of unutilized amino acids, due to the inability of dTORC1 to productively sense Methionine actual levels, thereby resulting in severe imbalances in protein synthesis and in detrimentally decreased lifespan. SAMTOR serves as the major mTORC1 sensor for SAM, which directly reflects Methionine reservoir, in tissue cytoplasms. Therefore, in the absence, or even modest downregulation, of (d)SAMTOR protein, SAM, and subsequently Methionine, cannot be efficiently sensed and properly quantified by (d)TORC1 and its interacting components, leading to excessive Methionine- and SAM-derived disequilibrium of amino acid-network metabolism that ultimately compels fly’s organic systems to collapse, in an age-dependent fashion,
in vivo. Surprisingly, as demonstrated by (real-time) quantitative PCR, the (mean) reduction of neuronal-targeted (endogenous)
dSAMTOR-transcript levels was measured at 23% for the modest downregulation-carrying flies (
Figure S2), thereby indicating the importance of Methionine-SAM-dSAMTOR integrity, with even small or moderate decreases in
dSAMTOR gene expression (e.g. 23%) strongly compromising and lowering survival and longevity rates in enriched Methionine environments,
in vivo. This unique genetic and nutritional synergism of (moderately) reduced dSAMTOR activity and excessive Methionine (or, Betaine) quantity, herein unveiled, paves the way for the development of novel and powerful nutrigenomics (nutritional genomics) platforms able to successfully treat human pathologies, via combined management of both genetic and nutritional abnormal profiles.
Betaine is a methyl derivative of Glycine and participates as methyl donor in re-synthesis of Methionine by Betaine-Homocysteine Methyl-Transferase (BHMT), utilizing Homocysteine as critical substrate [
39]. To further explore the role of Methionine-SAM axis in lifespan control, we performed RNAi-mediated downregulation of
dBHMT gene, in tissue-specific manner, throughout
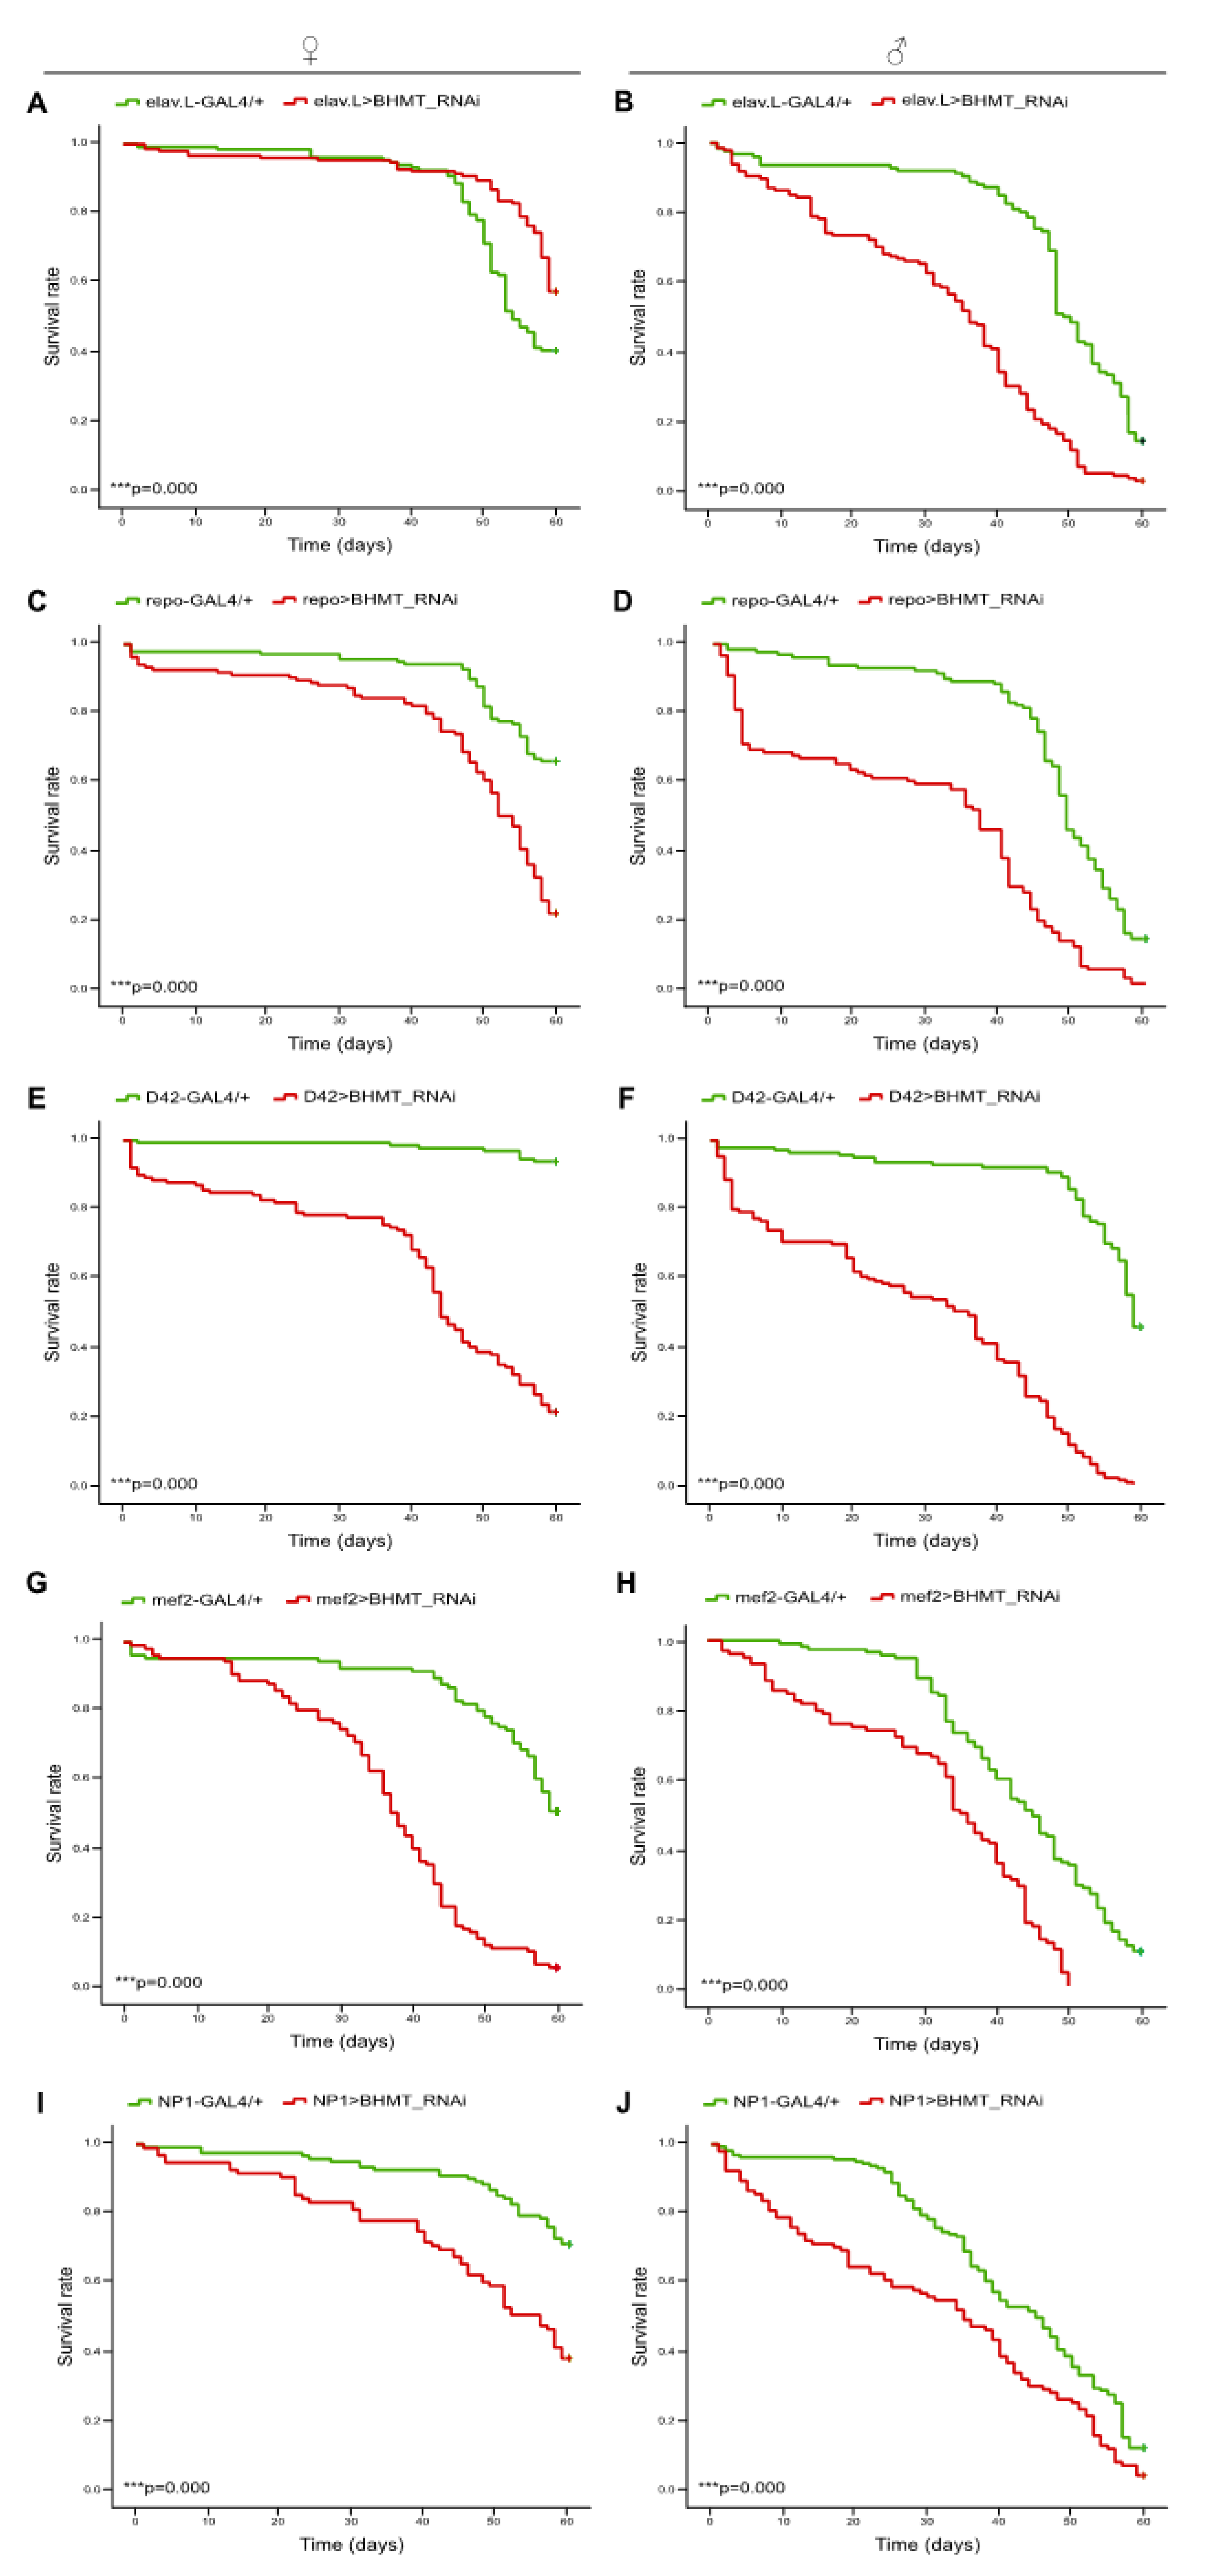
Drosophila lifetime. Genetic targeting of
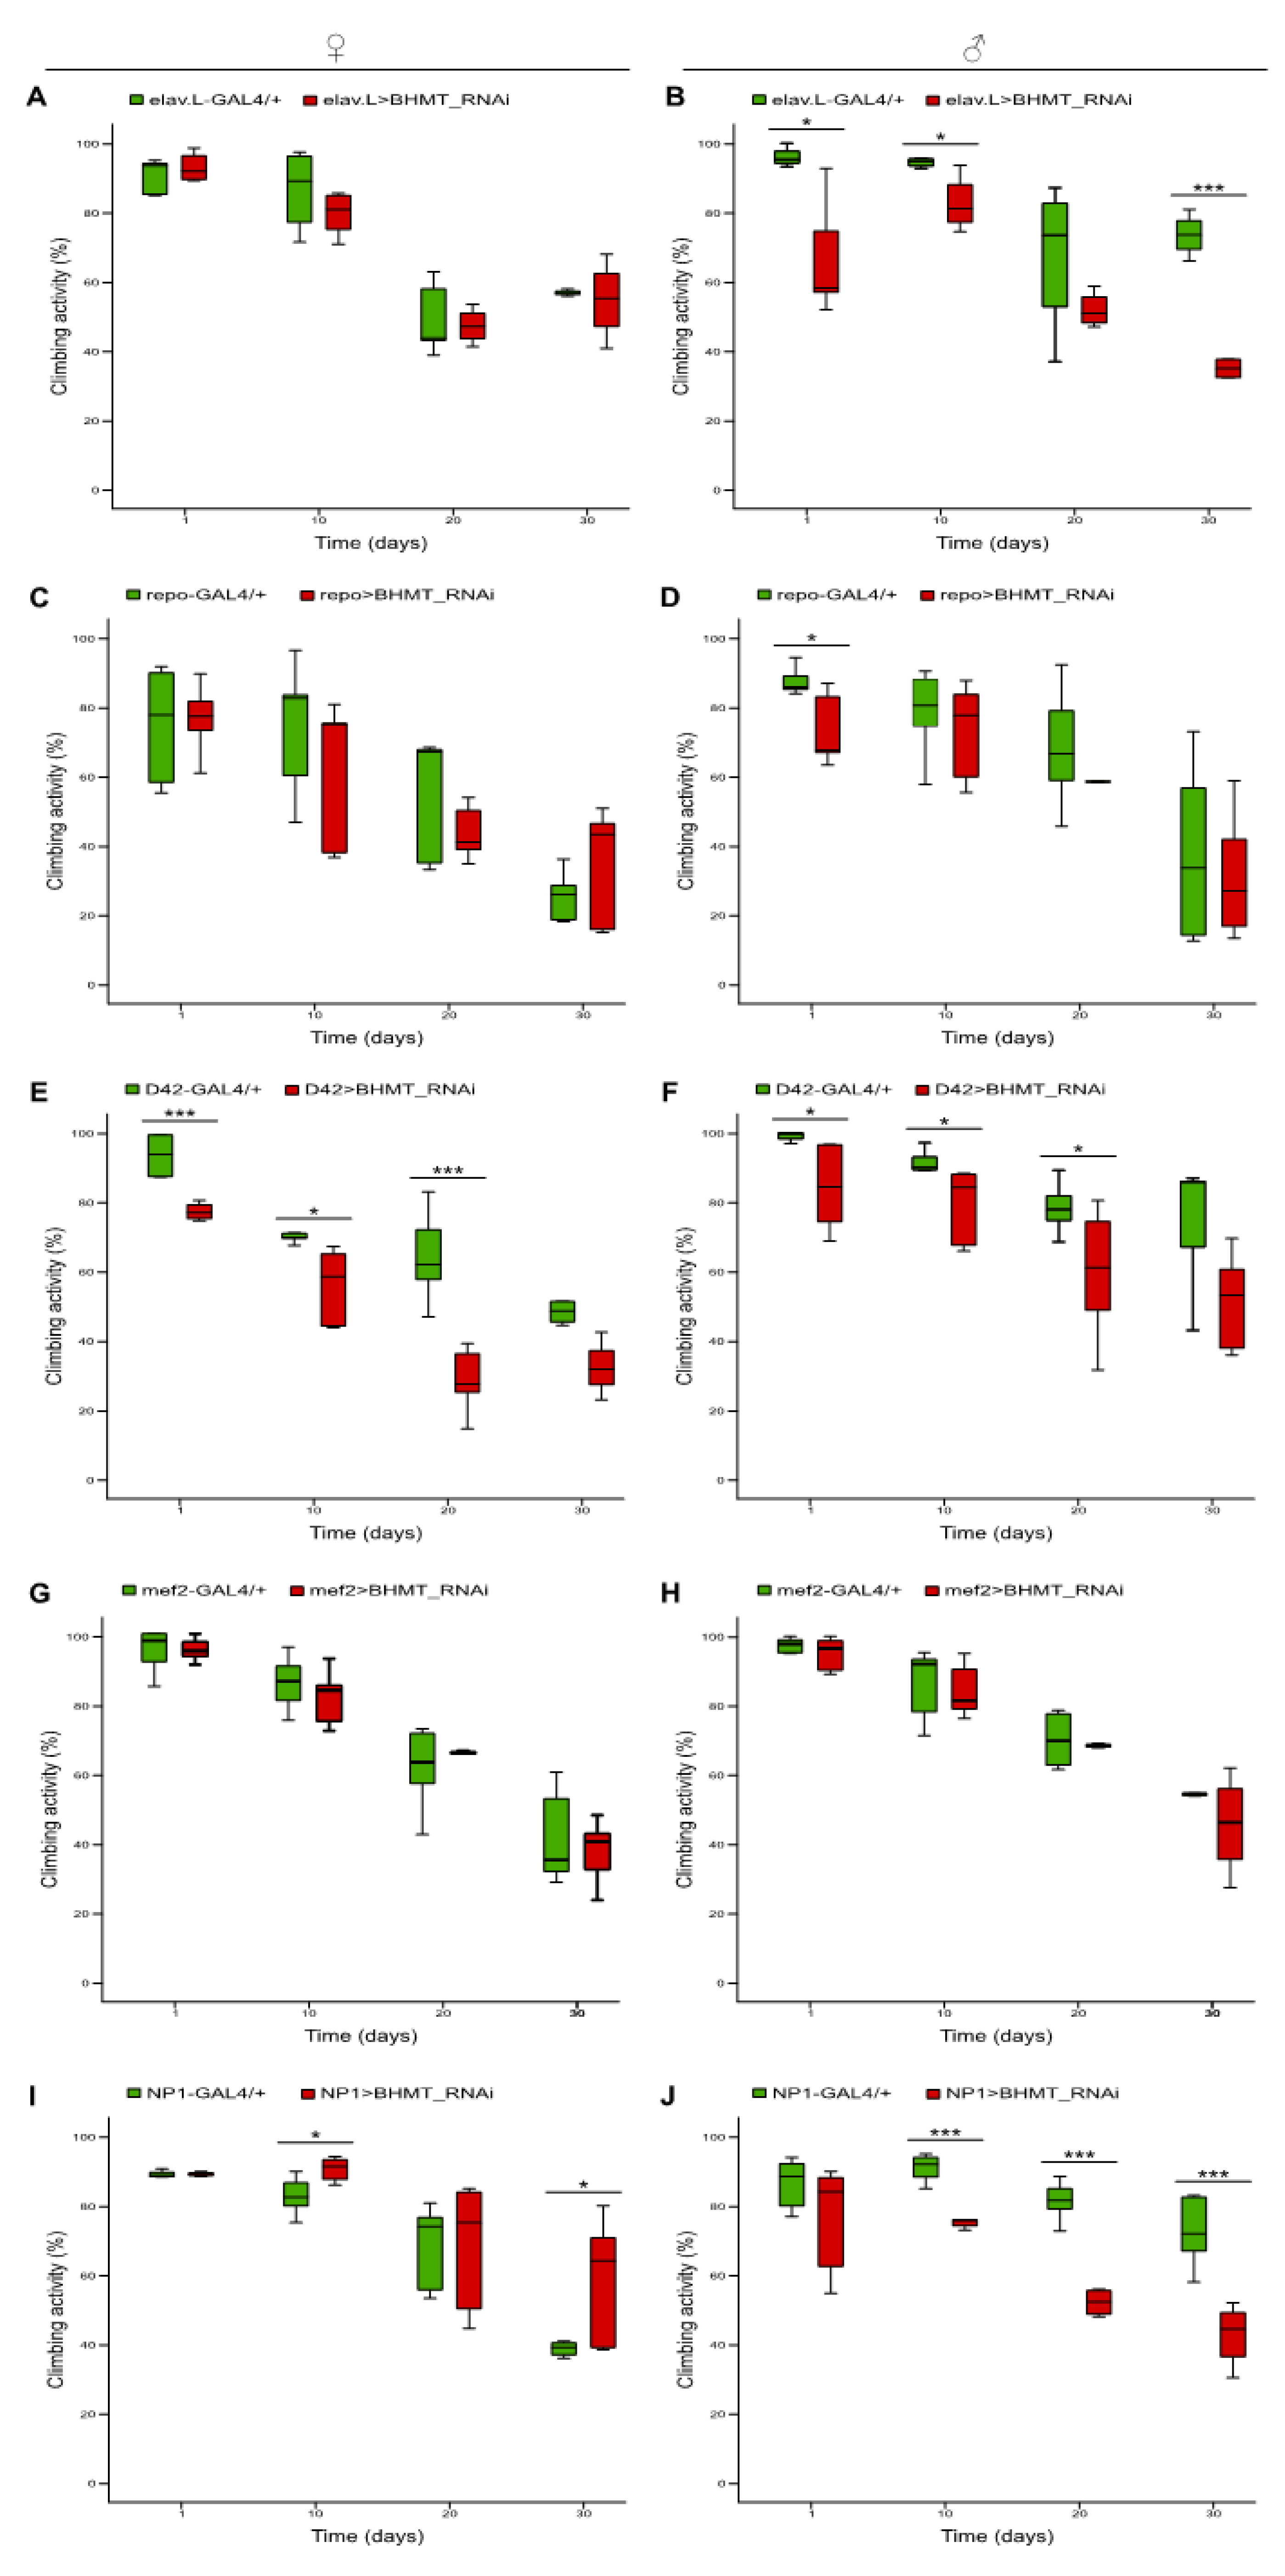
dBHMT resulted in notably reduced lifespan and slightly impaired climbing activity (indicative of neuromuscular function), during aging, in all tissues examined, a (negative geotaxis) phenotype with comparatively more pronounced pathogenic features in male populations. The only exemption has been observed in neuronal tissue-specific targeted female flies, which are presented with a moderately increased viability profile, especially at older ages. Gender-dependent differences in the nutritional requirements of reproduction in
Drosophila have already been reported, and it is possible that dietary control is only successful in one sex, with negative or no effect in the other sex [
40,
41]. Likewise, Methionine restriction results in different responses in (mean) lifespan between female and male flies [
34]. Blockade of Methionine re-synthesis leads to reduced levels of SAM metabolite and, thus, to inhibition of mTORC1 signaling by SAMTOR de-repression. Furthermore, Methionine depletion in human cells causes SAM exhaustion and promotes alterations in histone methylation being mechanistically associated with widespread induction of stress-response pathways, and cell death sub-routines [
18,
42]. It seems that, although Methionine restriction leads to longevity and metabolic health through suppression of (m)TORC1 activity, which is directly coupled with autophagy induction and improved insulin resistance, in
dBHMT-targeted flies, the amount of dietary Methionine intake is not sufficient for cellular homeostasis and physiological methylation events. Potential compensatory adaptations are not able to maintain the essential processes involved in Methionine metabolism, and, therefore, a critical threshold of (d)BHMT-regulated Methionine re-synthesis is necessary for the efficient control of protein synthesis (and methylome architecture), particularly during (fly) aging.
Lifespan represents an overall sum of both positive and negative effects of different signaling pathways related to cell/tissue type, gender, age, nutritional scheme, mutational load, genetic background and reproductive state. Hence, it is difficult to precisely determine the specific role(s) of dSAMTOR-derived signaling in lifespan control. Since the association between SAM and survival/lifespan does not function in a bidirectional fashion, a threshold in SAM levels that regulate organism lifespan is strongly suggested to exist,
in vivo. A similar threshold may likely act for dSAMTOR, as well, with loss or strong downregulation of
dSAMTOR gene expression resulting in embryonic lethal phenotypes for most targeted tissues (
Table 1), and modest reduction of dSAMTOR levels causing comparatively moderate pathologies. Further investigation of the precise molecular mechanisms that describe dSAMTOR critical involvement in lifespan control, neuromuscular performance, tissue development and organ architecture is essential and must be promptly conducted.
4. Materials and Methods
4.1. Fly stocks and culturing conditions (Drosophila husbandry)
Drosophila melanogaster transgenic fly strains were obtained from Bloomington Drosophila Stock Center (NIH P40OD018537) (Indiana, USA): y[1] v[1]; P{y[+t7.7]v[+t1.8]=TRiP.HMJ21611}attP40 (BL: 52944), y[1] v[1]; P{y[+t7.7] v[+t1.8]=TRiP.HMJ21433}attP40 (BL: 54010), y[1] v[1]; P{y[+t7.7]v[+t1.8]=TRiP.HMC02683}attP40 (BL: 43986), w[1118]; P{w[+m*]=GAL4}repo/TM3, Sb[1] (BL: 7415), w[1118]; w[*]; P{w[+mW.hs]=GawB}D42 (BL: 8816), w[*]; P{w[+mC]=GAL4-elav.L}3 (BL: 8760), y[1] w[*]; P{w[+mC]=GAL4-Mef2.R}3 (BL: 27390), w[1118]; P{w[+m*]=GAL4}repo/TM3, Sb[1] (BL: 7415), y[1] w[*]; P{w[+mC]=Act5C-GAL4}25FO1/CyO (BL: 4414), w[1118]; P{w[+mW.hs]=GawB}Bx[MS1096] (BL: 8860), w[*]; P{w[+mC]=GAL4-ninaE.GMR}12 (BL: 1104). The D. melanogaster transgenic NP1-GAL4 fly strain was kindly provided by Eric H. Baehrecke (Department of Cancer Biology, University of Massachusetts Medical School, Worcester, Massachusetts 01605, USA).
All fly stocks were maintained at 25°C, 55-65% relative humidity, on a photoperiod of 12 h light/dark, and a laboratory standard Drosophila medium (6.4% rice flour, 5% tomato paste, 3.2% sugar, 0.8% yeast, 0.8% agar, 0.4% ethanol and 0.4% propionic acid).
4.2. Chemicals and reagents
Methionine (CAS 63-68-3) was provided by Sigma-Aldrich (Missouri, USA) and Betaine (CAS 107-43-7) was obtained from Santa Cruz Biotechnology, Inc. (Heidelberg, Germany). The protein extraction buffer M-PER, Phosphatase Inhibitor Cocktail and Halt Protease Inhibitor Cocktail EDTA-free were purchased from Thermo Fisher Scientific (Darmstadt, Germany). Serine/Threonine Kinase (STK) PamChip and STK reagent kit were provided by PamGene International B.V. (BJ‘s-Hertogenbosch, Netherlands).
4.3. Longevity measurement
Newly emerged (~24 h) female and male flies from each fly cross were collected and kept separate in vials (approximately 20-25 flies per vial). Flies from each vial were transferred into a fresh vial of the same medium twice a week. Survival curves were generated by counting daily deceased flies. For each viability experiment, the sample size was set (at least) at 100 flies per sex and cross (based on the literature), for statistically significant results. Methionine and Betaine were employed to pharmacologically induce dTORC1 activity, and were supplemented to the fly food at concentrations of 5 and 10 mM, respectively. All viability experiments were performed at the same time for control and RNAi-downregulated strains. Experiments were carried out three different times, using independent genetic crosses.
4.4. Negative geotaxis assay
Negative geotaxis (climbing) assay has been established as an in vivo reliable indicator for the estimation of locomotor performance in Drosophila. The climbing assay was performed every 10 days. Flies of both sexes were kept together. Before the experimental procedure, flies were anesthetized and divided into males and females (groups of 20-25 flies). Each experimental group was, then, placed in an empty 100 ml cylinder, with a borderline drawn at the 60 ml mark (10 cm height). To climb (against gravity) simultaneously, flies were gently tapped to the bottom of the cylinder. After time interval of 20 sec, the number of flies that reached or exceeded the 60 ml mark was counted, and five repeats were performed for each group. The same populations were tested at different ages, excluding flies that died or flew away. Control and RNAi-targeted fly groups were examined simultaneously. The total sample size for each fly cross and gender was set (at least) at 100 flies. Experiments were performed three different times, using independent genetic crosses.
4.5. Statistical analysis
The Statistical Package for Social Sciences (IBM SPSS v23.0 for Windows IBM Corp., New York, USA) was used for statistical analysis of the results. Data from longevity experiments were analyzed with the Kaplan-Meier survival test, using log rank and Breslow test statistics. Climbing graphs were drawn, as an average pass rate per genotype/time-point with Sample Standard Deviation (± SSD) value. Differences between compared genotypes were evaluated by the independent t-test analysis. Significance was accepted at p < 0.05 (*), p < 0.01 (**) and p < 0.001 (***).
4.6. Light microscopy (LM)
D. melanogaster wings were visualized using Nikon Digital Eclipse C1 microscope (Nikon; Tokyo, Japan). Every 10 days, for a period of 50 days, flies were anaesthetized with CO2, and their wings were carefully dissected and mounted with DePeX (Serva Electrophoresis GmbH, Heidelberg, Germany) onto glass microscope slides. Morphology and structure of the wings were observed separately for each gender. Wing surface area was measured using the ImageJ software.
4.7. Scanning electron microscopy (SEM)
Surface structural architecture of D. melanogaster compound eyes was visualized through a Phillips 515 scanning electron microscope. Female and male transgenic flies, at the age of 10, 30 and 50 days, were collected and immediately attached to aluminum stubs. Next, flies were air-dried at room temperature, and coated with gold-palladium (60–40%) on Tousimis Samsputter 2a.
4.8. Kinase activity profiling
The PamStation platform and STK (Serine/Threonine: Ser/Thr) PamChip peptide arrays, manufactured by PamGene International B.V. (‘s-Hertogenbosch, The Netherlands), were used. A typical STK PamChip contains 4 (micro-)arrays with 140 Ser/Thr peptides and 4 positive control immobilized peptides each that are covalently attached to a porous material. The peptides harbor phosphorylation sites derived from literature or computational predictions, and are correlated with one or multiple upstream kinases. Kinases in the specimens actively phosphorylate substrates on the PamChip, in the presence of ATP. Phosphorylation is detected by a (phospho-)specific primary antibody and the signal is quantified by a second FITC-conjugated antibody. Protein lysates were prepared from frozen control and RNAi-downregulated Drosophila heads, with M-PER (cell-lysing) buffer being enriched with 1:100 Phosphatase Inhibitor Cocktail and 1:100 Halt Protease Inhibitor Cocktail EDTA-free, and quantified by Bradford assay. 1 µg of total protein from each biological sample was used for Ser/Thr kinase activity profiling, according to the standard protocol provided by the manufacturer. The STK basic mix was composed of the protein lysate, 4 µL 10x PK, 0.4 µL of 100x BSA, 4.0 µL of 4 mM ATP and 0.5 µL STK antibody mix. Total volume of the STK basic mix was adjusted to 40 µL by adding distilled water. The detection mix consisted of 3 µL of 10x antibody buffer (AB), 0.4 µL STK antibody FITC-labeled and 26.6 µL distilled water. After a pre-processing step of 30 cycles (blocking of peptide micro-arrays with 2% BSA), the STK basic mix was applied to each PamChip micro-array. Next, micro-arrays were incubated and washed for 60 cycles (30-90c). Subsequently, the detection mix was added onto the PamChips, and incubation with FITC-labeled STK antibody and image recording by a CCD camera (after 10, 50 and 200 msec) were operated for the next 30 cycles, and a final read was carried out after the end-cycle 124. Data normalization and visualization were performed using the BioNavigator Analysis Software Tool (BNAST).
4.9. RNA extraction and RT-qPCR
Total RNA was isolated from dSAMTOR-targeted fly heads (manually dissected), using TRIzol™ monophasic solution of Phenol and Guanidine Iso-thio-cyanate (Invitrogen, Thermo Fischer Scientific, Waltham, MA, USA), according to manufacturer’s instructions. Concentration and quality of isolated RNA were determined by NanoDrop One UV-Vis Spectro-photometer (Thermo Fischer Scientific, Waltham, MA, USA). RNA samples were reverse transcribed into complementary DNA (cDNA), using SuperScript™ IV First-Strand Synthesis System (Invitrogen, Thermo Fischer Scientific, Waltham, MA, USA), following manufacturer’s protocol.
Relative expression of
dSAMTOR gene was investigated by Reverse Transcription, real-time, quantitative Polymerase Chain Reaction (RT-qPCR), using
dSAMTOR-specific oligonucleotide TaqMan™ probes (Dm01831401_s1, Thermo Fischer Scientific, Waltham, MA, USA), the TaqMan™ Universal PCR Master Mix (Applied Biosystems, Thermo Fischer Scientific, Waltham, MA, USA) and the Applied Biosystems StepOne™ real-time PCR System (Thermo Fischer Scientific, Waltham, MA, USA), according to manufacturer's guidelines. As internal control for normalization of gene-expression data, the housekeeping gene
Actin 5C (Dm02361909_s1, Thermo Fischer Scientific, Waltham, MA, USA) was accordingly used. To ensure reproducibility, each assay was performed with technical triplicates, while three negative controls were also included in the analysis. Relative mRNA levels were calculated using the comparative 2
−ΔΔCt method [
43] that calculates changes in gene expression as a relative fold difference between the gene of interest (
dSAMTOR) and the reference gene (
Actin 5C). Results were presented as a percentage of the relative gene reduction in
dSAMTOR-targeted (specifically in neuronal tissues) flies compared to control populations.
Figure 1.
Strong evolutionary conservation of SAMTOR protein among species. Amino acid sequence alignment among human (Homo sapiens), mouse (Mus musculus), zebrafish (Danio rerio) and fly (Drosophila melanogaster) SAMTOR proteins, via employment of the Clustal Omega bioinformatics tool.
Figure 1.
Strong evolutionary conservation of SAMTOR protein among species. Amino acid sequence alignment among human (Homo sapiens), mouse (Mus musculus), zebrafish (Danio rerio) and fly (Drosophila melanogaster) SAMTOR proteins, via employment of the Clustal Omega bioinformatics tool.
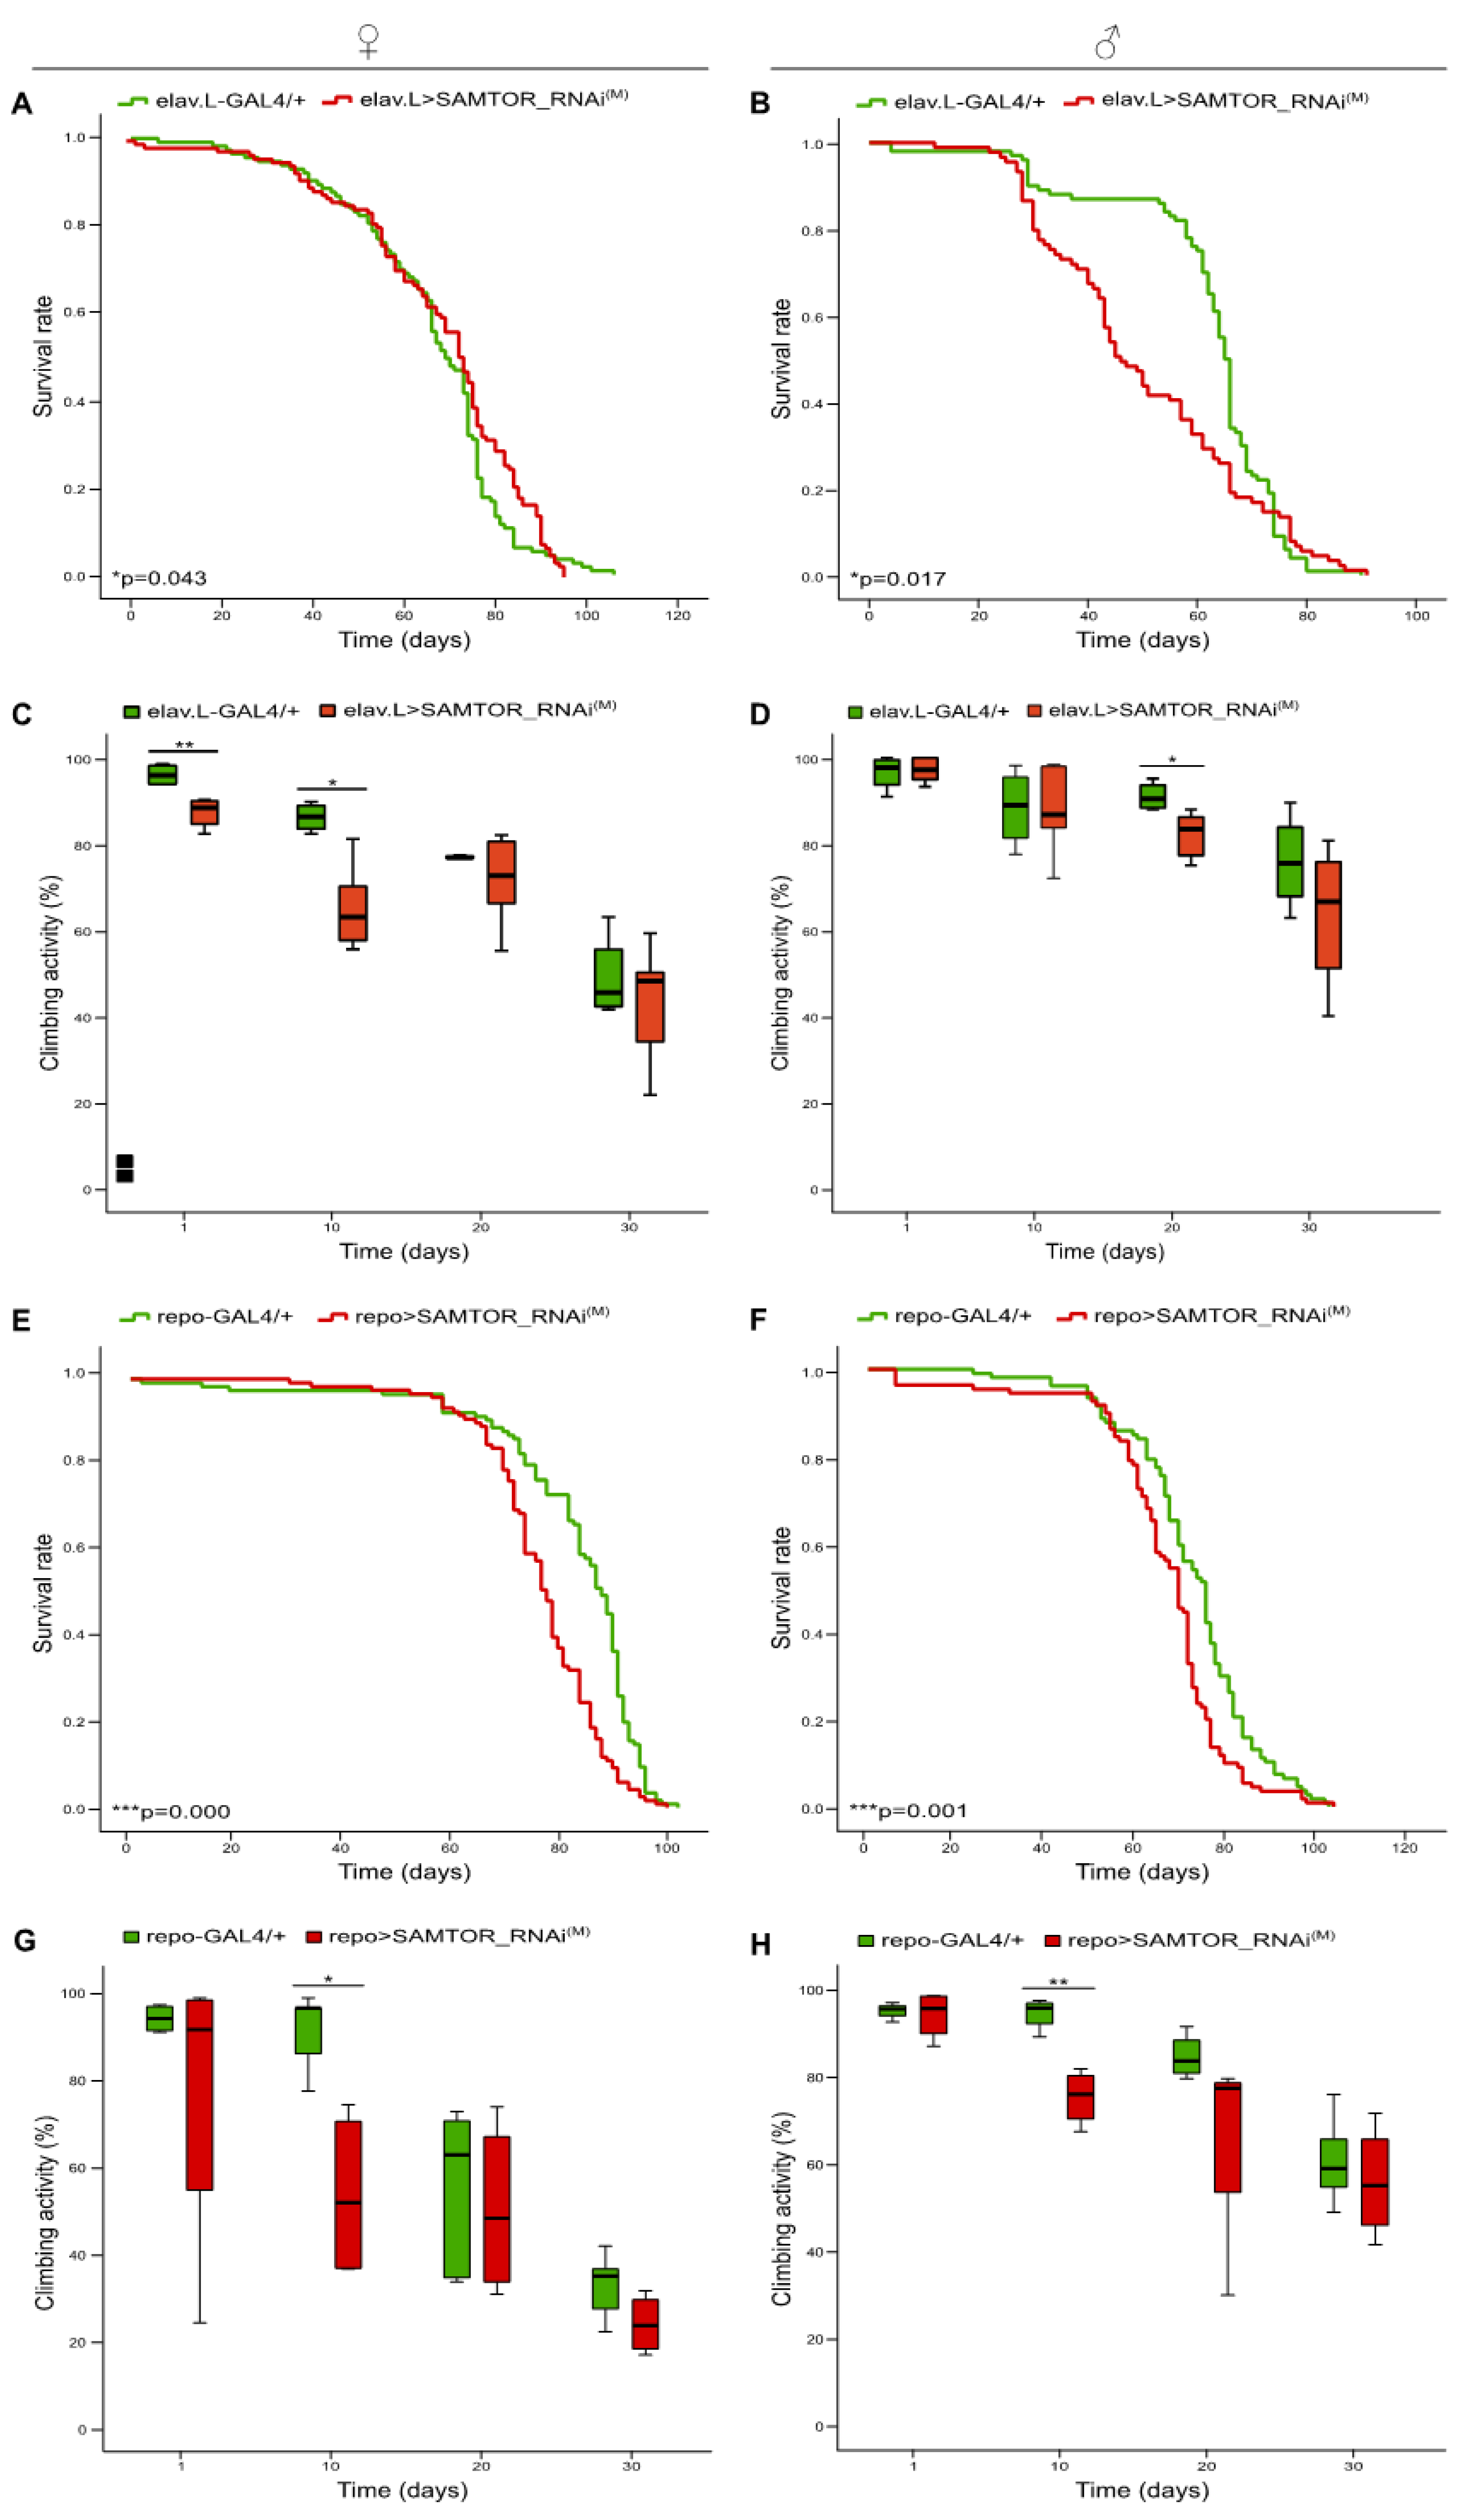
Figure 2.
Neuronal tissue- and glial cell-specific mild proficiency, targeting of dSAMTOR gene. Curves (A, B) and bar charts (C, D) showing the survival rates and (%) climbing capacities, respectively, of female (left panel) and male (right panel) transgenic flies being characterized by RNAi-mediated modest targeting of the dSAMTOR gene, specifically in neuronal tissues (elav.L>SAMTOR_RNAi(M)) (red lines/bars), as compared to control fly populations (elav.L-GAL4/+) (green lines/bars). Curves (E, F) and bar charts (G, H) presenting longevity profiles and (%) climbing patterns, respectively, of female (left panel) and male (right panel) flies with moderate downregulation of the dSAMTOR gene, specifically in glial cells (repo>SAMTOR_RNAi(M)) (red lines/bars), as compared to control flies (repo-GAL4/+) (green lines/bars). *p < 0.05, **p < 0.01 and ***p < 0.001.
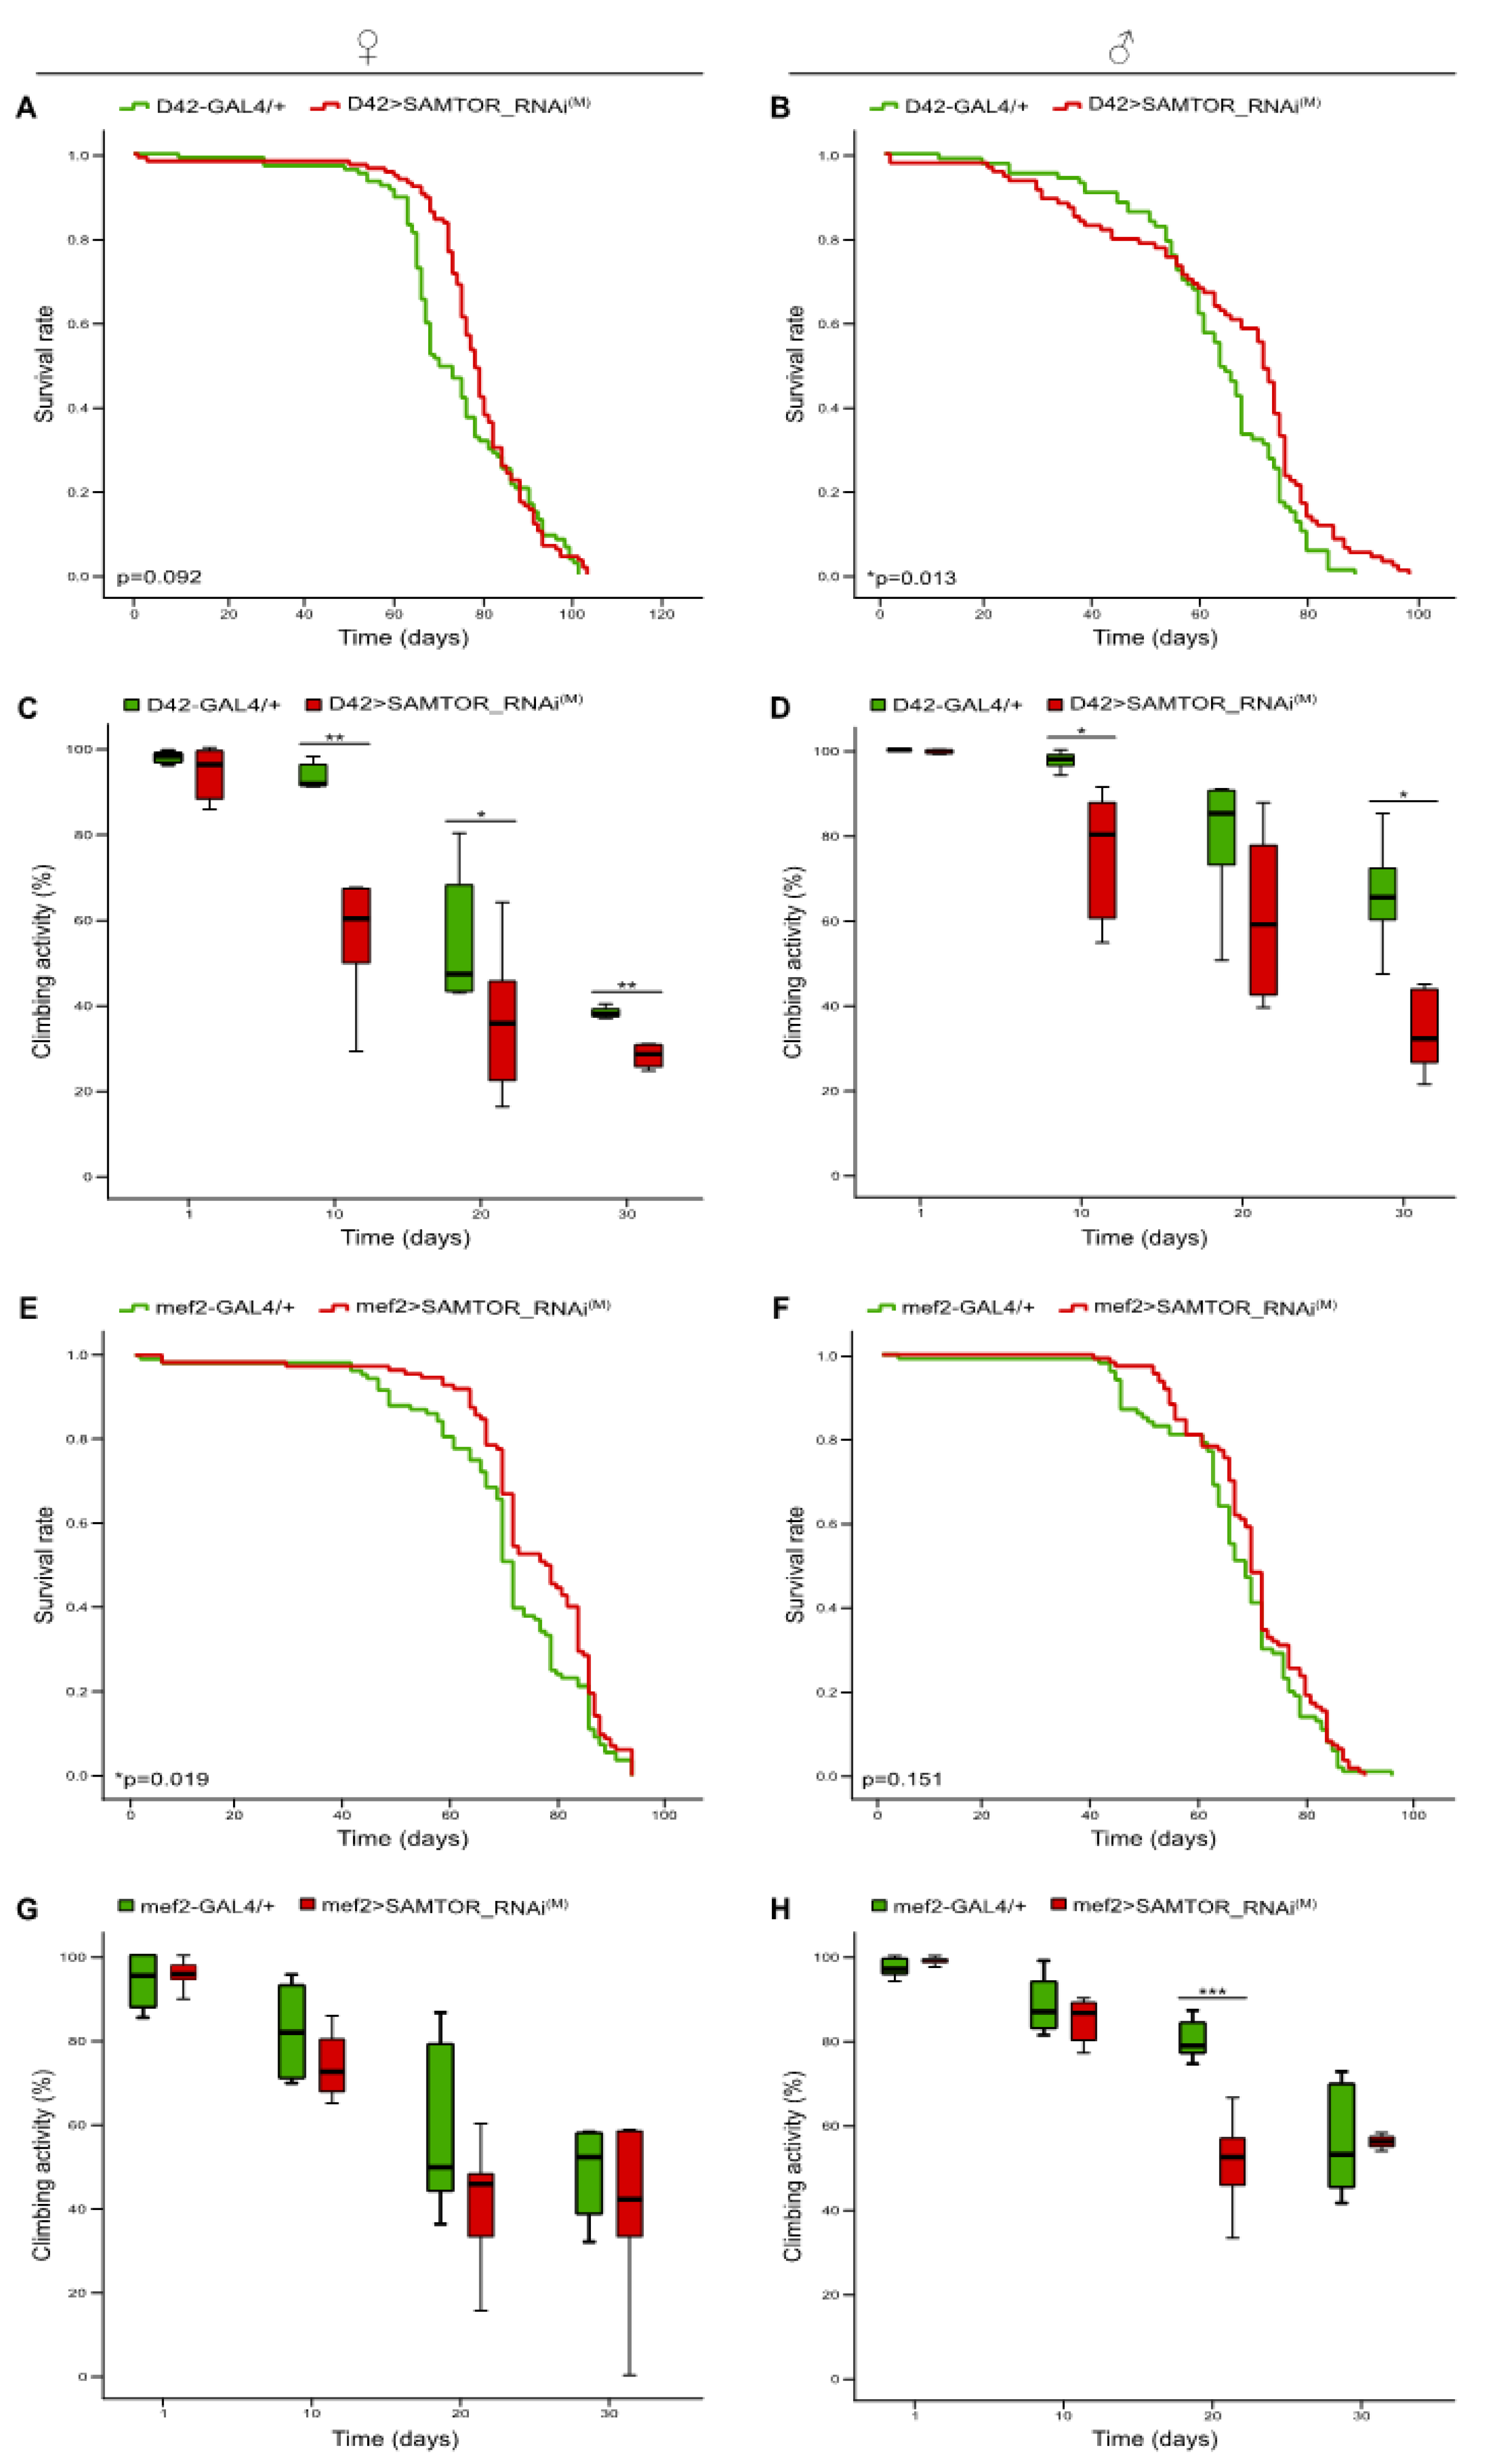
Figure 3.
dSAMTOR modest suppression in motor neurons and muscles. Lifespan curves (A, B) and (%) climbing bar charts (C, D) of female (left panel) and male (right panel) transgenic flies, carrying moderately downregulated dSAMTOR gene expression, specifically in motor neurons (D42>SAMTOR_RNAi(M)) (red lines/bars), as compared to control fly populations (D42-GAL4/+) (green lines/bars). Lifespan profiles (E, F) and climbing activity patterns (G, H) of female (left panel) and male (right panel) flies with mild downregulation of dSAMTOR gene activity, specifically in muscles (mef2>SAMTOR_RNAi(M)) (red lines/bars), as compared to control flies (mef2-GAL4/+) (green lines/bars). *p < 0.05, **p < 0.01 and ***p < 0.001.
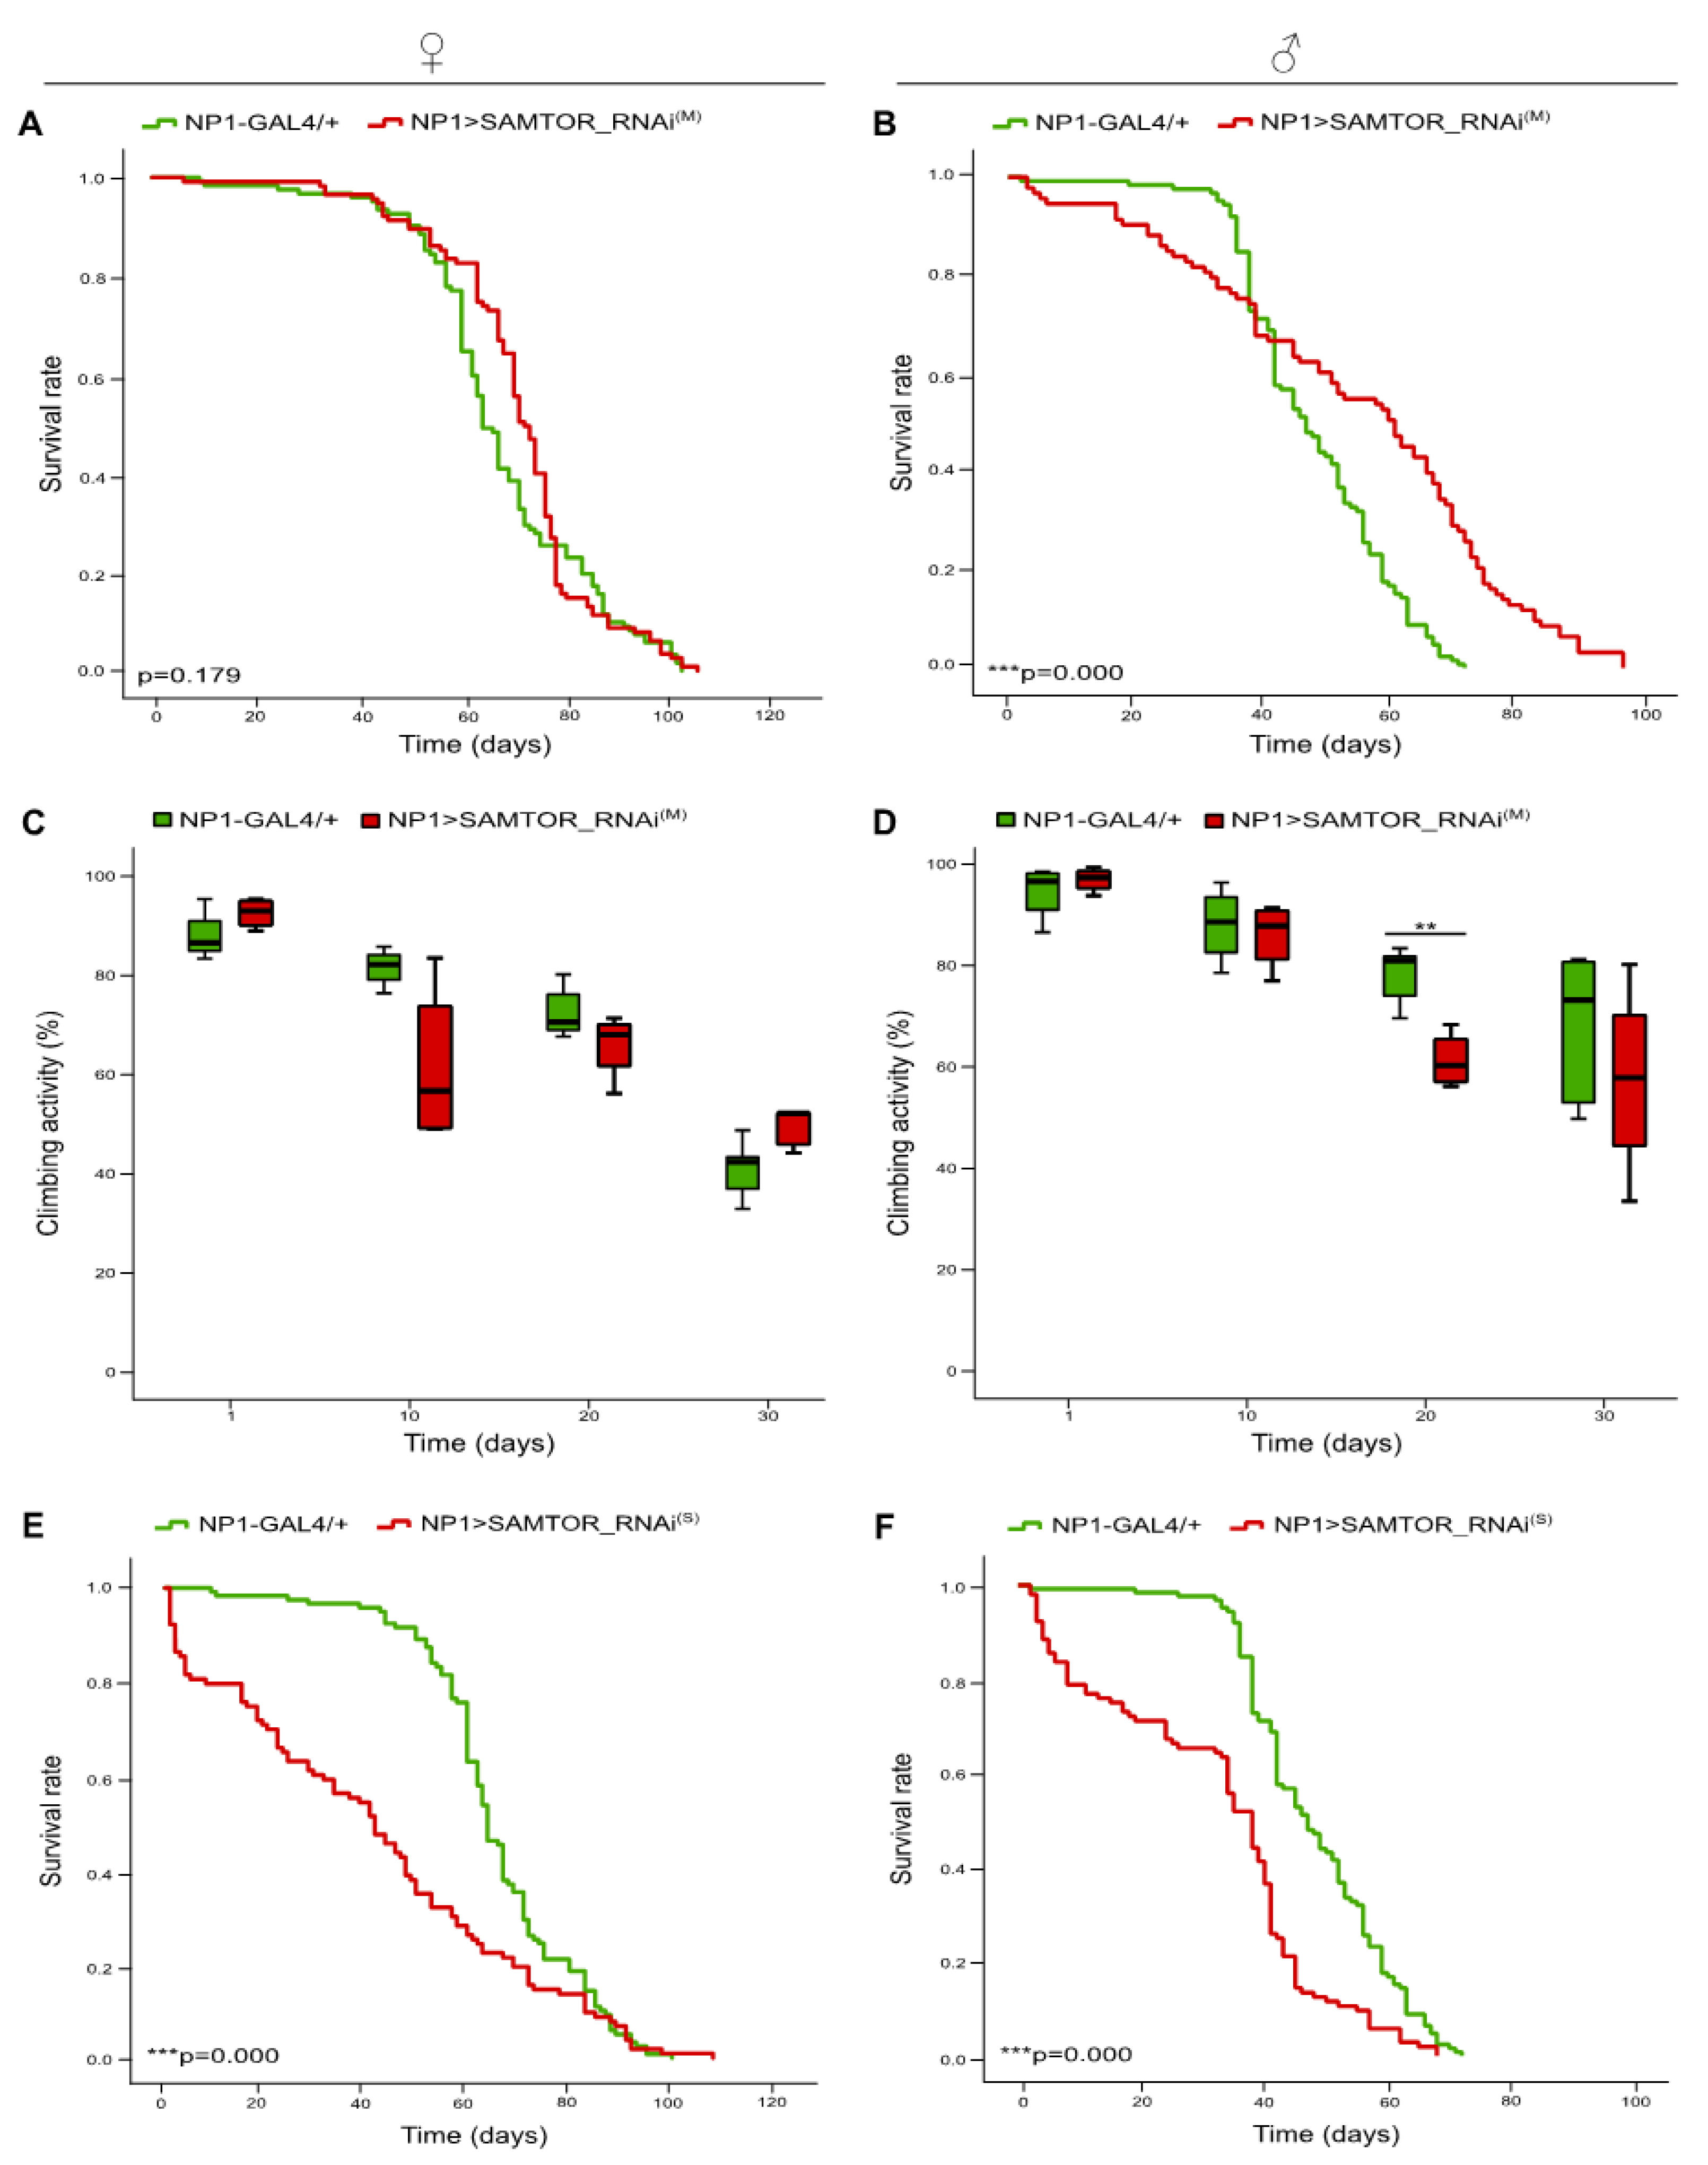
Figure 4.
Differential downregulation of dSAMTOR gene expression in midgut tissues. Lifespan profiles (A, B) and bar charts showing (%) kinetic activities (C, D) of female (left panel) and male (right panel) transgenic flies, with moderate dSAMTOR silencing capacity, specifically in midgut tissues (NP1>SAMTOR_RNAi(M)) (red lines/bars), as compared to control fly populations (NP1-GAL4/+) (green lines/bars). Curves (E, F) presenting the survival rates of female (left panel) and male (right panel) transgenic flies, with strong RNAi-mediated targeting of dSAMTOR gene, specifically in midgut tissues (NP1>SAMTOR_RNAi(S)) (red lines/bars), as compared to control flies (NP1-GAL4/+) (green lines/bars). SAMTOR_RNAi(M): RNAi strain with moderate (M) dSAMTOR silencing capacity. SAMTOR_RNAi(S): RNAi strain with strong (S) dSAMTOR silencing potency. **p < 0.01 and ***p < 0.001.
Figure 5.
Active kinome analysis of dSAMTOR-targeted D. melanogaster brains. (A) CCD images of PamChip arrays. Differential substrate phosphorylation comparing transgenic flies characterized by RNAi-mediated, modestly efficiency, targeting of the dSAMTOR gene, specifically in neuronal tissues (elav.L>SAMTOR_RNAi(M)) and control flies (elav.L-GAL4/+), showing representative Serine/Threonine (Ser/Thr) kinase activities. (B) Heatmaps visualizing Ser/Thr-peptide phosphorylation intensities (log2) of control and dSAMTOR-downregulated flies, specifically in fly brain (neuronal system). (C) Median Final Score Plots of the Ser/Thr kinase activity profiling in dSAMTOR-targeted fly brain (neuronal system) setting. Normalized kinase activity statistics is a mathematical-based algorithm indicating the estimated relative kinase activity, while the specificity score reflects the reliability and accuracy of the prediction. In particular, the x-axis indicates the values for the normalized kinase activity statistics (e.g., negative value [s < 0] = “the activity of the corresponding Ser/Thr kinase is decreased”). The specificity score (Qsp) is indicated by the colour of the points. Qsp logarithmic values > 1.3 (white [Qsp = 1.3] to red colour [Qsp ≥ 2]) were considered as statistically relevant.
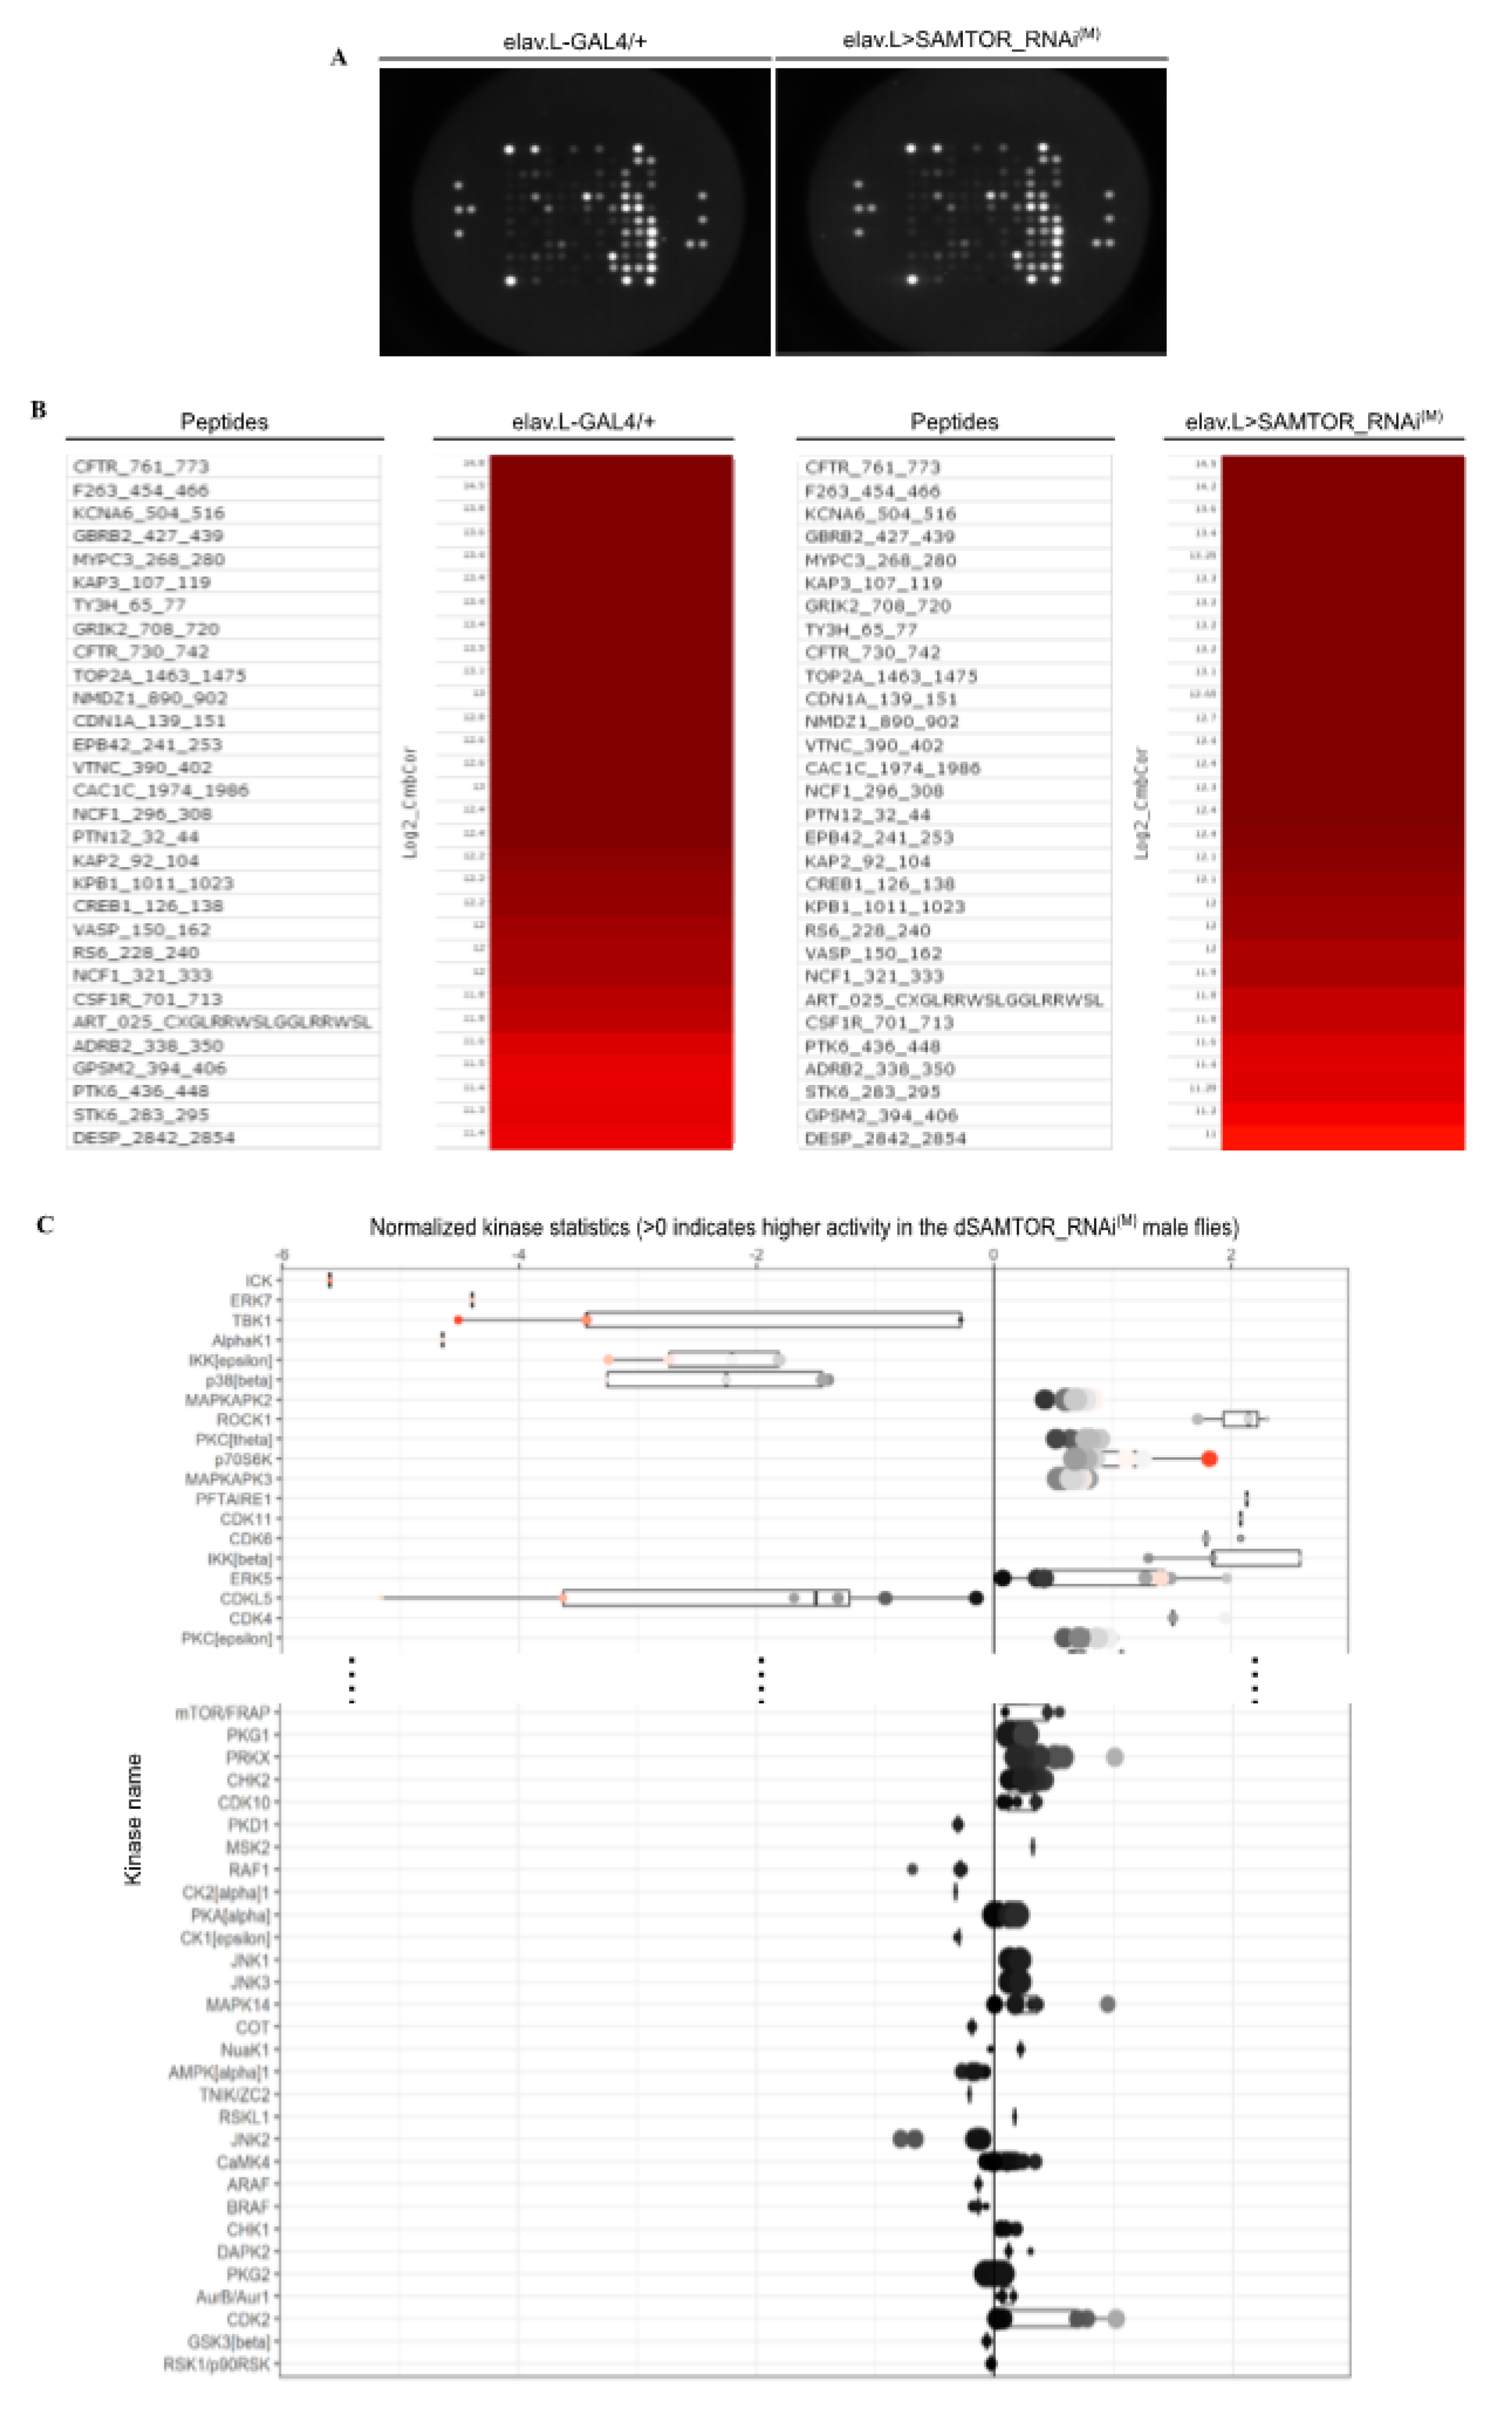
Figure 6.
Different levels of dSAMTOR gene downregulation result in distinct patterns of eye and wing pathology in Drosophila. (A) Scanning electron microscopy (SEM) images of compound eyes derived from male transgenic flies at the age of 10, 30 and 50 days, with moderate (M) (ninaE.GMR>SAMTOR_RNAi(M)) (d-f) and strong (S) (ninaE.GMR>SAMTOR_RNAi(S)) (g-i), respective, RNAi-mediated targeting of the dSAMTOR gene, as compared to control settings (ninaE.GMR-GAL4/+) (a-c). Scale Bars: 100 μm. (B) Wing images of female mutant (top panel) flies carrying moderate (M) (bxMS1096>SAMTOR_RNAi(M)) (b) and strong (S) (bxMS1096>SAMTOR_RNAi(S)) (c) dSAMTOR, respective, gene silencing, as compared to control fly populations (bxMS1096-GAL4/+) (a). Wing images of male mutant (bottom panel) flies, with moderate (M) (bxMS1096>SAMTOR_RNAi(M)) (e) and strong (S) (bxMS1096>SAMTOR_RNAi(S)) (f) dSAMTOR gene downregulation, as compared to control fly wings (bxMS1096-GAL4/+) (d). Scale Bars: (a), (b), (d) and (e): 200 µm; (c) and (f): 100 μm. SAMTOR_RNAi(M): RNAi strain with moderate (M) silencing capacity. SAMTOR_RNAi(S): RNAi strain with strong (S) silencing potency. Naming of normal (control) wing veins is indicated (L1-L6, a-cv and p-cv) (a) and (d).
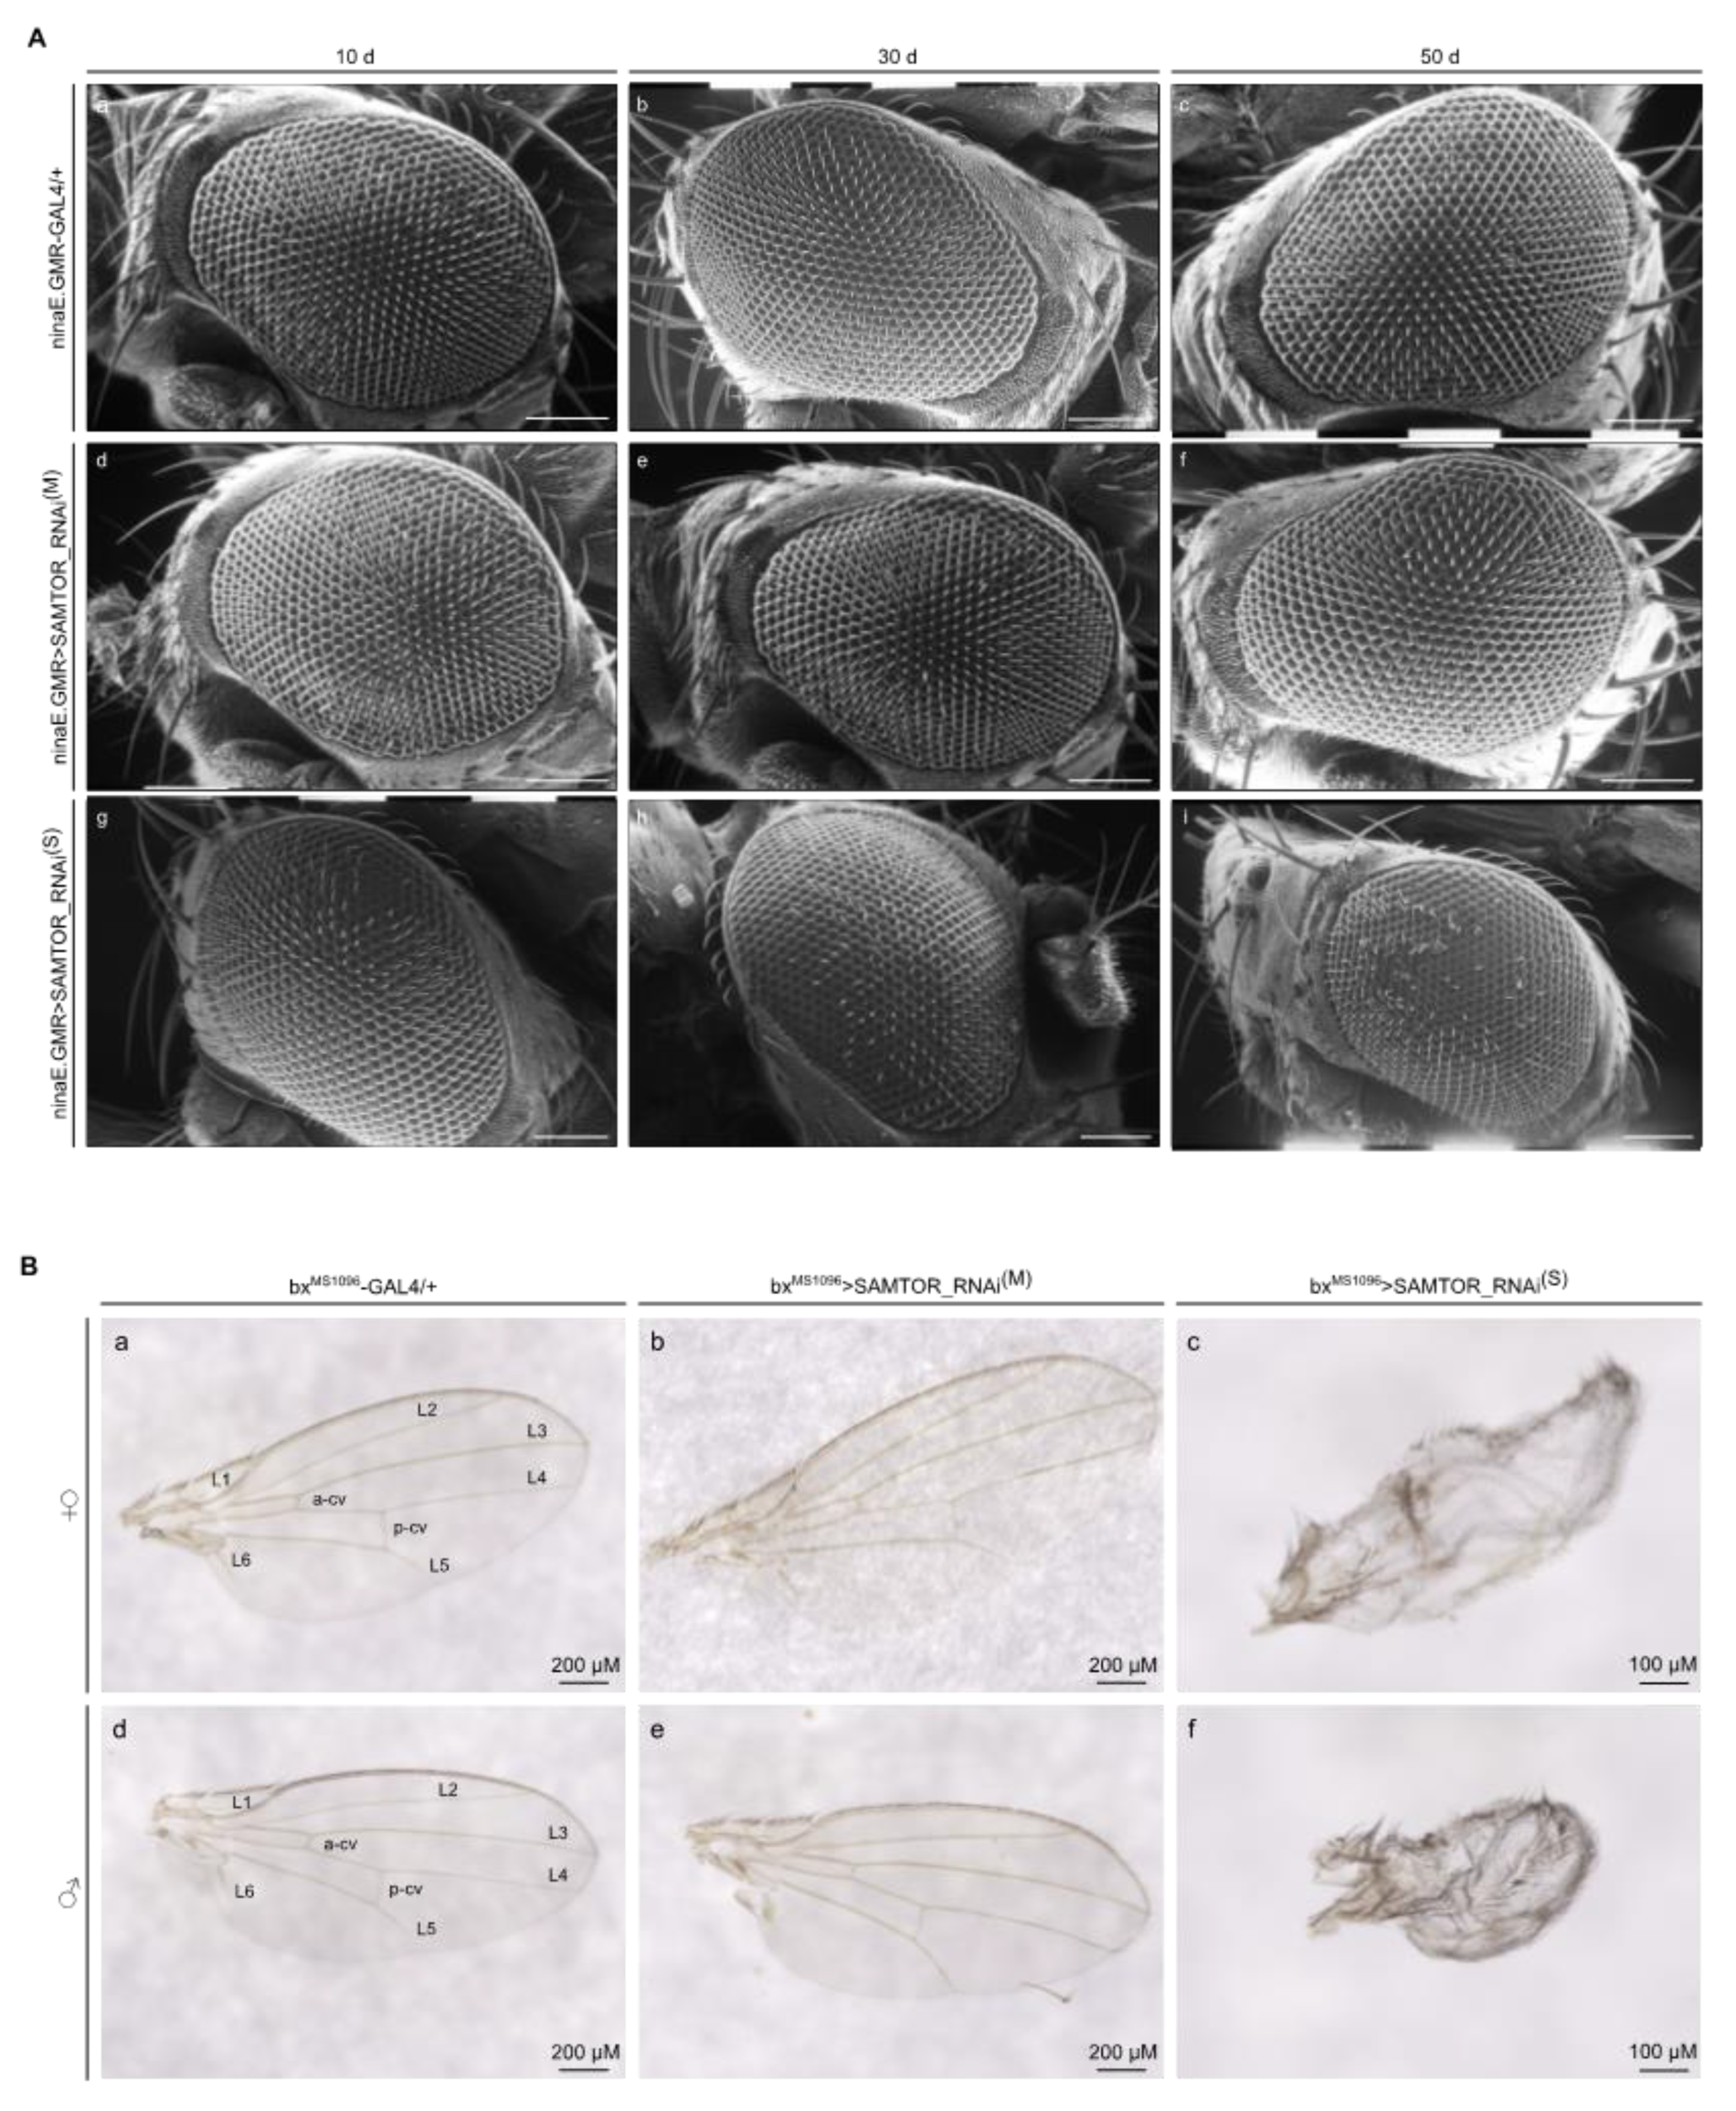
Figure 7.
(A) Schematic illustration of lysosome-associated components being critically involved in the Methionine-sensing pathway, upstream of mTORC1. BHMT uses Betaine to methylate Homocysteine directly into Methionine, which is, next, converted into SAM. SAMTOR has the ability to sense Methionine in the form of SAM. When SAM binds to SAMTOR, it (SAMTOR) dissociates from GATOR1 and leads to mTORC1 activation. (B) Strong evolutionary conservation of BHMT enzyme among species. Amino acid sequence alignment among human (Homo sapiens), mouse (Mus musculus), zebrafish (Danio rerio) and fly (Drosophila melanogaster) BHMT proteins, via employment of the Clustal Omega bioinformatics tool. BHMT: Betaine-Homocysteine S-Methyl-Transferase; MAT: Methionine Adenosyl-Transferase; ΜΤS: Methyltransferases; SAHH: S-Adenosyl-L-Homocysteine Hydrolase; SAM: S-Adenosyl-Methionine.
Figure 8.
Methionine and Betaine treatment of dSAMTOR, mildly, targeted flies, specifically in neuronal tissues, results in reduced viability. (A, B) Survival curves of female (left panel) and male (right panel) dSAMTOR, moderately, downregulated flies, specifically in neuronal tissues (elav.L>SAMTOR_RNAi(M)), in the presence of Methionine (5 mM) (supplemented into the food) for ~60 consecutive days (red lines), as compared to Methionine-exposed control (elav.L-GAL4/+) populations (green lines). (C, D) Survival rates of female (left panel) and male (right panel) dSAMTOR, modestly, targeted flies, specifically in neuronal tissues (elav.L>SAMTOR_RNAi(M)), after Betaine administration (10 mM) (in the food) for ~70 consecutive days (red lines), as compared to control (elav.L-GAL4/+) flies treated with the same dose of Betaine (green lines). ***p < 0.001.
Figure 9.
dBHMT gene suppression reduces Drosophila’s viability in diverse type of tissues. Lifespan profiles of Drosophila female (left panels) and male (right panels) transgenic flies, being characterized by RNAi-mediated and tissue-specific targeting of the dBHMT gene in: (A, B) neuronal tissues (elav.L>BHMT_RNAi), (C, D) glia cells (repo>BHMT_RNAi), (E, F) motor neurons (D42>BHMT_RNAi), (G, H) muscles (mef2>BHMT_RNAi) and (I, J) intestine (midgut) tissues (NP1>BHMT_RNAi). ***p < 0.001.
Figure 10.
Downregulation of dΒHΜΤ gene expression differentially impairs climbing capacity during Drosophila aging, revealing tissue-specific signatures. Climbing activity (negative geotaxis) patterns of female (left panels) and male (right panels) transgenic flies, being characterized by tissue-specific dΒHΜΤ gene targeting in: (A, B) neuronal tissues (elav.L>BHMT_RNAi), (C, D) glia cells (repo>BHMT_RNAi), (E, F) motor neurons (D42>BHMT_RNAi), (G, H) muscles (mef2>BHMT_RNAi) and (I, J) intestine (midgut) tissues (NP1>BHMT_RNAi). *p < 0.05 and ***p < 0.001.
Figure 11.
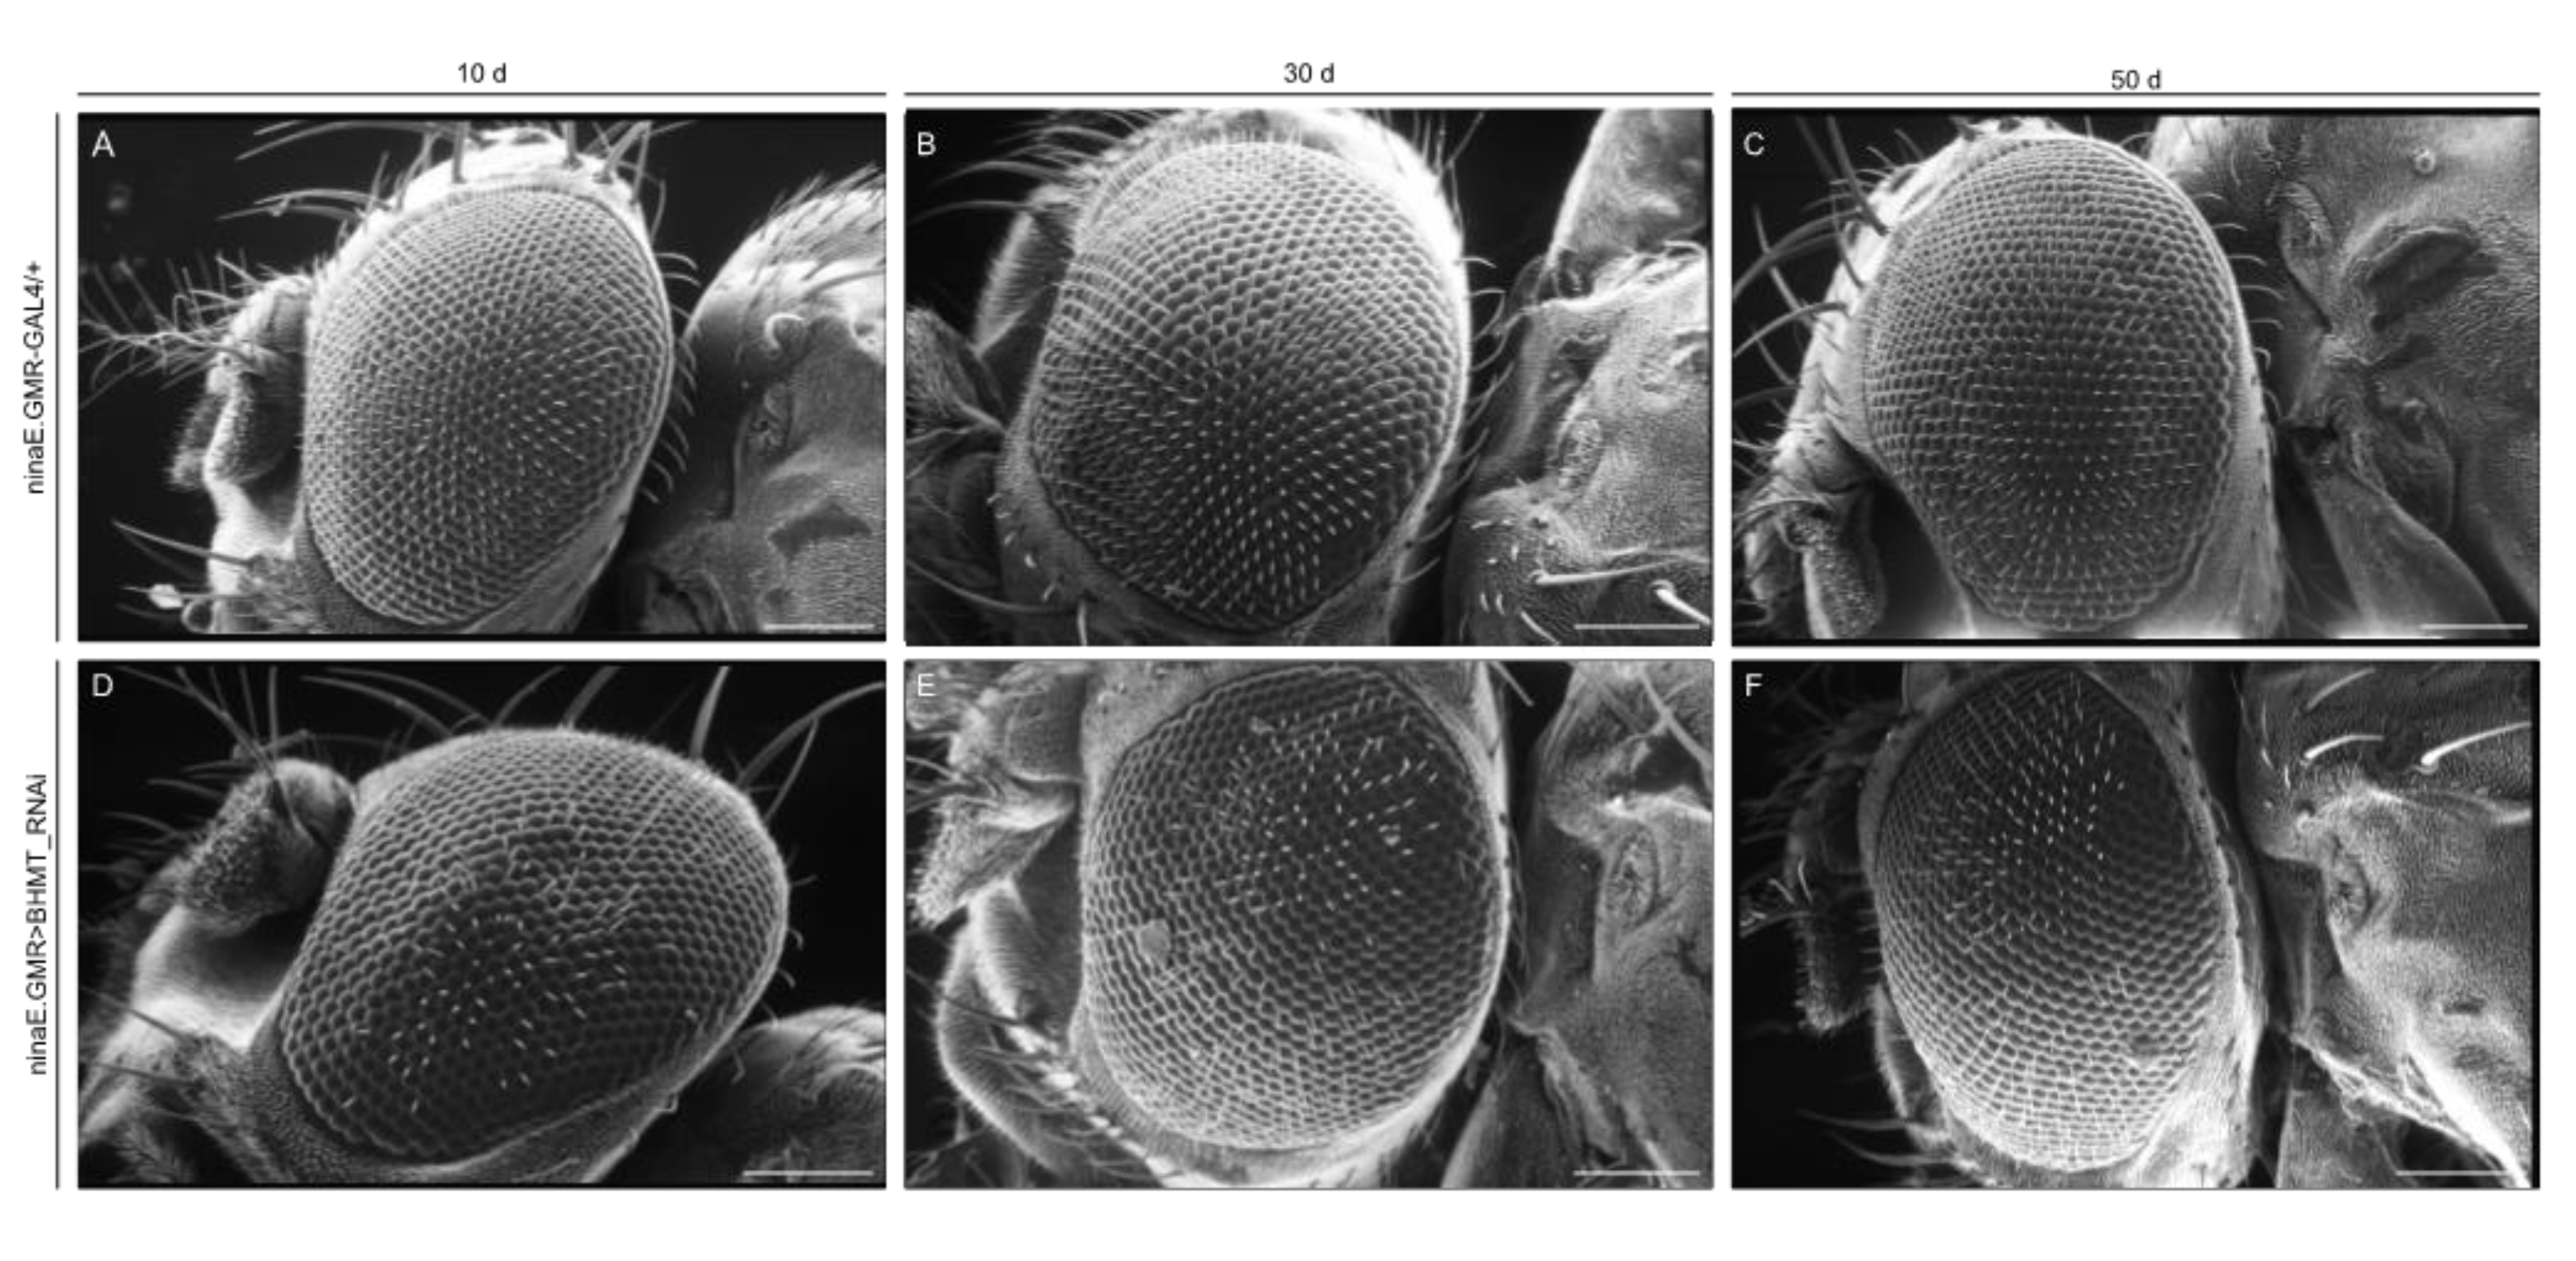
dBHMT gene downregulation causes eye dysmorphia in Drosophila: an age-dependent pathology. Scanning electron microscopy (SEM) images of compound eyes derived from control (ninaE.GMR-GAL4/+) (A-C) and dBHMT-targeted, specifically in the eye (ninaE.GMR>BHMT_RNAi), (D-F) male transgenic flies, at the age of 10, 30 and 50 days (d). Scale Bars: 100 μm.
Figure 12.
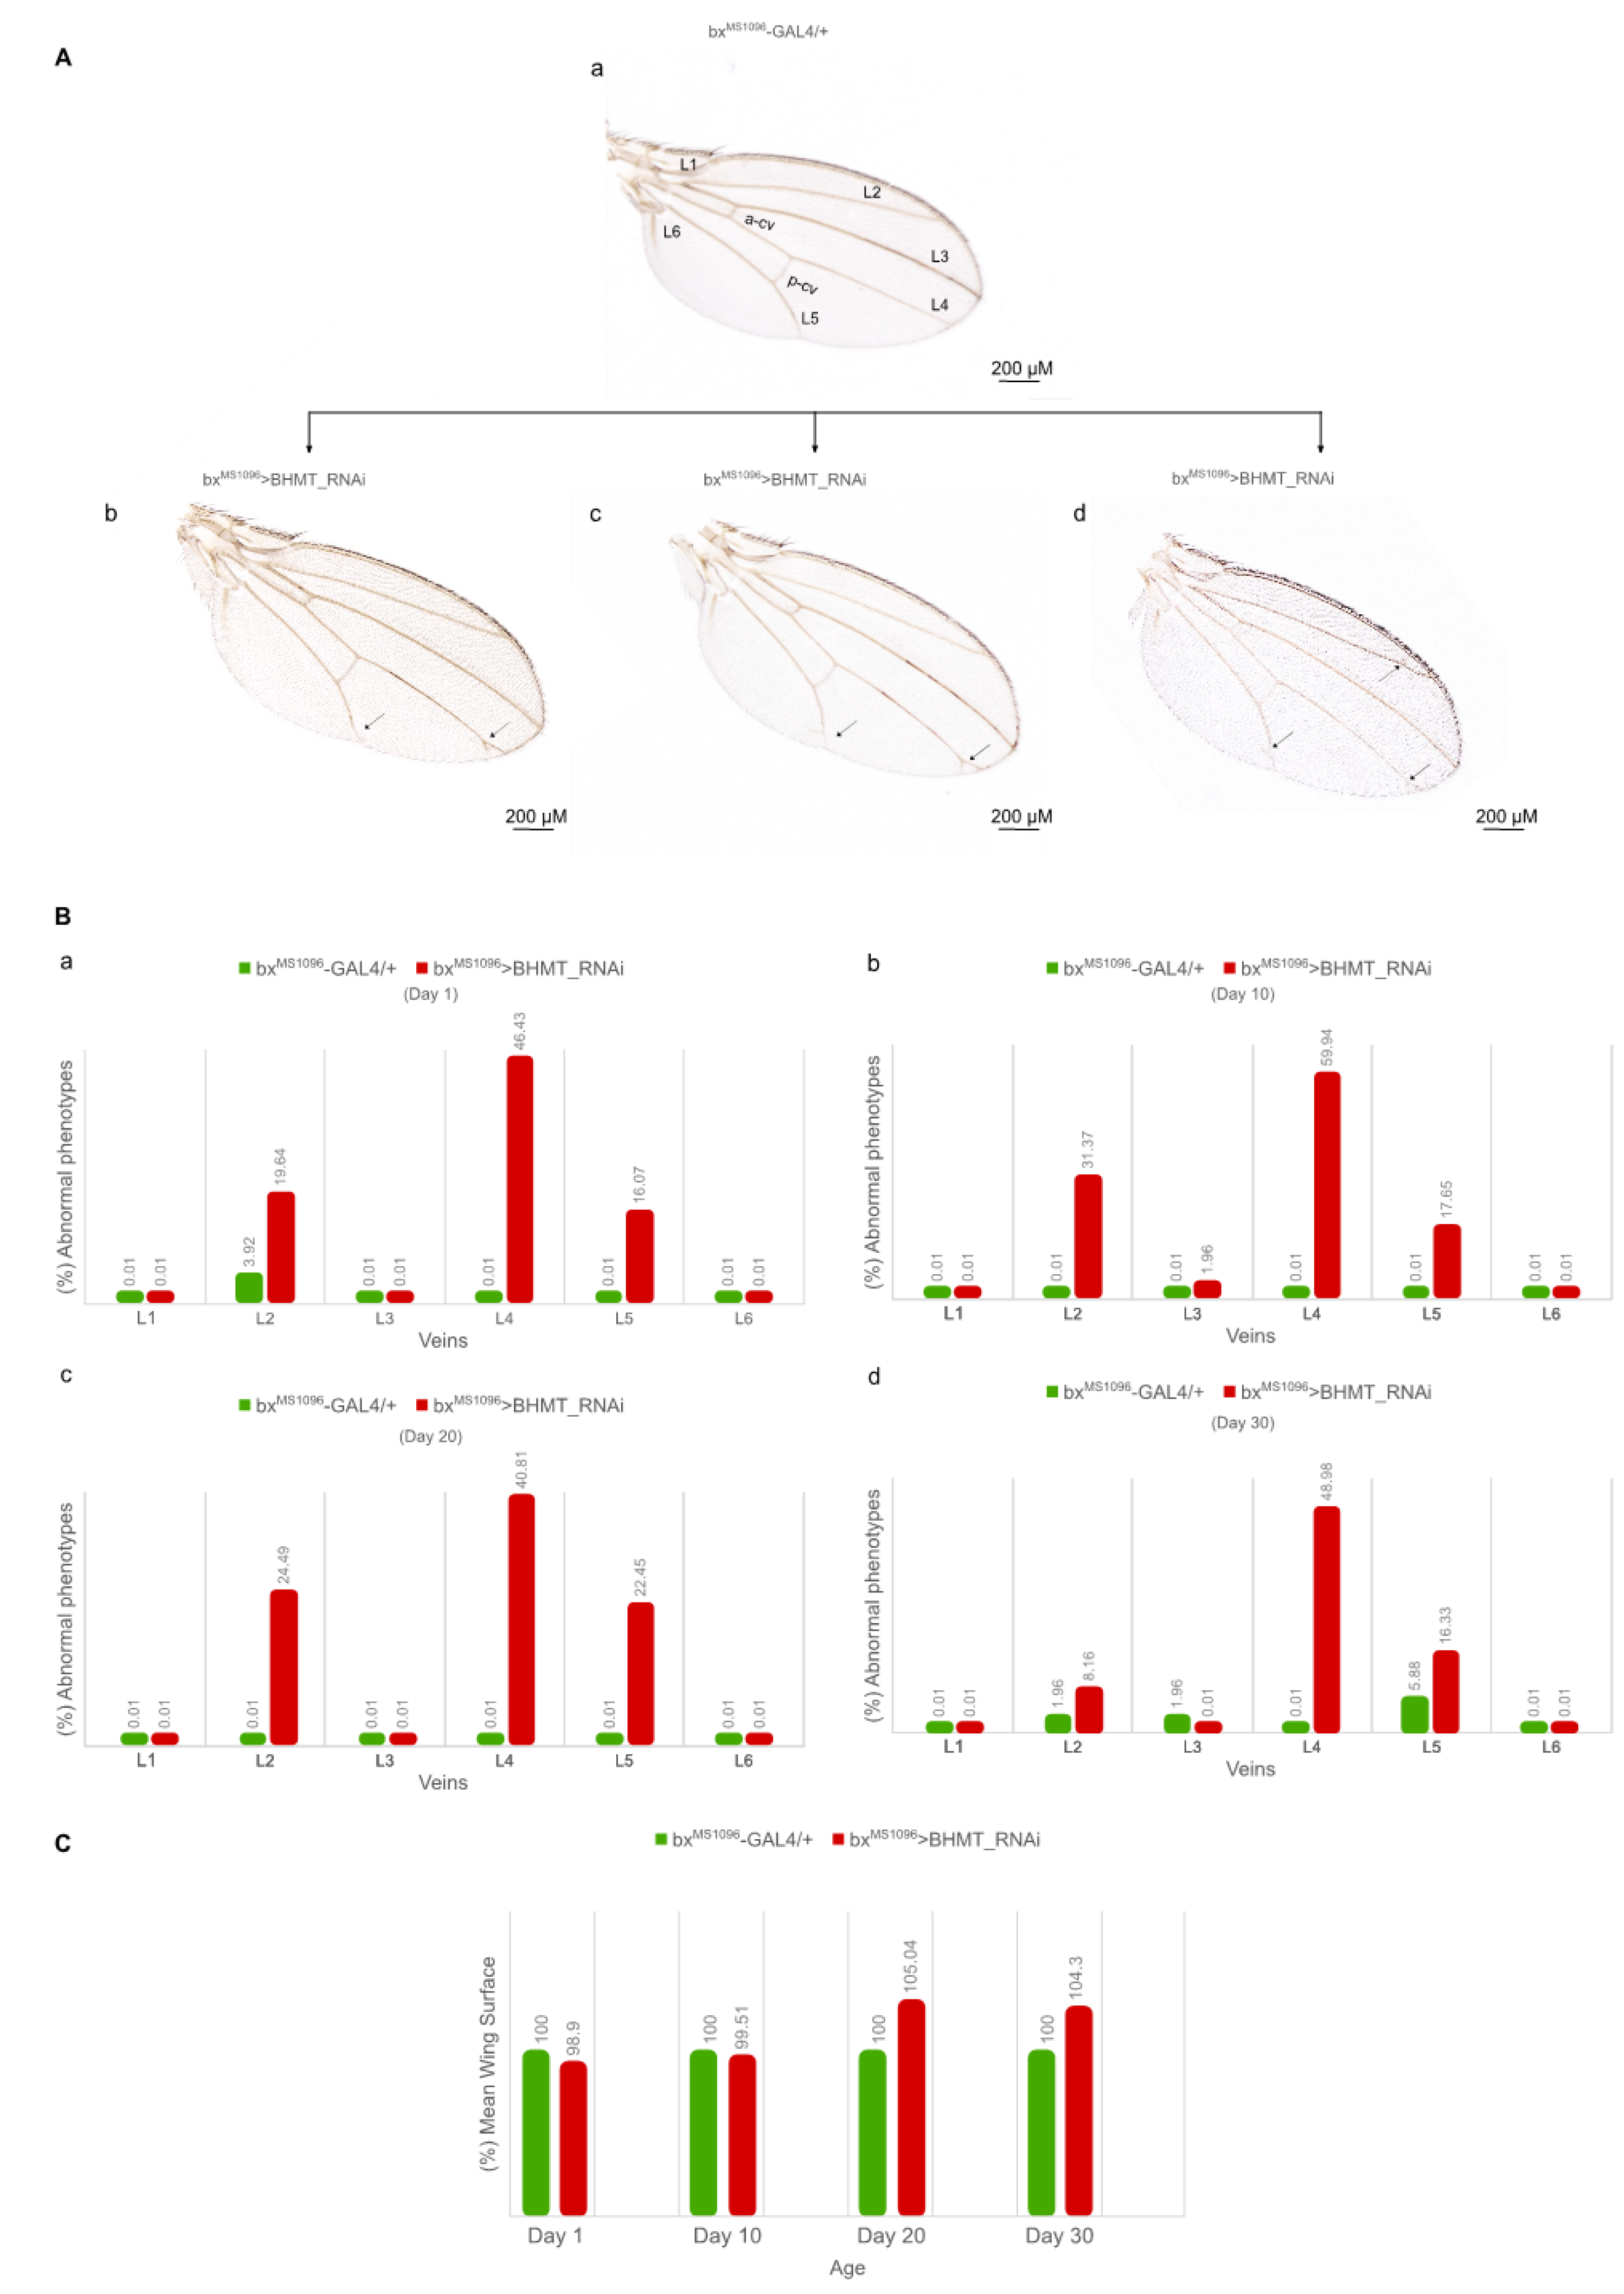
Reduced levels of dBHMT gene expression disrupts wing morphology and architecture in Drosophila: age-dependent profiles. (A) Wing images with differential vein pathology of male mutant flies being subjected to dBHMT gene silencing (bxMS1096>BHMT_RNAi) (b-d), as compared to control fly populations (bxMS1096-GAL4/+) (a). Scale Bars: 200 µm. (B) Bar charts presenting abnormal vein phenotypes of male transgenic flies (bxMS1096>BHMT_RNAi), as compared to control settings (bxMS1096-GAL4/+), during aging. (C) Quantification of wing areas of dBHMT mutant (bxMS1096>BHMT_RNAi) and control (bxMS1096-GAL4/+) flies, during aging. Naming of normal (control) wing veins is indicated (L1-L6, a-cv and p-cv) (a). Manually dissected wings from at least 50 male flies of each genotype were thoroughly examined and carefully quantified, as indicated.
Table 1.
Pathology of dSAMTOR gene, tissue-specific, downregulation, categorized in lethal and viable, systemic, phenotypes. S: Strong downregulation; M: Moderate downregulation.
Table 1.
Pathology of dSAMTOR gene, tissue-specific, downregulation, categorized in lethal and viable, systemic, phenotypes. S: Strong downregulation; M: Moderate downregulation.
| DRIVER |
|
dSAMTOR_RNAi(S)
|
dSAMTOR_RNAi(M)
|
| |
STRAIN |
| Act5C-GAL4 (whole body) |
Lethal |
Viable |
| elav.L-GAL4 (nervous system) |
Lethal |
Viable |
| repo-GAL4 (glial cells) |
Lethal |
Viable |
| D42-GAL4 (motor neurons) |
Lethal |
Viable |
| Mef2.R-GAL4 (muscles) |
Lethal |
Viable |
| NP1-GAL4 (midgut) |
Viable |
Viable |
| ninaE.GMR-GAL4 (eyes) |
Viable |
Viable |
| bxMS1096-GAL4 (wings) |
Viable |
Viable |
