Submitted:
08 May 2023
Posted:
08 May 2023
You are already at the latest version
Abstract
Keywords:
1. Short−term memory and literary texts
2. Translations of New Testament from Greek to Latin and modern languages
3. Probability density function of
4. Probability of readers’ overlap and overlap index
5. Universal Reader of the New Testament
6. Final remarks and future work
Funding
Institutional Review Board Statement
Informed Consent Statement
Data Availability Statement
Acknowledgments
Conflicts of Interest
Appendix A. Values of the probability of overlap
| Gr | Lt | Es | Fr | It | Pt | Rm | Sp | Dn | En | |
| Gr | 100.00 | 16.31 | 12.66 | 96.56 | 58.84 | 23.03 | 57.97 | 62.30 | 36.79 | 98.19 |
| Lt | 16.31 | 100.00 | 95.26 | 10.57 | 41.23 | 69.34 | 31.32 | 31.84 | 48.60 | 12.54 |
| Es | 12.66 | 95.26 | 100.00 | 7.46 | 36.49 | 66.88 | 26.60 | 27.14 | 44.30 | 9.20 |
| Fr | 96.56 | 10.57 | 7.46 | 100.00 | 50.74 | 15.79 | 50.58 | 54.87 | 28.61 | 98.54 |
| It | 58.84 | 41.23 | 36.49 | 50.74 | 100.00 | 56.64 | 93.84 | 91.48 | 76.75 | 53.94 |
| Pt | 23.03 | 69.34 | 66.88 | 15.79 | 56.64 | 100.00 | 47.04 | 46.59 | 72.49 | 18.38 |
| Rm | 57.97 | 31.32 | 26.60 | 50.58 | 93.84 | 47.04 | 100.00 | 95.67 | 70.40 | 53.68 |
| Sp | 62.30 | 31.84 | 27.14 | 54.87 | 91.48 | 46.59 | 95.67 | 100.00 | 68.50 | 57.99 |
| Dn | 36.79 | 48.60 | 44.30 | 28.61 | 76.75 | 72.49 | 70.40 | 68.50 | 100.00 | 31.73 |
| En | 98.19 | 12.54 | 9.20 | 98.54 | 53.94 | 18.38 | 53.68 | 57.99 | 31.73 | 100.00 |
| Fn | 10.74 | 89.96 | 92.16 | 6.06 | 32.29 | 59.77 | 22.73 | 23.40 | 38.66 | 7.60 |
| Ge | 32.85 | 50.89 | 46.84 | 24.75 | 71.98 | 76.59 | 65.03 | 63.30 | 94.55 | 27.80 |
| Ic | 29.70 | 63.80 | 60.24 | 21.93 | 65.82 | 89.90 | 56.70 | 55.97 | 82.42 | 24.78 |
| Nr | 86.46 | 7.86 | 5.23 | 89.90 | 43.39 | 11.69 | 42.18 | 46.51 | 22.40 | 88.43 |
| Sw | 80.17 | 12.03 | 9.06 | 77.02 | 45.51 | 16.30 | 42.80 | 46.88 | 26.33 | 78.22 |
| Bg | 27.33 | 65.51 | 62.28 | 19.71 | 62.71 | 93.15 | 53.45 | 52.79 | 79.30 | 22.49 |
| Cz | 12.58 | 89.12 | 88.49 | 7.66 | 34.07 | 58.72 | 24.65 | 25.32 | 39.59 | 9.30 |
| Cr | 30.44 | 69.70 | 65.90 | 22.79 | 64.96 | 91.64 | 55.19 | 54.88 | 78.20 | 25.59 |
| Pl | 4.37 | 67.93 | 68.10 | 1.80 | 18.12 | 37.58 | 10.42 | 11.21 | 20.83 | 2.56 |
| Rs | 2.65 | 47.75 | 44.96 | 1.01 | 11.49 | 22.50 | 5.92 | 6.59 | 11.94 | 1.47 |
| Sr | 33.73 | 58.20 | 54.23 | 25.72 | 71.58 | 82.84 | 63.11 | 62.07 | 89.84 | 28.71 |
| Sl | 16.12 | 92.58 | 91.09 | 10.19 | 42.83 | 75.76 | 32.72 | 33.08 | 52.26 | 12.23 |
| Uk | 4.49 | 70.99 | 72.13 | 1.83 | 19.03 | 40.34 | 11.01 | 11.80 | 22.29 | 2.61 |
| Et | 23.35 | 76.91 | 74.25 | 16.27 | 55.32 | 93.75 | 45.33 | 45.21 | 68.21 | 18.79 |
| Hn | 2.37 | 45.63 | 42.74 | 0.87 | 10.64 | 20.93 | 5.33 | 5.97 | 10.92 | 1.29 |
| Al | 60.19 | 31.60 | 26.89 | 52.79 | 92.60 | 46.83 | 97.77 | 97.89 | 69.46 | 55.90 |
| Ar | 22.57 | 61.19 | 58.47 | 15.19 | 57.57 | 92.95 | 48.59 | 47.74 | 76.32 | 17.85 |
| Wl | 24.69 | 45.83 | 41.96 | 16.86 | 62.64 | 73.75 | 55.66 | 53.81 | 85.25 | 19.75 |
| Bs | 10.27 | 90.71 | 94.85 | 5.62 | 32.28 | 61.76 | 22.59 | 23.22 | 39.37 | 7.14 |
| Hb | 25.77 | 63.11 | 60.05 | 18.19 | 61.35 | 92.45 | 52.33 | 51.52 | 79.35 | 20.95 |
| Cb | 51.11 | 2.58 | 1.41 | 48.80 | 21.27 | 3.48 | 17.75 | 21.16 | 7.72 | 49.60 |
| Tg | 78.23 | 5.95 | 3.73 | 81.52 | 37.57 | 8.78 | 35.64 | 39.92 | 17.80 | 80.11 |
| Ch | 50.47 | 46.73 | 42.03 | 42.28 | 91.01 | 64.59 | 83.05 | 81.77 | 85.73 | 45.47 |
| Lg | 35.72 | 65.10 | 60.84 | 27.83 | 71.44 | 85.19 | 61.72 | 61.38 | 85.35 | 30.76 |
| Sm | 59.43 | 43.00 | 38.26 | 51.26 | 99.53 | 57.83 | 93.25 | 90.95 | 76.82 | 54.46 |
| Ht | 59.27 | 28.38 | 23.70 | 52.23 | 90.15 | 43.32 | 96.57 | 96.64 | 66.54 | 55.25 |
| Nh | 61.29 | 37.06 | 32.33 | 53.38 | 95.95 | 52.11 | 98.80 | 95.99 | 72.93 | 56.58 |
| Fn | Ge | Ic | Nr | Sw | Bg | Cz | Cr | Pl | Rs | |
| Gr | 10.74 | 32.85 | 29.70 | 86.46 | 80.17 | 27.33 | 12.58 | 30.44 | 4.37 | 2.65 |
| Lt | 89.96 | 50.89 | 63.80 | 7.86 | 12.03 | 65.51 | 89.12 | 69.70 | 67.93 | 47.75 |
| Es | 92.16 | 46.84 | 60.24 | 5.23 | 9.06 | 62.28 | 88.49 | 65.90 | 68.10 | 44.96 |
| Fr | 6.06 | 24.75 | 21.93 | 89.90 | 77.02 | 19.71 | 7.66 | 22.79 | 1.80 | 1.01 |
| It | 32.29 | 71.98 | 65.82 | 43.39 | 45.51 | 62.71 | 34.07 | 64.96 | 18.12 | 11.49 |
| Pt | 59.77 | 76.59 | 89.90 | 11.69 | 16.30 | 93.15 | 58.72 | 91.64 | 37.58 | 22.50 |
| Rm | 22.73 | 65.03 | 56.70 | 42.18 | 42.80 | 53.45 | 24.65 | 55.19 | 10.42 | 5.92 |
| Sp | 23.40 | 63.30 | 55.97 | 46.51 | 46.88 | 52.79 | 25.32 | 54.88 | 11.21 | 6.59 |
| Dn | 38.66 | 94.55 | 82.42 | 22.40 | 26.33 | 79.30 | 39.59 | 78.20 | 20.83 | 11.94 |
| En | 7.60 | 27.80 | 24.78 | 88.43 | 78.22 | 22.49 | 9.30 | 25.59 | 2.56 | 1.47 |
| Fn | 100.00 | 40.86 | 53.80 | 4.19 | 7.70 | 55.60 | 96.26 | 59.68 | 75.91 | 51.31 |
| Ge | 40.86 | 100.00 | 86.50 | 18.99 | 23.24 | 83.25 | 41.51 | 81.86 | 22.17 | 12.55 |
| Ic | 53.80 | 86.50 | 100.00 | 16.95 | 21.49 | 96.70 | 53.76 | 95.69 | 33.23 | 20.33 |
| Nr | 4.19 | 18.99 | 16.95 | 100.00 | 82.31 | 15.01 | 5.55 | 17.98 | 1.08 | 0.60 |
| Sw | 7.70 | 23.24 | 21.49 | 82.31 | 100.00 | 19.61 | 9.28 | 22.54 | 3.08 | 1.95 |
| Bg | 55.60 | 83.25 | 96.70 | 15.01 | 19.61 | 100.00 | 55.26 | 98.64 | 34.47 | 20.90 |
| Cz | 96.26 | 41.51 | 53.76 | 5.55 | 9.28 | 55.26 | 100.00 | 59.75 | 78.77 | 57.34 |
| Cr | 59.68 | 81.86 | 95.69 | 17.98 | 22.54 | 98.64 | 59.75 | 100.00 | 39.16 | 25.38 |
| Pl | 75.91 | 22.17 | 33.23 | 1.08 | 3.08 | 34.47 | 78.77 | 39.16 | 100.00 | 66.82 |
| Rs | 51.31 | 12.55 | 20.33 | 0.60 | 1.95 | 20.90 | 57.34 | 25.38 | 66.82 | 100.00 |
| Sr | 48.17 | 94.54 | 92.92 | 20.19 | 24.51 | 89.69 | 48.62 | 88.76 | 28.71 | 17.40 |
| Sl | 83.62 | 55.08 | 68.76 | 7.39 | 11.60 | 70.96 | 80.78 | 74.16 | 60.00 | 39.35 |
| Uk | 79.92 | 23.81 | 35.44 | 1.08 | 3.13 | 36.85 | 81.57 | 41.42 | 93.08 | 60.07 |
| Et | 67.30 | 71.53 | 85.46 | 12.31 | 16.92 | 87.94 | 66.25 | 89.83 | 45.06 | 28.69 |
| Hn | 48.96 | 11.47 | 18.92 | 0.51 | 1.75 | 19.45 | 55.06 | 23.84 | 64.14 | 97.32 |
| Al | 23.08 | 64.17 | 56.35 | 44.40 | 44.88 | 53.14 | 25.00 | 55.06 | 10.82 | 6.26 |
| Ar | 51.45 | 81.30 | 91.75 | 10.97 | 15.59 | 94.79 | 50.76 | 99.01 | 29.86 | 16.72 |
| Wl | 35.80 | 90.51 | 86.18 | 11.98 | 16.57 | 81.84 | 36.36 | 80.04 | 17.17 | 8.69 |
| Bs | 96.06 | 41.80 | 55.12 | 3.79 | 7.26 | 57.13 | 92.03 | 60.82 | 71.67 | 46.44 |
| Hb | 53.25 | 83.85 | 95.53 | 13.60 | 18.21 | 99.27 | 52.80 | 97.80 | 32.00 | 18.75 |
| Cb | 1.09 | 6.10 | 5.84 | 55.98 | 71.04 | 4.92 | 1.72 | 6.80 | 0.19 | 0.12 |
| Tg | 2.94 | 14.79 | 13.31 | 91.63 | 85.71 | 11.62 | 4.10 | 14.40 | 0.65 | 0.37 |
| Ch | 37.29 | 80.96 | 74.18 | 35.37 | 38.33 | 70.96 | 38.80 | 72.67 | 21.46 | 13.49 |
| Lg | 55.10 | 89.70 | 93.84 | 22.51 | 26.89 | 91.04 | 55.74 | 93.47 | 35.83 | 23.53 |
| Sm | 34.10 | 72.26 | 66.76 | 44.15 | 46.56 | 63.73 | 35.88 | 66.19 | 19.83 | 12.90 |
| Ht | 20.07 | 61.16 | 52.90 | 43.53 | 43.52 | 49.67 | 22.04 | 51.54 | 8.65 | 4.81 |
| Nh | 28.33 | 67.97 | 61.36 | 45.61 | 47.00 | 58.22 | 30.19 | 60.42 | 15.01 | 9.26 |
| Sr | Sl | Uk | Et | Hn | Al | Ar | Wl | Bs | Hb | |
| Gr | 33.73 | 16.12 | 4.49 | 23.35 | 2.37 | 60.19 | 22.57 | 24.69 | 10.27 | 25.77 |
| Lt | 58.20 | 92.58 | 70.99 | 76.91 | 45.63 | 31.60 | 61.19 | 45.83 | 90.71 | 63.11 |
| Es | 54.23 | 91.09 | 72.13 | 74.25 | 42.74 | 26.89 | 58.47 | 41.96 | 94.85 | 60.05 |
| Fr | 25.72 | 10.19 | 1.83 | 16.27 | 0.87 | 52.79 | 15.19 | 16.86 | 5.62 | 18.19 |
| It | 71.58 | 42.83 | 19.03 | 55.32 | 10.64 | 92.60 | 57.57 | 62.64 | 32.28 | 61.35 |
| Pt | 82.84 | 75.76 | 40.34 | 93.75 | 20.93 | 46.83 | 92.95 | 73.75 | 61.76 | 92.45 |
| Rm | 63.11 | 32.72 | 11.01 | 45.33 | 5.33 | 97.77 | 48.59 | 55.66 | 22.59 | 52.33 |
| Sp | 62.07 | 33.08 | 11.80 | 45.21 | 5.97 | 97.89 | 47.74 | 53.81 | 23.22 | 51.52 |
| Dn | 89.84 | 52.26 | 22.29 | 68.21 | 10.92 | 69.46 | 76.32 | 85.25 | 39.37 | 79.35 |
| En | 28.71 | 12.23 | 2.61 | 18.79 | 1.29 | 55.90 | 17.85 | 19.75 | 7.14 | 20.95 |
| Fn | 48.17 | 83.62 | 79.92 | 67.30 | 48.96 | 23.08 | 51.45 | 35.80 | 96.06 | 53.25 |
| Ge | 94.54 | 55.08 | 23.81 | 71.53 | 11.47 | 64.17 | 81.30 | 90.51 | 41.80 | 83.85 |
| Ic | 92.92 | 68.76 | 35.44 | 85.46 | 18.92 | 56.35 | 91.75 | 86.18 | 55.12 | 95.53 |
| Nr | 20.19 | 7.39 | 1.08 | 12.31 | 0.51 | 44.40 | 10.97 | 11.98 | 3.79 | 13.60 |
| Sw | 24.51 | 11.60 | 3.13 | 16.92 | 1.75 | 44.88 | 15.59 | 16.57 | 7.26 | 18.21 |
| Bg | 89.69 | 70.96 | 36.85 | 87.94 | 19.45 | 53.14 | 94.79 | 81.84 | 57.13 | 99.27 |
| Cz | 48.62 | 80.78 | 81.57 | 66.25 | 55.06 | 25.00 | 50.76 | 36.36 | 92.03 | 52.80 |
| Cr | 88.76 | 74.16 | 41.42 | 89.83 | 23.84 | 55.06 | 99.01 | 80.04 | 60.82 | 97.80 |
| Pl | 28.71 | 60.00 | 93.08 | 45.06 | 64.14 | 10.82 | 29.86 | 17.17 | 71.67 | 32.00 |
| Rs | 17.40 | 39.35 | 60.07 | 28.69 | 97.32 | 6.26 | 16.72 | 8.69 | 46.44 | 18.75 |
| Sr | 100.00 | 62.48 | 30.60 | 78.74 | 16.14 | 62.62 | 85.45 | 97.05 | 49.18 | 89.10 |
| Sl | 62.48 | 100.00 | 63.59 | 83.03 | 37.29 | 32.92 | 67.33 | 50.44 | 86.00 | 68.82 |
| Uk | 30.60 | 63.59 | 100.00 | 47.90 | 57.43 | 11.42 | 32.33 | 18.72 | 76.30 | 34.38 |
| Et | 78.74 | 83.03 | 47.90 | 100.00 | 26.98 | 45.29 | 85.95 | 67.30 | 69.11 | 86.25 |
| Hn | 16.14 | 37.29 | 57.43 | 26.98 | 100.00 | 5.66 | 15.36 | 7.78 | 44.12 | 17.35 |
| Al | 62.62 | 32.92 | 11.42 | 45.29 | 5.66 | 100.00 | 48.17 | 54.72 | 22.93 | 51.94 |
| Ar | 85.45 | 67.33 | 32.33 | 85.95 | 15.36 | 48.17 | 100.00 | 81.09 | 53.34 | 96.22 |
| Wl | 97.05 | 50.44 | 18.72 | 67.30 | 7.78 | 54.72 | 81.09 | 100.00 | 36.88 | 82.74 |
| Bs | 49.18 | 86.00 | 76.30 | 69.11 | 44.12 | 22.93 | 53.34 | 36.88 | 100.00 | 54.90 |
| Hb | 89.10 | 68.82 | 34.38 | 86.25 | 17.35 | 51.94 | 96.22 | 82.74 | 54.90 | 100.00 |
| Cb | 7.25 | 2.18 | 0.18 | 4.06 | 0.10 | 19.46 | 2.92 | 2.83 | 0.91 | 4.13 |
| Tg | 16.09 | 5.44 | 0.64 | 9.46 | 0.31 | 37.83 | 8.04 | 8.61 | 2.60 | 10.32 |
| Ch | 80.30 | 48.99 | 22.62 | 62.67 | 12.50 | 82.38 | 65.98 | 71.58 | 37.51 | 69.75 |
| Lg | 95.78 | 68.66 | 37.76 | 83.44 | 22.11 | 61.58 | 85.83 | 90.54 | 55.90 | 89.51 |
| Sm | 72.24 | 44.52 | 20.77 | 56.72 | 12.00 | 92.04 | 58.53 | 63.08 | 34.08 | 62.29 |
| Ht | 59.25 | 29.56 | 9.14 | 41.77 | 4.30 | 98.25 | 44.76 | 51.81 | 19.86 | 48.51 |
| Nh | 67.26 | 38.49 | 15.78 | 50.79 | 8.51 | 97.32 | 53.11 | 58.53 | 28.25 | 56.89 |
| Cb | Tg | Ch | Lg | Sm | Ht | Nh | ||||
| Gr | 51.11 | 78.23 | 50.47 | 35.72 | 59.43 | 59.27 | 61.29 | |||
| Lt | 2.58 | 5.95 | 46.73 | 65.10 | 43.00 | 28.38 | 37.06 | |||
| Es | 1.41 | 3.73 | 42.03 | 60.84 | 38.26 | 23.70 | 32.33 | |||
| Fr | 48.80 | 81.52 | 42.28 | 27.83 | 51.26 | 52.23 | 53.38 | |||
| It | 21.27 | 37.57 | 91.01 | 71.44 | 99.53 | 90.15 | 95.95 | |||
| Pt | 3.48 | 8.78 | 64.59 | 85.19 | 57.83 | 43.32 | 52.11 | |||
| Rm | 17.75 | 35.64 | 83.05 | 61.72 | 93.25 | 96.57 | 98.80 | |||
| Sp | 21.16 | 39.92 | 81.77 | 61.38 | 90.95 | 99.93 | 95.99 | |||
| Dn | 7.72 | 17.80 | 85.73 | 85.35 | 76.82 | 66.54 | 72.93 | |||
| En | 49.60 | 80.11 | 45.47 | 30.76 | 54.46 | 55.25 | 56.58 | |||
| Fn | 1.09 | 2.94 | 37.29 | 55.10 | 34.10 | 20.07 | 28.33 | |||
| Ge | 6.10 | 14.79 | 80.96 | 89.70 | 72.26 | 61.16 | 67.97 | |||
| Ic | 5.84 | 13.31 | 74.18 | 93.84 | 66.76 | 52.90 | 61.36 | |||
| Nr | 55.98 | 91.63 | 35.37 | 22.51 | 44.15 | 43.53 | 45.61 | |||
| Sw | 71.04 | 85.71 | 38.33 | 26.89 | 46.56 | 43.52 | 47.00 | |||
| Bg | 4.92 | 11.62 | 70.96 | 91.04 | 63.73 | 49.67 | 58.22 | |||
| Cz | 1.72 | 4.10 | 38.80 | 55.74 | 35.88 | 22.04 | 30.19 | |||
| Cr | 6.80 | 14.40 | 72.67 | 93.47 | 66.19 | 51.54 | 60.42 | |||
| Pl | 0.19 | 0.65 | 21.46 | 35.83 | 19.83 | 8.65 | 15.01 | |||
| Rs | 0.12 | 0.37 | 13.49 | 23.53 | 12.90 | 4.81 | 9.26 | |||
| Sr | 7.25 | 16.09 | 80.30 | 95.78 | 72.24 | 59.25 | 67.26 | |||
| Sl | 2.18 | 5.44 | 48.99 | 68.66 | 44.52 | 29.56 | 38.49 | |||
| Uk | 0.18 | 0.64 | 22.62 | 37.76 | 20.77 | 9.14 | 15.78 | |||
| Et | 4.06 | 9.46 | 62.67 | 83.44 | 56.72 | 41.77 | 50.79 | |||
| Hn | 0.10 | 0.31 | 12.50 | 22.11 | 12.00 | 4.30 | 8.51 | |||
| Al | 19.46 | 37.83 | 82.38 | 61.58 | 92.04 | 98.25 | 97.32 | |||
| Ar | 2.92 | 8.04 | 65.98 | 85.83 | 58.53 | 44.76 | 53.11 | |||
| Wl | 2.83 | 8.61 | 71.58 | 90.54 | 63.08 | 51.81 | 58.53 | |||
| Bs | 0.91 | 2.60 | 37.51 | 55.90 | 34.08 | 19.86 | 28.25 | |||
| Hb | 4.13 | 10.32 | 69.75 | 89.51 | 62.29 | 48.51 | 56.89 | |||
| Cb | 100.00 | 61.90 | 15.98 | 9.30 | 22.49 | 18.00 | 21.96 | |||
| Tg | 61.90 | 100.00 | 29.99 | 18.49 | 38.50 | 36.74 | 39.45 | |||
| Ch | 15.98 | 29.99 | 100.00 | 79.19 | 90.97 | 79.16 | 86.92 | |||
| Lg | 9.30 | 18.49 | 79.19 | 100.00 | 72.60 | 58.06 | 66.91 | |||
| Sm | 22.49 | 38.50 | 90.97 | 72.60 | 100.00 | 89.54 | 95.46 | |||
| Ht | 18.00 | 36.74 | 79.16 | 58.06 | 89.54 | 100.00 | 95.32 | |||
| Nh | 21.96 | 39.45 | 86.92 | 66.91 | 95.46 | 95.32 | 100.00 | |||
Appendix B. Values of the correlation coefficient
| Gr | Lt | Es | Fr | It | Pt | Rm | Sp | Dn | En | |
| Gr | 1 | -0.8352 | -0.8386 | 0.9941 | 0.4374 | -0.5187 | 0.5240 | 0.5771 | -0.0602 | 0.9978 |
| Lt | -0.8352 | 1 | 0.9973 | -0.8487 | -0.2255 | 0.7017 | -0.3402 | -0.3864 | 0.2315 | -0.8448 |
| Es | -0.8386 | 0.9973 | 1 | -0.8470 | -0.2717 | 0.6674 | -0.3831 | -0.4275 | 0.1814 | -0.8451 |
| Fr | 0.9941 | -0.8487 | -0.8470 | 1 | 0.3453 | -0.5862 | 0.4386 | 0.4950 | -0.1559 | 0.9991 |
| It | 0.4374 | -0.2255 | -0.2717 | 0.3453 | 1 | 0.3335 | 0.9862 | 0.9761 | 0.7899 | 0.3818 |
| Pt | -0.5187 | 0.7017 | 0.6674 | -0.5862 | 0.3335 | 1 | 0.1987 | 0.1498 | 0.7920 | -0.5615 |
| Rm | 0.5240 | -0.3402 | -0.3831 | 0.4386 | 0.9862 | 0.1987 | 1 | 0.9970 | 0.6986 | 0.4728 |
| Sp | 0.5771 | -0.3864 | -0.4275 | 0.4950 | 0.9761 | 0.1498 | 0.9970 | 1 | 0.6608 | 0.5281 |
| Dn | -0.0602 | 0.2315 | 0.1814 | -0.1559 | 0.7899 | 0.7920 | 0.6986 | 0.6608 | 1 | -0.1193 |
| En | 0.9978 | -0.8448 | -0.8451 | 0.9991 | 0.3818 | -0.5615 | 0.4728 | 0.5281 | -0.1193 | 1 |
| Fn | -0.8592 | 0.9771 | 0.9859 | -0.8556 | -0.3722 | 0.5591 | -0.4714 | -0.5134 | 0.0561 | -0.8581 |
| Ge | -0.1579 | 0.3190 | 0.2706 | -0.2498 | 0.7074 | 0.8549 | 0.6041 | 0.5628 | 0.9904 | -0.2148 |
| Ic | -0.3732 | 0.5508 | 0.5087 | -0.4531 | 0.5039 | 0.9713 | 0.3776 | 0.3310 | 0.9035 | -0.4233 |
| Nr | 0.9687 | -0.8623 | -0.8545 | 0.9860 | 0.2374 | -0.6471 | 0.3335 | 0.3922 | -0.2542 | 0.9801 |
| Sw | 0.9514 | -0.8646 | -0.8575 | 0.9606 | 0.2512 | -0.6239 | 0.3415 | 0.3985 | -0.2281 | 0.9575 |
| Bg | -0.4219 | 0.5990 | 0.5594 | -0.4976 | 0.4448 | 0.9863 | 0.3152 | 0.2679 | 0.8675 | -0.4695 |
| Cz | -0.8710 | 0.9692 | 0.9768 | -0.8657 | -0.3846 | 0.5374 | -0.4809 | -0.5235 | 0.0381 | -0.8688 |
| Cr | -0.4435 | 0.6297 | 0.5907 | -0.5180 | 0.4283 | 0.9899 | 0.2972 | 0.2494 | 0.8523 | -0.4904 |
| Pl | -0.8577 | 0.8227 | 0.8412 | -0.8247 | -0.5903 | 0.2596 | -0.6518 | -0.6864 | -0.2426 | -0.8381 |
| Rs | -0.7832 | 0.5903 | 0.6043 | -0.7356 | -0.6610 | 0.0261 | -0.6872 | -0.7162 | -0.3988 | -0.7540 |
| Sr | -0.2472 | 0.4160 | 0.3696 | -0.3350 | 0.6307 | 0.9086 | 0.5165 | 0.4725 | 0.9659 | -0.3019 |
| Sl | -0.7971 | 0.9848 | 0.9759 | -0.8228 | -0.1182 | 0.8034 | -0.2435 | -0.2914 | 0.3609 | -0.8143 |
| Uk | -0.8581 | 0.8563 | 0.8749 | -0.8291 | -0.5633 | 0.3077 | -0.6315 | -0.6667 | -0.2018 | -0.8411 |
| Et | -0.6056 | 0.8036 | 0.7740 | -0.6650 | 0.2335 | 0.9859 | 0.0963 | 0.0462 | 0.7075 | -0.6435 |
| Hn | -0.7709 | 0.5690 | 0.5830 | -0.7224 | -0.6629 | 0.0071 | -0.6861 | -0.7143 | -0.4095 | -0.7411 |
| Al | 0.5502 | -0.3641 | -0.4060 | 0.4665 | 0.9808 | 0.1721 | 0.9991 | 0.9992 | 0.6778 | 0.5002 |
| Ar | -0.4282 | 0.5932 | 0.5545 | -0.5023 | 0.4241 | 0.9864 | 0.2945 | 0.2475 | 0.8573 | -0.4749 |
| Wl | -0.2169 | 0.3516 | 0.3049 | -0.3043 | 0.6347 | 0.8781 | 0.5256 | 0.4829 | 0.9670 | -0.2713 |
| Bs | -0.8490 | 0.9861 | 0.9941 | -0.8493 | -0.3409 | 0.5978 | -0.4447 | -0.4871 | 0.0970 | -0.8504 |
| Hb | -0.4112 | 0.5816 | 0.5418 | -0.4873 | 0.4512 | 0.9831 | 0.3226 | 0.2757 | 0.8734 | -0.4591 |
| Cb | 0.7771 | -0.8187 | -0.7973 | 0.8051 | -0.0266 | -0.7117 | 0.0639 | 0.1191 | -0.4371 | 0.7943 |
| Tg | 0.9391 | -0.8632 | -0.8513 | 0.9625 | 0.1635 | -0.6809 | 0.2603 | 0.3199 | -0.3164 | 0.9539 |
| Ch | 0.2185 | -0.0048 | -0.0554 | 0.1197 | 0.9541 | 0.5737 | 0.8987 | 0.8746 | 0.9310 | 0.1582 |
| Lg | -0.3202 | 0.5091 | 0.4645 | -0.4047 | 0.5711 | 0.9459 | 0.4485 | 0.4026 | 0.9362 | -0.3729 |
| Sm | 0.4301 | -0.2130 | -0.2593 | 0.3376 | 0.9999 | 0.3453 | 0.9838 | 0.9732 | 0.7956 | 0.3742 |
| Ht | 0.5704 | -0.3921 | -0.4329 | 0.4890 | 0.9715 | 0.1348 | 0.9966 | 0.9992 | 0.6492 | 0.5219 |
| Nh | 0.5142 | -0.3138 | -0.3573 | 0.4270 | 0.9920 | 0.2322 | 0.9988 | 0.9951 | 0.7203 | 0.4618 |
| Fn | Ge | Ic | Nr | Sw | Bg | Cz | Cr | Pl | Rs | |
| Gr | -0.8592 | -0.1579 | -0.3732 | 0.9687 | 0.9514 | -0.4219 | -0.8710 | -0.4435 | -0.8577 | -0.7832 |
| Lt | 0.9771 | 0.3190 | 0.5508 | -0.8623 | -0.8646 | 0.5990 | 0.9692 | 0.6297 | 0.8227 | 0.5903 |
| Es | 0.9859 | 0.2706 | 0.5087 | -0.8545 | -0.8575 | 0.5594 | 0.9768 | 0.5907 | 0.8412 | 0.6043 |
| Fr | -0.8556 | -0.2498 | -0.4531 | 0.9860 | 0.9606 | -0.4976 | -0.8657 | -0.5180 | -0.8247 | -0.7356 |
| It | -0.3722 | 0.7074 | 0.5039 | 0.2374 | 0.2512 | 0.4448 | -0.3846 | 0.4283 | -0.5903 | -0.6610 |
| Pt | 0.5591 | 0.8549 | 0.9713 | -0.6471 | -0.6239 | 0.9863 | 0.5374 | 0.9899 | 0.2596 | 0.0261 |
| Rm | -0.4714 | 0.6041 | 0.3776 | 0.3335 | 0.3415 | 0.3152 | -0.4809 | 0.2972 | -0.6518 | -0.6872 |
| Sp | -0.5134 | 0.5628 | 0.3310 | 0.3922 | 0.3985 | 0.2679 | -0.5235 | 0.2494 | -0.6864 | -0.7162 |
| Dn | 0.0561 | 0.9904 | 0.9035 | -0.2542 | -0.2281 | 0.8675 | 0.0381 | 0.8523 | -0.2426 | -0.3988 |
| En | -0.8581 | -0.2148 | -0.4233 | 0.9801 | 0.9575 | -0.4695 | -0.8688 | -0.4904 | -0.8381 | -0.7540 |
| Fn | 1 | 0.1451 | 0.3893 | -0.8531 | -0.8621 | 0.4430 | 0.9976 | 0.4770 | 0.9094 | 0.6947 |
| Ge | 0.1451 | 1 | 0.9472 | -0.3410 | -0.3135 | 0.9186 | 0.1262 | 0.9050 | -0.1591 | -0.3291 |
| Ic | 0.3893 | 0.9472 | 1 | -0.5285 | -0.5026 | 0.9960 | 0.3685 | 0.9919 | 0.0800 | -0.1304 |
| Nr | -0.8531 | -0.3410 | -0.5285 | 1 | 0.9809 | -0.5677 | -0.8635 | -0.5880 | -0.7989 | -0.7014 |
| Sw | -0.8621 | -0.3135 | -0.5026 | 0.9809 | 1 | -0.5423 | -0.8748 | -0.5646 | -0.8228 | -0.7343 |
| Bg | 0.4430 | 0.9186 | 0.9960 | -0.5677 | -0.5423 | 1 | 0.4218 | 0.9983 | 0.1366 | -0.0805 |
| Cz | 0.9976 | 0.1262 | 0.3685 | -0.8635 | -0.8748 | 0.4218 | 1 | 0.4564 | 0.9272 | 0.7316 |
| Cr | 0.4770 | 0.9050 | 0.9919 | -0.5880 | -0.5646 | 0.9983 | 0.4564 | 1 | 0.1726 | -0.0493 |
| Pl | 0.9094 | -0.1591 | 0.0800 | -0.7989 | -0.8228 | 0.1366 | 0.9272 | 0.1726 | 1 | 0.8799 |
| Rs | 0.6947 | -0.3291 | -0.1304 | -0.7014 | -0.7343 | -0.0805 | 0.7316 | -0.0493 | 0.8799 | 1 |
| Sr | 0.2457 | 0.9907 | 0.9786 | -0.4208 | -0.3940 | 0.9581 | 0.2260 | 0.9480 | -0.0633 | -0.2519 |
| Sl | 0.9312 | 0.4479 | 0.6686 | -0.8456 | -0.8411 | 0.7128 | 0.9171 | 0.7390 | 0.7298 | 0.4782 |
| Uk | 0.9354 | -0.1167 | 0.1266 | -0.8057 | -0.8270 | 0.1837 | 0.9485 | 0.2198 | 0.9952 | 0.8417 |
| Et | 0.6784 | 0.7778 | 0.9267 | -0.7192 | -0.7005 | 0.9499 | 0.6582 | 0.9604 | 0.3938 | 0.1475 |
| Hn | 0.6747 | -0.3414 | -0.1468 | -0.6875 | -0.7209 | -0.0978 | 0.7125 | -0.0671 | 0.8658 | 0.9993 |
| Al | -0.4928 | 0.5813 | 0.3520 | 0.3625 | 0.3695 | 0.2893 | -0.5025 | 0.2710 | -0.6688 | -0.7008 |
| Ar | 0.4377 | 0.9112 | 0.9919 | -0.5690 | -0.5421 | 0.9979 | 0.4158 | 0.9965 | 0.1321 | -0.0828 |
| Wl | 0.1807 | 0.9907 | 0.9619 | -0.3872 | -0.3571 | 0.9371 | 0.1616 | 0.9234 | -0.1198 | -0.2880 |
| Bs | 0.9974 | 0.1867 | 0.4304 | -0.8492 | -0.8556 | 0.4835 | 0.9911 | 0.5165 | 0.8832 | 0.6544 |
| Hb | 0.4242 | 0.9239 | 0.9964 | -0.5573 | -0.5310 | 0.9996 | 0.4028 | 0.9969 | 0.1174 | -0.0964 |
| Cb | -0.7776 | -0.4984 | -0.6358 | 0.8641 | 0.9126 | -0.6594 | -0.7894 | -0.6806 | -0.6845 | -0.5815 |
| Tg | -0.8436 | -0.3977 | -0.5731 | 0.9926 | 0.9854 | -0.6084 | -0.8541 | -0.6286 | -0.7747 | -0.6726 |
| Ch | -0.1723 | 0.8780 | 0.7228 | 0.0104 | 0.0305 | 0.6721 | -0.1877 | 0.6567 | -0.4406 | -0.5588 |
| Lg | 0.3441 | 0.9703 | 0.9929 | -0.4872 | -0.4623 | 0.9805 | 0.3244 | 0.9755 | 0.0333 | -0.1724 |
| Sm | -0.3609 | 0.7143 | 0.5141 | 0.2295 | 0.2439 | 0.4556 | -0.3737 | 0.4395 | -0.5830 | -0.6584 |
| Ht | -0.5158 | 0.5500 | 0.3159 | 0.3861 | 0.3913 | 0.2527 | -0.5246 | 0.2343 | -0.6802 | -0.7024 |
| Nh | -0.4499 | 0.6285 | 0.4087 | 0.3215 | 0.3315 | 0.3473 | -0.4610 | 0.3298 | -0.6437 | -0.6926 |
| Sr | Sl | Uk | Et | Hn | Al | Ar | Wl | Bs | Hb | |
| Gr | -0.2472 | -0.7971 | -0.8581 | -0.6056 | -0.7709 | 0.5502 | -0.4282 | -0.2169 | -0.8490 | -0.4112 |
| Lt | 0.4160 | 0.9848 | 0.8563 | 0.8036 | 0.5690 | -0.3641 | 0.5932 | 0.3516 | 0.9861 | 0.5816 |
| Es | 0.3696 | 0.9759 | 0.8749 | 0.7740 | 0.5830 | -0.4060 | 0.5545 | 0.3049 | 0.9941 | 0.5418 |
| Fr | -0.3350 | -0.8228 | -0.8291 | -0.6650 | -0.7224 | 0.4665 | -0.5023 | -0.3043 | -0.8493 | -0.4873 |
| It | 0.6307 | -0.1182 | -0.5633 | 0.2335 | -0.6629 | 0.9808 | 0.4241 | 0.6347 | -0.3409 | 0.4512 |
| Pt | 0.9086 | 0.8034 | 0.3077 | 0.9859 | 0.0071 | 0.1721 | 0.9864 | 0.8781 | 0.5978 | 0.9831 |
| Rm | 0.5165 | -0.2435 | -0.6315 | 0.0963 | -0.6861 | 0.9991 | 0.2945 | 0.5256 | -0.4447 | 0.3226 |
| Sp | 0.4725 | -0.2914 | -0.6667 | 0.0462 | -0.7143 | 0.9992 | 0.2475 | 0.4829 | -0.4871 | 0.2757 |
| Dn | 0.9659 | 0.3609 | -0.2018 | 0.7075 | -0.4095 | 0.6778 | 0.8573 | 0.9670 | 0.0970 | 0.8734 |
| En | -0.3019 | -0.8143 | -0.8411 | -0.6435 | -0.7411 | 0.5002 | -0.4749 | -0.2713 | -0.8504 | -0.4591 |
| Fn | 0.2457 | 0.9312 | 0.9354 | 0.6784 | 0.6747 | -0.4928 | 0.4377 | 0.1807 | 0.9974 | 0.4242 |
| Ge | 0.9907 | 0.4479 | -0.1167 | 0.7778 | -0.3414 | 0.5813 | 0.9112 | 0.9907 | 0.1867 | 0.9239 |
| Ic | 0.9786 | 0.6686 | 0.1266 | 0.9267 | -0.1468 | 0.3520 | 0.9919 | 0.9619 | 0.4304 | 0.9964 |
| Nr | -0.4208 | -0.8456 | -0.8057 | -0.7192 | -0.6875 | 0.3625 | -0.5690 | -0.3872 | -0.8492 | -0.5573 |
| Sw | -0.3940 | -0.8411 | -0.8270 | -0.7005 | -0.7209 | 0.3695 | -0.5421 | -0.3571 | -0.8556 | -0.5310 |
| Bg | 0.9581 | 0.7128 | 0.1837 | 0.9499 | -0.0978 | 0.2893 | 0.9979 | 0.9371 | 0.4835 | 0.9996 |
| Cz | 0.2260 | 0.9171 | 0.9485 | 0.6582 | 0.7125 | -0.5025 | 0.4158 | 0.1616 | 0.9911 | 0.4028 |
| Cr | 0.9480 | 0.7390 | 0.2198 | 0.9604 | -0.0671 | 0.2710 | 0.9965 | 0.9234 | 0.5165 | 0.9969 |
| Pl | -0.0633 | 0.7298 | 0.9952 | 0.3938 | 0.8658 | -0.6688 | 0.1321 | -0.1198 | 0.8832 | 0.1174 |
| Rs | -0.2519 | 0.4782 | 0.8417 | 0.1475 | 0.9993 | -0.7008 | -0.0828 | -0.2880 | 0.6544 | -0.0964 |
| Sr | 1 | 0.5411 | -0.0187 | 0.8441 | -0.2661 | 0.4922 | 0.9515 | 0.9951 | 0.2873 | 0.9615 |
| Sl | 0.5411 | 1 | 0.7703 | 0.8865 | 0.4561 | -0.2686 | 0.7085 | 0.4802 | 0.9496 | 0.6976 |
| Uk | -0.0187 | 0.7703 | 1 | 0.4415 | 0.8257 | -0.6488 | 0.1791 | -0.0780 | 0.9134 | 0.1643 |
| Et | 0.8441 | 0.8865 | 0.4415 | 1 | 0.1270 | 0.0693 | 0.9482 | 0.8024 | 0.7130 | 0.9428 |
| Hn | -0.2661 | 0.4561 | 0.8257 | 0.1270 | 1 | -0.6993 | -0.0998 | -0.3005 | 0.6335 | -0.1133 |
| Al | 0.4922 | -0.2686 | -0.6488 | 0.0693 | -0.6993 | 1 | 0.2687 | 0.5020 | -0.4665 | 0.2969 |
| Ar | 0.9515 | 0.7085 | 0.1791 | 0.9482 | -0.0998 | 0.2687 | 1 | 0.9327 | 0.4787 | 0.9985 |
| Wl | 0.9951 | 0.4802 | -0.0780 | 0.8024 | -0.3005 | 0.5020 | 0.9327 | 1 | 0.2221 | 0.9427 |
| Bs | 0.2873 | 0.9496 | 0.9134 | 0.7130 | 0.6335 | -0.4665 | 0.4787 | 0.2221 | 1 | 0.4652 |
| Hb | 0.9615 | 0.6976 | 0.1643 | 0.9428 | -0.1133 | 0.2969 | 0.9985 | 0.9427 | 0.4652 | 1 |
| Cb | -0.5606 | -0.8194 | -0.6945 | -0.7661 | -0.5677 | 0.0910 | -0.6501 | -0.5169 | -0.7775 | -0.6481 |
| Tg | -0.4732 | -0.8526 | -0.7830 | -0.7479 | -0.6585 | 0.2897 | -0.6072 | -0.4376 | -0.8412 | -0.5978 |
| Ch | 0.8236 | 0.1170 | -0.4054 | 0.4792 | -0.5653 | 0.8853 | 0.6541 | 0.8233 | -0.1352 | 0.6777 |
| Lg | 0.9926 | 0.6273 | 0.0795 | 0.8972 | -0.1882 | 0.4232 | 0.9733 | 0.9785 | 0.3847 | 0.9810 |
| Sm | 0.6391 | -0.1050 | -0.5551 | 0.2463 | -0.6606 | 0.9781 | 0.4348 | 0.6421 | -0.3291 | 0.4618 |
| Ht | 0.4586 | -0.3002 | -0.6623 | 0.0321 | -0.7001 | 0.9989 | 0.2321 | 0.4695 | -0.4909 | 0.2604 |
| Nh | 0.5440 | -0.2134 | -0.6206 | 0.1304 | -0.6924 | 0.9972 | 0.3266 | 0.5512 | -0.4213 | 0.3544 |
| Cb | Tg | Ch | Lg | Sm | Ht | Nh | ||||
| Gr | 0.7771 | 0.9391 | 0.2185 | -0.3202 | 0.4301 | 0.5704 | 0.5142 | |||
| Lt | -0.8187 | -0.8632 | -0.0048 | 0.5091 | -0.2130 | -0.3921 | -0.3138 | |||
| Es | -0.7973 | -0.8513 | -0.0554 | 0.4645 | -0.2593 | -0.4329 | -0.3573 | |||
| Fr | 0.8051 | 0.9625 | 0.1197 | -0.4047 | 0.3376 | 0.4890 | 0.4270 | |||
| It | -0.0266 | 0.1635 | 0.9541 | 0.5711 | 0.9999 | 0.9715 | 0.9920 | |||
| Pt | -0.7117 | -0.6809 | 0.5737 | 0.9459 | 0.3453 | 0.1348 | 0.2322 | |||
| Rm | 0.0639 | 0.2603 | 0.8987 | 0.4485 | 0.9838 | 0.9966 | 0.9988 | |||
| Sp | 0.1191 | 0.3199 | 0.8746 | 0.4026 | 0.9732 | 0.9992 | 0.9951 | |||
| Dn | -0.4371 | -0.3164 | 0.9310 | 0.9362 | 0.7956 | 0.6492 | 0.7203 | |||
| En | 0.7943 | 0.9539 | 0.1582 | -0.3729 | 0.3742 | 0.5219 | 0.4618 | |||
| Fn | -0.7776 | -0.8436 | -0.1723 | 0.3441 | -0.3609 | -0.5158 | -0.4499 | |||
| Ge | -0.4984 | -0.3977 | 0.8780 | 0.9703 | 0.7143 | 0.5500 | 0.6285 | |||
| Ic | -0.6358 | -0.5731 | 0.7228 | 0.9929 | 0.5141 | 0.3159 | 0.4087 | |||
| Nr | 0.8641 | 0.9926 | 0.0104 | -0.4872 | 0.2295 | 0.3861 | 0.3215 | |||
| Sw | 0.9126 | 0.9854 | 0.0305 | -0.4623 | 0.2439 | 0.3913 | 0.3315 | |||
| Bg | -0.6594 | -0.6084 | 0.6721 | 0.9805 | 0.4556 | 0.2527 | 0.3473 | |||
| Cz | -0.7894 | -0.8541 | -0.1877 | 0.3244 | -0.3737 | -0.5246 | -0.4610 | |||
| Cr | -0.6806 | -0.6286 | 0.6567 | 0.9755 | 0.4395 | 0.2343 | 0.3298 | |||
| Pl | -0.6845 | -0.7747 | -0.4406 | 0.0333 | -0.5830 | -0.6802 | -0.6437 | |||
| Rs | -0.5815 | -0.6726 | -0.5588 | -0.1724 | -0.6584 | -0.7024 | -0.6926 | |||
| Sr | -0.5606 | -0.4732 | 0.8236 | 0.9926 | 0.6391 | 0.4586 | 0.5440 | |||
| Sl | -0.8194 | -0.8526 | 0.1170 | 0.6273 | -0.1050 | -0.3002 | -0.2134 | |||
| Uk | -0.6945 | -0.7830 | -0.4054 | 0.0795 | -0.5551 | -0.6623 | -0.6206 | |||
| Et | -0.7661 | -0.7479 | 0.4792 | 0.8972 | 0.2463 | 0.0321 | 0.1304 | |||
| Hn | -0.5677 | -0.6585 | -0.5653 | -0.1882 | -0.6606 | -0.7001 | -0.6924 | |||
| Al | 0.0910 | 0.2897 | 0.8853 | 0.4232 | 0.9781 | 0.9989 | 0.9972 | |||
| Ar | -0.6501 | -0.6072 | 0.6541 | 0.9733 | 0.4348 | 0.2321 | 0.3266 | |||
| Wl | -0.5169 | -0.4376 | 0.8233 | 0.9785 | 0.6421 | 0.4695 | 0.5512 | |||
| Bs | -0.7775 | -0.8412 | -0.1352 | 0.3847 | -0.3291 | -0.4909 | -0.4213 | |||
| Hb | -0.6481 | -0.5978 | 0.6777 | 0.9810 | 0.4618 | 0.2604 | 0.3544 | |||
| Cb | 1 | 0.9012 | -0.2304 | -0.6170 | -0.0340 | 0.1138 | 0.0522 | |||
| Tg | 0.9012 | 1 | -0.0621 | -0.5370 | 0.1557 | 0.3137 | 0.2482 | |||
| Ch | -0.2304 | -0.0621 | 1 | 0.7778 | 0.9571 | 0.8655 | 0.9138 | |||
| Lg | -0.6170 | -0.5370 | 0.7778 | 1 | 0.5808 | 0.3879 | 0.4786 | |||
| Sm | -0.0340 | 0.1557 | 0.9571 | 0.5808 | 1 | 0.9683 | 0.9903 | |||
| Ht | 0.1138 | 0.3137 | 0.8655 | 0.3879 | 0.9683 | 1 | 0.9929 | |||
| Nh | 0.0522 | 0.2482 | 0.9138 | 0.4786 | 0.9903 | 0.9929 | 1 | |||
References
- Matricciani, E. Deep Language Statistics of Italian throughout Seven Centuries of Literature and Empirical Connections with Miller’s 7 ∓ 2 Law and Short–Term Memory. Open J. Stat. 2019, 9, 373–406. [CrossRef]
- Matricciani, E. A Statistical Theory of Language Translation Based on Communication Theory. Open J. Stat. 2020, 10, 936–997. [CrossRef]
- Matricciani, E. Linguistic Mathematical Relationships Saved or Lost in Translating Texts: Extension of the Statistical Theory of Translation and Its Application to the New Testament. Information 2022, 13, 20. [CrossRef]
- Matricciani, E. (2022) Multiple Communication Channels in Literary Texts. Open Journal of Statistics, 12, 486–520. [CrossRef]
- Matricciani, E. Capacity of Linguistic Communication Channels in Literary Texts: Application to Charles Dickens’ Novels. Information 2023, 14, 68. [CrossRef]
- Matricciani, E. Readability Indices Do Not Say It All on a Text Readability. Analytics 2023, 2, 296-314. [CrossRef]
- Miller, G.A. The Magical Number Seven, Plus or Minus Two. Some Limits on Our Capacity for Processing Information, 1955, Psychological Review, 343−352.
- Baddeley, A.D., Thomson, N., Buchanan, M., Word Length and the Structure of Short−Term Memory, Journal of Verbal Learning and Verbal Behavior, 1975, 14, 575−589. [CrossRef]
- Cowan, N., The magical number 4 in short−term memory: A reconsideration of mental storage capacity, Behavioral and Brain Sciences, 2000, 87−114. [CrossRef]
- Pothos, E.M., Joula, P., Linguistic structure and short−term memory, Behavioral and Brain Sciences, 2000, 138−139.
- Jones, G, Macken, B., Questioning short−term memory and its measurements: Why digit span measures long−term associative learning, Cognition, 2015, 1−13. [CrossRef]
- Saaty, T.L., Ozdemir, M.S., Why the Magic Number Seven Plus or Minus Two, Mathematical and Computer Modelling, 2003, 233−244. [CrossRef]
- Mathy, F., Feldman, J. What’s magic about magic numbers? Chunking and data compression in short−term memory, Cognition, 2012, 346−362. [CrossRef]
- Chen, Z., Cowan, N., Chunk Limits and Length Limits in Immediate Recall: A Reconciliation, J. Exp. Psychol. Mem. Cogn., 2005, 1235−1249. [CrossRef]
- Chekaf, M., Cowan, N., Mathy, F., Chunk formation in immediate memory and how it relates to data compression, Cognition, 2016, 155, 96−107. [CrossRef]
- Barrouillest, P., Camos, V., As Time Goes By: Temporal Constraints in Working Memory, Current Directions in Psychological Science, 2012, 413−419. [CrossRef]
- Conway, A.R.A., Cowan, N., Michael F. Bunting, M.F., Therriaulta, D.J., Minkoff, S.R.B., A latent variable analysis of working memory capacity, short−term memory capacity, processing speed, and general fluid intelligence, Intelligence, 2002, 163−183. [CrossRef]
- Flesch, R., A New Readability Yardstick, Journal of Applied Psychology, 1948, 222-233. [CrossRef]
- Flesch, R., The Art of Readable Writing, Harper & Row, New York, revised and enlarged edition, 1974.
- Kincaid, J.P., Fishburne, R.P, Rogers, R.L., Chissom, B.S., Derivation Of New Readability Formulas (Automated Readability Index, Fog Count And Flesch Reading Ease Formula) For Navy Enlisted Personnel, 1975, Research Branch Report 8-75, Chief of Naval Technical Training. Naval Air Station, Memphis, TN, USA.
- DuBay, W.H., The Principles of Readability, 2004, Impact Information, Costa Mesa, California.
- Bailin, A., Graftstein, A. The linguistic assumptions underlying readability formulae: A critique, Language & Communication, 2001, 21, 285−301. [CrossRef]
- DuBay (Editor), W.H. , The Classic Readability Studies, 2006, Impact Information, Costa Mesa, California.
- Zamanian, M., Heydari, P., Readability of Texts: State of the Art, Theory and Practice in Language Studies, 2012, 43−53. [CrossRef]
- Benjamin, R.G. Reconstructing Readability: Recent Developments and Recommendations in the Analysis of Text Difficulty, Educ Psycological Review, 2012, 63−88. [CrossRef]
- Collins−Thompson, K., Computational Assessment of Text Readability: A Survey of Past, in Present and Future Research, Recent Advances in Automatic Readability Assessment and Text Simplification, ITL, International Journal of Applied Linguistics, 2014, 97−135.
- Kandel, L.; Moles, A.; Application de l’indice de Flesch à la langue française. Cahiers Etudes de Radio-Télévision, 1958, 253–274.
- Matricciani, E.; Caro, L.D. A Deep–Language Mathematical Analysis of Gospels, Acts and Revelation. Religions 2019, 10, 257. [CrossRef]
- Papoulis, A. Probability & Statistics; Prentice Hall: Hoboken, NJ, USA, 1990.
- Shannon, C.E.; A Mathematical Theory of Communication, The Bell System Technical Journal, Vol. 27, 1st part: 379–423, 2nd part: 623–656, 1948.
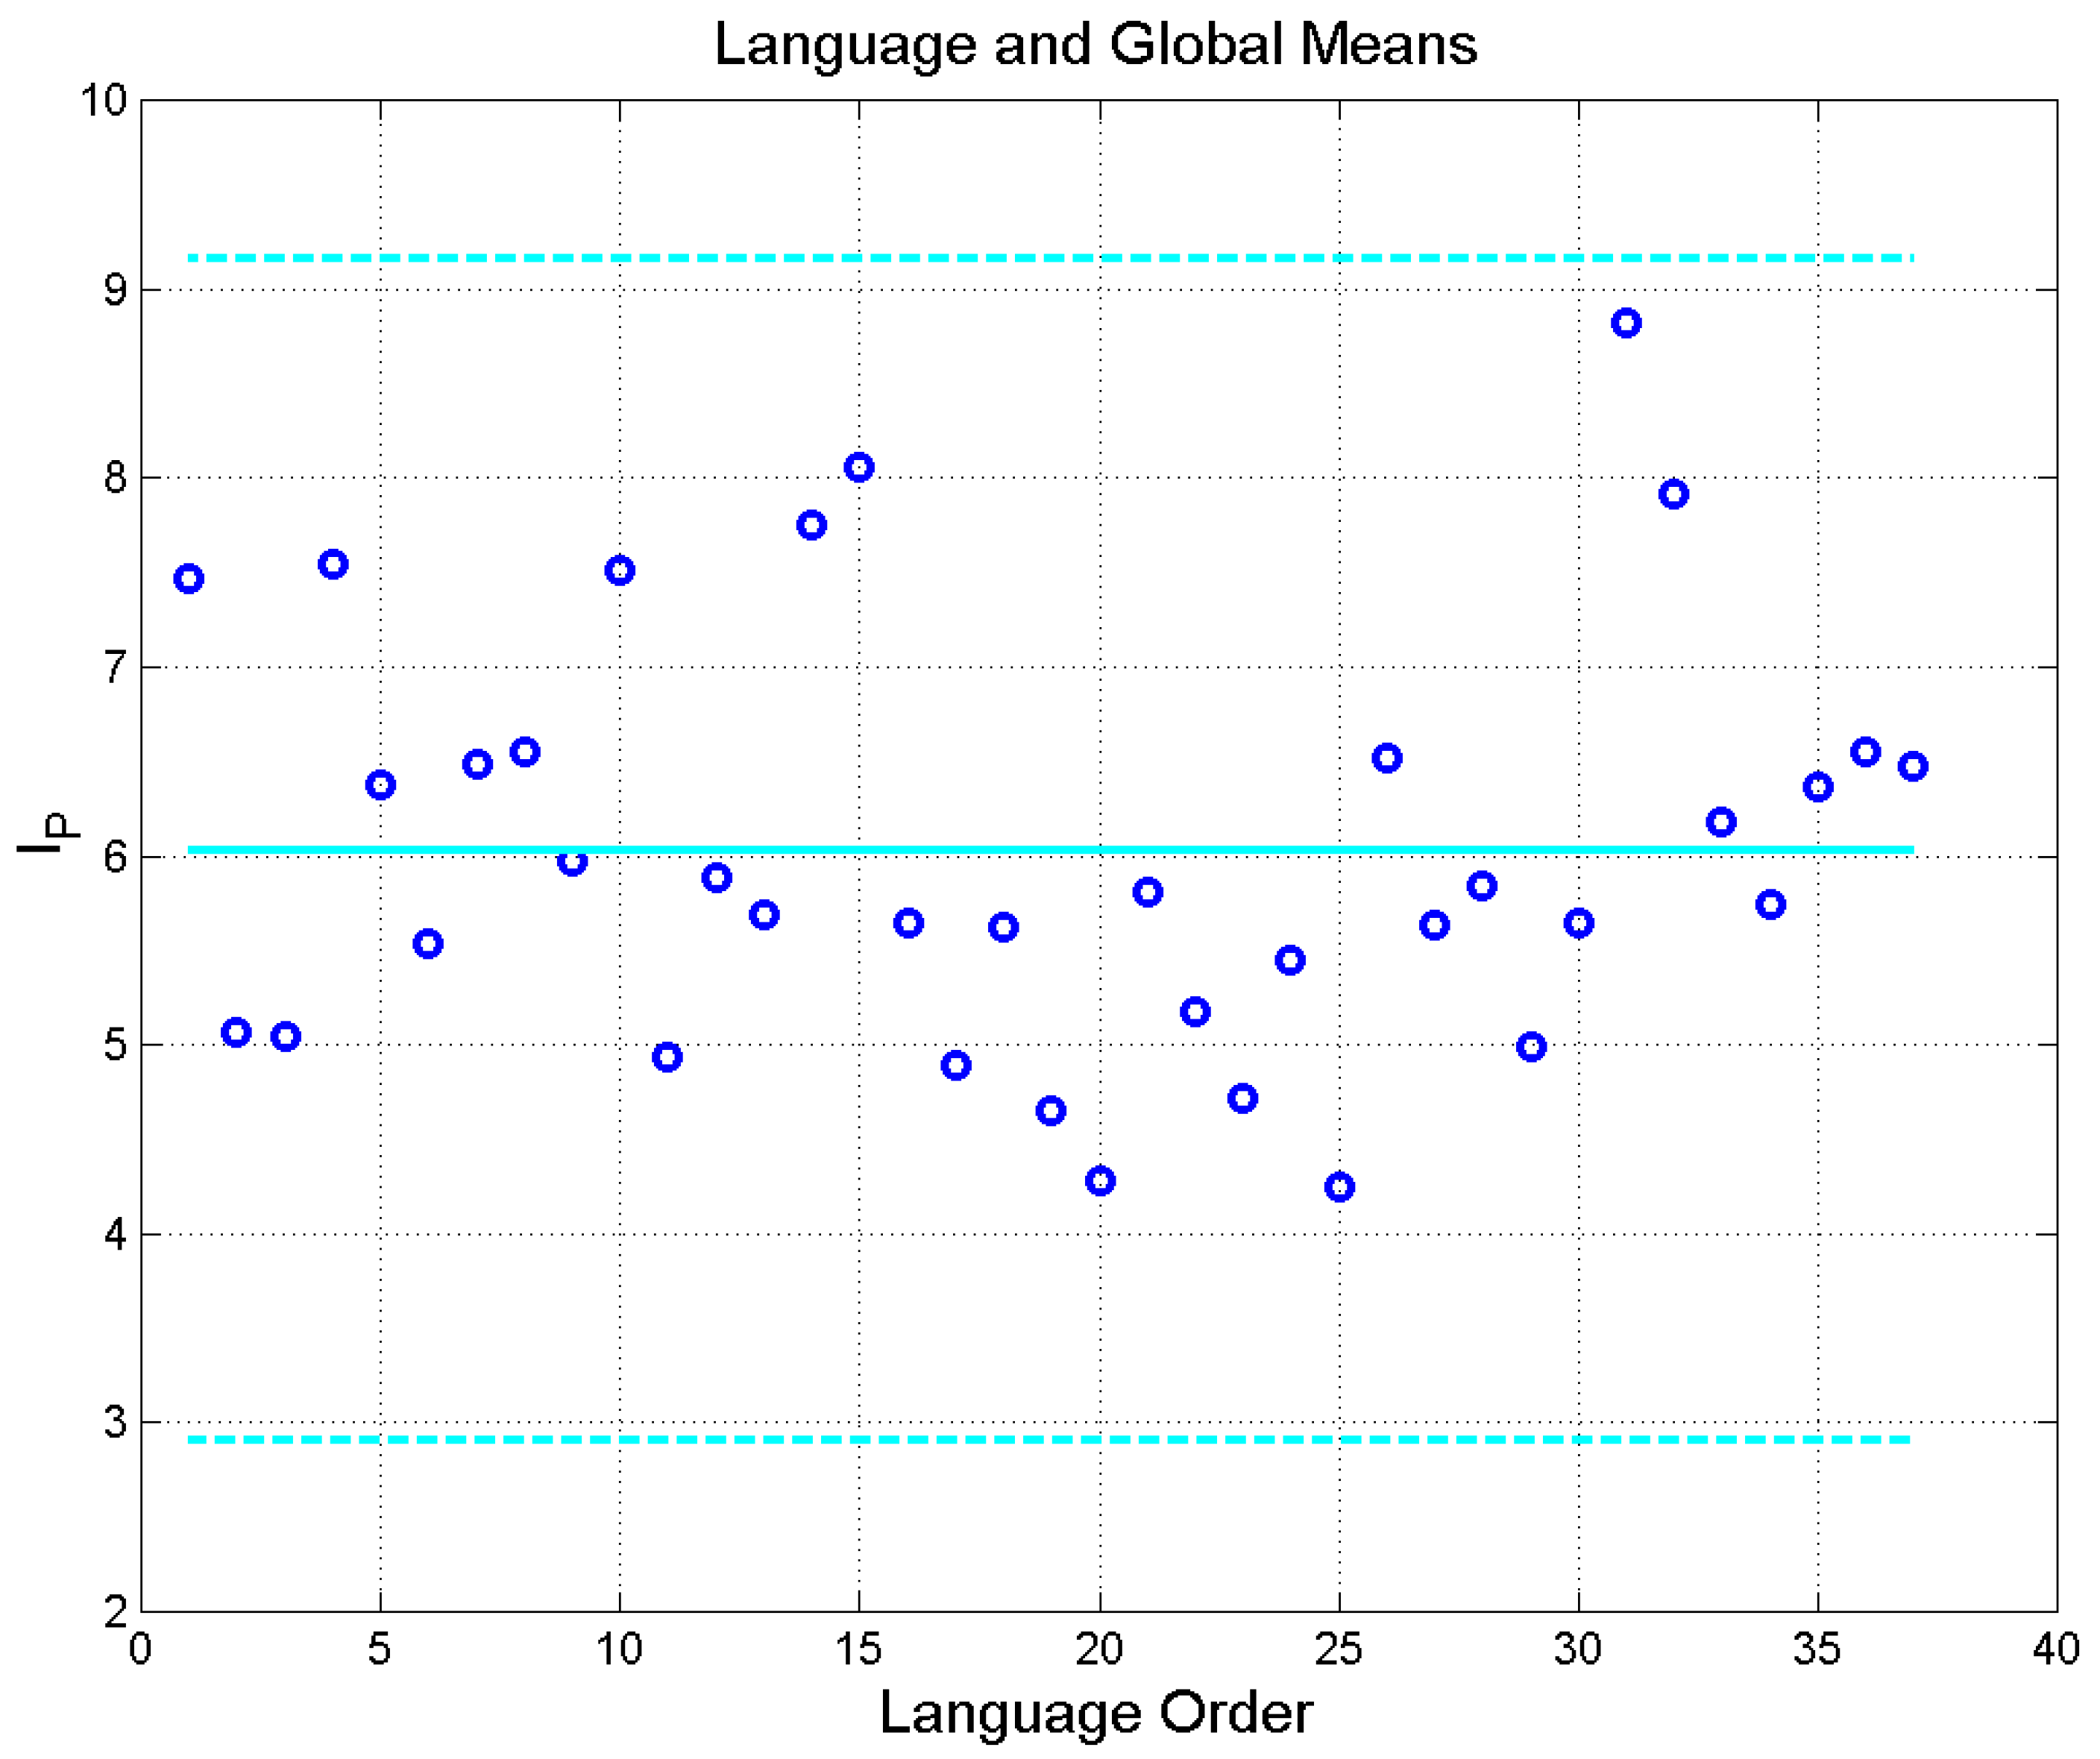
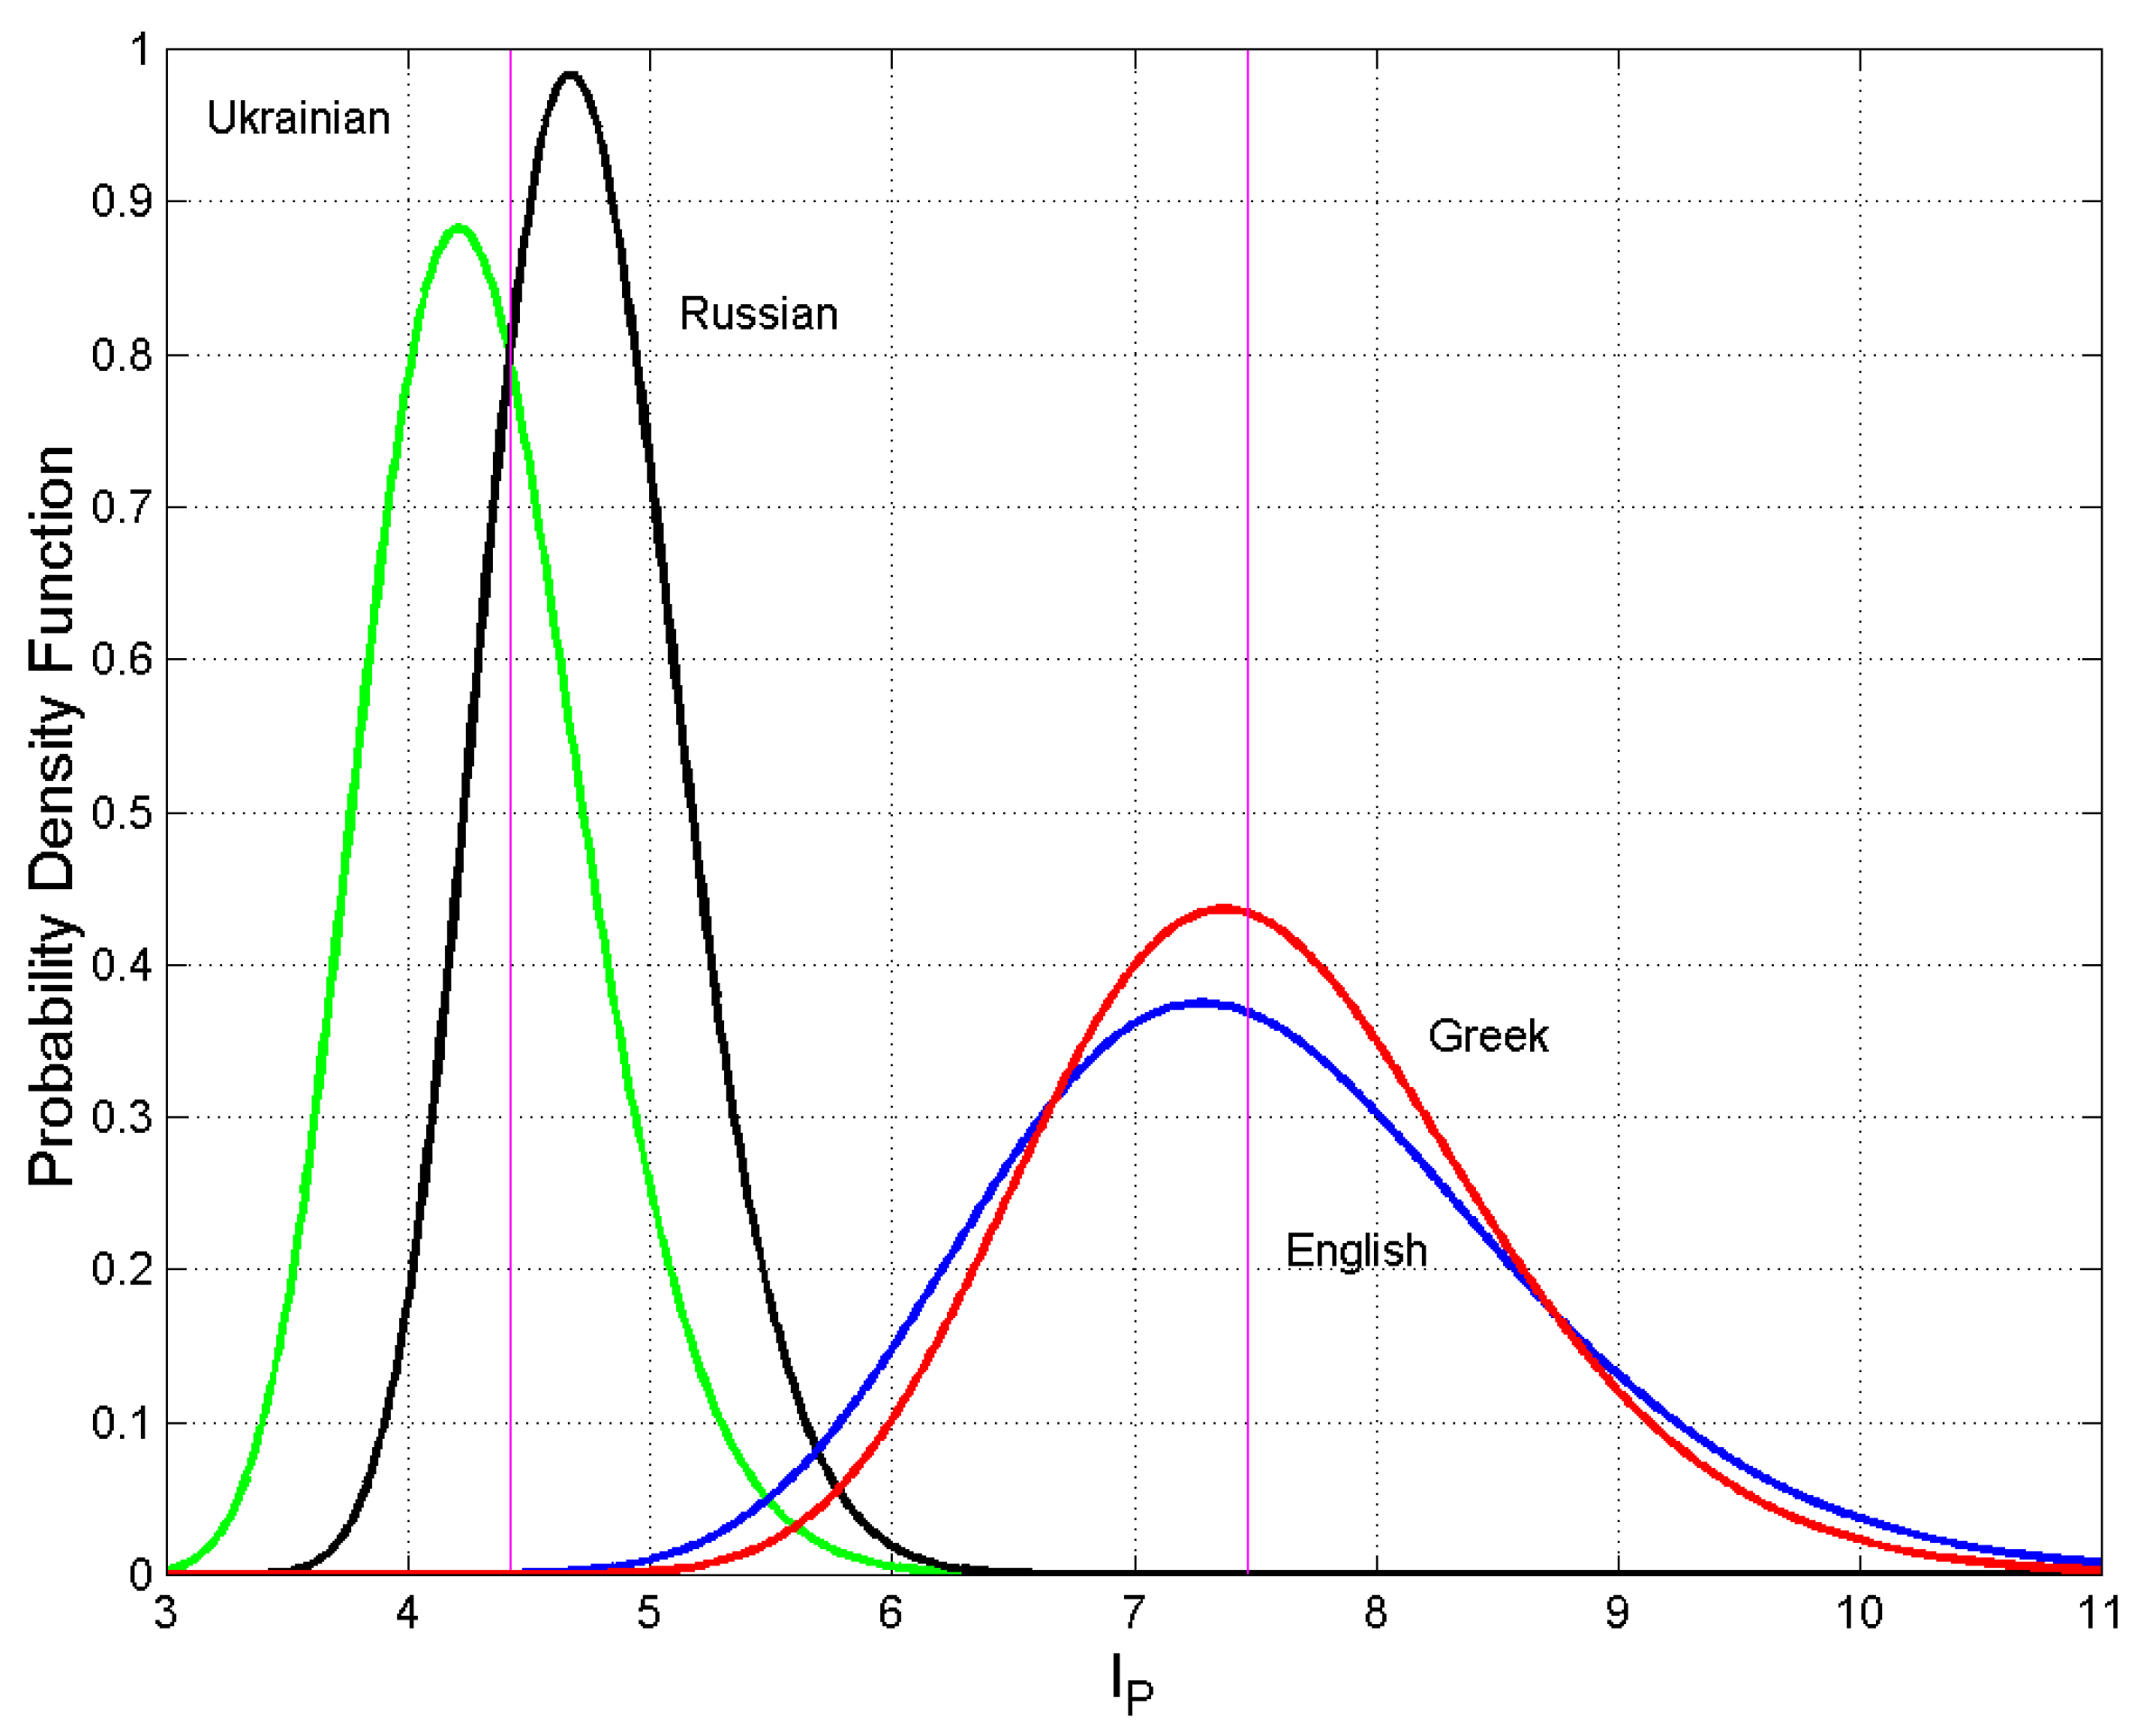
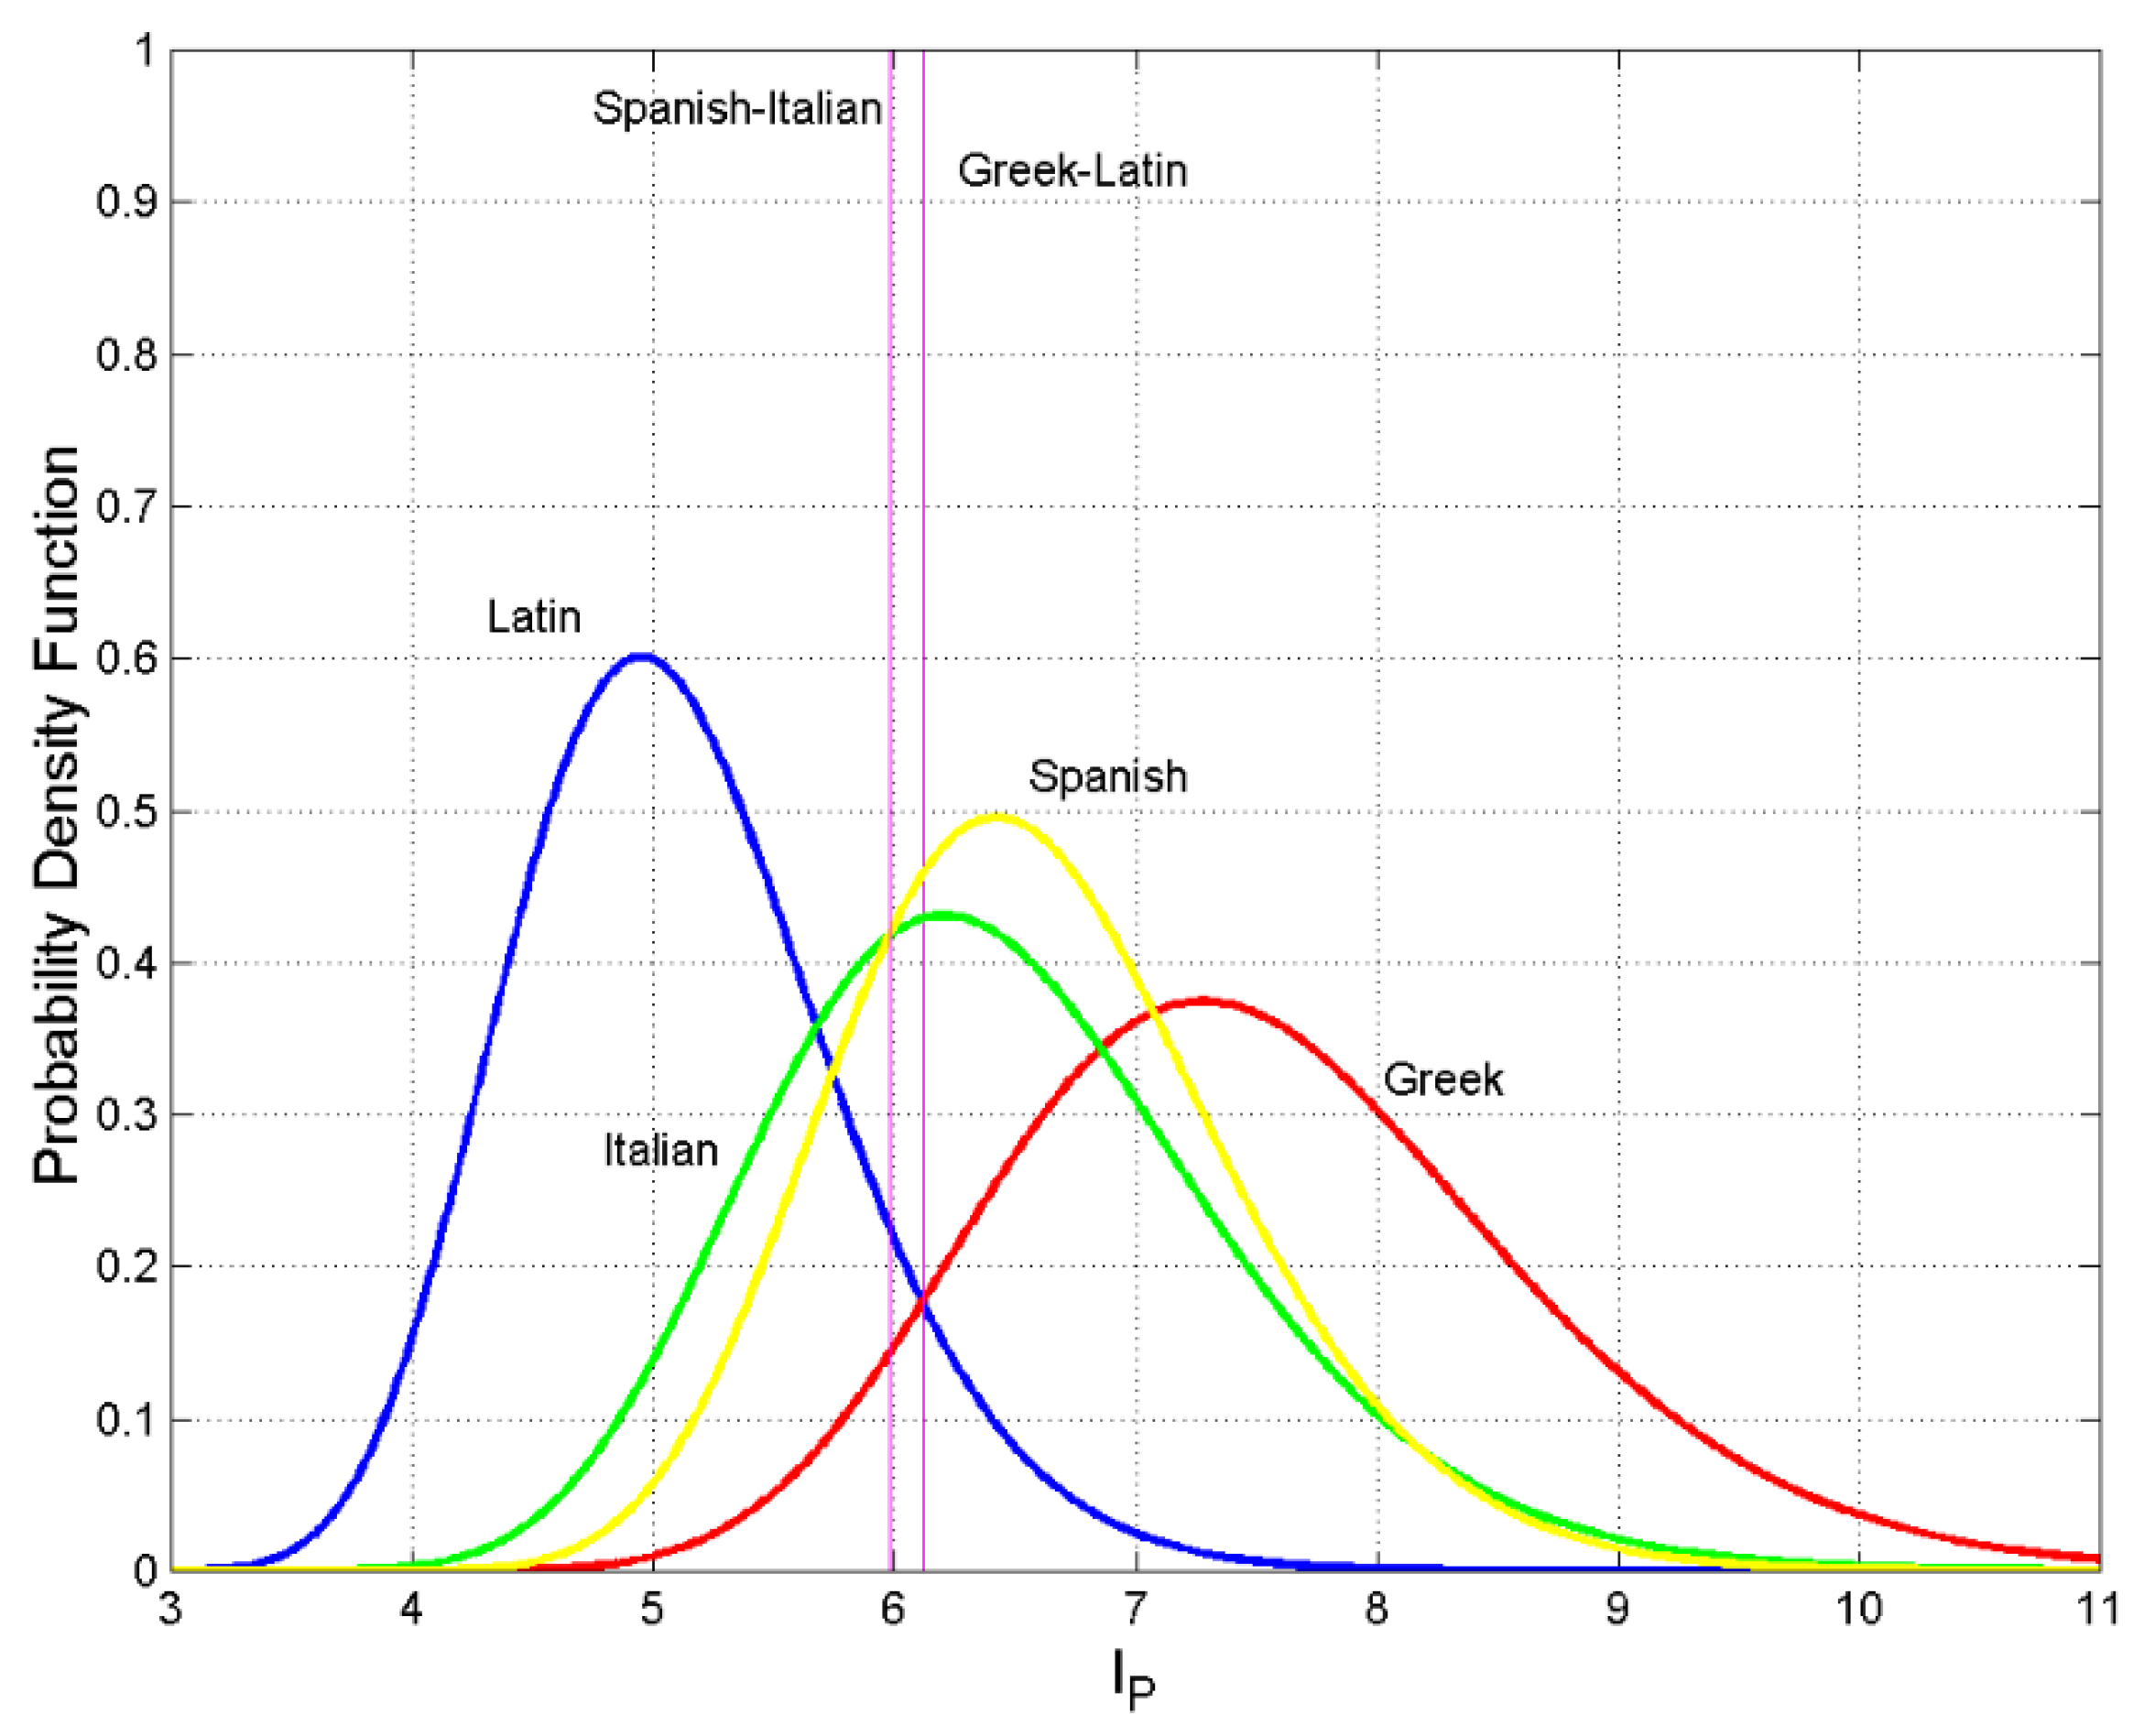
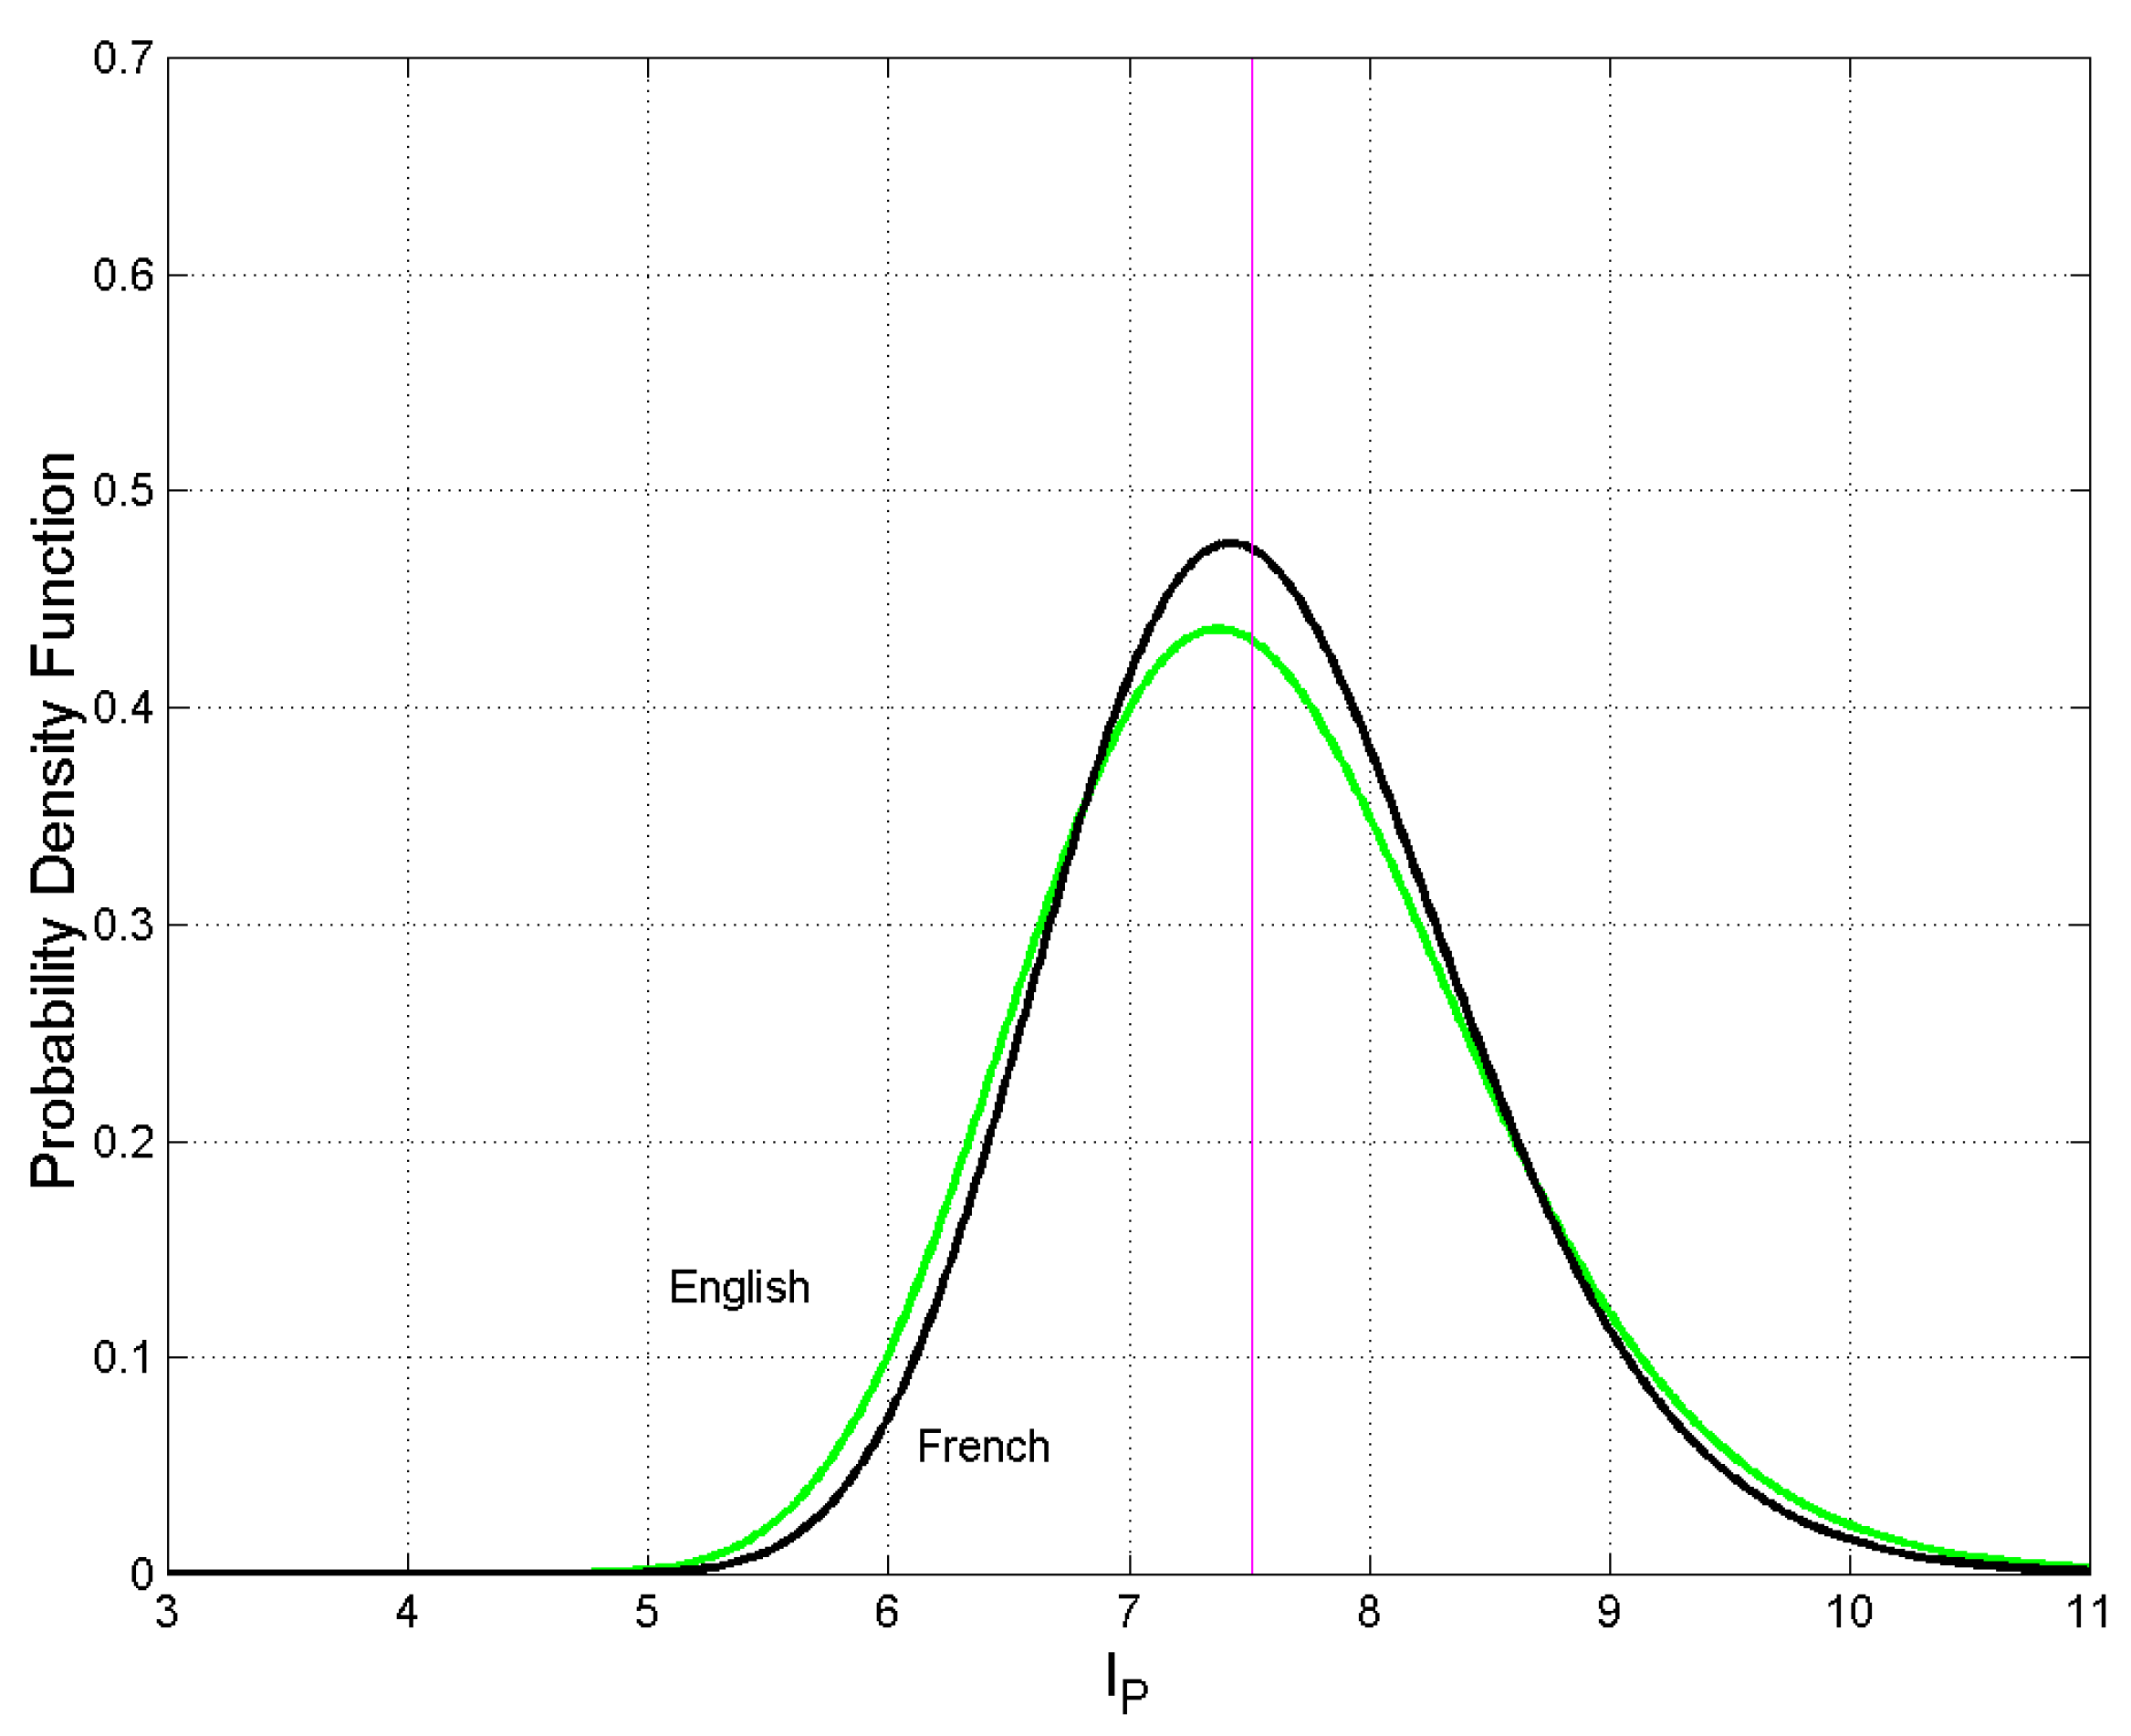
| Language | Abbreviation | Order Number | Language Family | ||
| Greek | Gr | 1 | Hellenic | 7.47 | 1.09 |
| Latin | Lt | 2 | Italic | 5.07 | 0.68 |
| Esperanto | Es | 3 | Constructed | 5.05 | 0.57 |
| French | Fr | 4 | Romance | 7.54 | 0.85 |
| Italian | It | 5 | Romance | 6.38 | 0.95 |
| Portuguese | Pt | 6 | Romance | 5.54 | 0.59 |
| Romanian | Rm | 7 | Romance | 6.49 | 0.74 |
| Spanish | Sp | 8 | Romance | 6.55 | 0.82 |
| Danish | Dn | 9 | Germanic | 5.97 | 0.64 |
| English | En | 10 | Germanic | 7.51 | 0.93 |
| Finnish | Fn | 11 | Germanic | 4.94 | 0.56 |
| German | Ge | 12 | Germanic | 5.89 | 0.60 |
| Icelandic | Ic | 13 | Germanic | 5.69 | 0.67 |
| Norwegian | Nr | 14 | Germanic | 7.75 | 0.84 |
| Swedish | Sw | 15 | Germanic | 8.06 | 1.35 |
| Bulgarian | Bg | 16 | Balto−Slavic | 5.64 | 0.64 |
| Czech | Cz | 17 | Balto−Slavic | 4.89 | 0.65 |
| Croatian | Cr | 18 | Balto−Slavic | 5.62 | 0.75 |
| Polish | Pl | 19 | Balto−Slavic | 4.65 | 0.43 |
| Russian | Rs | 20 | Balto−Slavic | 4.28 | 0.46 |
| Serbian | Sr | 21 | Balto−Slavic | 5.81 | 0.69 |
| Slovak | Sl | 22 | Balto−Slavic | 5.18 | 0.61 |
| Ukrainian | Uk | 23 | Balto−Slavic | 4.72 | 0.41 |
| Estonian | Et | 24 | Uralic | 5.45 | 0.66 |
| Hungarian | Hn | 25 | Uralic | 4.25 | 0.45 |
| Albanian | Al | 26 | Albanian | 6.52 | 0.78 |
| Armenian | Ar | 27 | Armenian | 5.63 | 0.52 |
| Welsh | Wl | 28 | Celtic | 5.84 | 0.44 |
| Basque | Bs | 29 | Isolate | 4.99 | 0.52 |
| Hebrew | Hb | 30 | Semitic | 5.65 | 0.59 |
| Cebuano | Cb | 31 | Austronesian | 8.82 | 1.01 |
| Tagalog | Tg | 32 | Austronesian | 7.92 | 0.82 |
| Chichewa | Ch | 33 | Niger−Congo | 6.18 | 0.87 |
| Luganda | Lg | 34 | Niger−Congo | 5.74 | 0.82 |
| Somali | Sm | 35 | Afro−Asiatic | 6.37 | 1.01 |
| Haitian | Ht | 36 | French Creole | 6.55 | 0.71 |
| Nahuatl | Nh | 37 | Uto−Aztecan | 6.47 | 0.91 |
| Reference Language | |
|---|---|
| Greek | French, English |
| Latin | Esperanto, Finnish, Slovack |
| Esperanto | Latin, Finnish, Czech, Slovak, Basque |
| French | Greek, English, Norwegian |
| Italian | Romanian, Spanish, Albanian, Somali, Nahuatl |
| Spanish | Italian, Romanian, Albanian, Haitian, Nahuatl |
| English | Greek, French, Norwegian |
| German | Danish, Serbian, Welsh |
| Russian | Hungarian |
| Ukrainian | Polish |
Disclaimer/Publisher’s Note: The statements, opinions and data contained in all publications are solely those of the individual author(s) and contributor(s) and not of MDPI and/or the editor(s). MDPI and/or the editor(s) disclaim responsibility for any injury to people or property resulting from any ideas, methods, instructions or products referred to in the content. |
© 2023 by the authors. Licensee MDPI, Basel, Switzerland. This article is an open access article distributed under the terms and conditions of the Creative Commons Attribution (CC BY) license (http://creativecommons.org/licenses/by/4.0/).


